

Submitted:
08 April 2026
Posted:
09 April 2026
You are already at the latest version
Abstract
Background and Objectives: Sepsis is a life-threatening organ dysfunction, and specific biomarkers could improve prognostic assessment in septic patients. The Sequential Organ Failure Assessment (SOFA) score is the standard tool for clinical sepsis monitoring. Recent studies highlight the need for its revision and the identification of rapid, specific, sensitive predictors of sepsis mortality. The aim of this study was to determine the significance of cardiac biomarkers alone or combined with the SOFA score for evaluating sepsis-related mortality. Materials and Methods: This is a retrospective, single-center study with a relatively small sample size of 73 septic patients (Sepsis-3 criteria) hospitalized in an intensive care unit (ICU) and intermediate care unit (IMCU). All patients had standard laboratory parameters, cardiac biomarkers, and the SOFA score available upon admission. Statistical analyses included non-parametric Mann–Whitney U test, ROC (Receiver Operating Characteristic) curve analysis, Hanley & McNeil method and Hosmer–Lemeshow goodness-of-fit test. Results: Lactate (p < 0.001) and SOFA (p < 0.001) showed the highest area under the curve (AUC) values, and all cardiac biomarkers had statistically significant AUCs (p < 0.05) for sepsis mortality prediction. A comparison of all ROC curves was conducted, but no statistically significant differences were observed. Adding hs-cTn (high-sensitivity cardiac troponin) and lactate to the SOFA score increased its AUC from 0.767 to 0.827 (p = 0.421). Conclusions: The results highlight the potential role of cardiac biomarkers alone or in combination with the SOFA score as useful clinical tool for predicting sepsis mortality. Further research with a larger sample size is required to validate and generalize the findings.
Keywords:
sepsis
; septic shock
; SOFA score
; cardiac biomarkers
; mortality
1. Introduction
Sepsis is a clinical syndrome responsible for high rates of mortality and morbidity worldwide. The new 2016 definition (Sepsis-3) describes sepsis as life-threatening organ dysfunction caused by a dysregulated host response, that is, as an infection accompanied by an increase in the Sequential Organ Failure Assessment (SOFA) score of 2 points or more [1]. Septic shock is accompanied by circulatory, cellular, and metabolic instability, which increases the risk of fatal outcomes. The diagnosis is established when hypotension is present that requires the use of vasopressors to maintain a mean arterial pressure above 65 mmHg, along with a blood lactate level greater than 2 mmol/L after adequate fluid resuscitation [2]. In 2021, the Surviving Sepsis Campaign (SSC) published updated international guidelines for the treatment of sepsis and septic shock. In addition to the new definition, recommendations were provided for clinical monitoring and timely recognition of potentially septic patients through the use of the SOFA (Table A1), quick Sequential Organ Failure Assessment (qSOFA), and Acute Physiology and Chronic Health Evaluation II (APACHE II) scores [3]. Recently published studies have focused on identifying reliable, rapid, easily accessible, and cost-effective biomarkers for mortality prediction in sepsis. Currently, among the 200 known biomarkers of sepsis, none is sufficiently sensitive and specific, which clearly indicates that even the new definition is not entirely adequate [4,5,6,7,8,9].
Septic cardiomyopathy (SCM) is a reversible myocardial dysfunction that occurs in patients with sepsis and septic shock. It results from multifactorial mechanisms. SCM manifests as systolic or diastolic dysfunction of the left or right ventricle, global hypokinesia of the heart, or a localized wall motion abnormality [10,11,12]. Approximately 50% of patients with severe forms of sepsis and septic shock will develop some form of left ventricular systolic dysfunction [12].
The SOFA score is most commonly used for clinical monitoring of sepsis and assessment of organ dysfunction, while the qSOFA score can be used when a rapid evaluation is needed [13]. In recent years, supplementation and revision of the SOFA score have been considered, since new clinical studies and real-world results indicate its shortcomings, particularly regarding the cardiac component. Efforts are being made to incorporate cardiac markers into the SOFA score. The reason why cardiac biomarkers could be combined with the SOFA score lies in their ability to provide an early and accurate picture of cardiac function, even before blood pressure drops or obvious myocardial dysfunction appears [11,14].
Markers that could improve the sensitivity and specificity of the SOFA score include hs-cTn (high-sensitivity cardiac troponin), N-terminal pro–brain natriuretic peptide (NT-proBNP), Creatine Kinase-MB (CK-MB), and lactate [11,15,16]. Incorporating these parameters into the existing SOFA score may enhance risk stratification and improve the identification of patients at high risk of mortality. This would allow timely initiation of adequate therapy, thereby reducing complications and improving outcomes [11].
Beyond sepsis, cardiac biomarkers may be elevated in a variety of other clinical conditions such as acute coronary syndromes, acute and chronic heart failure, pulmonary embolism, myocarditis, tachyarrhythmias, and hypertensive crises. Elevated concentrations are also reported in patients with chronic kidney disease due to reduced clearance. Therefore, while these biomarkers may have prognostic value in sepsis, their elevation is not disease-specific and should be interpreted within the overall clinical context [17].
The aim of this study was to determine the significance of cardiac biomarkers alone and in combination with the SOFA score for the evaluation of sepsis related mortality.
2. Materials and Methods
2.1. Patient Selection
Septic patients were identified according to the Sepsis-3 criteria. Between January 1, 2024, and December 31, 2024, a total of 160 septic patients hospitalized at the Clinic for Infectious Diseases, University Clinical Center of Vojvodina (UKCV), were included in this single-center retrospective study, which was approved by the Ethics Committee of UKCV (approval number 00-132).
Data were collected retrospectively from electronic healthcare records for all consecutive patients diagnosed with sepsis; consequently, additional informed consent was not required.
The exclusion criteria were designed to minimize confounding factors influencing cardiac biomarker levels and improve the generalizability of the study. Patients younger than 18 years, patients with acute coronary syndrome, patients with recent myocardial infarction (in the last 72 hours) or with active myocarditis and recent cardiac surgery, patients with confirmed pulmonary embolism, end-stage renal disease requiring dialysis, recent cardiac surgery, recent solid organ transplantation (in the last 3-6 months), auto-immune diseases, or malignancies, as well as HIV (Human Immunodeficiency Virus)-positive patients and pregnant patients, were excluded. Additionally, patients who didn’t need intensive care unit (ICU) admission or intermediate care admission (IMCU) were excluded. Consequently, in our hospital, biomarker testing was not routinely performed and may have preferentially included more severely ill patients. While this reflects real-world clinical practice, it may limit the generalizability of the findings; however, the statistical associations were analyzed within a clearly defined cohort with complete data, thereby preserving the internal validity of the predictive model.
A total of 73 patients were included in the final analysis and were divided into two groups: survivors and non-survivors (Figure 1.).
2.2. Laboratory Testing
For all patients included in the study, demographic data, clinical characteristics, vital signs at admission, comorbidities, length of stay, source and cause of infection and outcomes were recorded. All patients had following routine laboratory analyses at admission: complete blood count (CBC) with white blood cell count (WBC), neutrophil (Neu), lymphocyte cell count (Limf)), sodium (Na), potassium (K), magnesium (Mg), concentrations of bilirubin; C-reactive protein (CRP), procalcitonin (PCT) and D-dimer, alanine aminotransferase (ALT), aspartate aminotransferase (AST), and gamma-glutamyl transferase (GGT).
All patients had serum cardiac biomarkers (hs-cTn, NT-proBNP, and CK-MB), blood gas analysis (lactate, pH (potential of hydrogen), pO₂ (partial pressure of oxygen), pCO₂ (partial pressure of carbon dioxide), bicarbonate and base excess). The neutrophile to lymphocyte ratio (NLR) was calculated by dividing the absolute neutrophil count by the absolute lymphocyte count. Mean arterial pressure (MAP) was calculated from measured systolic and diastolic blood pressure values. The SOFA score, qSOFA score and Glasgow Coma Scale (GCS) were recorded.
2.3. Statistical Analysis
Statistical analyses were performed using IBM SPSS Statistics, version 21.0. Data with a normal distribution are presented as mean ± standard deviation (X̄ ± SD), data with a skewed distribution are presented as median with interquartile range (IQR). Categorical variables were presented numerically and with percentages (N(%)), and comparisons were analyzed using the Chi-square test (χ² test). For numerical data, the t-test was used to compare groups when the data followed a normal distribution, and the Mann–Whitney U test was performed for non-normally distributed data.
For all individual biomarkers (hs-cTn, CK-MB, NT-proBNP), the SOFA score, and hematological and biochemical parameters (red blood cell (RBC) count, red cell distribution width (RDW), neutrophils (Neu), lymphocyte cell count (Limf), neutrophil-to-lymphocyte ratio (NLR), platelets (PLT), hemoglobin (Hb), CRP, and lactate), we constructed Receiver Operating Characteristic (ROC) curves and calculated the areas under the curve (AUCs), optimal cut-off values, sensitivity, and specificity.
Univariate analysis was performed to evaluate the predictive value of individual cardiac biomarkers for mortality. Due to the limited sample size, multivariate analysis was not performed, as it would not provide statistically reliable estimates.
The predictive performance of the combined models incorporating the SOFA score and selected cardiospecific biomarkers was assessed using ROC analysis. The biomarkers included in the combined models were those demonstrating the highest area under the curve (AUC) values in the individual ROC analyses. As lactate demonstrated the highest area under the curve (AUC) value, followed by the SOFA score and hs-cTn, a modified SOFA score was constructed by first incorporating hs-cTn and subsequently both hs-cTn and lactate. For hs-cTn and lactate, values within the reference range were assigned a score of 0, whereas values above the reference range were divided into quartiles and assigned scores from 1 to 4, consistent with the scoring structure of the original SOFA components.
The modified scores were then calculated by summing the SOFA and troponin points, and a corresponding ROC curve was generated. Subsequently, a combined score including the SOFA score, hs-cTn, and lactate was constructed, and its ROC curve was analyzed. Calibration of the model was evaluated using the Hosmer–Lemeshow goodness-of-fit test, with a p-value > 0.05 indicating good agreement between predicted and observed outcomes.
The statistical significance of the difference between two ROC curves was assessed using the Hanley & McNeil method implemented in MedCalc software (version 23.2.0).
A p-value < 0.05 was considered statistically significant. The results are presented in tables and figures with textual interpretation.
3. Results
Out of the 73 included patients in this study 37/73 (50.7%) were females and 36/73 (49.3%) were males (Table 1.).
Average age was 72.7 ± 11.14 years (range: 41–93), indicating a predominance of the geriatric population.
The overall mortality was 35/73 (47.9%) (Table 1.).
There was no statistically significant difference between the two groups in terms of age, gender, comorbidities, site of infection, source of infection and length of stay (Table 1.).
Significantly higher values of respiratory rate (RR) was observed in the non-survivor group, and other vital signs did not differ significantly between two groups. MAP was significantly lower in non-survivor group (Table 1.).
There was a statistically significant difference in SOFA and qSOFA scores, and both scores were higher in non-survivors (p < 0.001). However, GCS also differed significantly between the groups (p < 0.001) (Table 1.).
Among all patients with sepsis in ICU and IMCU, 20 (27.39%) developed septic shock. There was a significant difference between the groups of patients with septic shock (p<0.001) (Table 1.).
Comparing the levels of all cardiac biomarkers between the groups, significantly higher values were observed in non-survivors group (Table 2.).
There was a statistically significant difference in magnesium levels (p = 0.049), AST (p = 0.006), GGT (p < 0.001) and D dimer (p < 0.001). There was no significant difference in other routine laboratory parameters (Table 2.).
Non-survivors had statistically significantly higher lactate levels (p < 0.001), as well as statistically significantly lower values of pCO₂, bicarbonate, and base excess (p = 0.04, p = 0.048, and p = 0.01, respectively) (Table 2.).
The ROC curves analysis demonstrated that lactate and SOFA score had the greatest area under the curve (AUC) for predicting sepsis mortality. AUC, ROC, cut-off, sensitivity and specificity are shown in Table 3. and Figure 2.
ROC curve analysis demonstrated that hs-cTn had the highest AUC for predicting mortality. AUC, ROC, cut-off, sensitivity and specificity are shown in Table 4. and Figure 3.
In order to assess whether there is a statistically significant difference in discriminative performance between cardiac biomarkers, SOFA score and lactate, we used comparation of ROC curves (Hanley & McNeil method). However, none of the pairwise comparisons revealed statistically significant differences between AUC values. These findings indicate that although each parameter showed significant individual discriminatory ability, their predictive performance was not statistically distinguishable from one another within the present cohort (Table 5.).
Univariate analysis was performed to identify the impact of cardiac biomarkers and the SOFA score on mortality in patients with sepsis. Due to the highly skewed distribution of some biomarkers (hs-cTn and NT-proBNP), log-transformation was applied prior to analysis to obtain more appropriate and interpretable effect estimates. In this analysis, all variables demonstrated statistical significance (Table 6.).
For the identification of independent predictors of sepsis mortality, multivariable regression analysis was required. Multivariable regression analysis was not conducted because of the limited sample size and small number of events, which would violate the underlying statistical assumptions, particularly with respect to the events-per-variable (EPV) rule and model stability. Therefore, we emphasize that statistical significance was observed primarily in the univariate analysis and the findings should be interpreted as exploratory.
Given the limited sample size and the inability to perform a multivariable regression analysis, the predictive performance of different combinations of the SOFA score and cardiac biomarkers were evaluated using ROC curve analysis (Figure 4.).
ROC analysis of biomarker combinations for the prediction of mortality did not reach statistical significance. However, the model showed that adding hs-cTn to the SOFA score increased the ROC AUC from 0.767 to 0.789, although the difference between the two AUC values was not statistically significant (p = 0.775) (Table 7.).
Further addition of lactate to the modified score that already included both the SOFA score and hs-cTn increased the ROC AUC from 0.767 to 0.827; however, this difference also did not reach statistical significance (p = 0.421).
The calibration of both models was evaluated using the Hosmer–Lemeshow goodness-of-fit test. The SOFA + hs-cTn model demonstrated a p value of 0.908, whereas the Lactate+ SOFA+ hs-cTn model had a p value of 0.327, suggesting good agreement between predicted and observed outcomes for both models.
4. Discussion
The pathophysiological mechanisms of sepsis-induced cardiovascular dysfunction are still not entirely understood, and the presence of cardiovascular dysfunction is associated with a significantly increased mortality rate [11,18], as confirmed by the results of our study (47.9% of the study participants), but the high incidence of mortality observed in our study is inconsistent with the findings from a recent study [7,19]. A potential explanation for this difference may lie in the fact that our study included only patients hospitalized in ICU and IMCU.
According to these data, the timely identification and implementation of potentially highly specific, rapid, useful, low-cost, available, and sensitive biomarkers for predicting mortality in septic patients is of great importance [19]. Many studies have investigated the importance of various biomarkers that are more or less specific to sepsis, as well as combinations of biomarkers, for the early recognition of sepsis severity and their potential role in predicting mortality [20,21]. Therefore, our primary aim was to examine the ability of cardiac biomarkers and the SOFA score, alone or in combination, for the evaluation of sepsis-related mortality in routine clinical practice in middle-income countries.
The results of our study show a predominance of older patients, with an almost equal distribution of males and females. Similar age-related findings have been reported by other authors [11,22]. Almost half of our patients had three or more chronic diseases.
In a previous study conducted in China, the most common comorbidities were hypertension (40.1%), diabetes (21.9%), cerebrovascular diseases (17.2%), and COPD (12.2%), which aligns with the data observed in our study and in other recent studies [11,23].
Vincent JL et al., in their retrospective study, reported that pneumonia was the primary cause of sepsis, with the respiratory tract being the most common site of infection, and the urinary tract was the second most common site [19,24]. Our data show that 41.09% of patients had a urinary tract infection. A possible explanation for these results is the presence of a specialized institution for treating respiratory tract infections in Vojvodina, namely the Institute for Pulmonary Diseases in Sremska Kamenica. The percentage of undetermined sources of infection in our study was significantly higher (26.3%) than in previous studies, exceeding the global average, which ranges between 6% and 21% [25].
A comparison of routinely tested laboratory parameters, inflammatory biomarkers, cardiac markers between survivors and non-survivors showed that all cardiac biomarkers, Mg, AST, D-dimer and lactate had significantly higher values in non-survivors than in survivors. These results indicate multisystem derangements, including increased oxidative stress, inflammatory response, and ischemia–reperfusion injury [11,14,26,27,28,29,30]. These findings from our study show that all cardiac biomarkers were significantly elevated in the non-survivor group, suggesting a role in sepsis prognosis and informing the approach to critically ill septic patients with elevated cardiac biomarkers.
The results of our study show that lactate and the SOFA score had better predictive value for sepsis mortality, with higher AUC ROC then cardiac biomarkers. This could be explained by the fact that both SOFA score and lactate are primarily used to asses organ failure.
In an Australian study, lactate was identified as the strongest predictor of mortality in multivariate analysis [31].
Several studies have shown that elevated lactate levels in sepsis are associated with mortality [32,33].
But there are currently controversies regarding the use of the SOFA score in clinical practice. A 2023 study by Moreno et al. suggested that the SOFA score should be updated [34].
But there are currently controversies regarding the use of the SOFA score in clinical practice. A 2023 study by Moreno et al. suggested that the SOFA score should be updated [34]. Since new clinical studies and real-world results indicate its shortcomings, particularly regarding the cardiac component, efforts are being made to incorporate cardiac biomarkers into the SOFA score. The reason why cardiac biomarkers could be combined with the SOFA score lies in their ability to provide an early and accurate picture of cardiac function, even before blood pressure drops or obvious myocardial dysfunction appears [11,14,28]. Lee et al. developed a modified CV SOFA score (cardiovascular SOFA), due to changes in vasopressor use. This study was based on data from multiple cohorts. Even this score was not for global use because of multiple limitations, but it could be a good starting point for SOFA score modification and other new research [28]. A 2024 study developed a cardiac–extended SOFA score model by adding hs-cTnT, NT-proBNP, heart rate, and presence of atrial fibrillation. Even this model did not significantly improve the discriminatory ability for 30-days mortality compared to the standard SOFA score; therefore, future studies are needed to investigate this model and the revised cardiovascular component of the SOFA score [29].
Results from our study show that among the cardiac biomarkers, hs-cTn had the highest AUC. It is well known that elevated troponin levels in sepsis are associated with sepsis induced myocardial injury [30,35]. Recent meta-analyses suggest a significant association between troponin elevation and increased mortality in patients with sepsis, emphasizing the need for a better understanding of this relationship [35].
The findings also showed a significant association between cardiac troponin elevation and mortality among septic patients [35].
Although the AUC values in our ROC analysis did not reach statistical significance, the calculated optimal cut-off values may still serve as indicators for identifying patients at higher risk of severe sepsis and support further diagnostic and treatment procedures, as well as clinical decision-making.
Univariate analysis was performed to evaluate the association between the SOFA score, individual biomarkers, and sepsis mortality. In this analysis, all three cardiac markers demonstrated statistical significance; however, these findings should be considered exploratory. To establish an independent prognosticator of mortality, multivariate analysis using binary logistic regression would be needed.
Because of the limited sample size and the inability to perform multivariable regression analysis, we evaluated the predictive performance of different combinations of the SOFA score, serum lactate, and cardiospecific biomarkers using ROC curve analysis; therefore, it was very difficult to compare our results with those of other studies.
This model aimed to show that a combined biomarker approach had better prognostic value than the SOFA score alone in predicting mortality. The calibration of both models was evaluated using the Hosmer–Lemeshow goodness-of-fit test.
This study further found, through ROC curve analysis, that the combination of the SOFA score and cardiac markers for predicting mortality had a higher AUC than the SOFA score alone, but the difference did not reach statistical significance.
Similarly, the AUC of the combined model integrating the SOFA score, hs-cTn and lactate was superior to that of both the SOFA score alone and the SOFA score plus hs-cTn model, however, no statistically significant differences were observed.
One study showed that the combination of different biomarkers had better prognostic value than SOFA score alone in predicting sepsis mortality [36]. Our results, however, might have been affected by selection bias and the small sample size. Even though we did not identify a statistically significant prognostic combination, the SOFA score combined with hs-cTn and serum lactate could be a useful tool for clinical use.
Many studies have attempted to modify the cardiovascular component of the SOFA score to better reflect cardiac dysfunction and improve its predictive performance (11, 14, 16).
Our study has several limitations. First, to the best of our knowledge, this is the first study in our clinical setting exploring the association between cardiac biomarkers and sepsis mortality. Second, this is a single-center study, including only patients hospitalized in ICU and IMCU unit, and the findings may differ when using records from other centers, limiting the generalizability of our findings to other populations. Third, although we adjusted for as many covariates as possible to diminish their possible influences, owing to the retrospective design of the study, residual confounding may still exist, which needs to be investigated in the future. Fourth, the relatively small number of patients represents an additional limitation for proper statistical analysis; therefore, further multicenter studies with larger sample sizes are needed to identify optimal prognostic cardiac biomarkers.
5. Conclusions
Based on our findings, the SOFA score and lactate showed the best predictive performance for mortality in this cohort.
In the present study, each cardiac biomarker demonstrated statistically significant discriminatory performance for mortality prediction. This finding suggests that it may be possible to determine the cut-off value for each biomarker for predicting mortality in sepsis patients.
In our univariate analysis, all cardiac markers showed association with mortality; however, multivariate analysis is required to confirm this observation.
Although adding lactate and troponin to the SOFA score did not improve the model performance significantly, we would like to highlight the possible role of combined models in the prognosis of sepsis, but this requires further validation in larger, adequately powered prospective studies.
Due to the complex pathophysiology of sepsis, combined biomarkers may represent the future of predicting outcomes among patients.
6. Patents
There are no patents resulting from the work reported in this manuscript.
Author Contributions
Conceptualization Petrić V. and Sević S.; methodology, Lendak D.; software, Vlatković V.; resources and data curation, Pete M.; writing—original draft preparation, Vlatković V.; writing—review and editing, Kovačević N.; visualization, Lendak D.; supervision, Sević S.; project administration, Petrić V.; funding acquisition, Petrić V. and Pete M. All authors have read and agreed to the published version of the manuscript.
Funding
This research was funded by the Provincial Secretariat for Science and Higher Education, grant number 003873711 2025 09418 003 000000 001.
Institutional Review Board Statement
This study was conducted in accordance with the Declaration of Helsinki and approved by the Ethics Committee of University Clinical Center of Vojvodina (protocol code 00-132; the approval was granted on 7 March 2025).
Informed Consent Statement
Patient consent was waived due to the retrospective nature of the research.
Data Availability Statement
The data presented in this study are available from the first author upon request.
Conflicts of Interest
The authors declare no conflicts of interest. The funders had no role in the design of the study; in the collection, analyses, or interpretation of data; in the writing of the manuscript; or in the decision to publish the results.
Abbreviations
| ALT | Alanine aminotransferase |
| APACHE II | Acute Physiology and Chronic Health Evaluation II |
| AST | Aspartate aminotransferase |
| AUC | Area under the curve |
| CI | Confidence interval |
| CK-MB | Creatine kinase-MB |
| CNS | Central nervous system |
| COPD | Chronic obstructive pulmonary disease |
| CRP | C-reactive protein |
| EPV | Events-per-variable |
| GCS | Glasgow Coma Scale |
| GGT | Gamma-glutamyl transferase |
| Hb | Hemoglobin |
| HCT | Hematocrit |
| HIV- Human immunodeficiency virus | |
| hs-cTn | High-sensitivity cardiac troponin |
| ICU | Intensive care unit |
| IMCU | Intermediate care unit |
| IQR | Interquartile range |
| K | Potassium |
| Limf | Lymphocyte cell count |
| MAP | Mean arterial pressure |
| Mg | Magnesium |
| N | Number of observed parameters |
| Na | Sodium |
| Neu | Neutrophil |
| NLR | Neutrophil to lymphocyte ratio |
| NT-proBNP | N-terminal pro-brain natriuretic peptide |
| OR | Odds ratio |
| pCO2 | Partial pressure of carbon dioxide |
| PCT | Procalcitonin |
| pH | Potential of hydrogen |
| PLT | Platelets |
| pO2 | Partial pressure of oxygen |
| qSOFA | Quick Sequential Organ Failure Assessment |
| RBC | Red blood cell count |
| RDW | Red cell distribution width |
| ROC | Receiver operating characteristic |
| RR | Respiratory rate |
| SaO2 | Oxygen saturation |
| SCM | Septic cardiomyopathy |
| SD | Standard deviation |
| SOFA | Sequential Organ Failure Assessment |
| SSC | Surviving Sepsis Campaign |
| UKCV | University Clinical Center of Vojvodina |
| WBC | White blood cell count |
| χ² test | Chi-square test |
Appendix A

Table A1.
Parameters for calculating the SOFA score.
| System | Parameter | 0 | 1 | 2 | 3 | 4 |
|---|---|---|---|---|---|---|
| Respiratory | PaO₂/FiO₂ (mmHg) | ≥400 | <400 | <300 | <200 with mechanical ventilation | <100 with mechanical ventilation |
| Coagulation | Platelets (10⁹/L) |
≥150 | <150 | <100 | <50 | <20 |
| Liver | Bilirubin (mg/dL) | <1,2 | 1,2-1,9 | 2-5,9 | 5-11,9 | >12 |
| Cardiovascular | MAP or need for vasopressors | >70 | <70 | Dopamine <5; ILI dobutamine | Dopamine 5,1-15; ILI epinephrine <0,1; ILI norepinephrine <0,1 | Dopamine >15; ILI epinephrine >0,1; ILI norepinephrine >0,1 |
| CNS | Glasgow Coma Scale (GCS) | 15 | 13-14 | 10-12 | 6-9 | <6 |
| Kidneys | Creatinine (mg/dL) or urine output | <1,2 | 1,2-1,9 | 2-3,4 | 3,5-4,9 | >5 |
References
- Dimić, N.; Đurić, M.; Nenadić, I.; Boboš, M.; Bojić, S.; Vukotić, T.; et al. Development of the definition of sepsis. Serbian J. Med. Chamb. 2023, 4(1), 75–81. [Google Scholar]
- Carneiro, A.H.; Póvoa, P.; Gomes, J.A. Dear Sepsis-3, we are sorry to say that we don’t like you. Rev. Bras. Ter. Intensiv. 2017, 29(1), 4–8. [Google Scholar] [CrossRef] [PubMed]
- Evans, L.; Rhodes, A.; Alhazzani, W.; Antonelli, M.; Coopersmith, C.M.; French, C.; et al. Surviving sepsis campaign: international guidelines for management of sepsis and septic shock 2021. Intensive Care Med. 2021, 47(11), 1181–247. [Google Scholar] [CrossRef] [PubMed]
- Jarczak, D.; Kluge, S.; Nierhaus, A. Sepsis—Pathophysiology and Therapeutic Concepts. Front Med. 2021, 8, 628302. [Google Scholar] [CrossRef]
- Fleischmann, C.; Scherag, A.; Adhikari, N.K.; Hartog, C.S.; Tsaganos, T.; Schlattmann, P.; et al. Assessment of Global Incidence and Mortality of Hospital-treated Sepsis. Current Estimates and Limitations. Am. J. Respir. Crit. Care Med. 2016, 193(3), 259–72. [Google Scholar] [CrossRef]
- Mellhammar, L.; Wullt, S.; Lindberg, A.; Lanbeck, P.; Christensson, B.; Linder, A. Sepsis Incidence: A Population-Based Study. Open Forum Infect. Dis. 2016, 3(4), ofw207. [Google Scholar] [CrossRef]
- Bauer, M.; Gerlach, H.; Vogelmann, T.; Preissing, F.; Stiefel, J.; Adam, D. Mortality in sepsis and septic shock in Europe, North America and Australia between 2009 and 2019- results from a systematic review and meta-analysis. Crit. Care 2020, 24(1), 239. [Google Scholar] [CrossRef] [PubMed]
- Font, M.D.; Thyagarajan, B.; Khanna, A.K. Sepsis and Septic Shock - Basics of diagnosis, pathophysiology and clinical decision making. Med. Clin. North Am. 2020, 104(4), 573–585. [Google Scholar] [CrossRef]
- Delaloye, J.; Calandra, T. Invasive candidiasis as a cause of sepsis in the critically ill patient. Virulence 2014, 5(1), 161–9. [Google Scholar] [CrossRef]
- Caraballo, C.; Jaimes, F. Organ Dysfunction in Sepsis: An Ominous Trajectory From Infection To Death. Yale J. Biol. Med. 2019, 92(4), 629–640. [Google Scholar]
- Wen, K.; Du, H.; Tang, B.; Xiong, B.; Zhang, A.; Wang, P. Complete blood count and myocardial markers combination with sequential organ failure assessment score can effectively predict the mortality in sepsis: a derivation and validation study. Int. J. Gen. Med. 2022, 15, 3265–80. [Google Scholar] [CrossRef]
- Maeder, M.; Fehr, T.; Rickli, H.; Ammann, P. Sepsis-associated myocardial dysfunction: diagnostic and prognostic impact of cardiac troponins and natriuretic peptides. Chest 2006, 129(5), 1349–1366. [Google Scholar] [CrossRef]
- Singer, M.; Deutschman, C.S.; Seymour, C.W.; Shankar-Hari, M.; Annane, D.; et al. The Third International Consensus definitions for sepsis and septic shock (sepsis-3). JAMA 2016, 315(8), 801–10. [Google Scholar] [CrossRef]
- Lörstad, S.; Wang, Y.; Tehrani, S.; Shekarestan, S.; Astrand, P.; Gille-Johnson, P.; et al. Development of an Extended Cardiovascular SOFA Score Component Reflecting Cardiac Dysfunction with Improved Survival Prediction in Sepsis: An Exploratory Analysis in the Sepsis and Elevated Troponin (SET) Study. J. Intensive Care Med. 2025, 40(3), 320–330. [Google Scholar] [CrossRef] [PubMed]
- Raja, D.C.; Mehrotra, S.; Agrawal, A.; Singh, A.; Sawlani, K.K. Cardiac Biomarkers and Myocardial Dysfunction in Septicemia. J. Assoc. Physicians India 2017, 65(12), 14–19. [Google Scholar]
- Chen, F.C.; Xu, Y.C.; Zhang, Z.C. Multi-biomarker strategy for prediction of myocardial dysfunction and mortality in sepsis. J. Zhejiang Univ. Sci. B 2020, 21(7), 537–548. [Google Scholar] [CrossRef]
- Hollander, J.E. Cardiac markers—facilitating diagnosis and exclusion of patients with acute coronary syndrome. US Cardiol. 2005, 2(1), 61–64. [Google Scholar] [CrossRef]
- Umbro, I.; Gentile, G.; Tinti, F.; Muiesan, P.; Mitterhofer, A.P. Recent advances in pathophysiology and biomarkers of sepsis-induced acute kidney injury. J. Infect. 2016, 72(2), 131–42. [Google Scholar] [CrossRef] [PubMed]
- Vincent, J.L.; Sakr, Y.; Sprung, C.L.; Ranieri, V.M.; Reinhart, K.; Gerlach, H.; et al. Sepsis in European intensive care units: results of the SOAP study. Crit. Care Med. 2006, 34(2), 344–53. [Google Scholar] [CrossRef]
- Lendak, D.; Bečejac, D.; Mitić, S.; Adamović, S.; Samardžić, K.; Pete, M.; et al. Inflammatory parameters in the prediction of sepsis-induced acute kidney injury: a case-control study. BMC Infect. Dis. 2025, 26;25(1), 1142. [Google Scholar] [CrossRef]
- Calzavacca, P.; May, C.N.; Bellomo, R. Glomerular haemodynamics, the renal sympathetic nervous system and sepsis-induced acute kidney injury. Nephrol. Dial. Transplant. 2014, 29(12), 2178–84. [Google Scholar] [CrossRef] [PubMed]
- Boonmee, P.; Ruangsomboon, O.; Limsuwat, C.; Chakorn, T. Predictors of Mortality in Elderly and Very Elderly Emergency Patients with Sepsis: A Retrospective Study. West J. Emerg. Med. 2020, 21(6), 210–218. [Google Scholar] [CrossRef]
- Fang, C.H.; Ravindra, V.; Akhter, S.; Adibuzzaman, M.; Griffin, P.; Subramaniam, S.; et al. Identifying and analyzing sepsis states: A retrospective study on patients with sepsis in ICUs. PLoS Digit Health 2022, 1(11), e0000130. [Google Scholar] [CrossRef] [PubMed]
- Vincent, J.L.; Rello, J.; Marshall, J.; Silva, E.; Anzueto, A.; Martin, C.D.; et al. International study of the prevalence and outcomes of infection in intensive care units. JAMA 2009, 302(21), 2323–9. [Google Scholar] [CrossRef]
- Brun-Buisson, C.; Meshaka, P.; Pinton, P.; Vallet, B. EPISEPSIS: a reappraisal of the epidemiology and outcome of severe sepsis in French intensive care units. Intensive Care Med. 2004, 30(4), 580–8. [Google Scholar] [CrossRef]
- Azkárate, I.; Choperena, G.; Salas, E.; Sebastián, R.; Lara, G.; Elósegui, I.; et al. Epidemiology and prognostic factors in severe sepsis/septic shock. Evolution over six years. Med. Intensiv. 2016, 40(1), 18–25. [Google Scholar] [CrossRef]
- Weiss, G.; Goodnough, L.T. Anemia of chronic disease. N Engl. J. Med. 2005, 352(10), 1011–1023. [Google Scholar] [CrossRef] [PubMed]
- Lee H.J., Ko B.S., S.M. et al. Modified cardiovascular SOFA score in sepsis> development and internal and external validation. BMC Med. 2022, 20, 263.
- Rodelo, J.R.; De La Rosa, G.; Valencia, M.L.; Ospina, S.; Arango, C.M.; Gómez, C.I.; et al. D-dimer is a significant prognostic factor in patients with suspected infection and sepsis. Am. J. Emerg. Med. 2012, 30(9), 1991–9. [Google Scholar] [CrossRef]
- Han, Y.Q.; Yan, L.; Zhang, L.; Ouyang, P.H.; Li, P.; Lippi, G.; et al. Performance of D-dimer for predicting sepsis mortality in the intensive care unit. Biochem Med. 2021, 31(2), 020709. [Google Scholar] [CrossRef]
- Ho, K.M.; Lan, N.S.; Williams, T.A.; Harahsheh, Y.; Chapman, A.R.; Dobb, G.J.; et al. A comparison of prognostic significance of strong ion gap (SIG) with other acid base markers in the critically ill: A cohort study. J. Intensive Care 2016, 4, 43. [Google Scholar] [CrossRef]
- Trzeciak, S.; Dellinger, R.P.; Chansky, M.E.; Arnold, R.C.; Schorr, C.; Milcarek, B.; et al. Serum lactate as a predictor of mortality in patients with infection. Intensive Care Med. 2007, 33(6), 970–7. [Google Scholar] [CrossRef]
- Lambden, S.; Laterre, P.F.; Levy, M.M.; Francois, B. The SOFA score-development, utility and challenges of accurate assessment in clinical trials. Crit. Care 2019, 23(1), 374. [Google Scholar] [CrossRef]
- Moreno, R.; Rhodes, A.; Piquilloud, L.; Hernandez, G.; Takala, J.; Gershengorn, H.B.; et al. The Sequential Organ Failure Assessment (SOFA) Score: has the time come for an update? Crit. Care 2023, 27(1), 15. [Google Scholar] [CrossRef] [PubMed]
- Zheng, P.; Wang, X.; Guo, T.; Gao, W.; Huang, Q.; Yang, J.; et al. Cardiac troponin as a prognosticator of mortality in patients with sepsis: A systematic review and meta--analysis. Immun. Inflam. Amp Dis. 2023, 11(9), e1014. [Google Scholar] [CrossRef] [PubMed]
- Lee, G.H.; Kim, H.; Moon, H.W.; Yun, Y.M.; Lee, S.; Hur, M. Multi-Marker Approach in Sepsis: A Clinical Role Beyond SOFA Score. Medicina 2026, 18;62(1), 201. [Google Scholar] [CrossRef]
Figure 1.
Patient selection flowchart.
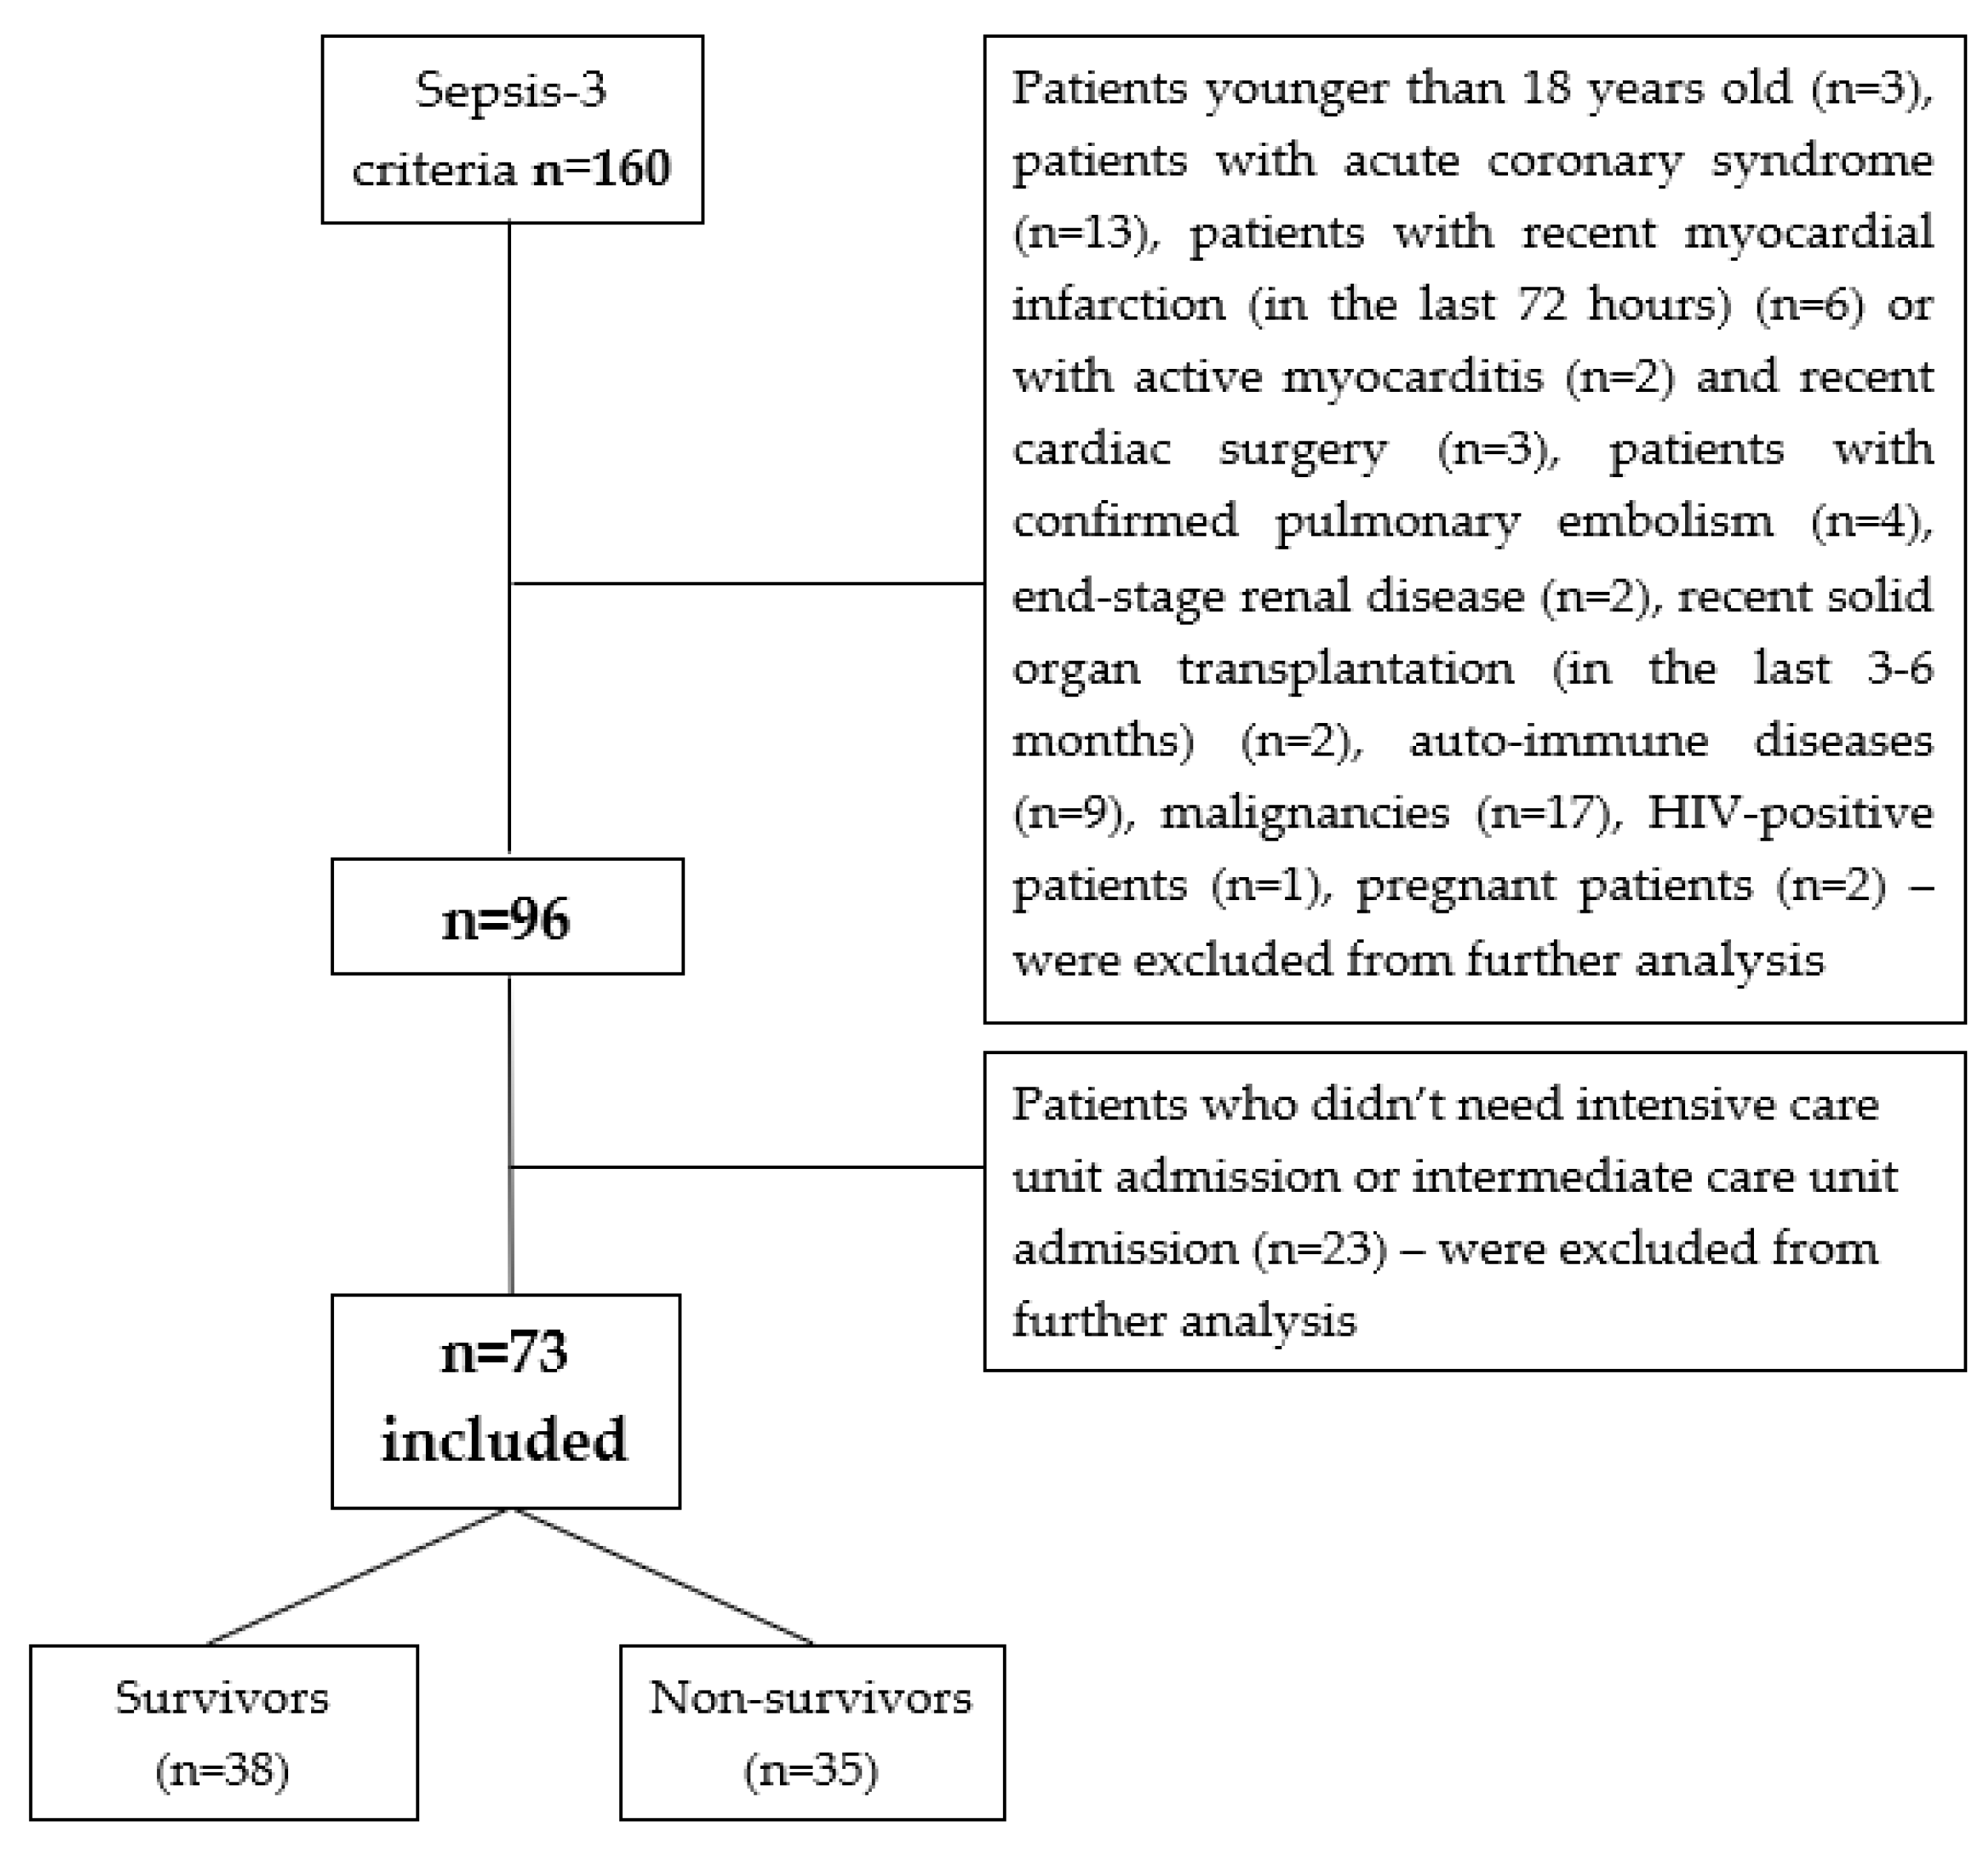
Figure 2.
ROC curves for RBC, RDW, WBC, Neu, Limf, NLR, PLT, CRP, Hb, and lactate.
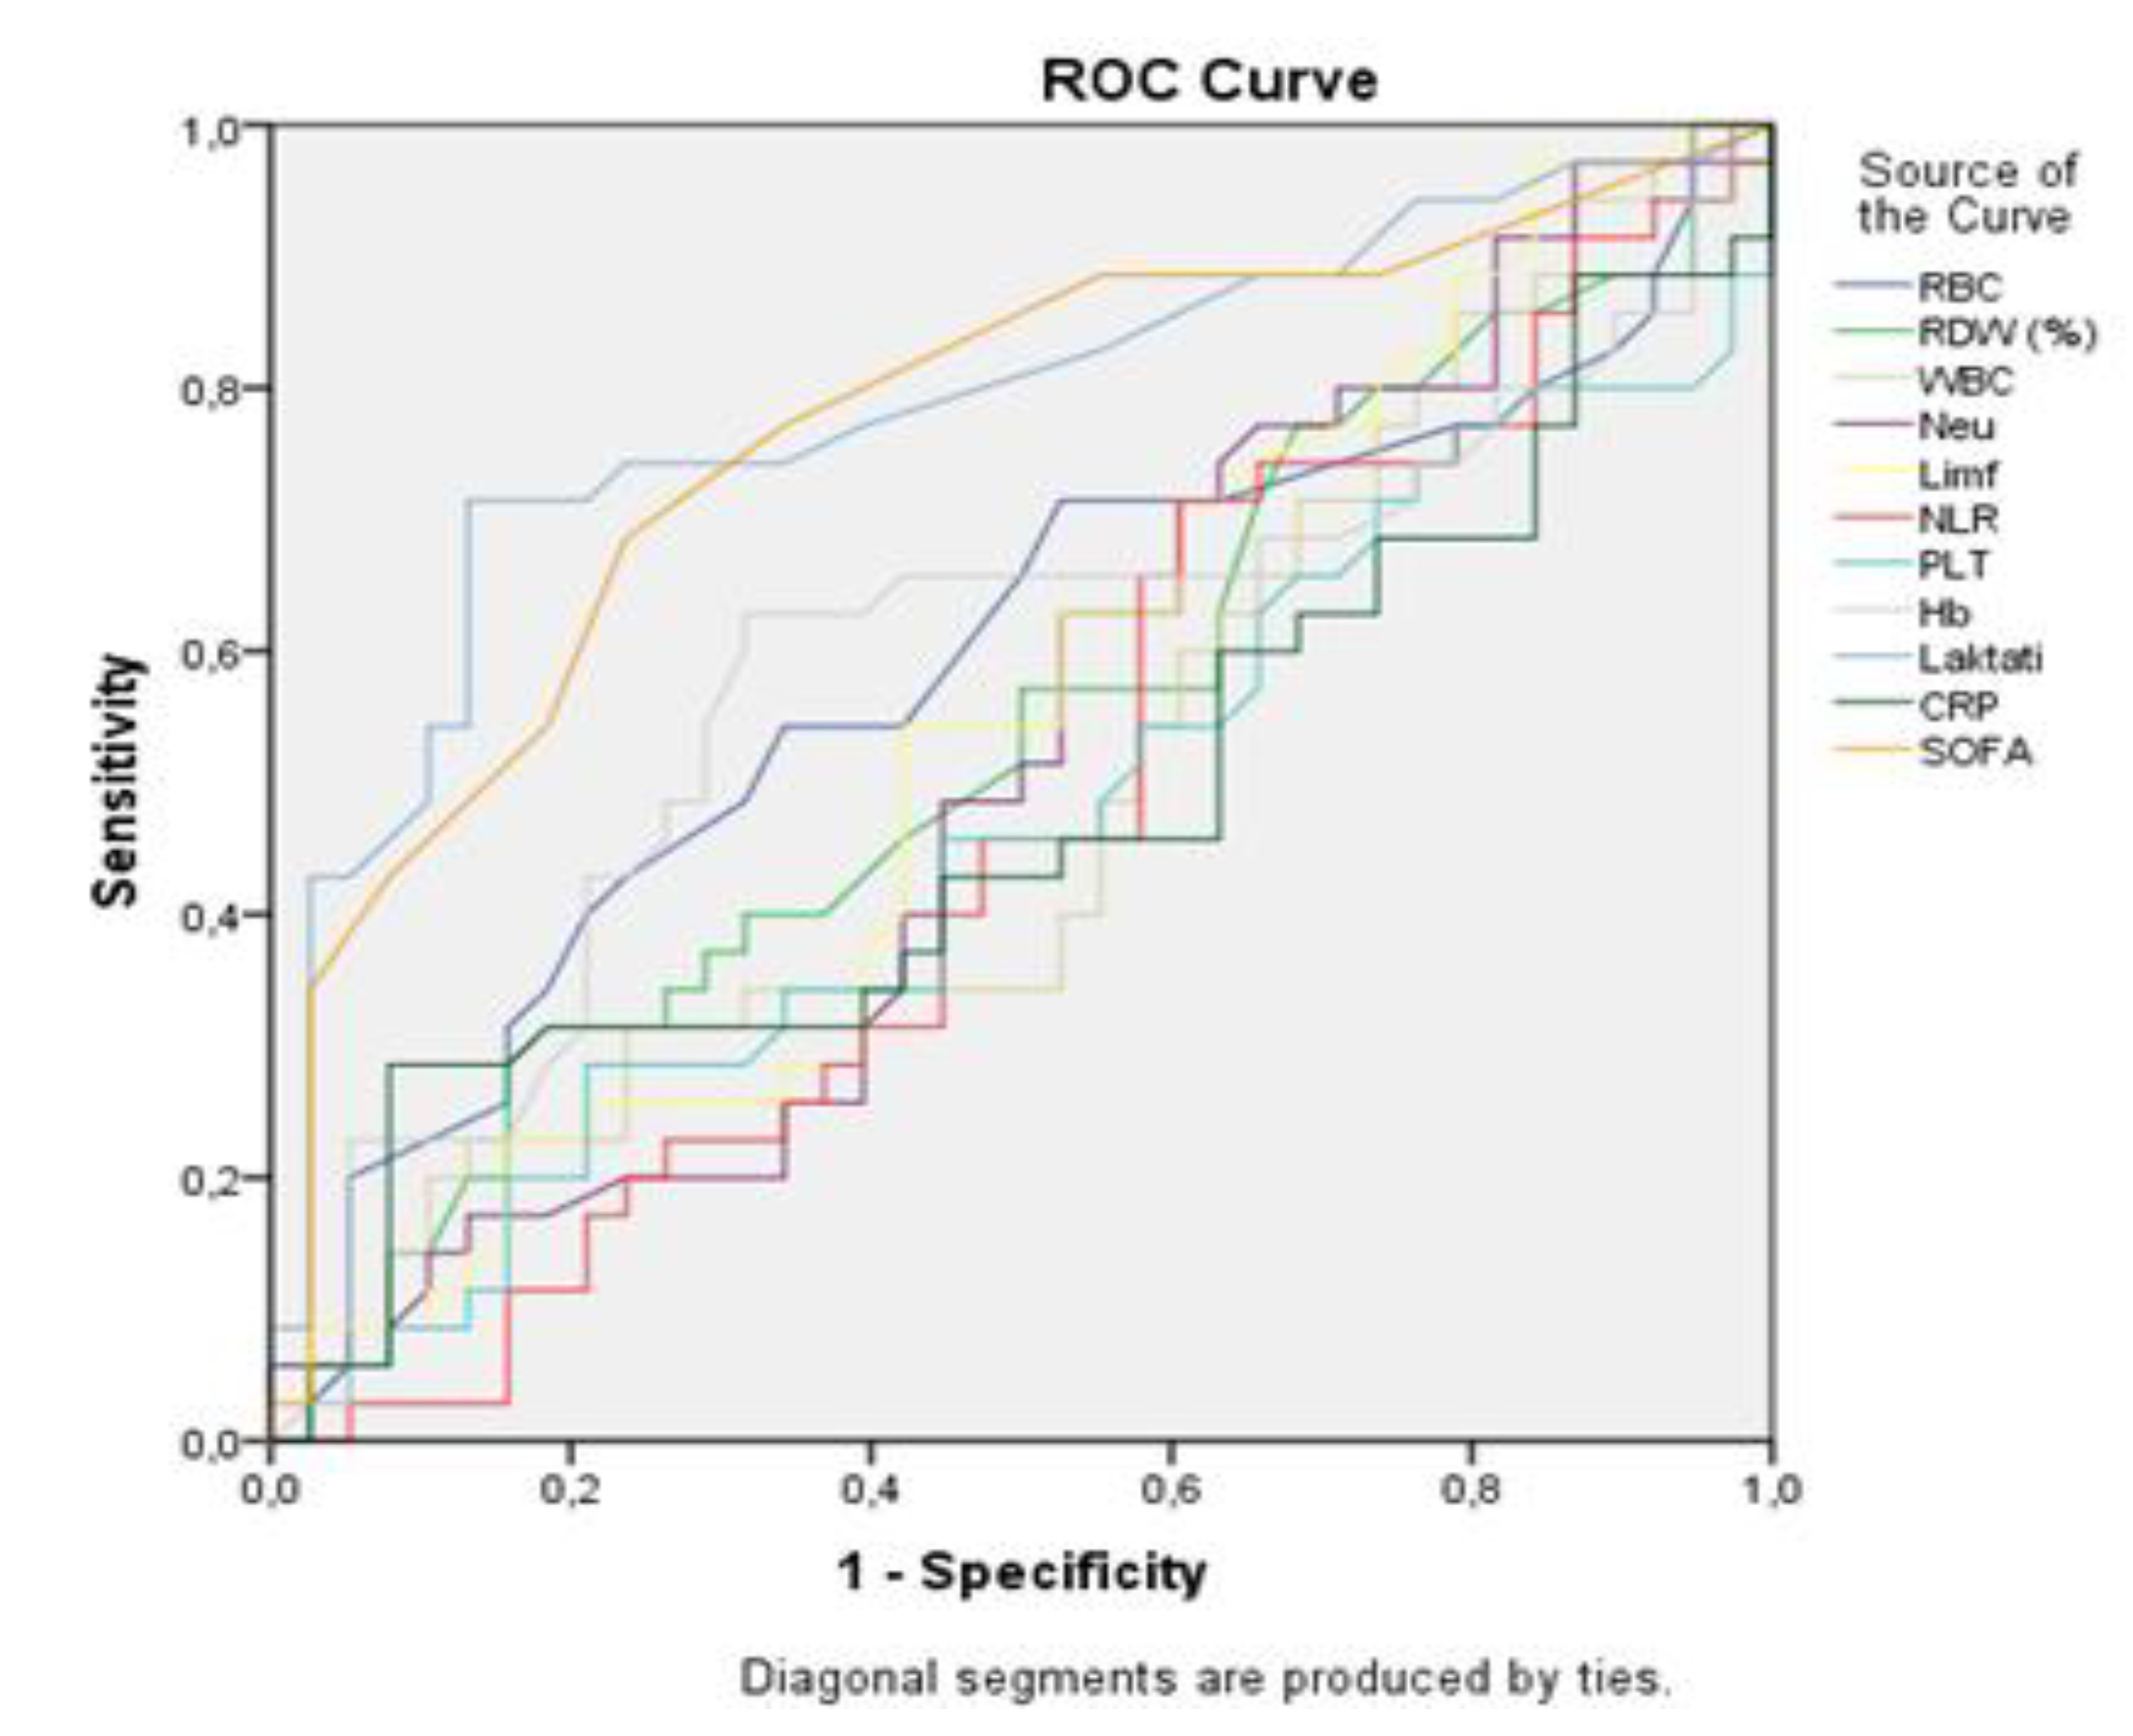
Figure 3.
ROC curves for cardiac markers.
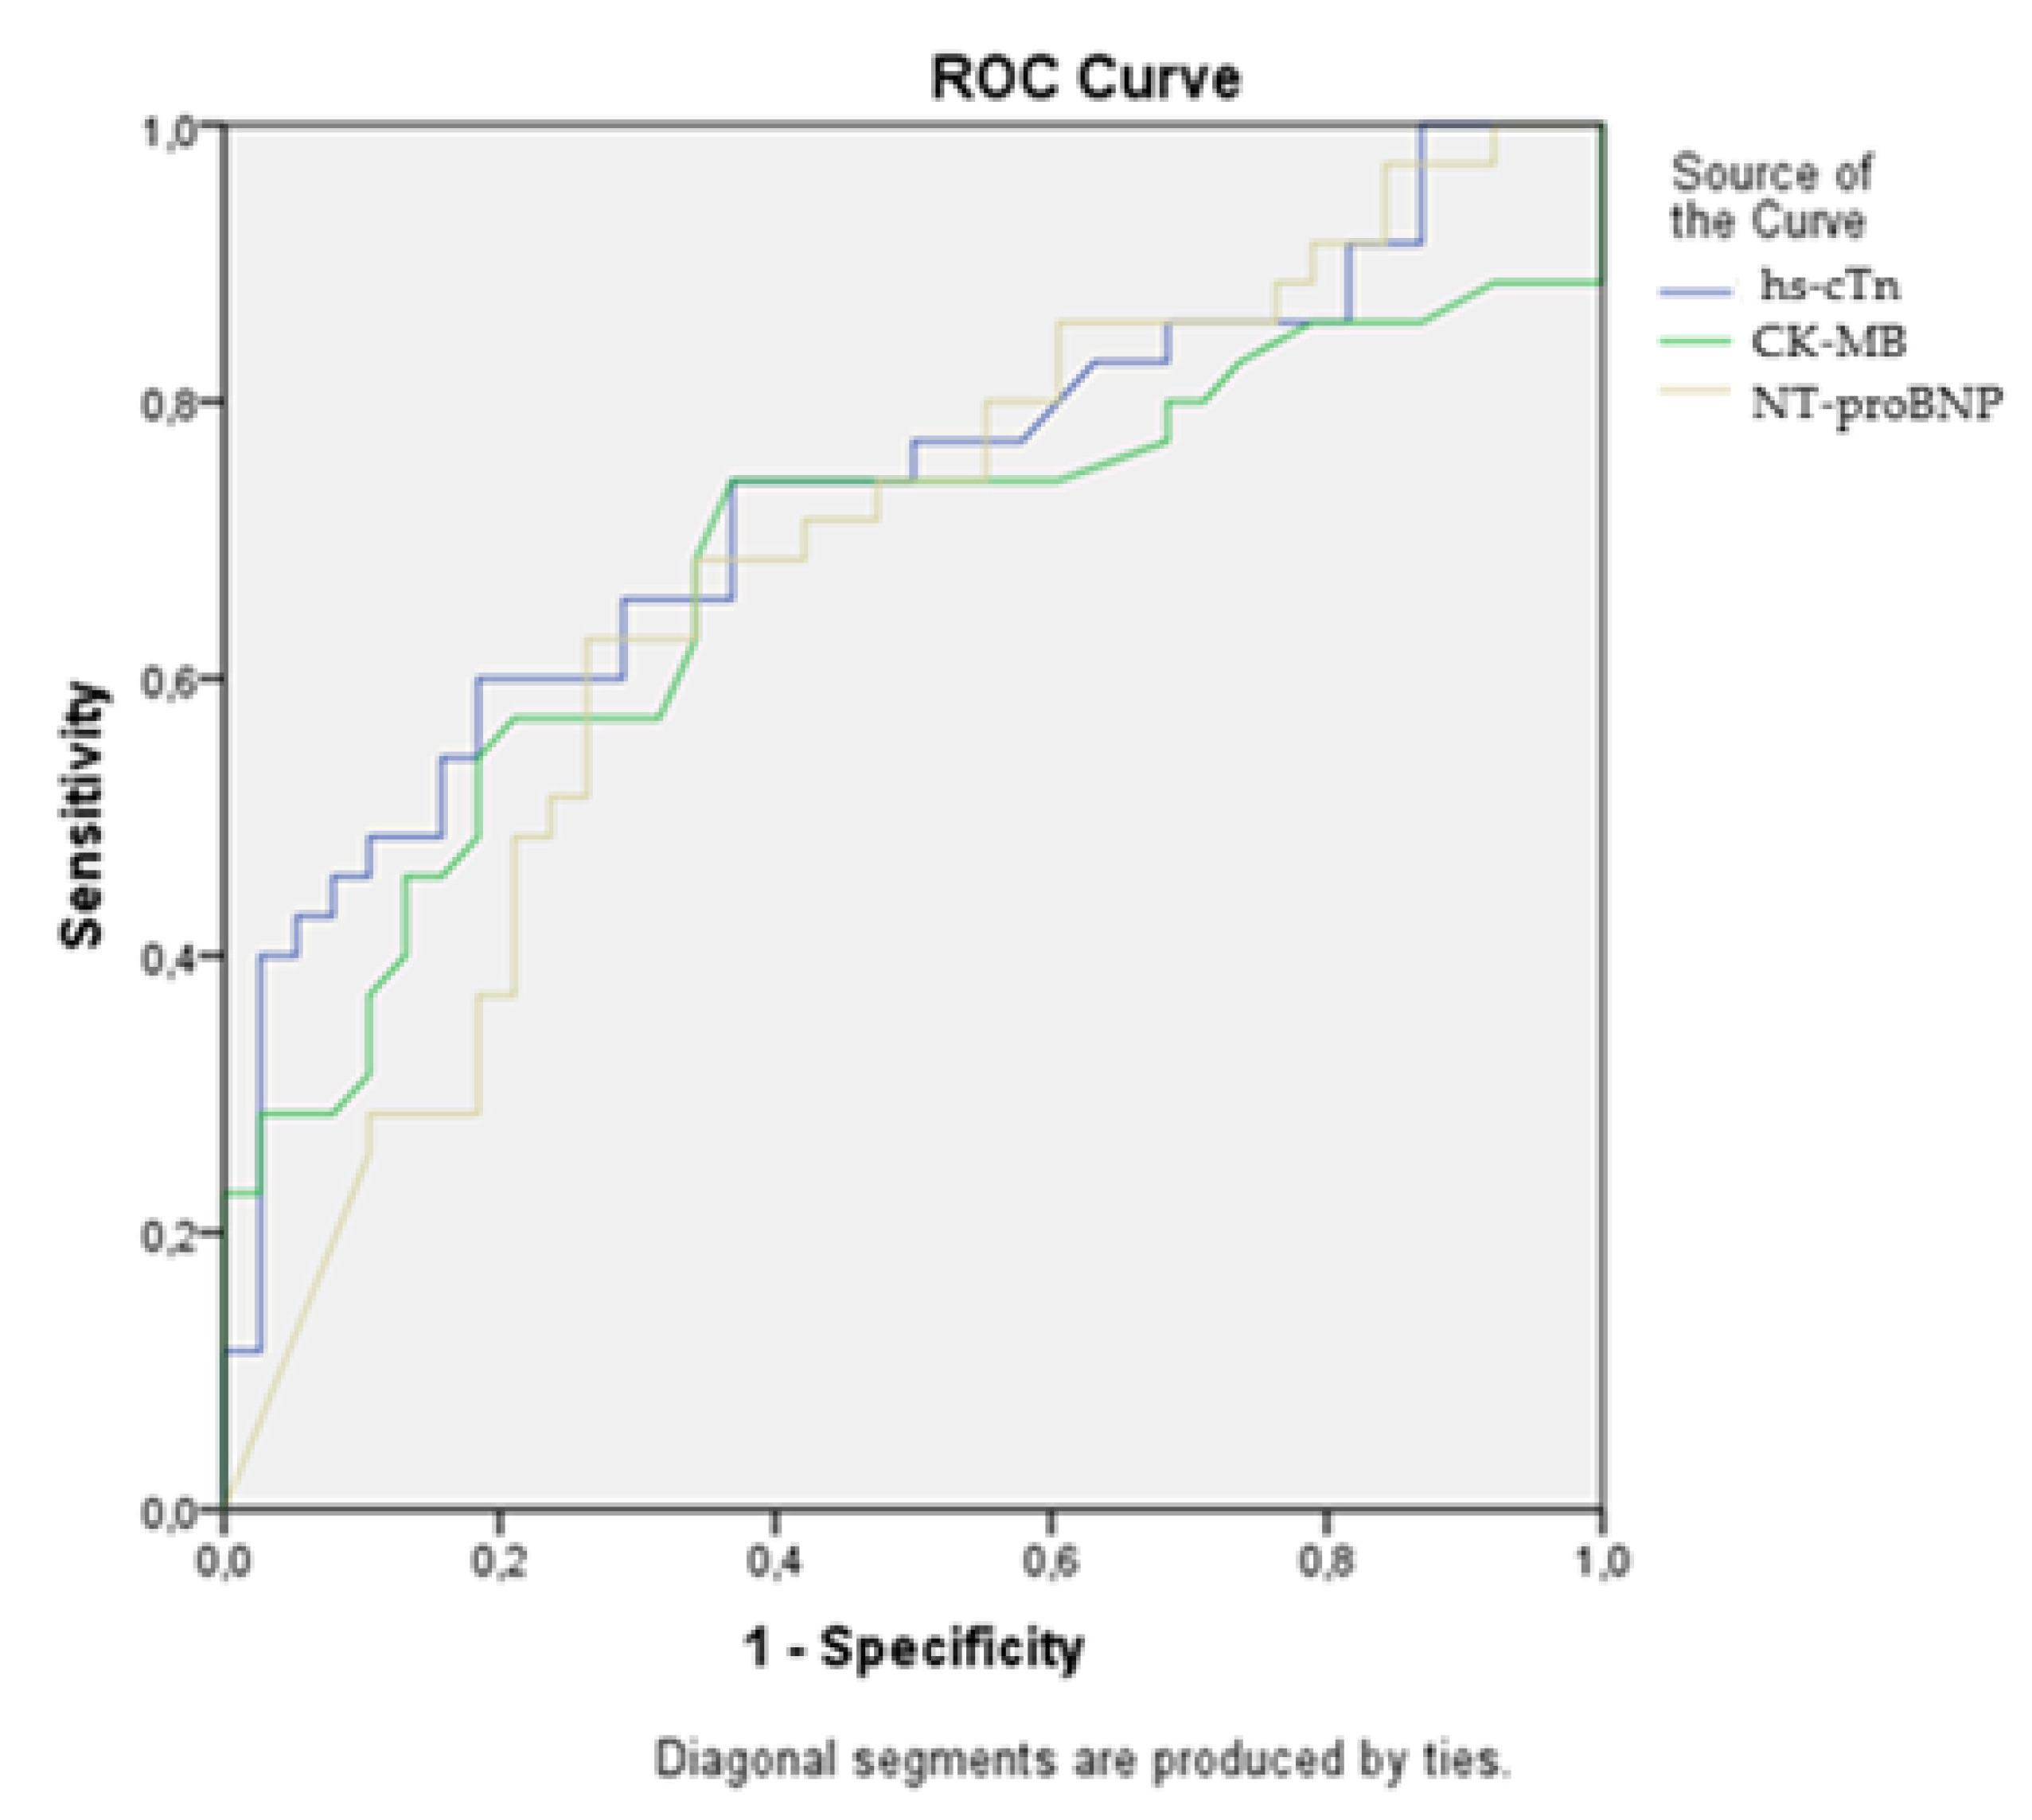
Figure 4.
ROC curves for combinations of cardiac biomarkers.
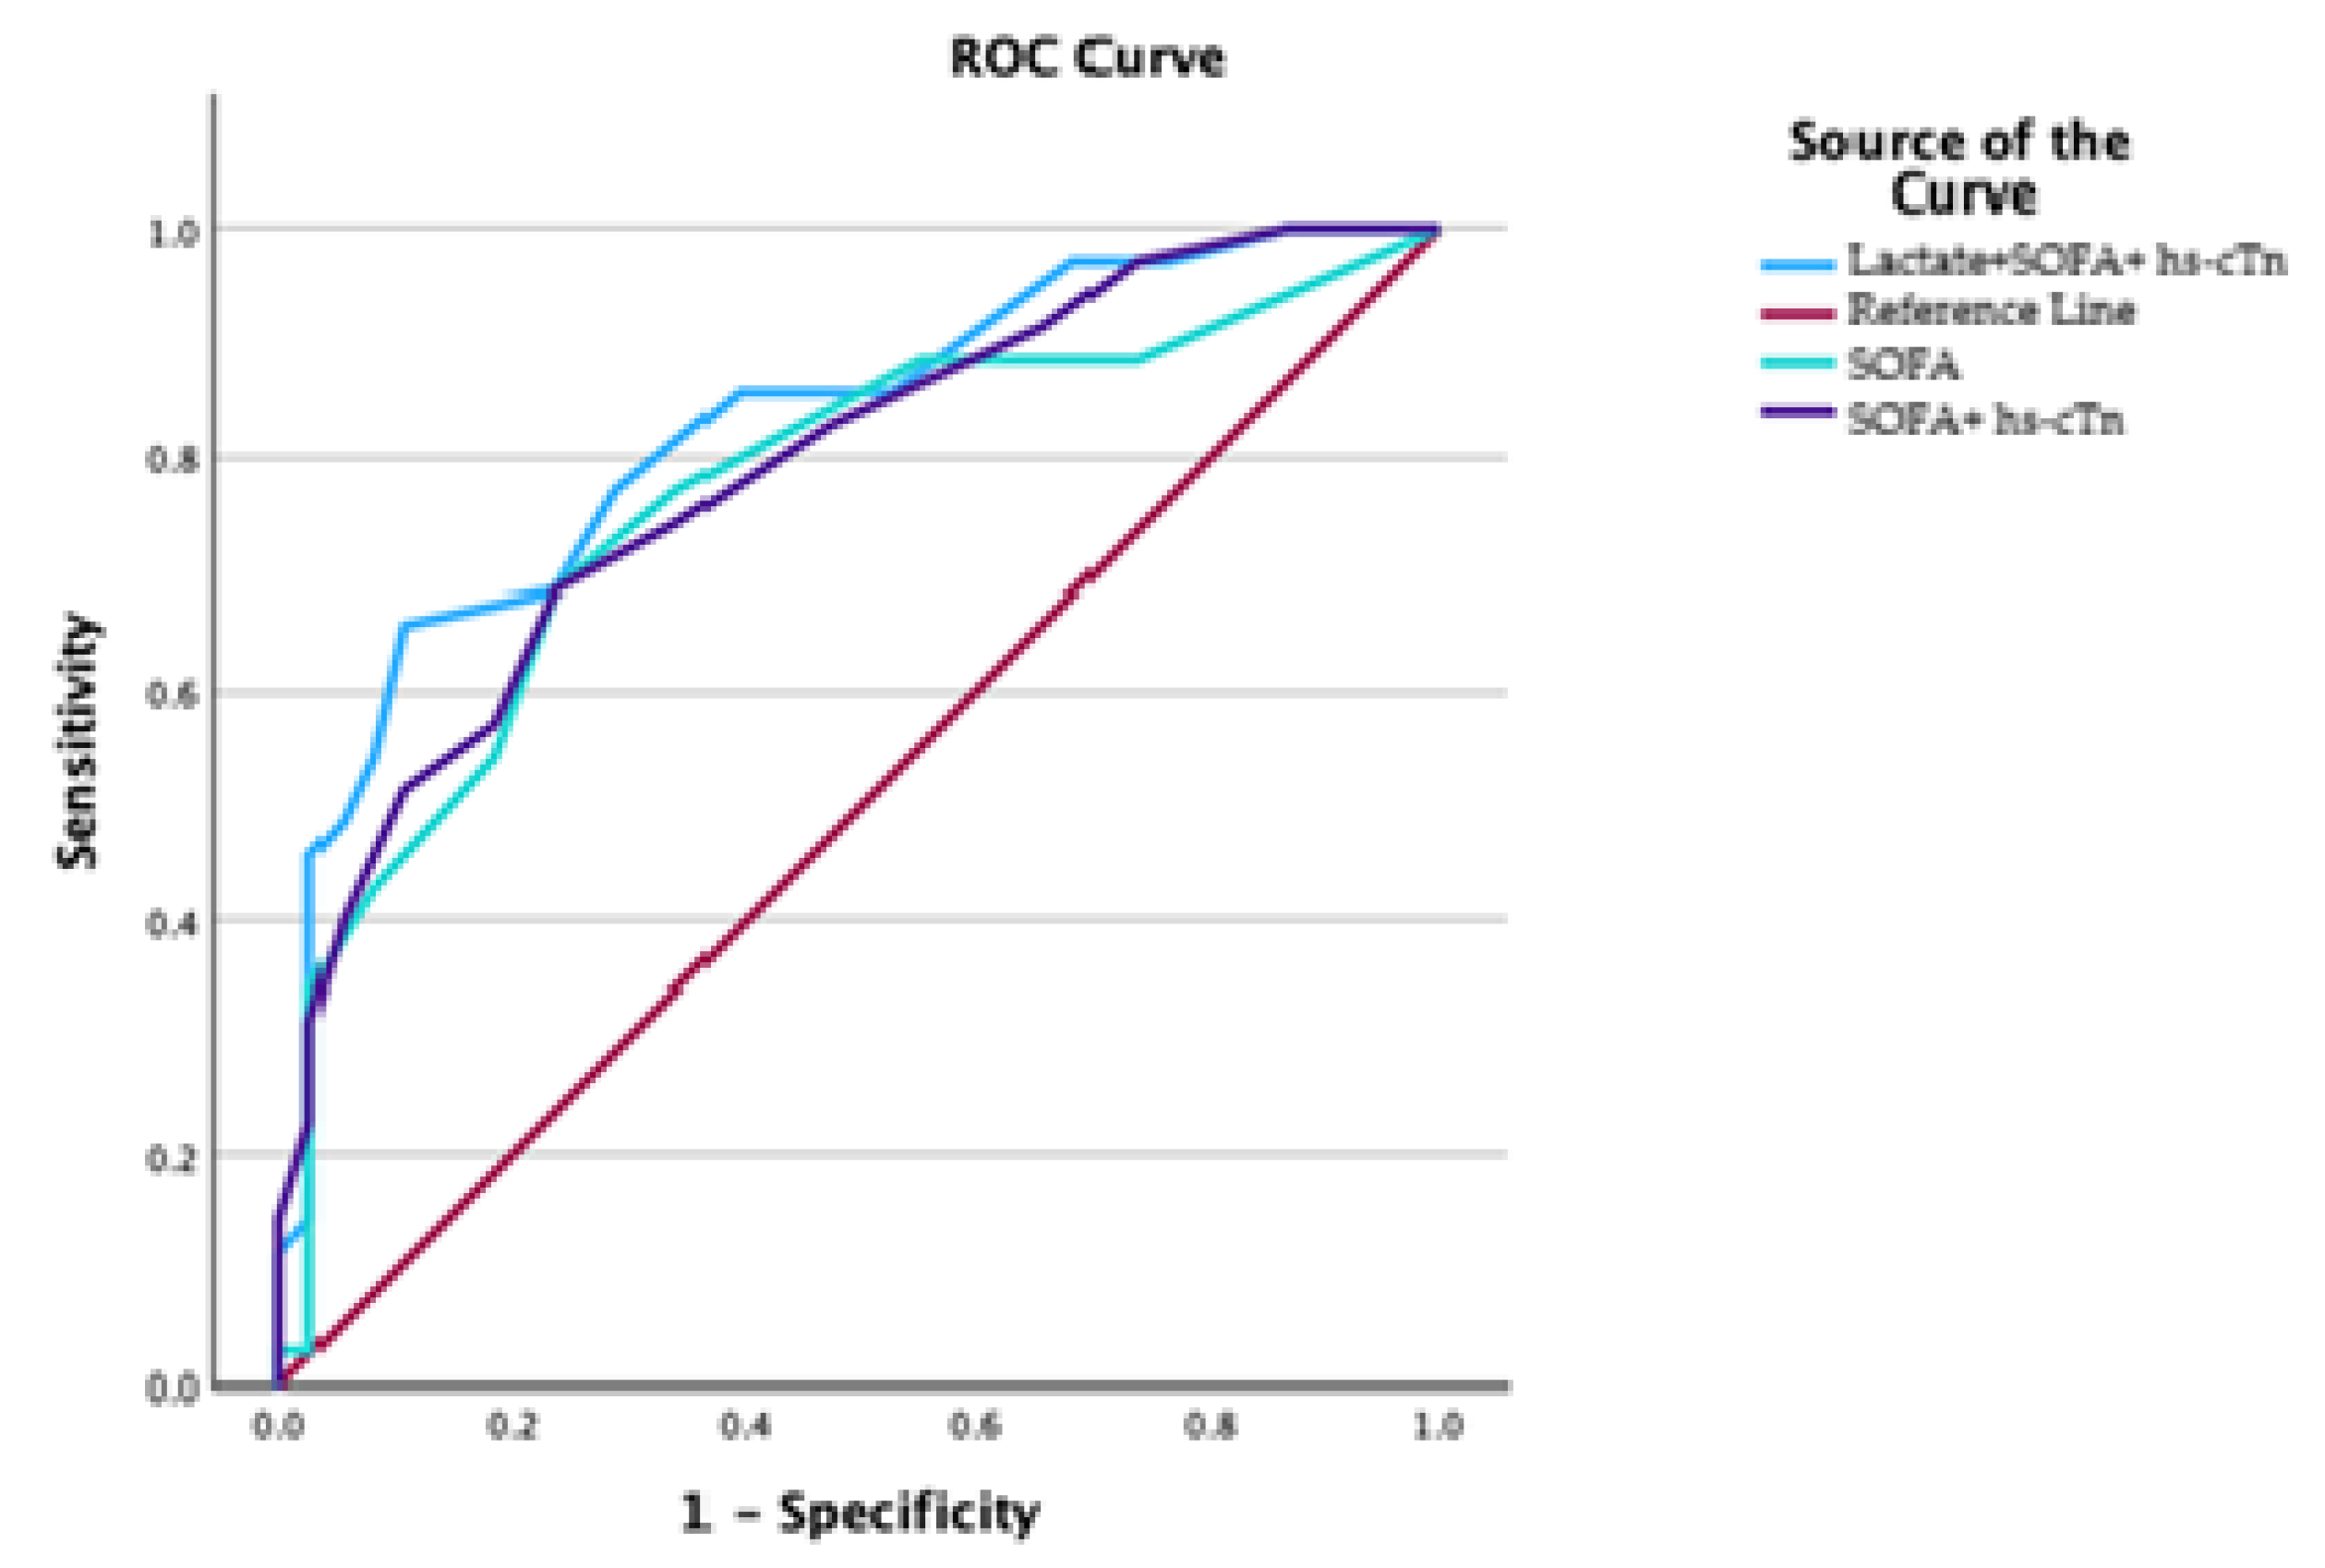
Table 1.
Demographic characteristics of the sample, comparation of comorbidity structure, sites of infection, isolated pathogens, hemodynamic parameters between survivors and non-survivors.
Table 1.
Demographic characteristics of the sample, comparation of comorbidity structure, sites of infection, isolated pathogens, hemodynamic parameters between survivors and non-survivors.
| VARIABLE | Survivors (N=38) | Non-survivors (N=35) | p | |
|---|---|---|---|---|
| Age (Mean ± SD) | 71.50 ± 12.77 | 73.00 ± 9.20 | 0.624** | |
| Gender N(%) | ||||
| Male | 19 (50.0%) | 17 (48.6%) | 0.903* | |
| Female | 19 (50.0%) | 18 (51.4%) | ||
| Comorbidity structure N(%) | ||||
| Arterial hypertension | 27 (71.1%) | 29 (82.9%) | 0.233* | |
| Diabetes mellitus | 13 (35.1%) | 18 (51.4%) | 0.163* | |
| Chronic obstructive pulmonary disease (COPD) | 4 (10.5%) | 3 (8.6%) | 0.777* | |
| Asthma | 2 (5.3%) | 2 (5.7%) | 0.933* | |
| Sepsis source N(%) | ||||
| Lungs | 2 (5.26%) | 3 (8.57%) | 0.4927* | |
| Central nervous system infection (CNS) | 2 (5.26%) | 5 (14.28%) | ||
| Abdomen | 4 (10.52%) | 3 (8.57%) | ||
| Skin | 2 (5.26%) | 4 (11.42%) | ||
| Not identified | 10 (26.32%) | 8 (22.86%) | ||
| Microbiologically confirmed bacteria from blood culture N(%) | 14 (36.8%) | 14 (40.0%) | **** | |
| Escherichia coli (E. coli) | 8 (21.1%) | 5 (14.3%) | ||
| Klebsiella pneumoniae (K. pneumoniae) | 2 (5.3%) | 2 (5.7%) | ||
| Pseudomonas aeruginosa (P. aeruginosa) | 1 (2.6%) | 1 (2.9) | ||
| Acinetobacter baumanii | 0 (0.0%) | 1 (2.9%) | ||
| Vancomycin resistant enterococcus | 1 (2.6%) | 0 (0.0%) | ||
| Other | 2 (2.6%) | 5 ((14.3%) | ||
| Vital Signs | ||||
| Heart rate (beats per minute - bpm); (Mean ± SD) | 95.00 ± 21.35 | 87.00 ± 26.23 | 0.728** | |
| Respiratory rate (RR) (Median (IQR)) | 15 (13-16.5) | 18 (15-21) | 0.003*** | |
| Body temperature (Median (IQR)) | 37.00 (36.6-38.7) | 37.00 (36.7-38.2) | 0.214*** | |
| Oxygen saturation (SaO2) (Median (IQR)) | 96 (94-98) | 95.2 (93-98) | 0.398*** | |
| MAP (Mean ± SD) | 86.67 ± 18.85 | 73.33 ± 21.54 | 0.037 | |
| SOFA (Median (IQR)) | 4 (4-5) | 7 (7-9) | < 0.001 | |
| qSOFA (Median (IQR)) | 0 (0-1) | 1 (1-2) | < 0.001 | |
| GCS (Median (IQR)) | 15 (10-15) | 9 (6-15) | < 0.001 | |
| Septic shock N(%) | 3 (7.9%) | 17 (48.6%) | <0.001 | |
| Length of stay (Median (IQR)) | 12 ((10.5-32.5) | 2 (2-19) | 0.051 | |
|
χ² test* T test** |
Mann–Whitney U test *** P value is not calculated due to small numbers in groups*** |
|||
Table 2.
Differences in standard laboratory parameters, blood gas analysis and cardiac biomarkers between survivors and non-survivors.
Table 2.
Differences in standard laboratory parameters, blood gas analysis and cardiac biomarkers between survivors and non-survivors.
| VARIABLE | Survivors (N=38) |
Non-survivors (N=35) |
p |
|---|---|---|---|
| WBC† [x10^9/L] | 16.71 (10.6-20.2) | 14.87 (10.8-20.9) | 0.947 |
| Neu† [%] | 88.90 (81.3-91.7) | 89.10 (83.3-91.1) | 0.847 |
| Limf† [%] | 5.60 (3.5-11.1) | 6.20 (4.1-12.0) | 0.600 |
| NLR† | 16.29 (7.38-25.87) | 14.15 (6.94-21.78) | 0.612 |
| PLT† [x10^9/L] | 208.00 (141.75-291.0) | 183.00 (128.0-296.0) | 0.547 |
| RBC [x10^12/L] | 4.09 ± 0.81* | 4.32 ± 0.91 | 0.255* |
| RDW† [%] | 14.40 (13.3-15.97) | 14.60 (13.6-16.3) | 0.607 |
| Hb [g/L] | 121.63 ± 24.98 | 129.97 ± 31.03 | 0.208* |
| Hct† [L/L] | 0.35 (0.32-0.40) | 0.40 (0.31-0.44) | 0.198 |
| CRP [mg/L] | 227.08 ± 103.40 | 221.51 ± 132.04 | 0.841* |
| PCT† [ng/mL] | 9.20 (3.54-40.04) | 14.60 (2.30-79.72) | 0.787 |
| Fibrinogen† [g/L] | 5.46 (4.32-8.55) | 4.64 (3.48-8.13) | 0.307 |
| Na† [mmol/L] | 137.00 (134.0-141.0) | 139.00 (135.0-143.0) | 0.226 |
| K† [mmol/L] | 3.90 (3.5-4.2) | 4.30 (3.4-4.8) | 0.114 |
| Mg† [mmol/L] | 0.81 (0.66-0.90) | 0.89 (0.74-0.96) | 0.049 |
| Urea† [mmol/L] | 14.15 (7.85-22.07) | 17.50 (9.90-26.30) | 0.140 |
| ALT† [U/L] | 29.50 (20.5-44.2) | 40.00 (23.0-109.0) | 0.139 |
| AST† [U/L] | 30.00 (20.75-62.75) | 59.00 (40.0-141.0) | 0.006 |
| GGT† [U/L] | 28.50 (19.0-65.75) | 51.00 (27.0-113.0) | 0.022 |
| D dimer† [mg/L] FEU] | 2.26 (1.5-3.7) | 4.38 (3.5-12.7) | <0.001 |
| Hs-cTn† [ng/L] | 27.00 (12.6-133.29) | 172.20 (27.5-1676.9) | 0.001 |
| CK-MB† [U/L] | 21.00 (13.0-33.0) | 36.00 (17.0-79.0) | 0.009 |
| NT-pro BNP† [ pg/mL] | 2.603.50 (1526.5-4971.0) | 5.024.00 (2516.0-25000.0) | 0.009 |
| Laktati† [mmol/L] | 1.40 (1.07-1.82) | 2.70 (1.60-4.60) | <0.001 |
| pH† | 7.42 (7.35-7.44) | 7.38 (7.27-7.45) | 0.246 |
| PO2† [mmHg] | 75.00 (66.5-88.0) | 79.00 (65.0-103.0) | 0.154 |
| PCO2† [mmHg] | 35.00 (32.0-38.0) | 33.00 (26.0-36.0) | 0.040 |
| Bicarbonate† [mmol/L] | 21.95 (20.07-25.60) | 20.10 (12.60-23.30) | 0.048 |
| Base excess† [mmol/L] | -0.95 (-4.0 - 0.90) | -5.00 (-9.7 - -0.5) | 0.010 |
|
Mean ± SD Median (IQR) † Mann-Whitney U test* |
Table 3.
Diagnostic value of laboratory parameters and SOFA score in predicting mortality in sepsis.
Table 3.
Diagnostic value of laboratory parameters and SOFA score in predicting mortality in sepsis.
| Variables | AUC (95% confidence interval (CI*)) | p | Cut-Off Value | Sensitivity (%) | Specificity (%) | ||
|---|---|---|---|---|---|---|---|
| RBC [x10^12/L] | 0.588 (0.454-0.721) | 0.189 | 4.2 | 54.3 | 65.8 | ||
| RDW [%] | 0.535 (0.401-0.669) | 0.608 | 16.1 | 31.4 | 81.6 | ||
| WBC [x10^9/L] | 0.495 (0.361-0.630) | 0.947 | 16.54 | 65.7 | 52.6 | ||
| Neu [%] | 0.513 (0.379-0.648) | 0.847 | 91.2 | 20.0 | 65.8 | ||
| Limf [%] | 0.536 (0.402-0.669) | 0.600 | 2.8 | 97.1 | 15.8 | ||
| NLR | 0.465 (0.332-0.599) | 0.612 | 18.69 | 68.6 | 44.7 | ||
| PLT [10^9/L] | 0.459 (0.325-0.593) | 0.547 | 104 | 20.0 | 94.7 | ||
| Hb [g/L] | 0.585 (0.449-0.721) | 0.212 | 126 | 62.9 | 68.4 | ||
| Lactate [mmol/L] | 0.785 (0.676-0.895) | <0.001 | 2.1 | 71.4 | 86.8 | ||
| CRP [mg/L] | 0.475 (0.338-0.612) | 0.711 | 333 | 71.4 | 7.9 | ||
| SOFA | 0.767 (0.655-0.879) | <0.001 | 5 | 68.6 | 76.3 | ||
| CI- Confidence interval* | |||||||
Table 4.
Diagnostic value of cardiac biomarkers in predicting sepsis mortality.
| Variables | AUC (95% CI) | p | Cut-Off Value | Sensitivity (%) | Specificity (%) |
|---|---|---|---|---|---|
| hs-cTn [ng/L] | 0.729 (0.610-0.847) | 0.001 | 146.200 | 60.0 | 81.6 |
| CK-MB [U/L] | 0.679 (0.550-0.808) | 0.009 | 26.50 | 74.3 | 63.2 |
| NT-proBNP [pg/mL] | 0.677 (0.553-0.801) | 0.009 | 4385.00 | 62.90 | 73.7 |
Table 5.
Statistical comparison of ROC curves (Hanley & McNeil method).
| Comparation between ROC Curves | p | Standard Error |
Difference | Z Statistic |
|---|---|---|---|---|
| Lactate vs SOFA | 0.822 | 0.079 | 0.018 | 0.225 |
| Lactate vs hs-cTn | 0.495 | 0.082 | 0.056 | 0.682 |
| Lactate vs CK-MB | 0.221 | 0.087 | 0.106 | 1.225 |
| Lactate vs NT-proBNP | 0.200 | 0.084 | 0.108 | 1.281 |
| SOFA vs hs-cTn | 0.646 | 0.083 | 0.038 | 0.459 |
| SOFA vs CK-MB | 0.313 | 0.087 | 0.088 | 1.009 |
| SOFA vs NT-proBNP | 0.289 | 0.085 | 0.090 | 1.059 |
| hs-cTn vs CK-MB | 0.575 | 0.089 | 0.050 | 0.561 |
| hs-cTn vs NT-proBNP | 0.550 | 0.087 | 0.052 | 0.598 |
| CK-MB vs NT-proBNP | 0.982 | 0.089 | 0.002 | 0.022 |
Table 6.
Analysis of the individual impact of biomarkers and the SOFA score on mortality in patients with sepsis - results of univariate analysis.
Table 6.
Analysis of the individual impact of biomarkers and the SOFA score on mortality in patients with sepsis - results of univariate analysis.
| Variables | Univariate | |||
|---|---|---|---|---|
| P | Odds ratio (ОR) | 95% CI | ||
| Lower Limit | Upper Limit | |||
| hs-cTn (log10) [ng/L] | 0.001 | 2.766 | 1.518 | 5.041 |
| CK-MB [U/L] | 0.030 | 1.020 | 1.002 | 1.039 |
| NT-Pro BNP (log10) [pg/mL] | 0,015 | 2.937 | 1.237 | 6.976 |
| SOFA | <0.001 | 1.450 | 1.180 | 1.781 |
Table 7.
ROC analysis of biomarker combinations for prediction of mortality.
| Test Variable(s) | AUC (95% CI) | Standard Error |
p | Cut-Off | Sensitivity (%) | Specificity (%) |
|---|---|---|---|---|---|---|
| Lactate+SOFA+ hs-cTn | 0,827 (0,732-0,922) |
0,048 | <0.001 | 8 | 77 | 81 |
| SOFA+ hs-cTn | 0.789 (0.686-0.892) |
0.052 | <0.001 | 7 | 74 | 66 |
| SOFA | 0.767 (0.655-0.879) |
0.057 | 5 | 77 | 66 |
Disclaimer/Publisher’s Note: The statements, opinions and data contained in all publications are solely those of the individual author(s) and contributor(s) and not of MDPI and/or the editor(s). MDPI and/or the editor(s) disclaim responsibility for any injury to people or property resulting from any ideas, methods, instructions or products referred to in the content. |
© 2026 by the authors. Licensee MDPI, Basel, Switzerland. This article is an open access article distributed under the terms and conditions of the Creative Commons Attribution (CC BY) license.
Copyright: This open access article is published under a Creative Commons CC BY 4.0 license, which permit the free download, distribution, and reuse, provided that the author and preprint are cited in any reuse.


