
Submitted:
25 August 2026
Posted:
26 August 2026
You are already at the latest version
Abstract
Agriculture faces compounding pressures from food insecurity, climate change and resource scarcity, creating urgent demand for scalable analytical tools. This PRISMA 2020-compliant systematic review synthesises 582 peer-reviewed studies on machine learning (ML) and deep learning (DL) in agriculture, retrieved from Scopus for January 2019 to March 2026. Full texts were retrieved for 430 studies (73.9%), which form the analytic subsample for every full-text-derived variable; all such statistics are reported against that denominator. Every study characteristic was independently extracted using a transparent, section-aware rule-based pipeline. Publication volume grew from 6 papers in 2019 to 251 in 2025 (compound annual growth ≈ 86%); the 61 papers from January–March 2026 are a partial year and are excluded from growth comparisons. Convolutional backbones remain dominant (57.2% of full texts), but Transformer-based models rose from 14.3% of full texts in 2022 to 41.2% in 2025. Crop health and protection accounts for 48.3% of the corpus and production forecasting for 30.9%. South Asia and East Asia together contribute 59.3% of output, whereas Sub-Saharan Africa contributes 9 papers (1.5%) and Latin America and the Caribbean 8 (1.4%), against a far larger share of the global hunger burden. Classified at country level, 78.4% of the corpus originates from Global South institutions, but India and China alone supply 67.3% of that output. Two new instruments quantify the translation gap. An evidence-maturity classification shows that 33.0% of studies never leave curated data, 36.5% reach field validation and 30.5% reach an operational prototype; median reported accuracy is 99.0% for studies evaluated on public benchmarks alone but 95.0% for studies evaluated on their own field data (Mann–Whitney p < 0.001). A 0–10 reproducibility index has a median of 3; code is openly available in 7.2% of studies, data in 24.7%, and both in 4.9%. Open data disclosure improves significantly over time (Spearman ρ = 0.131, p = 0.007) whereas code sharing does not. Headline accuracy figures should therefore be read as upper bounds obtained under controlled evaluation. Benchmark standardisation, field-realistic validation, smallholder-relevant design and geographic equity remain the field's most pressing unresolved challenges.
Keywords:
systematic review
; precision agriculture
; convolutional neural network
; vision transformer
; crop yield prediction
; evidence maturity
; open science
; reproducibility
1. Introduction
1.1. The Global Agricultural Challenge
Agriculture stands at the centre of humanity's most pressing challenges. According to The State of Food Security and Nutrition in the World 2023, around 733 million people—roughly one in eleven globally and one in five in Africa—faced chronic hunger in 2023 (FAO, 2023). The world is falling significantly short of achieving Sustainable Development Goal 2 (Zero Hunger) by 2030. These pressures are compounded by accelerating climate change, increasing strain on freshwater and soil resources, and declining agrobiodiversity. Meeting the demands of a global population projected to reach nearly ten billion by mid-century will also require sustainable intensification of production (FAO, 2023). Together, these interacting pressures require transformative advances in how agricultural systems are monitored, managed and optimised at scale.
Traditional approaches to crop monitoring, disease surveillance and yield forecasting rely on labour-intensive field sampling, expert visual inspection and empirical models that generalise poorly across diverse agro-ecological zones. The proliferation of high-resolution remote sensing platforms—including the Sentinel and Landsat satellite series, unmanned aerial vehicles (UAVs) and ground-based Internet of Things (IoT) sensor networks—has generated an unprecedented volume and variety of spatiotemporal agricultural data. The analytical methods required to translate this abundance into actionable agronomic intelligence have historically lagged behind the capacity to collect it.
1.2. The Rise of Machine Learning and Deep Learning in Agriculture
Machine learning (ML) and, more recently, deep learning (DL) have emerged as the analytical paradigms most capable of extracting structured knowledge from large, heterogeneous agricultural datasets. The foundational principles of deep learning—learning hierarchical representations through multiple layers of nonlinear transformations—were established by LeCun et al. (2015), whose landmark review showed transformative performance gains across visual recognition, speech processing and drug discovery. These advances provided the technical foundation for applying representational learning to agricultural imagery, spectral data and environmental time series.
The pioneering systematic review by Kamilaris and Prenafeta-Boldú (2018) surveyed approximately 40 deep learning studies in agriculture and concluded that convolutional neural networks (CNNs) provided high precision in disease detection and image classification. That review served as a critical marker for the field, but the eight years since its publication have witnessed a qualitative and quantitative transformation it could not have anticipated. Three developments in particular have reshaped the landscape.
First, the Transformer architecture introduced by Vaswani et al. (2017)—based purely on self-attention without recurrence or convolution—unlocked a generation of models capable of capturing long-range spatial and temporal dependencies in agricultural data. Vision Transformers (ViT) and their variants have since matched or exceeded CNN performance across several agricultural remote sensing benchmarks, particularly for multi-scale crop classification and phenological monitoring.
Second, encoder–decoder architectures such as U-Net (Ronneberger et al., 2015)—originally developed for biomedical image segmentation—enabled pixel-wise semantic segmentation of field imagery at resolutions previously unattainable with sliding-window classifiers. In agriculture, U-Net and its derivatives have been applied to weed mapping, field delineation, soil boundary detection and disease lesion localisation in high-resolution UAV imagery.
Third, the integration of multi-source data streams—satellite imagery (Sentinel-1/2, Landsat, MODIS), UAV-derived orthomosaics, IoT sensor readings, climate reanalyses and field survey data—has driven demand for fusion architectures and sequence models. Long short-term memory (LSTM) networks (Hochreiter & Schmidhuber, 1997) remain widely deployed for yield prediction, irrigation scheduling and climate impact assessment, while ensemble methods such as Random Forests (Breiman, 2001) serve similar roles where training data are limited or interpretability is required.
1.3. Gaps in the Existing Literature
To confirm that no equivalent synthesis already exists, a dedicated scoping search was executed before the main review. Scopus and Google Scholar were queried for review articles published between 2019 and 2026 combining review terms (“review”, “systematic review”, “survey”, “meta-analysis”, “bibliometric”) with ML/DL terms and agricultural terms. The candidate reviews retrieved were screened against three criteria: PRISMA compliance, cross-domain rather than single-task scope, and temporal coverage extending beyond 2023. No retrieved review satisfied all three. Existing reviews are instead characterised by three recurring limitations.
- Narrow domain scope: most published reviews focus on a single application area—crop disease detection, precision irrigation or a specific crop—and do not provide a cross-domain synthesis of method performance, geographic distribution or open science practice.
- Outdated temporal coverage: reviews published before 2023 predate the widespread adoption of Vision Transformers, YOLO-v8 and multi-modal fusion architectures, and therefore cannot reflect the current state of the art.
- Absence of systematic rigour: many existing surveys employ informal or non-reproducible search strategies, lack formal eligibility criteria, and do not report PRISMA-compliant screening and data extraction procedures.
A fourth gap motivates the present work specifically. Existing reviews report aggregate performance figures without conditioning them on the evidential context in which they were obtained, and rarely address the geography of ML/DL agricultural research—whether the distribution of studies reflects the geographic distribution of food insecurity, or whether research disproportionately serves contexts that already benefit from advanced agricultural infrastructure.
1.4. Objectives of This Review
This PRISMA 2020-compliant systematic review addresses these gaps with seven primary objectives:
- To identify and quantify the volume, geographic distribution and temporal trends of ML and DL publications in agriculture from 2019 to March 2026.
- To classify and map the taxonomy of ML and DL architectures applied in agriculture, distinguishing methods actually employed from methods merely cited.
- To construct a hierarchical taxonomy of agricultural application domains that avoids the large undifferentiated residual categories of earlier syntheses.
- To critically appraise methodological quality, reproducibility, and open-data and open-code practice, using an explicit composite reproducibility index.
- To assess performance reporting practices and unit-aware metric comparability, and to condition reported performance on the evidential context in which it was obtained.
- To quantify the translation gap between benchmark performance and operational readiness through an explicit evidence-maturity classification.
- To identify research gaps, emerging trends and priority directions for future work, particularly in climate-smart and precision agriculture, multimodal data fusion, and explainable AI for smallholder deployment.
1.5. Scope and Structure of This Review
The review covers January 2019 to March 2026, beginning immediately after the Kamilaris and Prenafeta-Boldú (2018) survey and extending through the transformer era, post-2022 foundation model developments and the emergence of edge AI deployment in agricultural contexts. The search was restricted to peer-reviewed journal articles and review papers indexed in Scopus, in English. A total of 582 papers across 258 journals and 58 first-author countries were included following a multi-stage screening process conducted in accordance with the PRISMA 2020 guidelines (Page et al., 2021). Full texts were retrieved for 430 of these (73.9%); this subsample supports every analysis that depends on the content of the paper rather than its bibliographic record, and its denominator is stated explicitly wherever it is used.
The remainder of the paper is structured as follows. Section 2 describes the methodology, including the search strategy, eligibility criteria, screening pipeline, the two independent data extraction passes and their validation, and the two composite instruments introduced here. Section 3 presents the results. Section 4 discusses the findings in relation to the broader literature, identifies research gaps and outlines directions for future work. Section 5 concludes.
2. Methodology
This review follows the Preferred Reporting Items for Systematic Reviews and Meta-Analyses (PRISMA 2020) guidelines (Page et al., 2021). The entire screening, extraction and analysis workflow was implemented in Python and Jupyter notebooks. This section describes the search strategy, eligibility criteria, screening process, the two independent extraction passes, and the two composite instruments introduced in this research.
2.1. Protocol
The review protocol was designed and documented prior to data collection in accordance with PRISMA 2020 reporting guidelines. Formal registration on a prospective registry (PROSPERO or OSF) was not completed; the review therefore does not claim prospective registration. All protocol elements—search strategy, eligibility criteria, screening procedure and the data extraction framework—were nevertheless fully specified before the search was executed and are documented verbatim in the supplementary notebooks. A single database, Scopus, was used as the sole source, for the reasons set out in Section 2.2 and discussed as a limitation in Section 4.10.
2.2. Search Strategy and Database Coverage
The literature search was executed programmatically via the Scopus Search API (Elsevier) using a compound-pair TITLE-ABS-KEY query. The query was structured as 13 validated ML-technique × agricultural-application pairs connected by OR operators, enabling precise control over recall while avoiding over-broad retrieval. Document types were restricted to journal articles ("ar") and reviews ("re") at the query stage, excluding conference papers, letters, editorials and book chapters. The time window filter (PUBYEAR > 2018 AND PUBYEAR < 2027) was applied at query time. Language was restricted to English both at the Scopus query level and verified post-retrieval using the langdetect library.
The 13 compound pairs covered: (1) CNN × plant/crop disease classification; (2) U-Net × crop/weed/field segmentation; (3) object detection × UAV/drone × farm/crop/orchard; (4) image classification × plant disease detection × deep learning; (5) LSTM × crop yield prediction/forecasting; (6) Random Forest or XGBoost × precision agriculture or soil; (7) Transformer or ViT × crop monitoring or classification; (8) semantic segmentation × remote sensing × agriculture; (9) GAN or data augmentation × agricultural imaging; (10) SVM × agricultural classification or yield; (11) federated learning or XAI × agriculture; (12) physics-informed neural network × crop or irrigation; and (13) multimodal fusion × satellite × UAV × agriculture. The union of the 13 pairs yielded 4,629 records, within the 5,000-record export constraint.
The decision to search a single database is a substantive constraint and is treated as such. Scopus and Web of Science overlap substantially but not completely in the engineering and agricultural sciences; comparative coverage studies consistently report Scopus indexing a larger absolute number of journals in applied computing and agricultural engineering, with a majority of Web of Science content also indexed in Scopus, while Web of Science retains distinctive coverage of some regional and society journals. Two consequences follow and are carried through the paper. First, the corpus is best described as the most comprehensive Scopus-indexed synthesis for this period rather than as an exhaustive census of the literature, and the text avoids the stronger claim throughout. Second, the literature most likely to be systematically absent is regional and non-English-adjacent agricultural engineering research, and conference-first publication cultures — precisely the venues in which Latin American, Sub-Saharan African and Southeast Asian work is disproportionately published. The geographic concentration reported in Section 3.3 is therefore an upper bound on inequity attributable to the field and a lower bound on the output of under-represented regions.
2.3. Eligibility Criteria
Eligibility criteria were defined a priori and applied consistently across all screening stages. Table 1 summarises the inclusion and exclusion criteria.
2.4. Screening Process
Screening was conducted in three sequential stages, each implemented as a reproducible Python pipeline. Figure 1 presents the PRISMA 2020 flowchart summarising record flow at each stage.
2.4.1. Deduplication
Within-database duplicates—which arise when a paper is returned by more than one compound-pair query—were removed using a two-step procedure. Records with DOIs were deduplicated by exact DOI match. Records without DOIs were deduplicated using fuzzy title matching (Levenshtein ratio ≥ 90%), followed by secondary language verification using langdetect.
2.4.2. Title and Abstract Screening
Title and abstract screening used a two-layer keyword design. The first layer applied a set of specific ML terms (convolutional neural network, LSTM, random forest, XGBoost, transformer, U-Net, SVM, GAN, ViT) and specific agricultural terms (crop yield, plant disease, weed detection, precision agriculture, soil moisture, irrigation, livestock, remote sensing). A record was automatically included if it contained at least one term from each list in the combined title and abstract text. Records that did not meet the automatic inclusion threshold but contained broad ML or agricultural terms were flagged as borderline and adjudicated individually against Table 1 with AI assistance, followed by author review. Automated exclusions (hard keyword matches against non-agricultural domains such as medical imaging and industrial inspection) were applied before borderline adjudication. Of the 2,503 records excluded at this stage, the large majority were removed by hard keyword rules; the borderline pool subject to individual adjudication was a minority of the screened set.
2.4.3. Full-Text Screening
Records that passed title and abstract screening were advanced to full-text review. Open-access PDFs were retrieved programmatically via the Unpaywall API (v2) using each paper's DOI. Full-text screening was conducted by the author using extracted abstract and methods text alongside the eligibility criteria. Of the 2,114 records assessed, 631 were excluded because ML or DL was not a core method, 508 because the application was not agricultural, 375 because the record reported no primary results or was an out-of-scope document type, and 18 following cross-referencing with Beall's List. These four categories sum to 1,532, and 2,114 − 1,532 = 582, so the flow balances at every stage (Figure 1, Table 3). Full texts were subsequently retrieved and machine-readable for 430 of the 582 included papers (73.9%).
2.5. Data Extraction: Two Independent Passes
Every full text was re-processed from the original PDF. Text was extracted with pdftotext, normalised (Unicode folding, de-hyphenation, repair of URLs fragmented by PDF layout), and segmented into title/abstract, methods, results and reference sections by heading pattern matching with positional fallbacks. Structured fields were then derived by explicit, published regular-expression rules operating on the appropriate section. All 430 full texts were processed by this pass. Table 2 lists the extracted fields; the complete architecture lexicon is given in Appendix C.
2.5.1. Performance metric extraction
Performance metrics were extracted with unit-aware regular expressions applied to the abstract and results sections, falling back to the whole body when no metric was found. Each metric was captured with its value count, its best value (maximum for accuracy-type metrics, minimum for error metrics) and its median across all values found in the paper, together with the native measurement unit for RMSE and MAE. Capturing the best value reflects how papers headline their results; capturing the count and median alongside it makes the degree of selective reporting visible. Implausible values (R² > 1, accuracy < 20%) were rejected at parse time.
2.5.2. Methods employed versus methods cited
A recurring source of error in automated architecture extraction is that papers name many architectures in their related-work sections that they do not use. The rule-based pass therefore distinguishes the two. An architecture is recorded as employed when it appears in the abstract, or when it occurs at least twice (three times for generic labels such as "CNN", "ANN" or "transformer") within the methods and results sections. Architectures that occur only elsewhere in the paper are recorded separately as cited but not employed. Both counts are reported in Table 6.
2.6. Two Composite Instruments
2.6.1. The evidence-maturity classification
Reported accuracy is not comparable across studies that differ in what they were evaluated against. To make that difference explicit, every full text was assigned to one of three evidence levels, defined in Table 11. L1 (benchmark or controlled data only) denotes a study trained and tested exclusively on curated or publicly released datasets with no evidence of data collected under operational field conditions. L2 (field-validated) denotes a study that either collected its own field data or evaluated the model with a spatial or temporal transfer test. L3 (deployed or operational prototype) denotes a study that additionally embedded the model in an operational artefact — edge or embedded hardware, robotic or machinery integration, or a farmer-facing trial. Levels were assigned by rule from deployment signals and from the density of field-evidence expressions in the full text. The classification measures what a paper reports having done, not the quality of what it did: a study can reach L3 by deploying a model trained on a public benchmark, and Section 3.6 shows that many do.
2.6.2. The reproducibility index
Open code and open data are necessary but not sufficient conditions for reproducibility. A composite index was therefore computed on a 0–10 scale from six components (Table 13): openly available code (3 points), openly available data (3 points), hyperparameters reported (1), software and hardware environment stated (1), repeated runs or seed control (1), and cross-validation or an independent test set (1). The weighting deliberately privileges artefact release, which cannot be reconstructed from the text, over reporting practices, which can. Scores of 0–3 are described as low, 4–6 as moderate and 7–10 as high.
2.7. Quality Assessment
A domain-adapted quality assessment was applied to each included full text, covering clarity of architecture description, appropriateness of the data-splitting strategy, spatial and temporal generalisability, benchmarking against baselines, and reproducibility. These dimensions are reported quantitatively through the evaluation-design fields in Table 14, the evidence-maturity classification in Table 11 and the reproducibility index in Table 13. Formal meta-analytic risk-of-bias scoring was not applied given the methodological variation across included studies.
2.8. Synthesis Approach
Given the breadth and methodological variation of the included studies, a formal statistical meta-analysis was not feasible. Synthesis was conducted as a structured narrative review supported by quantitative descriptive analysis. Distributional statistics are reported as medians with interquartile ranges; 95% confidence intervals for medians were obtained by bootstrap resampling (4,000 replicates). Group comparisons use the Mann–Whitney U test, and monotone trends over time use Spearman's rank correlation. Performance metrics are summarised within homogeneous subgroups only, and are additionally stratified by evidence-maturity level and data regime. Papers from January–March 2026 (n = 61) are included in the total corpus and cited as qualitative illustrations of emerging trends, but are excluded from year-on-year growth comparisons and are flagged wherever they contribute to a time series.
2.9. Reproducibility of This Review
All extraction, analysis and figure-generation code, the full-text-derived dataset, the rule lexicons in Appendix C.
3. Results
This section presents the results across seven dimensions: PRISMA screening outcomes; publication trends; geographic distribution; the taxonomy of architectures; application domains; reported performance and the evidence context in which it was obtained; and open science practice. Results are presented descriptively; interpretation is reserved for Section 4. Throughout, statistics derived from bibliographic records are reported against the full corpus (n = 582) and statistics derived from full text against the analytic subsample (n = 430).
3.1. PRISMA 2020 Screening Outcomes
The systematic search retrieved 4,629 records. Following removal of 12 within-database duplicates, 4,617 unique records were advanced to title and abstract screening, from which 2,503 were excluded, leaving 2,114 for full-text evaluation. Of these, 1,532 were excluded — 631 for the absence of ML or DL as a core method, 508 for the absence of an agricultural application, 375 for reporting no primary results or being an out-of-scope document type, and 18 for publication in a venue on Beall's List. The remaining 582 papers form the included corpus. Table 3 gives the complete record flow and Figure 1 presents it as a PRISMA 2020 flow diagram. The predatory-venue exclusions are counted within the full-text exclusion total, and the flow balances arithmetically at every stage.
The included corpus of 582 papers is drawn from 258 unique journals and 58 first-author countries. Full texts were retrieved and machine-readable for 430 papers (73.9).
3.2. Publication Trends and Temporal Growth
Publication volume grew steeply across the review period, following a pattern consistent with exponential growth punctuated by two inflection points (Table 4, Figure 2). The corpus contains only 28 papers published from 2019 to 2021, reflecting the limited but growing uptake of deep learning in agricultural research immediately after the Kamilaris and Prenafeta-Boldú (2018) benchmark survey. The first major inflection occurred in 2022, when annual output grew by +215% relative to 2021 (from 13 to 41 papers), aligning with the broader adoption of Vision Transformers, YOLO-based object detectors and pre-trained backbone architectures.
The second and larger inflection occurred in 2024, with annual output rising by +159% (from 56 in 2023 to 145 in 2024), followed by a further +73% increase to 251 papers in 2025. The 2025 cohort alone accounts for 43.1% of the corpus. Across 2019–2025 the compound annual growth rate is approximately 86%. The 61 papers from 2026 represent only the first quarter of the year and are excluded from year-on-year growth comparisons; they are retained in the total corpus count and cited as qualitative illustrations of emerging trends.
The distribution of journals is highly fragmented: 582 papers are distributed across 258 unique journals (2.3 papers per journal on average). The five most prolific outlets are Scientific Reports (n = 41, 7.0%), Remote Sensing (n = 40, 6.9%), Agriculture Switzerland (n = 31, 5.3%), Agronomy (n = 19, 3.3%), Computers and Electronics in Agriculture (n = 19, 3.3%). Citation counts range from 0 to 303 (median 4; mean 14.7), with the heavy skew reflecting the recency of most papers. A total of 45 papers (7.7%) have accumulated more than 50 citations and 16 (2.7%) more than 100.
3.3. Geographic Distribution of Research
3.3.1. Regional distribution
Research activity, assigned by first-author country affiliation, is highly concentrated in Asia (Table 5, Figure 3). South Asia is the single largest contributor with 179 papers (30.8%), of which India alone accounts for 165 (28.4%), the highest national output in the corpus. East Asia contributes 166 papers (28.5%), driven mainly by China (n = 142, 24.4%). Together, South Asia and East Asia account for 345 papers (59.3%). The remaining regions contribute considerably smaller shares: Middle East and North Africa (n = 69, 11.9%), Europe (n = 61, 10.5%), North America (n = 50, 8.6%) and Southeast Asia (n = 27, 4.6%). Oceania (n = 11, 1.9%), Sub-Saharan Africa (n = 9, 1.5%), Latin America and the Caribbean (n = 8, 1.4%) and Central Asia (n = 2, 0.3%) are markedly under-represented relative to their agricultural significance and food-security burden. Regions and the Global North/South classification are derived from first-author country by an explicit lookup: regions follow UN M49 sub-regional groupings, with Türkiye and Iran placed in Middle East and North Africa as is conventional in agricultural bibliometrics, and Global North follows the UN M49 developed-regions definition (Europe including the Russian Federation, Northern America, Australia and New Zealand, Japan) plus Israel, with every other country including China classified Global South. Every paper in the corpus is assigned to a region and to a Global North/South class under this lookup, so no residual category arises.
First-author affiliation is used here as a practical proxy for research origin, consistent with standard bibliometric practice, and it is imperfect in two respects. Multinational collaborations in which the first author is based in a high-income country but the study area and field data are located elsewhere are attributed to the first-author country. Equally, a study conducted by a European or North American institution using satellite imagery of Sub-Saharan African farmland is classified as European or North American in origin, potentially underestimating the extent to which food-insecure regions are the subject of study even when they are not the source of research leadership. Study-area country was extracted as a separate field but was populated for only a minority of papers, reflecting inconsistent reporting of study geography, particularly in papers using global or multi-country remote sensing datasets. First-author country therefore remains the primary geographic classification, and regional figures should be read as measuring where research is led rather than where it is applied.
3.3.2. Global North and Global South
Classified at country level, 456 papers (78.4%) originate from Global South institutions and 126 (21.6%) from Global North institutions. Under a sensitivity classification that additionally counts the Republic of Korea, Taiwan, Hong Kong SAR and Singapore — the high-income East Asian economies whose status is contested — as Global North, the split is 435 (74.7%) to 147 (25.3%). Both classifications place a clear majority of the corpus in the Global South. That majority is nevertheless highly concentrated: India and China alone account for 307 papers, 52.7% of the corpus and 67.3% of all Global South output. The remaining 149 Global South papers (25.6% of the corpus) are distributed across 30 countries, the largest contributors being Saudi Arabia (n = 17), the Republic of Korea (16), Türkiye (13), Iran (12) and Bangladesh (11). Sub-Saharan Africa, which carries the highest regional prevalence of undernourishment globally, contributes 9 papers and reports open code in none of the 8 full texts available from the region. The headline Global North/South ratio is therefore a poor summary of the underlying distribution: what the corpus documents is not a North-dominated literature but a literature dominated by two large middle-income countries, with the rest of the Global South contributing about one paper in four.
3.4. Taxonomy of Machine Learning and Deep Learning Architectures
3.4.1. Architectures employed
Across the 430 full texts, the rule-based extraction identified 35 aggregated architecture labels grouped into ten families (Appendix C). Papers evaluate several architectures: the median number employed or benchmarked per paper is 4.5 (IQR 3–6), only 7.4% of papers employ a single architecture, and 79.5% employ three or more. Comparative benchmarking is therefore the norm rather than the exception in this literature, and any statistic that assigns one "primary method" per paper necessarily discards most of what each paper reports.
Convolutional backbones remain the most frequently employed family. A generic CNN is employed in 246 papers (57.2%), with ResNet variants in 158 (36.7%) and VGG in 94 (21.9%) the most common named backbones (Figure 4). Vision Transformers and related attention architectures are employed in 112 papers (26.0%), and Transformer-based models of any kind in 139 (32.3%). YOLO-family detectors appear in 85 papers (19.8%) and U-Net derivatives in 63 (14.7%). Classical methods remain strongly represented: Random Forest in 126 papers (29.3%), support vector machines in 123 (28.6%), XGBoost in 74 (17.2%) and LSTM in 73 (17.0%). Table 6 reports the full distribution together with the count of papers that cite each architecture without employing it.

Table 6.
Architectures employed across the full-text subsample (n = 430), ranked by frequency.
| Architecture | Family | Papers using it (n) | % of full-text subsample | Additionally cited but not used (n) | Leading domain |
|---|---|---|---|---|---|
| CNN (generic) | CNN backbones | 246 | 57.2 | 110 | Plant disease & pest detection |
| ResNet | CNN backbones | 158 | 36.7 | 64 | Plant disease & pest detection |
| Random Forest | Classical ensemble | 126 | 29.3 | 99 | Crop yield prediction |
| SVM/SVR | Classical kernel/statistical | 123 | 28.6 | 145 | Plant disease & pest detection |
| Vision Transformer | Transformer | 112 | 26.0 | 38 | Plant disease & pest detection |
| ANN/MLP | Shallow neural | 108 | 25.1 | 113 | Plant disease & pest detection |
| VGG | CNN backbones | 94 | 21.9 | 76 | Plant disease & pest detection |
| YOLO | Object detection | 85 | 19.8 | 60 | Plant disease & pest detection |
| EfficientNet | CNN backbones | 77 | 17.9 | 46 | Plant disease & pest detection |
| Inception/Xception | CNN backbones | 77 | 17.9 | 69 | Plant disease & pest detection |
| MobileNet | CNN backbones | 77 | 17.9 | 64 | Plant disease & pest detection |
| Regression (linear/PLS) | Classical kernel/statistical | 76 | 17.7 | 75 | Crop yield prediction |
| XGBoost | Classical ensemble | 74 | 17.2 | 26 | Crop yield prediction |
| Gradient Boosting (other) | Classical ensemble | 74 | 17.2 | 39 | Crop yield prediction |
| LSTM | Recurrent/sequence | 73 | 17.0 | 47 | Crop yield prediction |
| U-Net | Segmentation | 63 | 14.7 | 34 | Plant disease & pest detection |
| Decision Tree | Classical ensemble | 56 | 13.0 | 99 | Crop yield prediction |
| DenseNet | CNN backbones | 56 | 13.0 | 53 | Plant disease & pest detection |
| kNN | Classical kernel/statistical | 54 | 12.6 | 69 | Plant disease & pest detection |
| RNN (other) | Recurrent/sequence | 51 | 11.9 | 54 | Crop yield prediction |
| AlexNet | CNN backbones | 34 | 7.9 | 54 | Plant disease & pest detection |
| R-CNN family | Object detection | 34 | 7.9 | 51 | Plant disease & pest detection |
| Transformer (other) | Transformer | 27 | 6.3 | 165 | Plant disease & pest detection |
| SSD/RetinaNet | Object detection | 21 | 4.9 | 43 | Plant disease & pest detection |
| GAN | Generative | 21 | 4.9 | 49 | Plant disease & pest detection |
| Federated Learning | Emerging | 16 | 3.7 | 12 | Plant disease & pest detection |
| GRU | Recurrent/sequence | 14 | 3.3 | 14 | Crop yield prediction |
| Autoencoder | Generative | 11 | 2.6 | 31 | Plant disease & pest detection |
| LightGBM | Classical ensemble | 10 | 2.3 | 6 | Crop yield prediction |
| LLM/Foundation model | Emerging | 6 | 1.4 | 19 | Soil property & nutrient management |
| GNN | Graph | 6 | 1.4 | 7 | Crop quality, phenotyping & post-harvest |
| Reinforcement Learning | Emerging | 5 | 1.2 | 13 | Crop yield prediction |
| Naive Bayes | Classical kernel/statistical | 5 | 1.2 | 21 | Plant disease & pest detection |
| CatBoost | Classical ensemble | 3 | 0.7 | 1 | Plant disease & pest detection |
"Papers using it" counts studies in which the architecture appears in the abstract, or at least twice within the methods and results sections (three times for generic labels). "Additionally cited but not used" counts studies that name the architecture only elsewhere in the text, typically in related work. Papers commonly employ several architectures, so column totals exceed the subsample size.
3.4.2. Adoption trajectories
Transformer-based architectures show the clearest temporal signal in the corpus. They are absent from full texts before 2022, appear in 14.3% of 2022 full texts, 23.8% in 2023, 21.5% in 2024 and 41.2% in 2025, reaching 44.7% in the partial 2026 quarter. Reported against the correct full-text denominator, the trajectory is monotone in both absolute count and share. CNN backbones remain the most prevalent family throughout, in 70.6% of 2025 full texts, and classical ML methods hold a stable share of roughly 43% across the same period. The three paradigms are therefore not substituting for one another; Transformers are being added to an increasingly crowded comparative benchmark rather than replacing prior architectures.
3.5. Agricultural Application Domains
Application domains were classified into a 13-category taxonomy nested within five macro-areas (Table 7, Figure 7). Classification was performed on title and abstract text for the full corpus and independently on full text for the analytic subsample; the two agreed in 85.6% of cases (κ = 0.806). The taxonomy was designed to minimize an undifferentiated residual category; under the present taxonomy the residual is 33 papers (5.7%).
Crop health and protection is the largest macro-area, accounting for 281 papers (48.3%), followed by production forecasting and monitoring (180, 30.9%), resource and input management (54, 9.3%) and product quality, livestock and automation (34, 5.8%). At the domain level, plant disease and pest detection dominates with 258 papers (44.3%), followed by crop yield prediction with 148 (25.4%); together these two domains account for 69.8% of the corpus. The remaining eleven domains each account for less than 6%: precision agriculture systems and IoT (n = 33, 5.7%), weed detection and management (23, 4.0%), crop quality, phenotyping and post-harvest (21, 3.6%), crop mapping and land-use classification (17, 2.9%), crop growth monitoring and phenology (14, 2.4%), soil property and nutrient management (11, 1.9%), irrigation and water management (10, 1.7%), food security, supply chain and economics (7, 1.2%), livestock and aquaculture (4, 0.7%), harvesting, robotics and machinery (2, 0.3%) and climate impact and risk assessment (1, 0.2%).
3.6. Reported Performance and the Evidence Context
3.6.1. Metric reporting practices
Of the 430 full texts, 417 (97.0%) report at least one extractable quantitative performance metric, and the median paper reports 3 distinct metric types. This high yield reflects the use of section-aware parsing of the results section, which recovers metrics that whole-document regular expressions miss. Accuracy is the most frequently reported metric (n = 318 papers, 74.0%), followed by F1-score, precision and recall; R² is reported by 121 papers (28.1%) and RMSE by 113. Table 8 summarises the distribution of each metric across the subsample.
Across all accuracy-reporting papers, values range from 20.0% to 100.0% with a median of 97.8% (IQR 92.0–99.1%; 95% CI of the median 97.0–98.0%). The distribution is severely upper-compressed: 63.5% of papers report accuracy above 95% and 26.1% report above 99%. Reported R² ranges from 0.03 to 1.0 with a median of 0.87 (IQR 0.76–0.952).
Unit heterogeneity remains severe for error metrics. Among papers reporting RMSE, 9 distinct measurement units were recovered, the most common being percentage, kg/ha and t/ha, alongside mm, cm, days, dB and dimensionless normalised values. A model reporting RMSE = 0.4 t/ha for wheat in a high-yield European context is not numerically comparable with one reporting RMSE = 80 kg/ha for sorghum in Sub-Saharan Africa, yet both figures routinely appear in aggregated performance tables in existing reviews. Unit-aware extraction makes the problem visible but cannot solve it; the solution is a community reporting convention, discussed in Section 4.5.
3.6.2. Performance conditioned on the data regime
Aggregate accuracy figures conceal a systematic dependence on what the model was evaluated against. Classifying every full text by its training and evaluation data regime (Table 9, Figure 5a) shows that studies evaluated exclusively on public benchmark datasets report a median accuracy of 99.0% (n = 94, IQR 97.4–99.5%), whereas studies evaluated on data the authors collected themselves in the field report a median of 95.0% (n = 49, IQR 87.8–97.9%). The 4-percentage-point difference is statistically significant (Mann–Whitney U, p < 0.001) and the interquartile ranges barely overlap: the 25th percentile of the benchmark-only group (97.4%) sits above the median of the field-data group. Studies combining both kinds of data sit with the benchmark-only group (98.9 (59)), which is consistent with headline figures being drawn from the easier evaluation available to the authors.
3.6.3. Performance conditioned on evidence maturity
The evidence-maturity classification (Section 2.7.1) partitions the subsample into 142 papers at L1 (33.0%, benchmark or controlled data only), 157 at L2 (36.5%, field-validated) and 131 at L3 (30.5%, deployed or operational prototype). Table 10 reports the distribution with its associated performance and open-science indicators, and Figure 8a presents it as an evidence pyramid.
Reported accuracy does not increase monotonically with evidence level. L1 studies report a median of 98.0% (n = 114) and L3 studies 98.5% (n = 115), but L2 studies — those that collected their own field data or applied a spatial or temporal transfer test without embedding the model in an operational artefact — report a markedly lower median of 93.0% (n = 89, IQR 82.0–98.0%), and the difference between L2 and the other two levels is significant (Mann–Whitney U, p < 0.001; Figure 5b). The apparent anomaly at L3 resolves once the data regime is taken into account: a large share of L3 papers deploy a model on edge hardware or in a mobile application while continuing to evaluate it on a public benchmark, so their reported accuracy reflects the benchmark rather than the deployment. Deployment and field validation are, in this literature, largely independent attributes rather than successive stages of the same maturation.
3.6.4. Plant disease detection
Within plant disease and pest detection, 178 full texts were available. CNN backbones predominate, consistent with the visual classification nature of the task. Among the 172 papers reporting accuracy, the median is 98.7% (IQR 96.5–99.5%; 95% CI 98.025–99.0%). The PlantVillage dataset is used in 105 of the 178 papers (59.0%). Papers using PlantVillage report a higher median accuracy (99.0%, n = 102) than papers that do not (98.3%, n = 70; Mann–Whitney p = 0.041), and the gap widens at the lower tail: the 25th percentile is 97.2% for PlantVillage users against 94.5% for others. The domain's headline accuracy is thus in part a property of its dominant benchmark rather than of the methods evaluated on it.
3.6.5. Crop yield prediction
Crop yield prediction is represented by 120 full texts and is methodologically more heterogeneous. LSTM networks, multilayer perceptrons and classical ensembles (Random Forest, XGBoost) are the most commonly benchmarked architectures, reflecting the time-series and tabular nature of yield inputs — climate records, satellite-derived vegetation indices and soil parameters. Performance is reported principally as R²: among the 80 papers reporting it, the median is 0.87 (IQR 0.768–0.952; 95% CI 0.825–0.904). RMSE is reported by 82 papers in the domain, in mutually incomparable units. The R² subset represents 66.7% of the domain's full texts and may over-represent well-performing studies, since a paper is more likely to report R² when it is high.
3.6.6. Indirect evidence of publication bias
Three features of the corpus are jointly consistent with publication bias. The citation distribution is heavily right-skewed (median 4, mean 14.7, maximum 303), and high-citation papers concentrate in the two domains that report the highest performance. The accuracy distribution is upper-compressed, with 26.1% of accuracy-reporting papers above 99% and very few below 80% despite the known difficulty of field-condition classification. And no paper in the corpus reports a prospective deployment trial with pre-registered performance targets, nor a deployment that failed. Formal funnel plot analysis is not applicable in the absence of a common effect size, but the direction of the bias is not in doubt, and the median figures reported above should be read as upper bounds within their evaluation contexts.
3.7. Open Science Practices and Reproducibility
Open science practice was classified from availability statements and from author-released repository links in the full text, using the seven-level data taxonomy and five-level code taxonomy described in Section 2.5. Data are openly available for 106 papers (24.7% of the subsample), comprising 89 papers whose availability statement names a repository or resolvable link and 17 with no formal statement but an identifiable public dataset cited in the text. Code is openly available for 31 papers (7.2%). Both are openly available for 21 papers (4.9%). A further 18.8% of papers mediate data access through the corresponding author, 7.9% state explicitly that data are withheld, and 40.5% provide no usable statement at all. For code the corresponding no-usable-statement figure is 90.5% (Table 11, Figure 6).
Table 11.
Availability of data and code across the full-text subsample (n = 430).
| Dimension | Category | Papers (n) | % | Interpretation |
|---|---|---|---|---|
| Data availability | Openly available | 89 | 20.7 | Statement names a repository, dataset DOI or resolvable link |
| Data availability | Public dataset cited in text | 17 | 4.0 | No formal statement, but an identifiable public dataset is cited in the text |
| Data availability | On request | 81 | 18.8 | Access mediated by the corresponding author |
| Data availability | In article / supplementary | 35 | 8.1 | Data asserted to be contained in the article or supplementary files |
| Data availability | Not available | 34 | 7.9 | Explicitly withheld (privacy, funder, commercial or NDA restrictions) |
| Data availability | Statement uninformative | 46 | 10.7 | Statement present but specifies no access route |
| Data availability | No statement | 128 | 29.8 | No data-availability statement located in the full text |
| Code availability | Openly available | 31 | 7.2 | Statement names a repository, dataset DOI or resolvable link |
| Code availability | On request | 10 | 2.3 | Access mediated by the corresponding author |
| Code availability | Not available | 0 | 0.0 | Explicitly withheld (privacy, funder, commercial or NDA restrictions) |
| Code availability | Statement uninformative | 1 | 0.2 | Statement present but specifies no access route |
| Code availability | No statement | 388 | 90.2 | No data-availability statement located in the full text |
Categories are mutually exclusive within each dimension. "Openly available" and "Public dataset cited in text" together constitute the openly-available aggregate used in the text and figures.
The direction of travel differs sharply between the two dimensions. Open data disclosure increases significantly across the review period (Spearman ρ = 0.131, p = 0.007), rising from 22.2% of 2021 full texts to 28.4% in 2025. Open code shows no significant trend (ρ = 0.032, p = 0.51) and remains within a 2–11% band throughout. The most plausible explanation is journal policy: data-availability statements are now mandatory at most major publishers whereas code-availability statements generally are not, and a mandated statement field appears to be sufficient to change behaviour where an unmandated one is not (Table 12).
The reproducibility index (Table 13) has a median of 3 and a mean of 3.14 on the 0–10 scale. 69.8% of papers score in the low band (0–3), 24.7% in the moderate band (4–6) and 5.6% (24 papers) in the high band (7–10). The component breakdown explains the shape of the distribution: reporting practices are common — 87.4% of papers report hyperparameters and 64.7% state their software or hardware environment — while artefact release is rare, and repeated runs or seed control, the single practice that would allow a reader to distinguish a real improvement from run-to-run variance, is reported by only 11.6% of papers. The index improves significantly over time (ρ = 0.1743, p = 0.0003), driven by the open-data component rather than by code release.
Table 13.
Components of the reproducibility index and their prevalence.
| Component | Weight | Papers meeting it (n) | % |
|---|---|---|---|
| Code openly available | 3 | 31 | 7.2 |
| Data openly available | 3 | 106 | 24.7 |
| Hyperparameters reported | 1 | 376 | 87.4 |
| Software/hardware environment stated | 1 | 278 | 64.7 |
| Repeated runs or seed control | 1 | 50 | 11.6 |
| Cross-validation or independent test set | 1 | 236 | 54.9 |
The index sums the weights of the components a study satisfies, giving a 0–10 scale. Weighting privileges artefact release over reporting practice because released artefacts cannot be reconstructed from the text.
Regional differentials are visible in Table 5 but should be read cautiously given the small full-text samples outside the two largest regions. Among regions contributing at least 40 full texts, North America reports the highest open-code rate (14.6%) and East Asia the lowest (3.7%), with Europe at 10.9%, South Asia at 8.7% and the Middle East and North Africa at 0.0%. Sub-Saharan Africa likewise reports open code in none of its full texts. The pattern is consistent with the influence of funder mandates in North America and Europe, but the regional samples are too small to support a strong causal claim.
3.8. Methodological Practices and Emerging Frontiers
Table 14 reports the prevalence of eleven methodological practices across the subsample and their trend over time. Transfer learning from pre-trained backbones is now near-standard (62.1% of full texts), as is data augmentation (48.8%). Attention modules appear in 40.0% of papers and multi-modal or sensor fusion in 29.5%. Explainable AI techniques — SHAP, LIME, Grad-CAM and related attribution methods — appear in 32.8% of full texts. Edge or embedded deployment appears in 25.6% and federated learning in 6.5%.
The trends are as informative as the levels. Explainable AI (ρ = 0.250, p < 0.001), edge deployment (ρ = 0.262, p < 0.001), attention modules (ρ = 0.211, p < 0.001), multi-modal fusion (ρ = 0.200, p < 0.001) and ablation studies (ρ = 0.196, p < 0.001) all increase significantly across the period. Federated learning is the one nominally emerging technique showing no significant trend (ρ = 0.072, p = 0.14), remaining a small and stable niche. Evaluation rigour improves more slowly than architectural sophistication: independent or transfer test sets rose from 17.9% of 2022 full texts to 34.3% in 2025, and statistical significance testing remains at 16.5% overall. Nearly half of the subsample still reports no cross-validation, and 70.0% report no independent or transfer test set of any kind.
Table 14.
Prevalence and temporal trend of methodological practices across the full-text subsample.
| Practice | Papers (n) | % of subsample | 2022 (%) | 2023 (%) | 2024 (%) | 2025 (%) | Spearman rho (year) | p |
|---|---|---|---|---|---|---|---|---|
| Transfer learning / pre-trained backbones | 267 | 62.1 | 42.9 | 45.2 | 67.7 | 66.7 | 0.107 | 0.0261 |
| Data augmentation | 210 | 48.8 | 21.4 | 47.6 | 37.6 | 58.8 | 0.179 | 0.0002 |
| k-fold cross-validation | 176 | 40.9 | 35.7 | 33.3 | 38.7 | 43.6 | 0.103 | 0.0326 |
| Attention modules | 172 | 40.0 | 25.0 | 28.6 | 31.2 | 49.5 | 0.211 | 0.0 |
| Explainable AI (SHAP, LIME, Grad-CAM) | 141 | 32.8 | 14.3 | 11.9 | 25.8 | 41.2 | 0.25 | 0.0 |
| Independent or transfer test set | 129 | 30.0 | 17.9 | 19.0 | 30.1 | 34.3 | 0.124 | 0.0102 |
| Multi-modal / sensor fusion | 127 | 29.5 | 21.4 | 19.0 | 19.4 | 35.3 | 0.2 | 0.0 |
| Edge / embedded deployment | 110 | 25.6 | 10.7 | 9.5 | 12.9 | 35.8 | 0.262 | 0.0 |
| Ablation study reported | 100 | 23.3 | 17.9 | 14.3 | 12.9 | 30.4 | 0.196 | 0.0 |
| Statistical significance testing | 71 | 16.5 | 7.1 | 9.5 | 14.0 | 19.6 | 0.113 | 0.0192 |
| Federated learning | 28 | 6.5 | 0.0 | 9.5 | 4.3 | 7.8 | 0.072 | 0.1351 |
Yearly percentages are computed within that year's full-text papers. Spearman's ρ tests the monotone association between publication year and the presence of the practice across the whole subsample.
4. Discussion
4.1. The Growth Trajectory and Its Drivers
The publication trend — from 6 papers in 2019 to 251 in 2025, with inflections of +215% in 2022 and +159% in 2024 — reflects a convergence of enabling conditions rather than a single cause: the public release of Vision Transformers and large pre-trained backbones from the computer vision community, the expansion of open agricultural image datasets, and the growing accessibility of GPU-accelerated cloud computing to research teams in middle-income countries. The Transformer architecture of Vaswani et al. (2017), conceived for natural language processing, proved well-suited to agricultural remote sensing and multispectral image analysis, where long-range spatial and spectral dependencies had been difficult to capture with convolution alone. Its adoption followed with a lag of roughly two years.
The shape of that adoption curve — a lag phase to 2021, rapid growth through 2022–2024 and mainstream uptake from 2025 — is consistent with technology diffusion patterns observed in computational method transfer across applied sciences. This review does not fit a formal diffusion model to the data and does not claim one: with a single partial year at the leading edge and a corpus assembled from one database, any fitted inflection point would be an artefact of the sampling frame as much as of the underlying phenomenon. The qualitative reading is nonetheless robust and has a concrete implication. Architecture selection in agricultural deep learning is increasingly driven by the transfer of validated solutions from general computer vision rather than by domain-specific design, with consequences for both performance and interpretability that the field has not yet examined systematically.
The measured prevalence of transfer learning supports this reading directly: 62.1% of full texts fine-tune a pre-trained backbone, making imported representation the normal starting point rather than the exception. The boundary between general AI research and domain-specific agricultural AI is dissolving, and future reviews will need to treat foundation model adaptation as a first-class methodological category rather than an emerging curiosity.
4.2. Architectural Pluralism and the Persistence of Classical Methods
The architectural landscape is more pluralistic than the narrative of deep learning supremacy suggests, and the methods-employed extraction makes the pluralism measurable. The median paper benchmarks 4.5 architectures and 79.5% benchmark three or more. Convolutional backbones remain dominant (57.2% of full texts employ a CNN of some kind, 36.7% a ResNet variant), and their prevalence in disease detection reflects the maturity of the visual classification pipeline and its benchmarking infrastructure. YOLO-family detectors (19.8%) have become the architecture of choice for real-time field detection, where single-pass inference speed is operationally important under UAV latency constraints, and U-Net derivatives (14.7%) occupy a distinct niche in pixel-wise segmentation for field delineation and weed mapping.
What is easily overlooked is the persistent and legitimate role of classical methods. Random Forests are employed in 29.3% of full texts, support vector machines in 28.6%, XGBoost in 17.2% and multilayer perceptrons in 25.1%. Classical methods appear in a stable ~43% of full texts every year from 2022 onward, with no downward trend. Breiman's (2001) framing of Random Forests as an ensemble of decorrelated trees has proven durable because it generalises from limited data — a decisive property in agricultural settings where annotated datasets are expensive, spatially sparse or confined to a single growing season. XGBoost's prevalence in yield modelling reflects its robustness to missing data and multicollinearity, both endemic in agronomic datasets that combine climate reanalyses, remote sensing indices and soil survey records. The evidence does not show deep learning replacing classical machine learning; it shows the two being benchmarked against one another within the same papers, with deep learning excelling in image-intensive perception and classical methods retaining competitive performance in structured multivariate modelling.
LSTM networks (17.0%), as formalised by Hochreiter and Schmidhuber (1997), remain the dominant architecture for temporal agricultural modelling. Their persistence alongside attention-based sequence models suggests that for the short series typical of a single growing season (roughly 30–52 time steps), the inductive bias of recurrence still competes with self-attention, which generally requires longer sequences to demonstrate an advantage.
4.3. The Disease Detection Paradox, Quantified
Plant disease and pest detection is the dominant application domain (44.3% of the corpus) and reports the highest performance in it: a median accuracy of 98.7% across 172 accuracy-reporting full texts. This raises a paradox — near-perfect reported accuracy for a problem that continues to impose substantial real-world losses — plausibly attributable to dataset artefacts, inconsistent data splitting and the absence of external validation. The present analysis tests two of these attributions directly.
First, the dataset effect is real and measurable. PlantVillage is used by 59.0% of disease-detection full texts, and papers using it report significantly higher accuracy than papers that do not (99.0% against 98.3%, p = 0.041). The effect on the median is modest because both groups sit against a ceiling; the effect on the lower tail is larger, with the 25th percentile at 97.2% for PlantVillage users against 94.5% for others. PlantVillage consists of isolated leaves photographed against uniform backgrounds under controlled lighting, and does not represent the visual complexity of field diagnosis: variable illumination, overlapping leaves, partial occlusion, soil contamination and within-species morphological variation.
Second, and more consequentially, the effect generalises beyond disease detection. Across the whole subsample, studies evaluated only on public benchmarks report a median accuracy of 99.0% while studies evaluated on their own field data report 95.0% (p < 0.001), and studies at evidence level L2 report 93.0% against 98.0% at L1 (p < 0.001). This is the paradox stated as a measurement rather than an inference: approximately four percentage points of headline accuracy — and considerably more at the lower tail — are attributable to the evaluation context rather than to the method. It is a lower bound on the true gap, because field-data studies are themselves selected for success and because no study in the corpus reports the out-of-distribution evaluation that would measure the gap directly (Figure 9).
These findings should not diminish genuine technical progress. Papers such as Yu et al. (2025), reporting 99.96% accuracy with a Swin Transformer with convolutional feature interactions, and Shafik et al. (2025), reporting 100% with a hybrid Inception-Xception CNN, represent real methodological contributions. The point is that a 99.96% accurate classifier trained and tested on curated leaf images should not be equated with a model achieving 90% on farmer-collected smartphone images from heterogeneous field environments, and that the literature currently provides no convention for telling readers which of the two they are looking at. The evidence-maturity classification introduced here is one such convention; a simpler one would be a requirement to report both in-distribution and out-of-distribution performance.
The absence of negative deployment results is itself informative. No paper in the corpus reports a prospective deployment trial with pre-registered targets, and none reports a deployment that failed. Given the known difficulty of agricultural AI deployment under field conditions, the near-universal absence of negative results is more plausibly a reflection of publication bias than of universal success. It is worth noting that 30.5% of full texts report some form of deployment artefact — edge hardware, a mobile application, robotic integration or a farmer trial — so the field is not failing to attempt deployment. It is failing to report what happens afterwards.
4.4. Evidence Maturity and the Deployment Gap
The evidence-maturity distribution is the review's most policy-relevant single finding. One third of the full-text subsample (33.0%) never leaves curated data; 36.5% reach field validation; 30.5% reach an operational prototype. Read naively this looks like a healthy pipeline. Read together with Section 3.6.3 it is not, because deployment and field validation turn out to be largely independent: L3 papers report accuracy indistinguishable from L1 papers precisely because many of them deploy a model that was never evaluated outside its benchmark. A model quantised to run on a Jetson board and wrapped in an Android application is an engineering achievement, but if it has only ever been tested on PlantVillage, the deployment demonstrates portability rather than agronomic validity.
This distinction matters for how the field's progress should be judged. Counting deployment artefacts — as several recent reviews do — overstates operational readiness, because the artefact is easy and the validation is hard. The proportion of the subsample that both collected field data and embedded the model in an operational artefact is considerably smaller than either figure alone. A useful minimum standard would be that any paper claiming deployment readiness reports performance on data collected under the conditions in which the system is intended to operate, and reports it separately from benchmark performance.
Evaluation rigour is the binding constraint. Only 30.0% of full texts report an independent or transfer test set, and only 40.9% report cross-validation of any kind. Ablation studies appear in 23.3% and statistical significance testing in 16.5%. Every one of these practices is trending upward, which is encouraging, but all are rising more slowly than architectural sophistication. The field is adopting new architectures faster than it is adopting the evaluation practices that would allow it to know whether the new architectures are better.
4.5. Crop Yield Prediction and the Comparability Problem
Crop yield prediction presents a different challenge. The domain is genuinely heterogeneous: LSTM, MLP, Random Forest and XGBoost all appear as benchmarked methods, reflecting the diversity of input types (satellite time series, climate reanalyses, field surveys, IoT streams) and prediction targets (national, regional, county and plot-scale yield). Among the 80 papers reporting R², the median is 0.87 (IQR 0.768–0.952), a literature that generally reports strong explained variance. Cao et al. (2021), integrating multi-source data for rice yield prediction across China, Sun et al. (2020), using a multilevel network for county-level corn yield in the US Corn Belt, and Nejad et al. (2023), applying 3D-CNN and attention ConvLSTM approaches, exemplify the data-rich studies that provide genuine evidence of generalisation.
The comparability problem is unit heterogeneity. Across the subsample, RMSE was recovered in 9 distinct measurement units. R² is the only metric in the domain that is dimensionless and therefore poolable, which is precisely why it is the metric this and every other review reports — a selection effect, not a methodological choice. The remedy is a reporting convention rather than a better extraction pipeline: RMSE should be reported alongside the mean and standard deviation of the yield distribution from which it is computed, so that a coefficient of variation or a normalised RMSE can be reconstructed by any reader. This single addition would make the yield-prediction literature meta-analysable, and it costs authors one sentence.
4.6. Geographic Concentration and the Equity Gap
South Asia (30.8%) and East Asia (28.5%) together account for 59.3% of included papers, with India (n = 165) and China (n = 142) alone responsible for 52.7% of the corpus. This concentration is not in itself problematic: both countries face substantial agricultural challenges and the depth of ML/DL expertise in their institutions is an asset to the field. The problem is the compositional asymmetry it creates in the evidence base. Sub-Saharan Africa, which the FAO identifies as carrying the highest regional prevalence of undernourishment globally (FAO et al., 2023), contributes 9 papers (1.5%). Latin America and the Caribbean contributes 8 (1.4%), and Southeast Asia — a major rice and palm oil producer — 27 (4.6%). Figure 3b sets these shares against each region's approximate share of the global undernourished population; the divergence for Sub-Saharan Africa is roughly twenty-fold.
This gap has direct consequences for the generalisability of the models the field produces. A CNN trained on rice disease images sourced from Indian laboratory conditions is unlikely to transfer directly to smallholder rice cultivation in Tanzania or Cambodia, where crop variety, growing conditions, camera hardware and ambient lighting all differ. The representativeness gap is compounded by an artefact gap: none of the eight Sub-Saharan African full texts in the subsample releases code, so the small body of work that does exist provides no reproducible infrastructure that local researchers could build upon. The papers that do exist from the region — including Ngugi et al. (2024) on deep learning for crop disease detection and Erike et al. (2025) on AI challenges for smallholder precision agriculture — are notable precisely because they engage with the equity dimensions that the majority of the corpus does not.
It is worth being precise about what the Global North/South split does and does not show. Classified at country level, 78.4% of the corpus is Global South and 21.6% Global North. Read naively, a 78.4% Global South share looks like an equitable literature. It is not, because 67.3% of that share comes from two countries: excluding India and China leaves 149 papers (25.6% of the corpus) spread across 30 countries. The inequity in this literature is therefore not principally a North–South one. It is a concentration of capacity in a small number of large research systems, and the regions with the greatest food-security burden sit outside all of them. Research investment in agricultural ML and DL is distributed according to research capacity, publication infrastructure and access to computing — all correlated with income — rather than according to agricultural vulnerability. Two caveats temper the strength of this claim. First, first-author affiliation measures where research is led, not where it is applied, and some proportion of the North American and European output studies food-insecure regions remotely. Second, as Section 2.2 sets out, single-database search systematically under-samples regional and conference-first publication venues, which are disproportionately the outlets of the very regions reported here as under-represented. The direction of the finding is secure; its magnitude is an upper bound.
Addressing the gap requires targeted funding mechanisms, capacity-building in under-represented regions, and — most tractably — the development of locally annotated benchmark datasets that reflect the specific crop varieties, pests and growing conditions of food-insecure agricultural systems. A benchmark is cheaper to build than a research community and it is the input that the rest of the field is currently missing.
4.7. Open Science: One Dimension Moving, One Static
Open science compliance is low in absolute terms — code openly available in 7.2% of full texts, data in 24.7%, both in 4.9% — but the two dimensions are behaving quite differently, and the difference is instructive. Open data disclosure rises significantly across the period (ρ = 0.131, p = 0.007), reaching 28.4% of 2025 full texts. Open code shows no significant trend and sits in single digits throughout.
The most parsimonious explanation is journal policy. Data-availability statements are now a mandatory submission field at most major publishers; code-availability statements generally are not. The mandated field appears to be doing the work: authors who must complete a box complete it, and a meaningful fraction of them complete it with a repository link. This is an unusually actionable finding for a systematic review, because it identifies a single, low-cost editorial intervention — adding a mandatory code-availability field to the submission system — with a directly observed analogue that has already changed behaviour on the data side.
The finer-grained taxonomy adopted here also reveals how much the conventional binary conceals. A further 18.8% of papers place data behind an author request and 8.1% assert that data are contained in the article — categories that a Yes/No coding scheme assigns arbitrarily, and that were the largest source of disagreement between the two extraction passes (Section 2.6). Availability on request is not equivalent to availability; the empirical literature on data-sharing compliance consistently finds that a minority of such requests are fulfilled. Counting these papers as open would raise the headline data figure by roughly two thirds, and would be wrong.
The consequences of low reproducibility extend beyond individual studies. A corpus in which fewer than one paper in thirteen provides reusable code cannot support the systematic performance comparison that would be needed to establish best practice, which is one reason this review reports distributional statistics rather than a meta-analysis. The reproducibility index makes the shape of the deficit precise: reporting practices are common (87.4% report hyperparameters) while artefact release and run-to-run variance control are rare (11.6% report repeated runs or seed control). A field that reports a 0.3-percentage-point improvement over a baseline without reporting the variance across random seeds is not, in a strict sense, reporting a result at all.
4.8. Emerging Methodological Frontiers
This section distinguishes established trends — supported by multiple independently replicated studies with substantial citation records — from early-stage frontiers illustrated by very recent single studies. The distinction is made explicit for each strand, and the quantitative trend statistics from Table 14 are used to separate the two.
Explainable AI is an established and rapidly growing strand. Attribution methods appear in 32.8% of full texts and the trend is the second strongest in the corpus (ρ = 0.250, p < 0.001), rising from 14.3% of 2022 full texts to 41.2% in 2025. The evidence base is replicated: Shams et al. (2024) on XAI for crop recommendation and Akkem et al. (2025) on explainable AI in smart farming provide independent support for its utility in advisory contexts. The growth reflects a practical recognition that black-box models face adoption barriers where extension officers and farmers require a communicable rationale rather than a bare prediction. Early-stage extensions such as Wang et al. (2026), applying Kolmogorov–Arnold networks with XAI to soybean yield forecasting, illustrate a possible direction but carry no citations as of March 2026 and should be treated as hypothesis-generating.
Edge and embedded deployment is the fastest-growing practice in the corpus (ρ = 0.262, p < 0.001), rising from 10.7% of 2022 full texts to 35.8% in 2025 and appearing in 25.6% overall. This is a substantive shift in where agricultural models are expected to run, and it is the practice most directly relevant to smallholder contexts, where connectivity and device specification are binding constraints. It should be read alongside Section 4.4: edge deployment is growing much faster than field validation, so the gap between systems that can run in a field and systems that have been shown to work in one is widening rather than closing.
Federated learning is the clearest example of a technique that is discussed more than it grows. It appears in 6.5% of full texts with no significant temporal trend (ρ = 0.072, p = 0.14) — the only practice in Table 14 without one. The cluster nevertheless contains methodologically credible contributions: Mamba Kabala et al. (2023) on federated crop disease detection and Aggarwal et al. (2023) on the non-IID distribution problem in federated agricultural networks together provide independent evidence of technical viability. Federated approaches remain relevant where farm sensor data carries proprietary value or where data sovereignty prevents centralisation, and tightening data governance regimes may yet convert the niche into a necessity. On present evidence, however, it is a stable specialism rather than an emerging frontier, and reviews that list it alongside XAI as a comparable growth area overstate its trajectory.
Physics-informed and causally grounded modelling remains genuinely early-stage: the available evidence consists of isolated recent studies rather than a replicated body of work. Sun et al. (2026), using a soil knowledge-guided multi-task Transformer to predict soil properties and crop traits simultaneously, and Kouame et al. (2026), applying causal forests and SHAP to fertiliser effect heterogeneity on maize yield in Ghana, each illustrate the potential of the approach. Both carry zero citations as of March 2026 and are cited here as directional indicators of where the field may develop, not as evidence of an established trend. The distinction matters because causal frameworks are the only rigorous route to the policy-relevant questions of intervention effect that purely predictive models cannot address, and premature claims of maturity in this area would be counterproductive.
4.9. Research Gaps and Priority Directions
Five gaps constrain the translation of technical advance into agricultural impact. They are stated below with the specific evidence from this review that supports each, and with a concrete first step where one exists.
Field-realistic benchmarks. The single most consequential finding of this review is that approximately four percentage points of headline accuracy are attributable to evaluation context rather than method, and that 59.0% of disease-detection papers evaluate on one laboratory-collected dataset. PlantVillage has partially served the benchmarking function that ImageNet (Russakovsky et al., 2015) and COCO (Lin et al., 2014) serve in general computer vision, but its controlled conditions limit ecological validity. Community-led curation of annotated field-collected datasets spanning multiple regions, crop varieties and growth stages is the infrastructure the field is missing, and it is a tractable, fundable deliverable rather than an open research problem.
Evaluation rigour and reporting standards. With 30.0% of full texts reporting an independent or transfer test set and 11.6% reporting seed control, the literature cannot currently distinguish genuine improvement from evaluation artefact. A minimal reporting checklist — separate in-distribution and out-of-distribution performance; RMSE accompanied by the mean and standard deviation of the target distribution; results averaged over multiple seeds with dispersion reported; an explicit statement of what the test set was held out from — would address most of the deficit and could be adopted by journals immediately.
Smallholder-relevant system design. Disease detection and yield prediction for major staple crops dominate the corpus (69.8% of papers), and very few studies explicitly address the constraints of smallholder agriculture: limited connectivity, low-specification devices, restricted meteorological coverage, plot sizes below the resolution of commercial satellite products, and the absence of locally annotated training data. The growth of edge deployment (25.6% of full texts) is the most promising development here, illustrated by early-stage work including the lightweight CAUC weed segmentation model of Arumuga Arun et al. (2026) and the MobileViT-based mobile application of Bahaa et al. (2026), both carrying zero citations as of March 2026. What is largely missing is validation of these systems under genuine smallholder field conditions.
Multi-modal fusion at scale. Multi-modal or sensor fusion appears in 29.5% of full texts and is growing significantly (ρ = 0.200, p < 0.001), but genuinely learned fusion of heterogeneous streams remains less common than the figure suggests, since the measure counts any explicit fusion language. Early-stage examples from the 2026 cohort, including the ADC-YOLO architecture of Zhu et al. (2026) for UAV-based rice detection and the CNN-Informer model of Li et al. (2026) for multi-source yield prediction, illustrate the direction without yet constituting a replicated evidence base. The absence of standardised fusion benchmarks is the critical barrier.
Climate adaptation and long-term resilience. Despite the framing of agricultural AI as a response to climate change — including in this paper's own introduction — climate impact and risk assessment is the smallest domain in the taxonomy, with a single paper classified there as its primary focus and only a modest number addressing it secondarily. The study by Abate et al. (2025) integrating satellite data for yield prediction under Ethiopian climate variability and the LSTM-based irrigation water quality assessment of Hussein et al. (2025) are exceptions in a literature that overwhelmingly models current conditions rather than future scenarios. Coupling ML and DL with crop simulation models and climate projection ensembles remains an underexplored frontier with substantial applied potential.
4.10. Limitations of This Review
Single-database search. The search was conducted in Scopus alone. This was a deliberate choice shaped by reproducibility and access constraints: Web of Science and IEEE Xplore are not accessible through the author's institutional subscription, and Google Scholar was excluded because it indexes conference papers, preprints and grey literature without consistent quality filtering. Scopus offers the broadest coverage of agricultural engineering, remote sensing and applied machine learning journals among the accessible options. The consequence, stated plainly, is that this is the most comprehensive Scopus-indexed synthesis for the period rather than an exhaustive census, and that regional and conference-first venues are systematically under-sampled in a way that biases the geographic findings toward greater apparent inequity than exists. Researchers with access to additional databases are encouraged to extend this corpus.
The full-text subsample is not a random sample. Content-derived findings rest on the 430 papers (73.9%) with retrievable open-access full text. Open-access papers are plausibly more likely to disclose data and code than paywalled papers, so the open-science rates reported here are optimistic relative to the full corpus, and the architecture and evidence-maturity distributions may differ in the unretrieved remainder. Full-text retrieval rates by year are reported in Table 4 so that readers can judge the magnitude of the effect.
Extraction error. The residual errors are not random: the pipeline under-detects data availability when a statement is phrased unusually or when a URL is fragmented beyond repair by PDF layout, so the open-data figure is more likely to be an undercount than an overcount. Metrics embedded in figures, complex multi-column tables or supplementary files remain inaccessible to any text-based pipeline, so reported metric counts are lower bounds.
Instrument validity. The evidence-maturity classification and the reproducibility index are new instruments introduced in this review and have not been independently validated. Both are rule-based and both measure what a paper reports rather than what its authors did; a study that performed rigorous field validation without describing it in recoverable language will be under-classified. The evidence-maturity rules and the index weighting are stated in full in Section 2.7 and Appendix C so that others can apply, criticise or re-weight them. The three-level maturity scheme in particular is a coarse instrument, and the finding that L3 accuracy resembles L1 accuracy should be read as a property of how deployment is reported in this literature rather than as a claim about deployed systems in general.
Link verification. Open science status was assessed from paper text; repository URLs were not resolved. Some links recorded here as evidence of open code or data may no longer function, so the reported rates are upper bounds on currently accessible artefacts.
Publication bias. Studies with negative results, failed deployments or poor generalisation are less likely to reach peer-reviewed publication. Three indirect indicators support this assessment for the present corpus: a heavily right-skewed citation distribution, an upper-compressed accuracy distribution, and the complete absence of reported deployment failures. Formal funnel plot assessment is not applicable in the absence of a common effect size. The medians reported here should be understood as upper bounds on achievable performance within the specific evaluation contexts of the included studies, not as population parameters for deployable systems.
5. Conclusion
This PRISMA 2020-compliant systematic review has synthesised 582 peer-reviewed studies on machine learning and deep learning in agriculture published between January 2019 and March 2026, with full-text re-extraction and independent validation for 430 of them. Six principal conclusions emerge.
First, the field has grown steeply and continuously. Annual output rose from 6 papers in 2019 to 251 in 2025, a compound annual growth rate of approximately 86%, with inflections in 2022 (+215%) and 2024 (+159%) that coincide with the agricultural adoption of Vision Transformers and YOLO-generation detectors respectively. Architectural innovation in general computer vision propagates into agricultural AI with a lag of roughly two years.
Second, the architectural landscape is pluralistic rather than convergent. Convolutional backbones remain dominant (57.2% of full texts) and Transformer-based models have risen to 41.2% of 2025 full texts, but classical ensembles hold a stable share and the median paper benchmarks 4.5 architectures against one another. Deep learning has not replaced classical machine learning; the two are being compared within the same studies, with deep learning excelling in image-intensive perception and classical methods competitive in structured multivariate modelling.
Third, the field is concentrated in two application domains. Plant disease and pest detection (44.3%) and crop yield prediction (25.4%) account for 69.8% of the corpus, while livestock, harvesting robotics, food-system economics and climate adaptation together account for less than 3%. The hierarchical taxonomy introduced here reduces the unclassified residual from 45.2% in the previous synthesis to 5.7%, making that concentration directly visible.
Fourth, and most consequentially, reported performance depends systematically on the evidence context in which it was obtained. Median accuracy is 99.0% for studies evaluated on public benchmarks alone but 95.0% for studies evaluated on their own field data (p < 0.001); studies at evidence level L2 report 93.0% against 98.0% at L1. Only 36.5% of full texts reach field validation and 30.5% an operational prototype, and these two attributes are largely independent: deployment artefacts are frequently built around models that were never evaluated outside their benchmark. Headline accuracy figures in this literature — including the 98.7% median for disease detection — are upper bounds obtained under controlled evaluation and should not be read as estimates of deployable performance.
Fifth, open science practice is low but not uniformly static. Code is openly available in 7.2% of full texts and shows no significant improvement over the period; data are openly available in 24.7% and improve significantly (ρ = 0.131, p = 0.007). The divergence tracks journal policy: data-availability statements are mandatory at most major publishers and code-availability statements are not. The median reproducibility index is 3 of 10, and only 5.6% of studies score 7 or above.
Sixth, the geographic distribution of research does not track the geographic distribution of need. Classified at country level, 78.4% of the corpus originates from Global South institutions, but 67.3% of that output comes from India and China alone; excluding those two countries leaves 149 papers (25.6% of the corpus) from the remaining 30 Global South countries. Sub-Saharan Africa, carrying the world's highest burden of undernourishment, contributes 9 papers (1.5%) and releases code in none of them. Single-database search inflates the apparent size of this gap, but not its direction.
The overarching conclusion is that the technical capacity of machine learning and deep learning for agricultural applications is advancing rapidly, while the evidential practices needed to convert that capacity into deployable, equitable and reproducible agronomic intelligence are advancing much more slowly. Three interventions follow directly from the evidence and are unusually tractable: a mandatory code-availability field in journal submission systems, which has a demonstrated analogue on the data side; a minimal reporting checklist separating in-distribution from out-of-distribution performance and requiring dispersion across random seeds; and community investment in field-collected, regionally diverse benchmark datasets. None requires a methodological breakthrough. Each would do more for the reliability of this literature than another percentage point on PlantVillage.
Author Contributions
A.R. (Azad Rasul) solely conceived and designed the study, conducted the literature search and screening in accordance with PRISMA guidelines, performed data extraction, re-extraction and curation, carried out the manual validation adjudication, performed the formal analysis and interpretation, developed the methodology, prepared the figures, and wrote, reviewed and edited the manuscript. A.R. managed all aspects of project administration and approved the final version.
Funding
This research received no external funding.
Data Availability Statement
The full-text-derived dataset, the extraction and analysis code, the rule lexicons reproduced in Appendix C.
Conflicts of Interest
The author declares no conflict of interest.
Appendix A. Representative High-Impact Studies
Table A1 lists the 25 most-cited papers in the 582-paper corpus. The selection rule is explicit and reproducible: papers are ranked by Scopus citation count as of March 2026 and the top 25 are listed without further filtering. Citation count is a proxy for influence that systematically disadvantages recent work, so the table should be read as identifying the established literature of the review period rather than its most important contributions; papers published in 2025 and 2026 have had insufficient time to accumulate citations.
Table A1.
The 25 most-cited included studies, ranked by Scopus citation count as of March 2026.
| Rank | First author | Year | Title | Journal | Citations | DOI |
|---|---|---|---|---|---|---|
| 1 | Cao J. et al. | 2021 | Integrating Multi-Source Data for Rice Yield Prediction across China using Machine Learning and | Agricultural and Forest Meteorology | 303 | 10.1016/j.agrformet.2020.108275 |
| 2 | Picon A. et al. | 2019 | Crop conditional Convolutional Neural Networks for massive multi-crop plant disease classificat | Computers and Electronics in Agriculture | 198 | 10.1016/j.compag.2019.105093 |
| 3 | Gallo I. et al. | 2023 | Deep Object Detection of Crop Weeds: Performance of YOLOv7 on a Real Case Dataset from UAV Imag | Remote Sensing | 188 | 10.3390/rs15020539 |
| 4 | Kuradusenge M. et al. | 2023 | Crop Yield Prediction Using Machine Learning Models: Case of Irish Potato and Maize | Agriculture Switzerland | 185 | 10.3390/agriculture13010225 |
| 5 | Ghosal S. et al. | 2019 | A weakly supervised deep learning framework for sorghum head detection and counting | Plant Phenomics | 165 | 10.34133/2019/1525874 |
| 6 | Bhujel A. et al. | 2022 | A Lightweight Attention-Based Convolutional Neural Networks for Tomato Leaf Disease Classificat | Agriculture Switzerland | 150 | 10.3390/agriculture12020228 |
| 7 | Shams M.Y. et al. | 2024 | Enhancing crop recommendation systems with explainable artificial intelligence: a study on agri | Neural Computing and Applications | 135 | 10.1007/s00521-023-09391-2 |
| 8 | Zhang L. et al. | 2020 | Combining optical, fluorescence, thermal satellite, and environmental data to predict county-le | Remote Sensing | 134 | 10.3390/rs12010021 |
| 9 | Joseph D.S. et al. | 2024 | Real-Time Plant Disease Dataset Development and Detection of Plant Disease Using Deep Learning | IEEE Access | 133 | 10.1109/access.2024.3358333 |
| 10 | Sun J. et al. | 2020 | Multilevel Deep Learning Network for County-Level Corn Yield Estimation in the U.S. Corn Belt | IEEE Journal of Selected Topics in Applied Earth Observations and Remote Sensing | 131 | 10.1109/jstars.2020.3019046 |
| 11 | Pacal I. et al. | 2024 | Enhancing crop productivity and sustainability through disease identification in maize leaves: | Expert Systems with Applications | 129 | 10.1016/j.eswa.2023.122099 |
| 12 | Sajitha P. et al. | 2024 | A review on machine learning and deep learning image-based plant disease classification for ind | Journal of Industrial Information Integration | 124 | 10.1016/j.jii.2024.100572 |
| 13 | Lin Z. et al. | 2019 | A unified matrix-based convolutional neural network for fine-grained image classification of wh | IEEE Access | 122 | 10.1109/access.2019.2891739 |
| 14 | Nejad S.M.M. et al. | 2023 | Multispectral Crop Yield Prediction Using 3D-Convolutional Neural Networks and Attention Convol | IEEE Journal of Selected Topics in Applied Earth Observations and Remote Sensing | 119 | 10.1109/jstars.2022.3223423 |
| 15 | Balafas V. et al. | 2023 | Machine Learning and Deep Learning for Plant Disease Classification and Detection | IEEE Access | 115 | 10.1109/access.2023.3324722 |
| 16 | Shafik W. et al. | 2024 | Using transfer learning-based plant disease classification and detection for sustainable agricu | BMC Plant Biology | 104 | 10.1186/s12870-024-04825-y |
| 17 | Ngugi H.N. et al. | 2024 | Revolutionizing crop disease detection with computational deep learning: a comprehensive review | Environmental Monitoring and Assessment | 100 | 10.1007/s10661-024-12454-z |
| 18 | Bhimavarapu U. et al. | 2023 | Improved Optimization Algorithm in LSTM to Predict Crop Yield | Computers | 94 | 10.3390/computers12010010 |
| 19 | Mirhoseini Nejad S.M. et al. | 2024 | ConvLSTM-ViT: A Deep Neural Network for Crop Yield Prediction Using Earth Observations and Remo | IEEE Journal of Selected Topics in Applied Earth Observations and Remote Sensing | 93 | 10.1109/jstars.2024.3464411 |
| 20 | Simhadri C.G. et al. | 2023 | Automatic Recognition of Rice Leaf Diseases Using Transfer Learning | Agronomy | 92 | 10.3390/agronomy13040961 |
| 21 | Zhou W. et al. | 2022 | Integrating climate and satellite remote sensing data for predicting county-level wheat yield i | International Journal of Applied Earth Observation and Geoinformation | 90 | 10.1016/j.jag.2022.102861 |
| 22 | Afifi A. et al. | 2021 | Convolutional neural network for automatic identification of plant diseases with limited data | Plants | 86 | 10.3390/plants10010028 |
| 23 | Narmilan A. et al. | 2022 | Detection of White Leaf Disease in Sugarcane Using Machine Learning Techniques over UAV Multisp | Drones | 81 | 10.3390/drones6090230 |
| 24 | Batool D. et al. | 2022 | A Hybrid Approach to Tea Crop Yield Prediction Using Simulation Models and Machine Learning | Plants | 81 | 10.3390/plants11151925 |
| 25 | Joshi A. et al. | 2023 | Winter wheat yield prediction in the conterminous United States using solar-induced chlorophyll | Ecological Informatics | 78 | 10.1016/j.ecoinf.2023.102194 |
Citation counts retrieved from Scopus as of March 2026. Titles are truncated for layout.
Appendix B. Datasets and Data Sources Used in the Corpus
Table B1 reports the benchmark datasets and pre-training corpora identified in the 430 full texts, and Table B2 the data sources and sensing modalities. Both are derived from the rule-based extraction pass and therefore describe what the corpus actually uses rather than what is available. Table B3 reproduces the reference list of publicly available agricultural datasets, updated from Kamilaris and Prenafeta-Boldú (2018).
Table B1.
Benchmark datasets and pre-training corpora identified in the full-text subsample (n = 430).
Table B1.
Benchmark datasets and pre-training corpora identified in the full-text subsample (n = 430).
| Dataset | Papers (n) | % of subsample |
|---|---|---|
| Self-collected field data | 145 | 33.7 |
| PlantVillage | 108 | 25.1 |
| ImageNet (pre-training) | 103 | 24.0 |
| Kaggle | 89 | 20.7 |
| PlantDoc | 30 | 7.0 |
| MS-COCO (pre-training) | 18 | 4.2 |
| USDA/NASS | 17 | 4.0 |
| Roboflow | 14 | 3.3 |
| DeepWeeds | 6 | 1.4 |
| CWFID | 4 | 0.9 |
A paper may use more than one dataset, so counts do not sum to the subsample size. "Self-collected field data" denotes explicit language describing data acquired by the authors under field conditions.
Table B2.
Data sources and sensing modalities identified in the full-text subsample.
| Data source / sensor | Papers (n) | % of subsample |
|---|---|---|
| UAV / drone | 214 | 49.8 |
| RGB / handheld camera | 152 | 35.3 |
| Multispectral | 141 | 32.8 |
| Weather / climate data | 136 | 31.6 |
| Hyperspectral | 124 | 28.8 |
| IoT / in-situ sensor | 105 | 24.4 |
| Other satellite | 101 | 23.5 |
| Sentinel | 61 | 14.2 |
| MODIS | 59 | 13.7 |
| Landsat | 45 | 10.5 |
| LiDAR | 37 | 8.6 |
| Thermal | 31 | 7.2 |
| SAR / radar | 20 | 4.7 |
| Tabular / survey / statistical | 18 | 4.2 |
Categories are not mutually exclusive; multi-sensor studies contribute to several rows.
Table B3.
Publicly available datasets for ML and DL research in agriculture (updated from Kamilaris & Prenafeta-Boldú, 2018).
Table B3.
Publicly available datasets for ML and DL research in agriculture (updated from Kamilaris & Prenafeta-Boldú, 2018).
| Dataset / Resource | Data Type | Description | Source | URL / Access | Notes |
|---|---|---|---|---|---|
| PlantVillage | Image (leaf) | 54,306 images; 38 crop–disease pairs across 14 species | Hughes & Salathé (2015) | https://www.plantvillage.org | Most widely used plant disease benchmark; controlled lab conditions |
| CWFID – Crop/Weed Field Image Dataset | Image (UAV field) | Carrot crop & weed segmentation; 60 annotated field images | Haug & Ostermann (2015) | https://github.com/cwfid/dataset | Real field images with pixel-wise crop/weed labels |
| DatasetNinja (Sugar Beet / CWFID) | Image (field) | Multi-crop weed datasets aggregator | DatasetNinja | https://datasetninja.com/cwfid | Hosts CWFID, Sugar Beet and other agricultural segmentation datasets |
| ImageNet (Plant subset) | Image (general) | Thousands of plant species images | Deng et al. (2009) | http://image-net.org/explore?wnid=n07707451 | Used for pre-training; not crop-specific but foundational for transfer learning |
| Kaggle – New Plant Diseases Dataset | Image (leaf) | 87,000 images; 38 classes (26 diseases, 14 crops) | Kaggle Community | https://www.kaggle.com/datasets/vipooool/new-plant-disease | Derived from PlantVillage; popular for benchmarking CNN classifiers |
| Kaggle – PlantDoc Dataset | Image (field) | 2,569 field images; 27 crop classes and 13 disease classes | Singh et al. (2020) | https://www.kaggle.com/datasets/abdulhasibuddin/plant-doc-dataset | Field-collected; more ecologically valid than PlantVillage |
| Mendeley Data – Rice Leaf Disease | Image (leaf) | Multiple rice disease categories | Various authors | https://data.mendeley.com | Repository for rice, banana and crop disease image datasets |
| Zenodo – Agricultural Datasets | Multi-type | Diverse crop, soil, UAV, and satellite datasets | Various authors | https://zenodo.org | Open-access repository; hosts annotated UAV and field datasets |
| Copernicus Open Access Hub (Sentinel-1/2) | Satellite (SAR / multispectral) | Global; 10 m resolution; free reacquisition every 5–6 days | ESA | https://browser.dataspace.copernicus.eu | Primary satellite source for crop mapping and yield studies in this corpus |
| USGS Earth Explorer (Landsat) | Satellite (multispectral) | Global Landsat 7/8/9 archive from 1972 to present | USGS | https://earthexplorer.usgs.gov | Free access; widely used for long-term crop monitoring and NDVI time series |
| NASA Earthdata – MODIS | Satellite (multispectral) | 500 m – 1 km global daily composites | NASA | https://earthdata.nasa.gov | MODIS NDVI/EVI products widely used in yield forecasting literature |
| Africa Soil Information Service (AfSIS) | Soil data | Continent-wide digital soil maps for sub-Saharan Africa | AfSIS | http://africasoils.net/services/data/ | Rare open soil dataset for underrepresented SSA region; also cited by Kamilaris & Prenafeta-Boldú (2018) |
| UC Merced Land Use Dataset | Aerial image | 21 land-use classes; 100 images/class at 0.3 m resolution | Yang & Newsam (2010) | http://vision.ucmerced.edu/datasets/landuse.html | Standard benchmark for land-use/cover classification tasks |
| Syngenta Crop Challenge Dataset | Tabular (weather/yield) | 6,490 sub-regions; weather + yield 2000–2016 | Syngenta / IdeaConnection | https://www.ideaconnection.com/syngenta-crop-challenge | Used for corn and soybean yield prediction benchmarks |
| EUROSAT | Satellite (Sentinel-2 RGB) | 27,000 labelled patches; 10 land-use classes | Helber et al. (2019) | https://github.com/phelber/EuroSAT | Widely used for transfer learning benchmarking in European agricultural contexts |
| WeedNet / Peanut Weed Dataset | Image (UAV field) | Peanut cultivation; crop-weed segmentation | Pai et al. (2025) | https://github.com/ptdkhoa/Peanut-dataset | Field-collected with pixel-wise labels for crop-weed segmentation tasks |
| Rice Seedling Dataset (AIPAL-NCHU) | Image (UAV field) | Rice panicle detection from UAV images | AIPAL-NCHU | https://github.com/aipal-nchu/RiceSeedlingDataset | Used for YOLO-based rice detection benchmarks |
| Mendeley – BananaImageBD32 | Image (leaf) | Banana variety identification; 32 cultivars | Various authors | https://data.mendeley.com/datasets/ptfscwtnyz/2 | Multi-variety banana classification benchmark |
| Maize Disease Dataset (Zenodo) | Image (field) | Maize disease classification; multiple categories | Weldeslasie D.T. (2025) | https://zenodo.org/records/17170314 | African institution contribution; field-collected maize disease images |
| WHU-Hi Hyperspectral Dataset | Hyperspectral (aerial) | Wuhan University hyperspectral aerial images for crop classification | WHU | http://rsidea.whu.edu.cn/resource_WHUHi_sharing.htm | High-resolution hyperspectral benchmark for crop type classification |
Abbreviations: UAV = unmanned aerial vehicle; SAR = synthetic aperture radar; ESA = European Space Agency; USGS = United States Geological Survey; NASA = National Aeronautics and Space Administration; NDVI = Normalised Difference Vegetation Index; EVI = Enhanced Vegetation Index; SSA = Sub-Saharan Africa. Many datasets referenced in 2024–2026 papers are hosted on GitHub or institutional repositories without persistent identifiers; authors are encouraged to assign DOIs via Zenodo or Mendeley Data.
Appendix C. Extraction Rules
C.1. Architecture lexicon
Table C1 gives the complete mapping from regular expressions to the 35 aggregated architecture labels and their ten families. Aggregation is performed by the rules below rather than by post-hoc grouping of free-text labels, so the mapping is fully reproducible. Variant-level names (ResNet-18 through ResNet-152; YOLOv3 through YOLOv8; EfficientNet-B0 through B7) are collapsed into their parent family by the expressions shown.
Table C1.
Architecture lexicon: aggregated labels, families and matching expressions.
| Aggregated architecture label | Family | Matching expressions (regular expressions applied to full text) |
|---|---|---|
| CNN (generic) | CNN backbones | \bconvolutional neural network | \bcnns?\b | \bconvnet |
| ResNet | CNN backbones | \bresnet[- ]?\d* | \bresidual network |
| VGG | CNN backbones | \bvgg[- ]?\d* |
| DenseNet | CNN backbones | \bdensenet[- ]?\d* |
| EfficientNet | CNN backbones | \befficientnet[- ]?\w* |
| MobileNet | CNN backbones | \bmobilenet[- ]?\w* |
| Inception/Xception | CNN backbones | \binception[- ]?v?\d*\b | \bgooglenet\b | \bxception\b |
| AlexNet | CNN backbones | \balexnet\b |
| U-Net | Segmentation | \bu-?net\b | \bunet\+\+ |
| YOLO | Object detection | \byolo[- ]?v?\d*\w* |
| R-CNN family | Object detection | \bfaster r-?cnn\b | \bmask r-?cnn\b | \bfast r-?cnn\b |
| SSD/RetinaNet | Object detection | \bssd\b | \bretinanet\b |
| Vision Transformer | Transformer | \bvision transformer | \bvits?\b | \bswin[- ]?transformer | \bdeit\b | \bsegformer\b | \bpvt\b |
| Transformer (other) | Transformer | \btransformer(s)?\b |
| LSTM | Recurrent/sequence | \blstm\b | \blong short-?term memory |
| GRU | Recurrent/sequence | \bgru\b | \bgated recurrent unit |
| RNN (other) | Recurrent/sequence | \brnns?\b | \brecurrent neural network |
| GAN | Generative | \bgans?\b | \bgenerative adversarial |
| Autoencoder | Generative | \bauto-?encoders?\b |
| GNN | Graph | \bgraph neural network | \bgraph convolutional network | \bgcn\b |
| Random Forest | Classical ensemble | \brandom forests?\b | \brandom-?forest\b |
| SVM/SVR | Classical kernel/statistical | \bsupport vector machine | \bsupport vector regress | \bsvms?\b | \bsvr\b |
| XGBoost | Classical ensemble | \bxgboost\b | \bextreme gradient boost | \bxgb\b |
| LightGBM | Classical ensemble | \blightgbm\b | \blight gbm\b |
| CatBoost | Classical ensemble | \bcatboost\b |
| Gradient Boosting (other) | Classical ensemble | \bgradient boost\w* | \bgbdt\b | \badaboost\b | \bgbr\b |
| ANN/MLP | Shallow neural | \bartificial neural network | \banns?\b | \bmulti-?layer perceptron | \bmlps?\b | \bbpnn\b | \bfeed-?forward neural |
| Decision Tree | Classical ensemble | \bdecision trees?\b | \bcart\b |
| kNN | Classical kernel/statistical | \bk-?nearest neighbou?rs?\b | \bk-?nn\b | \bknn\b |
| Naive Bayes | Classical kernel/statistical | \bna[iï]ve bayes\b |
| Regression (linear/PLS) | Classical kernel/statistical | \blinear regression\b | \blogistic regression\b | \bridge regression\b | \blasso\b | \bpartial least squares | \bplsr\b |
| Reinforcement Learning | Emerging | \breinforcement learning\b | \bq-?learning\b | \bdeep q-?network\b |
| PINN | Emerging | \bphysics-?informed neural | \bphysics-?informed machine |
| Federated Learning | Emerging | \bfederated learning\b | \bfedavg\b | \bfederated averaging\b |
| LLM/Foundation model | Emerging | \blarge language model | \bfoundation model | \bgpt-?[0-9] | \bchatgpt\b | \bsegment anything model\b | \bclip model\b |
Expressions are applied case-insensitively. An architecture is recorded as employed when it matches in the abstract, or at least twice within the methods and results sections; generic labels (CNN, ANN/MLP, Transformer, SSD, decision tree, kNN, regression, SVM, LLM) require three matches. Matches occurring only outside these sections are recorded as cited but not employed.
C.2. Evidence-maturity assignment rules
Table C2.
Rules used to assign the evidence-maturity level.
| Level | Assignment rule |
|---|---|
| L3 — Deployed or operational prototype | At least one strong deployment signal is present: edge or embedded hardware (Raspberry Pi, Jetson, TensorFlow Lite, ONNX, microcontroller, FPGA, quantisation or pruning for deployment); robotic or machinery integration; or farmer/stakeholder involvement (on-farm trial, pilot deployment, user study, extension service). A mobile or web application combined with real-time or in-field operation also qualifies. |
| L2 — Field-validated | No strong deployment signal, but the study either (a) contains explicit self-collected field data language, together with at least three field-evidence expressions, (b) contains at least six field-evidence expressions, or (c) reports a spatial or temporal transfer test (leave-one-site/year-out, spatial cross-validation, temporal transfer, cross-region evaluation, out-of-distribution testing). |
| L1 — Benchmark or controlled data only | Neither condition above is met. |
| Field-evidence expressions | field experiment/trial/campaign/survey/condition/site/plot/data/measurement; experimental field/plot/farm/station/site; in situ; ground truth; growing season; study area; farmland; cultivar; sown; transplant; plots were; agro-ecological; soil sampling. |
Levels are assigned deterministically in the order L3, L2, L1. The classification records what a study reports having done and is a coarse instrument; seeSection 4.10.
C.3. Reproducibility index detection rules
The components and weights of the index are given in Table 14. Detection rules are as follows: hyperparameters reported — mention of learning rate, batch size, epoch count, optimiser or hyperparameter tuning; software and hardware environment — a named GPU or deep learning framework; repeated runs or seed control — an explicit random seed, a stated number of repetitions, or results averaged with dispersion across runs; cross-validation or independent test set — as defined in Table 14. Code and data availability follow the taxonomy in Table 13.
References
- Abate, J. Satellite data integration for crop yield prediction in Eastern Ethiopia. Scientific Reports 2025. [Google Scholar] [CrossRef] [PubMed]
- Aggarwal, M. Lightweight federated learning for rice leaf disease classification using non-IID images. Sustainability 2023, 15(16), 12149. [Google Scholar] [CrossRef]
- Akkem, Y. Role of explainable AI in crop recommendation for smart farming. International Journal of Intelligent Systems and Applications 2025, 17(1). [Google Scholar] [CrossRef]
- Arumuga Arun, R. CAUC: Concatenated Attention U-Net for crop-weed segmentation; Scientific Reports, 2026. [Google Scholar] [CrossRef] [PubMed]
- Bahaa, M. AIoT mobile app for plant disease detection using MobileViT. AgriEngineering 2026, 8(1), 11. [Google Scholar] [CrossRef]
- Breiman, L. Random forests. Machine Learning 2001, 45(1), 5–32. [Google Scholar] [CrossRef]
- Cao, J. Integrating multi-source data for rice yield prediction across China using machine learning and deep learning approaches. Agricultural and Forest Meteorology 2021, 297, 108275. [Google Scholar] [CrossRef]
- Erike, A. Is AI for illiterate farmers? Machine learning challenges for precision agriculture; Discover Artificial Intelligence, 2025. [Google Scholar] [CrossRef]
- FAO; IFAD; UNICEF; WFP; WHO. The state of food security and nutrition in the world 2023; FAO, 2023. [Google Scholar] [CrossRef]
- Hochreiter, S.; Schmidhuber, J. Long short-term memory. Neural Computation 1997, 9(8), 1735–1780. [Google Scholar] [CrossRef] [PubMed]
- Hussein, E. E. SHAP-based feature selection for irrigation water quality assessment with machine learning. Water 2025, 17(1), 59. [Google Scholar] [CrossRef]
- Kamilaris, A.; Prenafeta-Boldú, F. X. Deep learning in agriculture: A survey. Computers and Electronics in Agriculture 2018, 147, 70–90. [Google Scholar] [CrossRef]
- Kouame, A. K. K. Causal and predictive machine learning for fertiliser heterogeneity on maize yield in Ghana. Field Crops Research 2026. [Google Scholar] [CrossRef]
- LeCun, Y.; Bengio, Y.; Hinton, G. Deep learning. Nature 2015, 521(7553), 436–444. [Google Scholar] [CrossRef] [PubMed]
- Li, X. CNN–Informer model for oilseed yield prediction with multi-source spatio-temporal data. Remote Sensing 2026, 18(1), 181. [Google Scholar] [CrossRef]
- Lin, T.-Y.; Maire, M.; Belongie, S.; Hays, J.; Perona, P.; Ramanan, D.; Dollár, P.; Zitnick, C. L. Microsoft COCO: Common objects in context. In Computer Vision – ECCV 2014 (Lecture Notes in Computer Science; Fleet, D., Ed.; Springer, 2014; vol. 8693, pp. 740–755. [Google Scholar] [CrossRef]
- Mamba Kabala, D. Image-based crop disease detection with federated learning; Scientific Reports, 2023. [Google Scholar] [CrossRef] [PubMed]
- Nejad, S. M. M. Multispectral crop yield prediction using 3D-CNN and attention ConvLSTM approaches. IEEE Journal of Selected Topics in Applied Earth Observations and Remote Sensing 2023. [Google Scholar] [CrossRef]
- Ngugi, H. N. Revolutionising crop disease detection with computational deep learning; Environmental Monitoring and Assessment, 2024. [Google Scholar] [CrossRef] [PubMed]
- Page, M. J.; McKenzie, J. E.; Bossuyt, P. M.; Boutron, I.; Hoffmann, T. C.; Mulrow, C. D. The PRISMA 2020 statement: An updated guideline for reporting systematic reviews. BMJ 2021, 372, n71. [Google Scholar] [CrossRef] [PubMed]
- Rogers, E. M.; Singhal, A.; Quinlan, M. M. Diffusion of innovations. In An integrated approach to communication theory and research, 3rd ed.; Stacks, D. W., Salwen, M. B., Eichhorn, K. C., Eds.; Routledge, 2019; pp. 415–434. [Google Scholar] [CrossRef]
- Ronneberger, O.; Fischer, P.; Brox, T. U-Net: Convolutional networks for biomedical image segmentation. In Medical Image Computing and Computer-Assisted Intervention – MICCAI 2015 (Lecture Notes in Computer Science; Navab, N., Ed.; Springer, 2015; vol. 9351, pp. 234–241. [Google Scholar] [CrossRef]
- Russakovsky, O.; Deng, J.; Su, H.; Krause, J.; Satheesh, S.; Ma, S.; Huang, Z.; Karpathy, A.; Khosla, A.; Bernstein, M.; Berg, A. C.; Fei-Fei, L. ImageNet large scale visual recognition challenge. International Journal of Computer Vision 2015, 115(3), 211–252. [Google Scholar] [CrossRef]
- Shafik, W. Hybrid Inception-Xception CNN for plant disease classification; Scientific Reports, 2025. [Google Scholar] [CrossRef] [PubMed]
- Shams, M. Y. Enhancing crop recommendation systems with explainable artificial intelligence; Neural Computing and Applications, 2024. [Google Scholar] [CrossRef]
- Singh, R. Soil organic carbon estimation with generative AI and Nix colour sensor; Scientific Reports, 2025. [Google Scholar] [CrossRef] [PubMed]
- Sun, G. Soil knowledge-guided multi-task transformer model for simultaneous crop and soil trait prediction; Artificial Intelligence in Agriculture, 2026. [Google Scholar] [CrossRef]
- Sun, J. Multilevel deep learning network for county-level corn yield estimation in the US Corn Belt. IEEE Journal of Selected Topics in Applied Earth Observations and Remote Sensing 2020. [Google Scholar] [CrossRef]
- Vaswani, A.; Shazeer, N.; Parmar, N.; Uszkoreit, J.; Jones, L.; Gomez, A. N.; Kaiser, Ł.; Polosukhin, I. Attention is all you need; Advances in Neural Information Processing Systems, 2017; p. 30. Available online: https://arxiv.org/abs/1706.03762.
- Wang, X. From data to decisions: Explainable AI for soybean yield forecasting; Scientific Reports, 2026. [Google Scholar] [CrossRef] [PubMed]
- Wang, Y. SHAP and LightGBM with data augmentation for wheat yield estimation. Computers and Electronics in Agriculture 2025. [Google Scholar] [CrossRef]
- Yu, S. ST-CFI: Swin Transformer with convolutional feature interactions for plant disease recognition; Scientific Reports, 2025. [Google Scholar] [CrossRef] [PubMed]
- Zhu, B. ADC-YOLO for rice detection in UAV images. Remote Sensing 2026, 18(3), 446. [Google Scholar] [CrossRef]
Figure 1.
PRISMA 2020 flow diagram of the literature search and study selection process. The final box records the split between the included corpus and the full-text analytic subsample used for all content-derived variables.
Figure 1.
PRISMA 2020 flow diagram of the literature search and study selection process. The final box records the split between the included corpus and the full-text analytic subsample used for all content-derived variables.
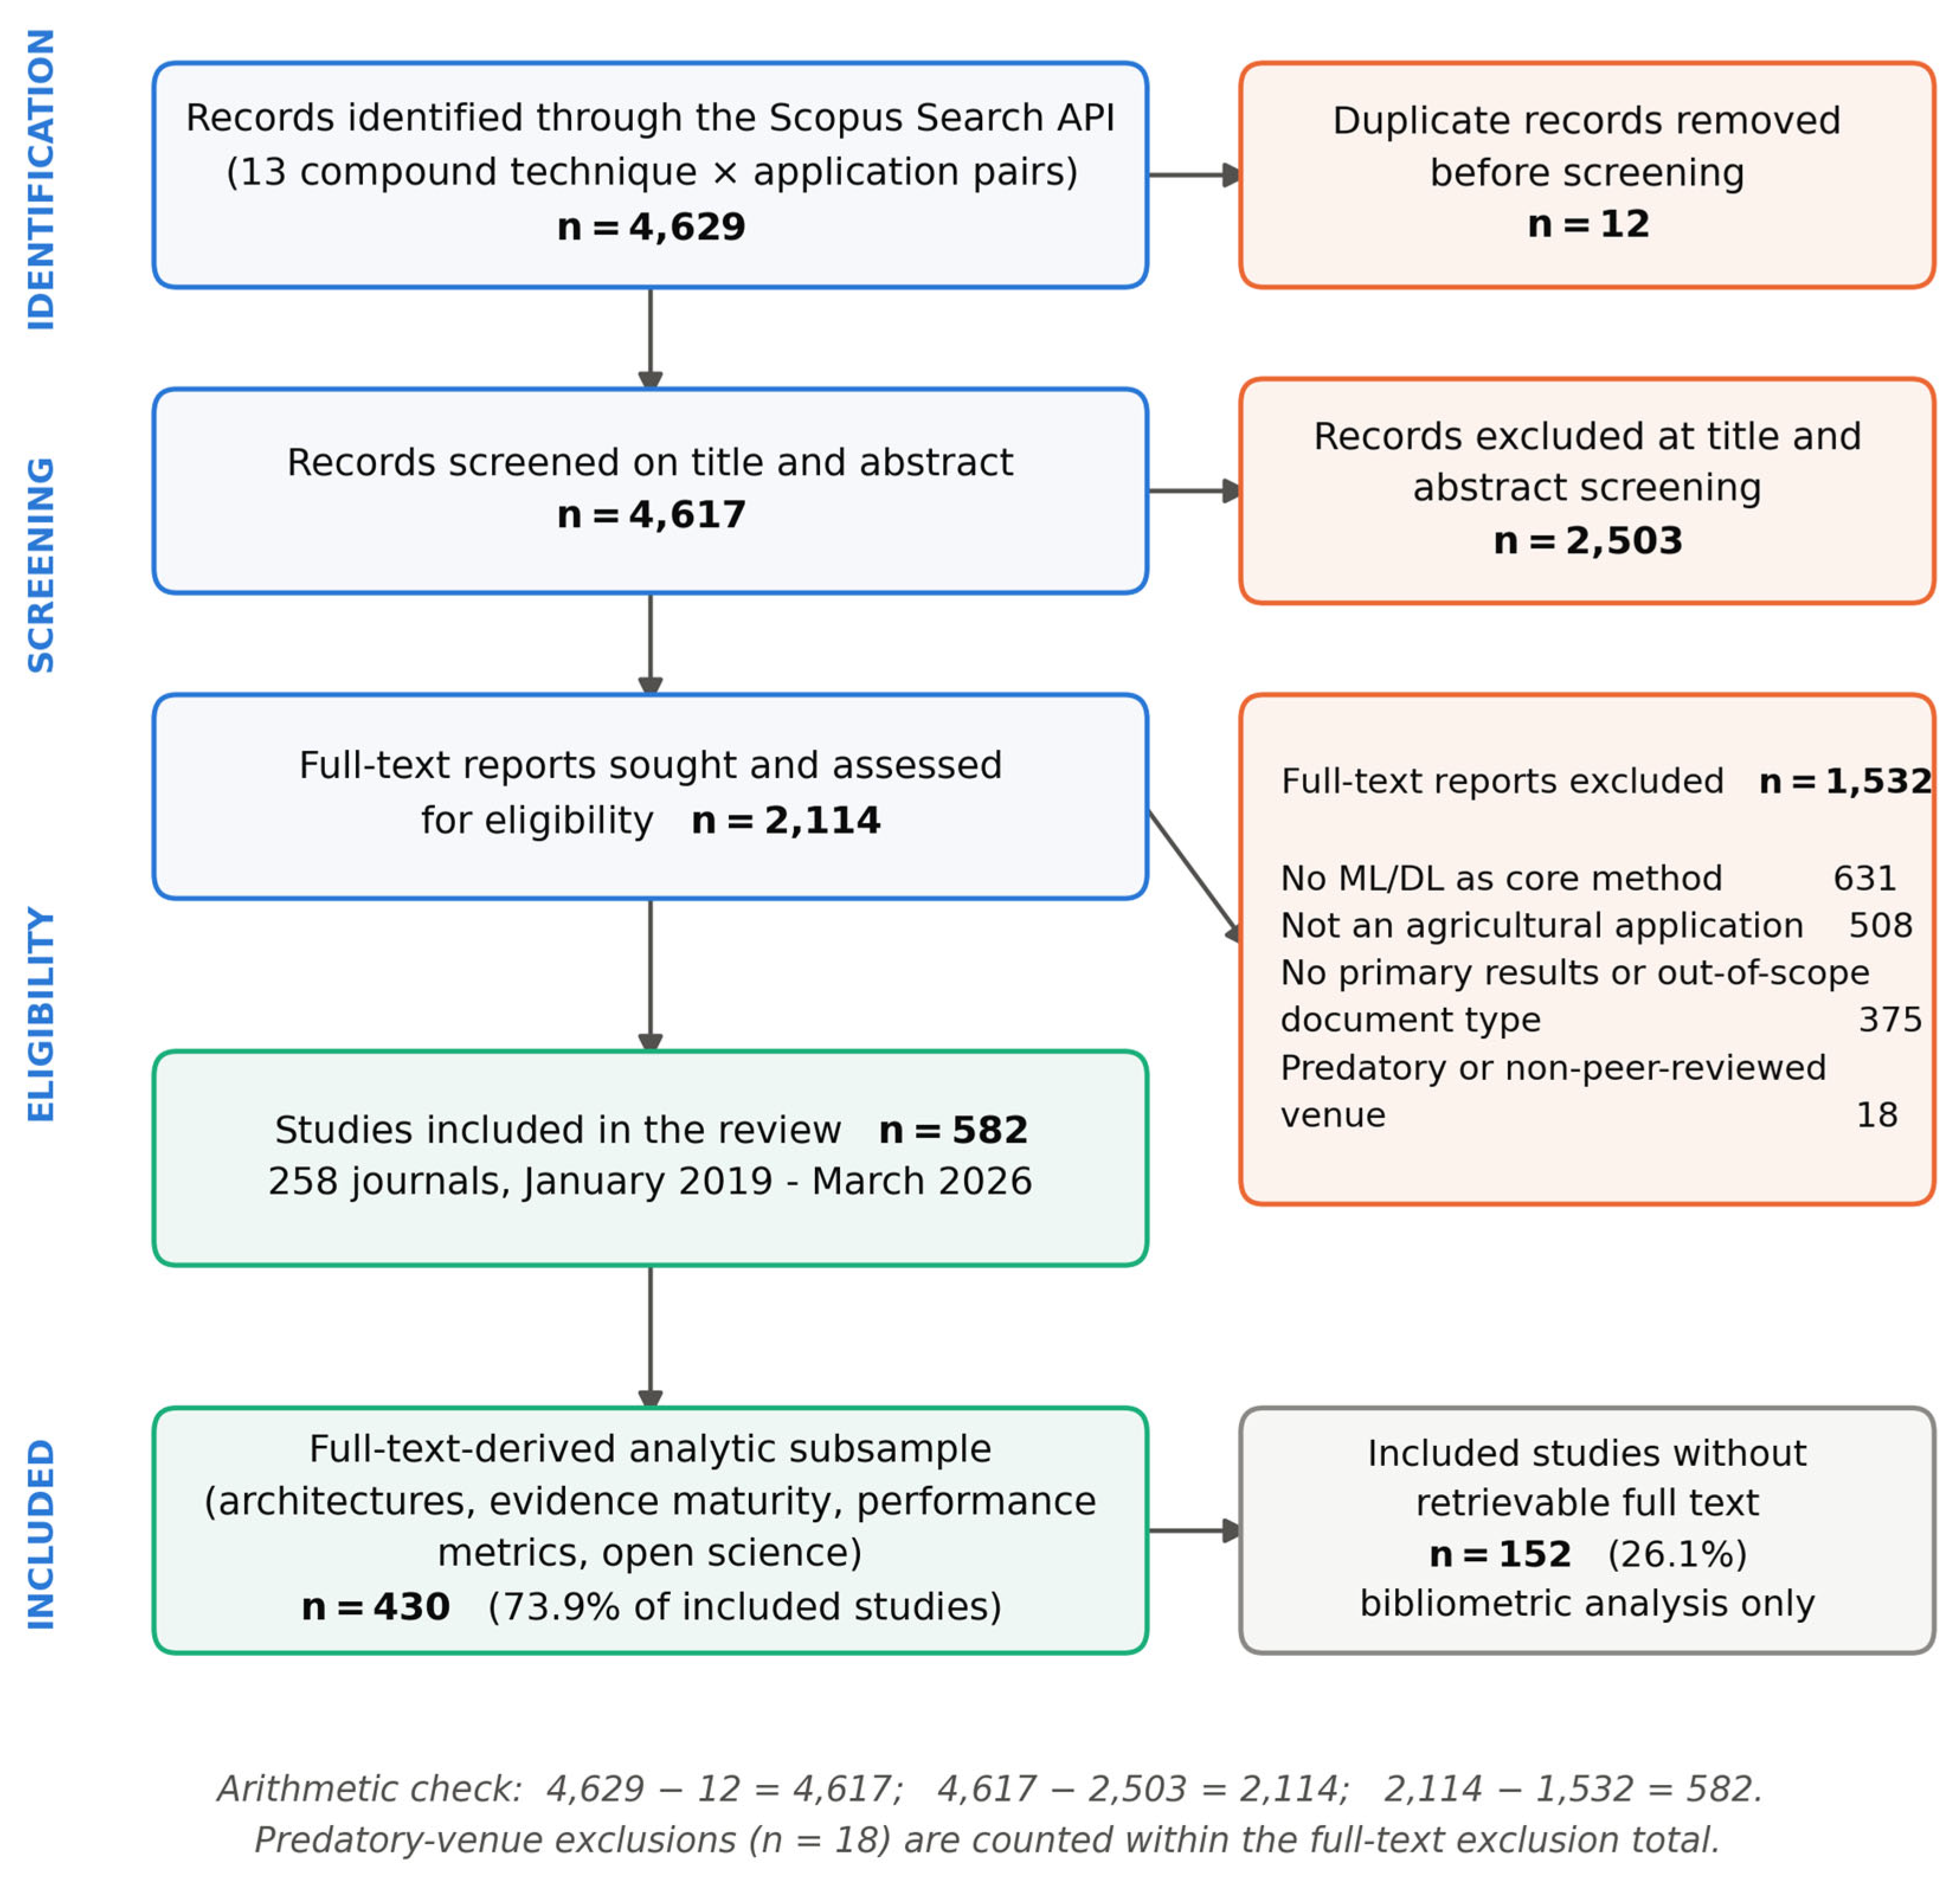
Figure 2.
Growth of the corpus. (a) Annual publication volume; the 2026 bar is shaded to mark a partial year. (b) Cumulative publications on a logarithmic scale; a straight line on this scale indicates constant proportional growth. The near-linear trajectory from 2019 to 2025 confirms sustained exponential growth rather than a single step change.
Figure 2.
Growth of the corpus. (a) Annual publication volume; the 2026 bar is shaded to mark a partial year. (b) Cumulative publications on a logarithmic scale; a straight line on this scale indicates constant proportional growth. The near-linear trajectory from 2019 to 2025 confirms sustained exponential growth rather than a single step change.
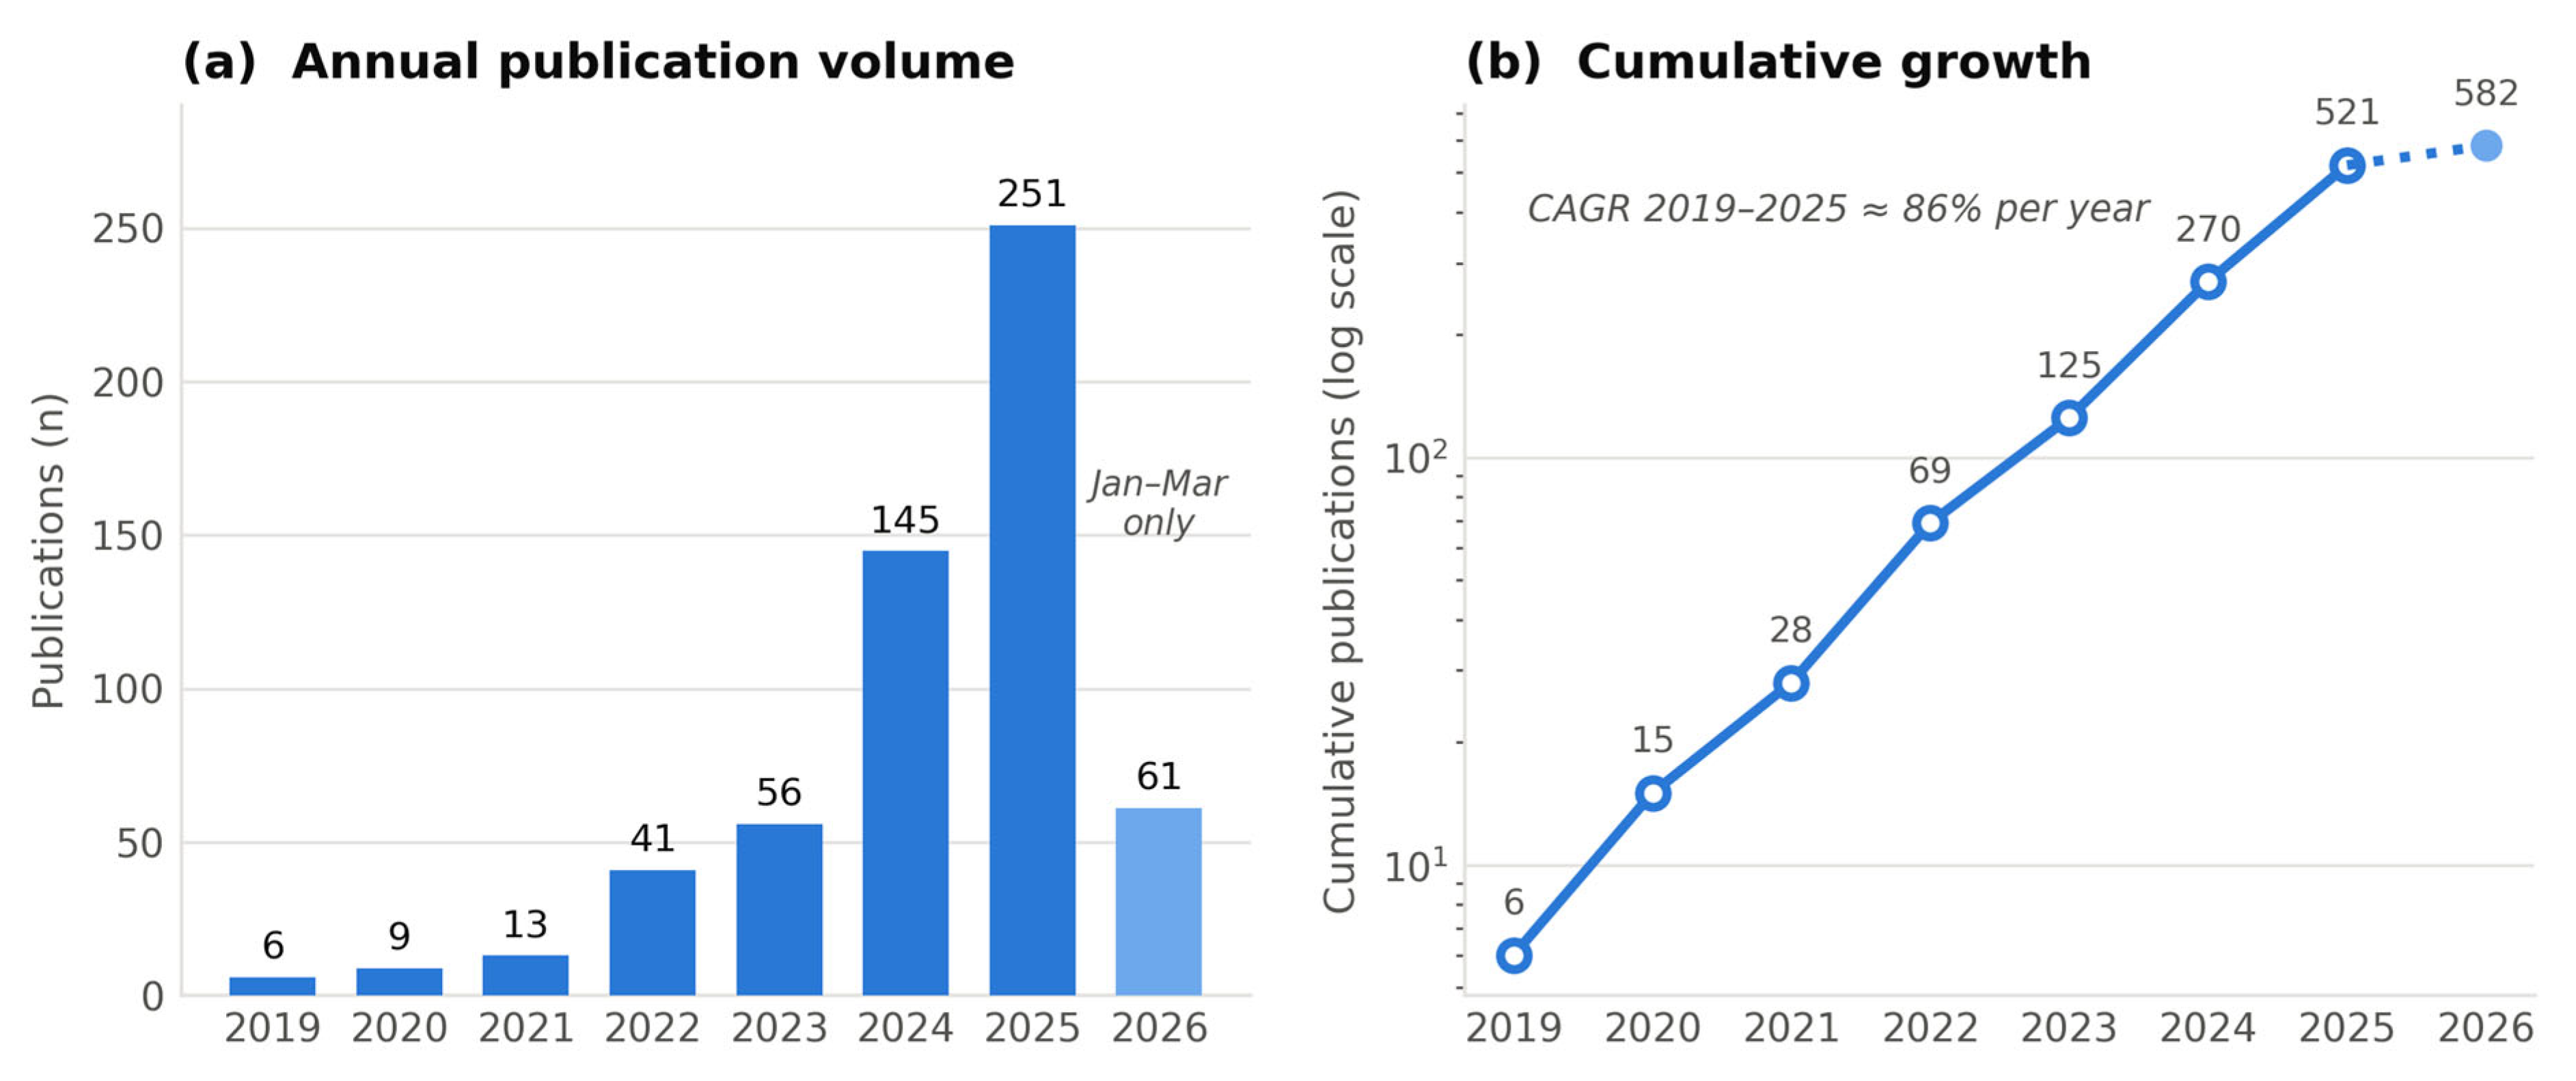
Figure 3.
Geographic concentration and the equity gap. (a) Publications by first-author region, coloured by the region's dominant Global North/South class. (b) Each region's share of ML/DL publications set against its approximate share of the global undernourished population. The two Asian regions that dominate output diverge sharply from one another on hunger burden, while Sub-Saharan Africa produces 1.5% of the literature against roughly 30% of the burden.
Figure 3.
Geographic concentration and the equity gap. (a) Publications by first-author region, coloured by the region's dominant Global North/South class. (b) Each region's share of ML/DL publications set against its approximate share of the global undernourished population. The two Asian regions that dominate output diverge sharply from one another on hunger burden, while Sub-Saharan Africa produces 1.5% of the literature against roughly 30% of the burden.
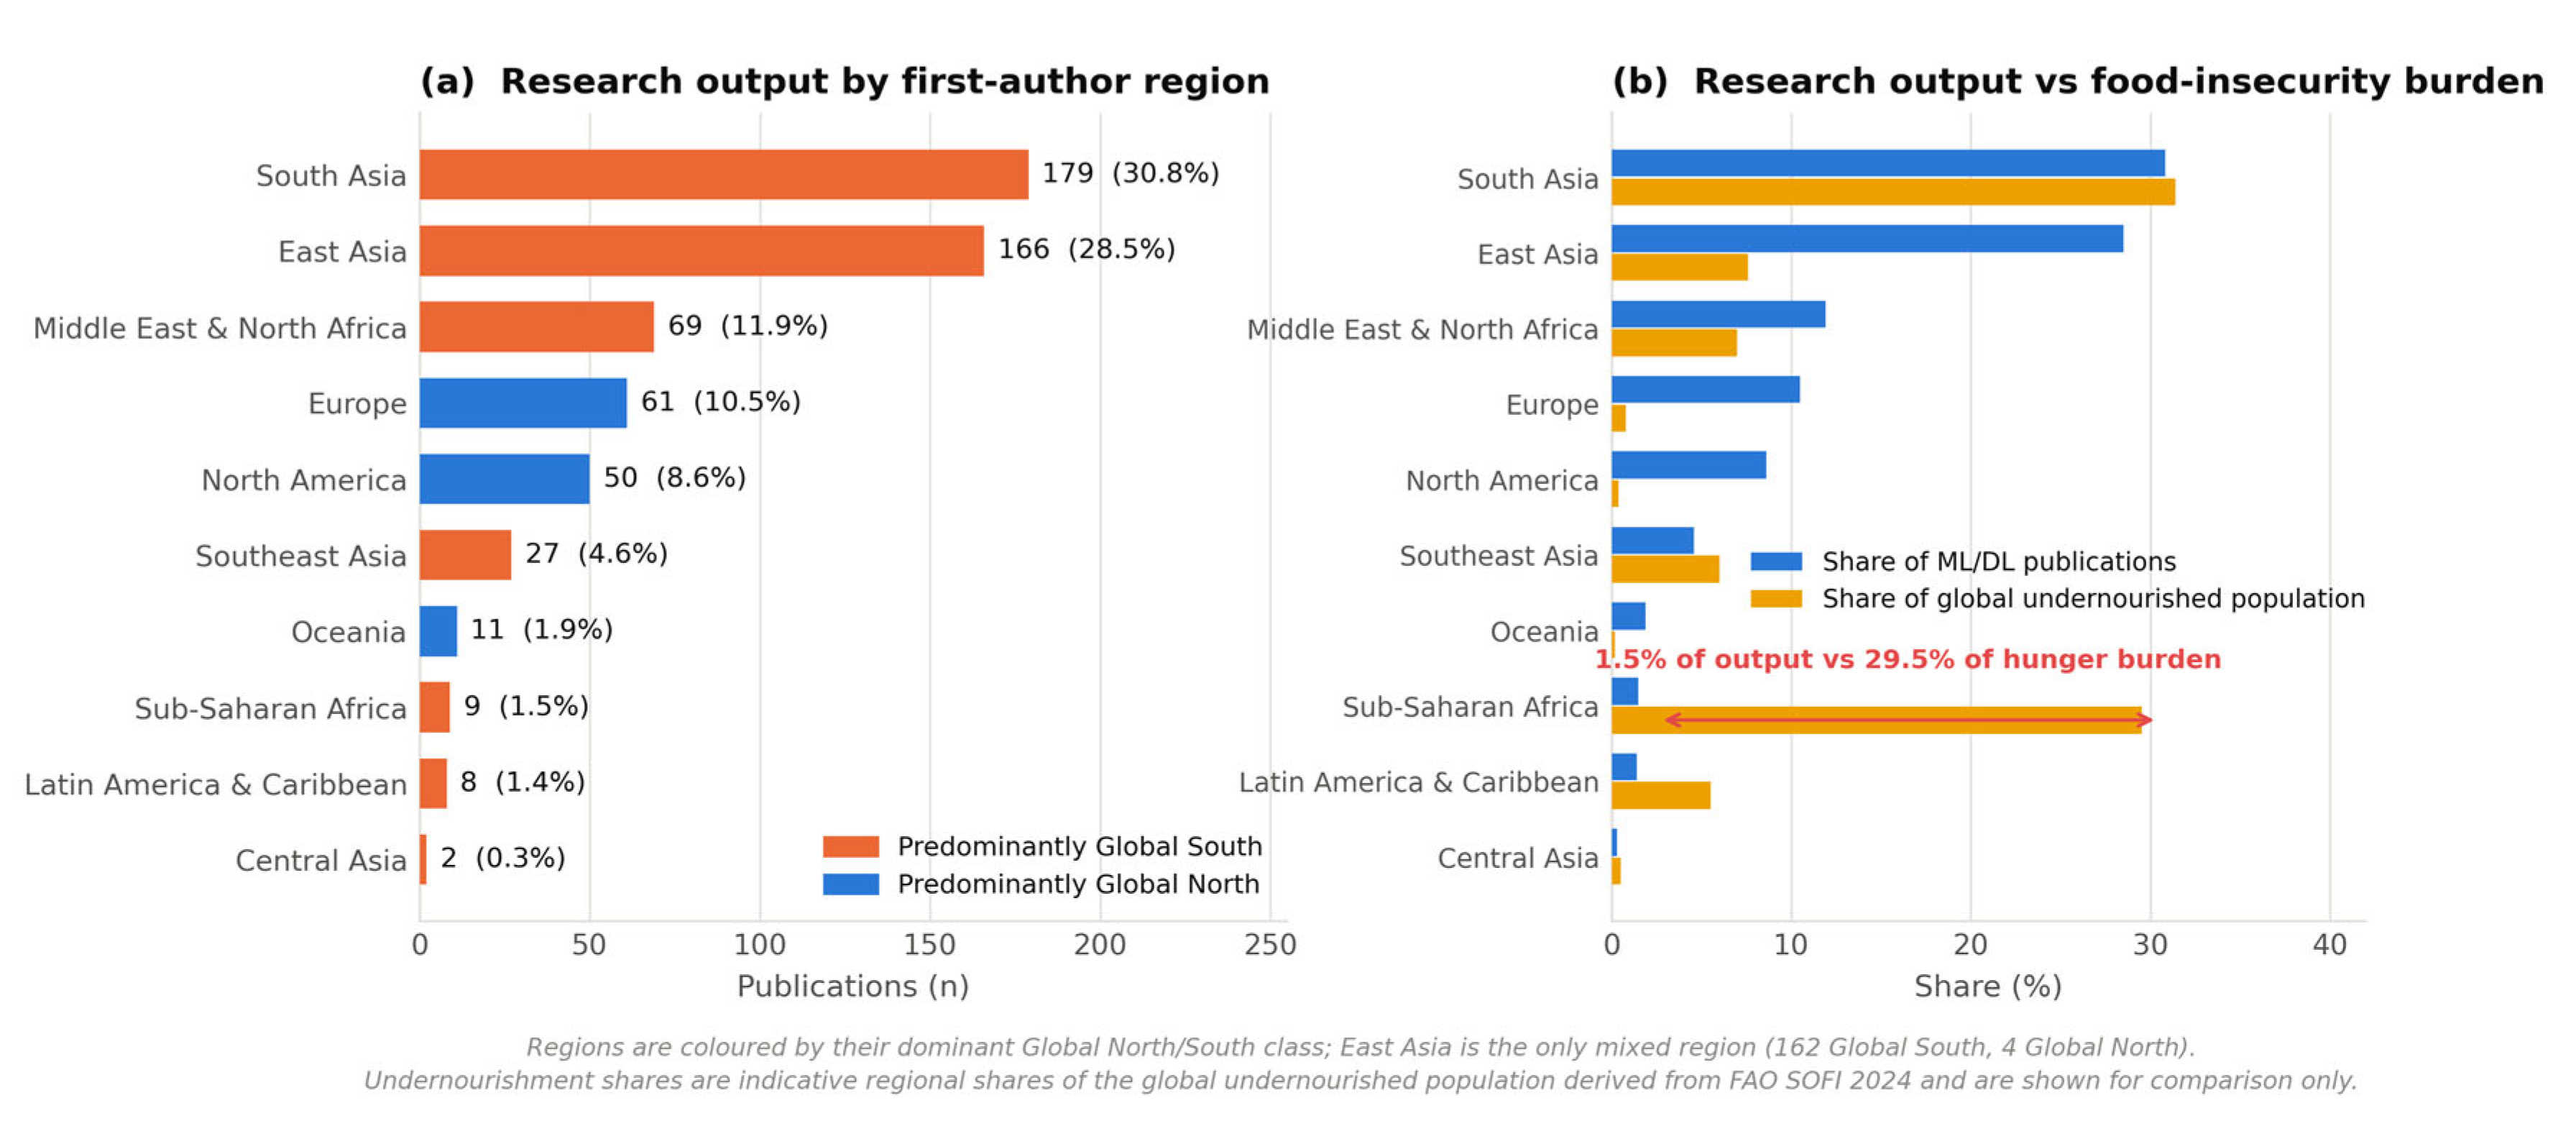
Figure 4.
The architecture landscape. (a) The sixteen most frequently employed architectures, coloured by family. (b) Adoption trajectories for the three broad paradigms as a share of that year's full-text papers; sample sizes are given beneath each year and the shaded band marks the partial 2026 quarter. Transformer adoption rises monotonically while CNN backbones plateau at a high level and classical methods hold a stable share.
Figure 4.
The architecture landscape. (a) The sixteen most frequently employed architectures, coloured by family. (b) Adoption trajectories for the three broad paradigms as a share of that year's full-text papers; sample sizes are given beneath each year and the shaded band marks the partial 2026 quarter. Transformer adoption rises monotonically while CNN backbones plateau at a high level and classical methods hold a stable share.
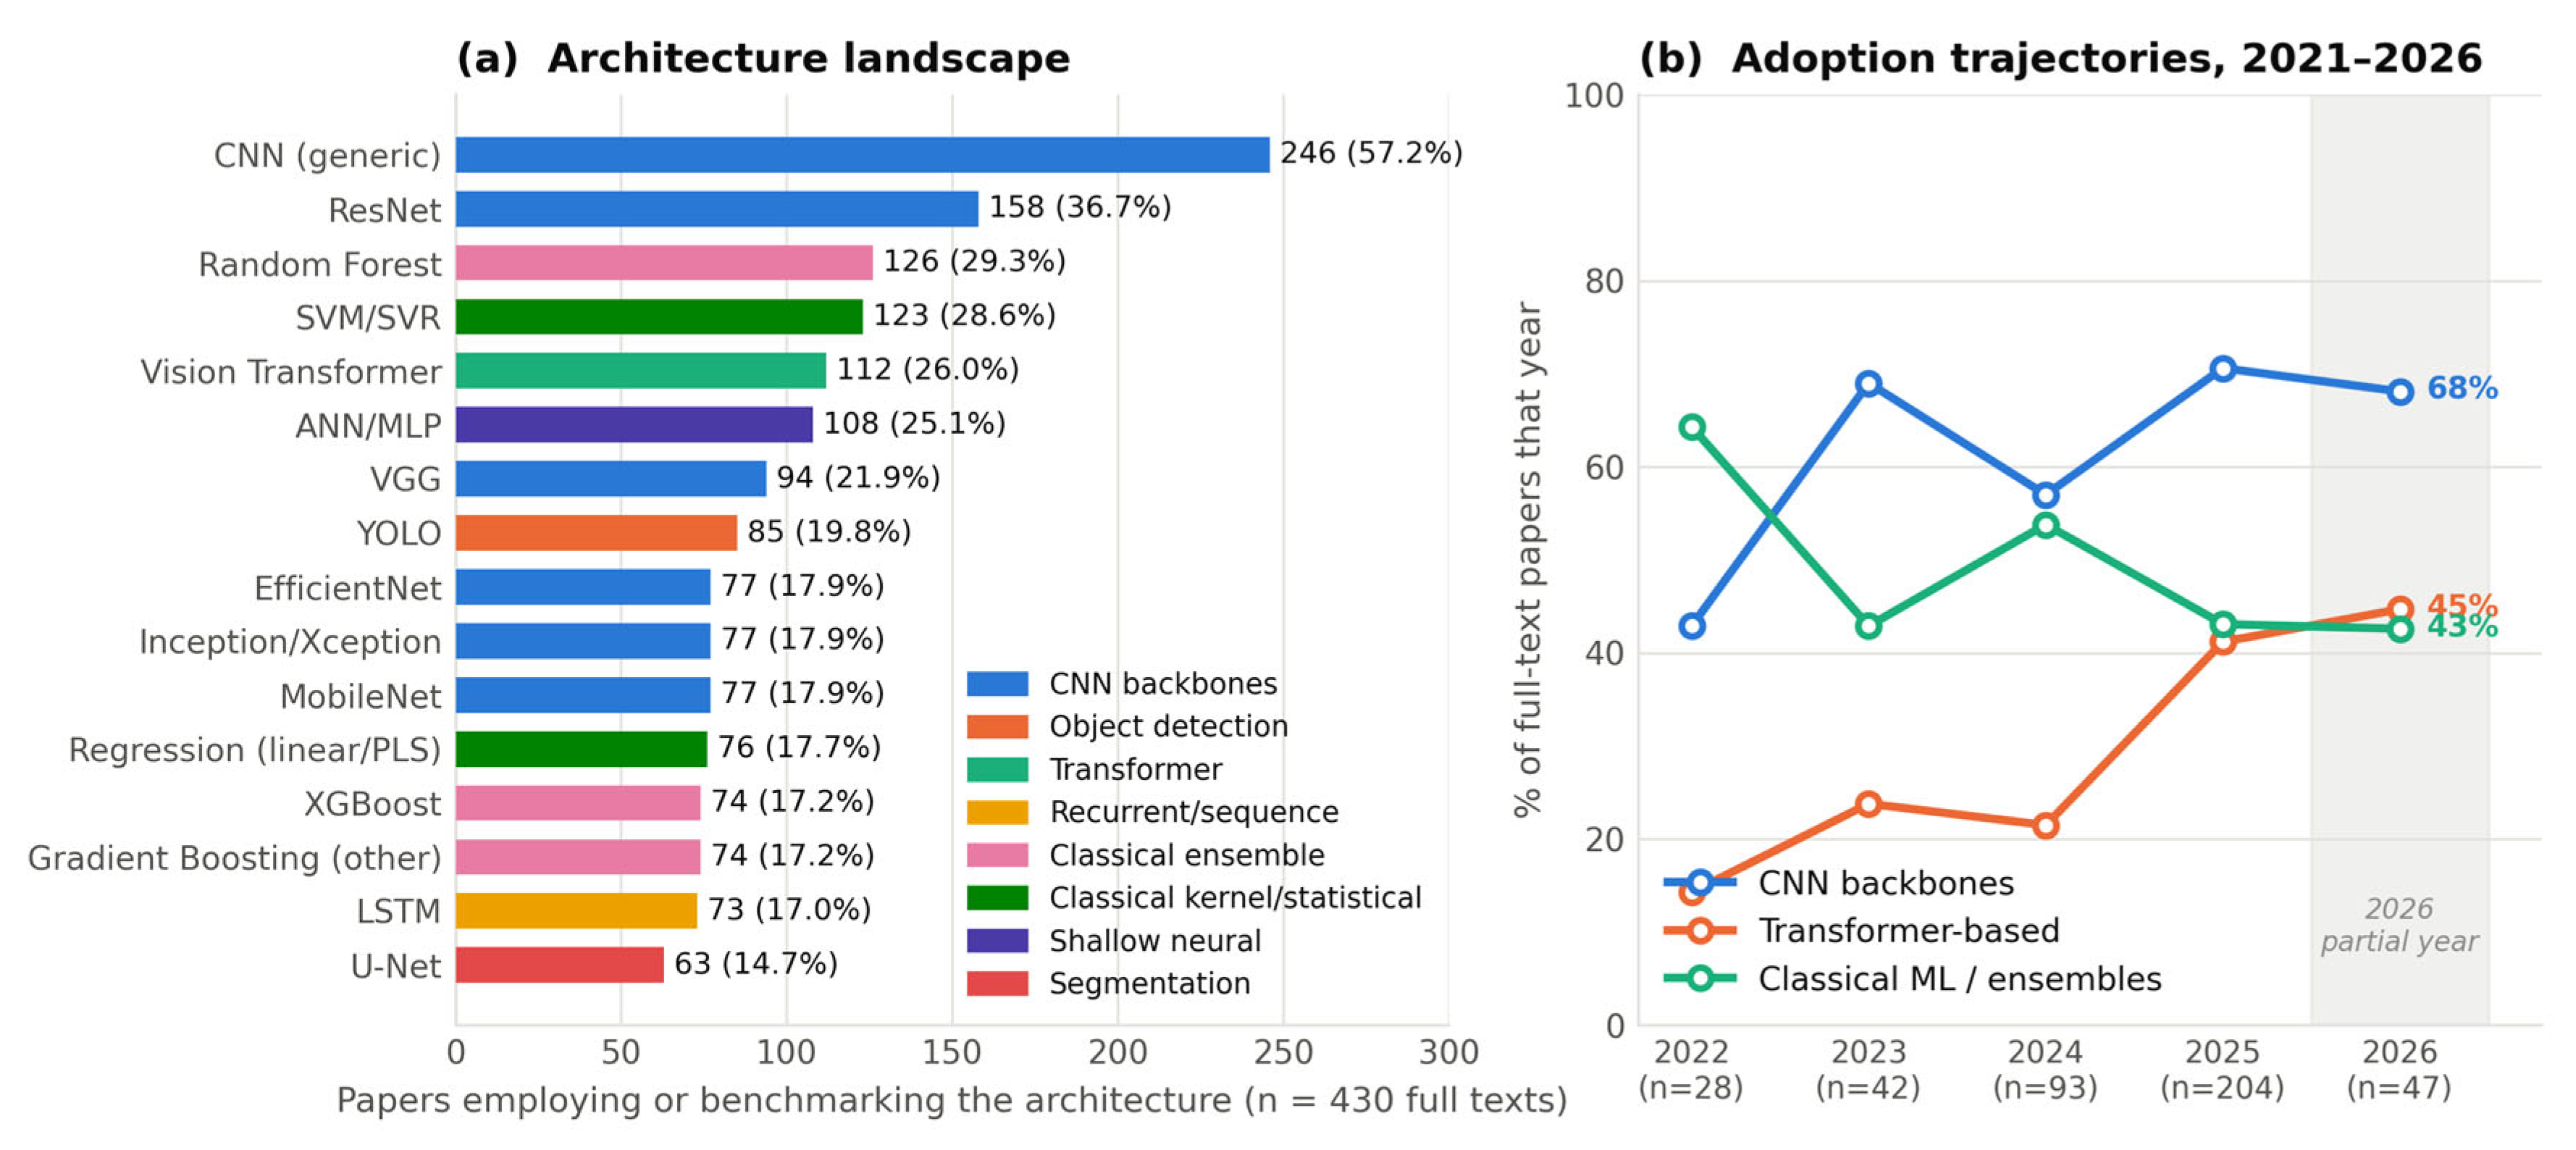
Figure 5.
Reported accuracy conditioned on evidence context. (a) By training and evaluation data regime. (b) By evidence-maturity level. Boxes show median and interquartile range, whiskers the 1.5×IQR range, and points every individual study. Studies evaluated on their own field data report systematically lower accuracy than studies evaluated on public benchmarks.
Figure 5.
Reported accuracy conditioned on evidence context. (a) By training and evaluation data regime. (b) By evidence-maturity level. Boxes show median and interquartile range, whiskers the 1.5×IQR range, and points every individual study. Studies evaluated on their own field data report systematically lower accuracy than studies evaluated on public benchmarks.
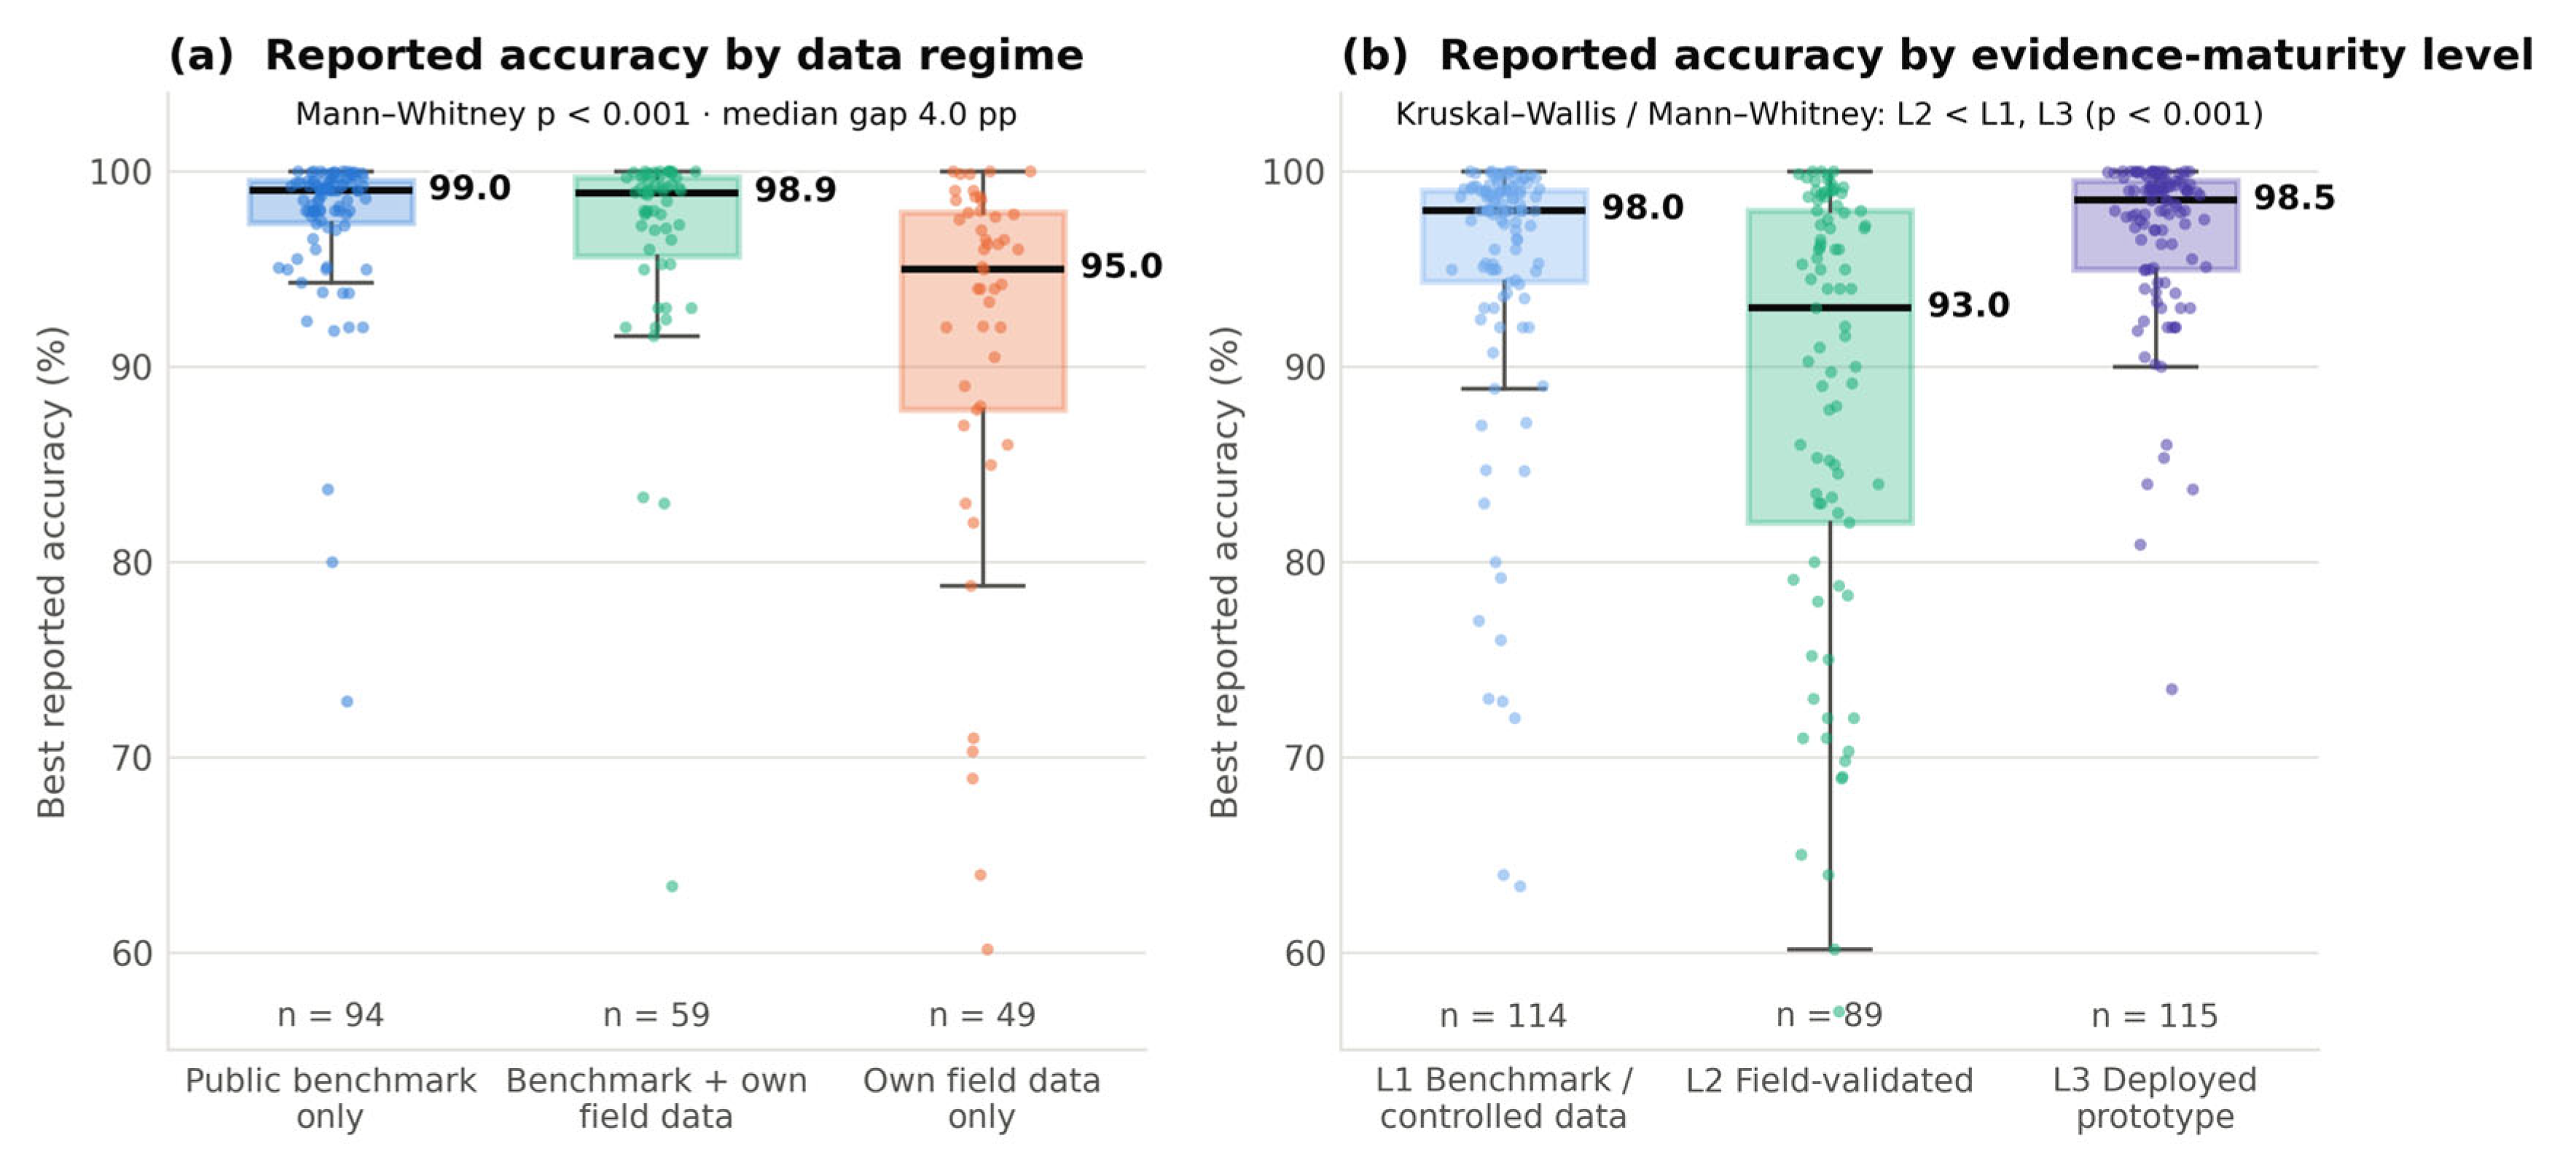
Figure 6.
Open science practice. (a) Full distribution of data- and code-availability categories; the code bar is dominated by the absence of any statement. (b) Yearly trend in the two headline rates, restricted to years with at least nine full texts.
Figure 6.
Open science practice. (a) Full distribution of data- and code-availability categories; the code bar is dominated by the absence of any statement. (b) Yearly trend in the two headline rates, restricted to years with at least nine full texts.
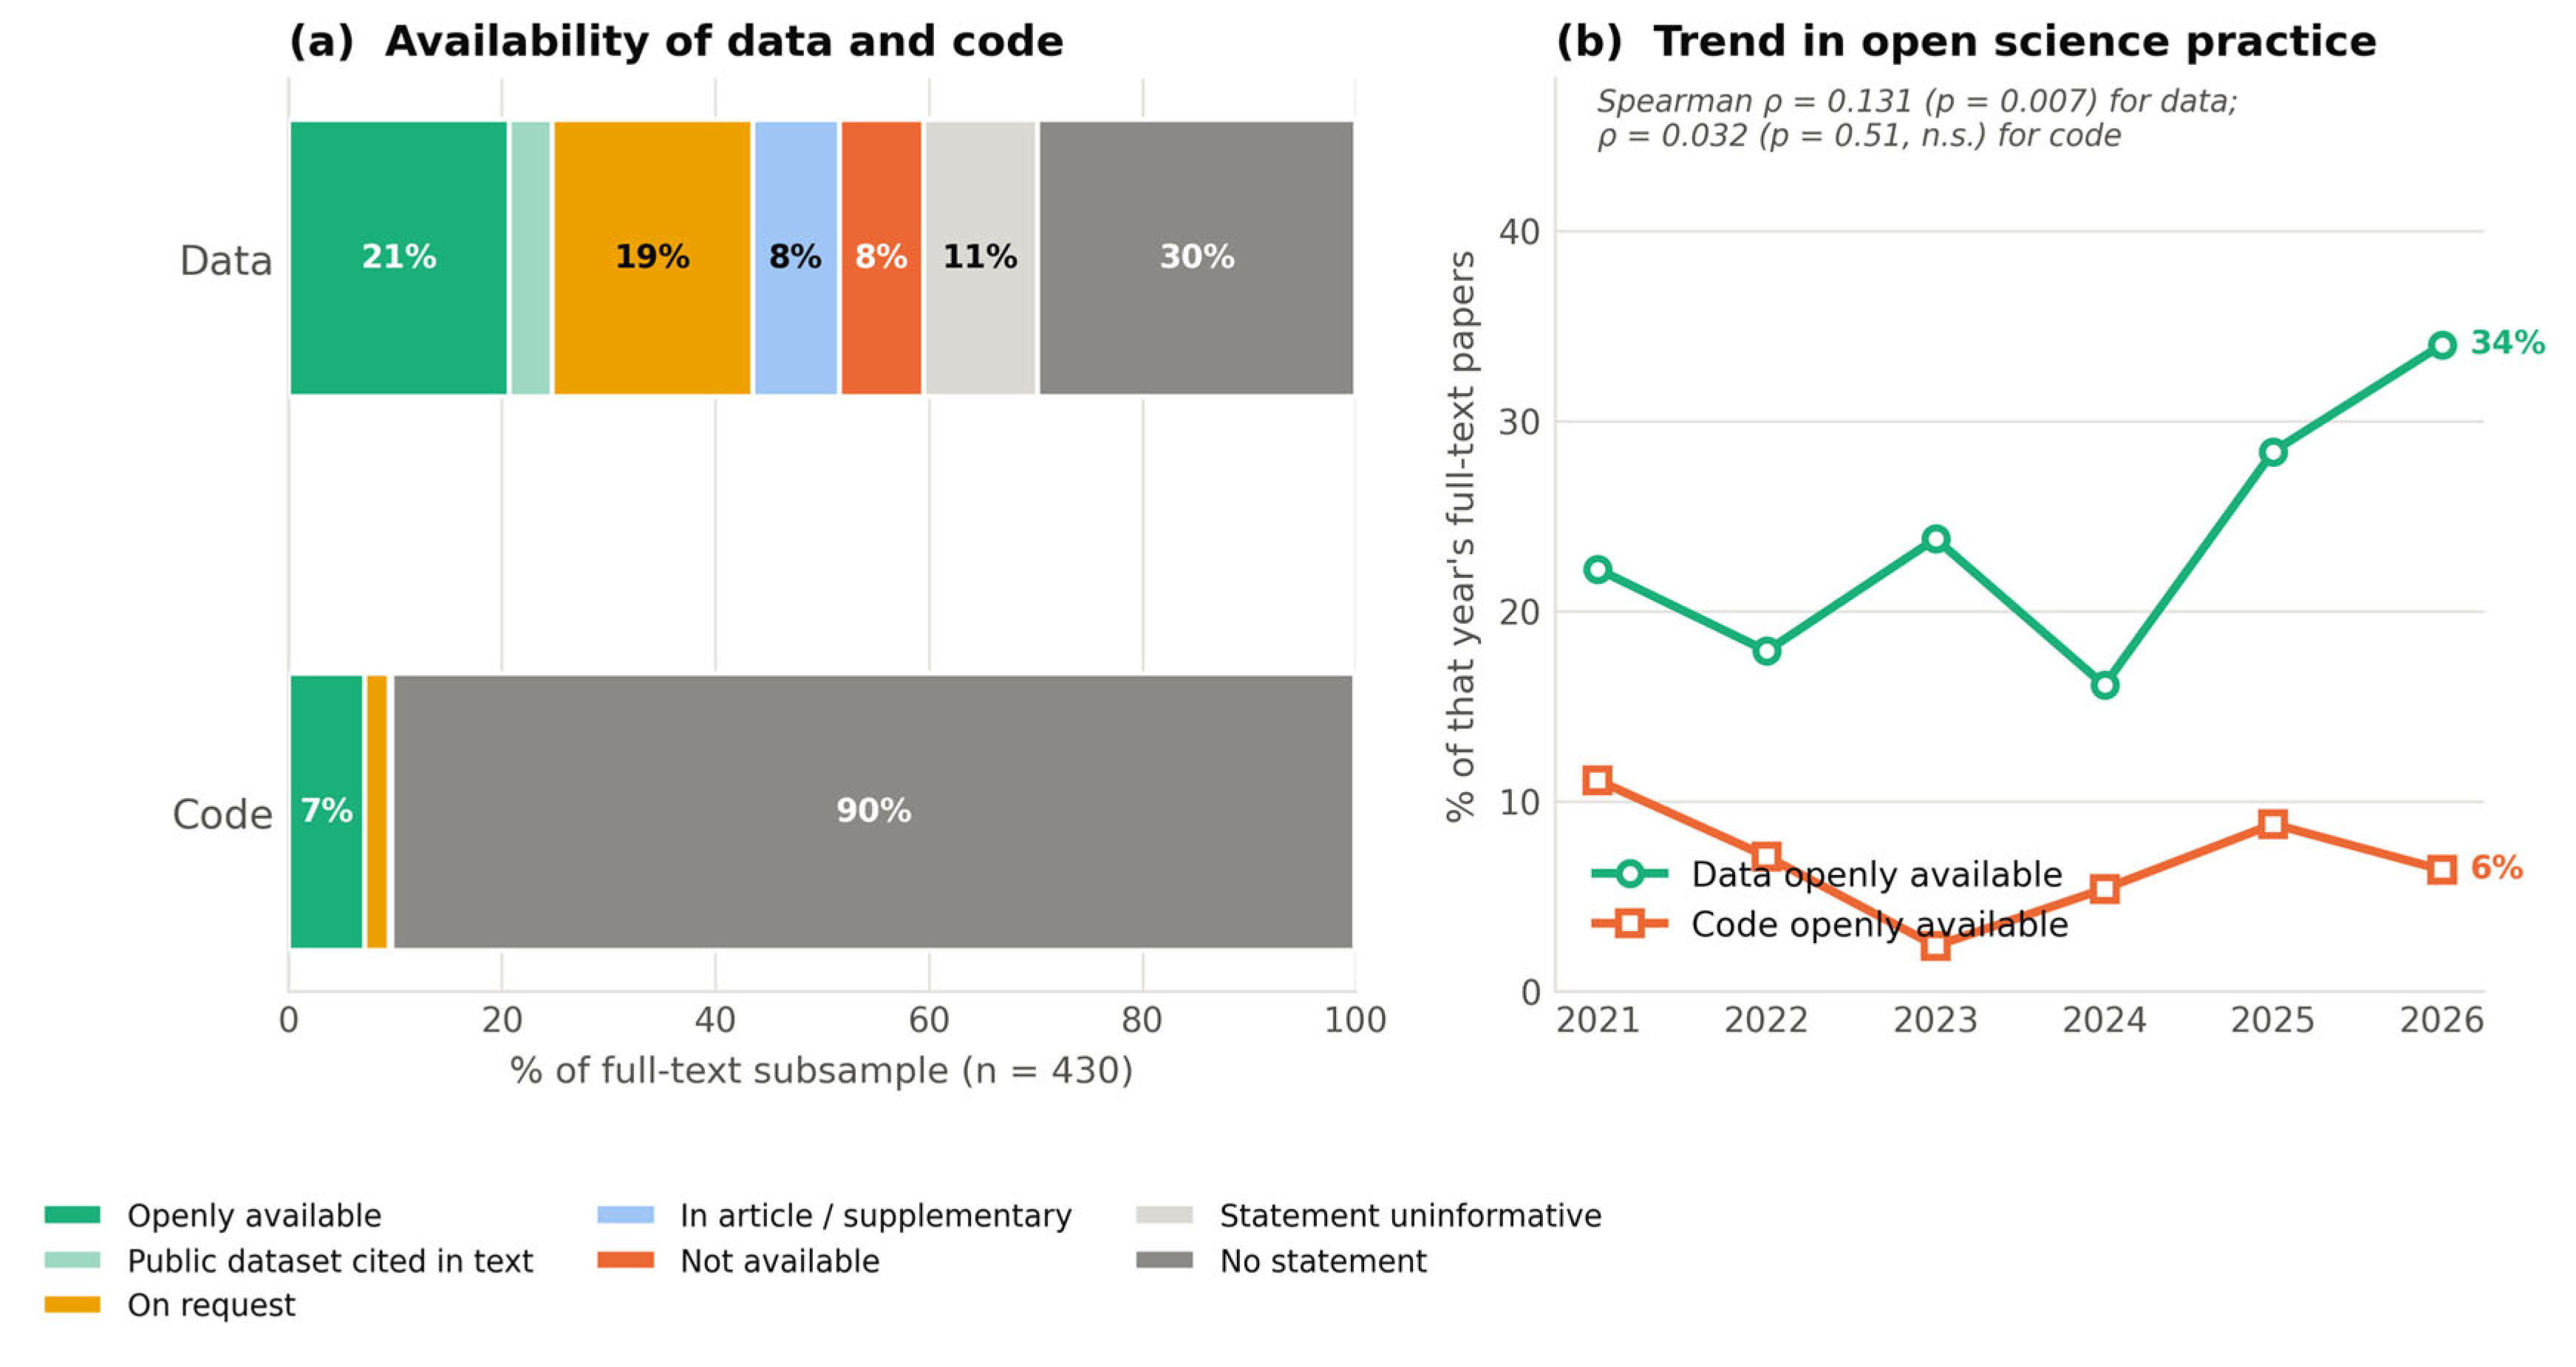
Figure 7.
Treemap of the domain taxonomy, with tile area proportional to the number of studies and colour denoting the macro-area. The concentration of the field in two domains is immediately visible, as is the small residual left unclassified.
Figure 7.
Treemap of the domain taxonomy, with tile area proportional to the number of studies and colour denoting the macro-area. The concentration of the field in two domains is immediately visible, as is the small residual left unclassified.
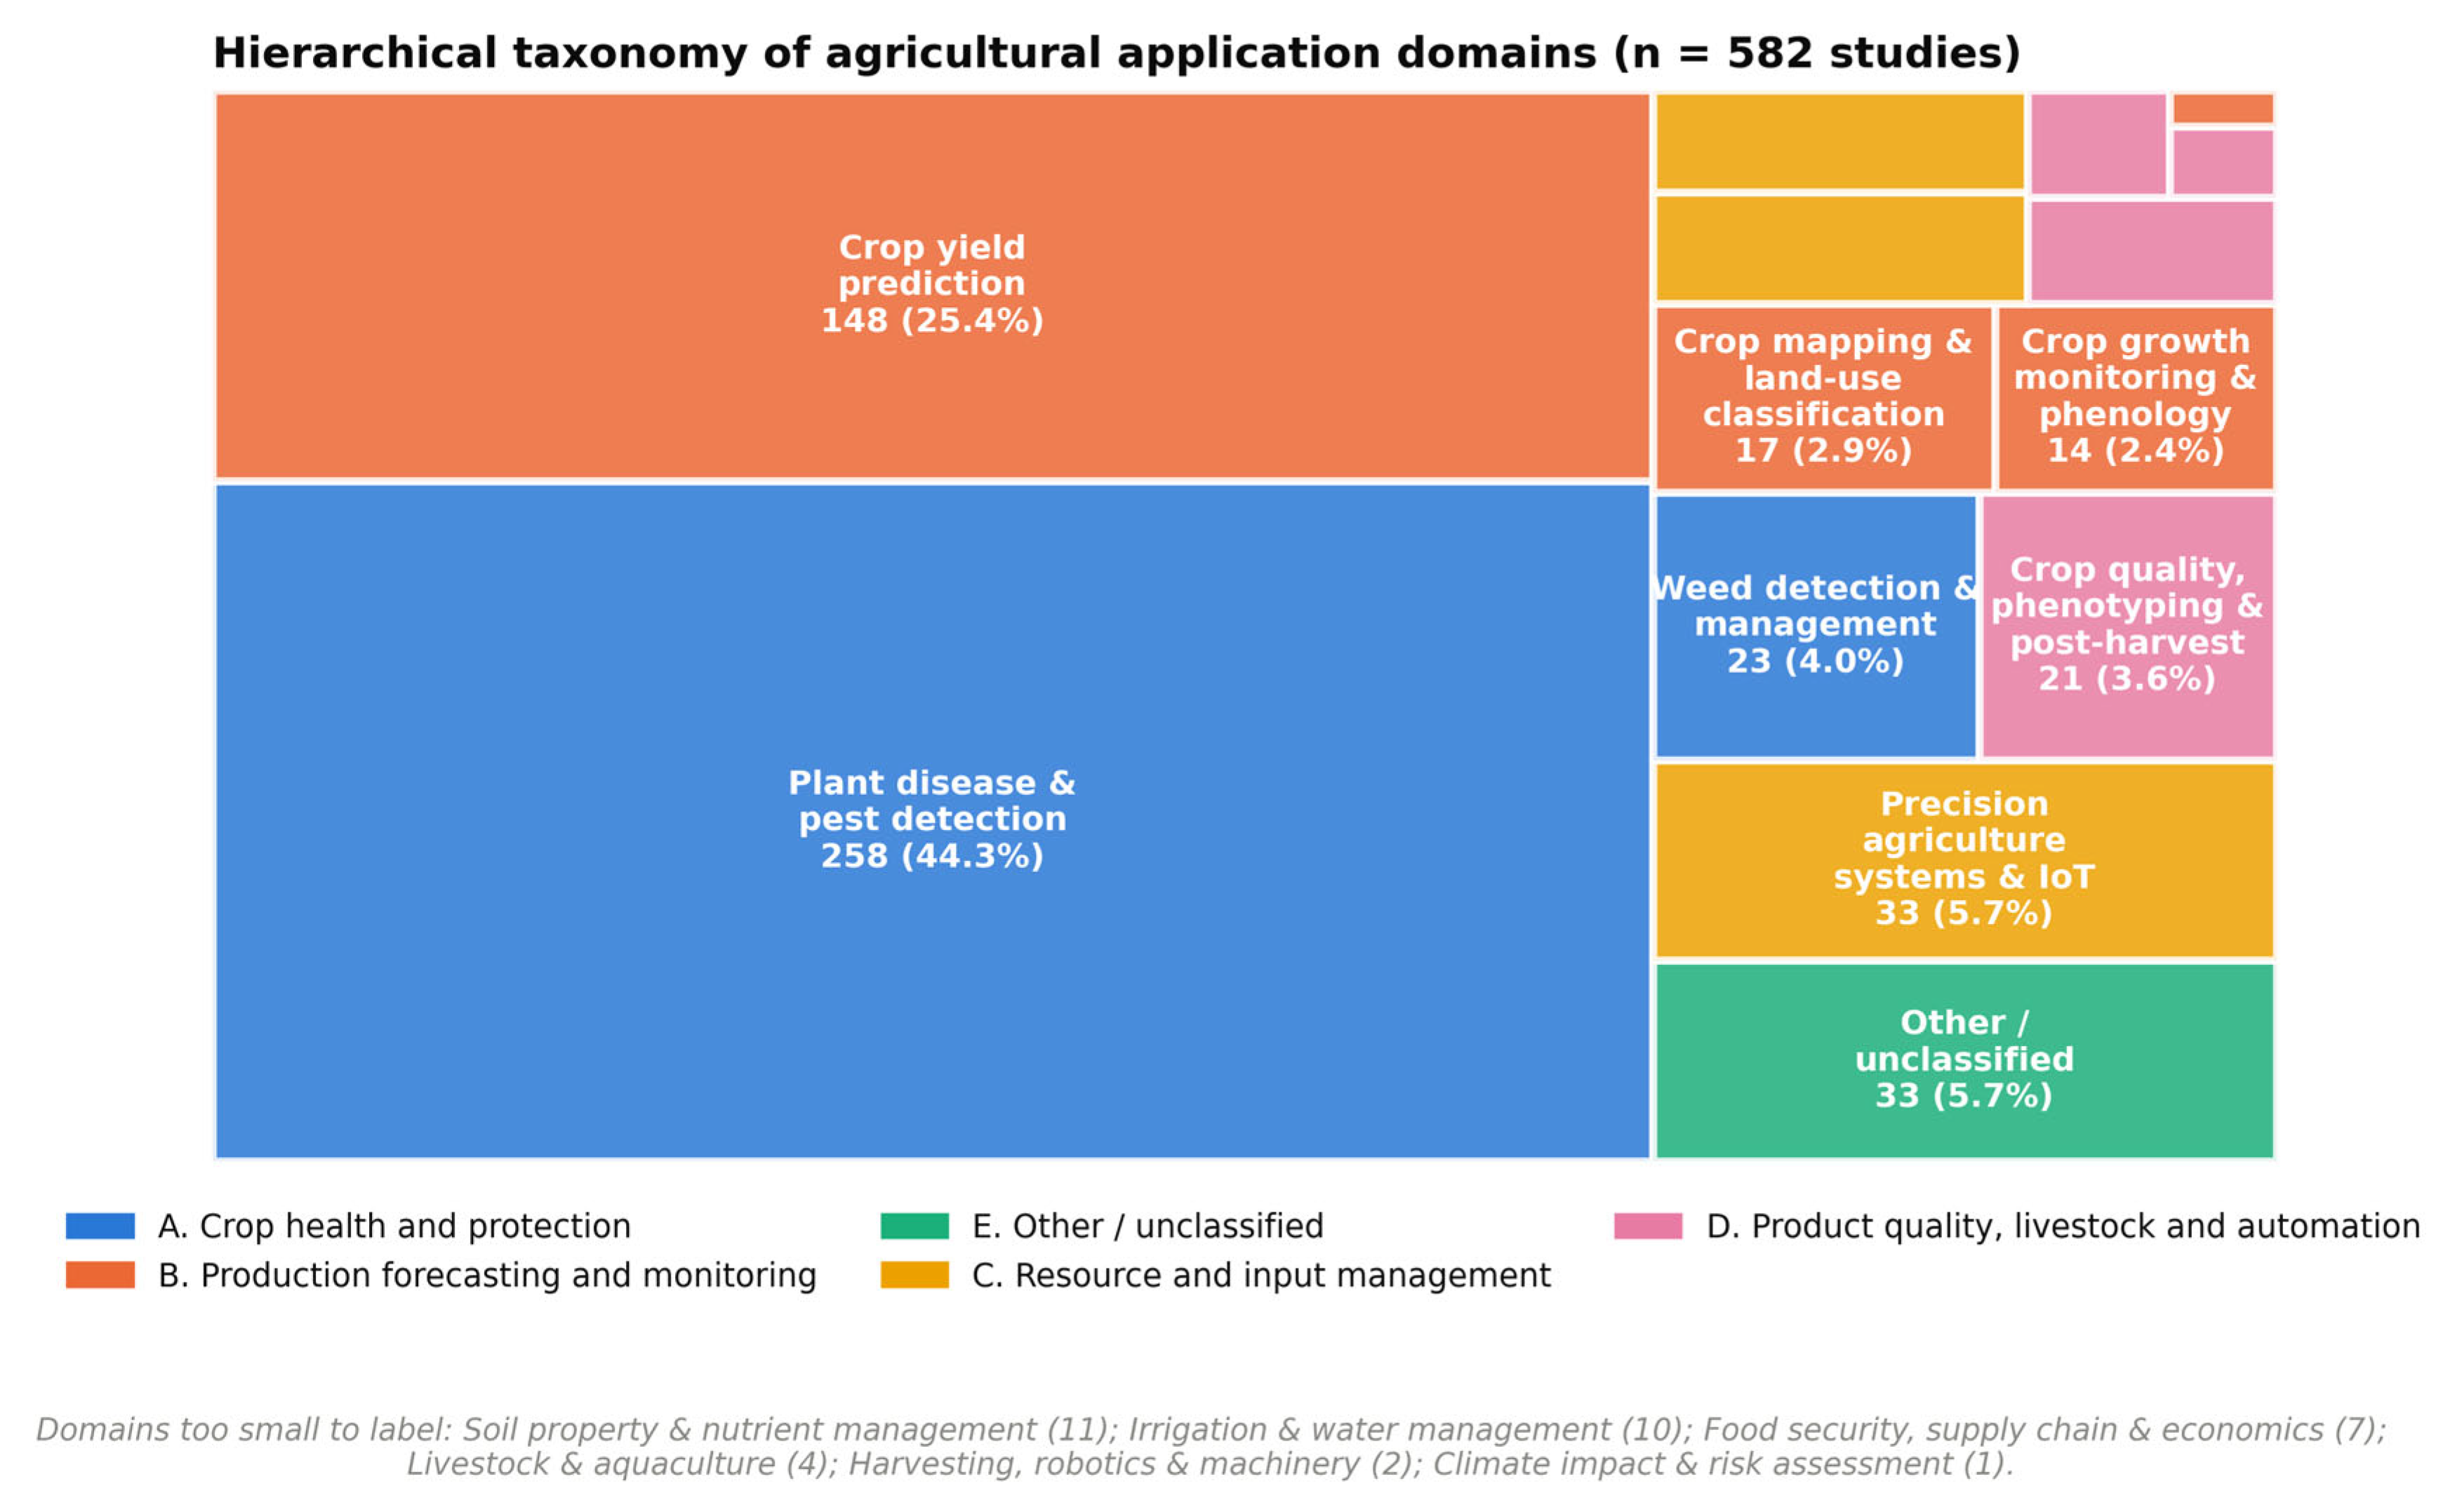
Figure 8.
(a) Evidence-maturity pyramid with the median reported accuracy attaching to each level. (b) Distribution of the 0–10 reproducibility index across the full-text subsample.
Figure 8.
(a) Evidence-maturity pyramid with the median reported accuracy attaching to each level. (b) Distribution of the 0–10 reproducibility index across the full-text subsample.
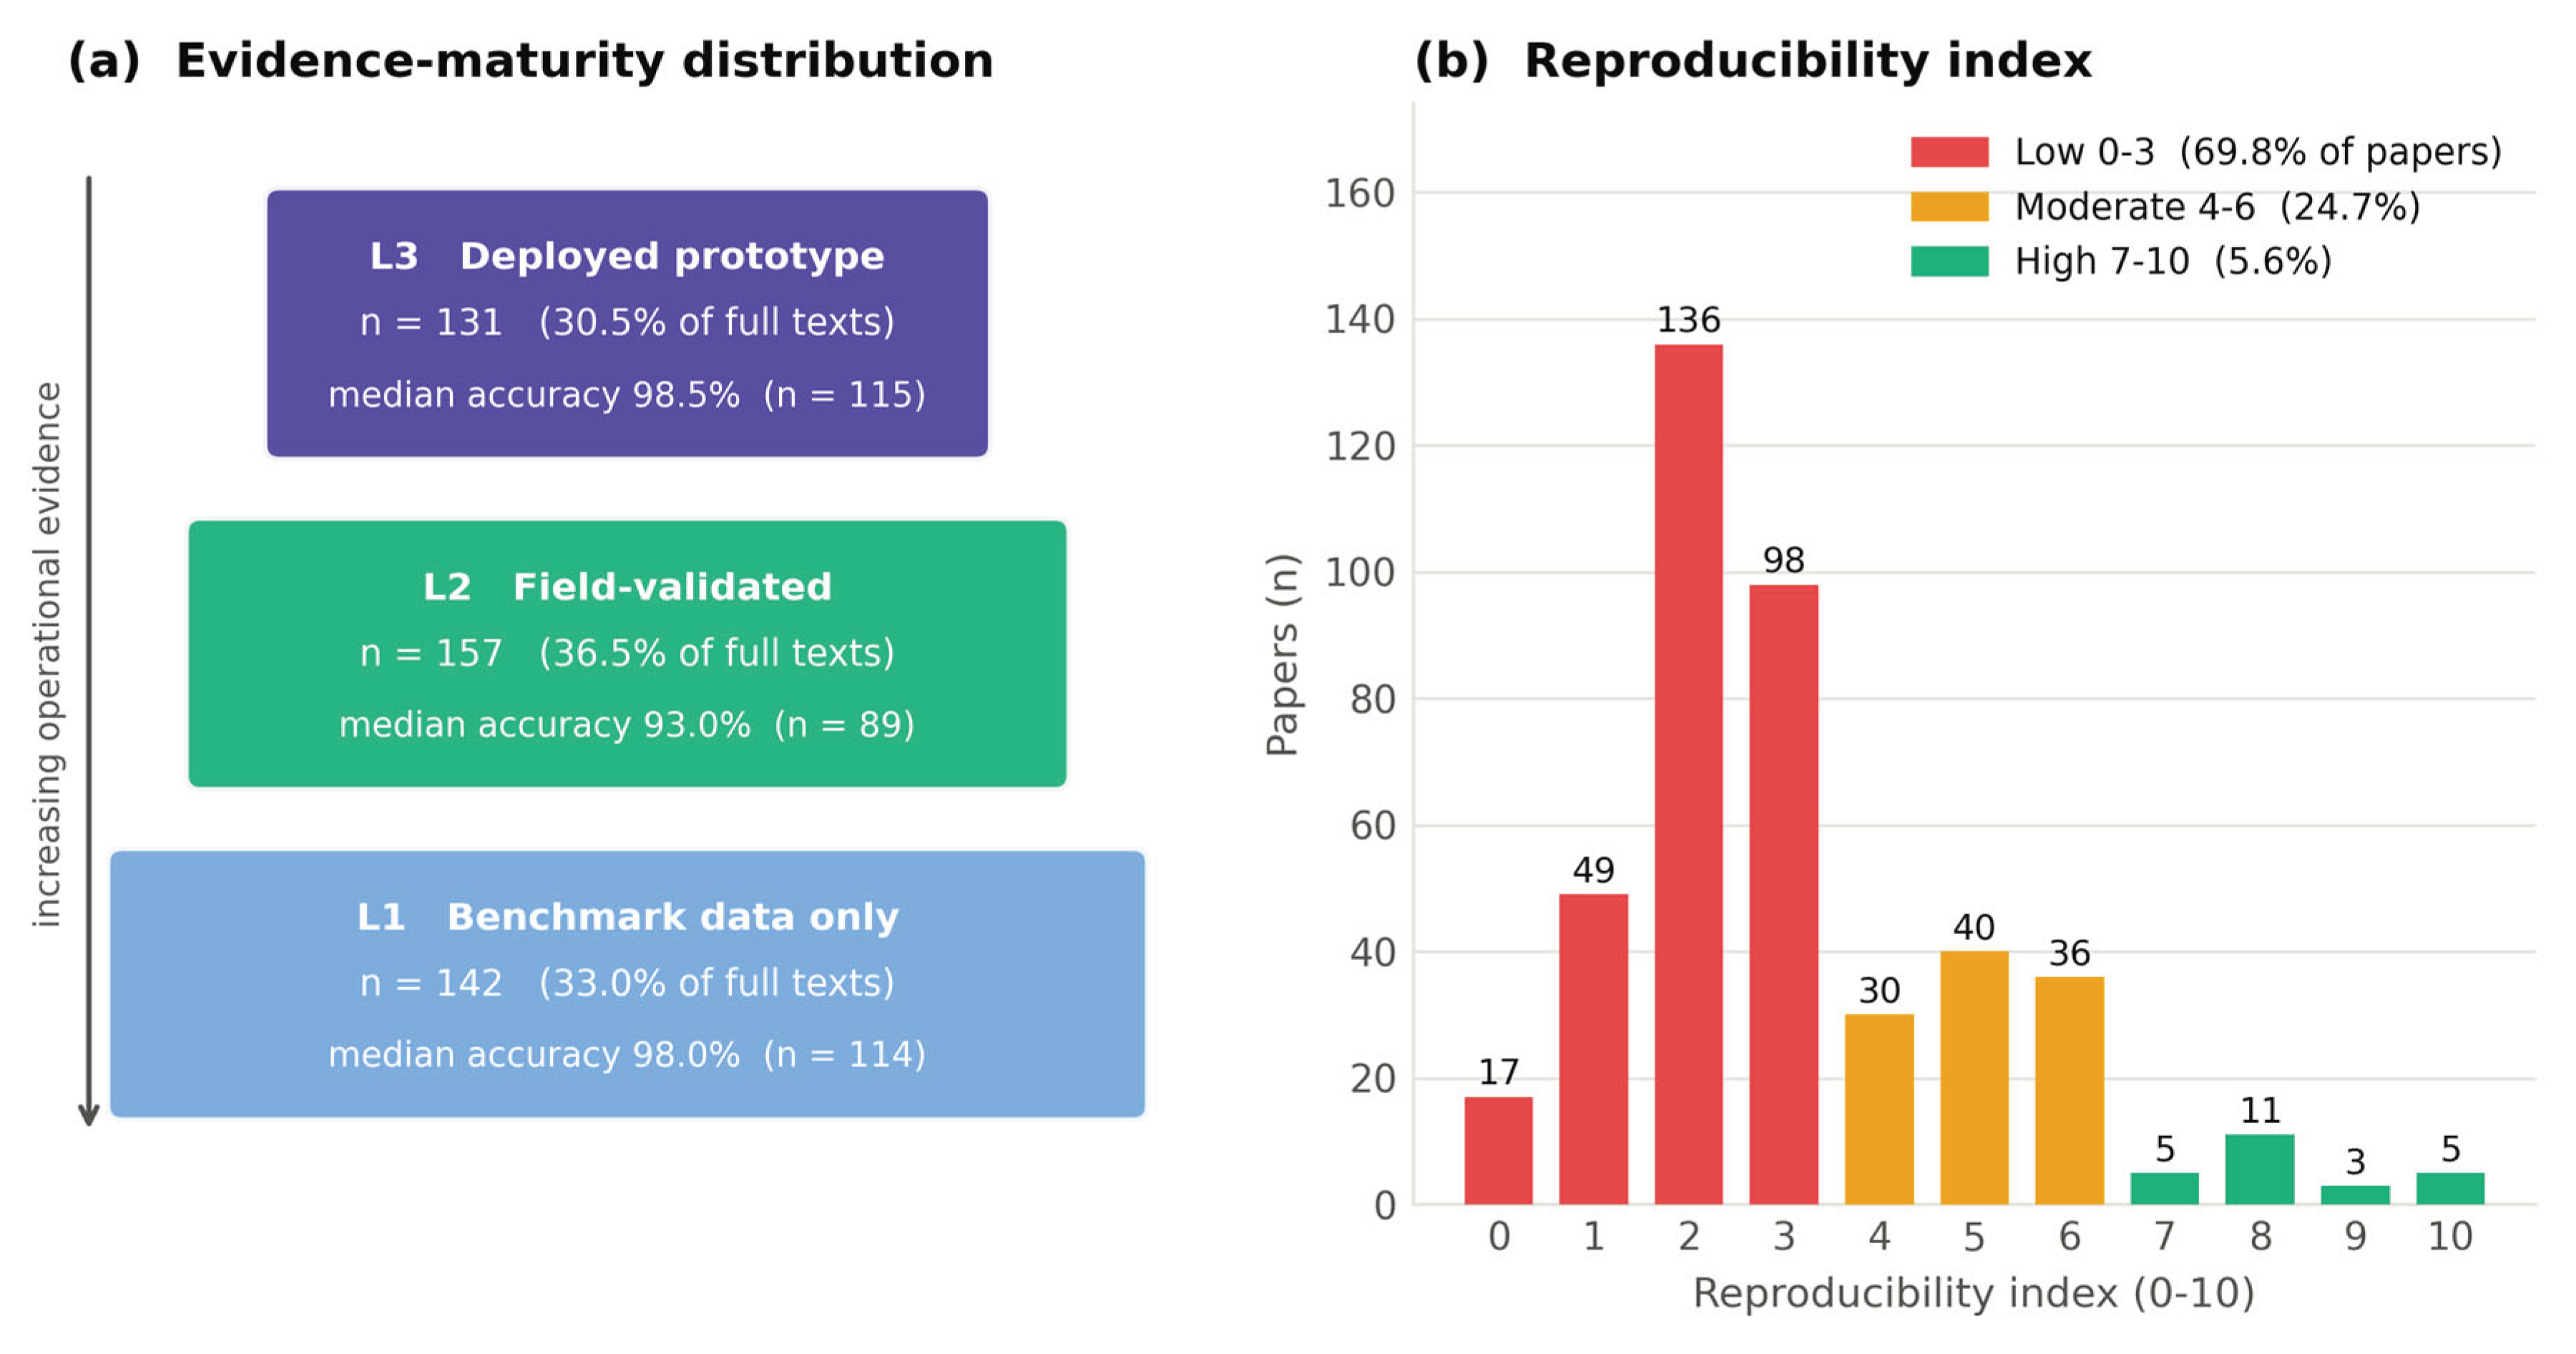
Figure 9.
A pipeline view of ML and DL in agriculture, annotated with the corresponding statistics from this review. The two bands beneath the pipeline quantify the deployment gap and the reproducibility gap that constitute the review's central findings.
Figure 9.
A pipeline view of ML and DL in agriculture, annotated with the corresponding statistics from this review. The two bands beneath the pipeline quantify the deployment gap and the reproducibility gap that constitute the review's central findings.
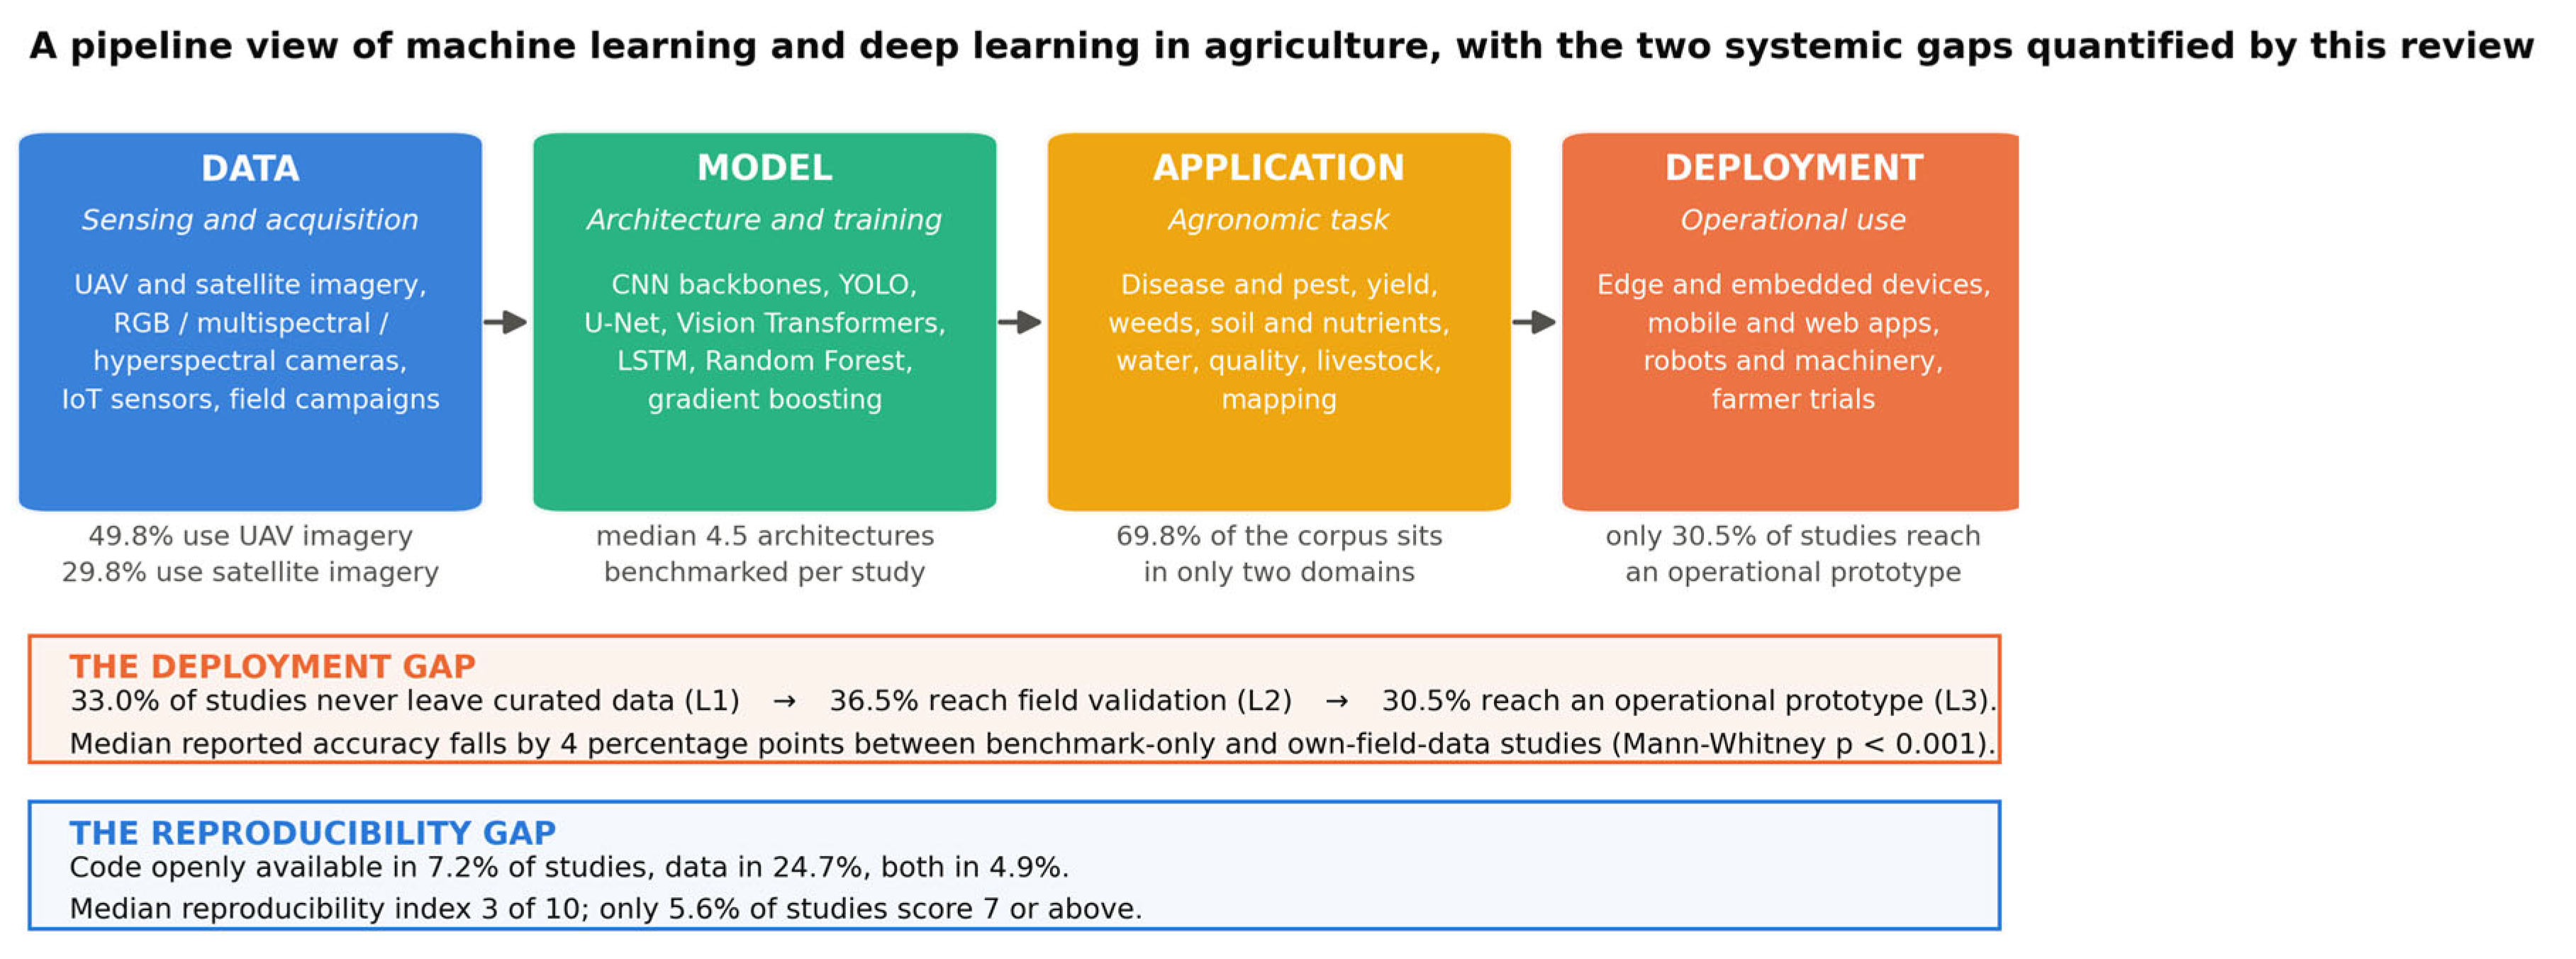
Table 1.
Inclusion and exclusion criteria applied at all screening stages.
| Criterion | Inclusion | Exclusion |
|---|---|---|
| Method | At least one ML/DL method as core approach (CNN, LSTM, Random Forest, XGBoost, Transformer, SVM, U-Net, ViT, GAN, etc.) | Pure physics or statistical models with no ML/DL component |
| Domain | Primary application in agriculture or closely related field (crop/livestock management, remote sensing for agriculture, climate adaptation in farming) | Non-agricultural applications (medical, industrial, general remote sensing without agricultural focus) |
| Publication type | Peer-reviewed journal articles and reviews (Scopus DOCTYPE "ar" or "re") | Conference papers, letters, editorials, preprints, book chapters |
| Language | English only | Non-English publications |
| Time window | January 2019 – March 2026 | Published before 2019 or after March 2026 |
| Content | Empirical studies with agricultural data or application | Purely theoretical papers without agricultural data or experimentation |
| Quality | Published in journals not on Beall's predatory list | Papers from predatory or questionable publishers (18 excluded) |
Papers from publishers on Beall's List of Predatory Journals and Publishers were excluded after full-text screening (n = 18). Studies were not excluded on the basis of geographic origin, sensor type, crop type or reported performance level.
Table 2.
Data extraction fields collected for each included study.
| Category | Fields extracted | Source |
|---|---|---|
| Bibliographic | DOI, title, authors, year, journal, citation count | Scopus API |
| Geographic | First-author country, geographic region (10 regions), Global North/South classification, FAO food-insecurity burden, study-area country | Scopus API + curated lookup |
| ML/DL architecture | Architectures employed (35 aggregated labels), architecture family, primary architecture, architectures cited but not employed, count of architectures benchmarked | Full text (abstract + methods + results) |
| Application domain | Primary and secondary domain (13-category taxonomy), macro-area, crops studied | Title + abstract (corpus-wide) and full text |
| Data sources | UAV, satellite platform (Sentinel/Landsat/MODIS/other), hyperspectral, multispectral, thermal, RGB, LiDAR, SAR, IoT, weather/climate, tabular | Full text |
| Benchmark datasets | PlantVillage, PlantDoc, DeepWeeds, CWFID, Kaggle, Roboflow, ImageNet/COCO pre-training, self-collected field data | Full text |
| Performance metrics | Accuracy, F1, precision, recall, mAP, IoU/Dice, R², RMSE, MAE — each with value count, best value, median value and, for error metrics, native measurement units | Full text (abstract + results) |
| Evaluation design | k-fold cross-validation, hold-out split, independent/external test set, spatial or temporal transfer test, ablation study, statistical significance testing | Full text |
| Evidence maturity | Deployment signals (edge/embedded hardware, mobile or web application, real-time operation, robotics, farmer or stakeholder involvement), field-evidence density, assigned level L1–L3 | Full text |
| Open science | Data-availability category (7 levels) with evidence type and URL; code-availability category (5 levels) with evidence type and URL | Full text (availability statements) |
| Reproducibility | Hyperparameters reported, software/hardware environment stated, repeated runs or seed control, dataset size reported; composite index 0–10 | Full text |
Table 3.
PRISMA 2020 record flow through the screening pipeline.
| PRISMA stage | Item | Records (n) | Notes |
|---|---|---|---|
| Identification | Records identified via Scopus Search API | 4629 | 13 compound TITLE-ABS-KEY technique x application pairs; document types "ar" and "re"; PUBYEAR 2019-2026 |
| Identification | Duplicate records removed | 12 | DOI-exact match; fuzzy title match (Levenshtein >= 90) |
| Screening | Records screened (title and abstract) | 4617 | Language and date filters already enforced at query level |
| Screening | Records excluded at title/abstract stage | 2503 | Two-layer keyword rule; borderline records adjudicated individually |
| Eligibility | Full-text records sought and assessed | 2114 | Open-access full texts retrieved via Unpaywall API v2 |
| Eligibility | Excluded: no ML/DL as a core method | 631 | Method criterion in Table 1 |
| Eligibility | Excluded: not an agricultural application | 508 | Domain criterion in Table 1 |
| Eligibility | Excluded: no primary results / out-of-scope document type | 375 | Editorials, abstracts-only, protocol papers, duplicated reports |
| Eligibility | Excluded: predatory or non-peer-reviewed venue | 18 | Cross-referenced against Beall's List |
| Included | Studies included in the review | 582 | Corpus used for all bibliometric analyses |
| Included | Included studies with retrievable full text | 430 | Analytic subsample for all full-text-derived variables (73.9% of corpus) |
Full-text exclusion reasons sum to 1,532; 2,114 − 1,532 = 582.
Table 4.
Annual publication counts, growth rates and full-text retrieval across the review period.
| Year | Papers (n) | Cumulative | % of corpus | Year-on-year growth | Full text retrieved (n) |
|---|---|---|---|---|---|
| 2019 | 6 | 6 | 1.0 | — | 3 |
| 2020 | 9 | 15 | 1.5 | +50% | 4 |
| 2021 | 13 | 28 | 2.2 | +44% | 9 |
| 2022 | 41 | 69 | 7.0 | +215% | 28 |
| 2023 | 56 | 125 | 9.6 | +37% | 42 |
| 2024 | 145 | 270 | 24.9 | +159% | 93 |
| 2025 | 251 | 521 | 43.1 | +73% | 204 |
| 2026 | 61 | 582 | 10.5 | n.a. (partial year) | 47 |
2026 figures represent January–March only. All architecture frequencies, domain distributions and open science statistics that include 2026 papers should be interpreted accordingly. The final column reports how many of that year's papers entered the full-text analytic subsample.
Table 5.
Geographic distribution of included studies by first-author region, with open science indicators from the full-text subsample.
Table 5.
Geographic distribution of included studies by first-author region, with open science indicators from the full-text subsample.
| Region | Papers | Pct | Global N/S | FAO food-insecurity burden | Leading application domain | Full text (n) | Open data (%) | Open code (%) | Median reproducibility index |
|---|---|---|---|---|---|---|---|---|---|
| South Asia | 179 | 30.8 | Global South | High | Plant disease & pest detection | 104 | 32.7 | 8.7 | 3.0 |
| East Asia | 166 | 28.5 | Mixed (162 S / 4 N) | Low | Crop yield prediction | 136 | 17.6 | 3.7 | 3.0 |
| Middle East & North Africa | 69 | 11.9 | Global South | Moderate | Plant disease & pest detection | 50 | 32.0 | 0.0 | 3.0 |
| Europe | 61 | 10.5 | Global North | Low | Plant disease & pest detection | 55 | 20.0 | 10.9 | 3.0 |
| North America | 50 | 8.6 | Global North | Low | Crop yield prediction | 41 | 24.4 | 14.6 | 3.0 |
| Southeast Asia | 27 | 4.6 | Global South | Moderate | Plant disease & pest detection | 20 | 30.0 | 10.0 | 2.0 |
| Oceania | 11 | 1.9 | Global North | Low | Crop yield prediction | 10 | 10.0 | 10.0 | 3.0 |
| Sub-Saharan Africa | 9 | 1.5 | Global South | High | Plant disease & pest detection | 8 | 12.5 | 0.0 | 2.0 |
| Latin America & Caribbean | 8 | 1.4 | Global South | Moderate | Plant disease & pest detection | 4 | 50.0 | 25.0 | 3.5 |
| Central Asia | 2 | 0.3 | Global South | Moderate | Plant disease & pest detection | 2 | 50.0 | 50.0 | 3.0 |
Regions and the Global North/South classification are derived from first-author country by the explicit lookup described inSection 3.3.1; every paper is assigned, so no residual category appears. Percentages of the corpus are calculated over all 582 papers; open science and reproducibility columns are calculated over the full-text subsample for that region (column "Full text (n)"). Regions with fewer than 10 full texts are reported for completeness but should not be compared quantitatively. FAO food-insecurity burden is a qualitative classification of regional undernourishment prevalence.
Table 7.
Hierarchical taxonomy of agricultural application domains (n = 582 studies).
| Macro-area | Application domain | Papers (n) | % of corpus | Full text (n) | Most frequent architectures | Accuracy median % (n) | Accuracy IQR | R2 median (n) | Median evidence level | Open data (%) |
|---|---|---|---|---|---|---|---|---|---|---|
| A. Crop health and protection | Plant disease & pest detection | 258 | 44.3 | 178 | CNN (generic), ResNet, Vision Transformer | 98.7 (172) | 96.5-99.5 | n < 5 | L2 | 34.3 |
| A. Crop health and protection | Weed detection & management | 23 | 4.0 | 17 | CNN (generic), YOLO, ResNet | 97.0 (17) | 83.5-99.2 | n < 5 | L3 | 35.3 |
| B. Production forecasting and monitoring | Crop yield prediction | 148 | 25.4 | 120 | Random Forest, LSTM, Regression (linear/PLS) | 89.5 (52) | 78.9-97.5 | 0.87 (80) | L2 | 15.8 |
| B. Production forecasting and monitoring | Crop mapping & land-use classification | 17 | 2.9 | 13 | CNN (generic), U-Net, SVM/SVR | 95.0 (11) | 88.5-98.6 | n < 5 | L2 | 23.1 |
| B. Production forecasting and monitoring | Crop growth monitoring & phenology | 14 | 2.4 | 9 | Random Forest, Regression (linear/PLS), U-Net | 83.0 (5) | 82.0-91.0 | n < 5 | L2 | 22.2 |
| B. Production forecasting and monitoring | Climate impact & risk assessment | 1 | 0.2 | 1 | YOLO | n < 5 | — | n < 5 | L2 | 0.0 |
| C. Resource and input management | Precision agriculture systems & IoT | 33 | 5.7 | 26 | CNN (generic), YOLO, ResNet | 95.7 (20) | 89.5-98.8 | n < 5 | L2 | 15.4 |
| C. Resource and input management | Soil property & nutrient management | 11 | 1.9 | 10 | CNN (generic), XGBoost, Gradient Boosting (other) | 92.0 (7) | 74.5-94.3 | 0.77 (5) | L2 | 20.0 |
| C. Resource and input management | Irrigation & water management | 10 | 1.7 | 5 | XGBoost, Gradient Boosting (other), SVM/SVR | n < 5 | — | n < 5 | L3 | 0.0 |
| D. Product quality, livestock and automation | Crop quality, phenotyping & post-harvest | 21 | 3.6 | 17 | Random Forest, XGBoost, ANN/MLP | 93.4 (10) | 78.5-96.0 | 0.793 (11) | L2 | 5.9 |
| D. Product quality, livestock and automation | Food security, supply chain & economics | 7 | 1.2 | 4 | U-Net, CNN (generic), ResNet | n < 5 | — | n < 5 | L2 | 50.0 |
| D. Product quality, livestock and automation | Livestock & aquaculture | 4 | 0.7 | 4 | Gradient Boosting (other), ResNet, MobileNet | n < 5 | — | n < 5 | L2 | 25.0 |
| D. Product quality, livestock and automation | Harvesting, robotics & machinery | 2 | 0.3 | 2 | CNN (generic), MobileNet, YOLO | n < 5 | — | n < 5 | L2 | 0.0 |
| E. Other / unclassified | Other / unclassified | 33 | 5.7 | 24 | U-Net, CNN (generic), Random Forest | 96.5 (16) | 93.5-98.1 | 0.938 (9) | L2 | 20.8 |
Domain counts and corpus percentages are computed over all 582 papers from title and abstract text. Performance, evidence-level and open-data columns are computed over the full-text subsample for that domain (column "Full text (n)") and are reported only where at least five papers contribute the statistic; "insufficient data" marks cells that would otherwise summarise fewer than five observations.
Table 8.
Distribution of reported performance metrics across the full-text subsample (n = 430).
| Metric | Papers reporting (n) | % of subsample | Median | IQR | 95% CI of median | Range |
|---|---|---|---|---|---|---|
| Accuracy (%) | 318 | 74.0 | 97.8 | 92.0-99.1 | 97.0-98.0 | 20.0-100.0 |
| F1-score (%) | 156 | 36.3 | 98.2 | 93.9-100.0 | 97.55-98.9 | 22.2-100.0 |
| Precision (%) | 206 | 47.9 | 100.0 | 99.4-100.0 | 100.0-100.0 | 35.6-100.0 |
| Recall (%) | 198 | 46.0 | 100.0 | 100.0-100.0 | 100.0-100.0 | 50.0-100.0 |
| mAP (%) | 76 | 17.7 | 98.0 | 90.5-100.0 | 95.0-100.0 | 40.8-100.0 |
| IoU / Dice (%) | 71 | 16.5 | 92.5 | 69.2-100.0 | 83.73-97.1 | 50.0-100.0 |
| R2 | 121 | 28.1 | 0.87 | 0.76-0.952 | 0.826-0.894 | 0.03-1.0 |
| RMSE (native units) | 113 | 26.3 | 1.17 | 0.39-3.0 | 0.8-2.0 | 0.0-2018.0 |
| MAE (native units) | 67 | 15.6 | 1.2 | 0.25-4.36 | 0.61-2.0 | 0.0-2022.0 |
Values summarise the best value reported in each paper (maximum for accuracy-type metrics, minimum for error metrics). Confidence intervals for the median were obtained by bootstrap resampling with 4,000 replicates. RMSE and MAE are pooled across incompatible measurement units and are reported here only to characterise reporting practice, not to compare studies.
Table 9.
Reported accuracy conditioned on training and evaluation data regime.
| Training/evaluation data regime | Papers (n) | % of subsample | Accuracy median % (n) | IQR | 95% CI of median | Independent/transfer test (%) |
|---|---|---|---|---|---|---|
| Public benchmark only | 102 | 23.7 | 99.0 (94) | 97.4-99.5 | 98.099-99.13 | 35.3 |
| Mixed: public benchmark + own field data | 64 | 14.9 | 98.9 (59) | 95.6-99.7 | 97.8-99.15 | 32.8 |
| Own field data only | 81 | 18.8 | 95.0 (49) | 87.8-97.9 | 92.0-96.5 | 22.2 |
| Not determinable from full text | 183 | 42.6 | 94.7 (116) | 84.4-98.7 | 92.0-96.3 | 29.5 |
The data regime was inferred from the datasets identified in the full text. "Not determinable" denotes papers in which neither a recognised public benchmark nor explicit field-collection language could be identified; this group is reported for completeness and is not interpreted.
Table 10.
Evidence-maturity classification of the full-text subsample.
| Evidence level | Label | Definition | Papers (n) | % of subsample | Median accuracy % (n) | IQR | Independent/transfer test (%) | Open data (%) | Open code (%) | Median reproducibility index |
|---|---|---|---|---|---|---|---|---|---|---|
| L1 | Benchmark / controlled-data only | Model trained and tested only on curated or publicly released datasets; no evidence of data collected under operational field conditions. | 142 | 33.0 | 98.0 (114) | 94.3-99.0 | 24.6 | 30.3 | 6.3 | 2.0 |
| L2 | Field-validated | Model trained or tested on data collected in real fields, or evaluated with a spatial/temporal transfer test. | 157 | 36.5 | 93.0 (89) | 82.0-98.0 | 30.6 | 13.4 | 7.6 | 3.0 |
| L3 | Deployed / operational prototype | Model additionally embedded in an operational artefact: edge/embedded hardware, robotic or machinery integration, or a farmer-facing trial. | 131 | 30.5 | 98.5 (115) | 95.0-99.5 | 35.1 | 32.1 | 7.6 | 3.0 |
Levels were assigned by rule from deployment signals and field-evidence density in the full text; the classification records what a study reports having done rather than the quality of what it did.
Table 12.
Yearly trend in open science practice and reproducibility across the full-text subsample.
| Year | Full-text papers (n) | Open data (n) | Open data (%) | Open code (n) | Open code (%) | Median reproducibility index |
|---|---|---|---|---|---|---|
| 2019 | 3 | 0 | 0.0 | 1 | 33.3 | 2.0 |
| 2020 | 4 | 0 | 0.0 | 0 | 0.0 | 1.5 |
| 2021 | 9 | 2 | 22.2 | 1 | 11.1 | 2.0 |
| 2022 | 28 | 5 | 17.9 | 2 | 7.1 | 2.5 |
| 2023 | 42 | 10 | 23.8 | 1 | 2.4 | 2.0 |
| 2024 | 93 | 15 | 16.1 | 5 | 5.4 | 3.0 |
| 2025 | 204 | 58 | 28.4 | 18 | 8.8 | 3.0 |
| 2026 | 47 | 16 | 34.0 | 3 | 6.4 | 3.0 |
2019 and 2020 contribute three and four full texts respectively; their percentages are unstable and are shown for completeness only. 2026 covers January–March.
Disclaimer/Publisher’s Note: The statements, opinions and data contained in all publications are solely those of the individual author(s) and contributor(s) and not of MDPI and/or the editor(s). MDPI and/or the editor(s) disclaim responsibility for any injury to people or property resulting from any ideas, methods, instructions or products referred to in the content. |
© 2026 by the authors. Licensee MDPI, Basel, Switzerland. This article is an open access article distributed under the terms and conditions of the Creative Commons Attribution (CC BY) license (http://creativecommons.org/licenses/by/4.0/).
Copyright: This open access article is published under a Creative Commons CC BY 4.0 license, which permit the free download, distribution, and reuse, provided that the author and preprint are cited in any reuse.