

Submitted:
08 April 2026
Posted:
09 April 2026
You are already at the latest version
Abstract
Fracture networks strongly control fluid flow, reservoir connectivity, and production performance in carbonate systems, yet their multiscale architecture of complexity remains difficult to characterize from heterogeneous geological and geophysical datasets. Here, we introduce the Digital Transformer (DiT), a physics-informed computational framework that automatically analyzes and classifies fracture systems using spatially encoded visuonumerical primitives derived directly from physical measurements. Instead of relying on textual tokenization, the approach performs attention primitives tokenization of multiscale geophysical data. Clusters of absolute integer values act as computational tokens while preserving spatial topology and scale-invariant structure of the original system. The framework integrates two complementary environments: Muuk'il Kaab (MIK) for multidimensional metadata fusion and visualization, and SYM-Fractron, a hybrid binary-symbolic transformer for two-dimensional image analysis. Within this architecture, Digital Twins provide coupled visual and statistical representations of geological systems and their computational counterparts, enabling an interpretable taxonomy of natural fracture patterns while supporting well-trajectory optimization in the exploration of dolomitized carbonate reservoirs. In this view, fracture architectures become visionumerical primitives whose physics-informed tokenization opens a pathway from the architecture of natural complexity to its computational realization through Digital Twins.
Keywords:
physics-informed artificial intelligence
; big geodata
; fracture networks
; primitives of architecture of complexity
; digital transformer
; hybrid symbolic–numeric learning
; visionumerical primitives
; digital twins
; multifractal and p-adic models
1. Introduction
Fracture networks are ubiquitous structural features of the Earth's crust and play a central role in controlling subsurface transport processes [1]. In carbonate formations, particularly dolomitized reservoirs, fracture architectures commonly emerge from the interaction of multiple geological, physical, mechanical, chemical, and biological processes, including diagenesis, deformation, and fluid–rock shape-morphing interactions [2]. The resulting structures form highly heterogeneous spatial patterns that extend across a broad range of scales, from kilometer-scale seismic structures to sub-microscopic pore networks [1]. Identifying and characterizing the patterning of natural fractures across multiple scales is a major challenge in geosciences, particularly in the petroleum industry [3]. The development of a systematic nomenclature ("naming fractures"), as well as the construction of a comprehensive taxonomy and atlas of fracture patterns—essential prerequisites for automated classification and machine learning—are still pending [3,4,5].
Traditional reservoir static and dynamic characterization relies on datasets (metadata) derived from seismic imaging, well logging, microscopy, tomography, and laboratory measurements (Figure 1).
Although these datasets contain valuable structural information, their integration across scales remains unsolved. Conventional statistical or purely data-driven approaches often struggle to capture the spatial organization of fracture systems embedded within such multiscale architectures. As a result, many structural patterns controlling subsurface connectivity stay partially hidden within large volumes of spatially encoded measurements.
Recent advances in scientific artificial intelligence and physics-informed modeling have opened new perspectives for analyzing complex natural systems. In particular, digital twin frameworks and hybrid symbolic-numeric learning approaches offer new opportunities to represent spatial structures directly from physics-informed measurements [6]. These developments suggest that numerical patterns embedded in geological datasets may be interpreted as computational primitives that encode structural information across scales.
Here, we introduce the Digital Transformer (DiT), a physics-driven computational framework for analyzing multiscale fracture architectures in complex geophysical and geological datasets. Unlike conventional language-based transformer models, the proposed approach operates on spatially encoded numerical primitives derived directly from multiscale physical measurements. By integrating symbolic–numeric representations, digital twin concepts, and p-adic and multifractal metrics, the framework enables systematic Identification and visualization of structural patterns within large volumes of geoscientific metadata. In this study, these patterns are referred to as visionumerical primitives.
The computational framework presented in this study builds on more than a decade of methodological development and field calibration within academic and industrial collaborations. This sustained efforts led to the construction of a unified family of mathematical and computational models designed to preserve scale invariance, spatial topology, and physical consistency across multisource raw datasets. Such models may be interpreted as geometric and topological approaches to Big Data [7] or, more particularly, in the context of Earth system studies, to Big Geodata [8,9].
The concept of Big Geodata refers to datasets describing Earth's surface and near-surface environments (Figure 1). However, conventional Big Data mining strategies, originally developed for generic applications, and associated with six attributes of volume, variety, velocity, veracity, value, and complexity, are often insufficiently representative for the statistically or geostatistically representative visualization and comparison of raw geophysical and geological data across the vast range of scales, dimensions, and physical variability characteristic of the petroleum systems. In this study, multisource, multiscale, and multidimensional datasets form a metadata architecture that is examined through the perspective of scale-invariant pattern formation, reflecting the intrinsic architecture of data complexity.
Metadata are commonly defined as data about data, describing provenance, organization, and relationships across repositories. Multisource, multiscale, and multidimensional datasets naturally generate metadata structures that encode contextual, spatial, temporal, and physical information, which are essential for reproducible scientific workflows [10,11,12].
Despite their central role in industry–academia collaboration, methodological frameworks for comparing metadata across workflows remain limited [13], often constraining reproducibility and long-term knowledge transfer. This limitation becomes particularly critical when comparing two- and three-dimensional representations of complex systems, where preserving topology and multiscale structural organization is a key attribute for optimizing real-task, sustainable industrial applications.
To address these limitations, we developed Muuk'il Kaab (MIK), a meta-driven computational environment designed to integrate, visualize, and compare statistically multiscale spatially encoded geological and geophysical datasets within a unified structural framework.
2. Architecture of Big Geodata Complexity
Big Data has increasingly been framed as a new science of complexity [14,15]. The conceptual foundation of this work follows the architecture of complexity introduced by Herbert A. Simon, which abstracts from domain-specific properties and is therefore applicable across physical, biological, and social systems [16]. In particular, Simon's well-known "ant" parable illustrates that computational requirements depend primarily on the problem's structural organization and its interaction with field-derived expert knowledge, user input, and calibration procedures. This perspective enables a context-aware characterization of the multiscale organization of complex systems.
The central question then becomes: which fundamental "building blocks" or mathematical elemental blocks are most suitable for comparing such architectures across computational and real-world systems?
In computational modeling of structural patterns and their behavior, the smallest functional building blocks are commonly referred to as primitives, understood as minimal processing units endowed with explicit semantic meaning and memory capacity [17]. Within classical Von Newman architectures, programs and data are stored in a unified memory and treated as a single computational entity [18,19]. Catalogs of architectural primitives have been developed to address fundamental representation and modeling challenges, demonstrating structural variability across application domains [20].
However, emerging non-Von Neumann or beyond-Von Neumann computing paradigms, increasingly integrated into the broader computing continuum, support modern distributed applications, including artificial intelligence, big data analytics, and scientific computing, thereby transforming data processing and analytical workflows across scientific, industrial, and social domains [20]. By physically separating processing units from memory, these architectures introduce new computational management strategies for distributed applications.
More recently, augmenting the classical Von Neumann architecture, several proposals have incorporated a Reasoning Unit (RU) as an additional subsystem for context-aware processing, complementing the Central Processing Unit (CPU), Arithmetic Logic Unit (ALU), and memory. Each of these architectural paradigms consequently operates with its own set of primitives and associated representation strategies.
In visual cognition research, visual shape primitives have long been proposed as fundamental building blocks for object representation in visual space, typically focusing on the detection of constituent scene components [21] and the shape-morphing features [22].
Biederman's recognition-by-components theory (RBC) further demonstrated that objects can be effectively represented in terms of elementary shape primitives (geons) and their topological relationships [23]. Morphing processes are deeply rooted in Nature and in synthetic shape-changing materials and mechanisms [24].
Visual primitives have been interpreted as compositional "visual words" in zero-shot learning (ZSL) frameworks, enabling flexible object recognition beyond explicitly trained categories [25]. Within the Digital Transformer framework proposed here, we extend this perspective by incorporating the self-attention mechanism to model relationships between attributes (states) and objects of complex systems. This mechanism enables the Identification of simple attention primitives within metadata structures [26].
The next step in this search pipeline focused on clusters of numerical values as visually interpretable primitives within the numerical matrices, thereby establishing a bridge between quantitative data structures and physically meaningful visual pattern representations. We refer to these elements as numerical primitives.
From the fusion of visual, attention, and numerical primitives emerges the central concept of this study: the architecture-of-complexity primitive. Although the theoretical formalization of this framework is still evolving, its practical implementation has proven highly effective in revealing scale-invariant structural patterns within Big Geodata, supporting its use as an operational modeling strategy.
These inverse shape-morphing visionumerical processes align with our morphogenesis-based approach to the classification of fracture architectures associated with carbonate dolomitization, where complex geological patterns are interpreted as the outcome of physically and biochemically constrained transformation processes.
In geosciences, high-complexity metadata architectures naturally emerge from the often only partially coherent fusion of multisource, multiscale information acquired through dense sensor networks and advanced imaging systems (Figure 2).
The architecture of complexity of Big Geodata requires explicit methodological attention, particularly in the analysis of fracture networks and lithofacies patterns. This perspective defines what was termed the Attention Landscape of Architecture of Complexity [27], referring to the structural distribution of relevant physical information across multiscale geological data.
Within this framework, digital modeling is treated not as a purely data-driven abstraction but as a physics-informed process linking physical perception, data acquisition, and digital representation through machine learning, automated model training, and transformer-based architectures, which can be interpreted as visual physical models of artificial intelligence following the approach proposed by Kozyrev [28].
Computational representations, therefore, aim to preserve the intrinsic structural organization of geological systems, forming the basis of Physics-Informed Computer Vision (PICV) [29]. From this standpoint, the extraction of spatially encoded numerical patterns can be interpreted as a form of physics-informed tokenization of the complex systems.
The integration of fundamental physical knowledge into machine learning is reshaping approaches to real-world applications. Recent studies propose taxonomies that classify PICV methods according to the type of physical information embedded in the computer vision pipeline. Within this classification, the proposed Digital Transformer Model (DiT) corresponds to PICV tasks 3.1-3.3: physics-informed imaging inverse problems, physics-informed image generation, and physics-informed image analysis. In our own words, we called this approach: Attention Landscape of Architecture of Complexity
The main inverse imaging problems addressed in this study involve reconstructing subsurface structures from raw measurements acquired through seismic, well logging, optical, X-ray tomographic, and electron microscopy imaging. Within this context, the Digital Transformer (DiT) operates as a distributed, multiscale architecture that is naturally consistent with the Digital Twins paradigm, in which numerical, symbolic, and spatial representations are jointly encoded in accordance with both the governing physics of the original system and their computational counterparts. Recent studies indicate that Big Data research in Earth system sciences is progressively evolving toward Digital Twin architectures [30].
Most artificial intelligence techniques rely on an encode–decode paradigm; however, their outputs often lack cross-framework comparability, particularly in metadata-driven Earth-science applications. This limitation resonates with Benoit Mandelbrot's concept of unintended effects in complex systems, in which computational processes may exhibit fractal and multifractal characteristics [31]. Mandelbrot argued that numerical descriptors derived from fractal geometry could provide a rigorous basis for jointly characterizing the architecture of complexity of both natural systems and algorithms designed to represent them. Among these unintended effects, he emphasized the emergence of transmission errors in communication channels and the non-classical statistical structure of computer memory usage, whose architecture may resemble Lévy dust rather than Poisson-type distributions. law, thereby making it amenable to multifractal characterization. Such observations suggest that numerical descriptors analogous to fractal dimensions could serve not only as a measure of software complexity, but also as a basis for discriminating intrinsic differences in computational workflows [31].
Extending this line of reasoning, Bojarski et al. [32] introduced a framework for modeling data-transmission errors based on Diophantine equations, enabling the evaluation of deterministic modulation effects in DC-DC power electronic interfaces.
Building on these insights, the present study introduces a unified multiscale performance metric grounded in multifractal theory and selected principles from the metric theory of Diophantine approximation. Particular attention is given to Ostrowski's theorem, which established that every nontrivial absolute value on the field of rational numbers is equivalent either to the standard Archimedean absolute value or to a p-adic absolute value associated with a prime number p [33]. This classification provides a rigorous foundation integrating Archimedean and p-adic metrics within a single analytical framework. In this context, both presentations become operational within the metric theory of Diophantine approximation and support the encoding of integers into structured color-based representations, as implemented in the Digital Transformer framework.
This perspective enables the consistent quantification of numerical proximity and structural similarity across heterogeneous datasets. The resulting metric supports rigorous Big Data fusion by enabling quantitative comparisons across physics-informed AI workflows while preserving scale-invariant structure, thereby enhancing interpretability and reproducibility of information throughout multifractal analysis and visualization.
Related objectives have been explored within the ANR-funded research program coordinated by S. Seuret [34], which investigated large intersections and connections with dynamical systems. His effort led to the development of the MUTADIS platform, demonstrating the natural emergence of multifractal structures across empirical data and diverse mathematical domains, including dynamical systems, probability theory, harmonic analysis, and Diophantine approximation [34]. Within this scheme, the Jaffard–Barral–Seuret group established multifractals as a unified mathematical object that can be consistently interpreted as a measure, a function, or a stochastic process characterized by strongly varying local regularity [35]. Building on this foundation, the present study extends the multifractal framework by incorporating Ostrowski's classification of absolute values and by introducing digital, image-based representations as operational performance metrics for comparing heterogeneous topological data analyses across artificial intelligence workflows [36].
This comparison is implemented using the Digital Transformer proposed here, conceived as both a topological construct and an algebraic modeling tool for cross-scale analysis of metadata. Tokenization thus naturally emerges as a scale-consistent transformation of spatially organized numerical information, preserving topological relations and statistical invariants, and enabling the Digital Transformer to generate a statistically grounded family of Digital Twins rather than a single deterministic representation (Figure 4a; 4b).
3. Digital Transformer Framework
The Digital Transformer (DiT) is introduced here as a unified algebraic-topological framework for artificial intelligence that explicitly links physical structures to their digital counterparts. Operationally, DiT arises from the coordinated interaction of numerical, symbolic, and spatially encoded primitives, which become tokens when instantiated as spatially grounded units endowed with positional encoding and physical meaning. Their organization is governed by topological and scale-invariant constraints rather than by statistical similarity. The underlying metric maps, raw data clouds, and their derived encodings are mapped onto shared architectural descriptors – such as connectivity, continuity, roughness, and multiscale organization – enabling direct comparison between physical systems and their digital counterparts.
In this context, transformation denotes not a change in data modality, but a geometrical and topological approach to metadata based on structure-preserving mapping [37]. These mappings are constrained by physical principles and spatial encoding, ensuring comparability of equivalent architectures across scales, resolutions, and multi-physical data sources.
3.1. Computational Ecosystem
The Digital Transformer framework is implemented through two complementary computational environments: Muuk'il Kaab (MIK) and SYM-Fractron. The design of this two-part computational ecosystem follows methodological principles proposed by Terekhov et al. [38], who demonstrated that visual modeling can function as an effective alternative to conventional text-based programming (LLM-Long Language Models). Their framework promotes the use of visual integrated development environments (IDEs) as a formal computational platform, leveraging domain-specific visual languages to enhance structural transparency, semantic precision, and model interpretability [38].
Both software packages were implemented in a high-level programming language (e.g., C++). SYM-Fractron was developed by the authors, whereas MIK was designed in collaboration with an international team of scientific advisers and developers with support from Mexico's national research funding programs (Project 168638, "Oil Reservoir as Fractal Reactor", CONACYT). The algorithms were designed by domain scientific experts and engineered to meet the computational constraints of geoscientific metadata.
To address the challenges mentioned above, the Digital Transformer integrates two tightly coupled computational platforms: Muuk'il Kaab (MIK) and SYM-Fractron. Together, they form a unified framework that functions as a metadata-driven, physics-informed Digital Twin of the architecture of complexity representing the geological systems. This framework is designed to provide a statistically grounded representation of the underlying geology, with particular emphasis on fracture patterns and associated lithofacies.
3.1.1. Muuk'il Kaab Software
The first, Muuk'il Kaab (MIK), is a bio-inspired honeycomb architecture designed for multidimensional analysis and physics-informed modeling of Big Geodata within a multiscale metadata landscape (Figure 3). Its effective use requires both theoretical understanding and applied expertise. The theoretical foundations of MIK algorithms have been previously published and independently peer-reviewed within their respective scientific communities, and subsequently validated and calibrated through field applications conducted throughout our project development. A comprehensive description of the full MIK ecosystem, which currently comprises more than thirty original software modules, lies beyond the scope of the present paper and will be published as a separate paper, Digital Transformer for Fractures classification: Part II-MIK.
The name Muuk'il Kaab (MIK)—a Mayan expression referring to bees building honeycomb—was adopted as a computational metaphor for a bio-inspired environment for multisource, multidimensional, and multiscale metadata fusion aimed at recognizing shape-morphing fracture and lithofacies patterns.
Following the general strategy of this research, spatially encoded data are represented using honeycomb-based units: voxels for the three-dimensional MIK environment and hexagonal pixels for the two-dimensional Sym-Fractron framework. Hexagonal tilings provide efficient spatial partitioning while supporting modular and interconnected processing pathways. This topology is particularly advantageous for MIK's Delaunay-based procedures for image isosurface extraction and metadata skeletonization, where geometric regularity facilitates stable multiscale connectivity analysis (Figure 3).
Honeycomb architectures are widely used in contemporary engineering design, including smart materials and additive manufacturing, where geometrical patterns are adapted to functional requirements [39,40]. Their structural efficiency and hierarchical organization have made them an increasingly important subject of research in materials design and discovery [41].
In the present framework, hexagonal cells form layered spatial structures that can be interpreted as numerically encoded units carrying explicit spatial and physical meaning. Such an organization supports hierarchical learning, reproducible information routing, and cross-scale visualization in heterogeneous datasets. Consequently, the mathematical modeling and simulation of three-dimensional honeycomb pattern formation have become an important topic in both theoretical and applied studies [42].
From its inception, MIK was conceived to enforce coherence between the intrinsic architecture of complexity observed in both algorithmic and geological systems, while preserving the spatial, topological, and multiscale organization of raw data clouds through the Number Spatial Encoding Model (NuSEM). More recently, however, Cheng et al. [43] demonstrated the quantitative feasibility of integrating computational workflows across CPU and GPU environments using just-in-time compilation strategies.
This advance can be naturally extended to the present framework, supporting the scalability from real-world systems to their Digital Twin counterparts. The resulting structured and tokenized representations preserve spatial, physical, and statistical information, thereby enabling interpretable and physics-consistent machine learning workflows.
3.1.2. SYM-Fractron Software
The complementary platform, Sym-Fractron, is a hybrid binary-symbolic Digital Transformer designed to operate on two-dimensional spatial representations such as seismic or tomographic slices. It enables scale-consistent projection, visualization, and classification of structural patterns. Implemented as a lightweight, Excel-compatible tool, SYM-Fractron facilitates broader access to multiscale complexity analysis while maintaining interoperability with high-performance computational environments, such as MIK.
The central objective of this study is to quantify and visualize the meta-complex architecture that links natural systems with their computational, mathematical, and numerical representations. We hypothesize that physically meaningful models and algorithms should reflect the hierarchical organization, intrinsic variability, and anisotropy observed in real-world systems.
Inside this framework, Artificial Intelligence is not treated as a data-processing tool, but as a representation paradigm capable of preserving the topology of physical structures. The Digital Transformer (DiT) defines a unified representation space in which physical systems and their computational counterparts can be compared on equal footing through a shared, topology-preserving description of the architecture of complexity.
The study adopts an intentionally empirical orientation to assess the operational relevance of selected concepts from Diophantine approximation and multifractal analysis within metadata-driven visualization frameworks. Rather than pursuing new formal proofs, the focus is on demonstrating how these mathematical structures (visionumerical primitives) can be effectively embedded into physics-informed AI pipelines for complex real-world systems. This integration leads to the SYM-Fractron framework, a hybrid binary–symbolic Digital Transformer designed for fracture classification, complexity-aware decision support, and well-trajectory optimization.
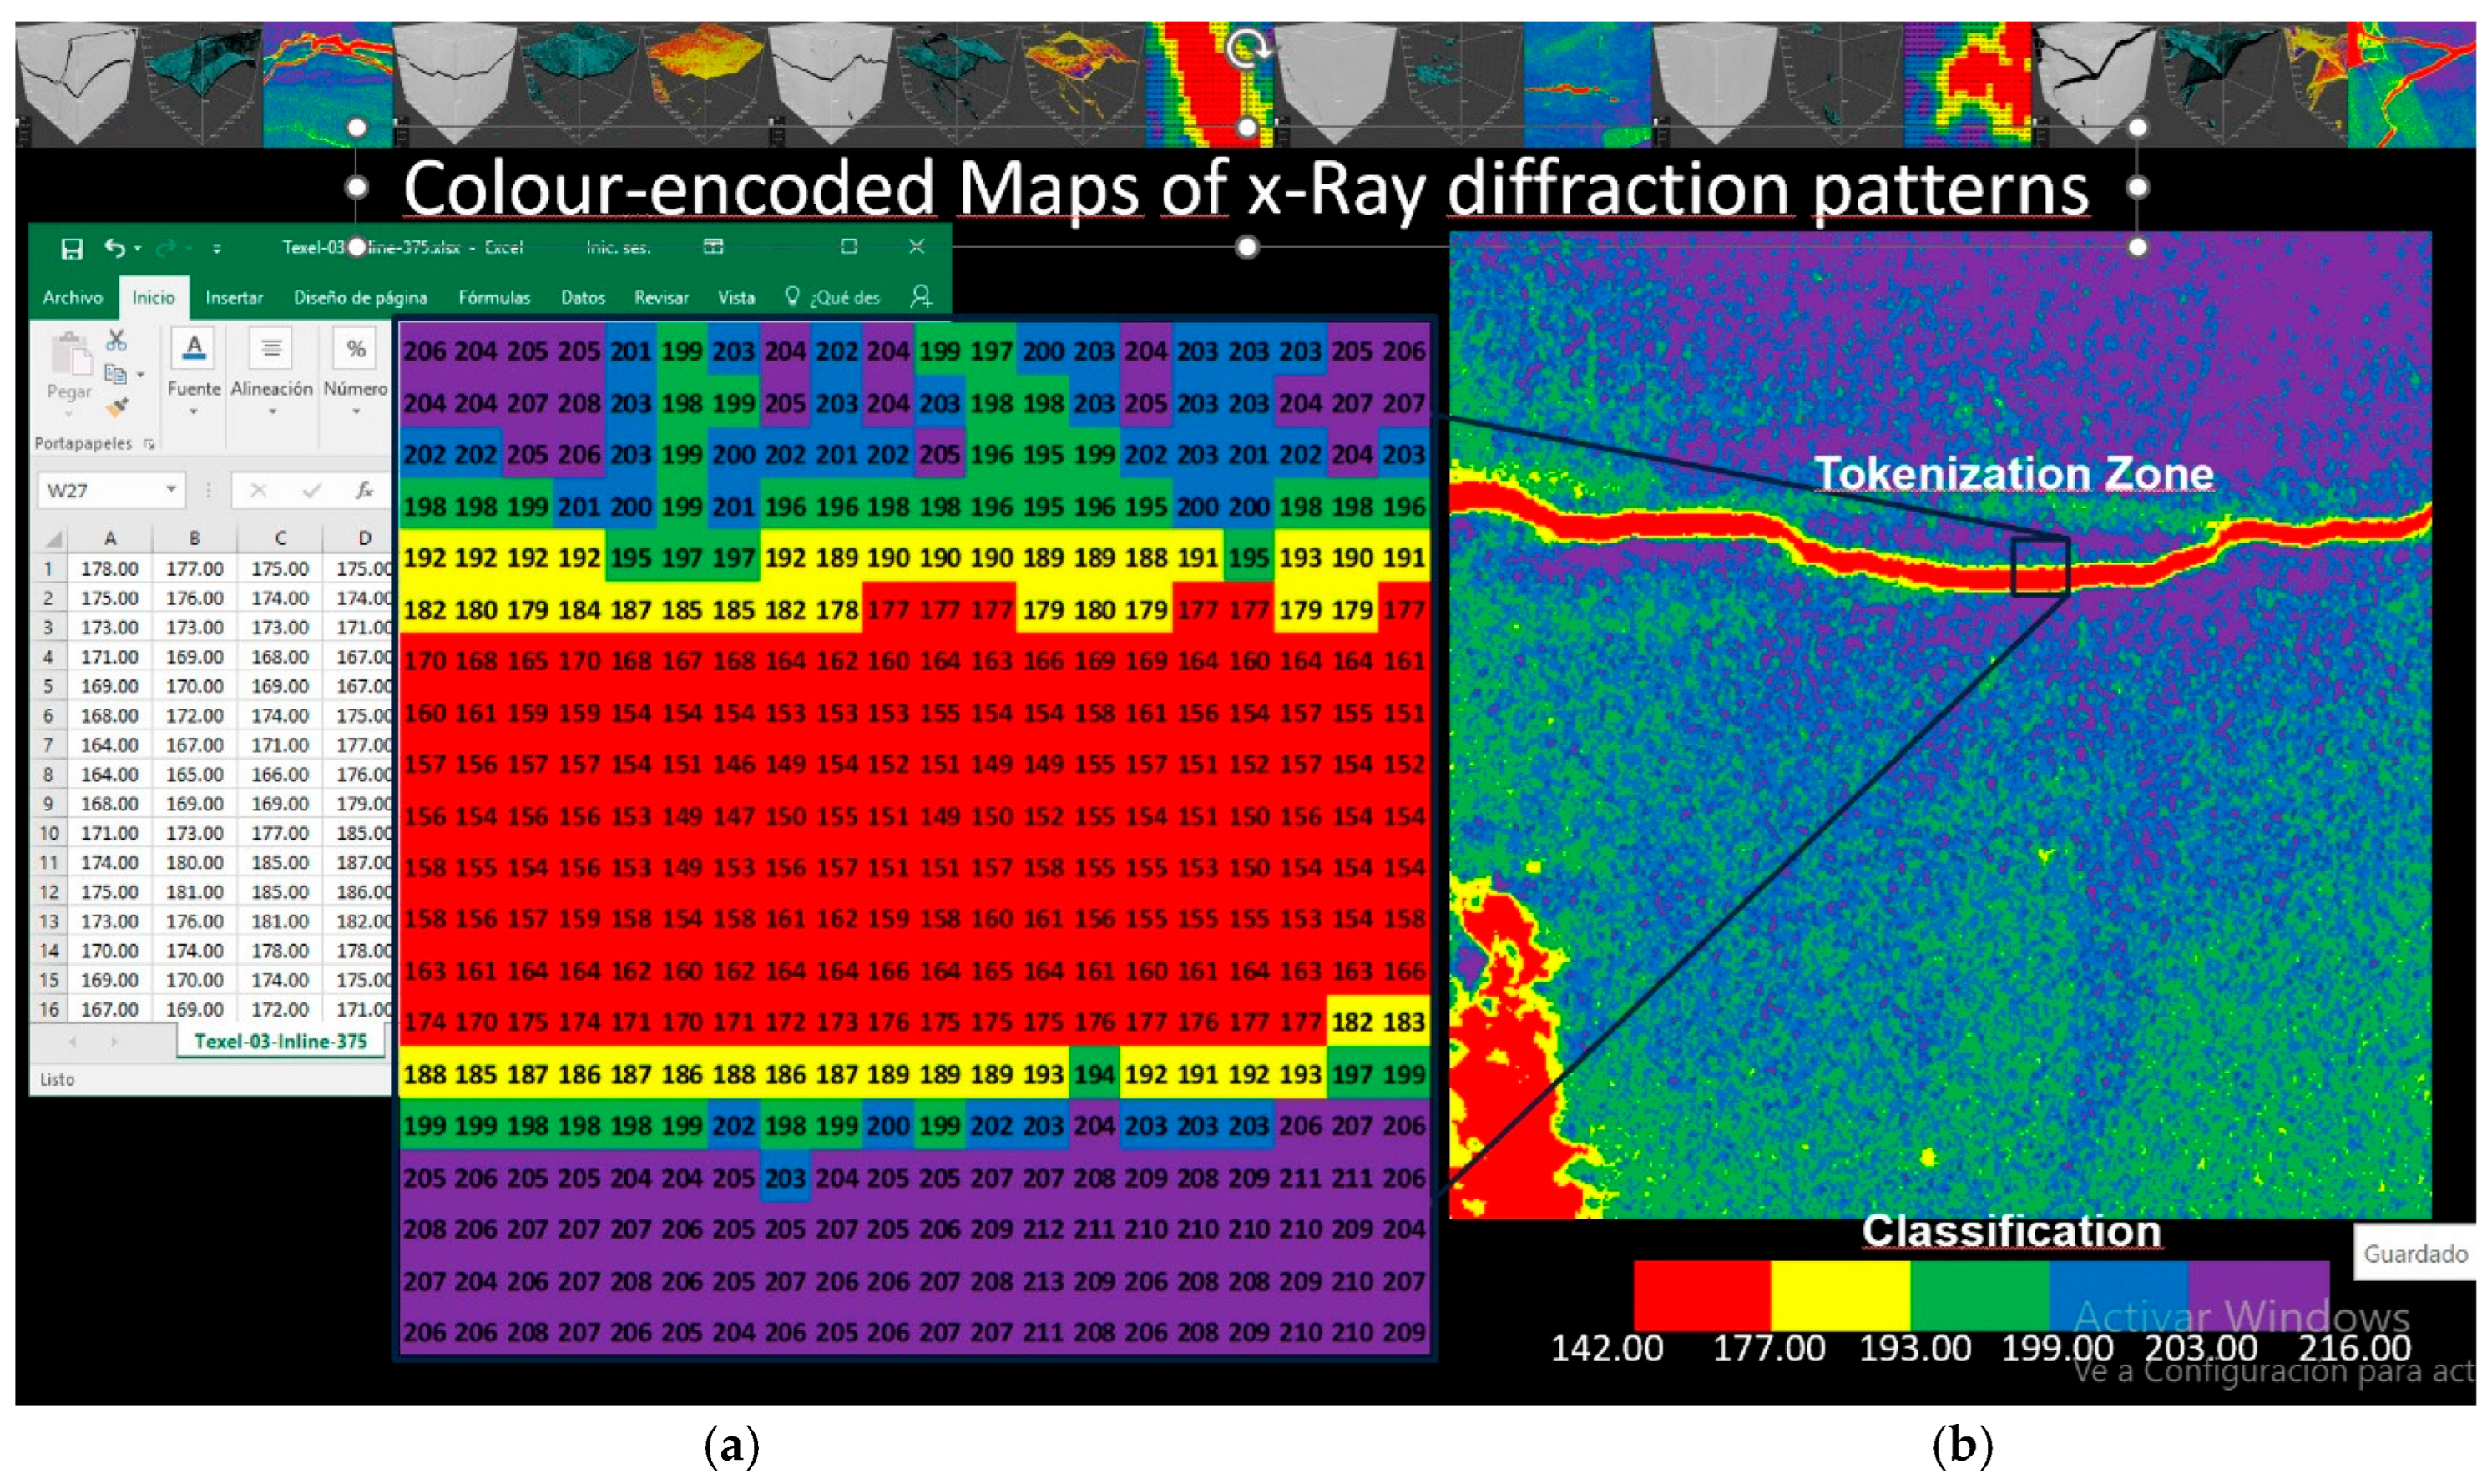
SYM-Fractron is calibrated through multiscale visualization of geophysical data. An example of the spatial, numerical, and color encoding of raw tomographic metadata for fracture pattern identification is shown in Figure 4a and Figure 4b.
Figure 4.
Multiscale visualization of tomographic metadata illustrating the correspondence between spatial structures and their numerical encoding (a) and symbolic (colour) visualization (Figure 4, b). The highlighted color band on the left represents a fracture-related feature encoded spatially, numerically, and color-wise, enabling its interpretation within the Digital Transformer framework. The vug (b, lower-left region) and the fracture (b, top of the image) metrics are visualized in great detail.
Figure 4.
Multiscale visualization of tomographic metadata illustrating the correspondence between spatial structures and their numerical encoding (a) and symbolic (colour) visualization (Figure 4, b). The highlighted color band on the left represents a fracture-related feature encoded spatially, numerically, and color-wise, enabling its interpretation within the Digital Transformer framework. The vug (b, lower-left region) and the fracture (b, top of the image) metrics are visualized in great detail.
3.1.3. Example of Joint Application of MIK and SYM-Fractron on the Digital Transformer Landscape
Although fractures are often idealized as linear conduits, their architecture in three-dimensional space is intrinsically complex and multiscale. Natural fracture systems and corridors organize into conductive pathways resembling interconnected neural networks with nontrivial morphology, particularly in carbonate reservoirs undergoing dolomitization (Figure 5a and Figure 5b).
Call attention to the fact that the key features of the fracture-corridor topology can be directly resolved from raw seismic metadata flow visualization (Figure 5b).
3.2. Digital Twins Approach
Digital Twins are evolving into self-learning, autonomous systems that link data, models, and human interaction [44,45]. San et al. develop a workflow that assesses consistency between input and output representations through systematic paired visualizations in the form of Digital Twins (DT), complemented by multifractal metrics. Digital Twins are generally defined as virtual representations (replicas) of physical or abstract systems that provide a unifying framework for navigating complexity through continuous interaction between data, models, and observations. In recent literature, DTs have been increasingly recognized as powerful tools for coupling modeling, data streams, and intelligence in adaptive feedback loops between physical and digital representations. They are widely applied across engineering, environmental sciences, and industrial mathematics [46,47].
In this framework, the Digital Transformer operates on heterogeneous metadata by extracting intrinsically structured clusters that serve as representation tokens, acting as elemental units of a multiscale attention landscape. Structural ensembles of tokens with consistent, similar visual and statistical characteristics collectively define a Digital Twin at a given scale, corresponding to a specific stage of analysis and capturing its intrinsic structural organization. In this way, encoding is no longer treated as an arbitrary reprocessing step, but as a physically grounded operation in which numerical structures act as visionumerical primitives of representation. Tokenization thus naturally emerges as a scale-consistent transformation of spatially organized numerical information, preserving topological relations and statistical invariants, and enabling the Digital Transformer to generate a statistically grounded family of Digital Twins rather than a single deterministic representation (Figure 6a; 6b).
In the present context, Digital Twins are understood as virtual multiscale representations of geological systems designed to preserve structural, behavioral, and spatial characteristics while enabling decision-relevant analyses, such as supervised well trajectory design. This modeling strategy is particularly suitable for monitoring, forecasting, and assessing Earth-system dynamics and the consequences of human interventions [45]. In this study, DTs primarily serve as a comparative framework for evaluating visual and structural similarity among statistical models applied to raw geological metadata.
4. Conceptual Design of Digital Transformer
The Digital Transformers framework was developed to address a set of fundamental conceptual questions arising in the analysis of multidimensional and multiscale Big Geodata. These questions are approached by integrating established theoretical foundations, whose implications are subsequently visualized and encoded through physics-informed symbolization, tokenization, and Digital Twins approaches. All analytical workflows were evaluated and calibrated within metadata-driven approaches.
Building on the perspective of [47], our central objective is to bridge symbolic and numerical representations through physics-informed tokenization of raw data, coming from seismic exploration, well logging, optical observations, X-ray tomography, and electron microscopy, and typically stored as volumetric signals (.sgy) and digital images (.jpg, .bmp). This section first formulates the key conceptual questions and then presents the corresponding theoretical and methodological responses. At the beginning, the SYM-Fractron module was used as the simplest operational component of the Digital Transformer, whose framework is structured around four foundational questions that guide the conceptual design:
Number system. Absolute values of integers are adopted as carriers of discrete structural information, complemented by rational residuals to preserve fine-scale variability (Section 4.1).
Symbolic representation. Color is selected as the primary symbolic attribute for visualizing the architecture of complexity, enabling invariance, comparability, and interpretability across multiple scales (Section 4.2).
Token definition and extraction. Colour equilizated histogram-based and Benford -consistent tokens as minimal symbolic, physics-informed, visionumerical primitives for decoding original structural information (Section 4.3).
Universal metric design
The multifractal spectrum f(α) is adopted as the most informative descriptor of structural heterogeneity and of the architecture of analyzed systems (Section 4.4).
Together, these four components define a physics-driven hybrid symbolic–visionumeric architecture that underpins the SYM-Fractron, the two-dimensional digital components of the Digital Transformer, enabling consistent fracture and lithofacies digitalization and classification across scales.
The objective is to unify the inverse imaging problems addressed in this study by ensuring fidelity between observed measurements, data, and their reconstructed structural representations. These problems arise from multiscale datasets acquired through seismic exploration, optical imaging, X-ray tomography, and electron microscopy, which are typically stored as volumetric signal (.sgy) and image (.jpg or .bmp) files.
4.1. Which Number System Is Best Suited for Empirical Big Data Representation?
Visser’s seminal question – “Which number system is best suited for describing empirical reality? – is here reformulated in the context of Big Geodata analysis as the problem of identifying numerical representations appropriate for multisource, multiphysics, multidimensional, and multiscale empirical data [48].
In our approach, a rigorous theoretical entry point is provided by algebraic number theory, particularly through Ostrowski’s theorem and its implications for the metric theory of Diophantine approximation [49]. Classical results from Liouville’s 1844 theorem to Roth’s refinement establish sharp upper bounds on the approximation of algebraic numbers by rationals, thereby revealing intrinsic limitations in representing continuous quantities within the rational number system [50,51].
In contrast, applied geoscientific workflows routinely encode multiphysics metadata as floating-point values These representations – finite-precision encoding of real numbers defined by sign, exponent, and significand under the IEEE-754 standard [53,54,55]- are systematically transformed across heterogeneous computation pipelines. As a result, their original structural, spatial, and multiscale relationships with physical reality are progressively degraded or obscured.
This discrepancy motivated a central inverse problem addressed in this study: whether multiscale, multidimensional spatial encoding of numerical information can be reformulated into integer-based representations without loss of the structurally relevant information required for pattern characterization and cross-scale comparison [56]. More fundamentally, we ask whether shape-memory, as formalized by Song et al. [57], is preserved under integer-based encoding of multiscale spatial patterns.
A contemporary engineering parallel is the resurgence of integer-only learning. For example, Pirillo et al. [58] introduced the NITRO-D framework, enabling native integer-only training of deep convolutional neural networks under strict memory and energy constraints. Although DiT targets a different objective—physics-informed comparability and preservation of multiscale topology rather than hardware efficiency—the conceptual correspondence is clear. Integer-centric representations provide an effective route to reducing computational complexity while retaining structurally meaningful information across scales [56].
Empirical, field-driven results support a positive answer to the inverse problem, subject to specific constraints. Although the raw data are stored in floating-point format, we adopt integer-based color encoding - particularly grayscale – as a symbolic-numerical interface, providing spatial encoding and preserving statistical coherence [59].
This strategy retains the physics-informed topology of the original datasets while separating structurally meaningful information from noise-related numerical fluctuations. It enables multiscale comparison without black-box filtering. Within the present framework, Skeletonization is the next operational step, reducing Big Geodata to a structurally representative, integer-based network (Figure 7), with mathematical foundations detailed in [60,61].
Since its introduction in 2016, this skeleton-based p-adic representation has underpinned subsequent theoretical and field-based developments. Under these conditions, we posit that Big Geodata repositories admit a decomposition into two complementary components: (i) a discrete structural skeleton (StruS), encoded by absolute integer values; and (ii) a residual rational field acting as a perturbative numerical background. This formulation directly motivates the use of the p-adic number systems for metadata-geometry representation, providing a coherent metric-topological framework for physics-informed, color-symbolic, number-coded visualization. Two tightly coupled problems nevertheless remain: (i) How can integer-based analysis be systematically optimized for the representation and interpretation of multiscale Big Geodata? (ii) How can numerical information be encoded into integers while remaining consistent with physics-informed tokenization and enabling cross-scale multifractal comparison, without loss of structural patterns of their scale invariance under metadata transformations?
How Do We Propose to Optimize the Integer Analysis?
The optimization of integer-based analysis is motivated by the need to reduce the number of connected nodes in the Digital Transformer (DiT)—which may reach millions—while preserving the physically meaningful structure of the data.
Within the emerging framework of the Science of Science [62], where measurements, Big Geodata, analytical methodologies, and modeling converge [63], we propose that the topological organization of prime number clusters defines a Structural Skeleton (StruS) that serves as a set of fundamental primitives for representing multiphysics, multiscale information [64]. This representation enables a unified, physics-informed approach to data analysis and modeling.
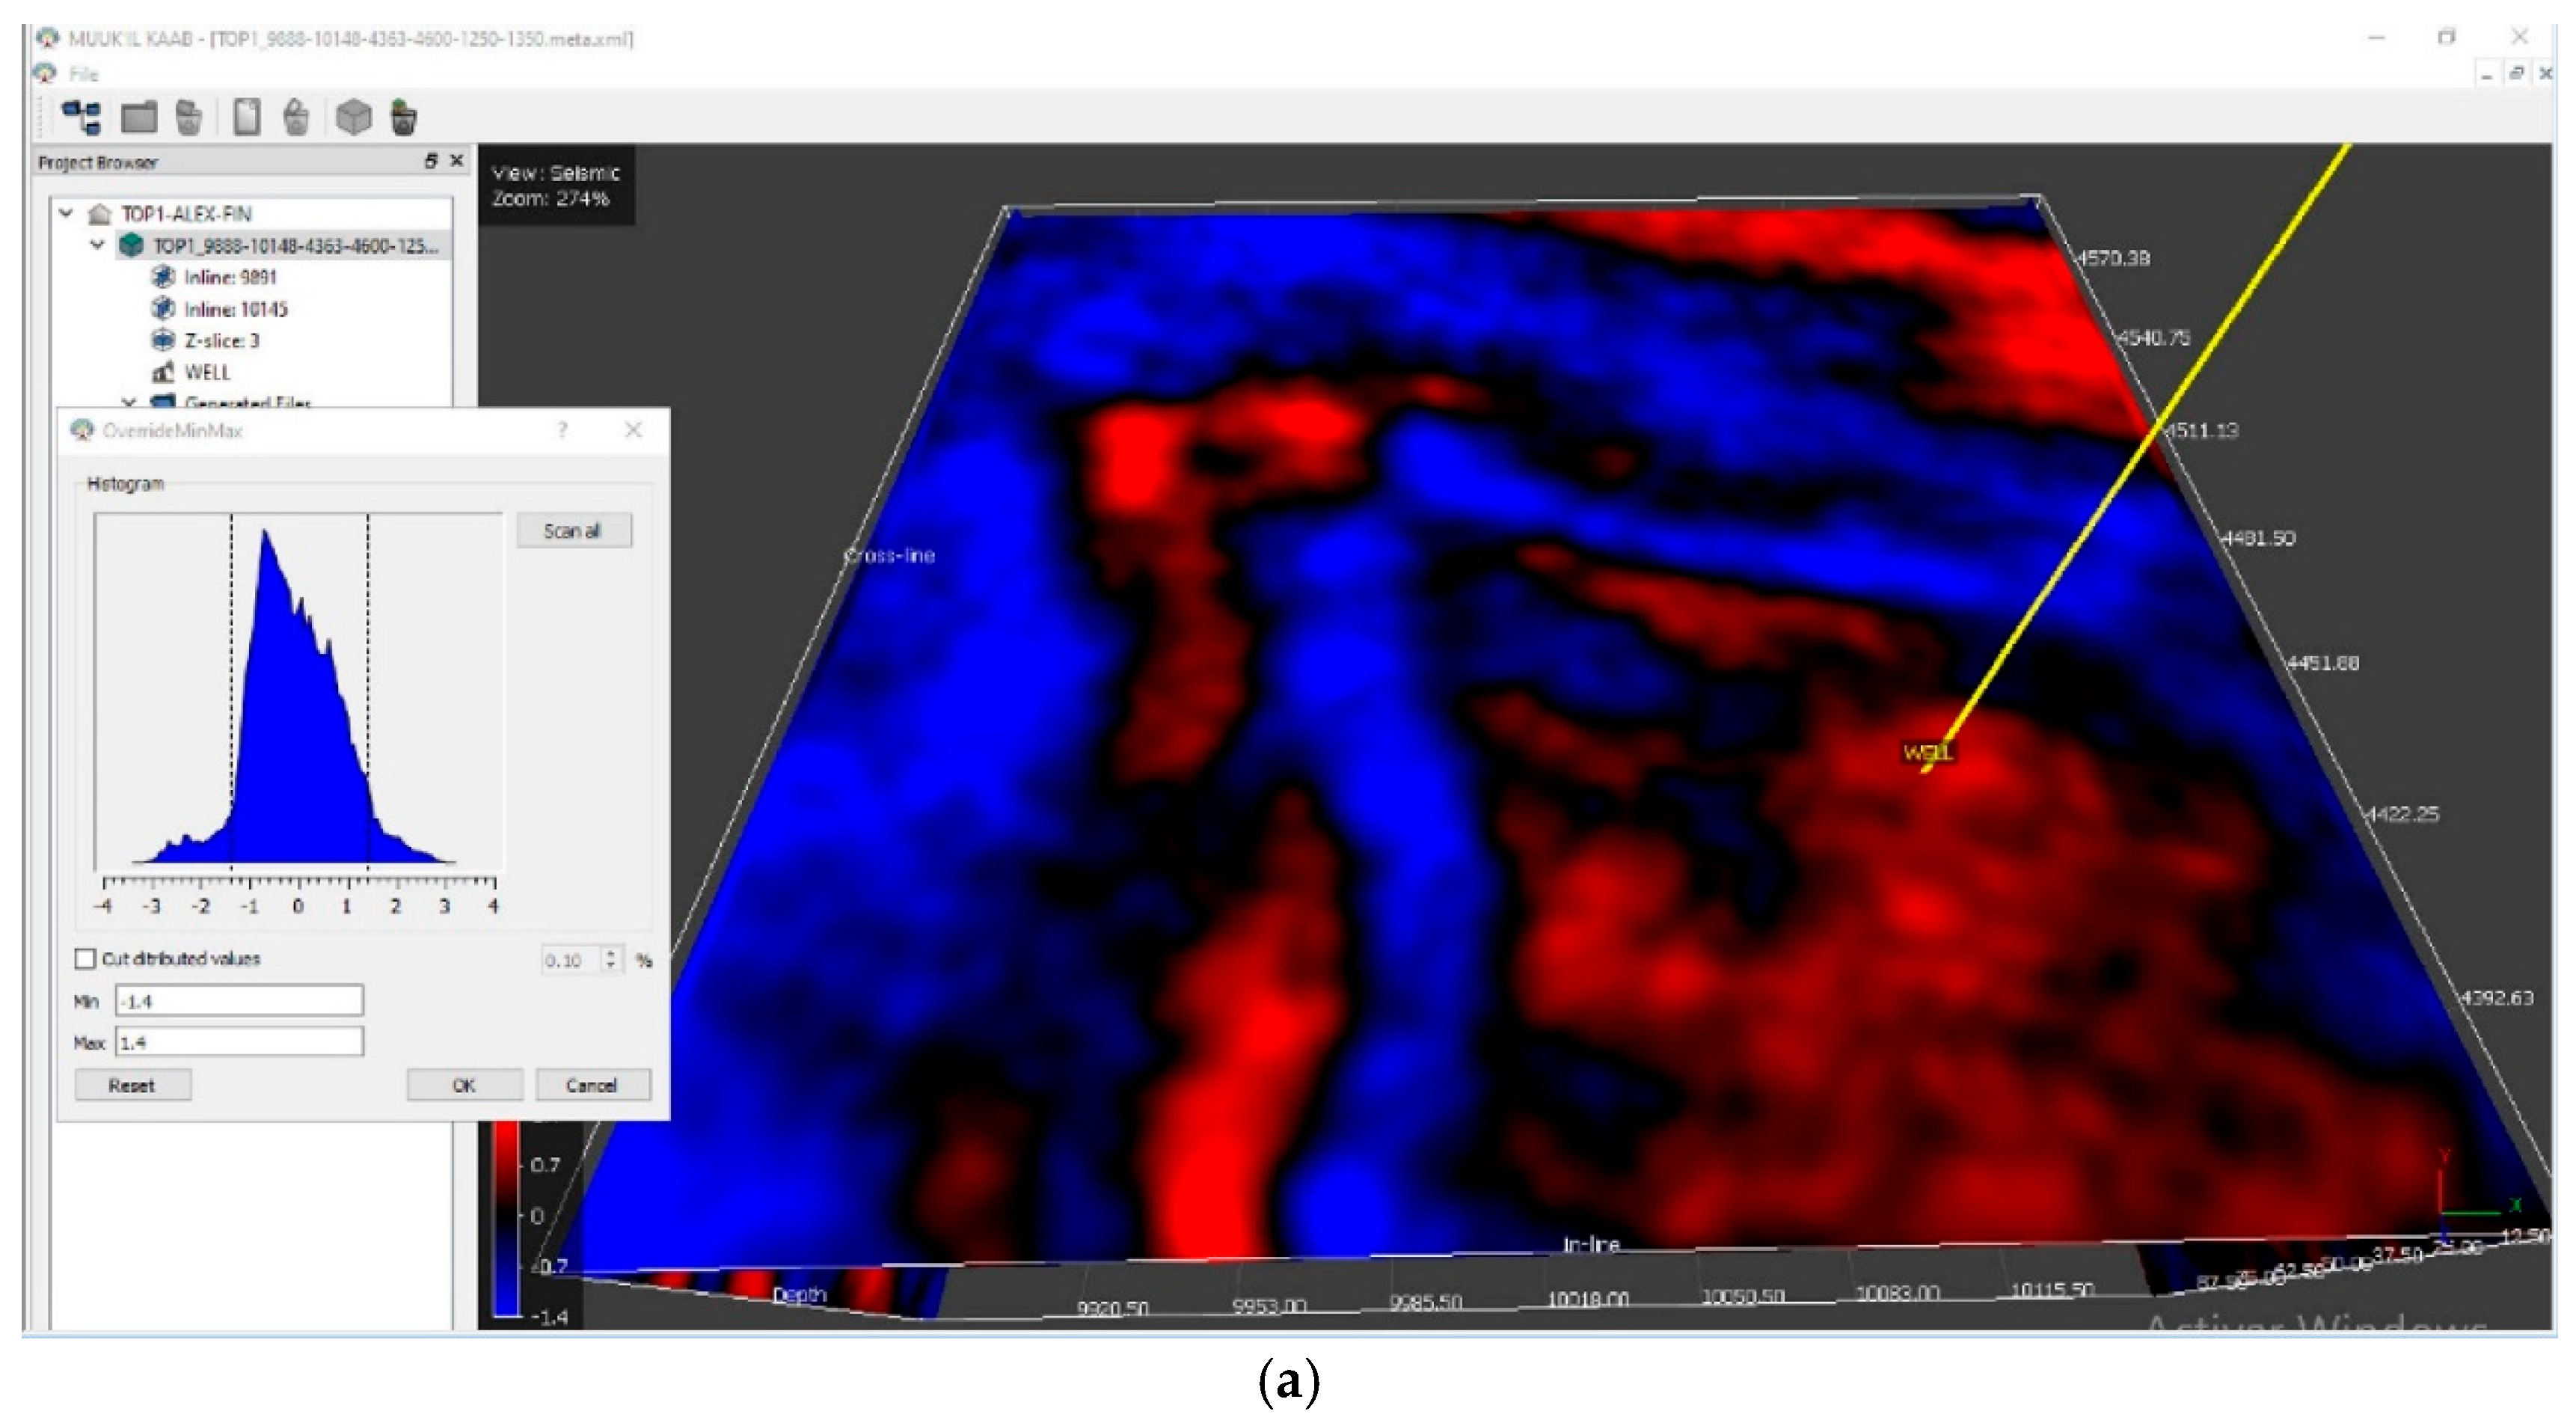
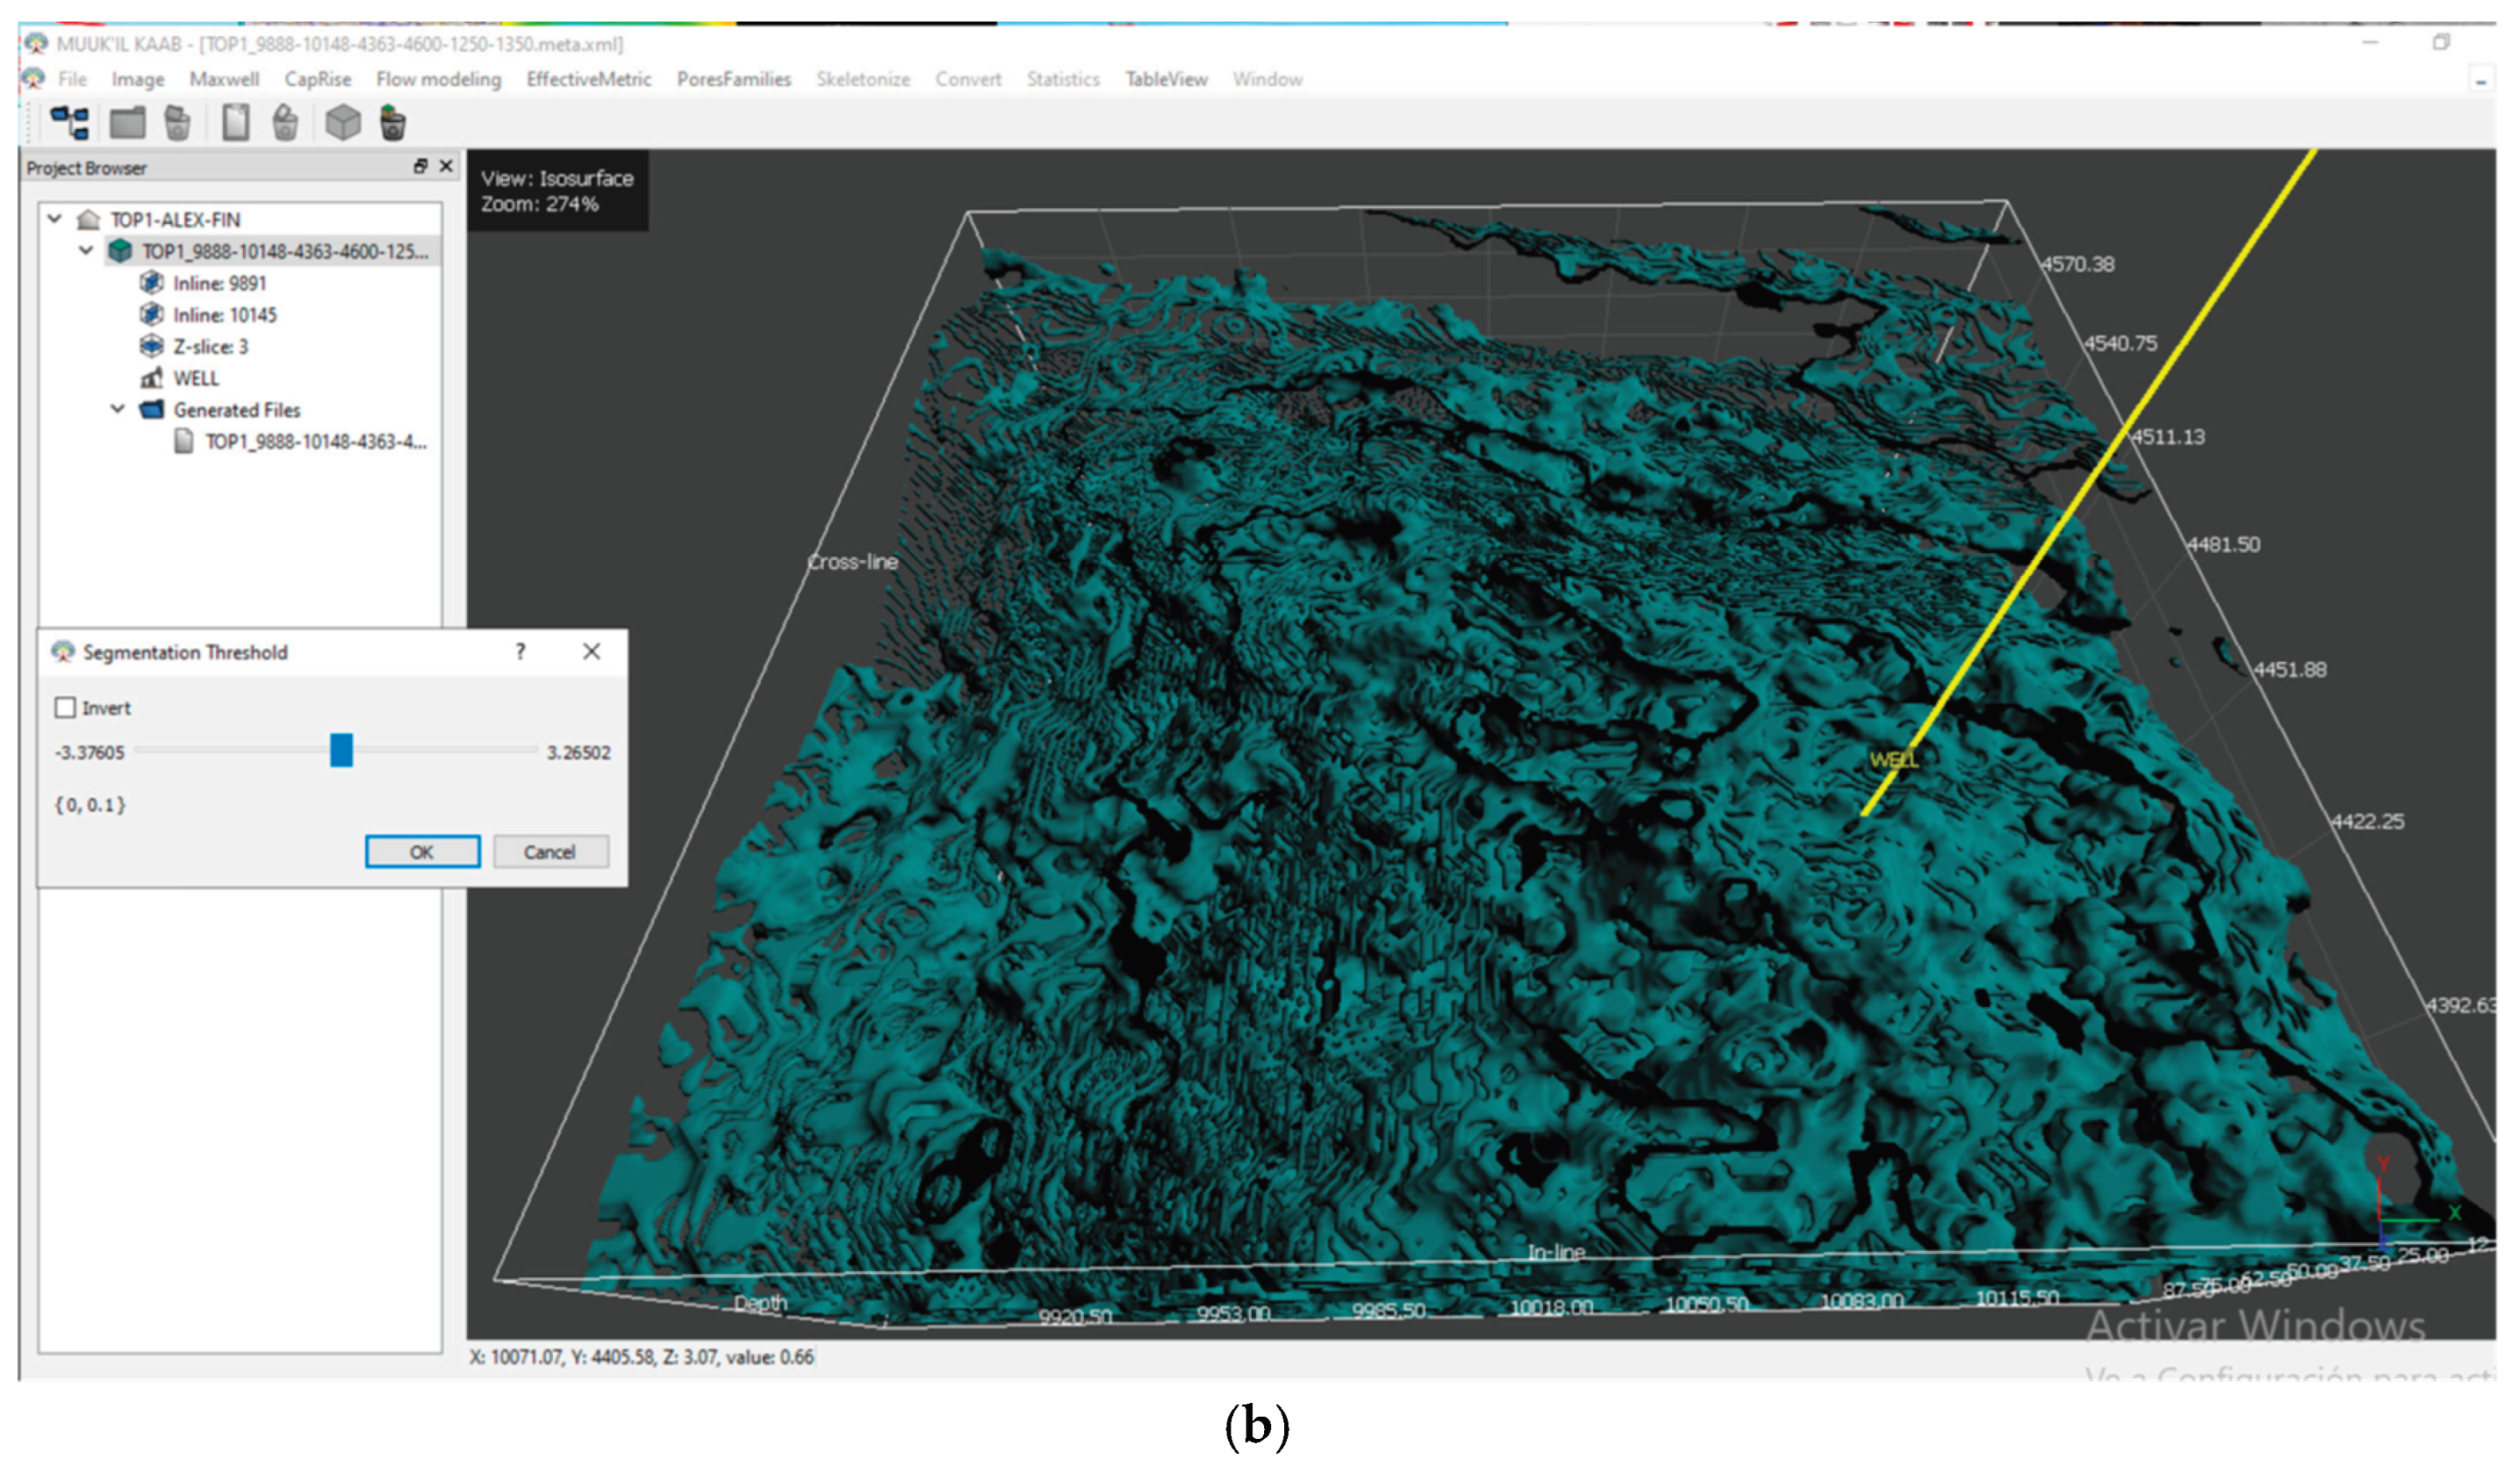
The algorithms for isosurface extraction and Skeleton construction are presented in a companion paper (Digital Transformer for Fractures classification: Part II-MIK). Here, we focus on the semantic and operational framework underlying the SYM-Fractron workflow, illustrated through Skeleton and isosurfaces derived from the same tomographic cube (Figure 7a). The design process begins by visualizing the user-selected optimal range of values extracted from the corresponding colour-encoded equilizated histogram. Note that isosurfaces, by definition, represent surfaces of constant value for a selected attribute (in this case, the range of sensor trace amplitudes), while the Skeleton represents the connected neuronal network, where the nodes with the same amplitude value are connected (Figure 7Figures –Figure 8).
The workflow begins with selecting of an optimal value range from a colour-encoded, histogram-equalized distribution. Isosurfaces represent loci of constant scalar values- here, sensor trace amplitudes- whereas the Skeleton encoded the connected structural linking nodes of eigenvalues extracted from the three-dimensional raw data values corresponding to the Macro Texel (Figure 7 and Figure 8).
The three-dimensional raw data volume (Macro Texel) is used as input and subsequently partitioned through visuonumerical tokenization into Micro Texels. The resulting Micro Texels define discrete tokens whose spatial distribution reflects the intrinsic architecture of complexity of the data, enabling the Identification and multiscale representation of features of interest, particularly pores and fracture systems. In this formulation, integer-based primities provide the bridge between topological structure and tokenized representations, enabling the construction of Digital Twins that preserve the multiscale architecture of complexity.
The division of the Macro Texel into Micro Texels (visuonumerical tokens) reflects the architecture of complexity of the analyzed information volume and the spatially encoded distribution of features of interest – namely, pores, with special attention to different types of natural fractures in our case (Figure 7a). The validity of this partitioning is verified visually and through a set of statistical attributes (Figure 6a).
Gray-scale representations are derived from spatially encoded numerical matrices constructed directly from unfiltered X-Ray measurements of scattered radiations. The primary objective is to identify hidden patterns in the multiscale distribution of prime numbers within scattering data, spanning scales from seismic exploration to X-ray tomography, while avoiding high-dimensional colour representations [64].
Within the Digital Transformer (DiT) framework, each two-dimensional color image – typically corresponding to a slice of MIK seismic or grey scale tomographic slices - is decomposed into two complementary sets defined on the same spatial grid:
- (i)
- a prime-number matrix, in which prime values preserve their original spatial position;
- (ii)
- a complementary integer matrix, in which composite values are encoded as the counterpart of the prime-number component.
This decomposition establishes a dual integer representation that preserves spatial structure while enabling prime-driven, hidden-pattern detection of architecture of complexity across scales [65].
Both number families (primes and composite numbers) are subsequently incorporated into the tokinezation process of the Digital Transformer, as well as into the subsequent multifractal pre-training stage for primitive classifications and statistical comparison (Figure 8).
The results shown in Figure 8 demonstrate that prime-number encoding preserves [66] and reveals the intrinsic architecture of complexity embedded in physical data, enabling a direct bridge between arithmetic structure and multiscale geophysical organization.
In this framework, prime numbers are not treated as abstract mathematical entities, but as operational primitives that retain spatial coherence and encode structurally relevant information across scales. Their complementary relationship with composite numbers gives rise to symmetric statistical distributions, reflecting an underlying arithmetic duality that is preserved within the data.
This construction is grounded in the Fundamental Theorem of Arithmetic, which guarantees that every integer admits a unique prime factorization. Consequently, the complementary composite-integer matrix can be fully decomposed into its prime constituents, allowing the entire numerical representation of Big Data – and its corresponding Digital Transformer – to be expressed exclusively in terms of primes.
This observation provides the foundation for a physics-informed tokenization strategy, in which prime-based structures serve as the minimal units of representation within the Digital Transformer (DiT). Each cluster of statistically and spatially coherent tokens can thus be interpreted as a scale-invariant DigitalTwin of the underlying physical system.
Taken together, these results suggest a unifying paradigm in which primes-primitives-tokenization-Digital Twins define a consistent pathway from pipelines of raw physical measurements, data, algorithms, and models to their structured computational representation, enabling multiscale comparison, learning, training, and interpretation within a common mathematical framework.
Therefore, primes emerge as operational primitives that enable physics-informed tokenization of complex systems, establishing a direct pathway from the architecture of physical reality to its Digital Twin representation.
A related visualization approach was previously illustrated in The Riemann Hypothesis in One Picture [67]. In more technical terms, Li et al. introduced a coding scheme, Unifying Colors by Primes [68], proposing the universal color system C235, grounded in a number-theoretic encoding based on prime numbers and Goldbach’s conjecture.
By contrast, the Digital Transformer (DiT) framework addresses the inverse problem: decoding, extracting, mapping, visualizing, and statistically analyzing prime-number patterns (clusters or tokens) directly from measured physical data within a spatially preserved numerical matrix.
Building on our earlier perspective articulated in The Primes are Everywhere, but Nowhere… [64], the present work advances toward a “Making Prime Numbers Work” perspective, in which prime structures are not only identified, but actively mobilized as in-context algebraic operational primitives within physics-informed computational architectures.
4.2. Which Symbolic Attributes Are Best Suited to Integer-Based Numerical Matrix Tokenization?
To address this question operationally, and following the proposal of Meidani et al. [47] on bridging symbolic and numerical domains through unified pre-training, we adopt a principle inspired by attention-guided representations in vision transformers [69]: symbolic attributes should be selected not for aesthetic encoding, but for their ability to preserve comparability, scale invariance, and interpretability under the transformations required for multiscale, physics-informed tokenization and learning [70].
The relevance of symbolic representation in scientific reasoning is not new. As early as 1891, Nature published a short note by Oliver J. Lodge (“The Meaning of Algebraic Symbols in Applied Mathematics”), raising a foundational question: what plays the primary role in physical reasoning—the numerical value itself, or the symbolic form used to represent it? [71]. Contemporary modeling approaches echo similar perspectives, for example, in “biology by numbers” frameworks [72] and in studies emphasizing the role of small sets of physically meaningful constants in describing large-scale system behavior, such as the six-number framework proposed for the Universe [73].
Our objective is not to revisit this classical debate, but rather to emphasize that, within Artificial Intelligence, symbolic representations can substantially reduce the effective data volume while preserving relevant information – particularly when symbols are explicitly derived from, or linked to, the topology, physical constraints, and multiscale invariants of the system. Within the Digital Transformers framework, this form of symbolic compression enables the visualization and analysis of Big Data topologies through interpretable, image-based representations. This selection principle defines the symbolic layer upon which tokenization is constructed.
4.2.1. Symbolism of Color for Visuonumerical Primitives Extraction
The workflow begins in MIK by encoding and visualizing raw data as three-dimensional, color-structured volumes spanning a continuous spectrum of millions of color values. Color symbolism constitutes a natural component of human perception and an efficient mechanism for cognitively guided visualization, capable of capturing fine-scale features while preserving semantic consistency [74]. As such, color represents one of the primary channels through which physical information is translated into interpretable mental representations [75]. However, drawing on Marvin Minsky’s “Society of Mind” framework and his broader contributions to artificial intelligence, color should not be regarded as a simple or absolute quale that can be treated as an isolated symbol. Rather, it emerges from a complex, physics-informed cognitive process shaped by functional, contextual, and computational factors [76]. In this context, color operates not as a superficial visual attribute, but as a structured, cognitively grounded carrier of physically meaningful information, forming the basis for the subsequent extraction of visuonumerical primitives.
Recent electrophysiological and neuroimaging studies suggest that the brain encodes visual categories and abstract concepts through structured algebraic representations, sometimes referred to as “brain algebra” [77], further supporting the role of symbolic encoding in cognition. An illustrative example of the usefulness of this approach for mathematical visualization, within in context algebra physics-informed primitives, token-based vision transformers, and Digital Twins for solving partial differential equations is presented in Figure 9. This data further supports the role of symbolic and algebraic encoding in cognition and its relevance for physics-informed computational representations.
Marvin Minsky, in The Society of Mind, emphasized that color recognition can be readily implemented in artificial systems using sensors that are responsive to different wavelengths of light. This observation highlights the close relationship between sensory encoding, symbolic representation, and machine perception – an idea consistent with the symbolic color-based encoding strategies adopted in the present Digital Transformer framework [76]. A strong semantic interconnection underlies color systems, color theory, primitive visual elements, and tokenization mechanisms, enabling their consistent use as physically interpretable symbolic carriers across multiscale visual representations [77,78,79].
Within the MIK ecosystem, the color gamma can be selected by the user or extended through additional scales, depending on the specific analytical objectives. Available options include transformations from binary images (black-and-white or user-defined color palettes) to grayscale representations, as well as to color schemes comparable to those commonly used in geoscience and imaging software, such as seismic interpretation workflows.
Once the dataset is loaded into MIK, the corresponding histogram of real-value distributions becomes available for inspection. At this stage, ranges of symbolic colors relevant for subsequent structural and statistical analysis can be visually, numerically, and physics-informed identified. Histogram equalization is then applied as a contrast enhancement method that remaps pixel intensity values toward a more uniform distribution, or, in our case, more representative of fractures’ histogram distribution, enhancing the detectability of structurally meaningful patterns, particularly those associated with fracture systems. Within the Digital Transformer framework, this operation constitutes the initial stage of data symbolization, whereby continuous numerical information is transformed into a structured symbolic representation, enabling the visuonumerical identification of the corresponding Digital Twins across scales.
Figure 10.
a. Raw seismic amplitude cube and equilized histogram representation. Digitalized seismic-amplitude volume with its corresponding amplitude histogram. The designed well trajectory is highlighted in yellow. b. Raw seismic data cube showing the amplitude range used for isosurface construction (indicated in the bar). The optimized well trajectory (yellow) intersects the most connected fracture volume. Notably, the extracted decoded volume corresponds to approximately 0.1% of the equilized amplitude histogram.
Figure 10.
a. Raw seismic amplitude cube and equilized histogram representation. Digitalized seismic-amplitude volume with its corresponding amplitude histogram. The designed well trajectory is highlighted in yellow. b. Raw seismic data cube showing the amplitude range used for isosurface construction (indicated in the bar). The optimized well trajectory (yellow) intersects the most connected fracture volume. Notably, the extracted decoded volume corresponds to approximately 0.1% of the equilized amplitude histogram.
In this sense, color selection operates as a controlled symbolic filtering mechanism that defines the initial tokenization space for subsequent multiscale analysis.
4.2.2. Anatomy of a Color Histogram of Primes
The theory and practice of image processing in computer science and engineering traditionally emphasize noise filtering, segmentation, and feature extraction, with particular attention to pixel grouping and color analysis. These topics are extensively documented in the literature and fall beyond the scope of the present work [78]. However, when images encode raw scientific data rather than conventional visual scenes, additional fundamental questions arise, leading to what was termed the anatomy of the color histogram [79].
A detailed understanding of color distribution, histogram structure, and their statistical relevance has become increasingly important across imaging-based scientific disciplines, particularly for improving metadata tokenization [80]. Color histograms are widely recognized as key tools in physics-based vision, especially for identifying the location, extent, and orientation of color clusters [79]. Nevertheless, the symbolic and structural role of color as a universal, physics-informed metadata encoding mechanism remains insufficiently explored.
Within the MIK and SYM-Fractron frameworks, once three-dimensional and two-dimensional visualizations are established, the grayscale histogram of encoded integer values is interpreted as a probability distribution over two complementary sets: primes, representing the Structural Skeleton (StruS), and composite numbers, representing their spatial complement. This formulation provides a direct visualization of the underlying structural skeleton defined by prime-number distributions. In practice, only three to four statistically dominant gray levels are often sufficient to contextualize the selected tokens, revealing their structural relevance within individual images or across specific zones of interest in both real-world data and their corresponding mathematical representations.
This behavior is illustrated in Figure 11, where the dominant histogram mode associated with prime value 11 delineates a connected structural domain within the fracture network. This correspondence supports the interpretation of prime-based histogram modes as indicators of structurally coherent regions, while remaining consistent with the power-law-like distribution of gray levels in the prime-associated probability distribution function. Although no explicit parametric fitting is performed, the observed distribution exhibits a pronounced heavy-tailed behavior, consistent with scale-dependent organization of the prime-defined structural skeleton (see Section 2.2.2).
This strategy addresses two central methodological questions: (i) which fraction of the original information remains structurally meaningful after successive transformations, encoding steps, and metadata-driven analytical processing; and (ii) how can this information be most effectively visualized and statistically compared? Closely related is the question of how connectivity among pixels with similar color encoding is preserved throughout these transformations and how it can be numerically represented.
In multisource, multiscale geophysical image analyses – including seismic imaging, formation microimaging, well logging, microscopy, and tomography - color encoding integrates physics-informed measurements with spatial and temporal metadata. The most frequent histogram value associated with prime may correspond to a dominant tone covering large pixel areas, which can be converted into direct hydrocarbon indicators (DHI), or reflect the complexity of the background exploration conditions. Empirical observations within our framework suggest that, in fracture analysis, statistically dominant colors often correspond to structurally significant features; however, spatial connectivity and contextual organization must be evaluated on a case-by-case basis, reflecting the transition from local, ad hoc interpretations to the underlying architecture of complexity of the attention landscape.
These considerations indicate that interpreting color distributions in complex-system imagery must not rely exclusively on frequency statistics, but should incorporate spatial topology, connectivity, and context-dependent encoding strategies to ensure physically meaningful further interpretation.
We begin with a simple yet robust visionumerical observation; empirical Big Data distributions rarely follow Gaussian behavior; instead, they exhibit skewed, heavy-tailed, or scale-free characteristics across resolutions. Consequently, classical second-order statistics are insufficient to describe their internal organization during machine learning, deep learning, or data-driven mining and training. To address this limitation, we adopt a histogram-based tokenization strategy, treating the distribution of integer-coded values as a structural network rather than a summary statistic.
Within this framework, histogram bins are interpreted as symbolic tokens, each representing a statistically coherent population of values with similar structural roles. The histogram thus functions as a symbolic map of the data cloud, encoding density, intermittency, and contrast in a form directly compatible with image-based representations.
Histogram-derived tokens are dimensionless and comparable across datasets, making them well-suited for cross-scale and cross-modality metadata analysis. Because they are derived from integer representations, they preserve spatial encoded coherence, enabling consistent visualization across resolutions.
4.2.3. Topological and Statistical Constraints: Four-Color Theorem and Benford´s Law
Within the proposed Digital Transformer framework, symbolic encoding is not arbitrary but constrained by both topological and statistical regularities inherent to empirical data. Two complementary principles govern this encoding: the four-color theorem, which imposes minimal topological constraints on planar partitioning, and Benford´s law, which characterizes the statistical distribution of numerical values across scales.
The four-color theorem ensures that any planar segmentation of spatial data can be encoded using a minimal set of symbolic states while preserving adjacency relations [81,82]. In the context of color-based image representations, this result provides a natural constraint for defining discrete symbolic domains, where each region can be uniquely identified without ambiguity in neighboring interections. Within this formulation, color becomes not merely a visual attribute but a topologically consistent symbolic carrier, enabling structural encoding of spatial relationships across multiscale datasets. When a two-dimensional image encodes structured physical information, it can be interpreted as a planar partition, rendering the theorem directly applicable as a foundation for image decoding and topologically consistent symbolic tokenization. Accordingly, SYM-Fractron adopts a color-encoding strategy grounded in the Four-Colour Theorem to enforce adjacency constraints in image-based representations [83,84].
Within this framework, integer-encoded spatial Big Geodata clouds are transformed into planar or quasi-planar partitions via gridding, skeletonization, or projection. The Four-Colour Theorem provides a minimal yet sufficient symbolic alphabet for encoding adjacency relations within these partitions [85]. Each color cluster acts as a symbolic token (visionumerical primitive) representing topological separation, while the associated integer magnitude encodes the discretized physical signal embedded in the image.
Complementary to this, Benford´s law governs the statistical organization of numerical values underlying such symbolic representations [86,87,88,89]. Rather than treating deviations from uniform digit distributions as anomalies, the present framework interprets Benford conformity as a signature of scale invariance and multiplicative processes embedded in the data.
When integer-encoded representations follow Benford-like distributions, the associated color histograms provide a direct quantitative approximation for hierarchical organization and multiscale structure. This suggests the logarithmic scaling may constitute a statistically preferred encoding principle in both natural and computational systems.
Taken together, these two constraints define a structured attention landscape, in which symbolic tokens are simultaneously organized by spatial adjacency (topology) and numerical scaling laws (statistics). Within this landscape, token interactions are not arbitrary but are governed by physically meaningful rules that preserve both local connectivity and global-scale consistency.
Furthermore, the compatibility of prime-number-based representations with Benford´s law, as shown by Kolpakov and Rocke [90], reinforces this unified perspective. Our empirical results on prime extraction from real-world grayscale images are consistent with this finding, showing that primes become increasingly sparse with magnitude within bounded intensity intervals. This behavior supports the interpretation of prime-based encodings as intrinsically scale-consistent carriers of structural information, naturally embedded within the combined topological-statistical constraints of the proposed symbolic-numeric framework.
Within this formulation, the resulting color-constrained partitions define a structured attention landscape, in which token interactions are governed by topological adjacency and a multiscale organization, reflecting the underlying physical constraints and scale-invariant shape-morphing processes.
Another significant manifestation of Benford's law arises in emergent computational domains where its logarithmic structure provides a robust statistical prior. In digital image forensics, for example, deviations from the expected first-digit distribution after the discrete cosine transform (DCT) have been successfully used to identify non-authentic or manipulated images [87].
More recently, this principle has been extended to the rapid development of Large Language Models (LLMs) through the Benford-Quant (BenQ) framework, a data-free, non-uniform quantization strategy that exploits the logarithmic distribution of leading digits to preserve the statistical structure of model parameters while reducing numerical precision requirements [91].
These developments suggest that Benford-consistent representations are not merely statistical artifacts, but rather reflect deeper structural constraints governing numerical data across domains.
Building upon this perspective and leveraging the structural correspondence between ordered integer sequences and index-based symbolic encodings over finite alphabets, we introduce the Numerical Spatial Encoding Model (NSeM). NSeM establishes a mathematically consistent mapping between spatially structured integer-arithmetic representations and tokenization mechanisms underlying Large Language Models, thereby providing a unified framework for visuonumerical encoding and multiscale analysis of metadata.
4.3. Binary–Symbolic Spatial Encoding for Token Construction
Tokens can be understood as the minimal units of symbolic encoding extracted from structured data sequences, a concept formalized in Artificial Intelligence and more broadly discussed within the Theory of Knowledge [92]. Tokenization refers to the process of identifying and constructing these units from input data streams, typically numerical, and constitutes a fundamental operation in Large Language Models (LLMs), where underlying algebraic structures are translated into discrete symbolic representations [93].
A central challenge in this process is to preserve the essential algebraic, topological, and statistical properties of the original data while avoiding numerical instability. This problem can be reformulated into two key questions: how to define an optimal visuonumerical tokenizer for visual and digital transformers [94], and how to perform efficient statistical token pruning without loss of structurally relevant information.
To address these issues, Sadeghi et al. [94] proposed a fixed-length numerical embedding scheme that defines a Neural Isomorphic Field within the rational number domain, enabling a consistent mapping between numerical values and their symbolic representations while preserving intrinsic structural relationships.
Building upon these developments, we introduce a Binary-Symbolic Spatial strategy implemented within the SYM-Fractron framework, designed to extract tokens directly from spatially structured numerical data. In contrast to purely sequence-based tokenization approaches, the proposed method operates on two-dimensional visionumerical fields, where each token preserves its spatial position, local topology, and associated statistical signature.
In this formulation, tokens are defined as binary-symbolic primitives derived from integer-based representations, enabling a consistent mapping between numerical values, color encoding, and symbolic structure. This approach ensures that tokenization remains physically interpretable and invariant under multiscale transformations, while significantly reducing numerical complexity.
Furthermore, the resulting token sets define an attention landscape in which interactions are governed not only by statistical similarity but also by spatial adjacency and structural constraints. Within this framework, groups of tokens exhibiting similar visual and statistical properties give rise to Digital Twins at a given scale, thereby enabling consistent multiscale comparison across heterogeneous datasets.
Image tokenization has become a fundamental procedure in computer vision and, more generally, in Artificial Intelligence. The principle, often summarized as "All in Tokens," is relevant to both soft and hard token design strategies [95]. Our research aligns more closely with the framework proposed by Todd's group, particularly with the concept of In-Context Algebra [96].
At the input level, SYM-Fractron operates on integer-coded representations derived from spatial encoding of the raw data cloud. These integers are transformed into binary spatial representations – distinguishing prime and composite numbers – thereby enabling efficient storage, comparison, and bit-level operations. Binary encoding further facilitates compatibility with histogram-based tokenization and integer-only learning paradigms.
Symbolic attributes—derived from histogram anatomy, Benford distributions, and Four-Color constraints—are subsequently superimposed onto the binary scaffold. The resulting binary–symbolic tokens constitute the fundamental units of the attention landscape within the Vision Transformer. Each token encapsulates spatial location (via georeferencing data), discrete structural role (integer and binary encoding), symbolic topology (color and histogram class), and multiscale relevance.
This hybrid encoding ensures that attention weights are not assigned solely on the basis of numerical similarity, but instead reflect statistical distributions, topological adjacency, symbolic separation, and scale-invariant structure.
Prime-Based Tokenization within the Digital Transformer for Physics-Informed Unifying Color Encoding
Having established the role of integers - and prime numbers in particular- as the structural skeleton of discrete, space-encoded information, the next objective of SYM-Fractron is to visualize the topology of raw two-dimensional Big Data clouds. This transformation converts numerical structure into interpretable image-based representations suitable for vision-driven analysis, learning, and training.
To ensure that this technology remains practical and reproducible, we adopt the following guiding principles: symbolic attributes should not be selected for purely aesthetic purposes, but for their universality and their ability to preserve comparability, visual clarity, scale invariance, and interpretability under the transformations required by multiscale, physics-informed learning and advanced machine training. Accordingly, color is retained as the primary encoding modality for tokenizing prime-number patterns. Within this framework, we bridge visonumericalbased primitives analysis with physics-informed, chemically grounded knowledge, contributing more broadly to the democratization of complex-system modeling through the Digital Transformer paradigm.
Within SYM-Fractron, this principle motivates the selection of symbolic encodings grounded in classical theorems and empirical statistical regularities. In this work, we empirically demonstrate how the Four-Color Theorem, histogram anatomy, and Benford's law can be operationalized as a unique set of symbolic attributes that preserve topological consistency while enabling efficient visualization, comparison, and classification of fracture and lithofacies patterns.
5. Scale-Invariant, Physics-Informed Tokenization of Big Geodata
The final conceptual question addressed in this first part of our twin papers concerns the relationship between symbolic tokenization, p-adic representations, and multifractal characterization. Recent studies indicate that fractal pattern recognition can guide both future token prediction and efficient token pruning in Vision Transformers [97,98]. Beyond these advances, the present work introduces, to the best of our knowledge, the first Digital Twin-based formulation in which tokens are defined as visuinumerical primitives linked to the physical architecture of the studied system. Among the descriptors available in multifractal analysis, the singularity spectrum f(α) has proven particularly effective at capturing the heterogeneity and intermittency of complex systems [99,100].
Within SYM-Fractron, histogram-based, four-color-constrained, and Benford-consistent tokens establish a direct bridge between measurements, raw data, statistical regularities, and the mathematical representation. By grouping integer-coded values into statistically coherent bins, the proposed absolute-prime dual tokenization defines probability measures directly compatible with the multifractal formalism. These measures are inherently normalized, dimensionless, and robust across scales.
Empirical analysis within the MIK ecosystem demonstrates that variations in histogram structure and leading-digit distributions are strongly correlated with changes in the shape and width of the f(α) spectrum. This relationship supports the use of histogram-derived tokens not only for visualization and classification, but also as diagnostic indicators of multifractal behavior and as a basis for metadata-driven training of representative image libraries.
For these reasons, the singularity spectrum f(α) is selected as the primary quantitative descriptor of the architecture of complexity within SYM-Fractron. Its integration with symbolic tokenization enables a unified treatment of numerical, symbolic, and visual representations, consistent with the physics-informed objectives of the framework.
Figure 12 presents two representative types of fracture patterns derived from SYM-Fractron analyses based on the decomposition of spatially encoded numerical fields into prime-number structures and their composite complement. These patterns correspond to two contrasting topological regimes: (i) near-circular geometries, here referred to as Rose patterns (Figure 11), and (ii) highly complex, anisotropic morphologies, such as the Fenix or Crazy Bird Patterns (Figure 5), commonly observed in dolomitized carbonate systems. The contrast between these regimes is consistently reflected in the corresponding singularity spectrum f(α), where Rose patterns exhibit relatively narrow and near-symmetric distributions, indicative of lower structural heterogeneity, while Fenix-type patterns display broader and right-skewed spectra associated with increased intermittency, anisotropy, and multiscale complexity.
This classification emerges naturally from the proposed visuonumerical tokenization framework, in which integer-based representations preserve the data's structural skeleton while enabling a physically consistent encoding across scales. Within this formulation, prime-number components act as discrete carriers of structured information, whereas the complementary composite numbers field captures the surrounding numerical background, together defining a coupled representation of fracture geometry and spatial organization.
Seven additional fracture patterns identified within the same raw seismic cube- used to guide well trajectory optimization (Figure 10)- span a continuum of structural complexity, ranging from simple linear fractures (Figure 4 and Figure 6) to fully developed Fenix-type morphologies. These intermediate regimes provide further evidence of spatial transitions in fracture organization and shape-morphing driven by local chemical and biological conditions. These new patterns will be presented in the second paper of this twin presentation.
A broader multifractal spectrum f(α) reflects an increased range of singularity strengths, indicating higher structural heterogeneity and enhanced multiscale intermittency within the system. In this example, the Fenix-type configurations exhibit broader, more asymmetric spectra, consistent with their greater structural complexity.
By contrast, Rose patterns correspond to more compact spectra, reflecting a more uniform organization. However, it is important to note that the Rose geometry represents an individual visuonumeric primitive, while the Fenix patterns emerge from the interaction and superposition of multiple primitives. Therefore, the in-context comparison should be interpreted within this hierarchical context, as it reflects not only differences in heterogeneity but also differences in compositional and structural space organization.
5.1. Mathematical Background
This section provides the mathematical framework for modeling complex, irregular physical phenomena—such as seismic wave propagation and geoscientific imaging—using the interplay between p-adic analysis and multifractal geometry. Traditionally, Euclidean geometry struggles to describe the "jaggedness" of porous rock or biological tissues. This approach solves that problem by bridging two distinct mathematical worlds:
- The p-adic Domain (Q_p): A non-Euclidean number system structured like a tree. Its inherent hierarchy makes it a natural fit for describing systems that branch or scale at different levels of detail.
- The Euclidean Domain: Our physical reality. By using the Monna-type map, we can "translate" the hierarchical p-adic structure into traditional space, where it manifests as a fractal or multifractal set.
By mapping physical signals (such as seismic data) into this p-adic framework, we applied the p-adic wavelet approach. These wavelets are uniquely efficient at decomposing "noisy" or highly irregular signals into organized components. Finally, this section introduces how reaction-diffusion equations—which describe the fluids or heat flow through complex hierarchical media—can be solved more elegantly in the p-adic domain and then "lifted" back to provide real-world insights into the architecture of porous materials like the Dolomites.
5.2. Multifractal and p-Adic Modeling of Computing Tomography and Seismic Waves, and Images
Let us fix a prime number and a natural number . Any -adic number can be represented in the form of the series:
Then this is a multifractal subset on the real line with discrete spectrum n.
By using the above construction of a representation of in the Euclidean space
in combination with the generalized multifractal construction, we obtain the representation of in the form of multifractal subsets of the Euclidean space.
We begin with investigating the correspondence between processes with real and adic arguments using the Monna-type map, which maps adic numbers on the subset of the positive half-line:
Denote the image of under this map
i.e., We can lift the Haar measure from to
where is a Borel subset of the space
We have:
The map is continuous. If , then it is injective and is homeomorphic.
It happens that, for , the image set is a fractal subset of .
from , to , where A is a Borel subset of the space
We have:
It happens that, for , the image-set is a fractal subset of
Thus, the set of p -adic numbers can be used for the representation of the special class of fractals of the fractal dimension < 1. In fact, these fractals are generalizations of the Cantor set fractal.
Example. (Cantor set as the image of the 2-adic unit ball). Let us consider a modification of the map , which we denote by the same symbol:
We select the normalization constant A in such a way that . We recall that , coincides with the 2-adic unit ball . It is easy to see that
Such normalization is not important for our further studies, but, for a moment, it will be useful to couple the images of p-dic balls with well known fractals. Now select and , i.e, , so:
In particular, on it has the form:
Then the image of , coincides with the Cantor set , i.e., . Now, let us consider the decomposition of into the disjoint union of balls of the unit radius: where
Denote by the image of the ball . These sets are homeomorphic to the Cantor set . In fact, they are shifts of by natural numbers of the form , i.e., Thus the image of , the set , can be represented as the disjoint union of shifts of the Cantor set.
We can repeat the above considerations for any and. We modify the map as in (1) with the constant A given by (3). Then is a subset of the segment generalizing the ordinary Cantor set. The complete image , can be represented as the disjoint union ot shifts ot this Cantor-like set,
Now we present the construction which provides a possibility of fractal representation of p-adic fields in the Euclidean space . Select an injective map . Thus numbers 0,1 are represented by vectors . Fix a natural number again.
Now we generalize the Monna-type map to the vector case:
where y . Set . It can be shown that in this way it is possible to obtain the most essential examples ot the tractal subsets of for example, the Sierpiński gasket.
5.3. Multifractal Representation of p-Adic Numbers
Now we proceed to the p-adic modeling of multifractal sets. Select some radius and represent , as the disjoint union of balls of this radius, these balls can be numbered by their centers, , here
Now we select the sequence of natural numbers n , the numbers in this sequence can coincide. Consider a family of maps
where , from , to and restrict them to the corresponding balls:
set now and, finally,
Then this is a multifractal subset of the real line with the discrete spectrum n.
By using the above construction of the representation of , in the Euclidean space in the combination with the generalization multifractal construction, we obtain a representation of , in the form of multifractal subsets of the Euclidean space.
This way, a connection between p-adic and multifractal spaces was established.
5.4. Application of p-Adic Wavelets to Study Multifractal Signals
We develop a wavelet analysis method for seismic signals, viewed as a multifractal field, based on the correspondence above. First of all, we briefly review the theory of p-adic Haar wavelets. The basis of p-adic wavelets in has the form:
Here, the index , the index is an element of the quotient group , understood as a rational number of the from
where (negative integer), . The addition in can be understood as the addition modulo one of fractions of the above form.
The function is the additive character of the field :
where contains the terms from the expansion of over the degrees of p:
The function is the characteristic function of (therefore is the characteristic function of ).
5.5. Fractal Wavelet Expansions of Signals Generated by p-Adic Wavelets
Now the p –adic wavelet expansions can be "lifted" to the fractals with the aid of the map .
Consider a map and its -image, . Suppose that this map belongs to the L2 –space. Then we can expand it with respect to the p -adic wavelet basis:
where
Now, in the case n > p we can use the inverse map and write the wavelet expansion in terms of the original functions :
Thus, any signal defined on the fractal of the —type (having the fractal dimension ) can be expanded in the wavelet type series; the corresponding parts of this series represent low and high frequency components of the signal.
We can proceed in the same way in the case of the multifractal representation of .
5.6. Multifractal Wavelet Expansions of Signals by p-Adic Wavelets
Look at a map and the corresponding map . Suppose that the latter belongs to the L2—space. Consider its representation as
corresponding to the disjoint union representation . Then each component can be expanded in the p -adic wavelet series,
and
where
The wavelet coefficients of , and the latter representation gives us the fractal components of this multifractal wavelet expansion.
Suppose now that in the spectral sequence all . Then the map is a homeomorphism and the inverse map is well defined: .
Thus the above wavelet expansion can be represented in internal multifractal terms:
where
5.7. Investigation of Dynamical Systems on Multifractals with the Aid of p-Adic Numbers
In our case study (Dolomites architecture), we model the reaction-diffusion equation on the field of p -adic numbers . This model describes the transport in real-world porous, disordered, complex media. Now, using the technique presented in this study, we can apply the aforementioned p-adic theory of reaction-diffusion dynamics to model such dynamics on multifractal spaces. First, we "lift" to the multifractal the fractional differential operator . Then we can write the reaction-diffusion equation on and it can be solved by reducing the solution-finding process for the corresponding p-adic PDE. We shall present this solution scheme for the multifractal reaction-diffusion equation in the following paper.
6. Conclusions
This study establishes a statistically coherent, physics-informed framework for decoding Big Geodata by integrating multiple theoretical and computational approaches. The central objective has been to advance the algorithmic understanding of the architecture of complexity in geosystems, a goal to which our approach directly contributes. Within this framework, attention-based vision transformers are reinterpreted as multiscale visuonumeric Digital Twins, enabling the unification of raw measurements, data, spatial organization, and visual encoding into a consistent set of color-coded two- and three-dimensional primitives. A key step is the extraction of the structural skeleton of Big Geodata, which reveals previously hidden prime-number distributions. This perspective, conceptually aligned with the Erdös-type conjectural framework, will be further formalized in Part II. The proposed tokenization strategy integrates gray-scale histograms, Benford´s law, and the Four-Color Theorem into a unified methodology for the symbolic encoding of Big Geodata. In this formulation, tokens preserve the statistical and topological invariants of the underlying system and act as in-context algebraic primitives. Their organization emerges from the extraction of symbolic rules across multiscale, highly heterogeneous attention landscapes. Multifractal and p-adic analyses are subsequently employed as physically grounded pruning operators, enabling the reduction of tokens and Digital Twins while preserving structural integrity. This results in a compact yet information-rich representation of fracture-lithofacies systems, simultaneously capturing the architecture of complexity in geosystems and its algorithmic counterpart within the SYM-Fractron and Muuk´il Kaab platforms. From an applied perspective, the proposed framework provides a physically interpretable basis for optimizing well trajectories and shot direction design, guided by continuity and tortuosity patterns of fracture corridors and networks. The Muuk' il Kaab platform, calibrated across multiple PEMEX fields, enables the construction of effective metrics for fracture connectivity and the generation of three-dimensional maps of optimal well trajectories that are consistent with the preferential orientation of the connected fracture pattern. More broadly, this work suggests a paradigm shift from purely statistical tokenization toward physics-informed, structurally constrained, in-context algebra representations of complex systems that visuonumerical tokenization, grounded in physical laws and number-theoretical structure, can serve as a bridge between mathematical theory and artificial intelligence, opening a pathway toward physics-informed Digital Twins for real-world decision-making in sustainable, complex geosystems management and conservation.
Author Contributions
Writing - original draft preparation, K.O. and A.K; writing – review and editing, K.O. and A. K.; conceptualization, K.O., M.-J. C.L., A.K., and Q.C.; methodology, K.O., M.-J. C. L and A. K.; formal analysis, K.O., A.R., J.L.L, R.G.P.C., P.P., and Y.G.A.; visualization, K.O., A.R., R.G.P.C., J.L.L., and Y.G.A.; supervision and discussion, K.O., A.K., M.-J. C.L., Q.C. All authors have read and agreed to the published version of the manuscript.
Funding
This work was supported by the CONACyT (Mexico's National Research Funding Programs) grants: SENER-Hydrocarbon Program, Project 168638, "Oil Reservoir as Fractal Reactor". At present, the first author is supported as a Foreign Adviser under the “111 Project” of China, Grant No. B25052. Project Title: “Data-Mathematics-Computing Advanced Integration and Intelligent Prediction of Extreme Geoscience Events- Discipline Innovation and Talent Introduction Base”.
Informed Consent Statement
Not applicable.
Data Availability Statement
The original contributions presented in this study are included in the article. Further inquiries can be directed to the corresponding author.
Conflicts of Interest
The authors declare no conflict of interest.
Abbreviations
Key abbreviations are defined at first mention and used consistently throughout the manuscript.
References
- Lacombe, O.; Tavani, S.; Lamarche, J.; Balsamo, F.; Agosta, F. Introduction: Faults and fractures in rocks: mechanics, occurrence, dating, stress history and fluid flow. Geological Magazine; Cambridge University Press, UK, 2023.
- Aljawad, M.S. Mineralogy impact on acid fracture design in naturally fractured carbonates. ACS Omega; American Chemical Society, USA, 2023, 12194.
- Leal, J.A.; Ochoa, L.; Garcia, J.A. Identification of natural fractures using resistive image logs, fractal dimension, and support vector machines. Ingenieria e Investigación, 2016, 36 (3), 125. [CrossRef]
- Lorenz, J.C. Naming Natural Fractures. Explorer Geophysical Corner, AAPG, 2026.
- Wang, M.; Yin, Lu.; Zhou, Q. An automatic classification method for igneous rock fractures based on an interpretable ensemble machine learning model. Acta Geofísica 2026, 74, 90. [CrossRef]
- Lorsung, C.; Li, Z.; Farimani, A.B. Physics-informed token transformer for solving partial differential equations. Mach. Learn: Sci. Technol. 2024, 5, 015032. [CrossRef]
- Snásel, V., Nowakova, J., Xhafa, F., Barolli, L. Geometrical and topological approaches to Big Data. Future Generation Computer Systems, 2017, v.67, 286-296. [CrossRef]
- Mohammadpoor, M.; Torabi, F. Big Data analytics in the oil and gas industry: An emerging trend. Petroleum, 2020, 6, 321-328. [CrossRef]
- Goodchild, M.F. Big Geodata.Comprehensive Geographic Information Systems, 2018, 19-25.
- Pei, T.; Song, Ci. ; Guo, S.; Shu, H.; Liu, Y.; Du, Y.; Ma, T.; Zhou, Ch. Big geodata mining: objective, connotations, and research issues. J. Geogr. Sci., 2020, 30 (2), 251-266. [CrossRef]
- Borgman, C.L., Big Data, Little Data, No Data. Scholarship in the Networked World, 2015, ISBN 978-0-262-02856-1, 384 pp.
- Gilliland, A. J. Setting the Stage. In: Introduction to Metadata, Murtha Baca, 2016, Getty Publications (3rd edition).
- NISO (National Information Standards Organization), Understanding Metadata, 2004 (actualized).
- Pietsch, W. Big Data – The New Science of Complexity. Philsci-archive.pitt.edu, 2013, 9944.
- Pietsch, W. Big Data. Elements in the Philosophy of Science, Ed. Stegenga, J., 2021, Cambridge University Press, 80p.
- Simon, H.A. The Sciences of the Artificial. Massachusetts Institute of Technology (3rd Edition), 2019, 241p.
- Kamal, A.W.; Avgeriou, P. Modelling architectural patterns' behavior using architectural primitives. ACSA, Springer Verlag: Software Architecture, 2008, 164-179.
- Zdun, U; Avgeriou, P. Modeling architectural patterns using architectural primitives. In EPRINTS-BOOK University of Groningen, Johann Bernoulli Institute for Mathematics and Computer Science. 2005, 133-146.
- Kimovski, D.; Saurabh, N.; Jansen, M.; Aral, A.; Al-Dulaimy, A.; Bondi, A.B.; Galleta, A.; Papadopolos, A.V.; Iosup, A.; Prodan, R. Beyond Von Neumann in the computing continuum: architectures, applications, and future directions. IEEE Internet Computing. 2024, 6-16. [CrossRef]
- Zdun, U; Avgeriou, P. A catalog of architectural primitives for modeling architectural patterns. Information and software technology, 2008, 50, 1003-1034. [CrossRef]
- Shams, L.; Ch. von der Malsburg. Acquisition of visual shape primitives. 2002, Vision Research, 42, 2105-2122). [CrossRef]
- Song, Ch. Y.; Hyde, D. Phys-Morph-GS. Differentiable shape morphing via joint optimization of physics and rendering objectives. ArXiv 2025, arXiv: 2511.16988.
- Biederman, I. Recognition-by-Components: A Theory of Human Image Understanding. Psychological Review, 1987, 94, 2, 115-147. [CrossRef]
- Oliver, K.; Seddon, A; Trask, R.S. Morphing in Nature and beyond: a review of natural and synthetic shape-changing materials and mechanisms. Review. J. of Material Science, 2016, 51, 10663-10689. [CrossRef]
- Shuang, F.; Li, J.; Huang, Q.; Zhao, W.; Xu, D.; Han, Ch.; Cheng, Ha. 2025. Visual primitives as words: Alignment and interaction for compositional zero-shot learning. Pattern Recognition, V. 157, 110814. [CrossRef]
- Ware, C. Visual thinking for information design; Elsevier: Morgan Kauffman, USA, 2022.
- Li, Yu; Yao, L.; Liu, Zh. Compositional Zero-Shot Learning with Contextualized Cues and Adaptive Contrastive Training. In MM '25: Proceedings of the 33rd ACM International Conference on Multimedia, pp. 4534 – 4541. [CrossRef]
- Kozyrev, S.V. Transformers as a Physical Model in AI. Lobachevskii J. of Mathematics. Springer Link Nature, 2024, 45, 710. [CrossRef]
- Banerjee, Ch.; Nguyen, K.; Fookes, C.; Karniadakis, G. Physics-Informed Computer Vision: A Review and Perspectives. ArXiv, 2025, arXiv:2210.09461. [CrossRef]
- Li, X.; Feng, M.; Ran, Yo.; Su, Ya.; Liu, F.; Huang, Ch.; Shen, H.; Xiao, Q.; Su, J.; Yuan, Sh.; Guo, H. Big Data in Earth system science and progress towards a digital twin. Nature Reviews Earth & Environment, 2023.
- Mandelbrot, B. Multifractals and 1/f noise. Wild Self-Affinity in Physics (1963-1976). 1999, Springer-Verlag, New York.
- Bojarski, J.; Smoleński, R.; Lezynski, P.; Sadowski, Z. Diophantine equation-based model of data transmission errors caused by interference generated by DC-DC converters with deterministic modulation. Bulletin of The Polish Academy of Sciences-Technical Sciences, 2026, 64 (3), 575. [CrossRef]
- Bourbaki, N. Algèbre commutative (Russian traduction). 1971. Mathematical Enciclopedia, 1, p.42.
- Seurett, S. Multifractals and metric theory of Diophantine approximation-MUTADIS. Funded Project, ANR (Agence Nationale de la Recherche), 2011-2016.
- Jaffard, S.; Seurett, S; Wendb, H.; Leonarduzzic, R.; Rouxc, S.; Abryc, P. Multivariate multifractal analysis. App. Comput. Harmon. Anal. 2019, 46, 653-663. [CrossRef]
- Lee, Yi.W.; Scones, A. Effective results in the metric theory of quantitative Diophantine approximation. Advances in Mathematics, 2025, 482, Part C, 110631. [CrossRef]
- Snášel, A.; Novaková, J.; Xhafa, F.; Baroli, L. Geometrical and topological approaches to Big Data. Future Generation Computer Systems, 2017, 67:286-296. [CrossRef]
- Terekhov, A.; Bryksin, T.; Litvinov, Yu. How to make visual modeling more attractive to software developers; Springer International Publishing AG, 2017. Present and ulterior Software Engineering, p. 139-152. [CrossRef]
- Hou, Ch-Yi.; Li, L.; Zhang, H.; Naumov, P. Smart molecular crystal switches. Review Paper. Smart Molecules. 2024, 1-16. [CrossRef]
- Khodd, B.; Nasmul Ahsan, A.M.M.; Shovon, A.N.; Alam, A.I. Nature Research, Scientific Reports, 2021, 11: 494.
- Thatipell, K.R.; Kalathur; H. A state-of-the-art on honeycomb cellular solids: Structures, properties, applications. In: AIP Conf. Proc. 3185, 020021. 2025. [CrossRef]
- Jeong, D.; Li, Yi.; Kim, S.; Choi, Yo.; Lee, Ch.; Kim, Ju. Mathematical modeling and computer simulation of the three-dimensional pattern formation of honeycombs. Nature Researc, Scientific Reports, 2019, 9:20364. [CrossRef]
- Cheng, X.; Zeng, W.; Dai, D.; Chen, Q.; Wang, B.; Xie, Zh.; Zhao, D.; Liang, W. Conditional Memory via Scalable Lookup: A New Axis of Sparsity for Large Language Models. ArXiv 2026, arXiv: 2601.07372v.
- San, O.; Rasheed, A.; Bozdemir, E.; Deng, J. The evolution of digital twins from reactive to agentic systems. Nature Computational Science, 2026, 6–10 pp. [CrossRef]
- Hazeleger, W. et al (+28 authors). Digital Twins of the Earth with and for humans. Nature, communications, Earth & Environment, 2024, 5:463.
- Hartmann, D.; Van der Auweraer, H. Digital Twins - a golden age for industrial mathematics. Journal of Mathematics in Industry, 2025, 15, 6. [CrossRef]
- Meidani, K.; Shojaee, P.; Reddy, C.K.; Farimani, A.B. SNIP: Bridging Mathematical Symbolic and Numeric Realms with Unified Pre-training. ArXiv 2024, arXiv:2310.02227v3 .
- Visser, M. Which number system is "best" for describing empirical reality? Mathematics 2022, 10:3340. [CrossRef]
- Malachovskiy, V.S. Introduction to Mathematics, Editorial: 1999, 40-60 pp.
- Katende, R. Optimizing neural network performance and interpretability with Diophantine equation encoding. arXiv, 2024, arXiv: 2409.07310v1. [CrossRef]
- Roth, K.F. Rational approximations to algebraic numbers. Mathematika: a journal of pure and applied mathematics. 1955, 2 (1), 3, 1-20. [CrossRef]
- Xu, M.; Lu, D; Sun, X. Scaling up and down of 3-D floating-point data in quantum computing. Nature Scientific Reports. 2022. 12: 2771. [CrossRef]
- Overton, M.L. Numerical Computing with IEEE Floating Point Arithmetic: Including One Theorem, One Rule of Thumb, and One Hundred and Six Exercises. SIAM, 2025, 146 pp.
- Muller, J.-M; Brunie, N.; de Dinechin, F.; Jeannerod, C.-P.; Joldes, M.; Lefèvre, V.; Melquiond, G.; , Revol, N.; Torres, S. Handbook of Floating-Point Arithmetic. 2018. Birkhäuser; 627 pp.
- IEEE Standard for Floating-Point Arithmetic. 2019, 754.
- Ghaffari, A.; Tahaei, M.S.; Tayaranian, M.; Asgharian, M.; Nia, V.P. Is Integer Arithmetic Enough for Deep Learning Training? 2022, In 36th Conference on Neural Information Processing Systems (NeurIPS 2022), 1-12.
- Song, Y.; Xu, S.; Sato, S.; A lightweight shape-memory alloy with superior temperature-fluctuation resistance. Nature, 2025, 638, 965–971pp. [CrossRef]
- Pirilloa, A.; Colomboa, L.; Roveria, M. NITRO-D: Native Integer-only Training of Deep Convolutional Neural Networks. arXiv 2024, arXiv: 2407.11698v2.
- Lai, G.; Tong, X.; Zhang, Yo.; Ding, Lu.; Suia, Yi.; Leia, Yi.; Zhan, Yo. A spatial multiscale integer coding method and its application to three-dimensional model organization. 2020, Int. J. of Digital Earth, 1151-1171 pp. [CrossRef]
- Khrennikov, A. Yu.; Oleschko, K.; Correa López, M. de J. Applications of p-adic numbers: from physics to geology, 2014, Contemporary Mathematics, 665: Advances in Non-Archimedean Analysis, 121-133.
- Khrennikov, A. Yu.; Oleschko, K.; Correa López, M. de J. Modeling Fluid's Dynamics with Master Equations in Ultrametric Spaces Representing the Treelike Structure of Capillary Networks. 2016. Entropy, 18 (7):249. [CrossRef]
- Wang, D.; Barabási, A.-L. The Science of Science. Cambridge University Press. 2021. 304pp.
- Liu, Lu; Jones, B.F.; Uzzi, B.; Wang, D. Data, measurement and empirical methods in the science of science. Nature Human Behaviour. 2023. 7, 1046-1058. [CrossRef]
- Oleshko, K.; Khrennikov, A.; Oleshko, B.F.; Parrot, JF.The Primes are Everywhere, but Nowhere…. In: Toni, B. (eds) New Trends and Advanced Methods in Interdisciplinary Mathematical Sciences. STEAM-H: Science, Technology, Engineering, Agriculture, Mathematics & Health. Springer.
- Savitsky, Z. Proof steps toward the hidden structure of prime numbers. Science, 2024. 385, 6708, 483-484. [CrossRef]
- Torquato, S.; Zhang, G.; de Courcy-Ireland, M. Uncovering multiscale order in the prime numbers via scattering. Journal of Statistical Mechanics: Theory and Experiment. 2018, 093401. [CrossRef]
- Granville, V. The Riemann Hypothesis in One Picture. Non-peer-reviewed technical article. 2022. URL.
- Li, HL.; Fang, SC.; Lin, B.M.T.; Kuo, W. Unifying colors by primes. Nature, Light Sci Appl, 2023, 12, 32. [CrossRef]
- Padalkar, P.; Gupta, G. Symbolic rule extraction from attention-guided sparse representations in vision transformers. . arXiv 2025, arXiv: 2505.06745v1. [CrossRef]
- Lorsung, C., Li Z., Farimani, A.B. Physics informed token transformer for solving partial differential equeations. Mach. Learn.: Sci. Technol. IOP Publishing. 2024, 5, 015032.
- Lodge, O.J., The meaning of algebraic symbols in applied mathematics. Nature, 1891, 43, 1118, 513. [CrossRef]
- Tomlin, C.J.; Axelrod, J.D. Biology by numbers: mathematical modelling in development biology. Nature Reviews Genetics, 2007, 8, 331. [CrossRef]
- Page, L. The Little Book of Cosmology. Princeton University Press, 2020, 120p.
- Zhong, P., Hu, W., Zhao, Y.; Zhang, F. Geo-TCAM: a Thangka captioning method integrating topic modeling with geometry-guided spatial attention. npj Herit. Sci. 2026, 14,. [CrossRef]
- Ware, C. Visual thinking for information design. Elsevier, 2021, 212 pp.
- Minsky, M. The Society of Mind. Simon & Scuster, 1986, New York, 340 pp.
- Ferrante, M.; Boccato, T.; Toschi, N.; VanRullen, N. Evidence for compositionality in fMRI visual representations via Brain Algebra. Nature, Commun Biol, 2025, 8, 1263. [CrossRef]
- Cuevas, E.; Rodríguez, A.N. Image Processing and Machine Learning, Foundations of Image Processing. 2024, Chapman and Hall/CRC, New York, eBook, ISBN9781003287414, 224 pp.
- Novak, C.H.; Shafer, S.A. Anatomy of color histogram. In IEEE Proceedings, 1992, Computer Soc. Conference on Computer Vision and Pattern Recognition.Champaign, IL, USA.
- Shapiro, L.G.; Stockman, G. C. Computer Vision. 2001, Prentice Hall, 580 pp.
- He, Ya-H. AI-driven research in pure mathematics and theoretical physics. Nature Review Physics. 2024, 6: 546-553. [CrossRef]
- Appel, K.; Haken, W. Every planar map is four colorable. Bulletin of the Mathematical Society. 1976, Research Announcements by R. Fossum, v. 82, 5, 711-712. [CrossRef]
- Appel, K.; Haken, W. Every planar map is four colorable. Part I: Discharging. 1977. Illinois Journal of Mathematics, 21,3, 429–490. [CrossRef]
- Appel, K.; Haken, W. Every planar map is four colorable. Part II: Reducibility. 1977.Illinois Journal of Mathematics, 21,3, 491–567. [CrossRef]
- Allaire, F.; Swart, E.R. A systematic approach to the determination of reducible configurations in the four-color conjecture. J.of Combinatorial Theory.Series B. 1978, 25, 3, 339-362. [CrossRef]
- Wang, L.; Ma, Bo-Q. A concise proof of Benford's law. Fundamental Research, 2024, 4, 84-844. [CrossRef]
- Kobiela, J.; Dzierwa, P. Application of Benford's law to the Identification of non-authentic digital images. In Lecture Notes in Computer Science, vol 15341. MoMM 2024. Advances in Mobile Computing and Multimedia Intelligence. Delir Haghighi, P., Fedushko, S., Kotsis, G., Khalil, I. (eds) Springer, Cham.
- Fu, D.; Shi, Yu.Q.; Wei, Su. A generalized Benford's law for JPEG coefficients and its applications in image forensics. In the Electrical and Computer Architectures Proceedings, 2007.
- Bodke, M.; Mishra, D.; Vasani, K.; Janjua, J. Analysis of Benford's Law for image processing. IJCRT, 2021, 2106855, 9,6.
- Kolpakov, A.; Rocke, A. Benford's law, the Bombieri zeta density and the prime coding theorem. HAL open science, 2025, hal-05202023v2.
- Negrao, A.; Silva, P.; Freitas, V.; Moreira, G.; Luz, E. Benford's law as a distributional prior for post-training quantization of Large Language Models. arXiv 2026, arXiv: 2602.00165v1. [CrossRef]
- Friedman, R. Tokenization.n in the Theory of Knowledge. E-encyclopedia, 2023, MDPI, 3010024, 3, 380–386. [CrossRef]
- Singh, A.K.; Strouse, D.J. Tokenization counts: the impact of tokenization on arithmetic in frontier LLMs. arXiv, 2024, arXiv: 242.14903v1. [CrossRef]
- Sadeghi, H.; Momtazi, S.; Safabakhsh, R. Neural isomorphic fields: a transformer-based algebraic numerical embedding. arXiv, 2026, arXiv: 2210.09461.
- Ning, J.; Li, Ch.; Zhang, Zh.; Geng, Zi.; Dai, Qi; He, K.; Hu, H. All in tokens: unifying output space of visual tasks via soft token. arXiv, 2023, arXiv: 2301.02229v2. [CrossRef]
- Todd, E.; Brinkmann, J.; Gandikota, R.; Bau, D. In-context algebra. arXiv, 2026, arXiv: 2512.16902v2.
- Alabdulmohsin, I.; Tran, V.Q.; Dehghani, M. Fractal patterns may illuminate the success of next-token prediction. Advances in Neural Information Processing Systems. NeurlPS Proceedings, 2024, 37.
- Kim, S.R.; Lee, M. Fractal-guided token pruning for efficient vision transformers. Fractal Fract., 2025, 9 (12), 767. [CrossRef]
- Cheng, Q.; Agterberg, F.P. Multifractal modeling and spatial statistics. Mathematical Geosciences, 1996, 28,1. [CrossRef]
- Olsen, L. Multifractal Geometry. In: Bandt, C.; Graf, S.; Zähle, M. (eds) Fractal Geometry and Stochastics II. Progress in Probability, vol 46. 2000, Birkhäuser, Basel.
Figure 1.
Multiscale and multi-physics sources of oil reservoir metadata. Techniques used in his study span spatial scales from seismic exploration to borehole, microscopic, and tomographic imaging, providing the metadata basis for cross-scale analysis of the complexity of petroleum system architecture.
Figure 1.
Multiscale and multi-physics sources of oil reservoir metadata. Techniques used in his study span spatial scales from seismic exploration to borehole, microscopic, and tomographic imaging, providing the metadata basis for cross-scale analysis of the complexity of petroleum system architecture.
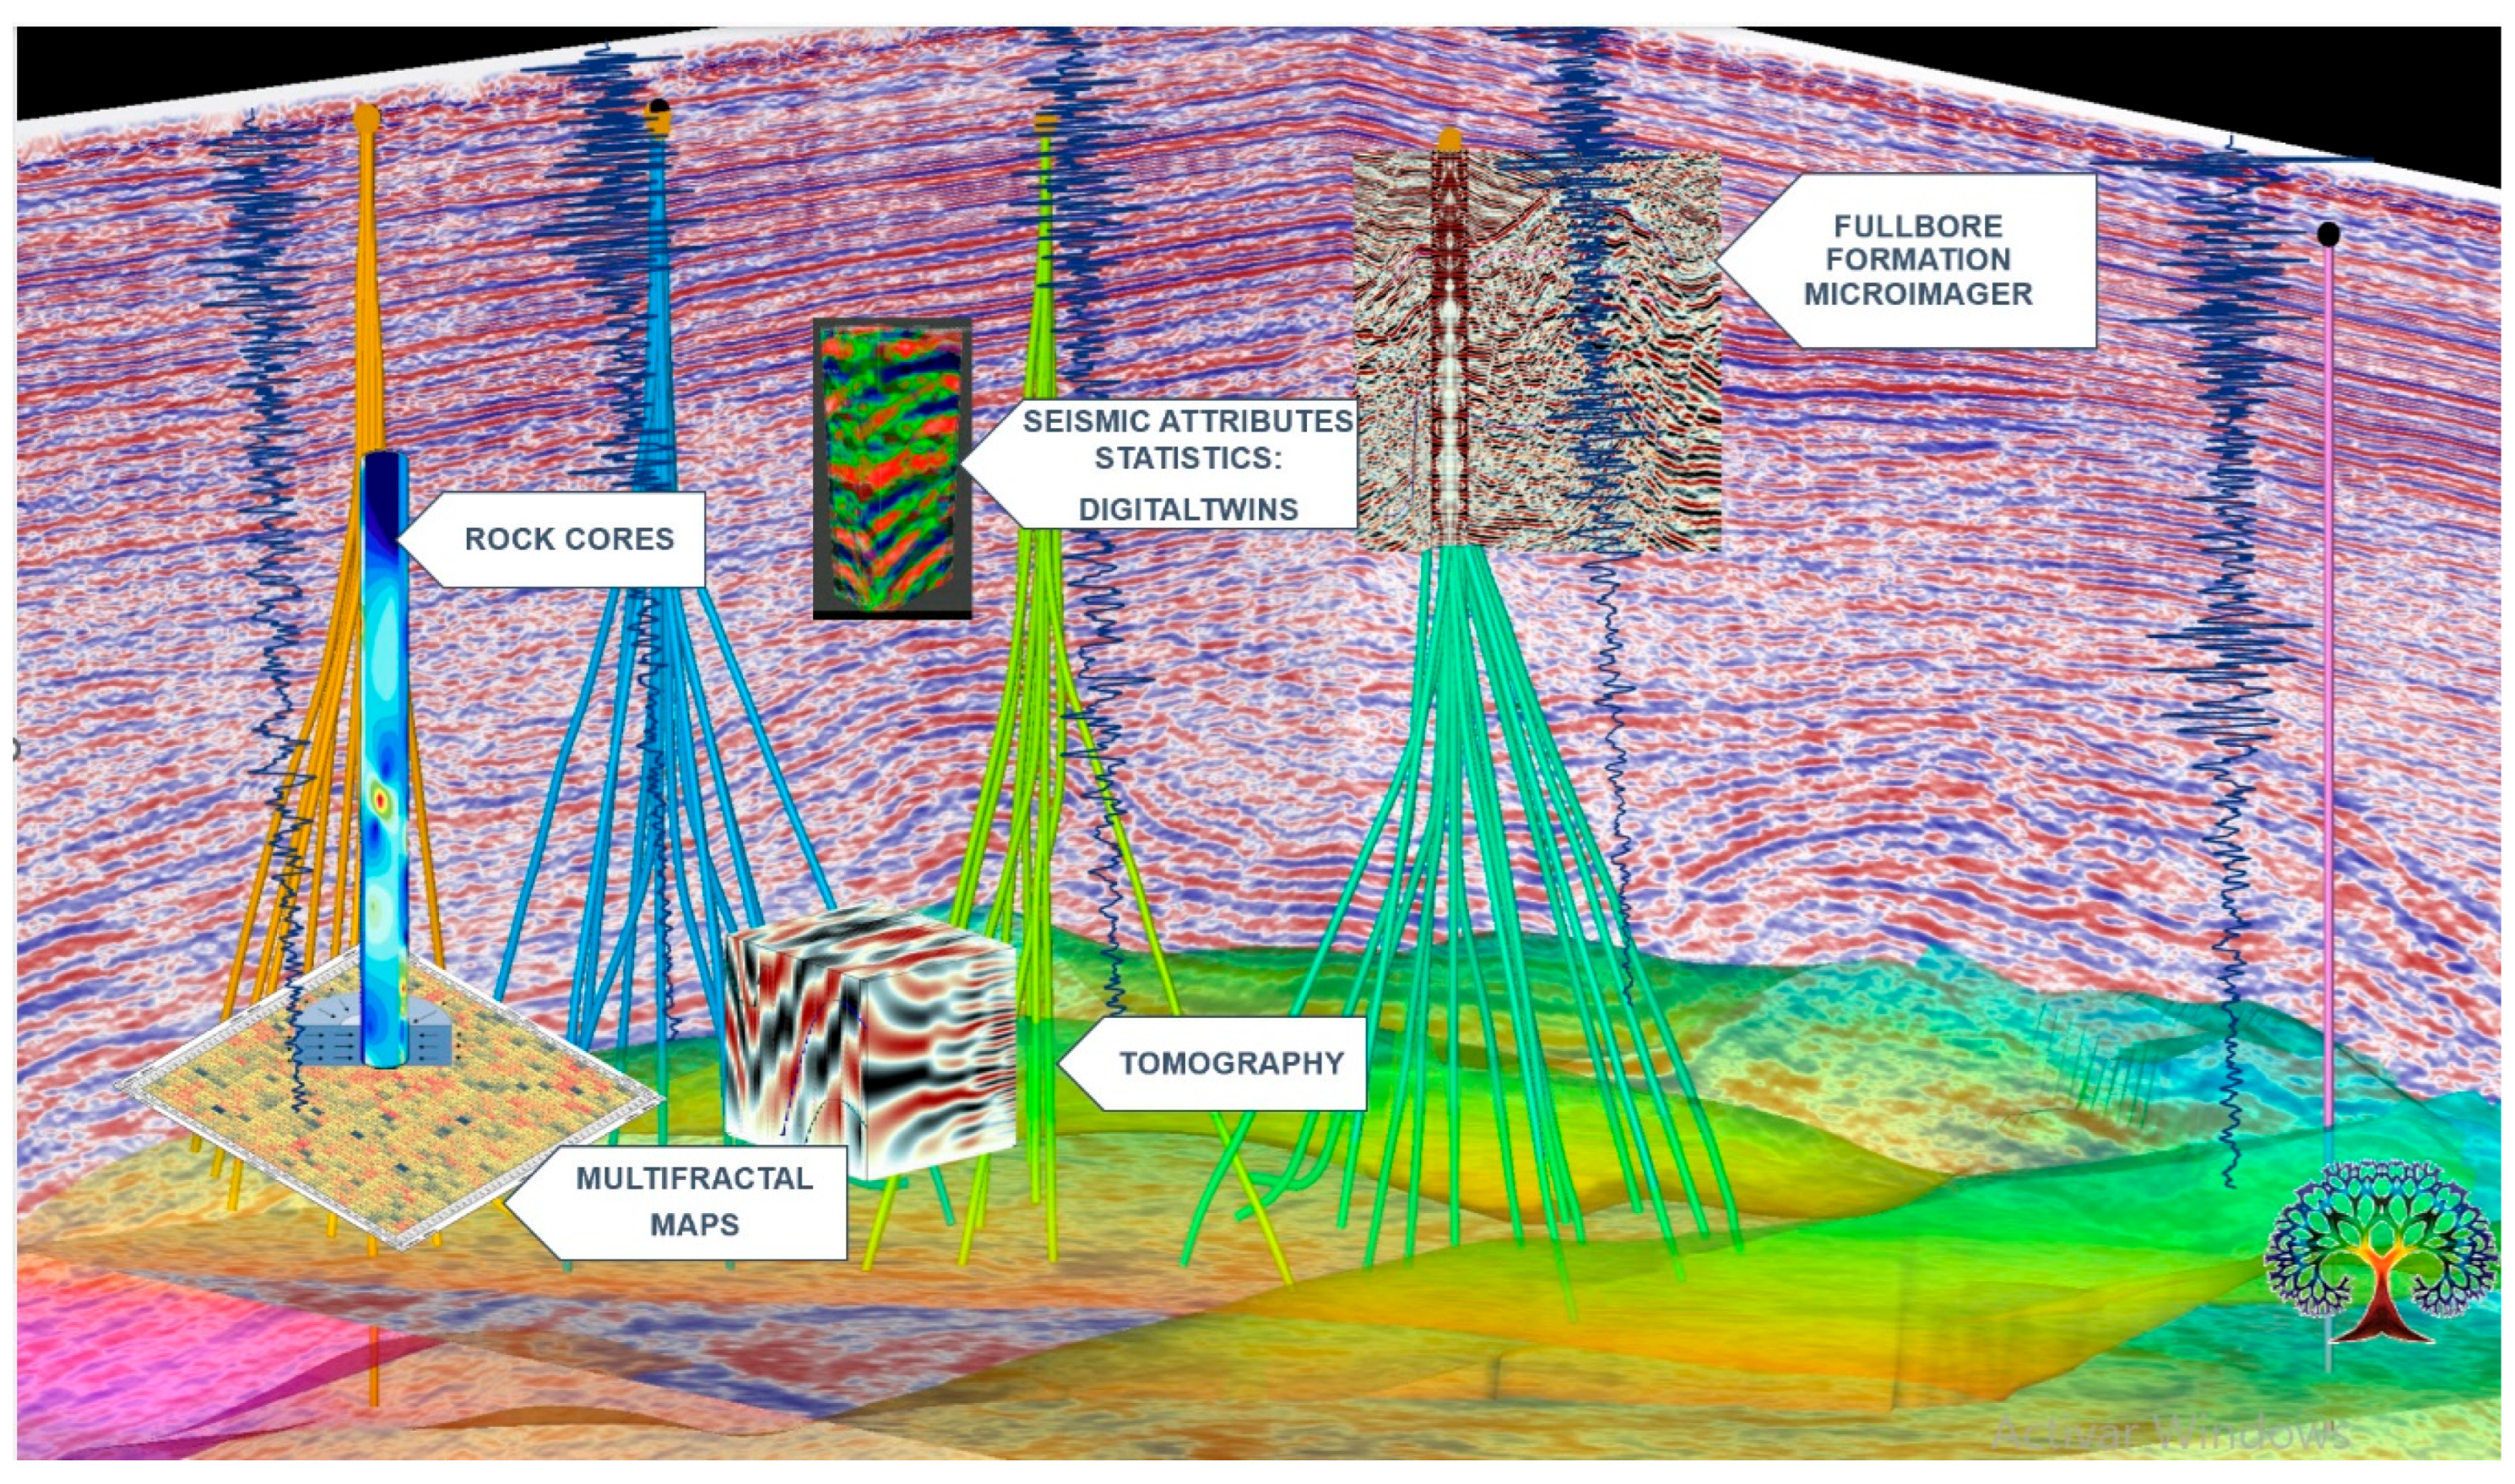
Figure 2.
Spatial, numerical, and color codification of raw, tabular, geophysical exploration (seismic) data illustrating the preprocessing stage preceding metadata tokenization within the proposed Digital Transformer framework.
Figure 2.
Spatial, numerical, and color codification of raw, tabular, geophysical exploration (seismic) data illustrating the preprocessing stage preceding metadata tokenization within the proposed Digital Transformer framework.
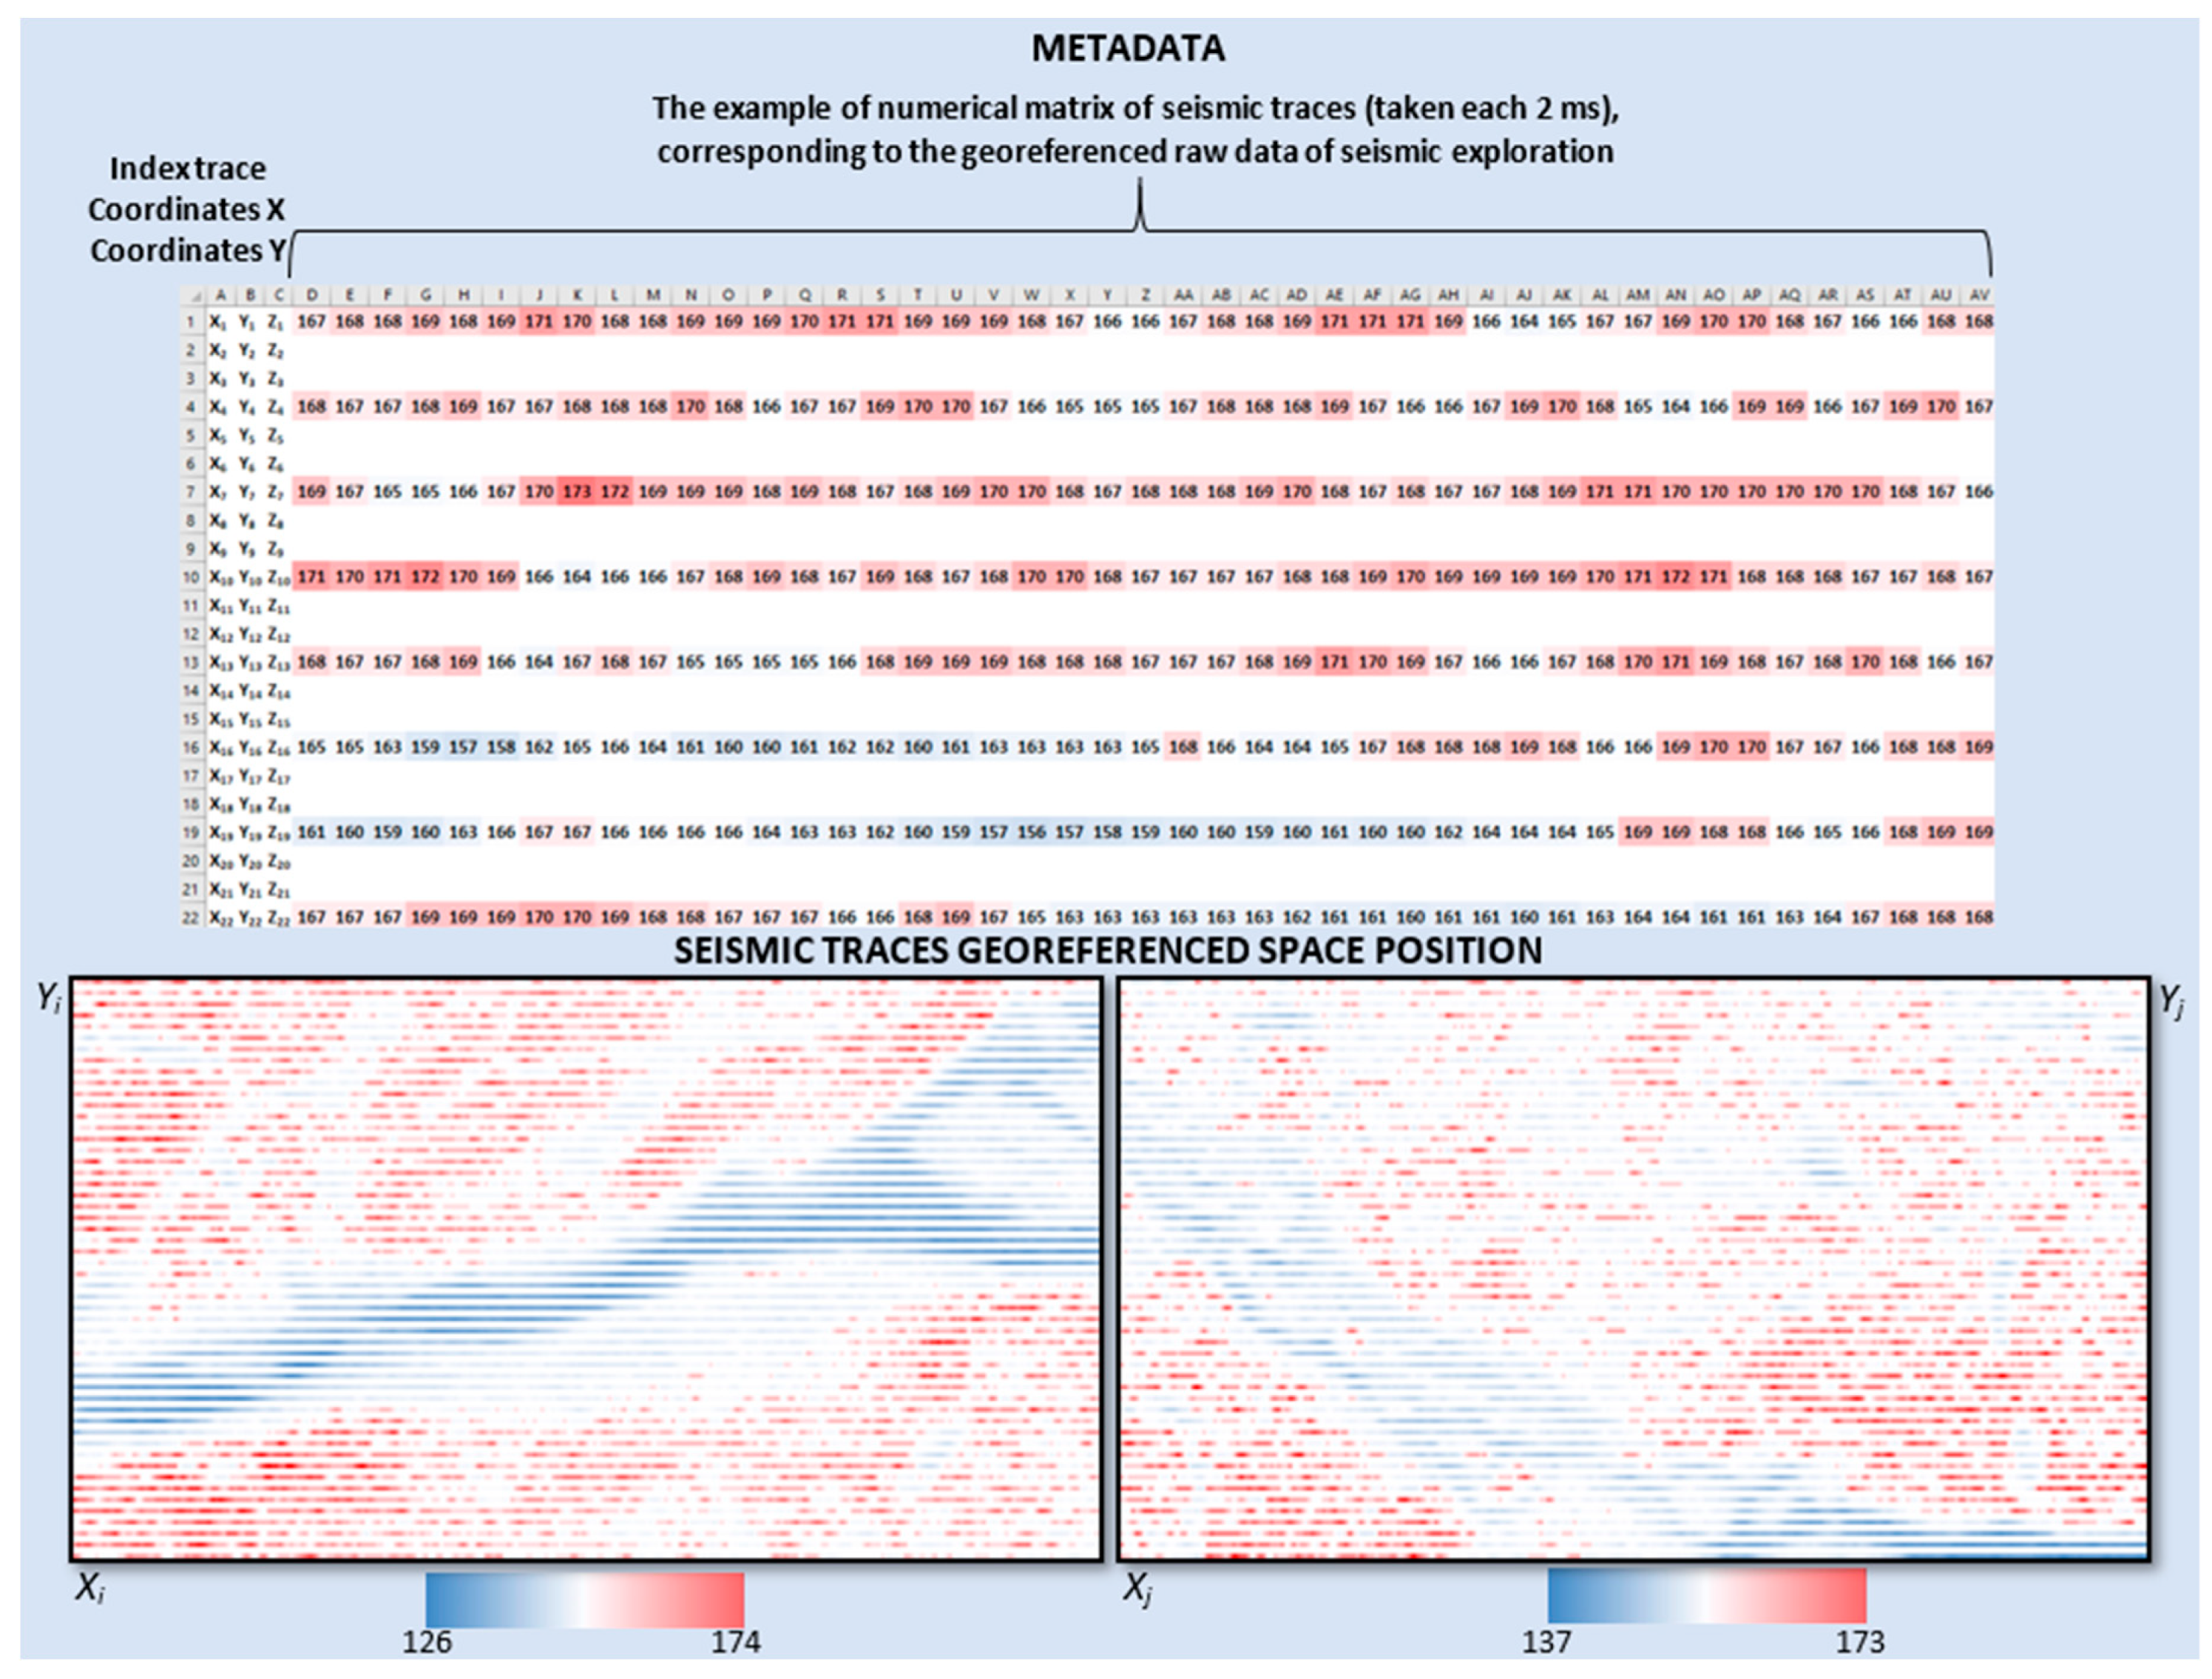
Figure 3.
The Muuk'il Kaab (MIK) framework. The bio-inspired design enables physically interpretable cross-scale comparisons between geological structures and their computational and mathematical representations, supporting the construction of a structured library of fracture patterns in dolomitized carbonates and the development of physics-informed Digital Twins. The background image illustrates the phase structure of interfering waves, adapted from the work of Sir. Michael Berry 2010).
Figure 3.
The Muuk'il Kaab (MIK) framework. The bio-inspired design enables physically interpretable cross-scale comparisons between geological structures and their computational and mathematical representations, supporting the construction of a structured library of fracture patterns in dolomitized carbonates and the development of physics-informed Digital Twins. The background image illustrates the phase structure of interfering waves, adapted from the work of Sir. Michael Berry 2010).
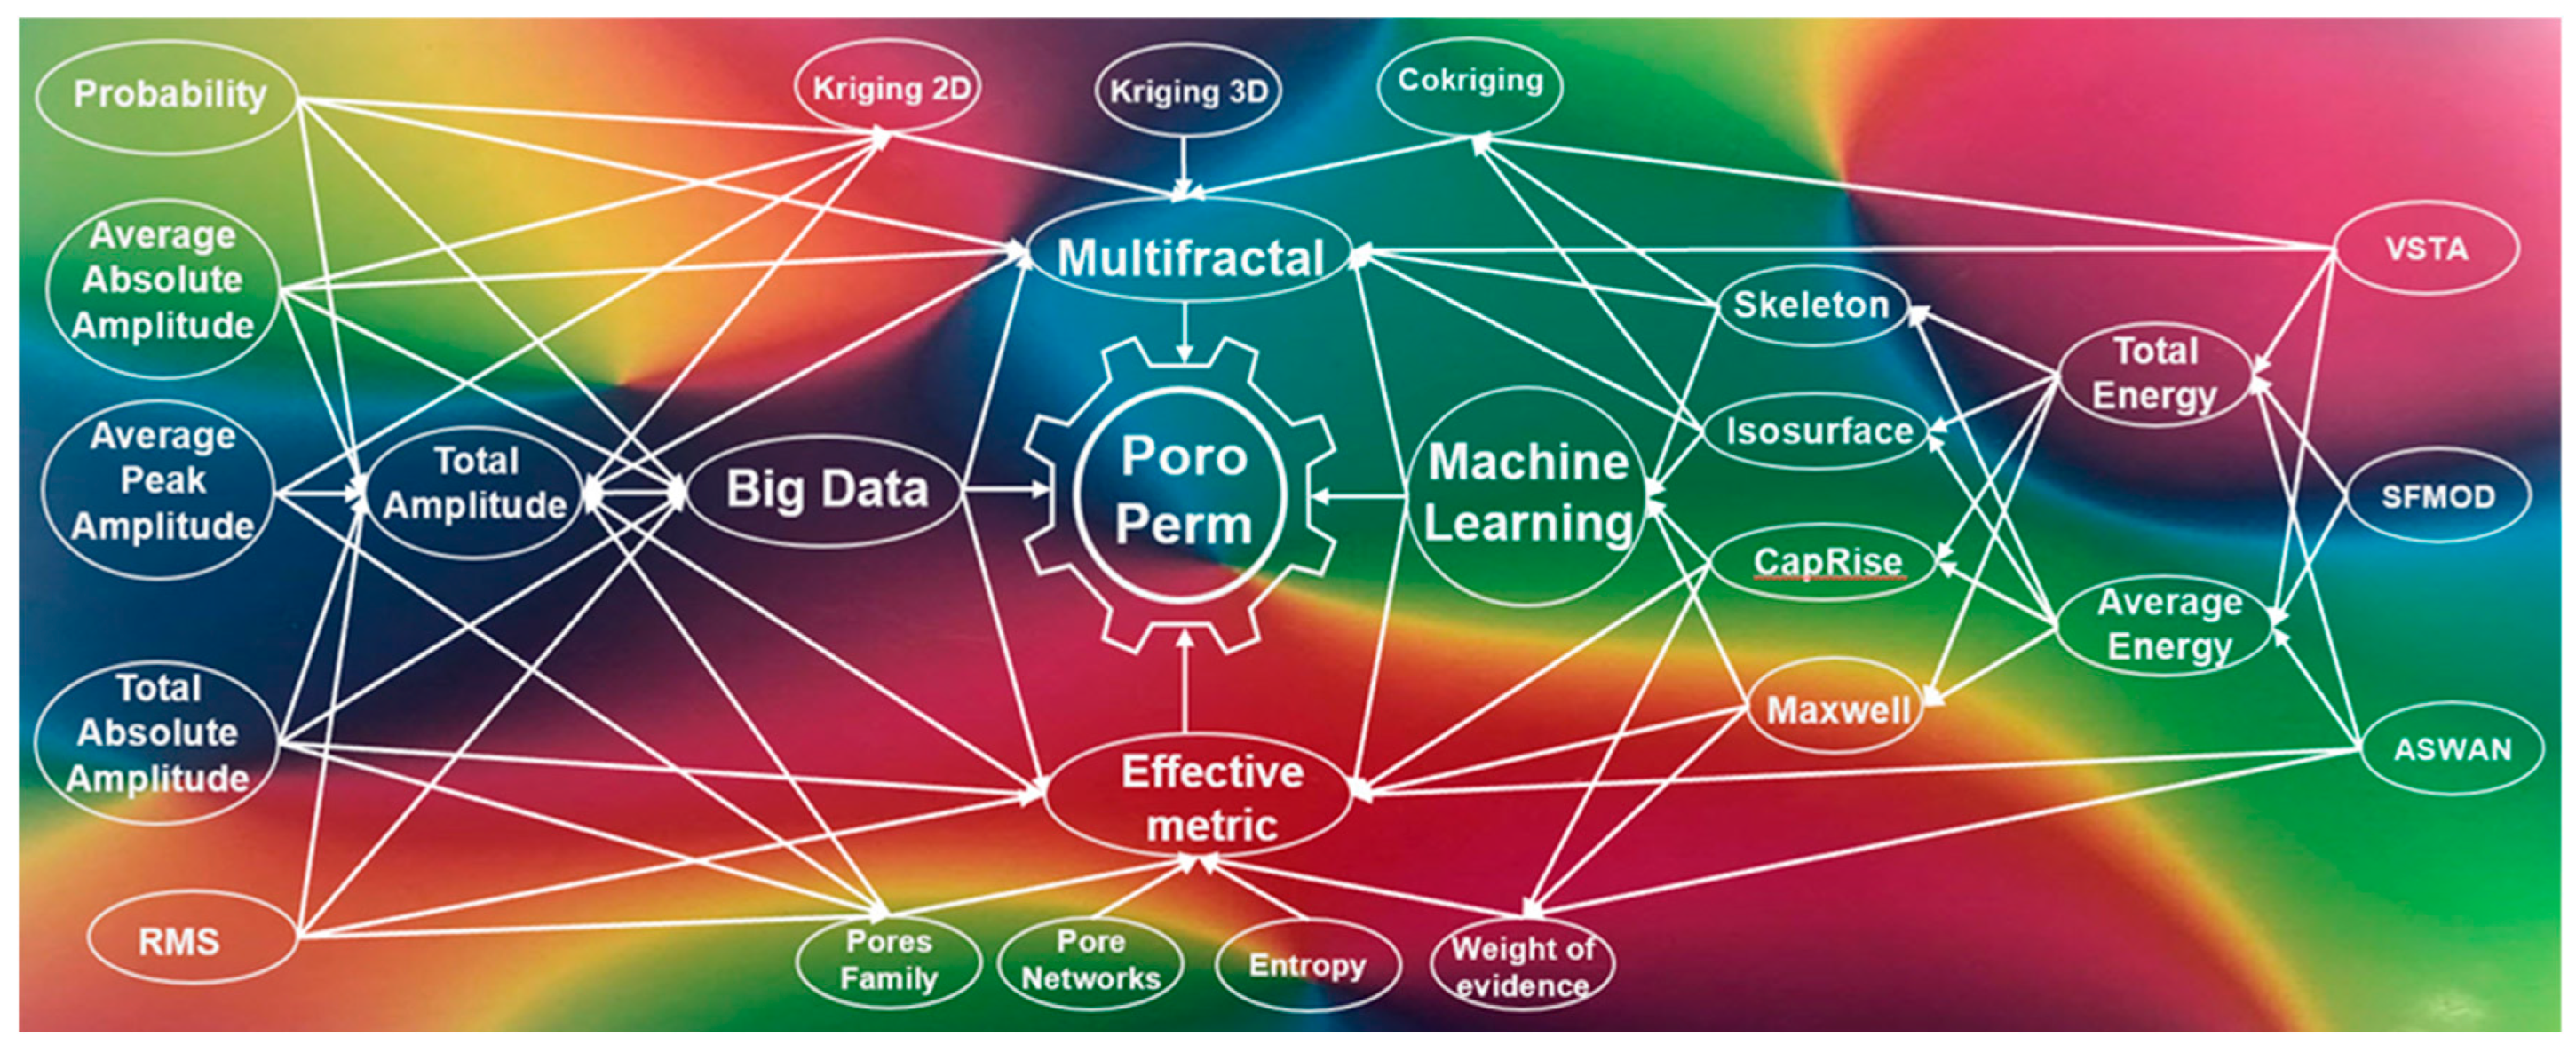
Figure 5.
a. Three-dimensional multiscale architecture of fracture corridors with an isosurface derived from raw seismic metadata visualization by the Muuk'il Kaab software. The structure exhibits highly connected, non-planar preferential pathways with pronounced directional organization and spatial heterogeneity. The intersection with the well trajectory (Well 2) highlights zones of enhanced connectivity. This configuration constitutes a Digital Twin of the fracture system, capturing the details of its multiscale architecture, which we named the Fenix or Crazy Bird pattern. b. The same seismic dataset without isosurface extraction, revealing the raw seismic metadata from which fracture corridors are directly identified (color-coded wave attributes). The concentration of fractures around the well is clearly resolved.
Figure 5.
a. Three-dimensional multiscale architecture of fracture corridors with an isosurface derived from raw seismic metadata visualization by the Muuk'il Kaab software. The structure exhibits highly connected, non-planar preferential pathways with pronounced directional organization and spatial heterogeneity. The intersection with the well trajectory (Well 2) highlights zones of enhanced connectivity. This configuration constitutes a Digital Twin of the fracture system, capturing the details of its multiscale architecture, which we named the Fenix or Crazy Bird pattern. b. The same seismic dataset without isosurface extraction, revealing the raw seismic metadata from which fracture corridors are directly identified (color-coded wave attributes). The concentration of fractures around the well is clearly resolved.
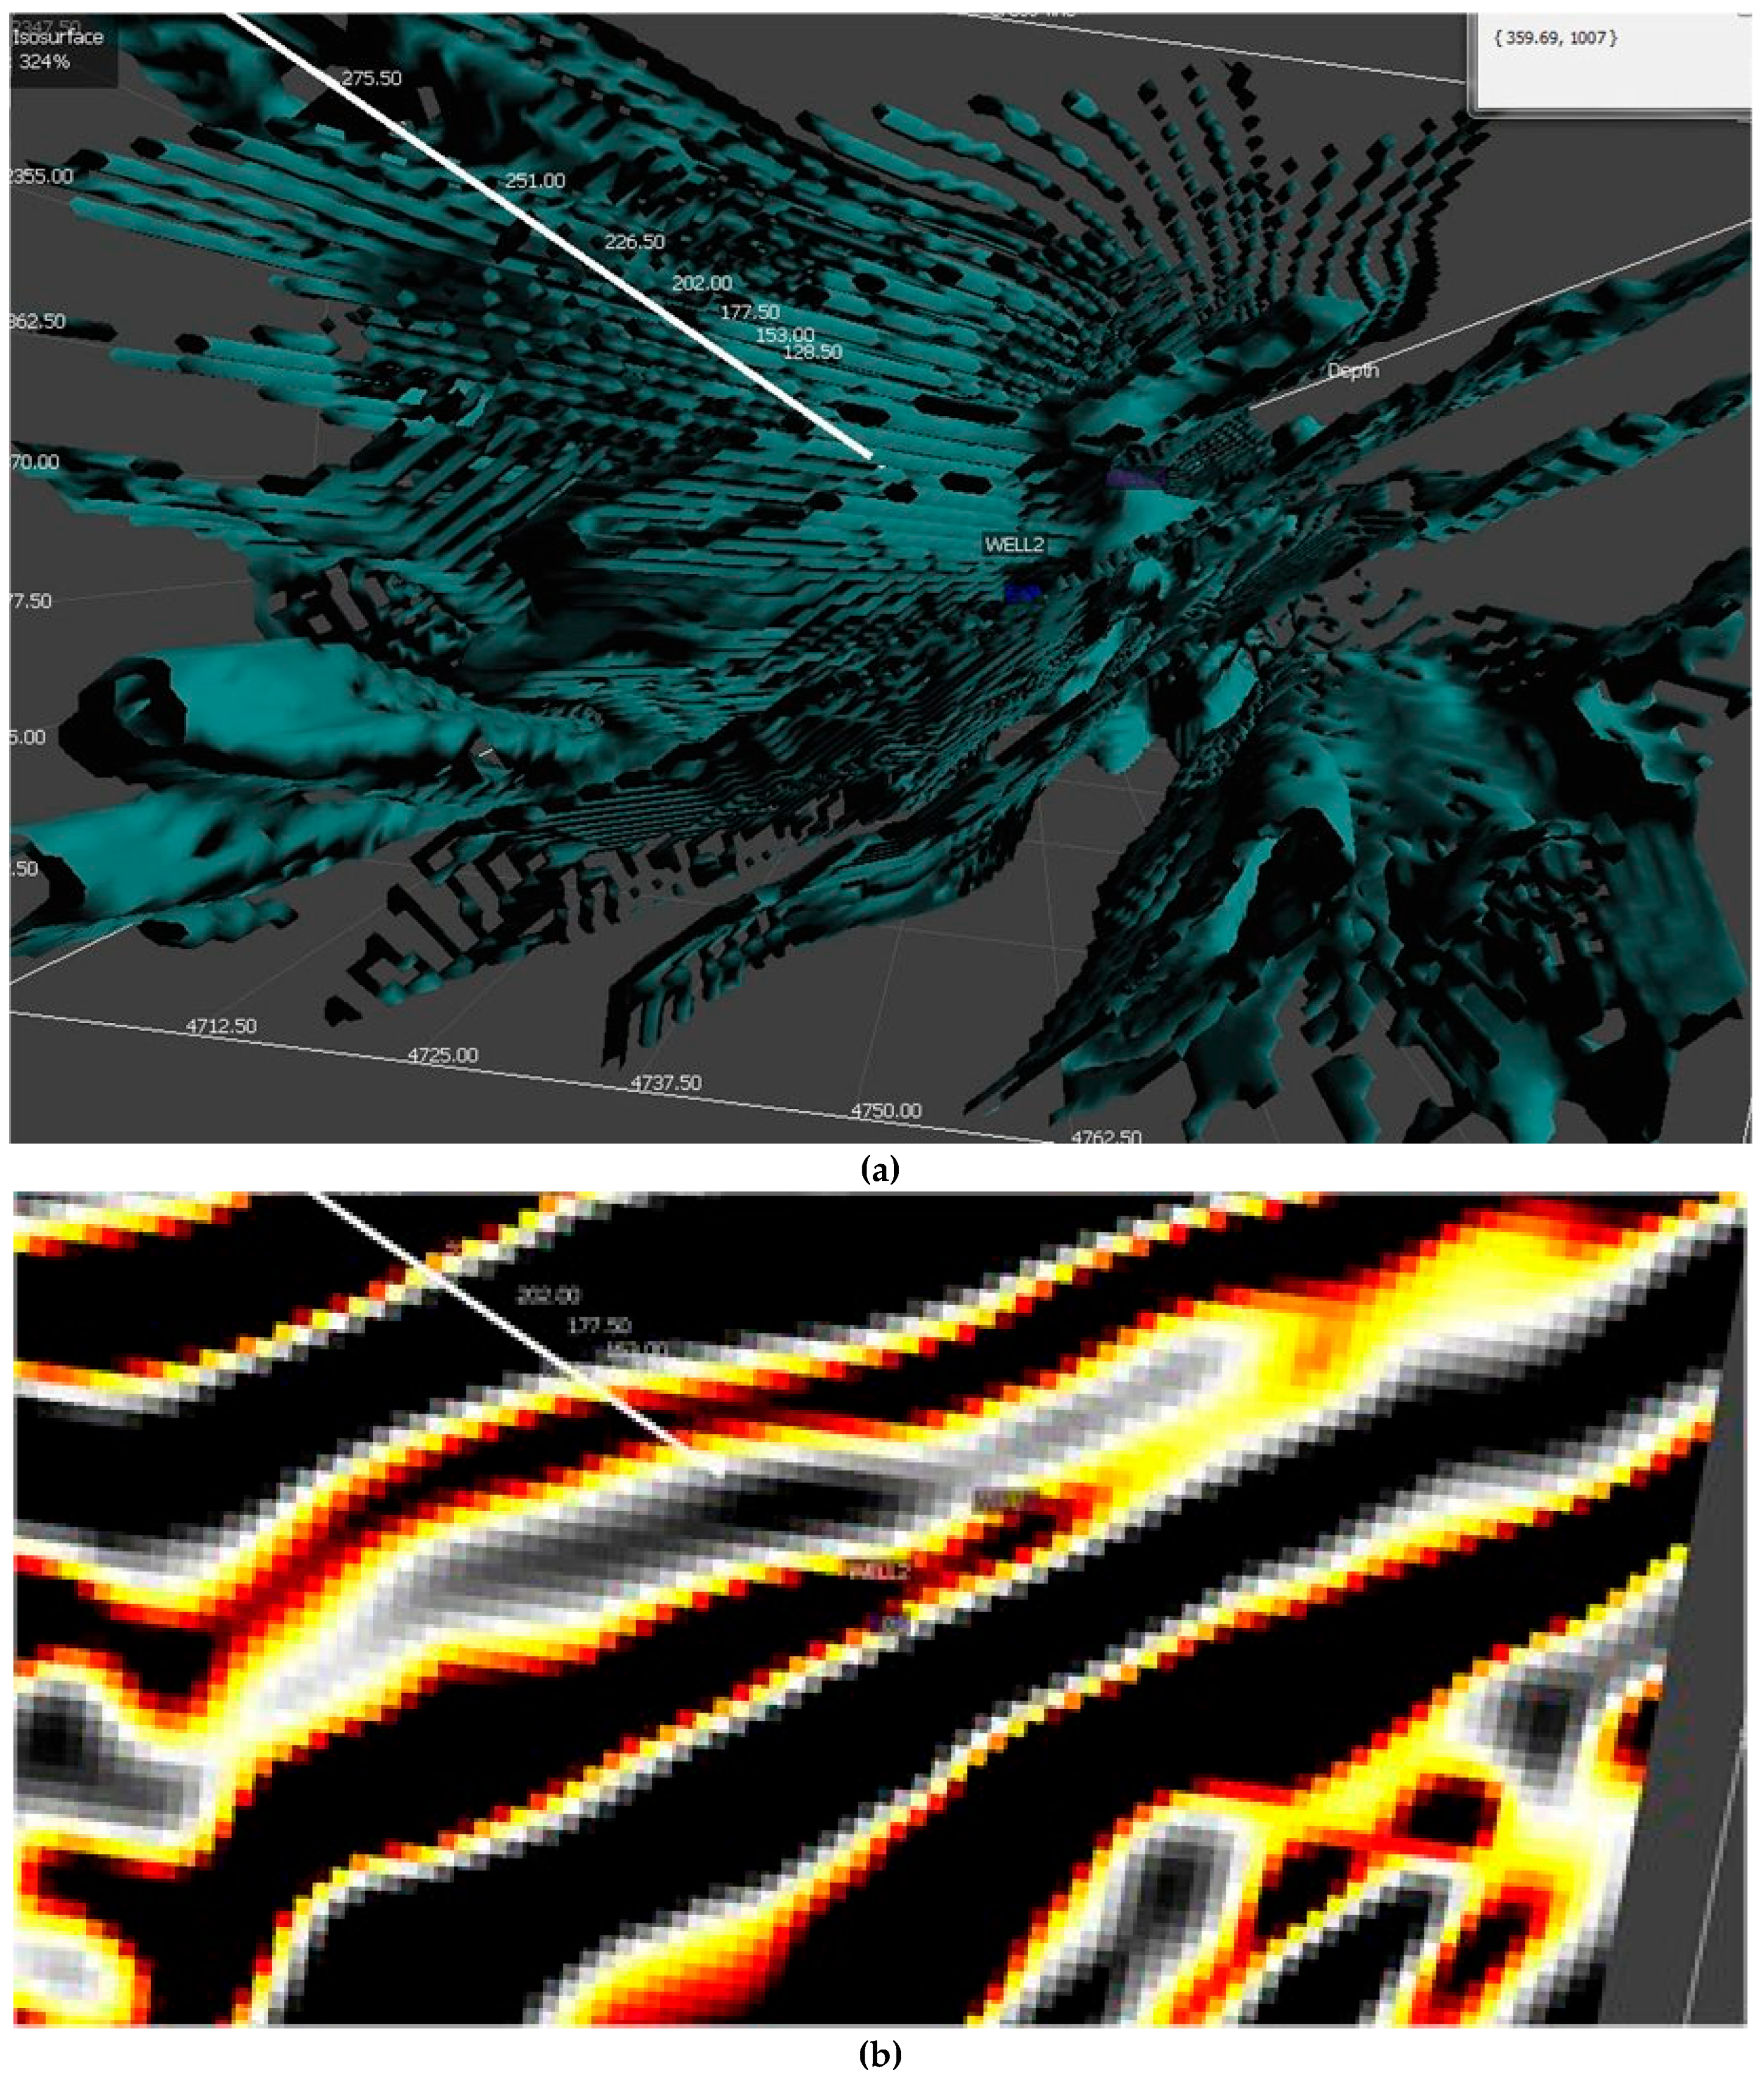
Figure 6.
a. Representative cubes (Digital Twins) were generated within the MIK environment from the same tomographic dataset using a set of statistical tools (See 6b). The spatial organization of the original tomographic signals is preserved, maintaining the positions of each measurement and its corresponding statistical parameter within their respective voxels (MIK) or pixels (SYM-Fractron). Signal intensity is represented by colour spatial coding on a continuous gamma scale. b. The set of statistical attributes extracted from metadata. This esqueme was applied to raw tomographic data, and visualized by the Digital Twins shown in Figure 4a. The common geophysical well-log measurements used in petroleum geosciences for rock-attribute analysis, including Gamma Ray (GR), Bulk Density (RHOB), Resistivity logs, Neutron Porosity (NPHI), and Sonic Transit Time (DT) constitute the primary input for geostatistical analyses such as kriging and co-kriging, aimed at estimating the spatial distribution (patterning) and joint variability of reservoir attributes. At each analysis stage, a corresponding Digital Twin, similar to tomography, can be constructed, visualized, and compared statistically for all metadata of interest.
Figure 6.
a. Representative cubes (Digital Twins) were generated within the MIK environment from the same tomographic dataset using a set of statistical tools (See 6b). The spatial organization of the original tomographic signals is preserved, maintaining the positions of each measurement and its corresponding statistical parameter within their respective voxels (MIK) or pixels (SYM-Fractron). Signal intensity is represented by colour spatial coding on a continuous gamma scale. b. The set of statistical attributes extracted from metadata. This esqueme was applied to raw tomographic data, and visualized by the Digital Twins shown in Figure 4a. The common geophysical well-log measurements used in petroleum geosciences for rock-attribute analysis, including Gamma Ray (GR), Bulk Density (RHOB), Resistivity logs, Neutron Porosity (NPHI), and Sonic Transit Time (DT) constitute the primary input for geostatistical analyses such as kriging and co-kriging, aimed at estimating the spatial distribution (patterning) and joint variability of reservoir attributes. At each analysis stage, a corresponding Digital Twin, similar to tomography, can be constructed, visualized, and compared statistically for all metadata of interest.
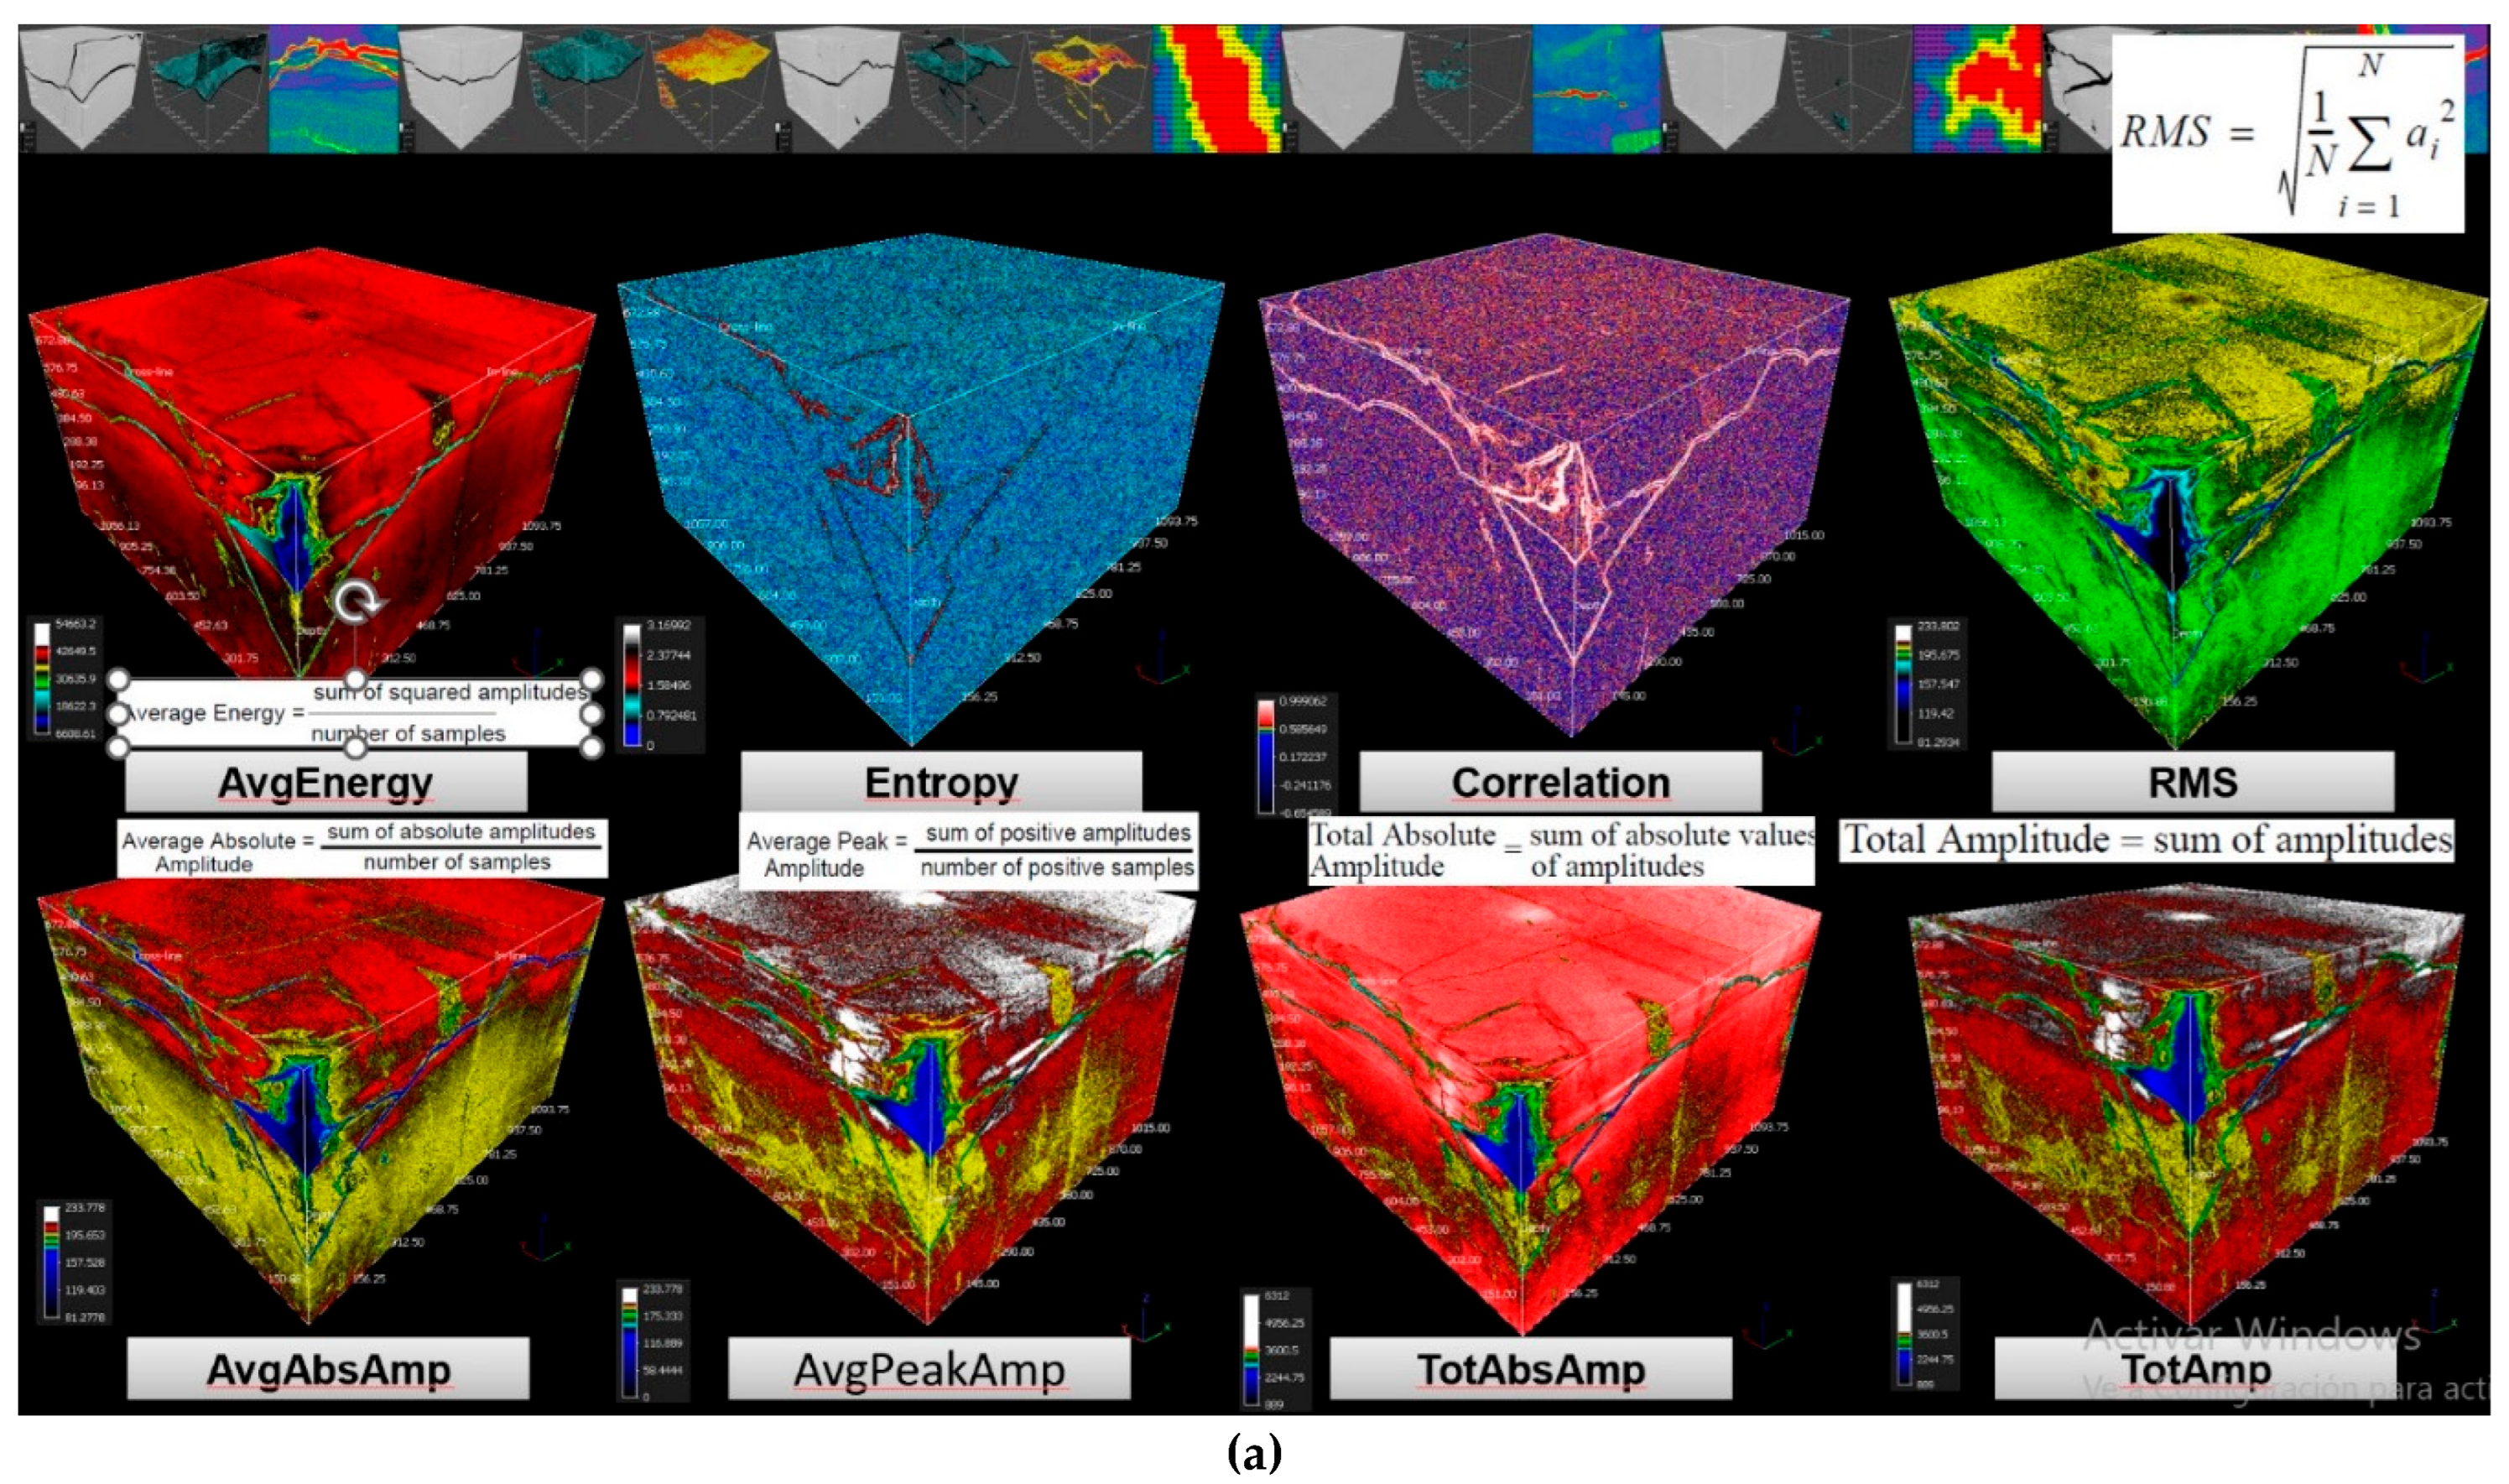
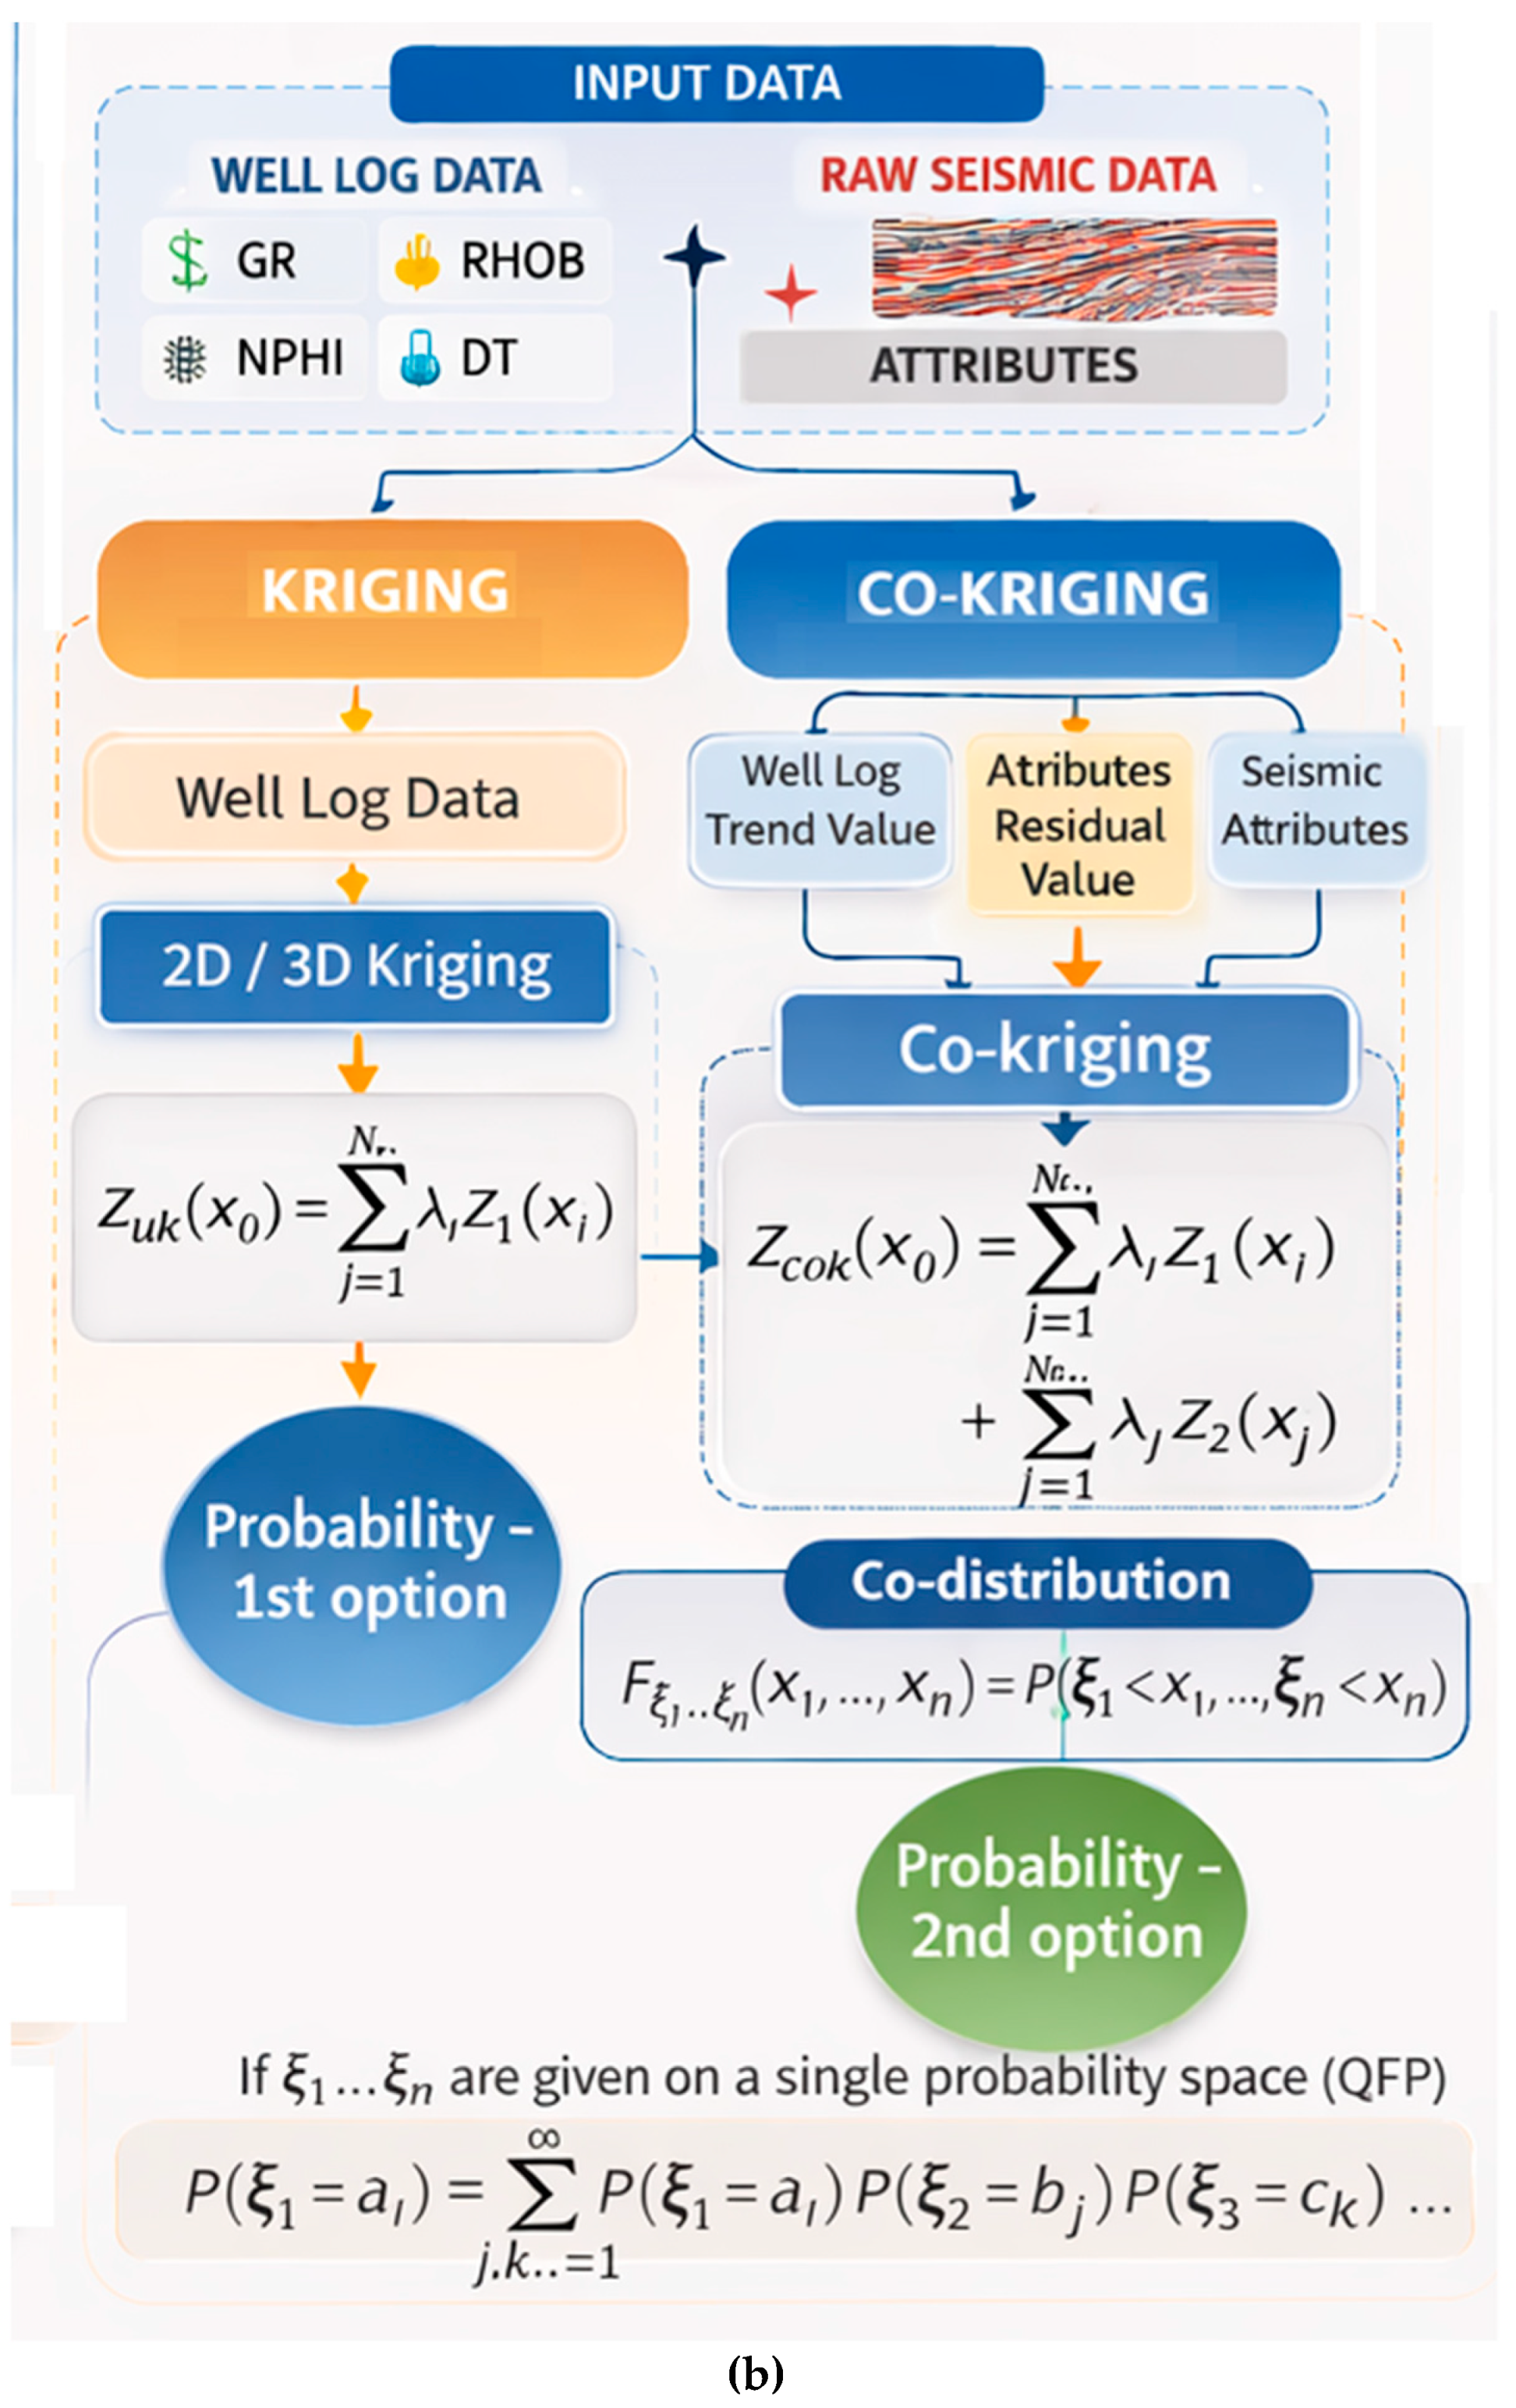
Figure 7.
a. Division of the Macro Texel into representative Microtexels. For clarity, only Micro Texels exhibiting visually and statistically confirmed contrasting porosity are shown. b. Skeleton of the Macro and Micro Texeles of the same tomographic cube, shown in Figure 6a and Figure 6b. Colors encoding the three classes of porosity. c. Isosurfaces of the Macro Texel and Micro Texels derived from the same tomographic cube shown in Figure 6a and Figure 6b.
Figure 7.
a. Division of the Macro Texel into representative Microtexels. For clarity, only Micro Texels exhibiting visually and statistically confirmed contrasting porosity are shown. b. Skeleton of the Macro and Micro Texeles of the same tomographic cube, shown in Figure 6a and Figure 6b. Colors encoding the three classes of porosity. c. Isosurfaces of the Macro Texel and Micro Texels derived from the same tomographic cube shown in Figure 6a and Figure 6b.
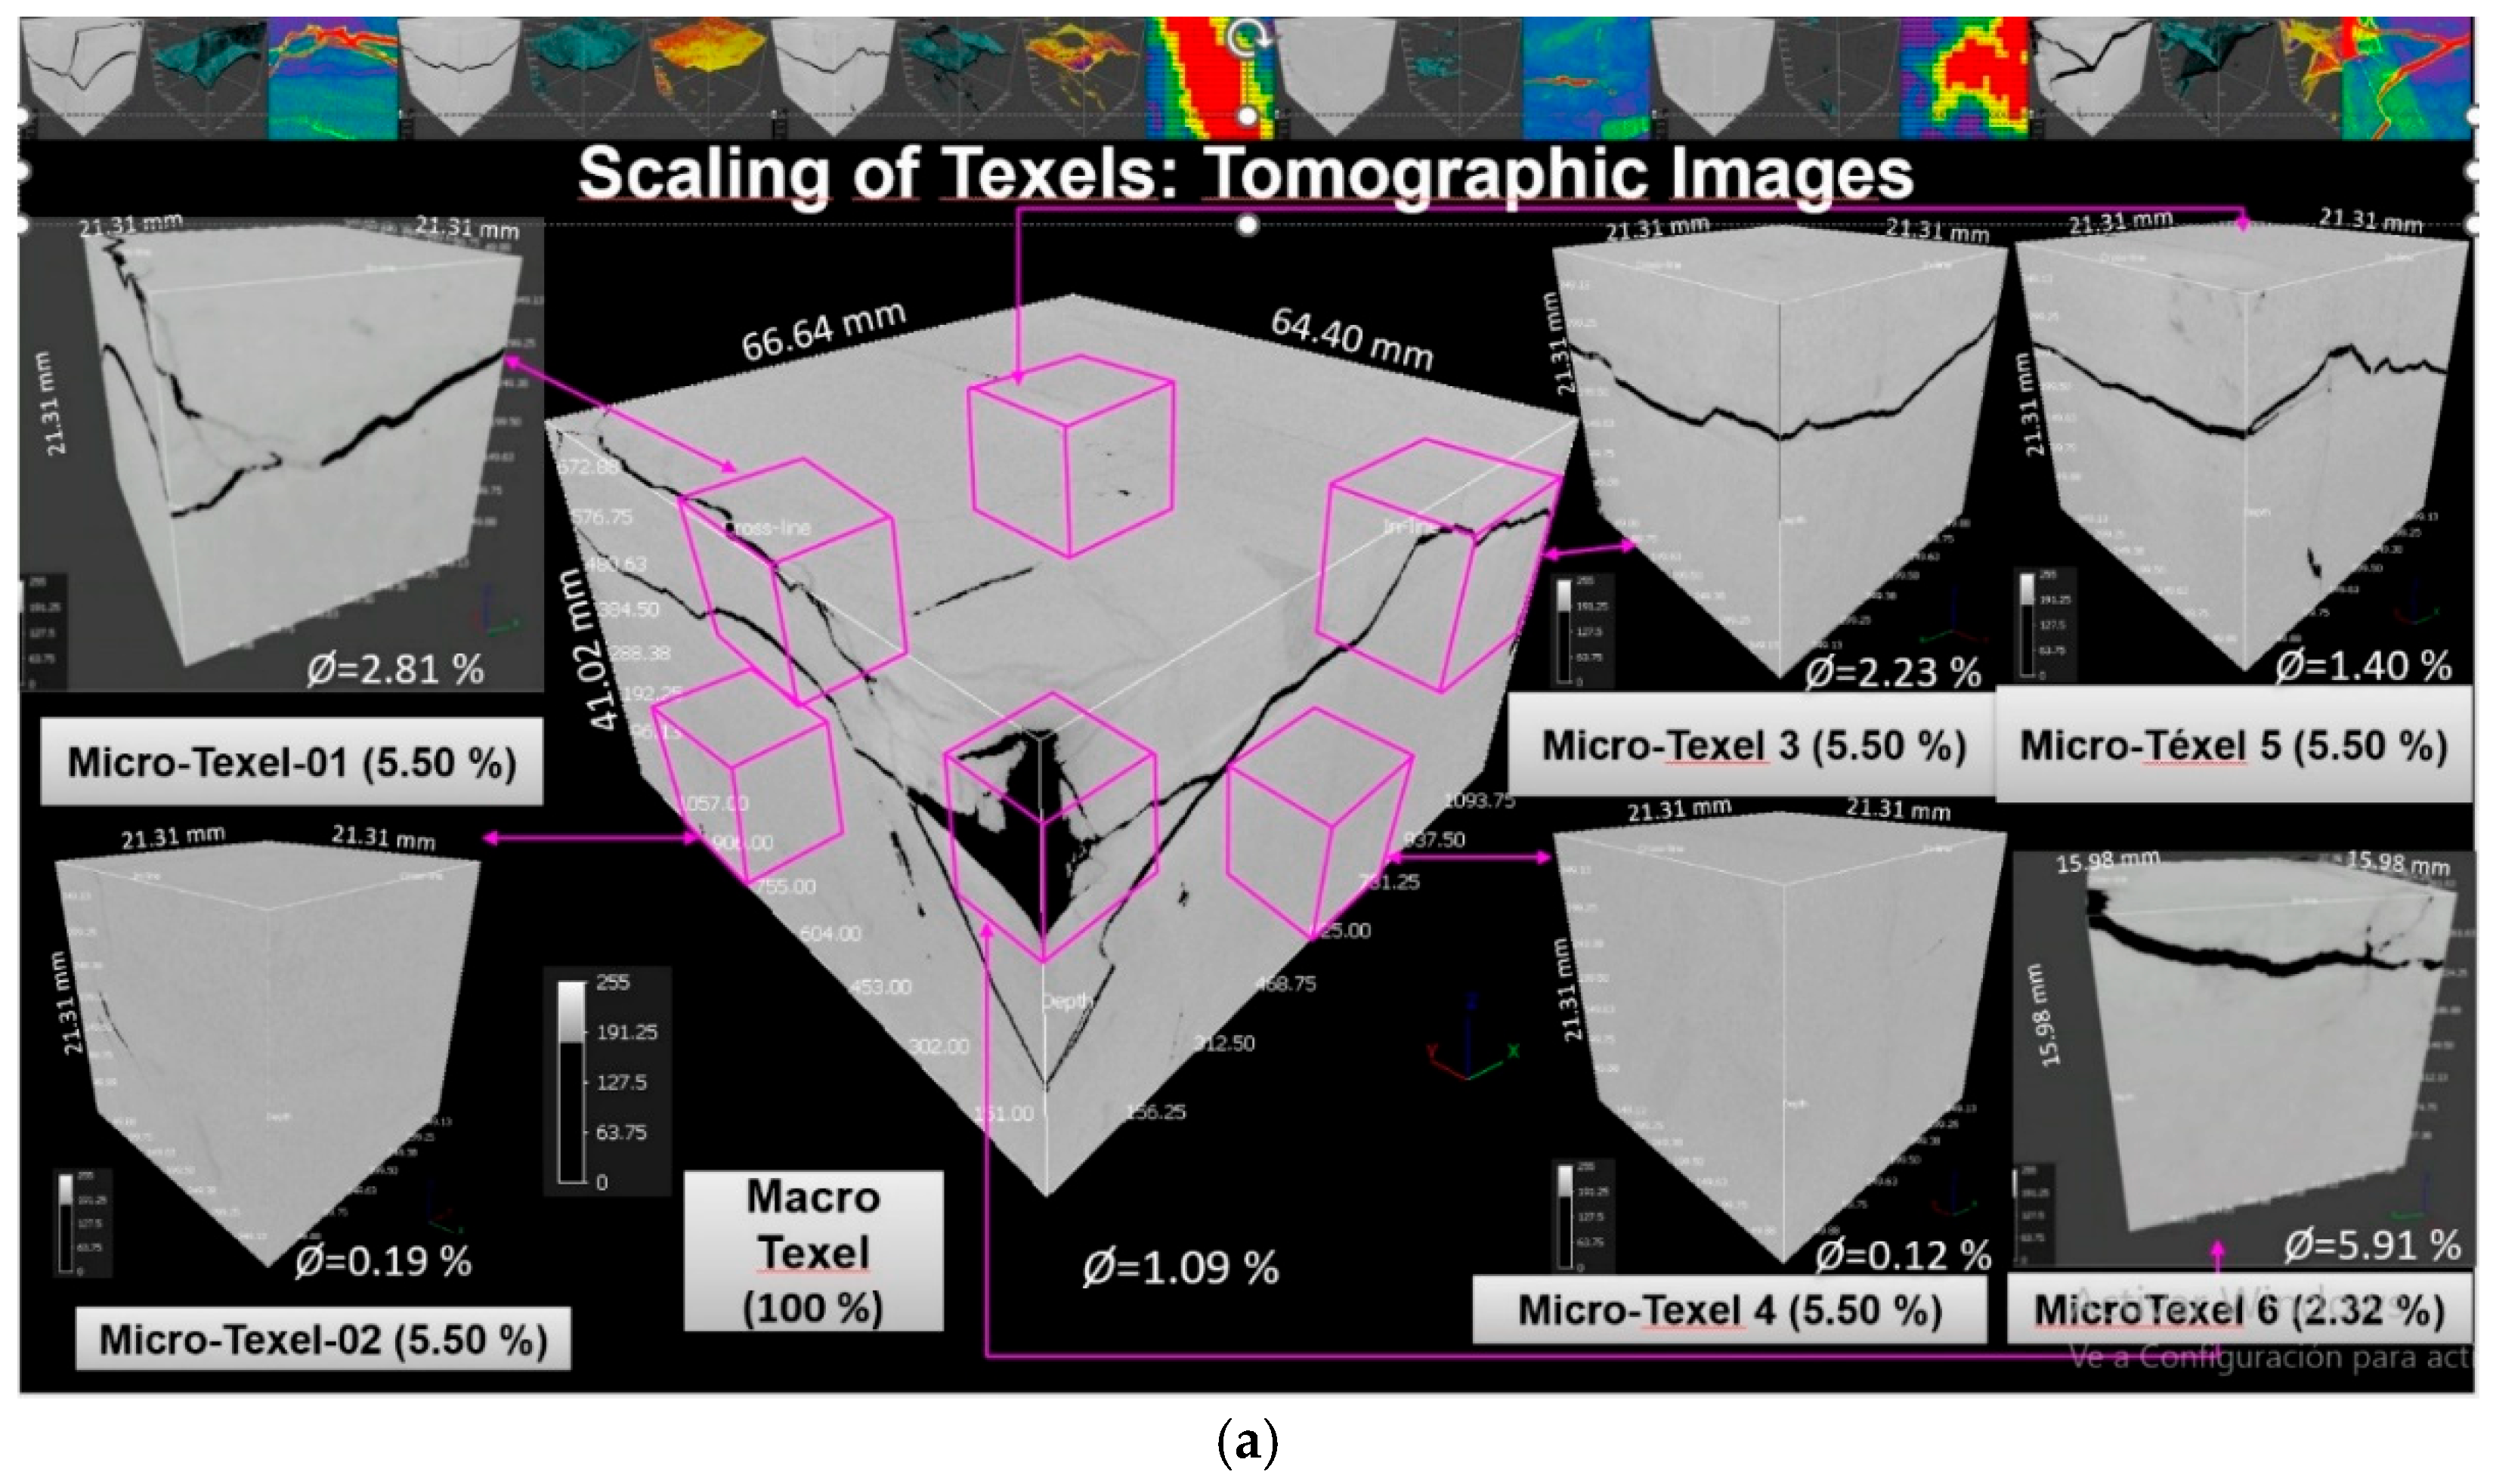
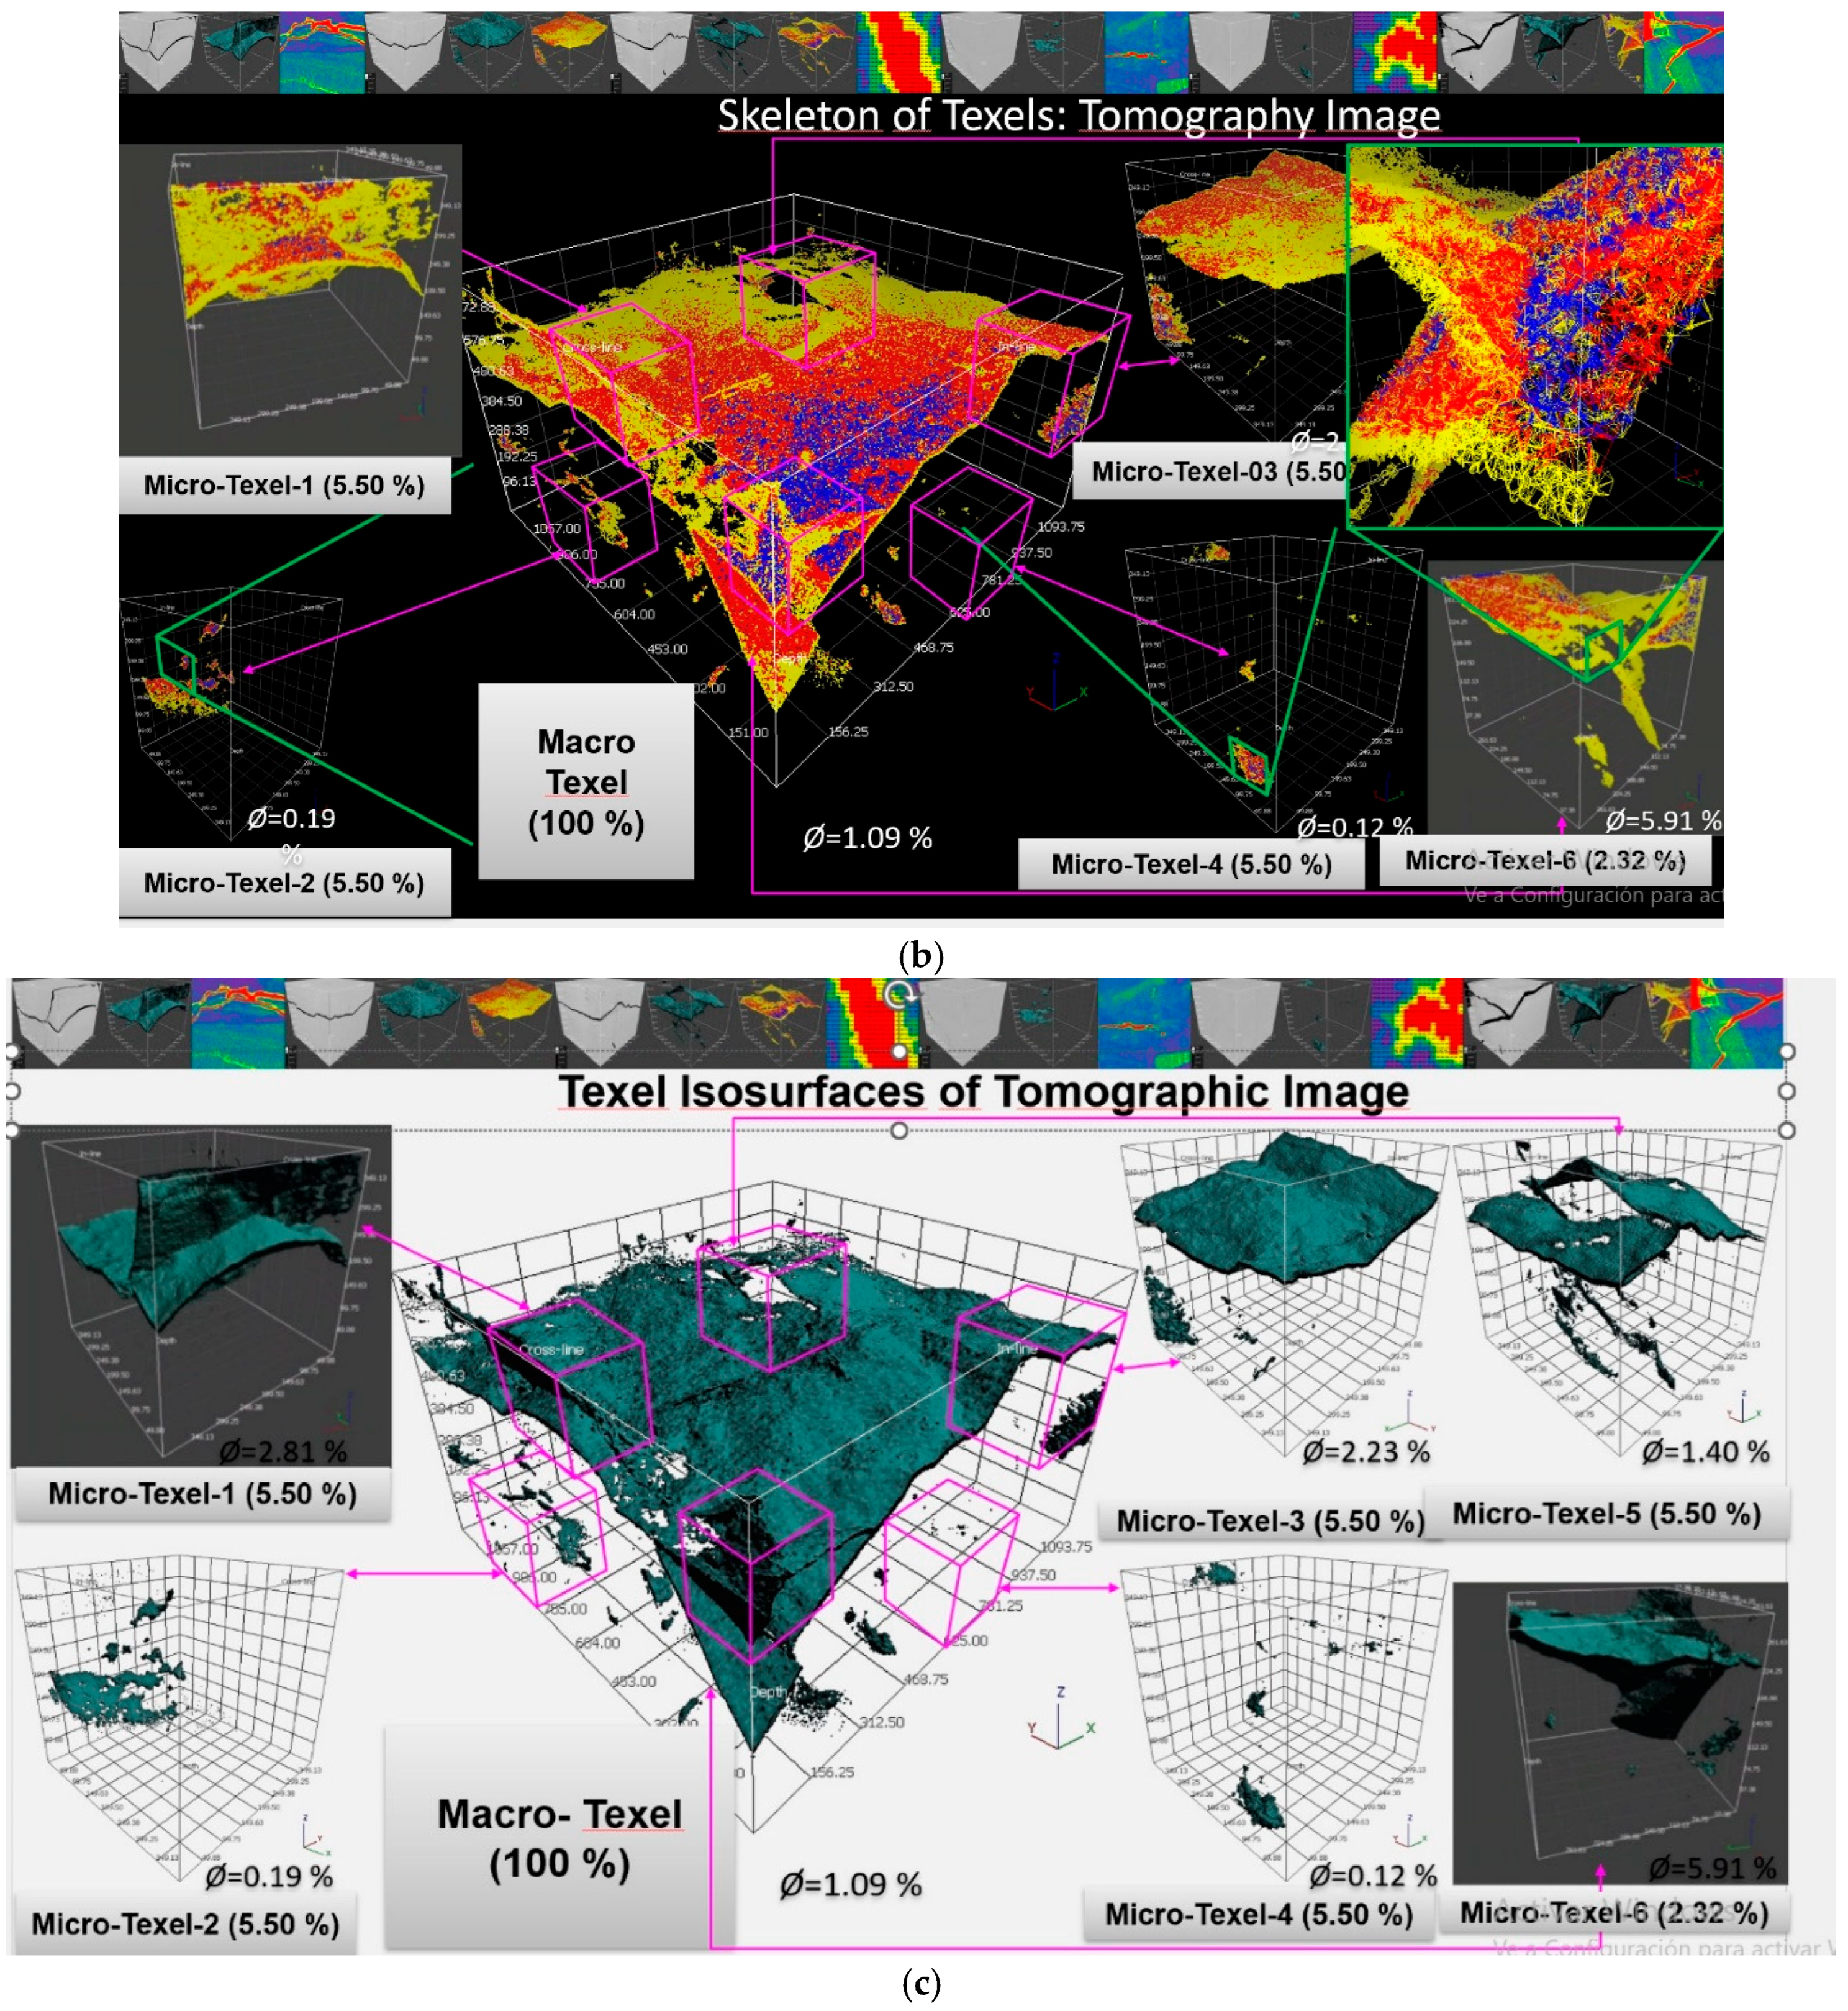
Figure 8.
Multicale encoding of the Macro Texcel topology (Figure 6a), into prime-number space. (right part of the top images). The upper panels show the original grayscale X-ray topographic cube (left) and its corresponding prime-number representation (right), where spatial positions are preserved. The lower-left panel displays the direct output of the SYM-Fractron software, including the binary-symbolic extraction of hidden prime structures. The low-right panels present the frequency distributions of primes and composite numbers derived from the same spatially encoded dataset. Both distributions exhibit clear power-law behavior, revealing a remarkable symmetry between the prime and composite components. This symmetry reflects the data’s underlying structural organization and supports their joint role as complementary numerical carriers in the Digital Transformer framework.
Figure 8.
Multicale encoding of the Macro Texcel topology (Figure 6a), into prime-number space. (right part of the top images). The upper panels show the original grayscale X-ray topographic cube (left) and its corresponding prime-number representation (right), where spatial positions are preserved. The lower-left panel displays the direct output of the SYM-Fractron software, including the binary-symbolic extraction of hidden prime structures. The low-right panels present the frequency distributions of primes and composite numbers derived from the same spatially encoded dataset. Both distributions exhibit clear power-law behavior, revealing a remarkable symmetry between the prime and composite components. This symmetry reflects the data’s underlying structural organization and supports their joint role as complementary numerical carriers in the Digital Transformer framework.
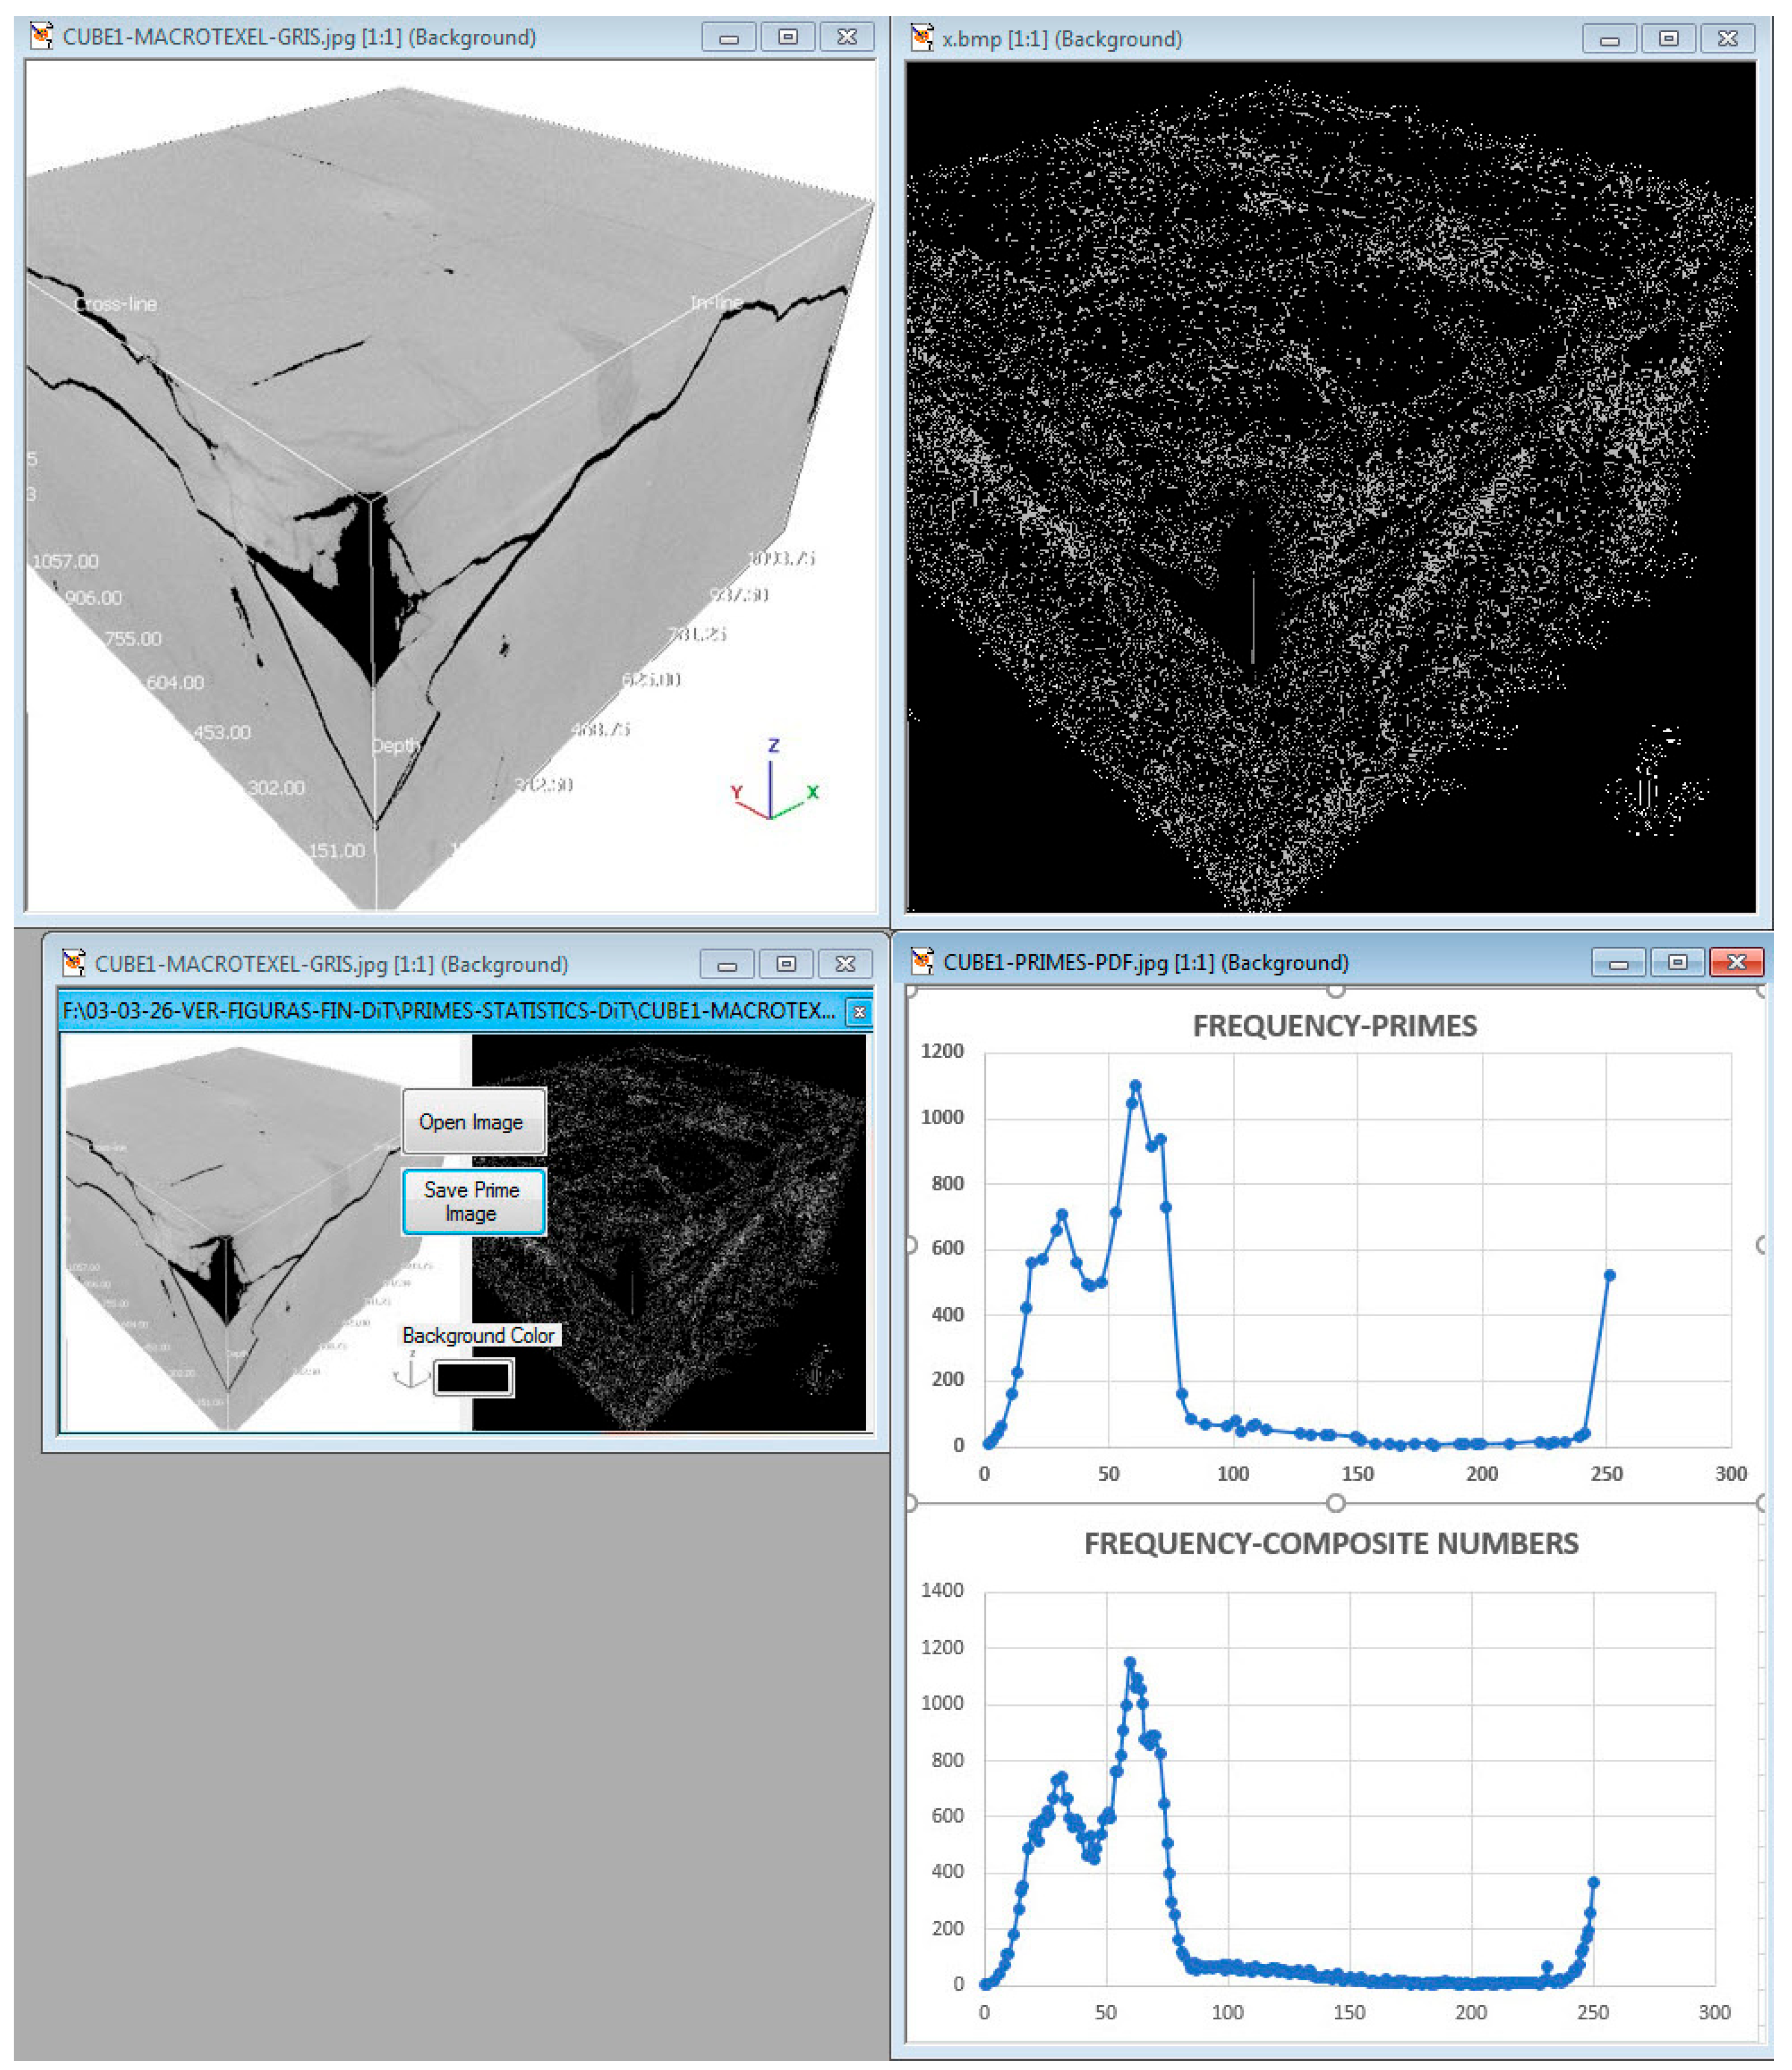
Figure 9.
Conceptual illustration of the numerical encoding of the PDE solution matrix, referring to the physical background of the phenomenon illustrated in this figure and described in detail in the caption of Figure 2, following the original explanation by Sir Prof. Michael Berry (2010). The upper-left panel shows the original visualization of the phenomenon using a continuous spectrum of millions of colors. At the same time, the corresponding grayscale transformation serves as the basis for numerical extraction. The right panels display spatially encoded numerical maps from the digitized image, preserving the system’s underlying geometry. The distribution of prime and composite numbers reveals a dominant prime value (highlighted in red) whose spatial organization captures the curvature of the underlined physical field. This result illustrates the capacity of prime-based encoding to represent geometrical and physical structure within a discrete, algebraically grounded numerical framework. This conclusion supports the interpretation of prime numbers as algebraic carriers of geometric information in discretized physical systems.
Figure 9.
Conceptual illustration of the numerical encoding of the PDE solution matrix, referring to the physical background of the phenomenon illustrated in this figure and described in detail in the caption of Figure 2, following the original explanation by Sir Prof. Michael Berry (2010). The upper-left panel shows the original visualization of the phenomenon using a continuous spectrum of millions of colors. At the same time, the corresponding grayscale transformation serves as the basis for numerical extraction. The right panels display spatially encoded numerical maps from the digitized image, preserving the system’s underlying geometry. The distribution of prime and composite numbers reveals a dominant prime value (highlighted in red) whose spatial organization captures the curvature of the underlined physical field. This result illustrates the capacity of prime-based encoding to represent geometrical and physical structure within a discrete, algebraically grounded numerical framework. This conclusion supports the interpretation of prime numbers as algebraic carriers of geometric information in discretized physical systems.
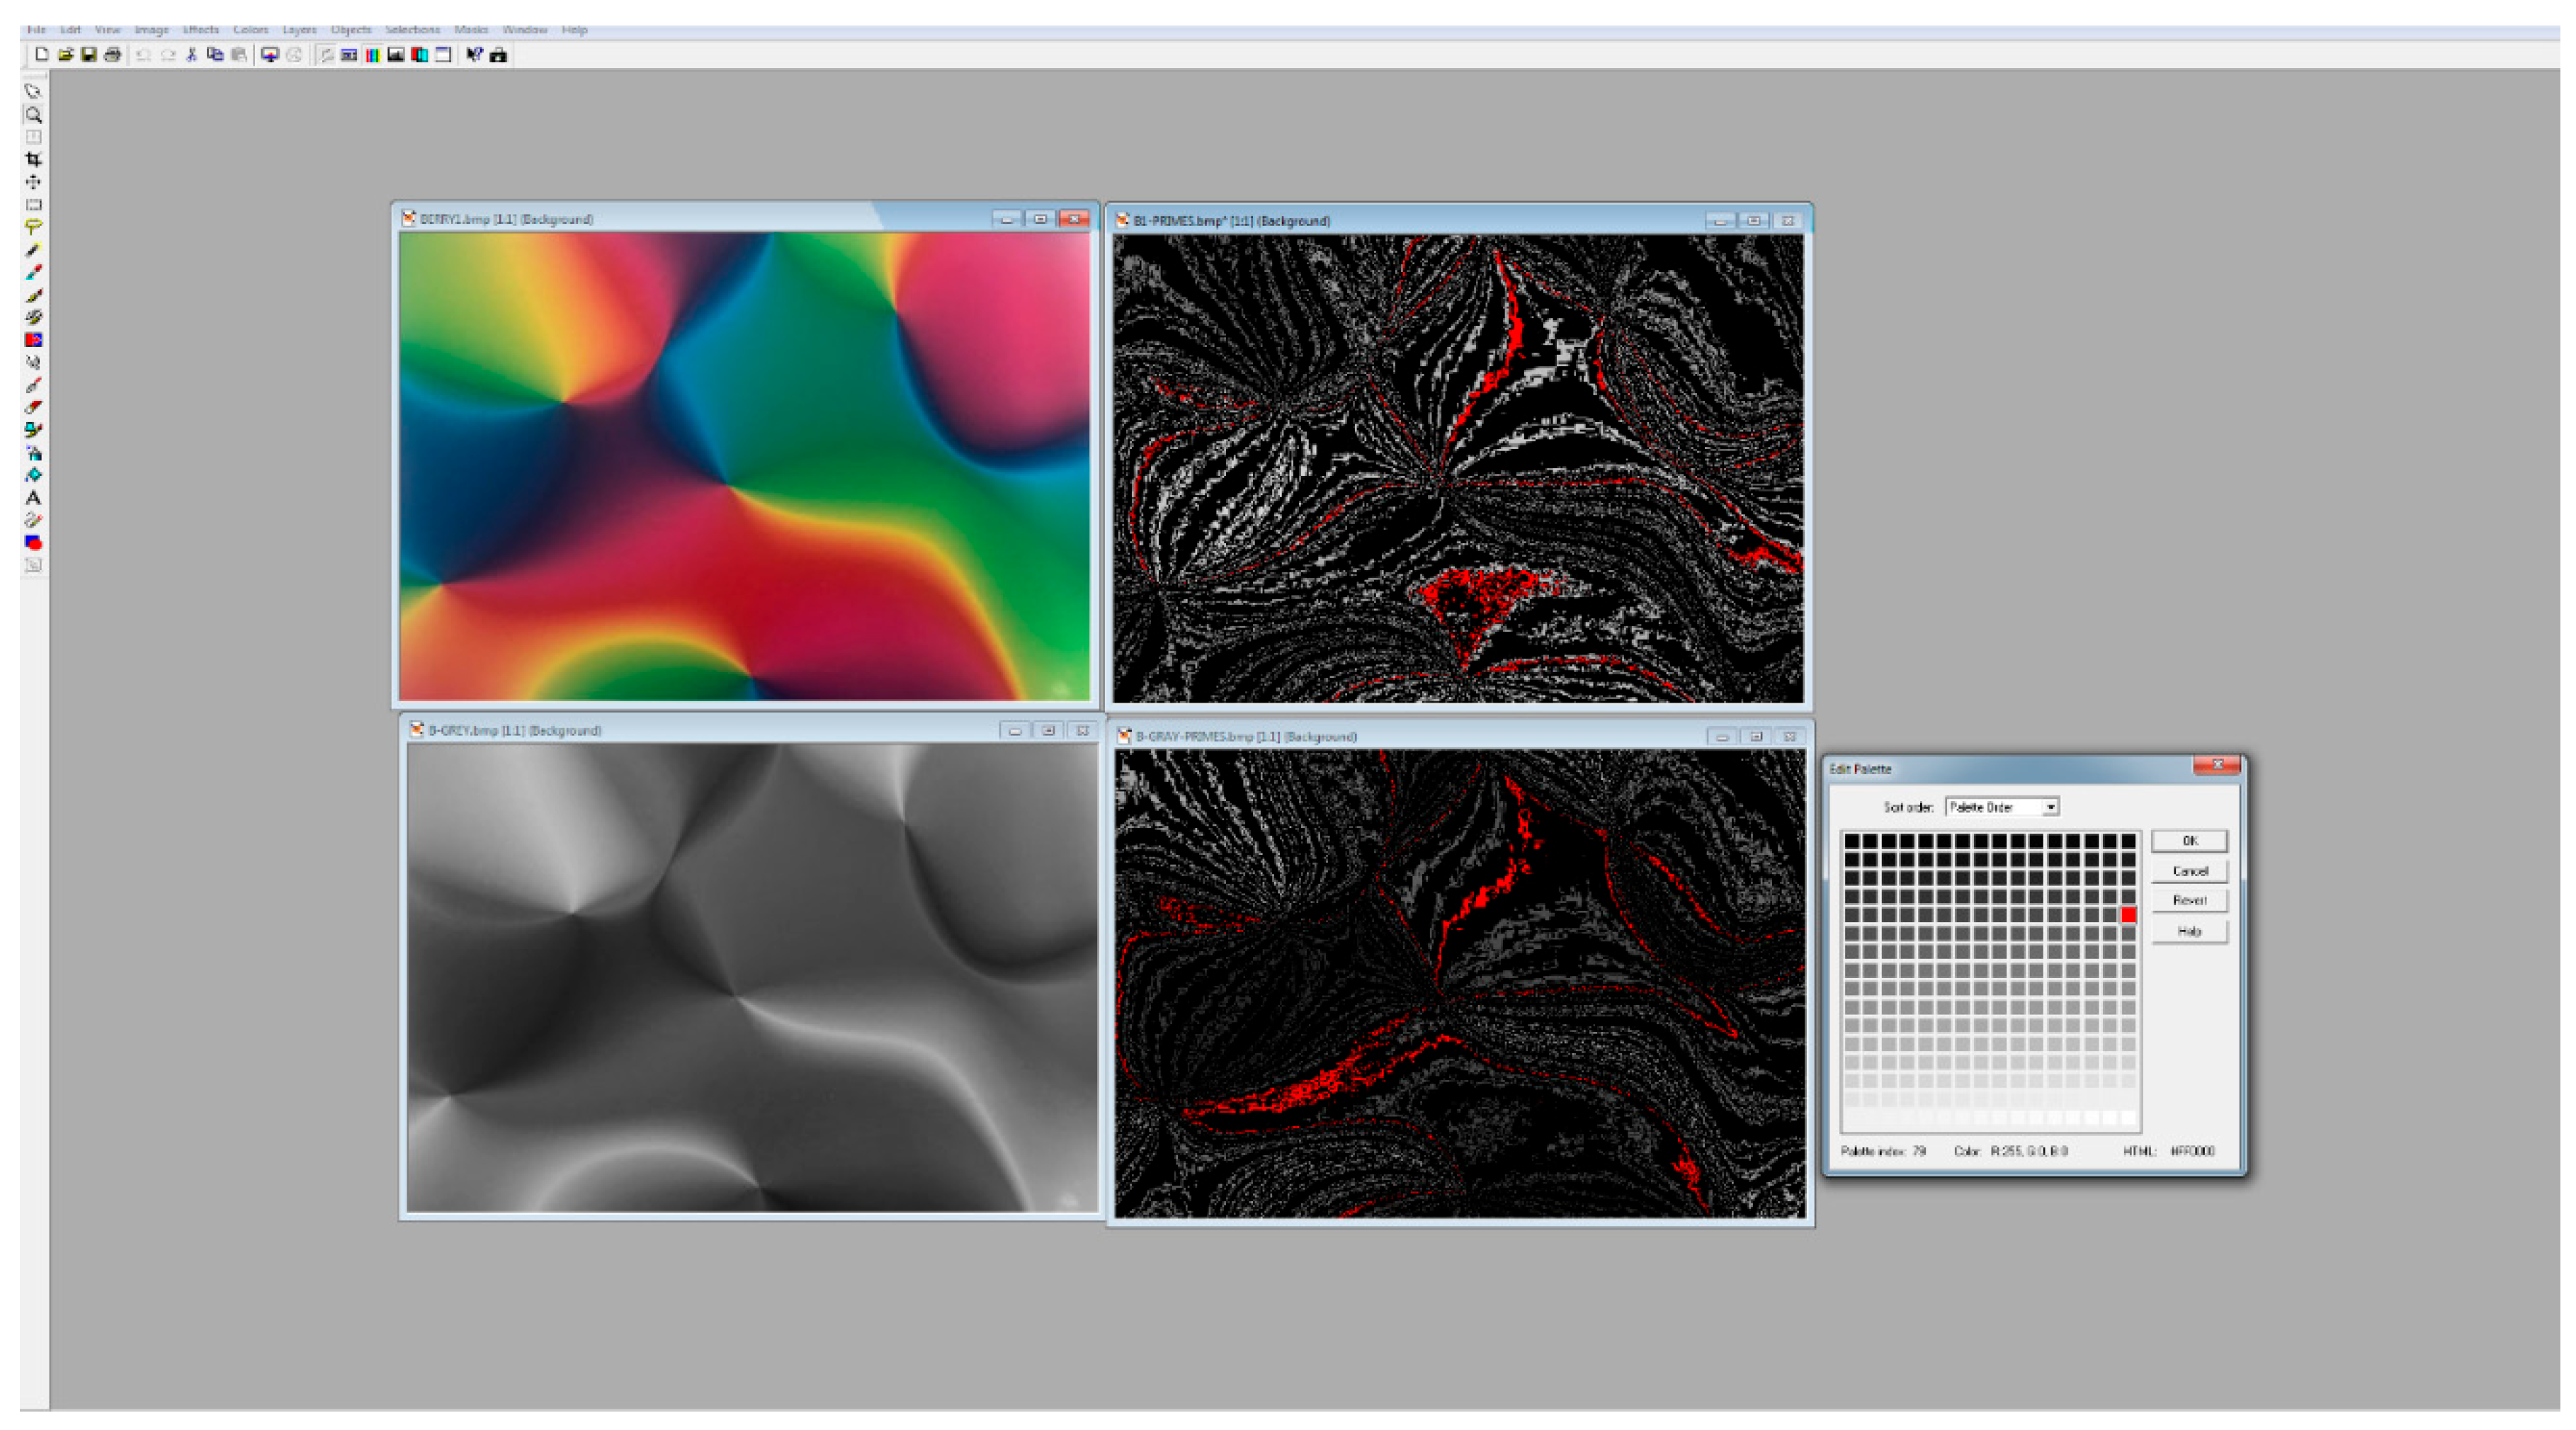
Figure 11.
Prime-based histogram mode and visionumerical decoding of structural connectivity in fracture patterns. The dominant histogram mode associated with the prime value 11 (right) delineates a connected structural domain within the fracture network, consistent with the isosurface representation of the Rose pattern (left) of fractures and indicative of underlying lithofacies curvature. White and blue lines indicate the designed well trajectories (see Section 2.2.2).
Figure 11.
Prime-based histogram mode and visionumerical decoding of structural connectivity in fracture patterns. The dominant histogram mode associated with the prime value 11 (right) delineates a connected structural domain within the fracture network, consistent with the isosurface representation of the Rose pattern (left) of fractures and indicative of underlying lithofacies curvature. White and blue lines indicate the designed well trajectories (see Section 2.2.2).
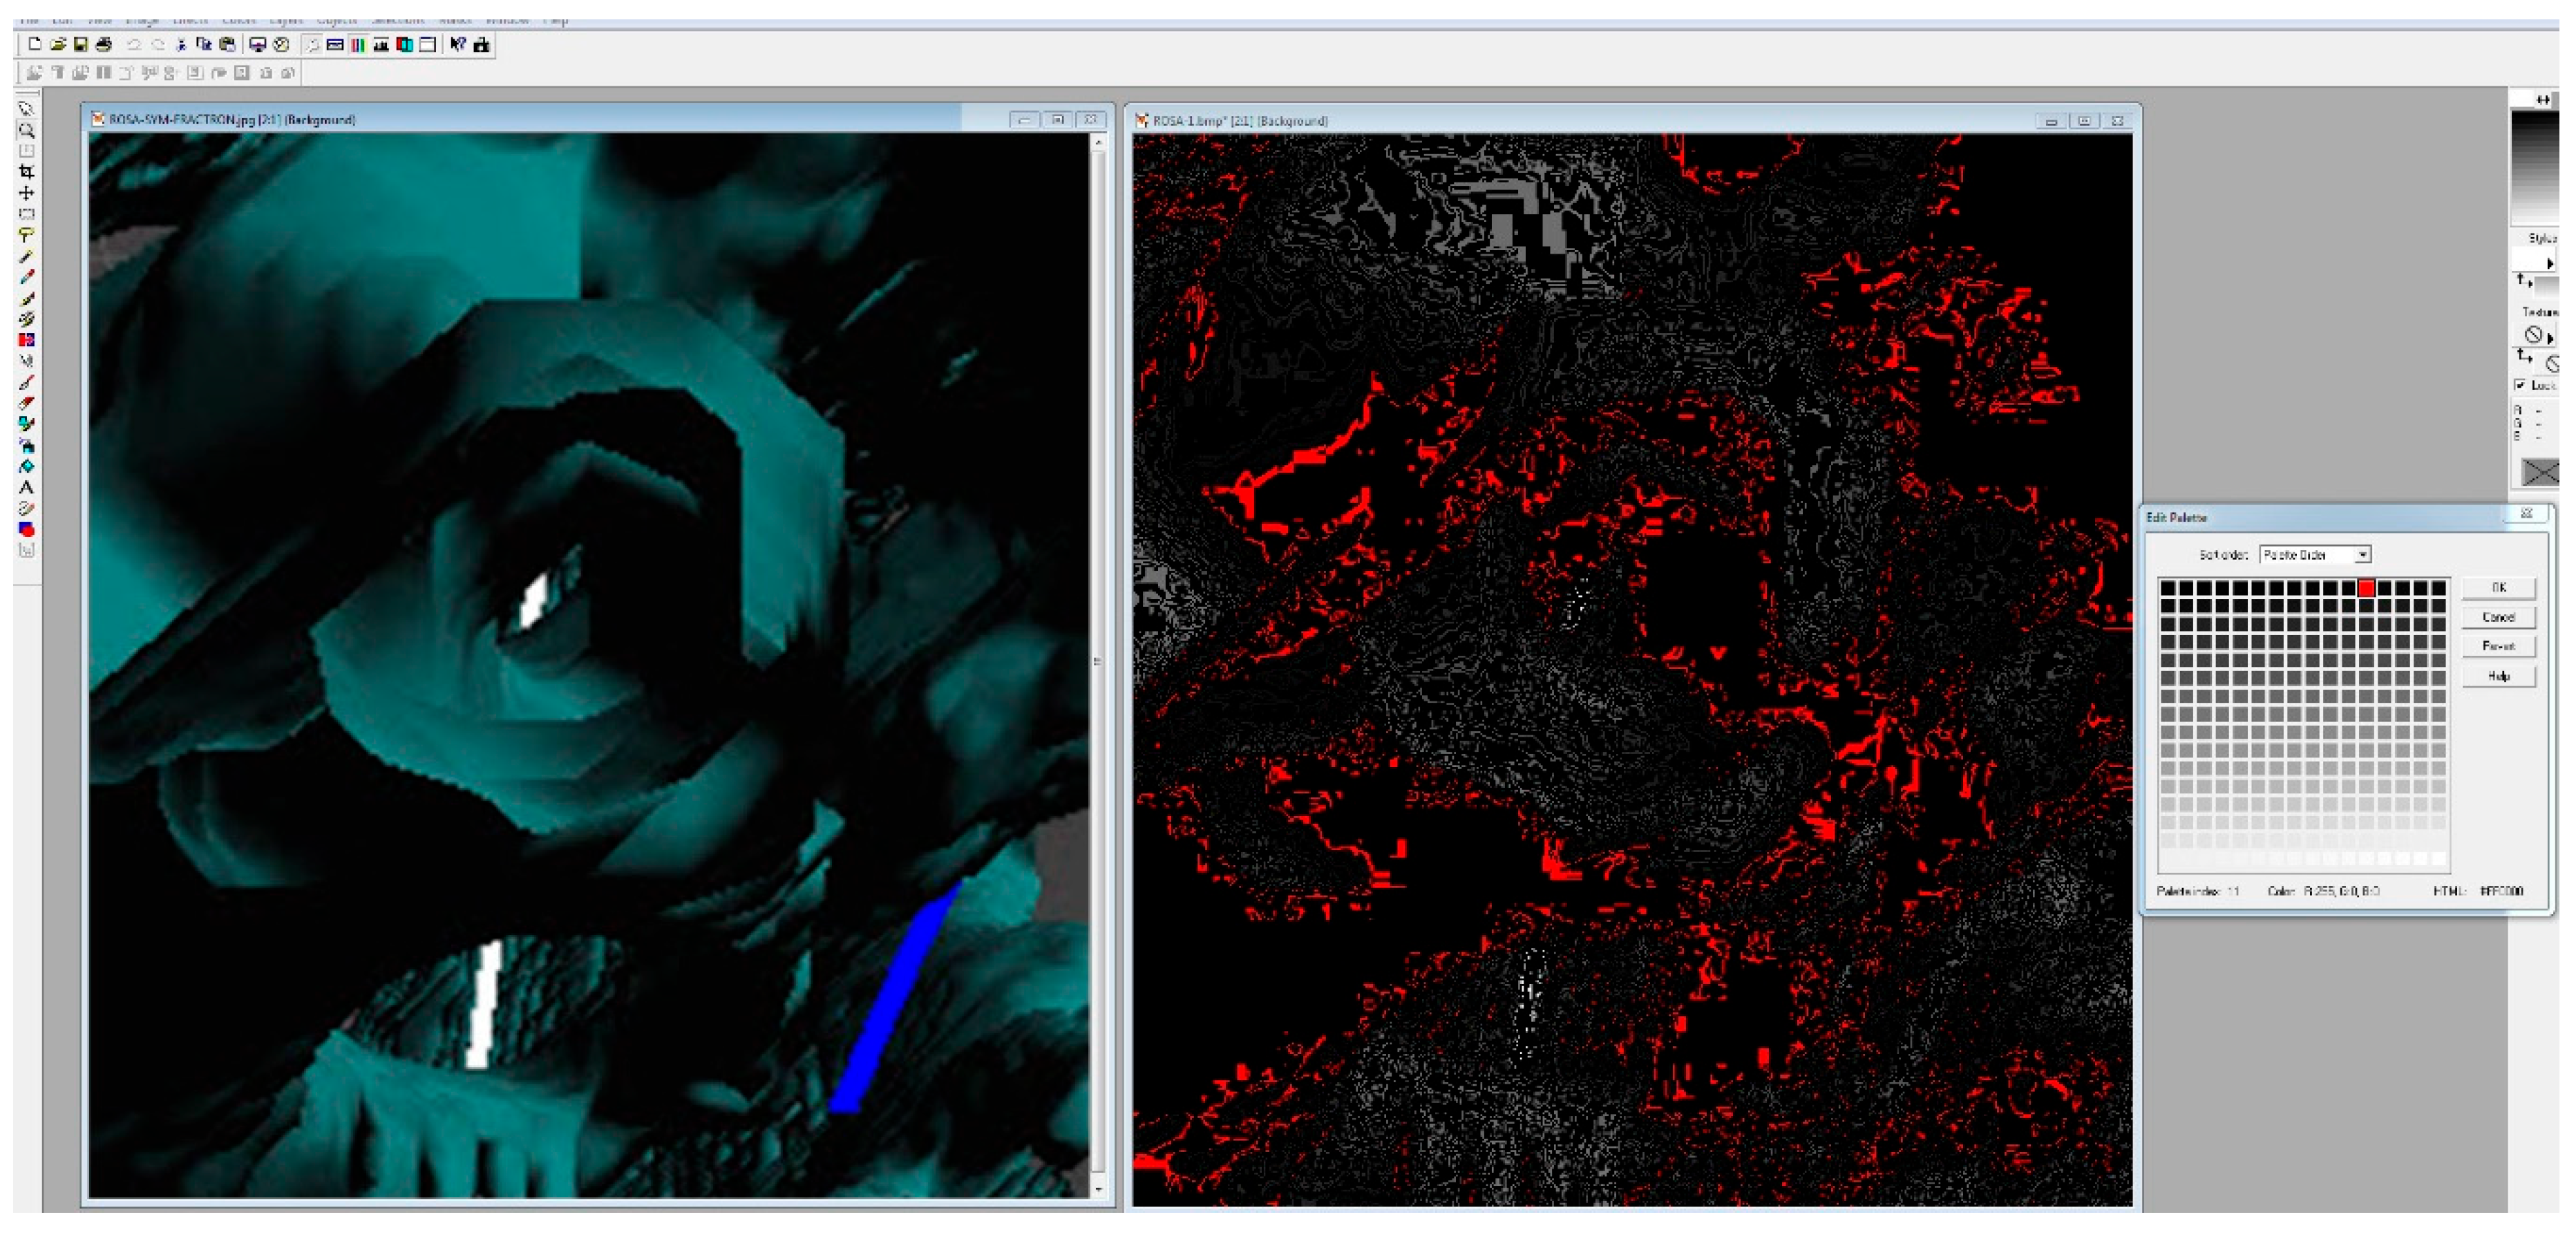
Figure 12.
The comparison of the singularity spectra highlights two contrasting topological regimes: (i) near-circular geometries (yellow and orange), here referred to as Rose patterns (Figure 11), and (ii) highly complex, anisotropic morphologies, such as the Fenix or Crazy Bird Patterns (Figure 5), commonly observed in dolomitized carbonate systems (blue, green and red).
Figure 12.
The comparison of the singularity spectra highlights two contrasting topological regimes: (i) near-circular geometries (yellow and orange), here referred to as Rose patterns (Figure 11), and (ii) highly complex, anisotropic morphologies, such as the Fenix or Crazy Bird Patterns (Figure 5), commonly observed in dolomitized carbonate systems (blue, green and red).
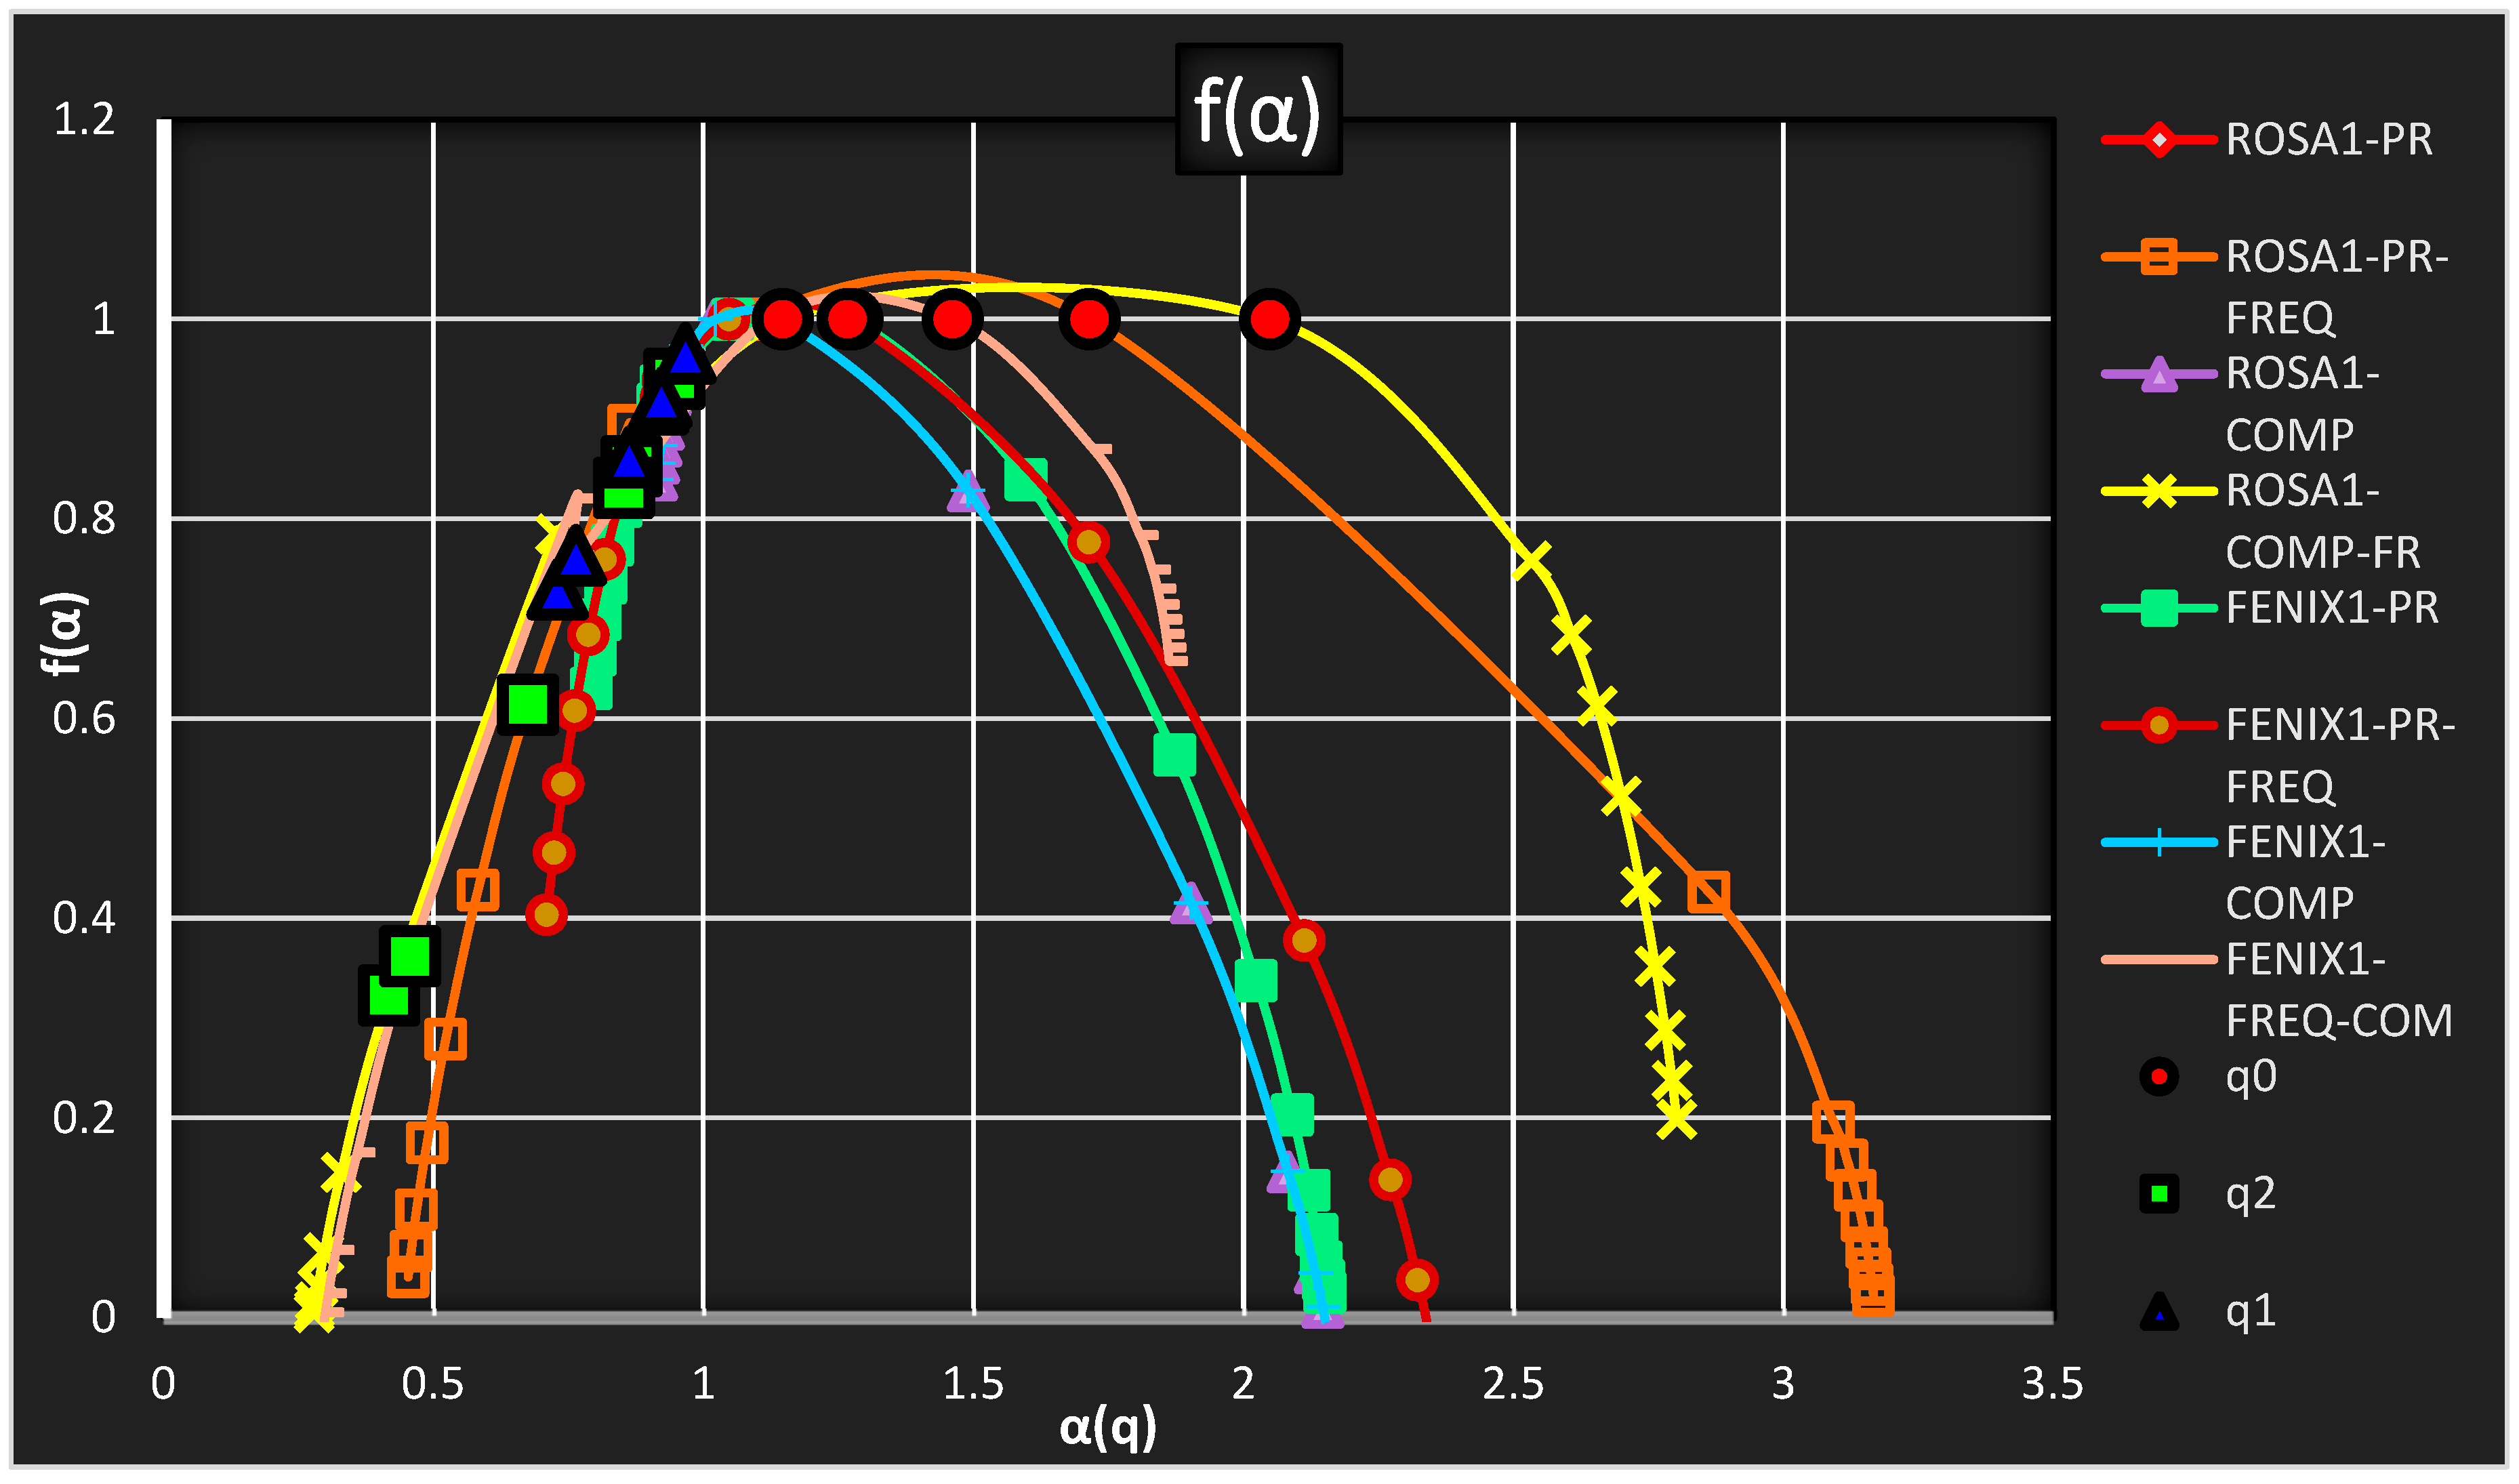
Disclaimer/Publisher’s Note: The statements, opinions and data contained in all publications are solely those of the individual author(s) and contributor(s) and not of MDPI and/or the editor(s). MDPI and/or the editor(s) disclaim responsibility for any injury to people or property resulting from any ideas, methods, instructions or products referred to in the content. |
© 2026 by the authors. Licensee MDPI, Basel, Switzerland. This article is an open access article distributed under the terms and conditions of the Creative Commons Attribution (CC BY) license (http://creativecommons.org/licenses/by/4.0/).
Copyright: This open access article is published under a Creative Commons CC BY 4.0 license, which permit the free download, distribution, and reuse, provided that the author and preprint are cited in any reuse.


