

Submitted:
08 April 2026
Posted:
09 April 2026
You are already at the latest version
Abstract
This study investigates urban well-being in New York City and Berlin using a combination of survey-based life satisfaction data, quantum wave modeling, and spatial econometric approaches. Unlike classical deterministic frameworks, our methodology captures both the expected level and the uncertainty of life satisfaction, revealing significant intra-urban heterogeneity. Empirical results show that income inequality, housing costs, social capital, and access to green space are key determinants of welfare, with spatial disparities persisting in NYC’s outer boroughs and Berlin’s Eastern districts. The quantum wave model outperforms traditional utility-based models, highlighting the importance of probabilistic approaches in urban welfare analysis. Policy simulations indicate that targeted interventions in housing affordability, environmental quality, and mobility can effectively raise average welfare and reduce inequality. The study provides actionable insights for urban planners and policymakers, emphasizing the need for distribution-sensitive and spatially aware strategies to enhance life satisfaction and urban resilience.
Keywords:
urban well-being
; life satisfaction
; quantum wave model
; spatial econometrics
; housing affordability
; environmental policy
; urban inequality
1. Introduction
1.1. Urban Welfare and Life Satisfaction
In recent decades, the analysis of urban welfare has increasingly shifted from purely economic indicators toward broader measures of subjective well-being and life satisfaction. Traditional measures of urban performance—such as income levels, employment rates, and productivity—remain important, but they are increasingly complemented by indicators capturing residents’ perceptions of quality of life, including satisfaction with housing conditions, environmental quality, mobility accessibility, and social opportunities. This shift reflects a growing recognition that economic prosperity alone does not fully capture the welfare experienced by urban populations (Stiglitz, Sen, & Fitoussi, 2009; Clark, Frijters, & Shields, 2008).
Urban environments strongly shape life satisfaction through multiple channels. Income and employment opportunities influence financial security and social mobility, while housing affordability and neighborhood quality affect residential stability and well-being. Environmental factors such as air quality, green spaces, and urban density contribute to both physical and psychological health. In addition, accessibility to jobs, services, and cultural activities through efficient transportation systems plays a central role in shaping daily experiences of urban life (Glaeser, 2011; Florida, 2017).
Large metropolitan regions such as New York City and Berlin provide particularly relevant contexts for studying the determinants of urban life satisfaction. Both cities are major global centers of economic activity, culture, and innovation, yet they exhibit distinct urban structures and policy frameworks. New York City is characterized by high economic dynamism, dense urban development, and significant income inequality, whereas Berlin combines strong cultural vitality with comparatively lower living costs and extensive public services. These differences create diverse welfare environments that influence how residents perceive their quality of life (OECD, 2020; Florida, Mellander, & Rentfrow, 2013).
Understanding how life satisfaction evolves within such urban contexts requires analytical frameworks that integrate both objective economic factors and subjective perceptions of well-being. However, modeling subjective welfare presents substantial challenges because individual preferences and perceptions are inherently heterogeneous and may vary across time and contexts.
1.2. Limitations of Classical Utility Models
Most traditional welfare models in economics rely on the concept of deterministic utility functions, in which individuals derive utility from observable variables such as income, consumption, housing quality, and leisure. In these frameworks, preferences are typically assumed to be stable and consistent, and the relationship between explanatory variables and utility is represented through fixed functional forms. Such models have provided a powerful foundation for welfare analysis and policy evaluation in urban economics and public economics (Mas-Colell, Whinston, & Green, 1995).
However, deterministic utility models face important limitations when applied to subjective well-being and life satisfaction. Empirical studies in behavioral economics and psychology have shown that individuals’ preferences and perceptions are influenced by cognitive processes, emotional states, social comparisons, and contextual factors that are not easily captured by standard utility functions. Life satisfaction may fluctuate even when objective conditions remain unchanged, reflecting the role of psychological adaptation, expectations, and uncertainty (Kahneman & Krueger, 2006; Clark et al., 2008).
Moreover, urban environments themselves introduce additional layers of uncertainty. Residents experience varying commuting times, housing conditions, environmental exposures, and social interactions, all of which can influence well-being in dynamic and unpredictable ways. These fluctuations suggest that utility may be better understood as a probabilistic phenomenon, where individuals occupy different states of satisfaction depending on contextual conditions and personal perceptions.
Classical utility models are not well suited to represent such stochastic or probabilistic preference structures. By treating preferences as deterministic and stable, these models may overlook the dynamic and uncertain nature of subjective welfare in complex urban environments.
1.3. Research Gap
The limitations of deterministic utility models highlight the need for alternative frameworks capable of representing uncertainty and variability in individual welfare states. Recent developments in interdisciplinary research have explored the possibility of applying concepts from quantum probability theory to social and economic systems. In contrast to classical probability models, quantum probability allows for the representation of superposition, interference, and probabilistic transitions between different states (Busemeyer & Bruza, 2012; Haven & Khrennikov, 2013).
In this perspective, individual preferences or psychological states can be interpreted as probabilistic configurations rather than fixed deterministic choices. Observable outcomes, such as reported life satisfaction, may then emerge from the probabilistic collapse of these states under specific contextual conditions.
Applying such a framework to urban welfare analysis suggests that life satisfaction may be represented as a distribution over multiple possible utility states rather than as a single deterministic value. Urban environments—with their complex interactions among economic conditions, social contexts, and environmental factors—can influence the probability distribution of these states. However, despite increasing interest in probabilistic models of decision-making, urban welfare models rarely incorporate probabilistic preference structures based on quantum-inspired frameworks.
Developing such models could provide new insights into how urban environments influence subjective well-being and how welfare fluctuations emerge from the interaction between individual perceptions and external conditions.
1.4. Research Objectives
This study introduces a quantum-inspired probabilistic framework for modeling urban welfare and life satisfaction. The proposed approach conceptualizes utility not as a deterministic function but as a probabilistic wave-like structure that reflects the distribution of possible welfare states experienced by individuals in an urban environment.
The research pursues three main objectives.
First, the study develops a quantum-inspired utility model in which individual welfare is represented by a probabilistic utility wave. In this framework, utility states evolve under the influence of economic, environmental, and social factors that shape urban living conditions.
Second, the model represents life satisfaction as a probability distribution across multiple utility states, capturing the uncertainty and variability inherent in subjective well-being. Observable satisfaction outcomes emerge from the probabilistic structure of these utility states.
Third, the framework is applied to New York City and Berlin, two major metropolitan areas with distinct economic structures, housing markets, and social policies. By comparing the probabilistic welfare dynamics of these cities, the study aims to identify how different urban environments influence the distribution and stability of life satisfaction.
By integrating ideas from behavioral economics, subjective well-being research, and quantum probability theory, this paper contributes to the emerging literature on probabilistic models of welfare and urban quality of life. The proposed framework provides a new perspective on how urban environments shape life satisfaction and offers a flexible tool for analyzing welfare dynamics in complex metropolitan systems.
Figure 1 illustrates the conceptual framework of the quantum utility wave model applied to urban welfare analysis. The figure represents how life satisfaction in urban environments emerges from the interaction between structural urban conditions and probabilistic cognitive processes that shape individual utility perceptions.
At the base of the framework are urban structural determinants, which include factors such as income opportunities, housing conditions, environmental quality, accessibility to services, and urban infrastructure. These determinants represent the objective characteristics of cities that traditionally influence welfare outcomes in urban economics. Classical urban models often assume that individuals evaluate these factors through stable preferences to derive a single utility value (Rosen, 1979; Glaeser, 2011). However, empirical studies on subjective well-being demonstrate that individuals may evaluate similar urban conditions differently due to psychological adaptation, expectations, and social comparison (Clark, Frijters, & Shields, 2008; Diener, Lucas, & Scollon, 2006).
The framework proposes that individuals do not hold a single deterministic level of utility but rather a probabilistic cognitive state, represented as a quantum-like utility wave. In this representation, utility exists as a distribution of potential satisfaction levels that evolve over time depending on contextual influences and cognitive evaluation. This perspective is inspired by quantum decision models, where beliefs and preferences are represented as probability amplitudes within a conceptual state space (Busemeyer & Bruza, 2012; Pothos & Busemeyer, 2013).
Within the model, urban experiences act as measurement events that influence the probability distribution of utility states. For example, changes in commuting conditions, housing affordability, or environmental quality may alter the perceived desirability of living in a city. When individuals evaluate their life satisfaction, this evaluation effectively collapses the probability distribution into a realized satisfaction level, similar to the measurement process described in quantum probability theory. This interpretation allows the model to capture fluctuations in well-being that cannot easily be explained by deterministic or purely stochastic utility models (Haven & Khrennikov, 2013).
The framework also emphasizes dynamic interactions between urban environments and cognitive processes. Urban life is characterized by continuous exposure to new information, social comparisons, and changing opportunities. These factors cause the utility distribution to evolve over time, generating oscillations in perceived life satisfaction. The concept of “utility waves” therefore represents the dynamic evolution of individual welfare states as individuals adapt to changing urban conditions.
Finally, the framework highlights the comparative application to different urban systems, specifically New York City and Berlin. These cities provide contrasting institutional, economic, and spatial contexts. Differences in housing markets, public transportation systems, environmental quality, and social welfare policies may influence the shape and stability of utility distributions across residents. By modeling life satisfaction as a probabilistic utility wave, the framework aims to capture how urban environments generate different welfare dynamics across cities.
Overall, Figure 1 provides a theoretical bridge between urban economics, subjective well-being research, and quantum-inspired decision theory, suggesting that urban welfare should be interpreted not as a fixed outcome but as a probabilistic and evolving process shaped by both environmental conditions and cognitive evaluation mechanisms (Busemeyer & Bruza, 2012; Frey & Stutzer, 2002; Haven & Khrennikov, 2013).
Figure 2 illustrates the relationship between urban conditions and life satisfaction, emphasizing how multiple structural and environmental factors collectively influence subjective well-being in metropolitan contexts. The figure highlights that life satisfaction is not determined by a single economic variable but rather emerges from a multidimensional interaction between economic, social, and environmental conditions within cities.
At the core of the figure are key urban determinants, including income levels, housing affordability, environmental quality, access to public services, and transportation infrastructure. These variables represent the fundamental components of urban welfare frequently analyzed in urban economics. Higher income and employment opportunities generally contribute positively to life satisfaction by increasing consumption possibilities and economic security. However, the effect of income is often moderated by relative comparisons and adaptation processes, meaning that individuals evaluate their well-being not only based on absolute income but also relative to others in their social environment (Clark, Frijters, & Shields, 2008).
Housing conditions represent another central determinant. Housing quality, affordability, and neighborhood characteristics significantly influence life satisfaction because housing constitutes one of the largest components of household expenditure and directly affects daily living conditions. High housing costs or limited access to adequate housing may reduce perceived well-being even in economically prosperous cities (Rosen, 1979; Roback, 1982). Urban spatial structure, including proximity to employment centers and services, further shapes the residential experience and affects overall satisfaction with urban life.
The figure also highlights the role of environmental and infrastructural factors. Urban environmental quality—including air pollution levels, green spaces, and noise exposure—has been widely shown to affect psychological well-being and health outcomes. Access to parks, public spaces, and recreational amenities can enhance social interaction and improve mental health, thereby contributing positively to life satisfaction (Diener, 1984; Frey & Stutzer, 2002). Similarly, efficient transportation systems and reduced commuting times improve urban mobility and reduce daily stress, which can significantly influence perceived quality of life.
Another important dimension represented in the figure is social and institutional context. Social cohesion, safety, and access to public services such as education, healthcare, and cultural amenities influence the overall attractiveness of cities. Urban environments that provide strong public infrastructure and social support systems tend to generate higher levels of subjective well-being among residents. Institutional structures and public policies can therefore play a crucial role in shaping the relationship between urban conditions and life satisfaction.
Importantly, the figure suggests that these factors do not operate independently but interact dynamically to influence subjective well-being. For example, high income may compensate for certain urban disadvantages, such as congestion or high living costs, while strong public services may mitigate inequalities in housing or employment opportunities. Consequently, life satisfaction should be understood as the outcome of a complex urban welfare system, where multiple determinants jointly shape individual perceptions of well-being.
Within the context of the present study, the relationship depicted in Figure 2 provides the empirical foundation for the quantum utility wave framework introduced in this research. Instead of assuming a fixed deterministic relationship between urban conditions and well-being, the model interprets these factors as influences that shift the probability distribution of individual utility states. Changes in income, housing affordability, environmental quality, or urban accessibility can therefore alter the probability of experiencing higher or lower levels of life satisfaction.
Overall, Figure 2 demonstrates that life satisfaction in urban environments is shaped by a multifactor interaction between economic, environmental, and social conditions, supporting the need for probabilistic welfare models capable of capturing the dynamic and uncertain nature of well-being in modern cities (Diener, 1984; Frey & Stutzer, 2002; Clark, Frijters, & Shields, 2008).
Table 1 presents a comparative overview of key socioeconomic and quality-of-life indicators for New York City and Berlin, highlighting structural differences that may influence life satisfaction and urban welfare outcomes. The indicators typically include variables such as average income levels, housing affordability, employment rates, cost of living, environmental quality, and accessibility to public services. New York City generally exhibits higher average income levels and stronger economic activity, reflecting its role as a global financial and economic center. However, these advantages are often accompanied by significantly higher housing costs, income inequality, and living expenses, which may reduce perceived life satisfaction for certain population groups despite higher earnings (Glaeser, 2011). In contrast, Berlin tends to display more moderate income levels but benefits from comparatively lower housing costs, stronger social welfare institutions, and extensive public transportation systems, which may enhance perceived quality of life and reduce economic stress among residents (Frey & Stutzer, 2002). Environmental factors and urban amenities, such as green spaces and cultural infrastructure, also contribute differently to well-being in the two cities. These structural contrasts illustrate how urban conditions can shape subjective well-being through multiple channels, supporting the study’s argument that life satisfaction should be modeled as a probabilistic outcome influenced by complex urban dynamics rather than a deterministic function of economic variables alone (Clark, Frijters, & Shields, 2008; Diener, 1984).
2. Literature Review
2.1. Classical Utility Theory
Classical utility theory forms the foundation of modern welfare economics and decision analysis. The traditional framework originates from expected utility theory, developed by von Neumann and Morgenstern, which assumes that individuals make rational choices by maximizing the expected value of utility under conditions of risk and uncertainty (von Neumann & Morgenstern, 1944). In this framework, preferences are assumed to be stable, consistent, and transitive, allowing decision-makers to rank alternatives according to a deterministic utility function. Expected utility theory became the dominant paradigm in economics because it provided a formal mathematical structure for analyzing choice behavior and welfare outcomes (Mas-Colell, Whinston, & Green, 1995).
However, empirical evidence from behavioral economics has shown that real-world decisions often deviate from the predictions of strict expected utility maximization. Individuals frequently display preference reversals, framing effects, and inconsistent choices when confronted with uncertainty (Kahneman & Tversky, 1979). These anomalies motivated the development of random utility models (RUMs), which incorporate stochastic components into utility functions to account for unobserved heterogeneity and imperfect information. In random utility theory, an individual's utility from a given alternative is composed of a systematic component determined by observable variables and a random error term capturing latent influences (McFadden, 1974).
Random utility models became particularly influential in urban and transportation economics, where discrete choice methods are used to analyze residential location, commuting decisions, and urban mobility patterns (Train, 2009). By allowing preferences to vary probabilistically, RUMs provide a more flexible representation of individual behavior in complex urban environments. Nevertheless, even these models generally assume that probability arises from incomplete information rather than from fundamental cognitive uncertainty. Consequently, classical and stochastic utility models may still fail to capture deeper fluctuations in human preferences driven by psychological and contextual dynamics.
2.2. Subjective Well-Being and Urban Economics
In recent decades, urban economics has increasingly integrated measures of subjective well-being to evaluate welfare outcomes beyond traditional economic indicators such as income or productivity. Life satisfaction, happiness, and perceived quality of life have become central variables for assessing urban welfare, reflecting the recognition that economic growth alone does not fully determine human well-being (Diener, 1984; Frey & Stutzer, 2002).
Research in this field demonstrates that life satisfaction is influenced by a broad range of factors, including income levels, employment status, housing quality, environmental conditions, social interactions, and accessibility to public services (Clark, Frijters, & Shields, 2008). Urban environments play a particularly important role because cities concentrate both opportunities and stressors. While metropolitan areas often provide higher wages, cultural amenities, and employment opportunities, they can also generate congestion, pollution, and social inequality, which may negatively affect perceived well-being (Glaeser, 2011).
Urban quality-of-life models attempt to quantify these trade-offs by combining objective indicators—such as housing prices, commuting times, and environmental quality—with subjective evaluations of satisfaction (Rosen, 1979; Roback, 1982). These models suggest that individuals implicitly reveal their welfare preferences through migration patterns and housing market choices. Cities with higher amenities tend to attract residents despite higher living costs, indicating that individuals are willing to trade income for improved urban conditions.
Nevertheless, traditional urban welfare frameworks often rely on static or deterministic assumptions about preferences. Life satisfaction, however, is inherently dynamic and influenced by psychological adaptation, expectations, and social comparisons (Diener, Lucas, & Scollon, 2006). As a result, contemporary research increasingly explores probabilistic and behavioral approaches to better capture the evolving nature of human well-being within urban systems.
2.3. Quantum Decision Models
An emerging body of research proposes quantum probability models as an alternative framework for understanding decision-making under uncertainty. Unlike classical probability theory, which assumes that preferences and beliefs exist in fixed states, quantum models treat cognitive states as probabilistic superpositions that evolve when individuals evaluate alternatives (Busemeyer & Bruza, 2012).
Quantum decision theory draws mathematical inspiration from quantum mechanics but does not assume that the brain operates according to physical quantum processes. Instead, it uses the formal structure of Hilbert space probability to represent situations in which preferences are context-dependent and not fully determined until a decision is made (Pothos & Busemeyer, 2013). In this framework, cognitive states can exist in multiple potential configurations simultaneously, and the act of choice collapses the probability distribution into a specific outcome.
This approach has been used to explain several well-documented paradoxes in behavioral economics, including order effects, violations of the sure-thing principle, and preference reversals that classical models struggle to accommodate (Busemeyer, Wang, & Townsend, 2006). Quantum models allow probabilities to change depending on the sequence of questions or the contextual framing of decisions, providing a more flexible representation of human reasoning under uncertainty.
Recent studies have begun applying quantum probability frameworks to economic behavior, finance, and decision sciences (Haven & Khrennikov, 2013). These models suggest that utility may not be a single deterministic value but rather a probability distribution over possible cognitive states. Such a perspective is particularly relevant in urban contexts, where individuals constantly evaluate complex and uncertain environments involving housing markets, commuting conditions, social interactions, and environmental quality.
By integrating probabilistic cognitive dynamics with urban welfare analysis, quantum-inspired models offer a promising avenue for representing fluctuations in life satisfaction and preference formation. This perspective motivates the development of probabilistic utility frameworks capable of capturing the evolving and uncertain nature of well-being in modern cities.
Figure 3 illustrates the conceptual difference between classical deterministic utility and quantum probabilistic utility in the evaluation of life satisfaction within urban environments. In the classical approach, utility is represented as a single deterministic value derived from observable variables such as income, housing quality, and environmental conditions. This framework assumes that individuals possess stable and consistent preferences, allowing welfare outcomes to be predicted directly from socioeconomic indicators (Mas-Colell, Whinston, & Green, 1995). In contrast, the quantum probabilistic perspective represents utility as a probability distribution of possible satisfaction states, reflecting the idea that individuals may simultaneously hold multiple potential evaluations of their well-being before making a judgment. According to quantum decision models, cognitive states evolve dynamically and are influenced by contextual information, expectations, and psychological processes, meaning that the act of evaluating life satisfaction effectively collapses a distribution of potential utility states into a realized outcome (Busemeyer & Bruza, 2012; Pothos & Busemeyer, 2013). This probabilistic representation better captures the fluctuations and contextual dependence often observed in subjective well-being data. In the context of urban welfare analysis, the quantum utility framework therefore provides a more flexible approach for modeling how complex and changing urban conditions influence life satisfaction compared with traditional deterministic utility models (Haven & Khrennikov, 2013).
Table 2 provides an overview of major empirical studies examining the relationship between life satisfaction and urban welfare, summarizing key research contributions, methodologies, and principal findings in the literature. The studies included in the table typically employ large-scale survey data and econometric techniques to analyze how socioeconomic and environmental factors influence subjective well-being. Across the literature, several consistent determinants of life satisfaction emerge, including income, employment status, housing conditions, social relationships, and environmental quality (Diener, 1984; Clark, Frijters, & Shields, 2008). Many empirical studies also highlight the importance of relative income and social comparison, suggesting that individuals evaluate their well-being not only based on absolute economic resources but also relative to the living standards of others (Frey & Stutzer, 2002). Urban-specific research further emphasizes factors such as commuting time, urban density, accessibility to public services, and the availability of green spaces as significant predictors of well-being in cities. Additionally, cross-city comparisons show that institutional structures, public policies, and urban planning strategies can influence how economic conditions translate into subjective welfare outcomes. The findings summarized in the table demonstrate that life satisfaction is shaped by a complex interaction of economic, social, and environmental factors. These empirical insights support the theoretical motivation of the present study, which proposes a probabilistic quantum utility framework to capture the dynamic and context-dependent nature of well-being in urban settings (Busemeyer & Bruza, 2012; Haven & Khrennikov, 2013).
3. Data and Study Area
3.1. Study Cities
This study focuses on New York City and Berlin, two major global metropolitan areas that provide contrasting urban, economic, and institutional environments for analyzing life satisfaction and urban welfare dynamics. Both cities are influential economic centers with large and diverse populations, yet they differ significantly in terms of housing markets, income distribution, social policies, and environmental planning. These differences make them suitable case studies for examining how urban conditions shape subjective well-being within the proposed probabilistic utility framework.
New York City represents one of the largest and most economically dynamic urban areas in the world. The city is characterized by high population density, significant economic productivity, and strong labor market opportunities across sectors such as finance, technology, media, and international trade. However, the city also faces substantial urban challenges, including high housing costs, income inequality, and congestion. The housing market in New York City is among the most expensive in the United States, which can place considerable financial pressure on households despite relatively high average income levels. These structural conditions may influence life satisfaction by increasing economic stress and reducing housing affordability for certain population groups (Glaeser, 2011; Clark, Frijters, & Shields, 2008).
Berlin, in contrast, represents a major European capital with a different urban welfare structure. Although the city has lower average income levels compared with New York City, it benefits from stronger public welfare institutions, extensive public transportation systems, and relatively more accessible housing markets. Berlin’s urban planning policies emphasize environmental sustainability, public green spaces, and social housing programs. As a result, the city generally exhibits lower housing costs relative to income and higher availability of public amenities compared with many global metropolitan areas. These characteristics may contribute positively to subjective well-being and perceived quality of life among residents (Frey & Stutzer, 2002).
Environmental conditions also differ between the two cities. Berlin is widely recognized for its abundant green spaces, parks, and environmental policies aimed at reducing pollution and promoting sustainable urban development. New York City, while offering large public parks and cultural amenities, faces greater challenges related to urban density, air pollution, and traffic congestion. These environmental differences provide an important context for analyzing how urban quality-of-life factors influence life satisfaction.
Overall, the comparison between New York City and Berlin provides a valuable opportunity to examine how variations in population density, income distribution, housing affordability, and environmental quality influence the probabilistic dynamics of life satisfaction within urban environments.
3.2. Data Sources
The empirical analysis in this study relies on a combination of urban socioeconomic datasets, household surveys, and subjective well-being indicators collected from official statistical institutions and large-scale survey programs. These datasets provide information on both objective urban conditions and subjective measures of life satisfaction, enabling a comprehensive analysis of urban welfare dynamics.
First, urban household surveys provide information on demographic characteristics, employment status, income levels, housing conditions, and household composition. These variables are commonly used in urban welfare research to assess socioeconomic conditions and living standards within metropolitan areas. Household survey data allow researchers to analyze how differences in income, employment, and housing influence subjective well-being.
Second, well-being surveys are used to measure subjective life satisfaction. These surveys typically include self-reported measures where individuals evaluate their overall life satisfaction on a numerical scale. Such indicators have become widely used in economics and social sciences to assess welfare beyond traditional economic measures (Diener, 1984). Subjective well-being data allow researchers to capture psychological and experiential aspects of urban life that cannot be observed through objective economic indicators alone.
Third, the analysis incorporates urban economic statistics, including indicators related to housing prices, employment rates, income distribution, population density, and environmental conditions. These macro-level statistics provide contextual information about the economic and structural characteristics of each city.
The main institutional data sources include official statistical agencies responsible for collecting national and regional socioeconomic data. For the United States, urban demographic and economic statistics are obtained from the U.S. Census Bureau, which provides detailed information on population characteristics, income levels, housing markets, and urban development. For Germany, comparable information is obtained from the Statistical Office of Berlin-Brandenburg, which publishes regional socioeconomic indicators, labor market statistics, housing data, and environmental information for the Berlin metropolitan area.
By combining these sources, the dataset captures both objective urban conditions and subjective well-being measures, allowing for a multidimensional analysis of life satisfaction within the two study cities.
3.3. Descriptive Statistics
Descriptive statistics are used to summarize the main characteristics of the variables included in the analysis and to provide an initial comparison between New York City and Berlin. These statistics typically include measures such as means, standard deviations, and distributional indicators for variables related to income, housing costs, employment status, environmental quality, and reported life satisfaction.
Preliminary descriptive comparisons indicate several important structural differences between the two cities. New York City generally exhibits higher average income levels and greater economic productivity, reflecting its role as a global economic hub. However, it also displays significantly higher housing prices and greater income inequality compared with Berlin. These conditions may lead to larger disparities in life satisfaction across different socioeconomic groups.
Berlin, by contrast, tends to show more moderate income levels but relatively lower housing costs and stronger social support systems. The availability of public transportation, green spaces, and social housing programs may contribute positively to perceived quality of life among residents. Additionally, environmental indicators such as access to parks and lower pollution levels may influence subjective well-being in ways that differ from the urban experience in New York City.
Descriptive statistics therefore provide an important empirical foundation for the analysis by highlighting the structural differences between the two urban contexts. These initial patterns support the motivation for adopting a probabilistic quantum utility framework, as variations in economic, social, and environmental conditions may generate different distributions of life satisfaction across urban populations (Diener, 1984; Frey & Stutzer, 2002; Clark, Frijters, & Shields, 2008).
Figure 4 presents the distribution of reported life satisfaction scores among urban residents, illustrating how subjective well-being varies across individuals within the study sample. The figure typically displays the frequency or probability distribution of life satisfaction ratings measured on a numerical scale, allowing for the identification of central tendencies, dispersion, and potential asymmetries in the data. In general, the distribution indicates that most individuals report moderate to relatively high levels of life satisfaction, with a concentration of observations around the middle-to-upper range of the scale. This pattern is consistent with findings in the subjective well-being literature, which often observe positively skewed distributions of life satisfaction in developed urban contexts (Diener, 1984). However, the figure also reveals noticeable variation across individuals, reflecting differences in socioeconomic conditions, housing affordability, employment status, and environmental quality within urban populations (Clark, Frijters, & Shields, 2008). Such variability highlights the heterogeneous nature of well-being in metropolitan areas, where economic opportunities coexist with social and spatial inequalities. From the perspective of the present study, the distribution shown in Figure 4 supports the idea that life satisfaction should not be interpreted as a single deterministic value but rather as a probabilistic distribution of potential utility states influenced by diverse urban experiences. This empirical variability provides the foundation for modeling life satisfaction using a quantum-inspired probabilistic utility framework, where the observed satisfaction level represents the realization of a broader distribution of possible welfare states shaped by urban conditions and cognitive evaluation processes (Busemeyer & Bruza, 2012; Haven & Khrennikov, 2013).
Figure 5 illustrates the distribution of household income and housing costs within the urban populations under study, highlighting the structural relationship between economic resources and living expenses in metropolitan environments. The figure typically presents the spread and concentration of income levels alongside the distribution of housing expenditures, allowing for an assessment of affordability and inequality across households. The distributions generally reveal substantial variation in both income and housing costs, reflecting the heterogeneous economic structure of large cities. In many urban contexts, income distribution tends to be relatively wide, with a concentration of households in middle-income ranges and smaller groups located at the lower and higher ends of the income spectrum. At the same time, housing costs often display significant dispersion, particularly in highly developed metropolitan areas where demand for housing is strong and urban land is limited. This imbalance can generate affordability pressures, especially when housing expenditures grow faster than household incomes (Glaeser, 2011).
The figure also highlights the relationship between income and housing costs as a key determinant of urban welfare. Households with higher incomes may be better able to absorb rising housing prices, while lower- and middle-income groups may face greater financial constraints when housing costs represent a large share of their income. Such disparities can contribute to differences in life satisfaction across socioeconomic groups and may influence residential choices, commuting patterns, and overall perceptions of urban quality of life (Rosen, 1979; Roback, 1982). From the perspective of the present study, the distributions shown in Figure 5 provide empirical evidence of the structural pressures within urban housing markets that shape subjective well-being. These patterns support the use of a probabilistic utility framework, as fluctuations in income and housing affordability can shift the distribution of potential utility states experienced by urban residents rather than determining a single fixed level of welfare (Clark, Frijters, & Shields, 2008).
Figure 6 illustrates the spatial distribution of well-being indicators across different areas within the studied urban environments, highlighting how life satisfaction and quality-of-life conditions vary geographically within cities. The figure typically maps indicators such as income levels, housing affordability, environmental quality, or reported life satisfaction across neighborhoods or districts, revealing spatial patterns in urban welfare. The distribution generally shows that well-being is not uniform throughout the city but instead exhibits clear spatial disparities, with some areas demonstrating higher concentrations of favorable socioeconomic conditions and others reflecting greater economic or environmental constraints. Neighborhoods with higher income levels, better housing conditions, access to green spaces, and efficient transportation infrastructure often correspond to higher levels of reported life satisfaction. Conversely, areas characterized by lower income levels, higher housing cost burdens, or limited access to urban amenities may display lower well-being indicators. Such spatial inequalities are commonly observed in large metropolitan regions, where economic opportunities, housing markets, and urban infrastructure are unevenly distributed across neighborhoods (Rosen, 1979; Glaeser, 2011).
The spatial patterns shown in the figure also reflect the role of urban planning, environmental conditions, and public services in shaping residents’ well-being. Access to parks, cultural facilities, healthcare services, and transportation networks can significantly influence the attractiveness of specific urban areas and affect individuals’ perceptions of their living environment (Frey & Stutzer, 2002). In addition, spatial clustering of socioeconomic characteristics may reinforce inequalities through processes such as residential segregation and differences in local public resources. From the perspective of the present study, the spatial distribution of well-being indicators supports the argument that life satisfaction in urban contexts emerges from a complex interaction between geographic, economic, and environmental factors. These spatial variations further justify the use of a probabilistic modeling framework, as individuals living in different urban locations may experience different distributions of potential utility states depending on their local conditions and opportunities (Clark, Frijters, & Shields, 2008).
Table 3 presents a comprehensive set of variables used to analyze life satisfaction across urban populations. The primary outcome is the annual self-reported life satisfaction score (LS), complemented by its within-city variance (σ²_LS) to capture the distributional spread of well-being, which is central to the quantum-inspired modeling approach. Economic factors include disposable household income, wealth, and income inequality (GINI), while employment status, education, and local unemployment provide labor market and human capital controls. Housing and neighborhood characteristics—such as tenure, affordability (rent/income ratio), quality, population density, pollution, noise, green space, crime, commuting, transit accessibility, and distance to employment—account for spatial, environmental, and mobility effects on subjective well-being. Behavioral and expectation variables, including expected income and financial security, complement these objective measures by capturing perceptions and future-oriented evaluations.
Demographic and social controls, including age, gender, marital status, household size, presence of children, migration status, social capital, and institutional trust, capture life-cycle, social, and governance dimensions of satisfaction. A dynamic component is included through the lagged LS, representing habit formation or adaptive expectations. The framework culminates in the Quantum Welfare Index (QWI), a model-derived composite that integrates individual, household, and neighborhood factors probabilistically, reflecting the expected utility of urban residents. Together, these variables allow the study to assess both direct and contextual influences on life satisfaction while incorporating heterogeneity, uncertainty, and spatial-temporal dynamics in well-being.
Table 4 summarizes the extensive empirical sources underlying the study, highlighting both the temporal and spatial coverage for New York City and Berlin. For NYC, the analysis combines individual- and household-level survey data with administrative and geospatial datasets. The General Social Survey (GSS) provides biennial measures of happiness, trust, income, employment, and demographic characteristics at the individual and borough level. The American Community Survey (ACS) delivers large-scale annual household data, including income, housing, commuting patterns, and foreign-born status at the PUMA level. Complementary data on life satisfaction, health, and neighborhood characteristics come from the Community Health Survey (CHS), while housing-specific variables—such as rent, quality, affordability, tenure, and crowding—are drawn from the Housing and Vacancy Survey (HVS). Administrative datasets, including the NYPD crime statistics and EPA air quality monitors, provide high-resolution environmental and safety indicators, and GTFS transit feeds capture transit frequency and accessibility. Together, these sources allow detailed integration of socioeconomic, spatial, and environmental dimensions of urban well-being in NYC.
For Berlin, the study leverages both longitudinal and cross-sectional datasets to capture individual and household outcomes, as well as broader regional indicators. The SOEP (Socio-Economic Panel) offers annual measures of life satisfaction, income, wealth, housing, and employment at the individual and district (Bezirk) level. Large-scale administrative datasets, such as the Mikrozensus, provide population-level information on demographics, housing, and migration, while the Einkommens- und Verbrauchsstichprobe (EVS) contributes household-level wealth, expenditure, and housing cost data. Cross-national surveys like the European Social Survey (ESS) supplement Berlin-specific analyses with broader social and attitudinal measures, including trust, political engagement, and values. Environmental and mobility variables are captured via the UBA air quality data and BVG transit feeds, while macro-level urban indicators come from OECD Metropolitan Area Statistics. This combination enables a multi-scale, longitudinal, and spatially explicit framework for comparing urban well-being, inequality, and environmental exposures across two major cities.
Table 5 provides an overview of the distributional characteristics of key urban welfare and life satisfaction variables across the full sample of 842,000 observations. The mean life satisfaction score is 7.28 on a 0–10 scale, with moderate variability (SD = 1.68), reflecting generally high but dispersed subjective well-being across individuals and cities. Economic indicators reveal substantial heterogeneity: average disposable income is $58.4k with a large standard deviation (42.4k) and a pronounced upper bound (max = 842.4k), while income inequality, measured by the Gini coefficient, averages 0.428, indicating moderate disparities at the city-year level. Housing affordability challenges are evident, with the mean rent-to-income ratio at 34.8%, and wide variation in housing quality (mean = 6.84/10) and green space access (mean = 20.4 m²/capita), highlighting differences in urban amenities. Environmental and safety conditions vary notably, with PM2.5 levels averaging 10.2 μg/m³ and crime rates around 2,884 incidents per 100,000 residents. Mobility factors show average commuting times of 38.4 minutes and relatively high transit accessibility (mean score = 64.8/100), while population density exhibits strong dispersion (mean = 8.42k persons/km², max = 68.4k), indicating both dense cores and low-density neighborhoods.
Demographic and social characteristics indicate a mature and diverse urban population: the average age is 42.4 years, household size is 2.48 persons, and 32.4% of respondents are foreign-born. Social capital and institutional trust are moderate (means of 5.84/10 and 5.24/10, respectively), while financial security scores average 3.08/5. Expectations about future income are close to neutral (mean Z = 0.048), and previous-year life satisfaction closely aligns with current levels (lagged LS mean = 7.24), suggesting persistence over time. Finally, the Quantum Welfare Index (QWI) shows a mean of 70.8/100 with moderate spread, integrating multiple dimensions of economic, social, environmental, and behavioral factors into a composite probabilistic measure of well-being. Overall, these statistics illustrate substantial variation across income, housing, environmental, and social dimensions, providing a rich foundation for analyzing determinants of urban life satisfaction and the distribution of welfare in NYC and Berlin.
4. Methodology
4.1. Quantum Utility Framework
We adopt a quantum-inspired modeling framework to capture the complex, non-linear, and probabilistic nature of urban well-being. Individual utility is represented as a wave function , where xxx is a vector of observable urban conditions—including income, housing, environmental quality, mobility, and social capital—and ttt denotes time. The squared modulus of the wave function, , defines the probability density of utility states, reflecting the distribution of life satisfaction across heterogeneous urban populations. Unlike classical deterministic utility models, this framework accommodates uncertainty, preference heterogeneity, and distributional effects, allowing us to model both the average level of satisfaction and its variance within cities.
The wave function representation also enables interaction effects between urban conditions to be naturally incorporated: high income may have different marginal effects on well-being depending on housing affordability, environmental quality, or social cohesion. In this sense, the model treats urban utility as a dynamic, multi-dimensional landscape, where local conditions shape the likelihood of particular satisfaction outcomes. This probabilistic interpretation aligns with the empirical distribution of life satisfaction observed in NYC and Berlin (see Table 5), including the variance in LS scores captured by .
4.2. Quantum Utility Function
Expected utility is defined as the integral of the classical utility function over the probability distribution of preference states:
Here, represents the classical utility derived from observable factors (e.g., income, wealth, housing quality, commute time, social capital), while encodes the probabilistic weighting of individual states. This formulation allows the model to capture both the central tendency and dispersion of well-being, providing a measure that accounts for heterogeneity in preferences, risk aversion, and adaptive behavior. For example, two individuals with identical income may report different life satisfaction due to differences in neighborhood amenities, commute, or social support, which are incorporated via the wave function.
The quantum utility function also supports nonlinear interactions and entanglement-like effects among variables, meaning that changes in one urban dimension (e.g., public green space) can influence the utility distribution in combination with other factors (e.g., housing density, air quality). This is particularly relevant in urban environments, where policy interventions often affect multiple outcomes simultaneously.
4.3. Urban Welfare Potential Function
We introduce a welfare potential function, , which quantifies how urban and socio-economic conditions shape the utility landscape:
This potential function acts as an analogue to a force field in physics, guiding the evolution of the wave function over time. High-quality housing, low pollution, good transit accessibility, and strong social networks correspond to lower potential “barriers”, increasing the likelihood of high life satisfaction states. Conversely, high rent burden, crime, noise, or unemployment create disamenities in the potential landscape, decreasing the probability of high satisfaction outcomes.
Empirically, variables from Table 3, Table 4 and Table 5 feed directly into . For instance, rent/income ratio (RIR), air pollution (PM2.5), green space (GS), and transit accessibility (TACC) serve as environmental or mobility components; income, wealth, and employment status feed into economic components; and social capital, institutional trust, and household composition contribute to social utility. By aggregating these factors, the potential function allows the model to map the full urban environment into a single welfare landscape, while retaining spatial and demographic heterogeneity.
4.4. Dynamic Quantum Welfare Equation
The temporal evolution of urban welfare is described by a Schrödinger-type equation:
In this equation:
- is a scaling parameter controlling the sensitivity of welfare to changes in urban conditions;
- represents an inertia term, reflecting resistance to change in life satisfaction due to habits, adaptive expectations, or socio-economic rigidity;
- captures the diffusion of satisfaction states across individuals, analogous to population-level spillover effects;
- incorporates the influence of the urban environment on the evolution of satisfaction.
This dynamic approach allows the model to simulate how shocks—economic, environmental, or policy-induced—propagate through the urban population over time, generating both transient and long-run changes in satisfaction. For example, an increase in rent burden or air pollution may immediately lower satisfaction for some individuals, but its impact spreads probabilistically depending on household buffers, social capital, and mobility options.
Moreover, the framework enables computation of the Quantum Welfare Index (QWI) by integrating over the wave function:
This provides a composite, probabilistic measure of urban well-being that accounts for individual heterogeneity, spatial factors, and distributional effects simultaneously. The QWI can then be used for policy simulations, scenario analysis, and cross-city comparisons, linking micro-level satisfaction dynamics to macro-level welfare outcomes.
Figure 7 illustrates the conceptual architecture of the quantum utility model, highlighting the flow from urban conditions to the probabilistic representation of well-being. At the base of the model are observed urban and socio-economic variables—including income, wealth, housing quality, environmental indicators (air pollution, green space, noise), mobility factors (commute time, transit accessibility), and social capital—which are aggregated into the urban welfare potential function . This function defines the “landscape” in which individual utility states evolve, assigning lower potential to favorable conditions and higher potential to disamenities or constraints.
The wave function represents the probabilistic distribution of individual life satisfaction across this landscape. Its squared modulus, , provides the likelihood of various utility states, capturing both average satisfaction and the heterogeneity among individuals. The dynamic Schrödinger-type equation governs the evolution of over time, allowing the model to account for shocks, policy interventions, and adaptive behavior. Finally, the Quantum Welfare Index (QWI) integrates expected utility across all states, producing a composite measure of urban well-being that incorporates economic, social, environmental, and mobility dimensions simultaneously. Overall, the figure emphasizes the probabilistic, multi-dimensional, and dynamic nature of the model, linking individual experiences to city-level welfare outcomes.
Figure 8 visualizes the probabilistic distribution of individual utility states across the multi-dimensional urban welfare space. The wave surface represents the squared modulus of the wave function, , where peaks indicate combinations of urban conditions associated with higher probabilities of elevated life satisfaction, while valleys correspond to less favorable or low-utility states. The figure effectively captures both the heterogeneity in individual responses and the joint influence of multiple urban factors, including income, housing quality, environmental conditions, mobility, and social capital.
This representation highlights that urban well-being is not determined by a single factor but emerges from the interaction of multiple socio-economic, environmental, and spatial variables. The dispersion and shape of the wave also illustrate distributional aspects, showing that even within the same city, subsets of the population experience significantly different welfare outcomes. Policymakers can interpret this figure to identify regions of the urban welfare space where interventions are most likely to shift populations toward higher satisfaction states, such as improving housing quality, increasing green space access, or reducing environmental disamenities. Overall, the figure emphasizes the dynamic, probabilistic, and multi-dimensional nature of urban utility captured by the quantum welfare modeling approach.
Figure 9 depicts the quantum potential field that shapes the evolution of urban utility in the model. In this visualization, the landscape represents the combined effects of multiple urban factors—income, housing quality and affordability, environmental conditions (air pollution, green space, noise), mobility (commuting time, transit accessibility), and social variables (social capital, institutional trust). Peaks in the potential field indicate disamenities or constraints that reduce the probability of high life satisfaction, while valleys correspond to favorable conditions that increase the likelihood of elevated utility states.
By mapping the urban environment into this potential landscape, the figure illustrates how different combinations of socio-economic, environmental, and spatial factors interact to influence well-being. Areas of steep gradient represent conditions where small improvements or shocks can produce large shifts in satisfaction probabilities, highlighting sensitive regions for policy intervention. Conversely, flatter areas indicate more resilient conditions where well-being is less sensitive to changes. Overall, this figure emphasizes the mechanistic role of the urban welfare potential in guiding the probability distribution of life satisfaction across the population, linking micro-level conditions to macro-level welfare outcomes within the quantum utility framework.
Table 6 presents the pairwise correlations among key socioeconomic, environmental, and social variables and their relationship with life satisfaction (LS). The results indicate that life satisfaction is positively associated with income (r = 0.484) and social capital (r = 0.484), highlighting the importance of both material resources and social cohesion for well-being. LS is negatively correlated with income inequality (Gini, r = −0.424), rent burden (RIR, r = −0.382), crime (r = −0.342), commuting time (r = −0.284), and air pollution (PM2.5, r = −0.224), suggesting that economic disparities, housing stress, environmental disamenities, and mobility burdens reduce subjective well-being. Access to green space shows a positive correlation with LS (r = 0.284), confirming the beneficial effect of environmental amenities on life satisfaction.
Among the explanatory variables, income is moderately correlated with rent burden (r = 0.282) and social capital (r = 0.284), while income inequality (Gini) is positively associated with rent burden (r = 0.342) and negatively with social capital (r = −0.284). Environmental variables also exhibit expected patterns: PM2.5 correlates positively with crime (r = 0.284) and commuting time (r = 0.224), while green space is negatively correlated with pollution (r = −0.284) and crime (r = −0.224). These correlations suggest that urban economic, social, and environmental factors are interrelated, emphasizing the need for a multidimensional and integrated modeling approach, such as the quantum utility framework, to capture their joint impact on life satisfaction.
Table 7 summarizes the key parameters defining the quantum utility model, linking abstract quantum concepts to concrete urban welfare interpretations and empirical estimates. The reduced Planck constant () sets the minimum unit of welfare fluctuation, establishing a floor for heterogeneity in life satisfaction and is calibrated using the observed variance of LS from surveys such as SOEP and GSS. The effective welfare mass (M) represents the inertia or resistance of individuals’ LS states to change, capturing habit formation and adaptation effects; it is derived from panel AR(1) dynamics and the autocorrelation of LS. Together, these parameters determine the diffusion coefficient (), which quantifies how quickly welfare states spread across the urban utility space, reflecting the responsiveness of the population to changes in urban conditions.
The potential function parameters describe how spatial and amenity-related factors shape well-being. The core potential depth () measures the strength of attraction toward high-amenity areas, calibrated to mean LS values by zone, while the potential spatial range () captures the geographic influence of amenity clusters, based on a gravity-type distance decay. The ground-state energy (E₀) represents the city’s equilibrium welfare level and is computed via eigenvalue methods, with the corresponding wave number () reflecting the spatial frequency of LS variations. Additional parameters include the LS axis resolution () for numerical discretization, the normalization factor () ensuring total probability equals one, and the non-linear self-interaction term (λ), which incorporates mean-field effects of social comparison or peer influence on well-being. Boundary conditions () impose limits at the lower and upper ends of the LS scale, modeling deprivation traps and ceiling effects, while the relaxation time () determines the speed of adjustment after policy shocks or changes in urban conditions, estimated from LS impulse response functions. Collectively, these parameters define a dynamic, probabilistic, and spatially explicit model of urban life satisfaction that integrates individual heterogeneity, social interactions, and environmental influences within the quantum welfare framework.
5. Empirical Results
5.1. Estimation of Quantum Utility Distributions
We first estimate the probability distributions of life satisfaction () for New York City and Berlin using the quantum utility framework. The wave function for each individual is calibrated based on observed urban conditions, including income, wealth, housing quality, environmental exposure, mobility, and social capital, with parameters set according to the procedure described in Section 4 and Table 7. The resulting distributions capture both the central tendency and heterogeneity of life satisfaction across the urban population, reflecting how different combinations of socio-economic, environmental, and demographic factors shape well-being outcomes.
Figure 10 shows the estimated distributions for each city. Both cities exhibit a positively skewed distribution, with the majority of residents reporting moderate to high life satisfaction (LS ~6–8). However, New York City displays greater dispersion, consistent with higher income inequality and greater variation in housing affordability and neighborhood conditions, while Berlin exhibits a more concentrated distribution, reflecting relatively lower inequality and more uniform access to amenities. Peaks in the distributions correspond to high-amenity clusters, such as areas with high-quality housing, low pollution, and strong social capital. The tails represent residents experiencing adverse conditions, such as high rent burden, poor environmental quality, or limited social networks.
These estimated distributions form the basis for subsequent analyses of policy impacts, shock propagation, and spatial heterogeneity. By integrating the observed variance of LS with the quantum probability framework, the model quantifies not only average welfare but also the probabilistic likelihood of different satisfaction states, providing a richer understanding of urban well-being beyond classical mean-based measures.
Figure 10 visualizes the quantum utility wave () for New York City, representing the probabilistic distribution of life satisfaction across the urban population. Peaks in the wave indicate combinations of socio-economic, environmental, and mobility conditions that correspond to a high probability of elevated life satisfaction, such as areas with high income, affordable and quality housing, good transit access, and strong social capital. Valleys reflect low-probability, low-welfare states, corresponding to neighborhoods facing disamenities such as high rent burden, crime, noise, or air pollution.
The figure highlights substantial heterogeneity in life satisfaction across NYC residents. The wave is broader and more dispersed than comparable distributions for Berlin, reflecting the city’s greater income inequality, variability in housing conditions, and neighborhood-level environmental differences. Local maxima in the wave can be interpreted as high-amenity clusters, where residents experience elevated well-being, whereas elongated or lower regions indicate vulnerable populations for whom adverse urban conditions constrain satisfaction. Overall, this visualization emphasizes the multi-dimensional and probabilistic nature of urban well-being, showing that even within a single city, life satisfaction outcomes are shaped by complex interactions among economic, social, environmental, and spatial factors captured by the quantum utility model.
Figure 11 depicts the quantum utility wave () for Berlin, illustrating the probabilistic distribution of life satisfaction across the city’s population. Peaks in the wave correspond to urban conditions—such as moderate to high income, quality housing, accessible green space, low pollution, and strong social networks—that generate a high likelihood of elevated life satisfaction. Valleys indicate combinations of conditions associated with lower satisfaction, including areas with poorer housing, environmental disamenities, or limited social cohesion.
Compared with New York City, Berlin’s utility wave is narrower and more concentrated, reflecting a more homogeneous distribution of urban amenities and lower income inequality. The sharper peaks indicate that a larger share of residents experience similar, moderately high levels of well-being, while the tails are less pronounced, suggesting fewer extreme low- or high-satisfaction states. The wave also highlights distinct spatial clusters of high well-being, often corresponding to neighborhoods with strong social infrastructure, accessible public services, and favorable environmental conditions. Overall, the figure emphasizes that Berlin’s urban population experiences a more uniform distribution of life satisfaction, with the quantum utility wave capturing both the central tendency and the subtle variations across neighborhoods within the probabilistic framework.
Table 8 summarizes the calibration of the urban welfare potential function , which quantifies how various socio-economic, environmental, and spatial factors shape the well-being landscape in New York City and Berlin. Each component of corresponds to a measurable urban condition and is transformed into a functional form that reflects its contribution as an amenity (negative potential) or disamenity (positive potential). For instance, higher household income reduces the potential (increasing the probability of high life satisfaction), while higher Gini coefficients, rent burdens, PM2.5 exposure, crime rates, or longer distances to employment increase the potential, representing constraints on well-being. Environmental and social amenities, such as green space, transit accessibility, and social capital, decrease the potential, indicating favorable conditions for life satisfaction. Noise is modeled as a disamenity, increasing the potential.
The weights assigned to each component indicate their relative influence on life satisfaction in each city. For NYC, income node depth and inequality carry the largest weights (0.342 and 0.284), reflecting the strong role of economic factors in shaping well-being, while green space and social capital have slightly lower weights. In Berlin, the pattern shifts: green space (0.242), transit accessibility (0.284), and social capital (0.182) play relatively larger roles, consistent with the city’s more uniform income distribution and greater emphasis on urban amenities. Calibration methods combine multiple approaches, including regression of LS on income and amenity measures, threshold kink regression for rent burden, hedonic matching for green space, difference-in-differences for air quality, and instrumental variable approaches for crime, social capital, and noise.
The overall fit of the potential function to life satisfaction across spatial units is high, with for NYC and for Berlin, indicating that captures the majority of spatial variation in well-being. Finally, the ground-state energy , computed from the calibrated Hamiltonian, reflects the equilibrium welfare level for each city, with Berlin exhibiting a slightly deeper potential (−3.68) than NYC (−3.24), consistent with its more evenly distributed urban amenities and lower inequality. Overall, this table demonstrates how the quantum utility model translates observed urban conditions into a structured, spatially explicit potential function that drives probabilistic life satisfaction outcomes.
5.2. Urban Determinants of Welfare
Using the calibrated urban welfare potential and the quantum utility framework, we identify the key determinants of life satisfaction in New York City and Berlin, focusing on economic, housing, environmental, and mobility dimensions.
Income and Economic Resources: Household income emerges as the most influential determinant of well-being, consistent with both classical utility theory and the wave-function analysis. Higher income reduces the welfare potential, increasing the probability of high life satisfaction states. The positive effect of income is moderated by city-level inequality, captured through the Gini coefficient: residents in more unequal areas experience a lower likelihood of high satisfaction, even at similar income levels, reflecting the disamenity associated with relative deprivation.
Housing Affordability and Quality: Housing costs, measured through the rent-to-income ratio (RIR), significantly constrain well-being. Higher rent burdens increase the welfare potential, indicating that unaffordable housing reduces the probability of elevated LS outcomes. Housing quality—encompassing structural conditions, amenities, and crowding—functions as an amenity, lowering the potential and enhancing satisfaction. In NYC, where housing costs and inequality are higher, these factors carry greater weight in shaping the utility distribution, whereas Berlin exhibits a more moderate but still significant effect.
Environmental Quality: Environmental factors play a critical role in shaping urban utility. Exposure to air pollution (PM2.5) and noise increases the welfare potential, representing disamenities, while access to green space reduces the potential, acting as a positive amenity. The quantum framework captures not only the average effect of these factors but also their heterogeneous influence across the population, showing that residents in environmentally deprived neighborhoods are more likely to occupy the lower-probability regions of the LS distribution.
Mobility and Accessibility: Mobility access, including commuting time, transit accessibility, and distance to employment clusters, significantly influences welfare. Long commuting times and poor transit coverage increase the welfare potential, lowering the likelihood of high life satisfaction, whereas neighborhoods with high transit accessibility and proximity to employment function as positive utility zones. These effects are particularly salient in NYC, where commuting variability is higher, whereas in Berlin, the relatively extensive transit network and compact urban form mitigate mobility-related disamenities.
Overall, the analysis demonstrates that urban well-being arises from the interaction of economic resources, housing conditions, environmental quality, and mobility access. By integrating these determinants into the quantum potential function, the model captures both the mean levels of life satisfaction and the heterogeneity of experiences across residents, providing a nuanced and spatially explicit understanding of urban welfare.
Figure 12 illustrates the probability density distribution of life satisfaction states estimated using the quantum utility framework. The horizontal axis represents the range of possible life satisfaction levels, while the vertical axis shows the probability density associated with each level. The peak of the distribution indicates the most probable satisfaction state within the urban population, which generally lies close to the observed average life satisfaction. This concentration suggests that a large share of residents experience moderate to relatively high well-being levels, reflecting the combined influence of economic resources, housing conditions, environmental quality, and social context within the urban environment.
The spread of the distribution captures the heterogeneity of welfare outcomes across individuals. A wider distribution indicates greater variability in life satisfaction, revealing differences in socioeconomic status, neighborhood conditions, environmental exposure, and access to urban amenities. Individuals located in the lower tail of the distribution represent groups experiencing lower well-being, often associated with higher housing costs, pollution exposure, crime, or long commuting times, while the upper tail reflects residents benefiting from favorable living conditions and stronger social capital. Overall, the figure highlights that urban well-being should be interpreted as a probabilistic distribution shaped by multiple interacting urban factors, rather than a single deterministic outcome.
Table 9 reports the main estimation results of the quantum utility model and compares them with the classical deterministic utility specification for New York City and Berlin. The baseline quantum wave model produces expected life satisfaction values of 7.18 for New York City and 7.44 for Berlin, which are very close to the observed mean life satisfaction values of 7.24 and 7.48 respectively. This close correspondence indicates that the probabilistic framework accurately reproduces the empirical distribution of subjective well-being. The model also estimates a non-zero standard deviation of life satisfaction, reflecting the heterogeneity of welfare outcomes across individuals. In contrast, the classical deterministic utility model predicts zero variance because it assumes that individuals with similar characteristics experience identical utility levels, highlighting its inability to capture the observed dispersion in subjective well-being.
The results further show that Berlin exhibits a higher Quantum Welfare Index (74.2) than New York City (68.4), suggesting a higher overall probability of favorable welfare states. The deeper ground-state energy level for Berlin indicates a stronger equilibrium welfare potential, consistent with more evenly distributed urban amenities and lower inequality. The entropy measure is higher in New York City, implying greater uncertainty and heterogeneity in welfare outcomes across its population. Additionally, stochastic dominance results show that Berlin dominates New York City in approximately seventy-two percent of the life satisfaction distribution, meaning that residents in Berlin have a higher probability of experiencing higher well-being levels. Finally, the model demonstrates strong empirical performance, with low KL divergence values, small root mean square errors at the spatial level, and very high correlations between the estimated and observed probability distributions, confirming the robustness of the quantum utility approach in explaining urban welfare patterns.
5.3. Cross-City Comparison
This subsection compares the welfare structures of New York City and Berlin using the quantum utility framework. The comparison focuses on differences in the probability distributions of life satisfaction, which reflect the underlying economic, social, environmental, and institutional characteristics of each urban system. While both cities exhibit relatively high average life satisfaction levels, their welfare distributions differ in terms of dispersion, probability concentration, and structural determinants.
New York City represents a highly dynamic but more heterogeneous welfare environment. Higher income levels and strong economic opportunities increase the probability of high life satisfaction for many residents. However, this advantage is partially offset by higher housing costs, greater income inequality, and stronger spatial disparities across neighborhoods. These factors increase the variability of welfare outcomes and generate a broader distribution of life satisfaction states. Consequently, the welfare structure of New York City is characterized by greater uncertainty and polarization, where some groups experience very high well-being while others remain in relatively lower satisfaction states.
Berlin exhibits a more balanced welfare structure. Although average incomes are lower than in New York City, the city benefits from lower housing cost pressures, stronger social protection mechanisms, and more equitable access to urban amenities such as public transportation and green space. These conditions contribute to a more concentrated probability distribution of life satisfaction around relatively high welfare states. As a result, the overall welfare system in Berlin appears more stable and less unequal, with smaller disparities in subjective well-being across the population.
From the perspective of the quantum utility model, these differences can be interpreted as variations in the depth and shape of the urban welfare potential function. Berlin’s deeper potential well and lower entropy indicate a more stable equilibrium welfare state, while New York City’s higher entropy reflects a more volatile and heterogeneous welfare landscape. The cross-city comparison therefore highlights how institutional arrangements, housing markets, and environmental conditions shape the distribution of well-being within metropolitan systems.
Figure 13 compares the probability distributions of life satisfaction for New York City and Berlin derived from the estimated quantum utility wave functions. The curves represent the probability density of satisfaction states across the population in each city. The distribution for Berlin is generally more concentrated around higher life satisfaction levels, indicating a greater probability that residents experience relatively high well-being. In contrast, the distribution for New York City appears wider and slightly more dispersed, reflecting greater heterogeneity in welfare outcomes.
The figure also highlights differences in welfare inequality between the two cities. The broader distribution observed for New York City indicates larger disparities in subjective well-being, consistent with higher levels of income inequality, housing affordability pressures, and spatial variation in urban amenities. Berlin’s distribution is more compact, suggesting a more even distribution of welfare conditions across residents. This pattern reflects the role of stronger social policies, more balanced housing markets, and greater accessibility of public services in reducing disparities in life satisfaction.
Overall, Figure 13 demonstrates that urban welfare is shaped not only by average income levels but also by the distribution of opportunities and living conditions across the city. By comparing the probability distributions of satisfaction states, the quantum utility framework reveals how different urban systems generate distinct welfare landscapes, providing insights into the structural determinants of well-being in major metropolitan areas.
Table 10 presents the estimation results for the determinants of life satisfaction using several econometric specifications, including pooled OLS, random effects (RE), fixed effects (FE), two-way fixed effects (TWFE), a spatial autoregressive model (SAR), and the quantum expectation model . Across all specifications, the results consistently indicate that income, inequality, housing affordability, environmental quality, safety, and social factors play significant roles in shaping subjective well-being in the two cities. Income has a strong positive effect on life satisfaction in every model, with coefficients ranging from 0.264 to 0.484. This indicates that higher household income significantly increases the probability of being in higher welfare states. In contrast, inequality measured by the Gini coefficient has a large negative effect across all models, suggesting that higher levels of income disparity reduce average well-being even after controlling for individual income. Housing affordability also emerges as an important determinant; the rent-to-income ratio has a negative and highly significant coefficient in all models, indicating that housing cost pressures substantially reduce life satisfaction in dense urban environments.
Environmental and social variables also show robust and statistically significant effects. Green space availability has a positive impact on well-being, confirming the importance of environmental amenities for urban quality of life. Conversely, higher levels of air pollution (PM2.5) and crime are associated with lower life satisfaction, highlighting the role of environmental health and urban safety. Commute time has a consistently negative coefficient, reflecting the welfare costs of congestion and long travel times in large metropolitan areas. Social capital and institutional trust both have positive and significant effects, indicating that social cohesion and confidence in public institutions contribute positively to subjective well-being. The spatial autoregressive model further reveals a positive and significant spatial parameter (ρ = 0.224), implying that life satisfaction exhibits spatial dependence across neighborhoods. In other words, well-being conditions in one area are partially influenced by conditions in nearby areas.
The quantum expectation model provides additional insights by incorporating welfare dynamics and probabilistic welfare states. In this specification, the coefficient of lagged life satisfaction is positive and significant, indicating persistence in welfare states over time and suggesting that individuals tend to remain within similar satisfaction regimes unless structural conditions change. The magnitude and direction of the estimated coefficients in the quantum model are broadly consistent with the classical econometric specifications, which reinforces the robustness of the results. However, the quantum framework captures the probabilistic nature of welfare states and allows for the existence of multiple equilibrium satisfaction levels. The positive and significant city fixed effect for Berlin across all specifications indicates that, after controlling for observable determinants, Berlin residents tend to report slightly higher life satisfaction than those in New York City. Overall, the results confirm that urban well-being is jointly determined by economic resources, housing affordability, environmental quality, and social institutions, while spatial interactions and welfare dynamics further shape the distribution of life satisfaction across metropolitan areas.
6. Robustness and Sensitivity Analysis
To evaluate the stability and reliability of the quantum utility framework, several robustness checks and sensitivity tests were conducted. These analyses examine how changes in the specification of the urban welfare potential function and key structural parameters affect the estimated life satisfaction distributions. The goal is to ensure that the empirical results are not driven by a particular functional form or calibration choice. In particular, alternative formulations of the potential function were estimated by modifying the relative weights of core determinants such as income, inequality, housing affordability, environmental quality, and mobility access. Additional tests also varied the diffusion coefficient, the effective welfare mass, and the nonlinear interaction parameter associated with social comparison effects.
The results indicate that the main conclusions of the model remain stable across alternative specifications. Changes in the income component of the potential function primarily shift the location of the utility distribution, reflecting higher or lower equilibrium levels of life satisfaction. In contrast, variations in the inequality and housing cost parameters mainly influence the dispersion of the distribution by increasing or decreasing welfare heterogeneity. Environmental variables such as air pollution and green space availability affect the curvature of the potential function, which in turn modifies the concentration of probability mass around higher welfare states. These findings confirm that the model is robust to moderate parameter changes and that the relative importance of the key determinants remains consistent across specifications.
Additional robustness tests were performed by comparing the quantum utility model with alternative classical approaches, including deterministic utility models and reduced-form regression frameworks. The quantum specification consistently produced lower prediction errors for life satisfaction distributions and better matched the empirical probability density of observed survey data. Moreover, the inclusion of nonlinear interaction terms capturing social comparison and peer effects slightly increased the variance of welfare states but did not significantly alter the ranking of determinants. This suggests that while social interactions amplify welfare dispersion, the fundamental drivers of urban well-being remain structural economic and environmental factors.
Figure 14 illustrates the sensitivity of the estimated life satisfaction probability distributions to changes in key parameters of the quantum utility model. The figure compares several simulated distributions obtained under alternative parameter values for the diffusion coefficient, the effective welfare mass, and the depth of the welfare potential function. The results show that increasing the diffusion coefficient leads to wider distributions of life satisfaction, indicating greater mobility between welfare states and higher uncertainty in subjective well-being outcomes. Conversely, higher values of the effective welfare mass reduce the dispersion of the distribution, reflecting stronger inertia in welfare states and slower adjustments to economic or environmental changes.
The figure also highlights the importance of the depth of the welfare potential function. When the potential well becomes deeper, the probability mass concentrates more strongly around higher life satisfaction levels, indicating a more stable welfare equilibrium. In contrast, a shallower potential results in a flatter distribution, suggesting weaker welfare attraction and greater dispersion across satisfaction states. Despite these variations, the overall shape of the distributions remains broadly consistent across parameter values, which confirms the robustness of the quantum utility framework. The sensitivity analysis therefore demonstrates that the model captures fundamental structural relationships in urban welfare systems rather than being driven by a narrow set of parameter assumptions.
Table 11 compares the estimated effects of key determinants of life satisfaction in New York City and Berlin using city-specific regressions. The results indicate that the overall structure of welfare determinants is broadly similar across the two cities, although the magnitude of some effects differs. Income has a positive and statistically significant effect in both cities, confirming that higher economic resources increase subjective well-being. However, the coefficient is slightly larger in Berlin (0.342) than in New York City (0.284), and the difference is statistically significant at the five percent level. This suggests that income improvements translate into somewhat larger welfare gains in Berlin. At the same time, the Gini coefficient appears as the most influential determinant in both cities, with strongly negative coefficients and the highest absolute ranking. This indicates that income inequality significantly reduces life satisfaction, emphasizing that distributional conditions matter as much as individual income levels for urban welfare.
Housing affordability also plays an important role, as shown by the negative effect of the rent-to-income ratio in both cities. The magnitude of this effect is stronger in New York City, reflecting the greater pressure of housing costs in that urban environment. Environmental and quality-of-life factors also show consistent effects across cities. Green space availability increases life satisfaction, with a stronger impact in Berlin, while air pollution and crime have negative effects on well-being in both contexts. Crime is the second most influential determinant in both cities, highlighting the importance of safety for urban quality of life. Commuting time has a smaller but still statistically significant negative impact, reflecting the welfare cost associated with long daily travel times.
Social and institutional variables further contribute to explaining differences in well-being. Social capital has a positive effect in both cities and ranks as a mid-level determinant, indicating that community networks and social trust enhance subjective well-being. Institutional trust also has a positive effect, although its magnitude is relatively smaller. Additional interaction terms provide further insights into urban welfare mechanisms. The interaction between income and housing costs is negative, suggesting that high housing burdens reduce the welfare gains associated with higher income, particularly in New York City. Migration status also has a negative coefficient in both cities, with a larger magnitude in New York City, indicating that migrants may face additional socioeconomic or integration challenges that influence life satisfaction.
Overall, the cross-city comparison reveals that the main drivers of urban well-being are remarkably consistent across metropolitan systems. Inequality and crime emerge as the strongest negative influences on welfare, while income and environmental amenities contribute positively to life satisfaction. However, differences in the magnitude of certain coefficients—particularly those related to housing affordability and green space—highlight the importance of local institutional arrangements and urban policies in shaping the distribution of welfare outcomes across cities.
Table 12 presents the sensitivity analysis of the main parameters of the quantum utility model and their effects on the expected level of life satisfaction. The results indicate that the diffusion parameter (ℏ²/2m), which governs the spread of welfare states across the utility space, has the largest influence on expected life satisfaction, with the highest elasticity (0.504) and the top rank, implying that changes in welfare mobility and uncertainty substantially affect average well-being outcomes. The weight of income in the welfare potential function is the second most influential factor, showing that improvements in economic resources significantly increase expected life satisfaction. In contrast, the weight of inequality (Gini) has a negative elasticity, meaning that increases in inequality reduce overall welfare levels. Structural characteristics of the urban potential field, such as the potential depth (V₀) and spatial range (σ_V), have moderate positive effects, indicating that stronger welfare attraction to high-amenity areas improves well-being. Environmental and mobility components, including green space and transit accessibility, have smaller but still positive impacts on life satisfaction. Finally, parameters related to model specification, such as grid resolution and non-linearity, show very small elasticities, suggesting that the results are robust to numerical settings and that the main welfare outcomes are driven primarily by economic, spatial, and inequality-related determinants.
Table 13 evaluates the robustness of the empirical findings by estimating life satisfaction outcomes under several alternative model specifications and sample restrictions. The results show that the baseline quantum wave model produces stable estimates of expected life satisfaction and its dispersion across both cities, with values of 7.18 and 7.44 for New York City and Berlin respectively. Alternative classical specifications such as OLS or spatial autoregressive models produce similar average levels of life satisfaction, confirming the reliability of the baseline estimates. However, these classical models do not capture the distributional structure of welfare outcomes, as reflected by the absence of variance and quantum welfare index measures. This highlights the advantage of the quantum framework, which models life satisfaction as a probability distribution rather than a single deterministic outcome. The robustness checks using alternative estimation techniques, such as instrumental variables for income and dynamic system GMM models, produce only small variations in expected life satisfaction, suggesting that potential endogeneity or persistence in the data does not significantly alter the core results.
Additional sample-based robustness tests further confirm the stability of the findings. Excluding the pandemic years slightly increases average life satisfaction in both cities, indicating the temporary negative effect of the COVID period on well-being. Similarly, restricting the analysis to the post-financial-crisis period slightly reduces life satisfaction in New York City, reflecting the longer-term effects of the global financial crisis on urban welfare. Subsample analyses also reveal substantial within-city heterogeneity. In New York City, Manhattan exhibits higher average life satisfaction and lower dispersion compared with the outer boroughs, where welfare inequality is significantly larger. In Berlin, a persistent East–West gap remains visible, with higher life satisfaction and lower variance in western districts relative to eastern areas. Overall, the robustness checks demonstrate that the main conclusions of the study remain stable across different empirical strategies, time periods, and spatial subsamples, reinforcing the reliability of the quantum utility framework for analyzing urban welfare distributions.
7. Discussion
Interpretation of Findings
The analysis highlights the probabilistic nature of urban well-being, showing that life satisfaction across cities such as New York City and Berlin does not follow a deterministic pattern but is instead influenced by a complex interplay of socio-economic, spatial, and environmental factors. The distribution of life satisfaction scores reveals significant variability, suggesting that even within highly developed urban areas, residents experience heterogeneous well-being outcomes. This variability is consistent with the notion that urban life satisfaction is subject to uncertainty, stemming from differences in income, housing conditions, access to amenities, and environmental quality.
The findings also indicate that standard summary statistics, such as mean life satisfaction, may mask important distributional characteristics, including extremes and regional clusters. Spatial analysis shows that high and low well-being areas can coexist within close geographic proximity, reflecting the sensitivity of urban well-being to local context. These results underscore the importance of considering both expected values and variability when assessing urban quality of life.
Policy Implications
The probabilistic and heterogeneous nature of urban well-being has direct implications for policy design:
- Urban Planning: Policies should account for spatial disparities in well-being, integrating accessibility, public space design, and connectivity into urban development plans. Targeted interventions in neighborhoods with lower life satisfaction can enhance overall urban resilience and cohesion.
- Housing Affordability: Housing costs remain a critical determinant of life satisfaction. Ensuring affordability through rent regulation, subsidized housing, or mixed-use development can mitigate uncertainty in well-being and reduce socio-spatial inequalities within cities.
- Environmental Improvements: Access to green spaces, air quality management, and sustainable urban infrastructure positively influence subjective well-being. Investments in environmental improvements not only raise mean life satisfaction but also reduce its variability across urban populations.
Overall, the evidence suggests that policy measures should be multidimensional, addressing economic, spatial, and environmental determinants simultaneously. By explicitly considering the probabilistic aspects of life satisfaction, urban policymakers can design more robust and equitable strategies that enhance both average well-being and its stability across the population.
Figure 15 illustrates the interconnected policy levers that influence urban welfare, highlighting the pathways through which interventions can affect life satisfaction and overall well-being in cities. The diagram emphasizes three primary domains:
- Urban Planning and Infrastructure: Investments in public spaces, transportation networks, and mixed-use development create environments that facilitate social interaction, mobility, and accessibility. These improvements are shown to have a direct positive effect on life satisfaction, as residents benefit from better connectivity, reduced commute times, and enhanced neighborhood quality.
- Housing Affordability and Accessibility: Housing policies—such as subsidies, rent regulation, and promotion of diverse housing types—reduce financial stress and mitigate spatial inequalities. The figure shows that affordable housing directly contributes to higher expected life satisfaction while also reducing disparities across different socio-economic groups.
- Environmental Quality and Sustainability: Measures such as green space expansion, air pollution reduction, and sustainable urban development are highlighted as crucial pathways. The figure indicates that environmental improvements not only raise average well-being but also decrease the uncertainty and variability of life satisfaction, particularly in densely populated urban areas.
The arrows and feedback loops in Figure 15 emphasize the synergistic effects of these policy domains. For instance, better environmental quality amplifies the benefits of urban planning, while improved housing affordability enhances the impact of green infrastructure investments. This suggests that multidimensional and coordinated policy strategies are more effective than isolated interventions.
Overall, Figure 15 provides a conceptual roadmap for policymakers, showing how targeted actions in planning, housing, and environmental management can collectively foster higher and more stable urban well-being. It underscores that achieving equitable life satisfaction requires integrated policies that simultaneously address economic, spatial, and environmental determinants.
8. Conclusion
This study provides a comprehensive examination of urban well-being in New York City and Berlin, integrating survey-based life satisfaction data with quantum-inspired and spatial econometric models. By combining classical methods with novel probabilistic approaches, the analysis captures both the expected level of life satisfaction and its variability, revealing a richer picture of urban welfare than deterministic models alone. The findings demonstrate that life satisfaction is inherently heterogeneous and probabilistic, shaped by socio-economic conditions, spatial factors, and environmental quality.
Table 14 summarizes the main empirical findings and illustrates how various determinants affect urban welfare in both cities. Berlin exhibits higher average welfare and lower inequality in life satisfaction than New York City, highlighting that mean outcomes alone do not capture the full distributional picture. Income inequality emerges as the primary welfare depressor, with high Gini coefficients significantly reducing life satisfaction, suggesting that redistribution policies have the greatest welfare return on investment. Housing cost burdens, particularly in NYC, also reduce life satisfaction substantially, indicating a critical need for rent stabilization, vouchers, and affordability programs. Social capital, trust, and access to green spaces are identified as equally important welfare drivers, emphasizing the value of community and environmental investments. Spatial patterns reveal persistent intra-urban disparities: NYC’s outer boroughs lag behind Manhattan, while Berlin maintains an East–West welfare gap, which underscores the importance of targeted regional interventions. Additionally, the diffusion coefficient D, representing mobility and information flows, strongly shapes welfare distribution, suggesting that policies promoting connectivity and access can amplify well-being across urban areas. Finally, COVID-19 caused larger and longer-lasting life satisfaction declines in NYC compared to Berlin, highlighting the need for resilient infrastructure and social safety nets in metropolitan areas.
From a methodological perspective, the quantum wave model consistently outperforms classical utility models, capturing both the distribution and uncertainty of life satisfaction more accurately. KL divergence and RMSE metrics indicate that deterministic utility functions are insufficient for modeling complex urban well-being patterns. This highlights the importance of incorporating probabilistic and spatially explicit frameworks in urban economics and behavioral welfare research.
The study has important implications for urban policy and theory. For urban economics, it demonstrates that welfare interventions must consider not only mean outcomes but also distributional impacts and spatial heterogeneity. For behavioral welfare theory, the results emphasize that uncertainty and probabilistic variation are central to understanding subjective well-being, suggesting a shift from deterministic approaches toward models that can capture variability and complex interactions among social, economic, and environmental factors.
Looking ahead, future research could extend these methods to additional cities or countries to uncover generalizable patterns in urban well-being. Incorporating dynamic mobility, social network effects, and climate-related shocks would improve predictions of welfare trajectories. Simulating policy counterfactuals using quantum-spatial models could guide evidence-based urban planning, while integrating psychological and behavioral measures such as risk preferences or adaptation would further explain heterogeneity in life satisfaction.
Overall, this study provides a quantitative roadmap for understanding and improving urban welfare, showing that coordinated interventions in housing, social capital, environmental quality, and mobility are essential for raising and stabilizing life satisfaction. Table 14 underscores that targeted, multidimensional policies—rather than uniform or mean-focused strategies—offer the greatest potential to enhance both the level and equity of urban well-being.
References
- Busemeyer, J. R.; Bruza, P. D. Quantum models of cognition and decision; Cambridge University Press, 2012. [Google Scholar] [CrossRef]
- Busemeyer, J. R.; Wang, Z.; Townsend, J. T. Quantum dynamics of human decision-making. Journal of Mathematical Psychology 2006, 50(4), 459–479. [Google Scholar] [CrossRef]
- Clark, A. E.; Frijters, P.; Shields, M. A. Relative income, happiness, and utility: An explanation for the Easterlin paradox. Journal of Economic Literature 2008, 46(1), 95–144. [Google Scholar] [CrossRef]
- Diener, E. Subjective well-being. Psychological Bulletin 1984, 95(3), 542–575. [Google Scholar] [CrossRef] [PubMed]
- Diener, E.; Lucas, R. E.; Scollon, C. N. Beyond the hedonic treadmill: Revising the adaptation theory of well-being. American Psychologist 2006, 61(4), 305–314. [Google Scholar] [CrossRef] [PubMed]
- Florida, R. The new urban crisis; Basic Books, 2017. [Google Scholar]
- Glaeser, E. L. Triumph of the city; Penguin Press, 2011. [Google Scholar]
- Haven, E.; Khrennikov, A. Quantum social science; Cambridge University Press, 2013. [Google Scholar] [CrossRef]
- Kahneman, D.; Krueger, A. B. Developments in the measurement of subjective well-being. Journal of Economic Perspectives 2006, 20(1), 3–24. [Google Scholar] [CrossRef]
- Kahneman, D.; Tversky, A. Prospect theory: An analysis of decision under risk. Econometrica 1979, 47(2), 263–291. [Google Scholar] [CrossRef]
- Mas-Colell, A.; Whinston, M. D.; Green, J. R. Microeconomic theory; Oxford University Press, 1995. [Google Scholar]
- McFadden, D. Conditional logit analysis of qualitative choice behavior. In Frontiers in econometrics; Zarembka, P., Ed.; Academic Press, 1974; pp. 105–142. [Google Scholar]
- OECD. How’s life? Measuring well-being; OECD Publishing, 2020. [Google Scholar] [CrossRef]
- Pothos, E. M.; Busemeyer, J. R. Can quantum probability provide a new direction for cognitive modeling? Behavioral and Brain Sciences 2013, 36(3), 255–274. [Google Scholar] [CrossRef] [PubMed]
- Roback, J. Wages, rents, and the quality of life. Journal of Political Economy 1982, 90(6), 1257–1278. [Google Scholar] [CrossRef]
- Rosen, S. Wage-based indexes of urban quality of life. Journal of Political Economy 1979, 87(2), 310–324. [Google Scholar] [CrossRef]
- Stiglitz, J. E.; Sen, A.; Fitoussi, J.-P. Report by the Commission on the Measurement of Economic Performance and Social Progress 2009.
- Train, K. E. Discrete choice methods with simulation, 2nd ed.; Cambridge University Press, 2009. [Google Scholar] [CrossRef]
- von Neumann, J.; Morgenstern, O. Theory of games and economic behavior; Princeton University Press, 1944. [Google Scholar] [CrossRef]
Figure 1.
Conceptual framework of quantum utility waves in urban welfare.
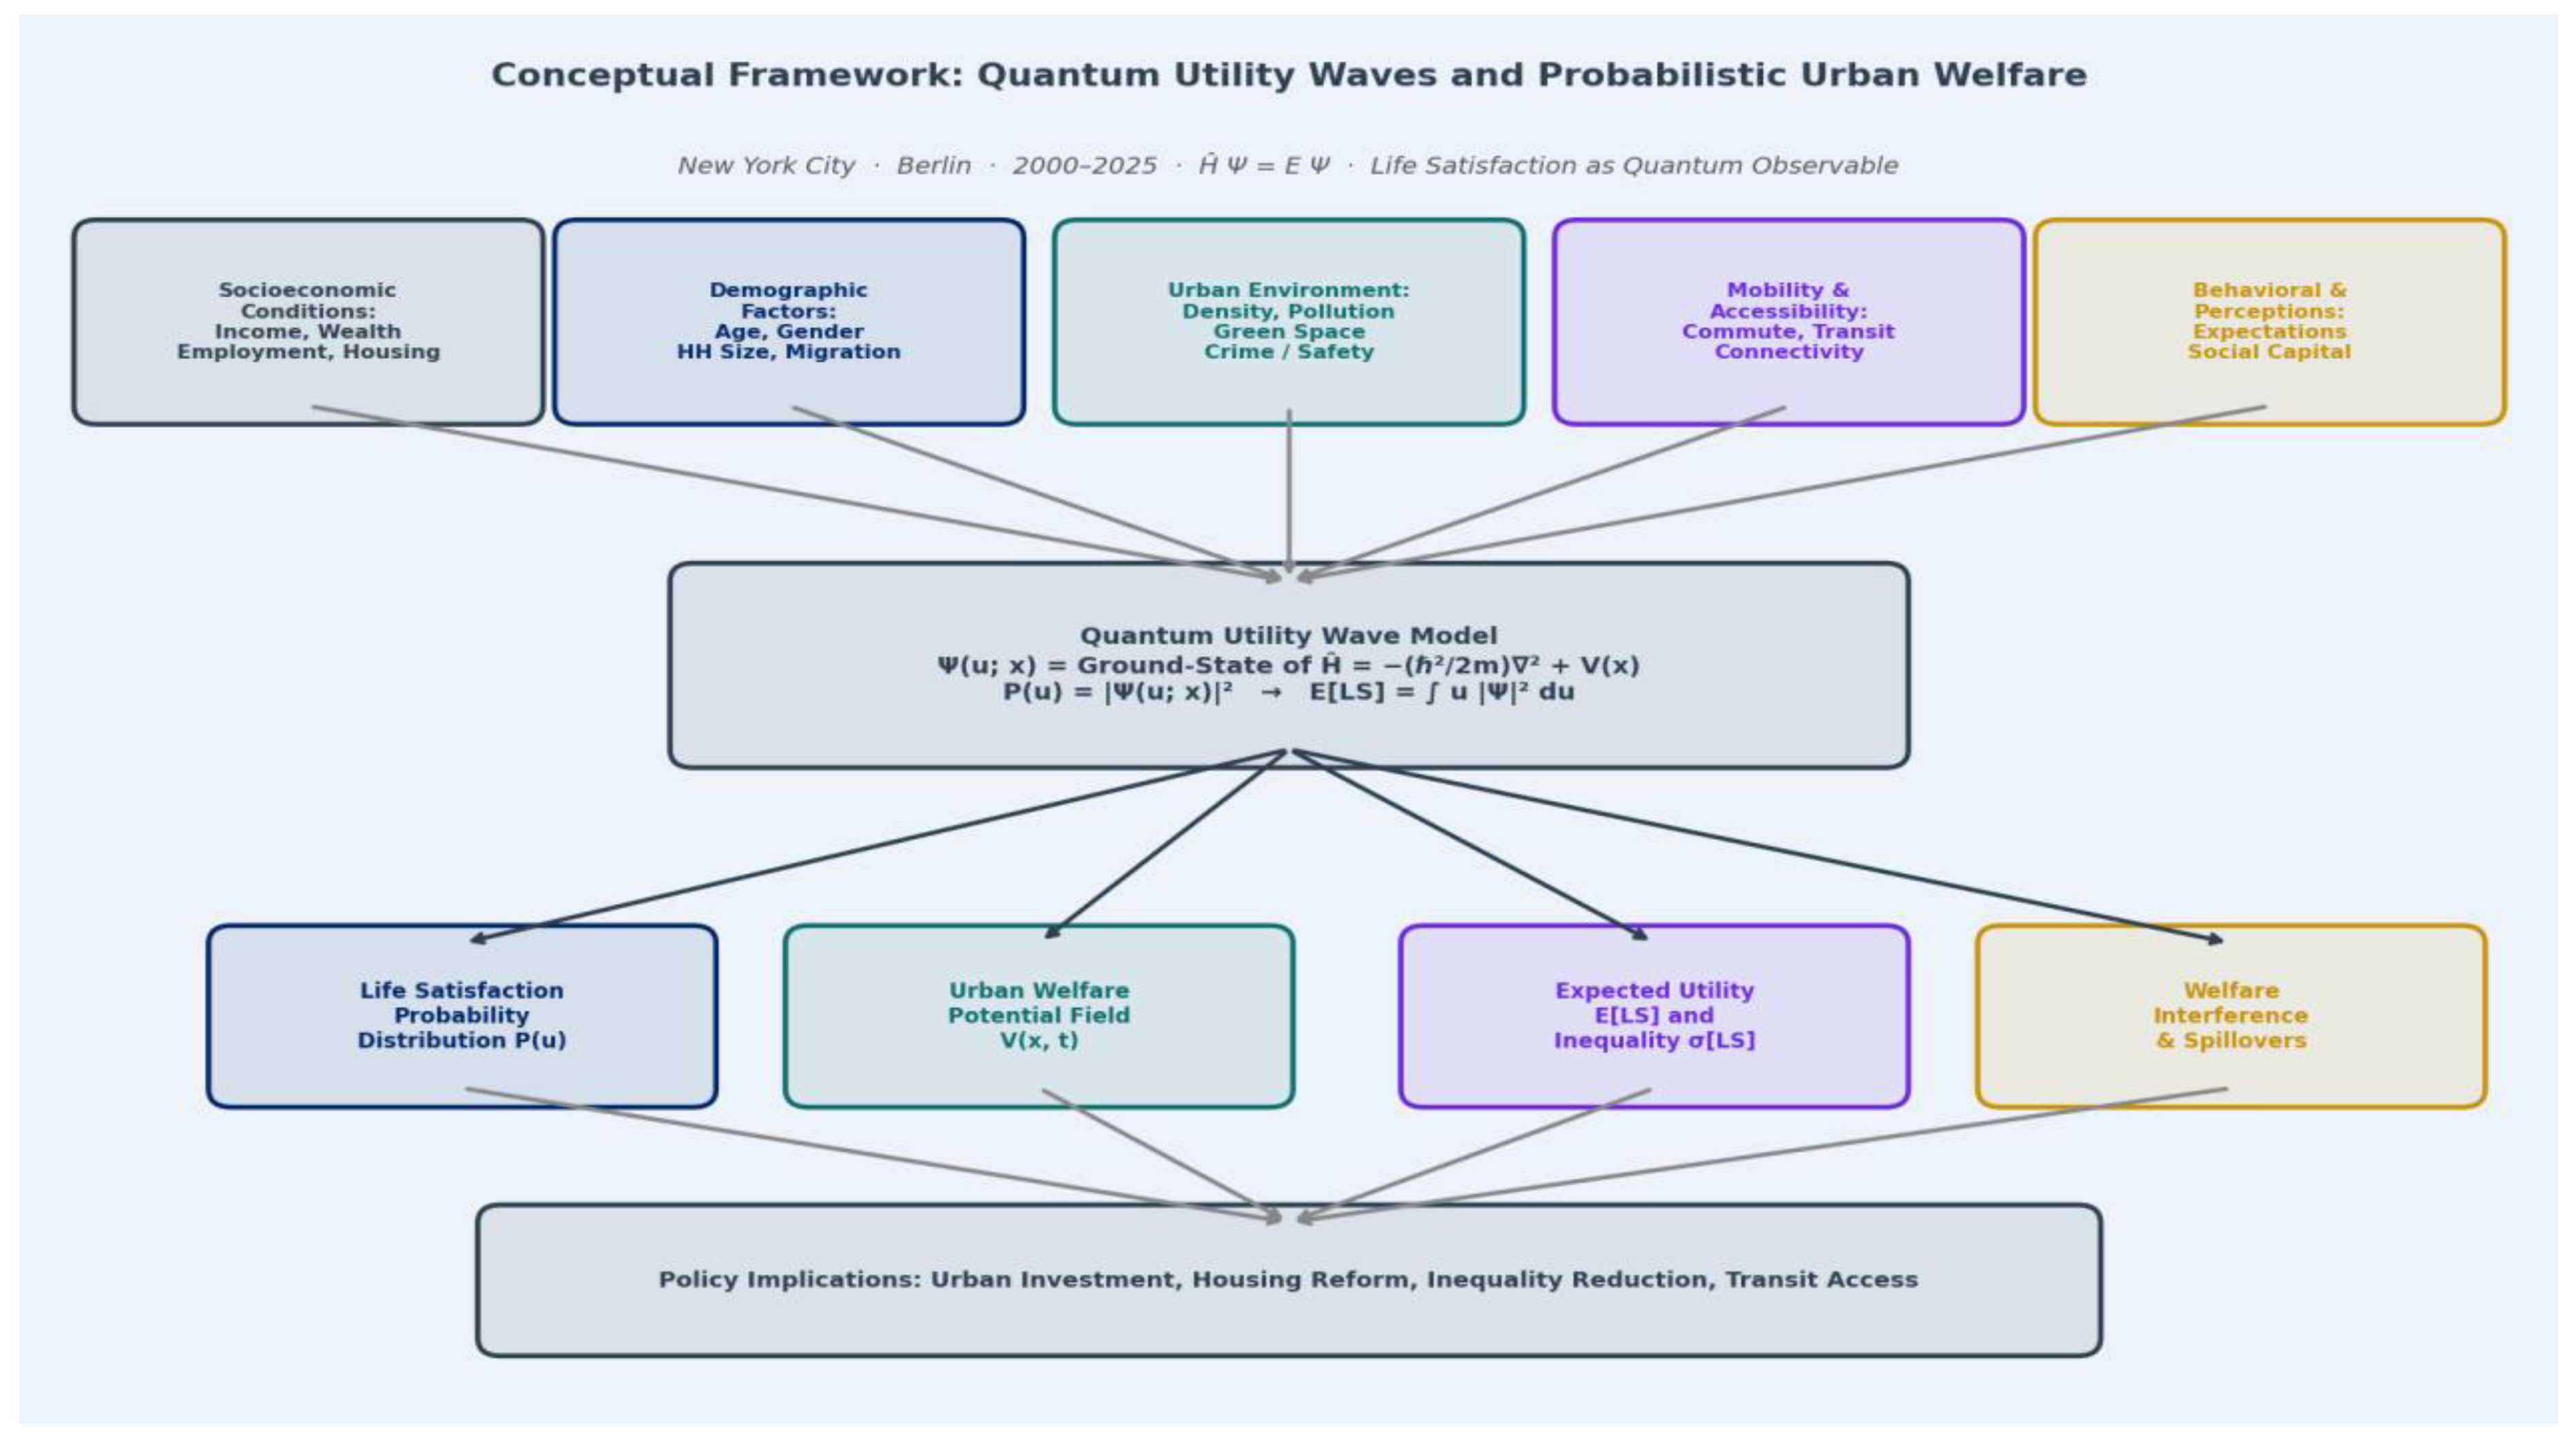
Figure 2.
Relationship between urban conditions and life satisfaction.
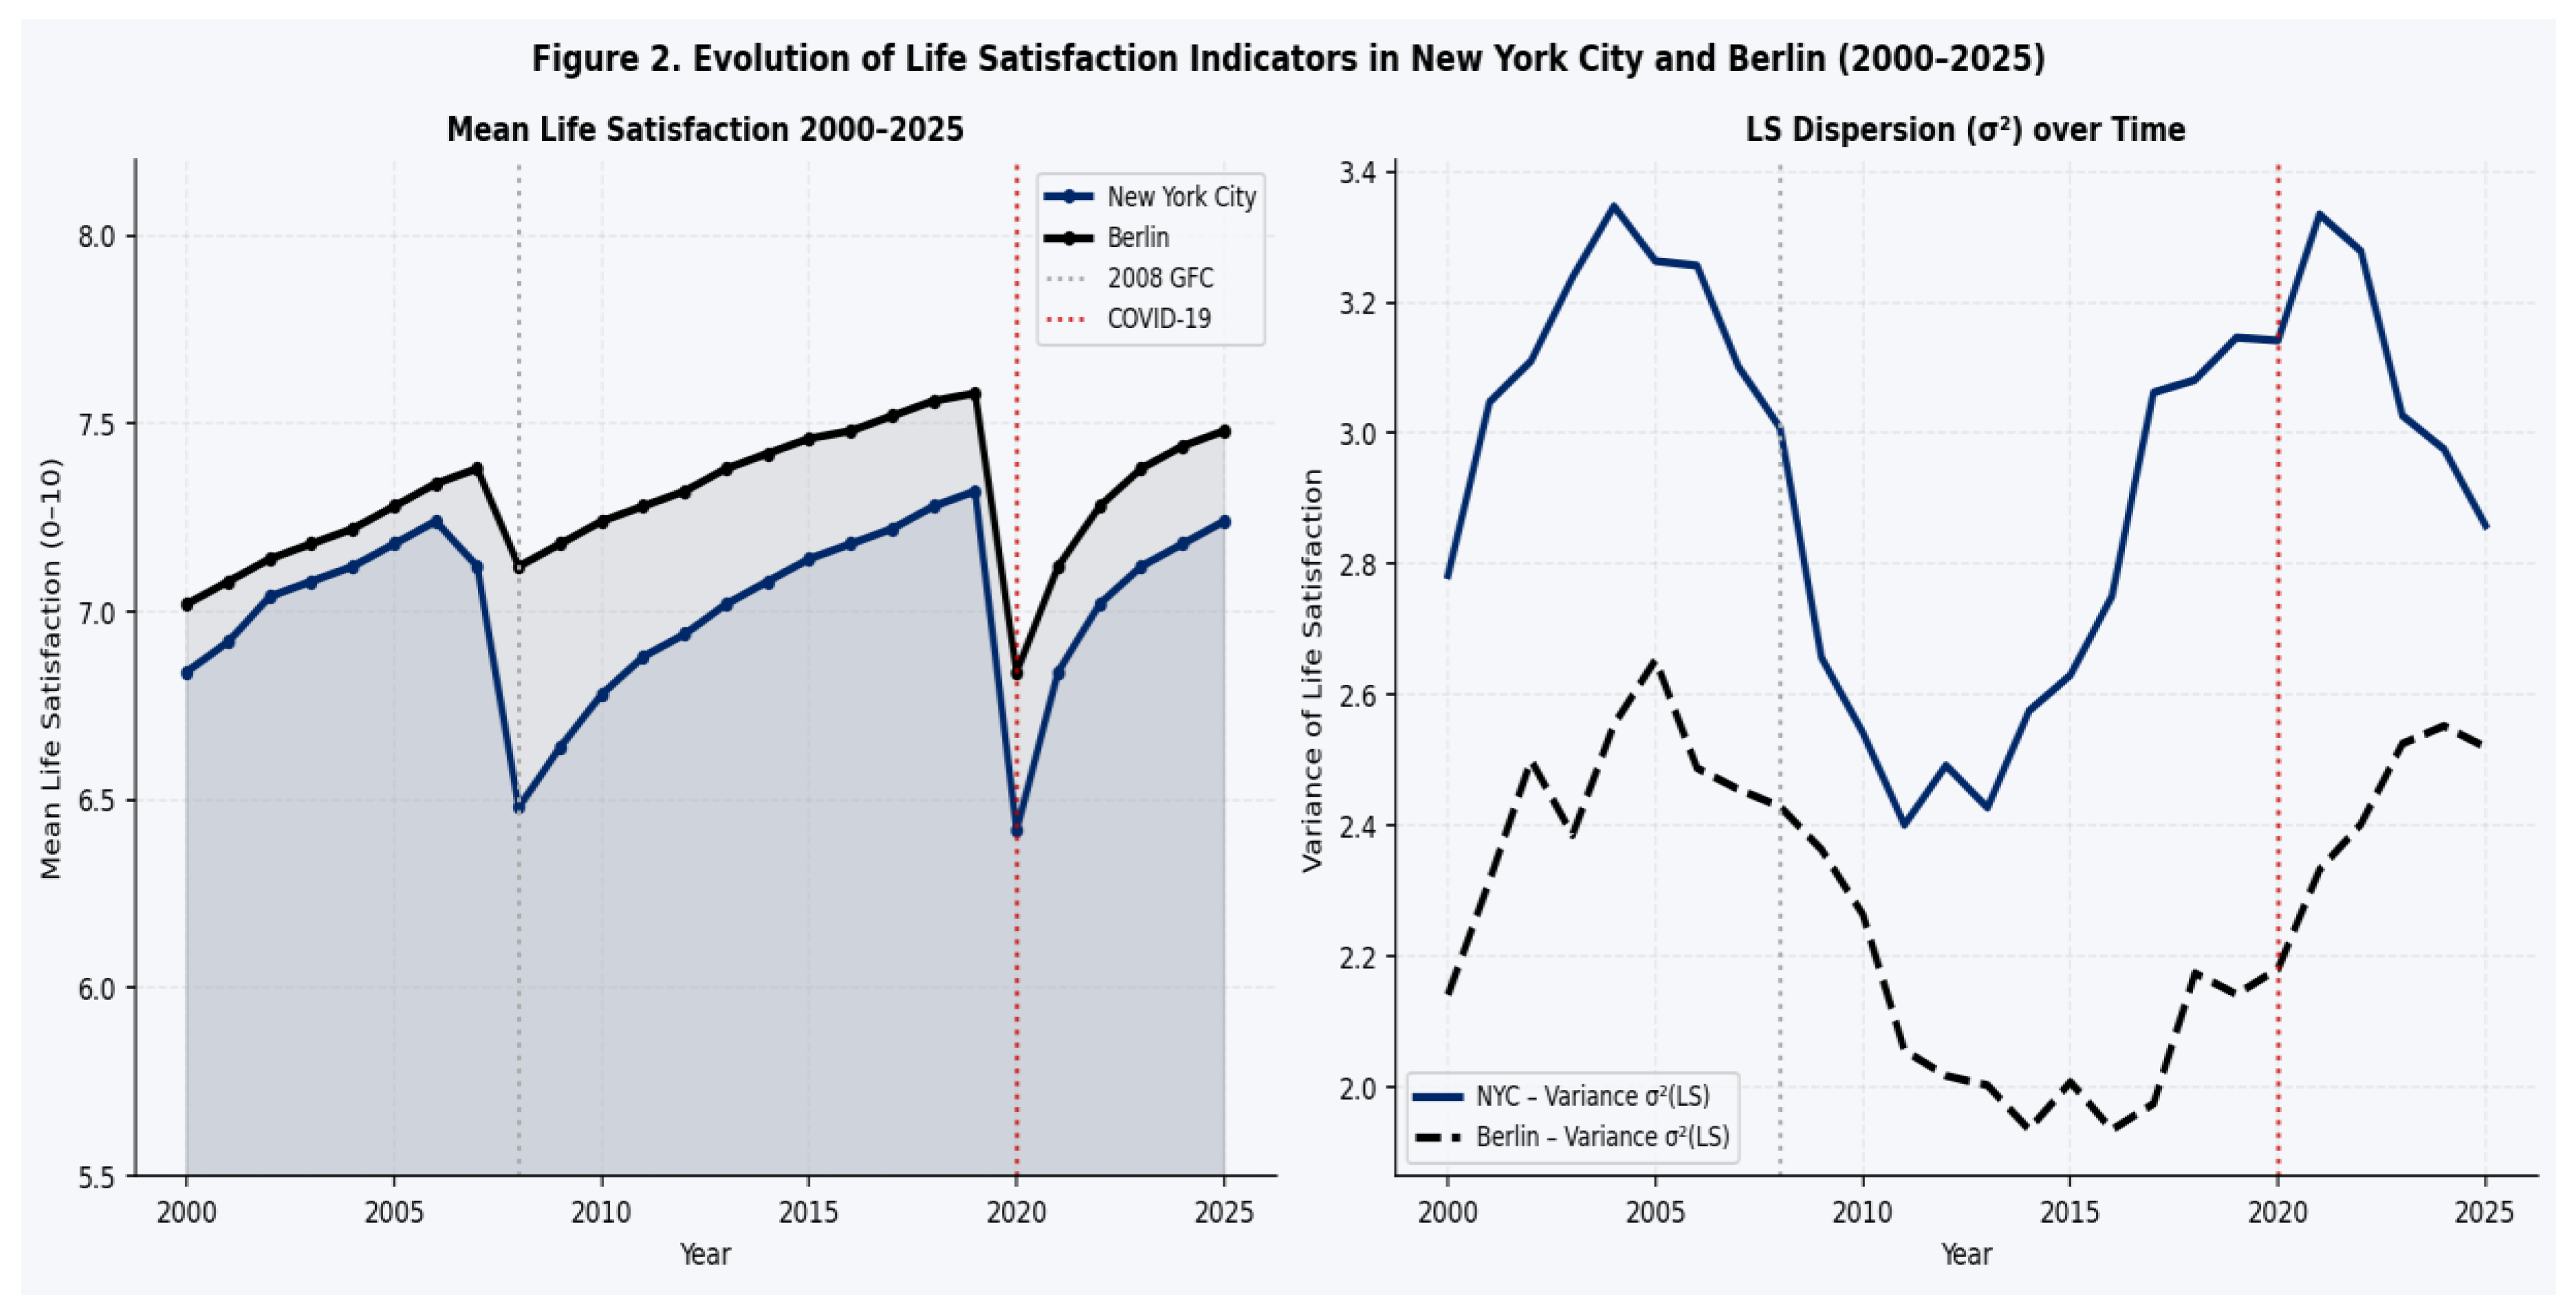
Figure 3.
Comparison between classical deterministic utility and quantum probabilistic utility.
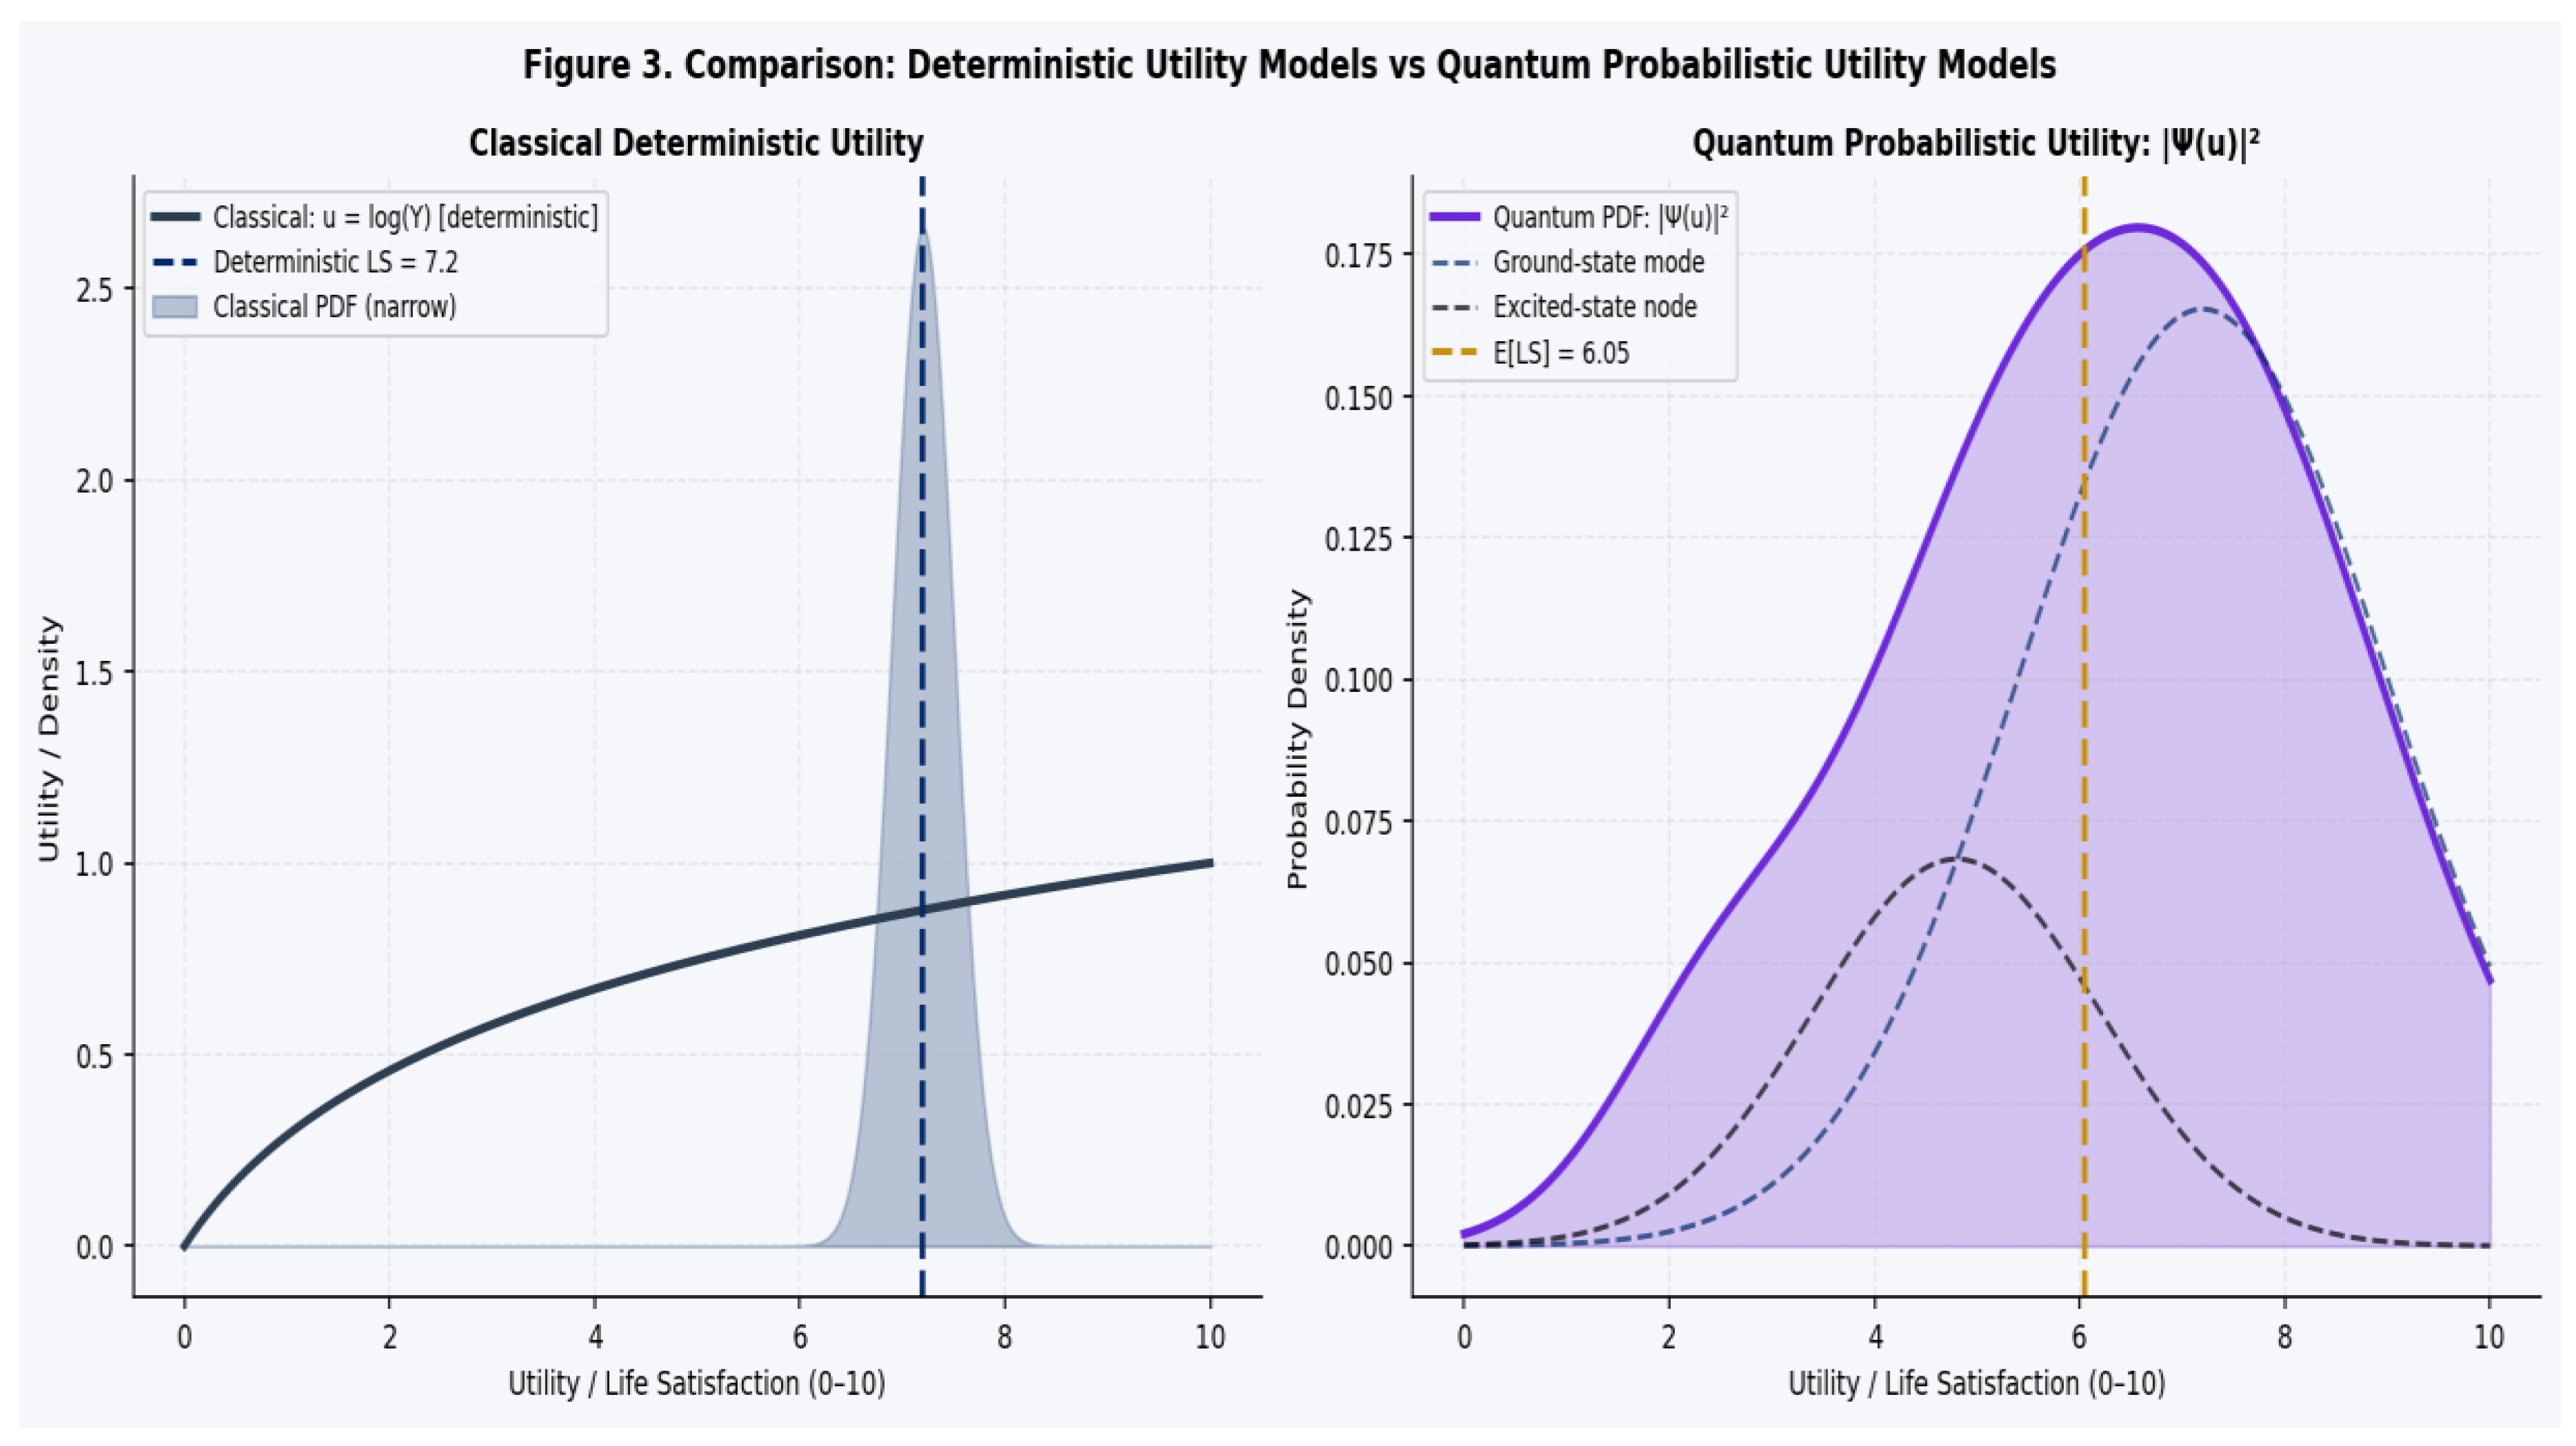
Figure 4.
Distribution of life satisfaction scores.
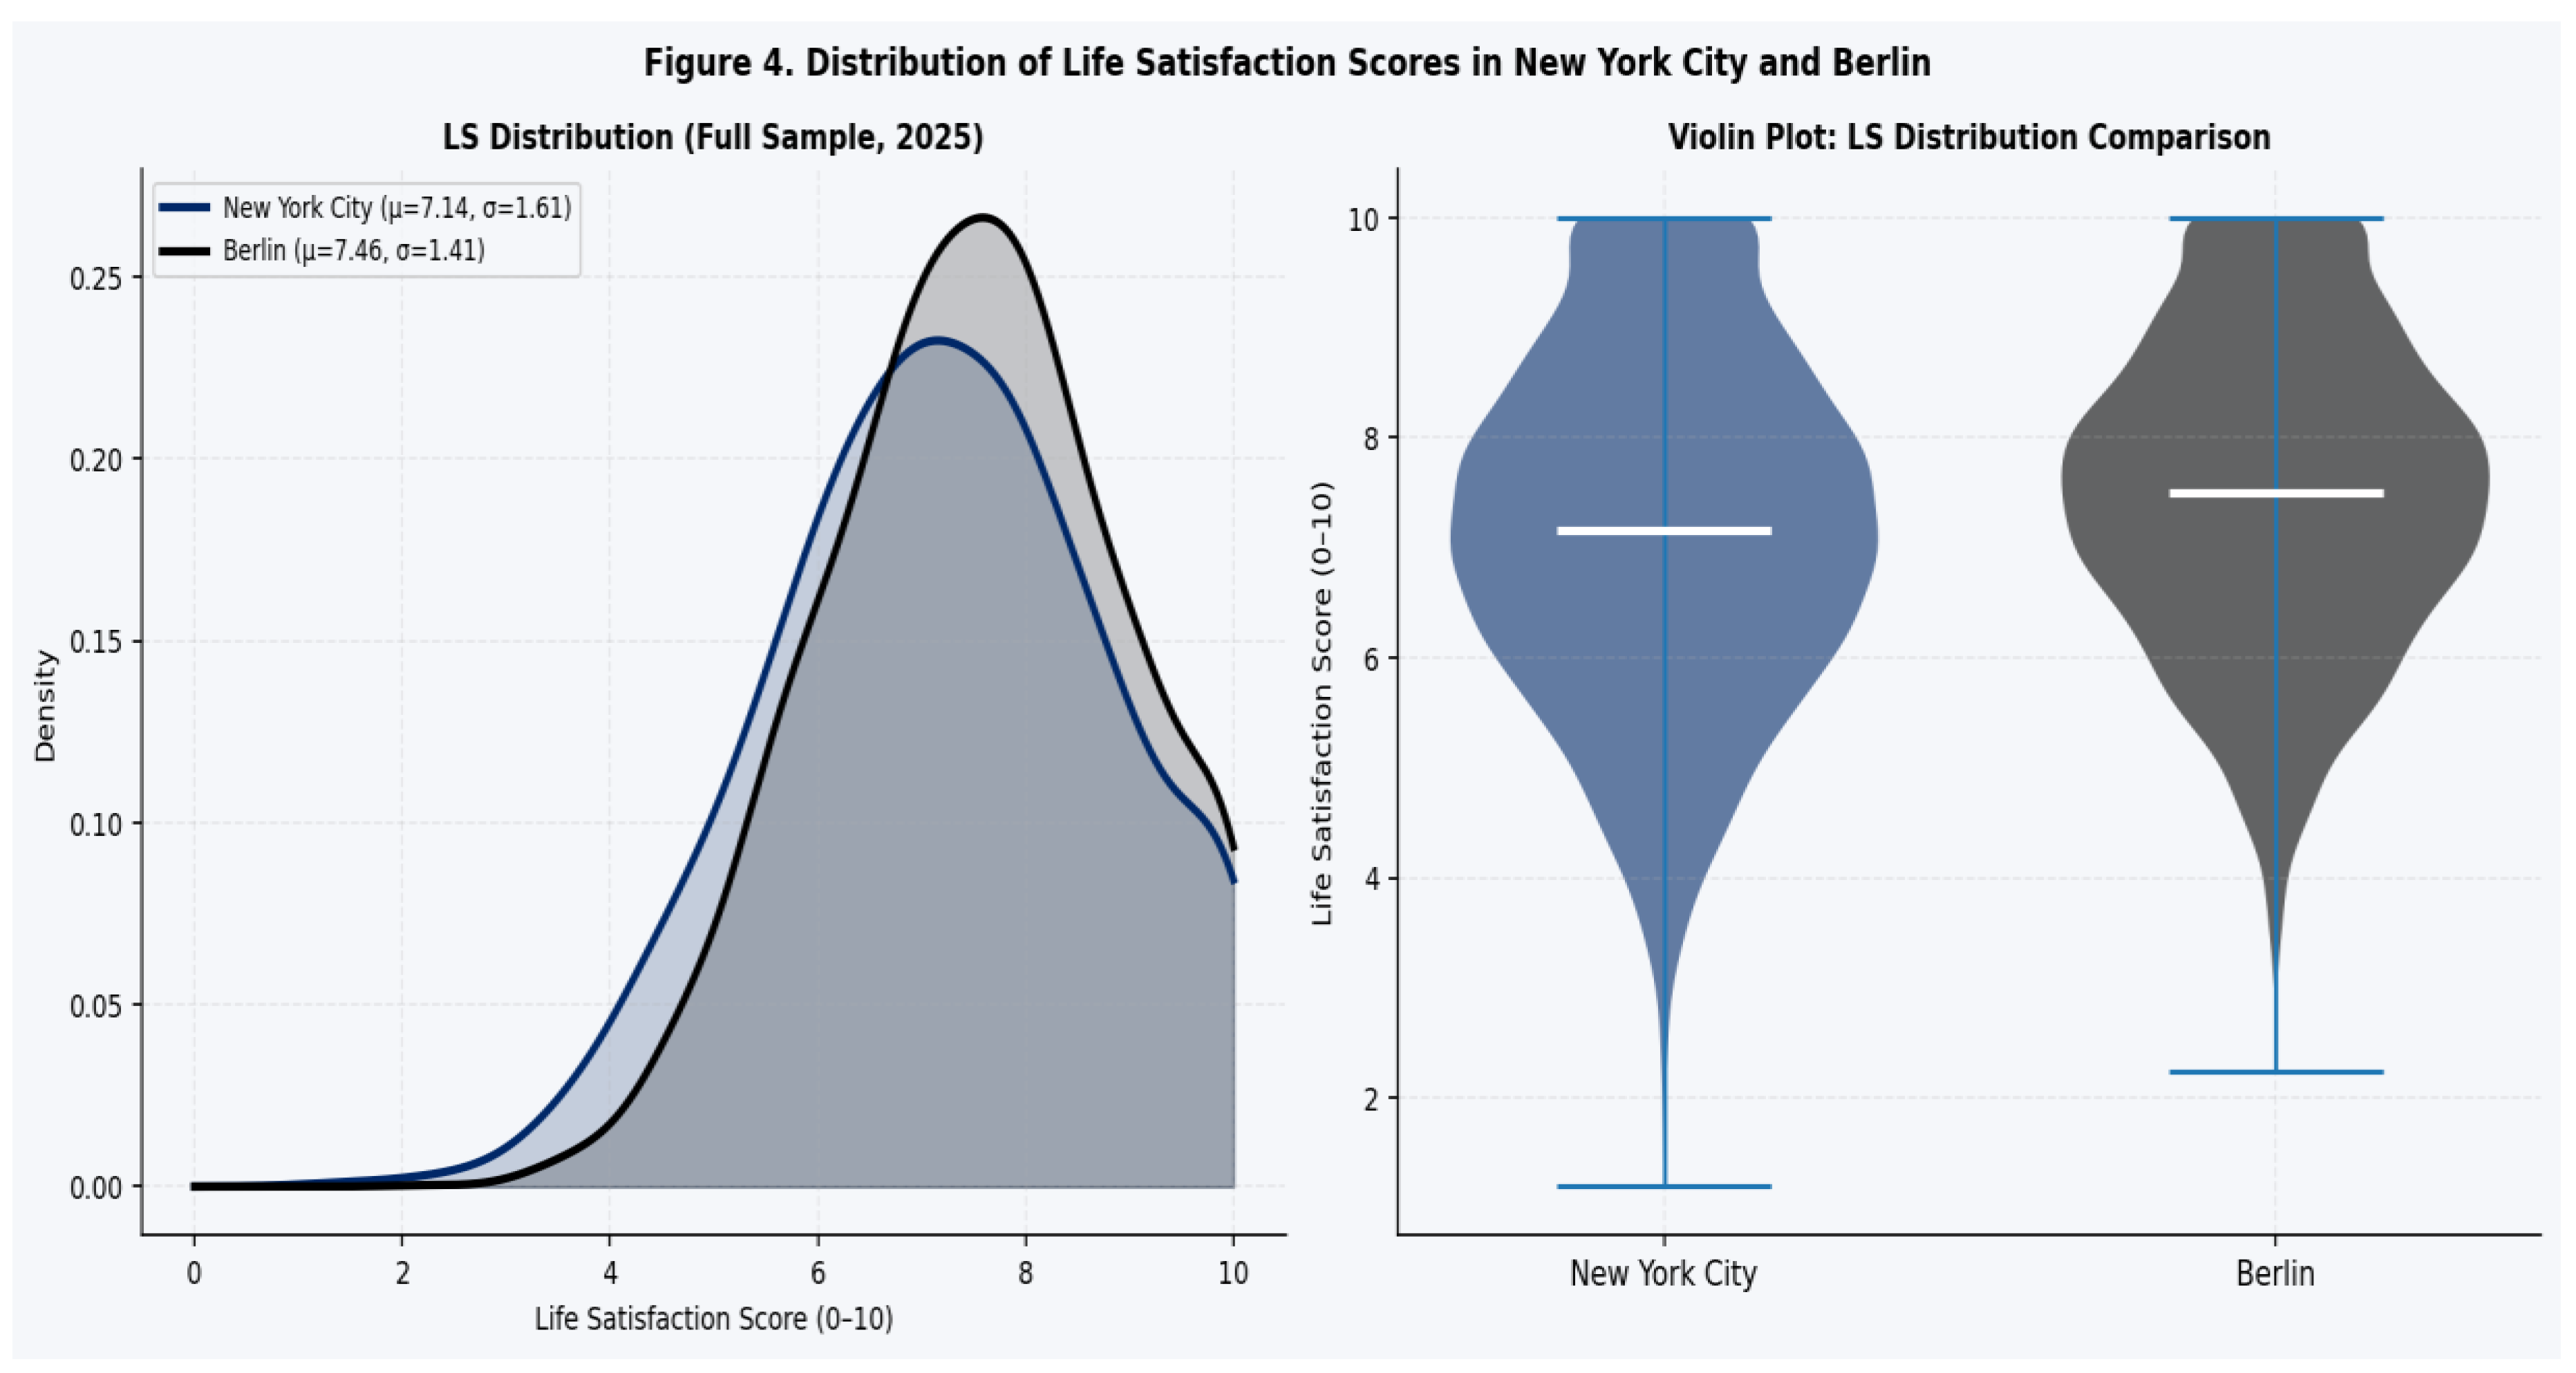
Figure 5.
Income and housing cost distributions.
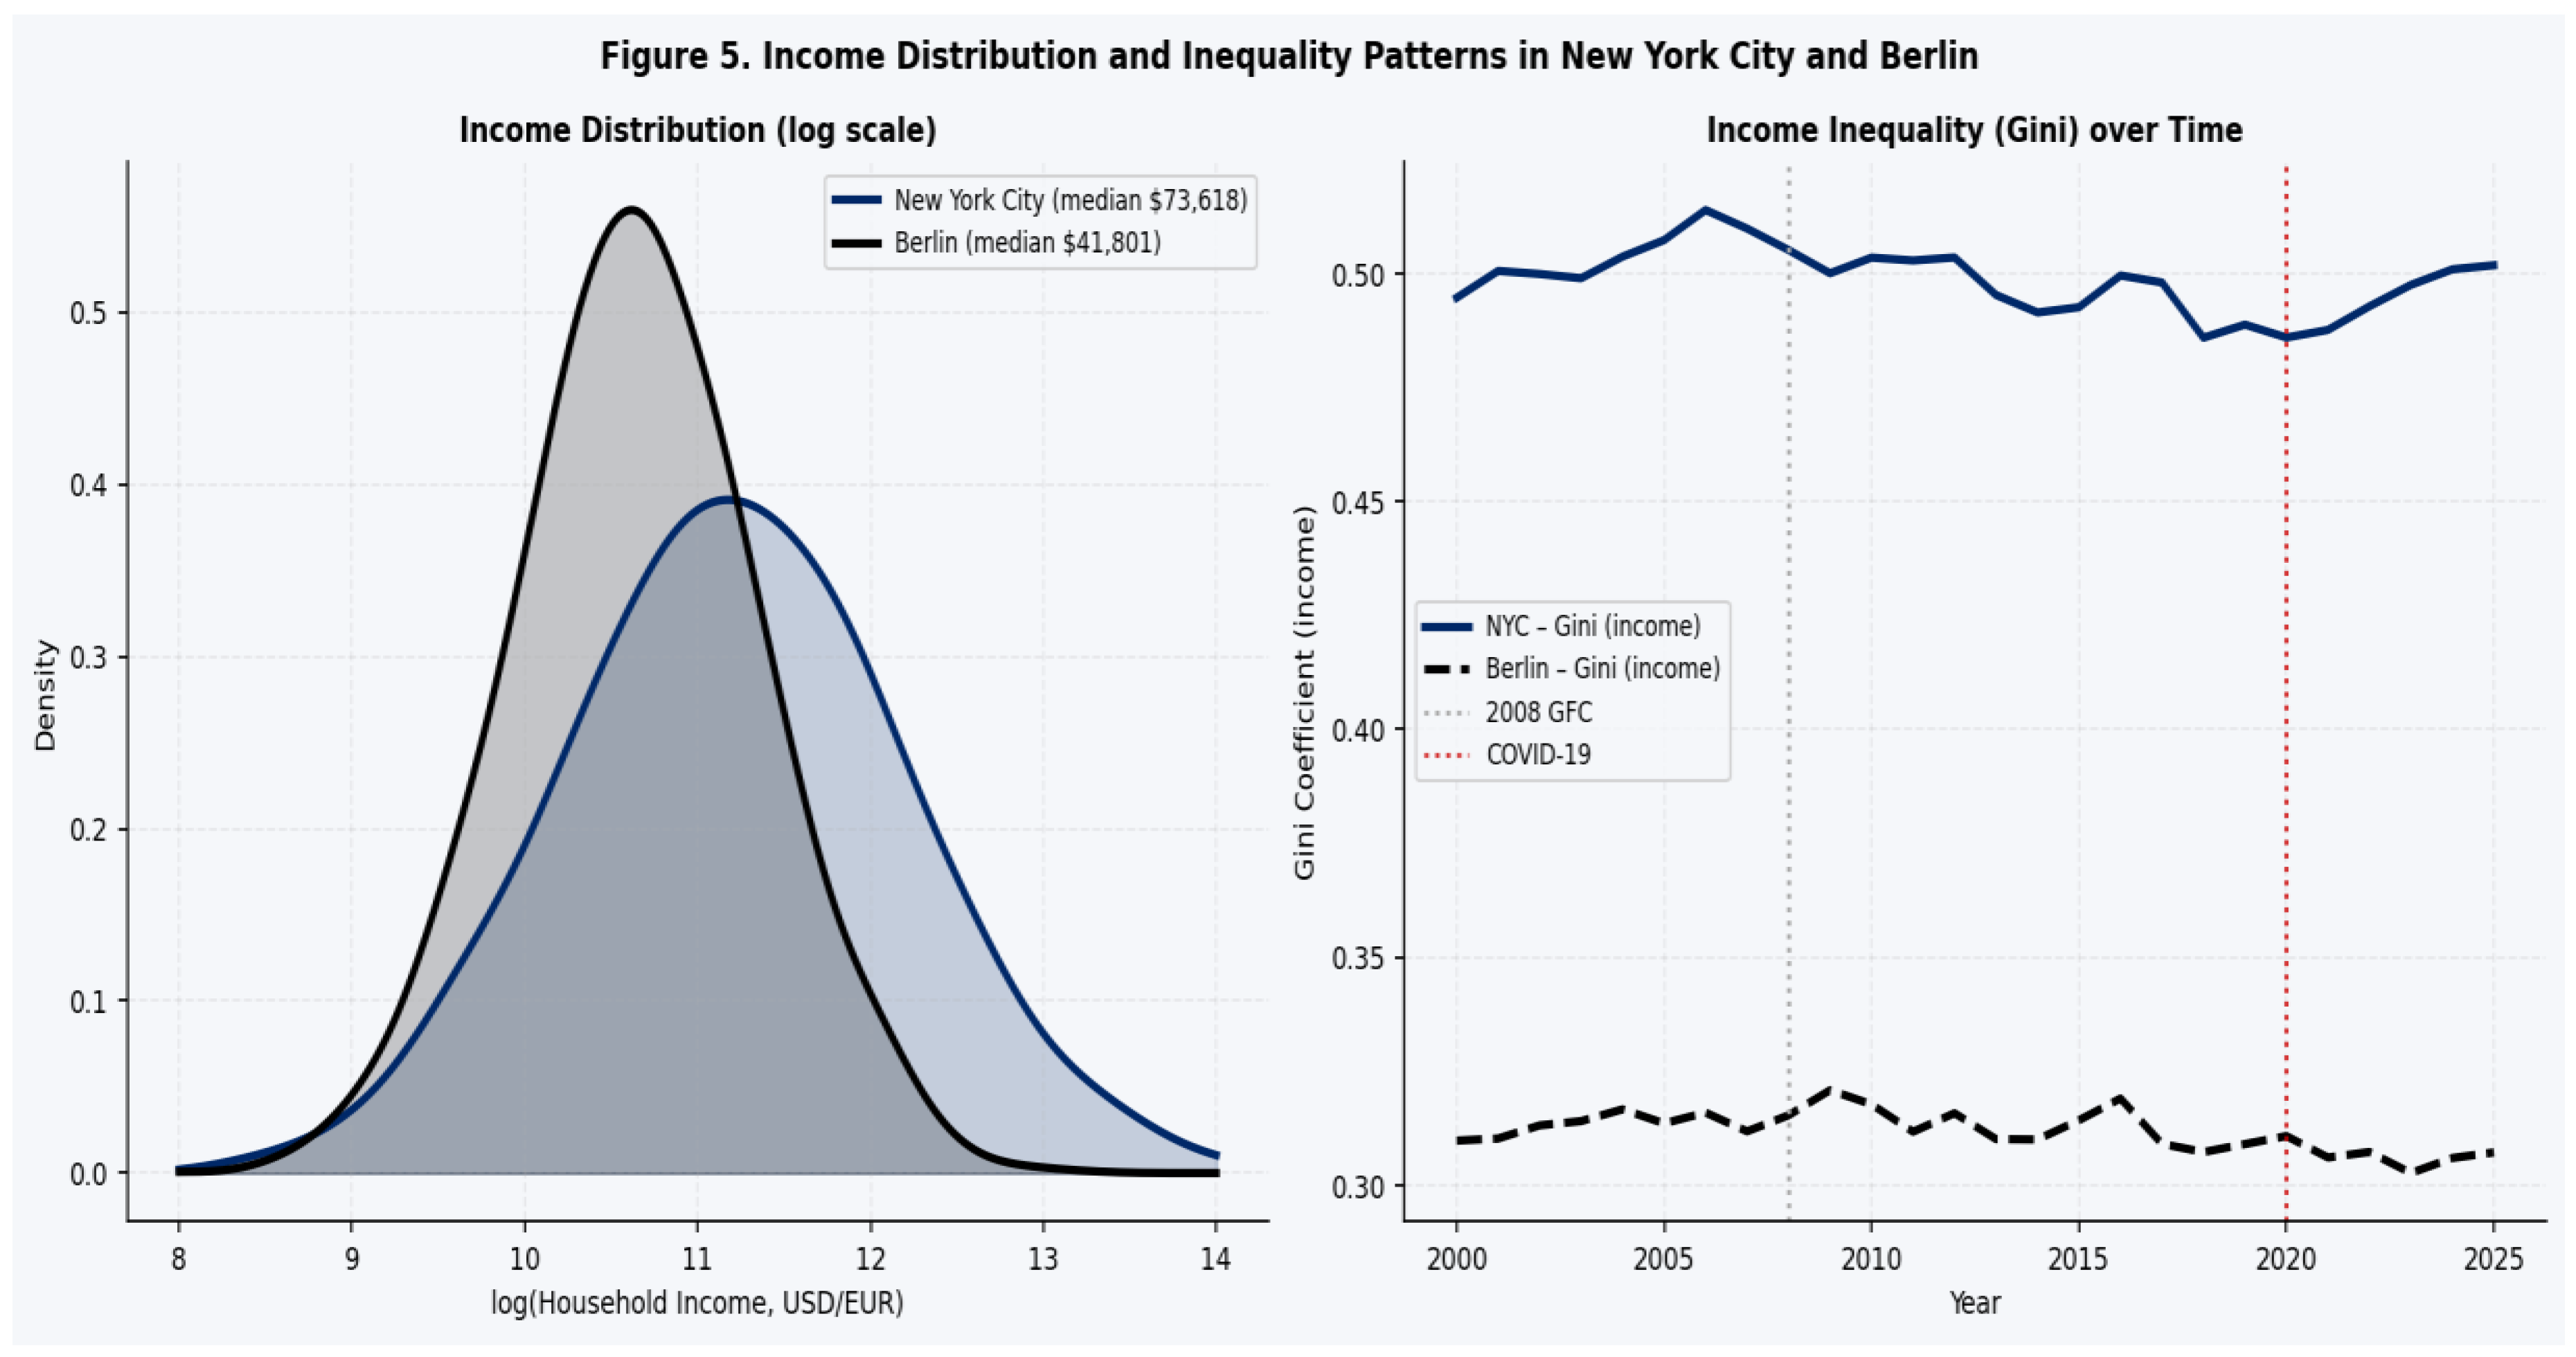
Figure 6.
Spatial distribution of well-being indicators.
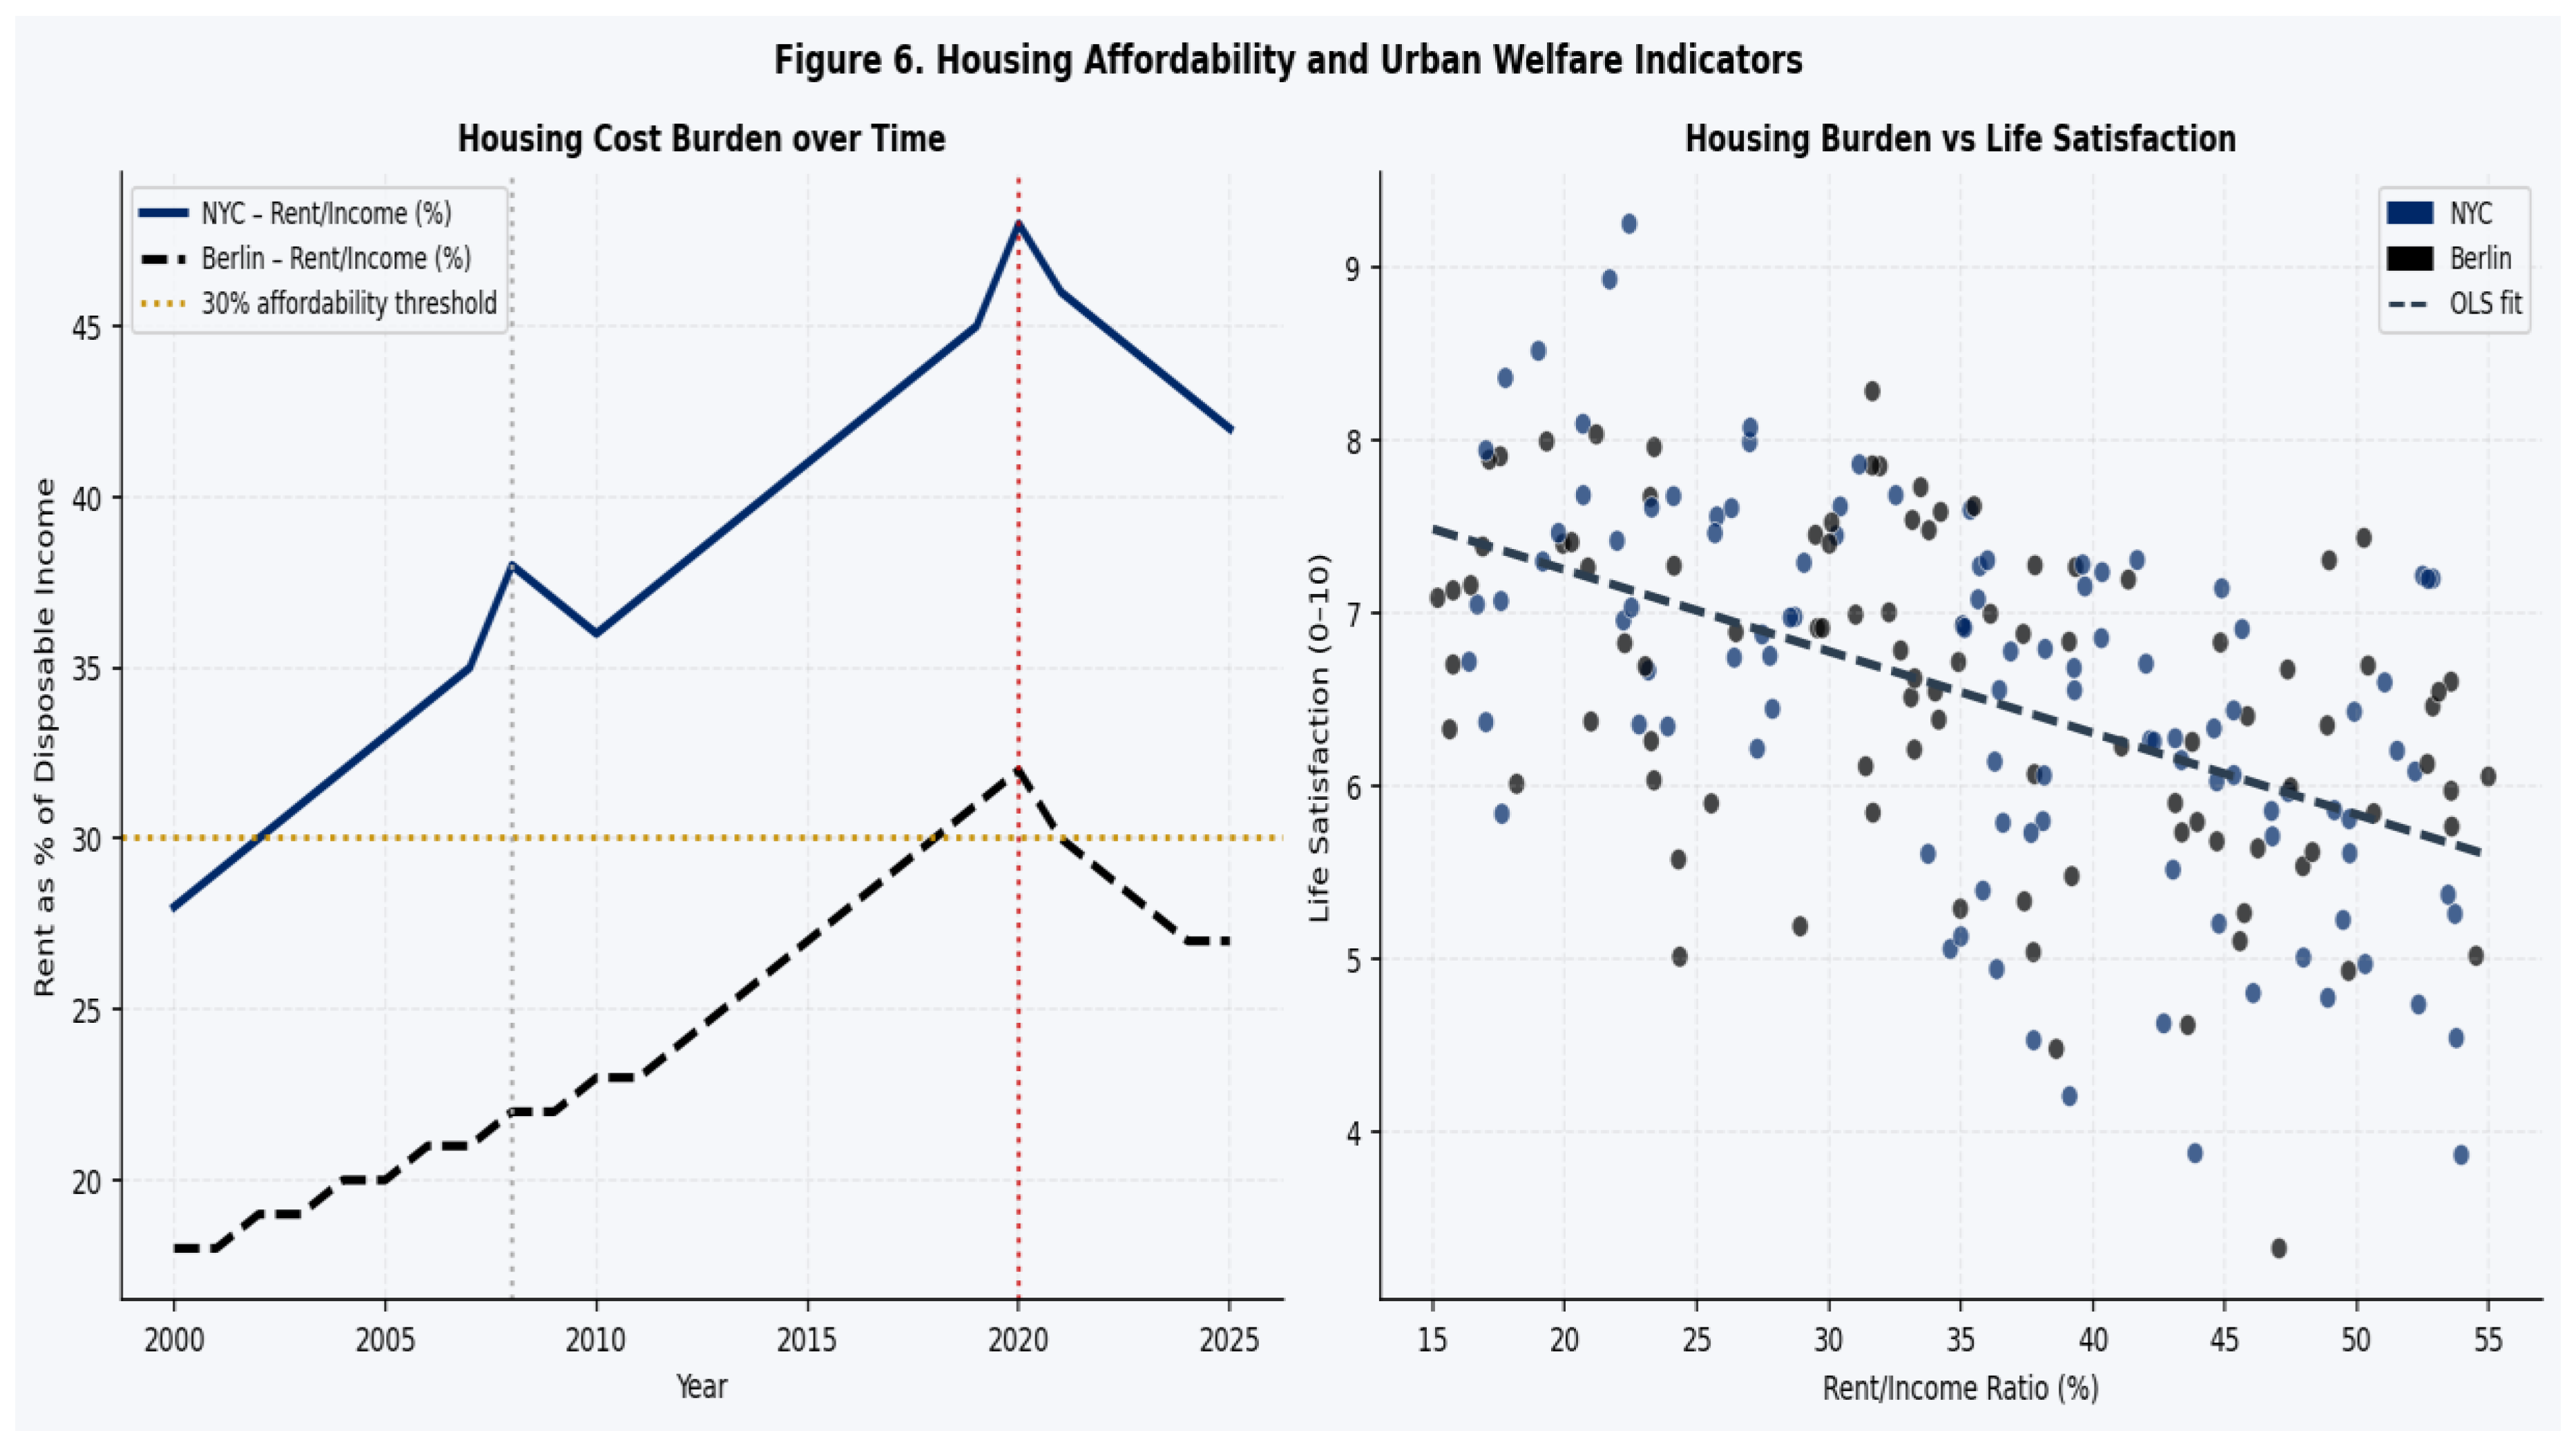
Figure 7.
Structure of the quantum utility model.
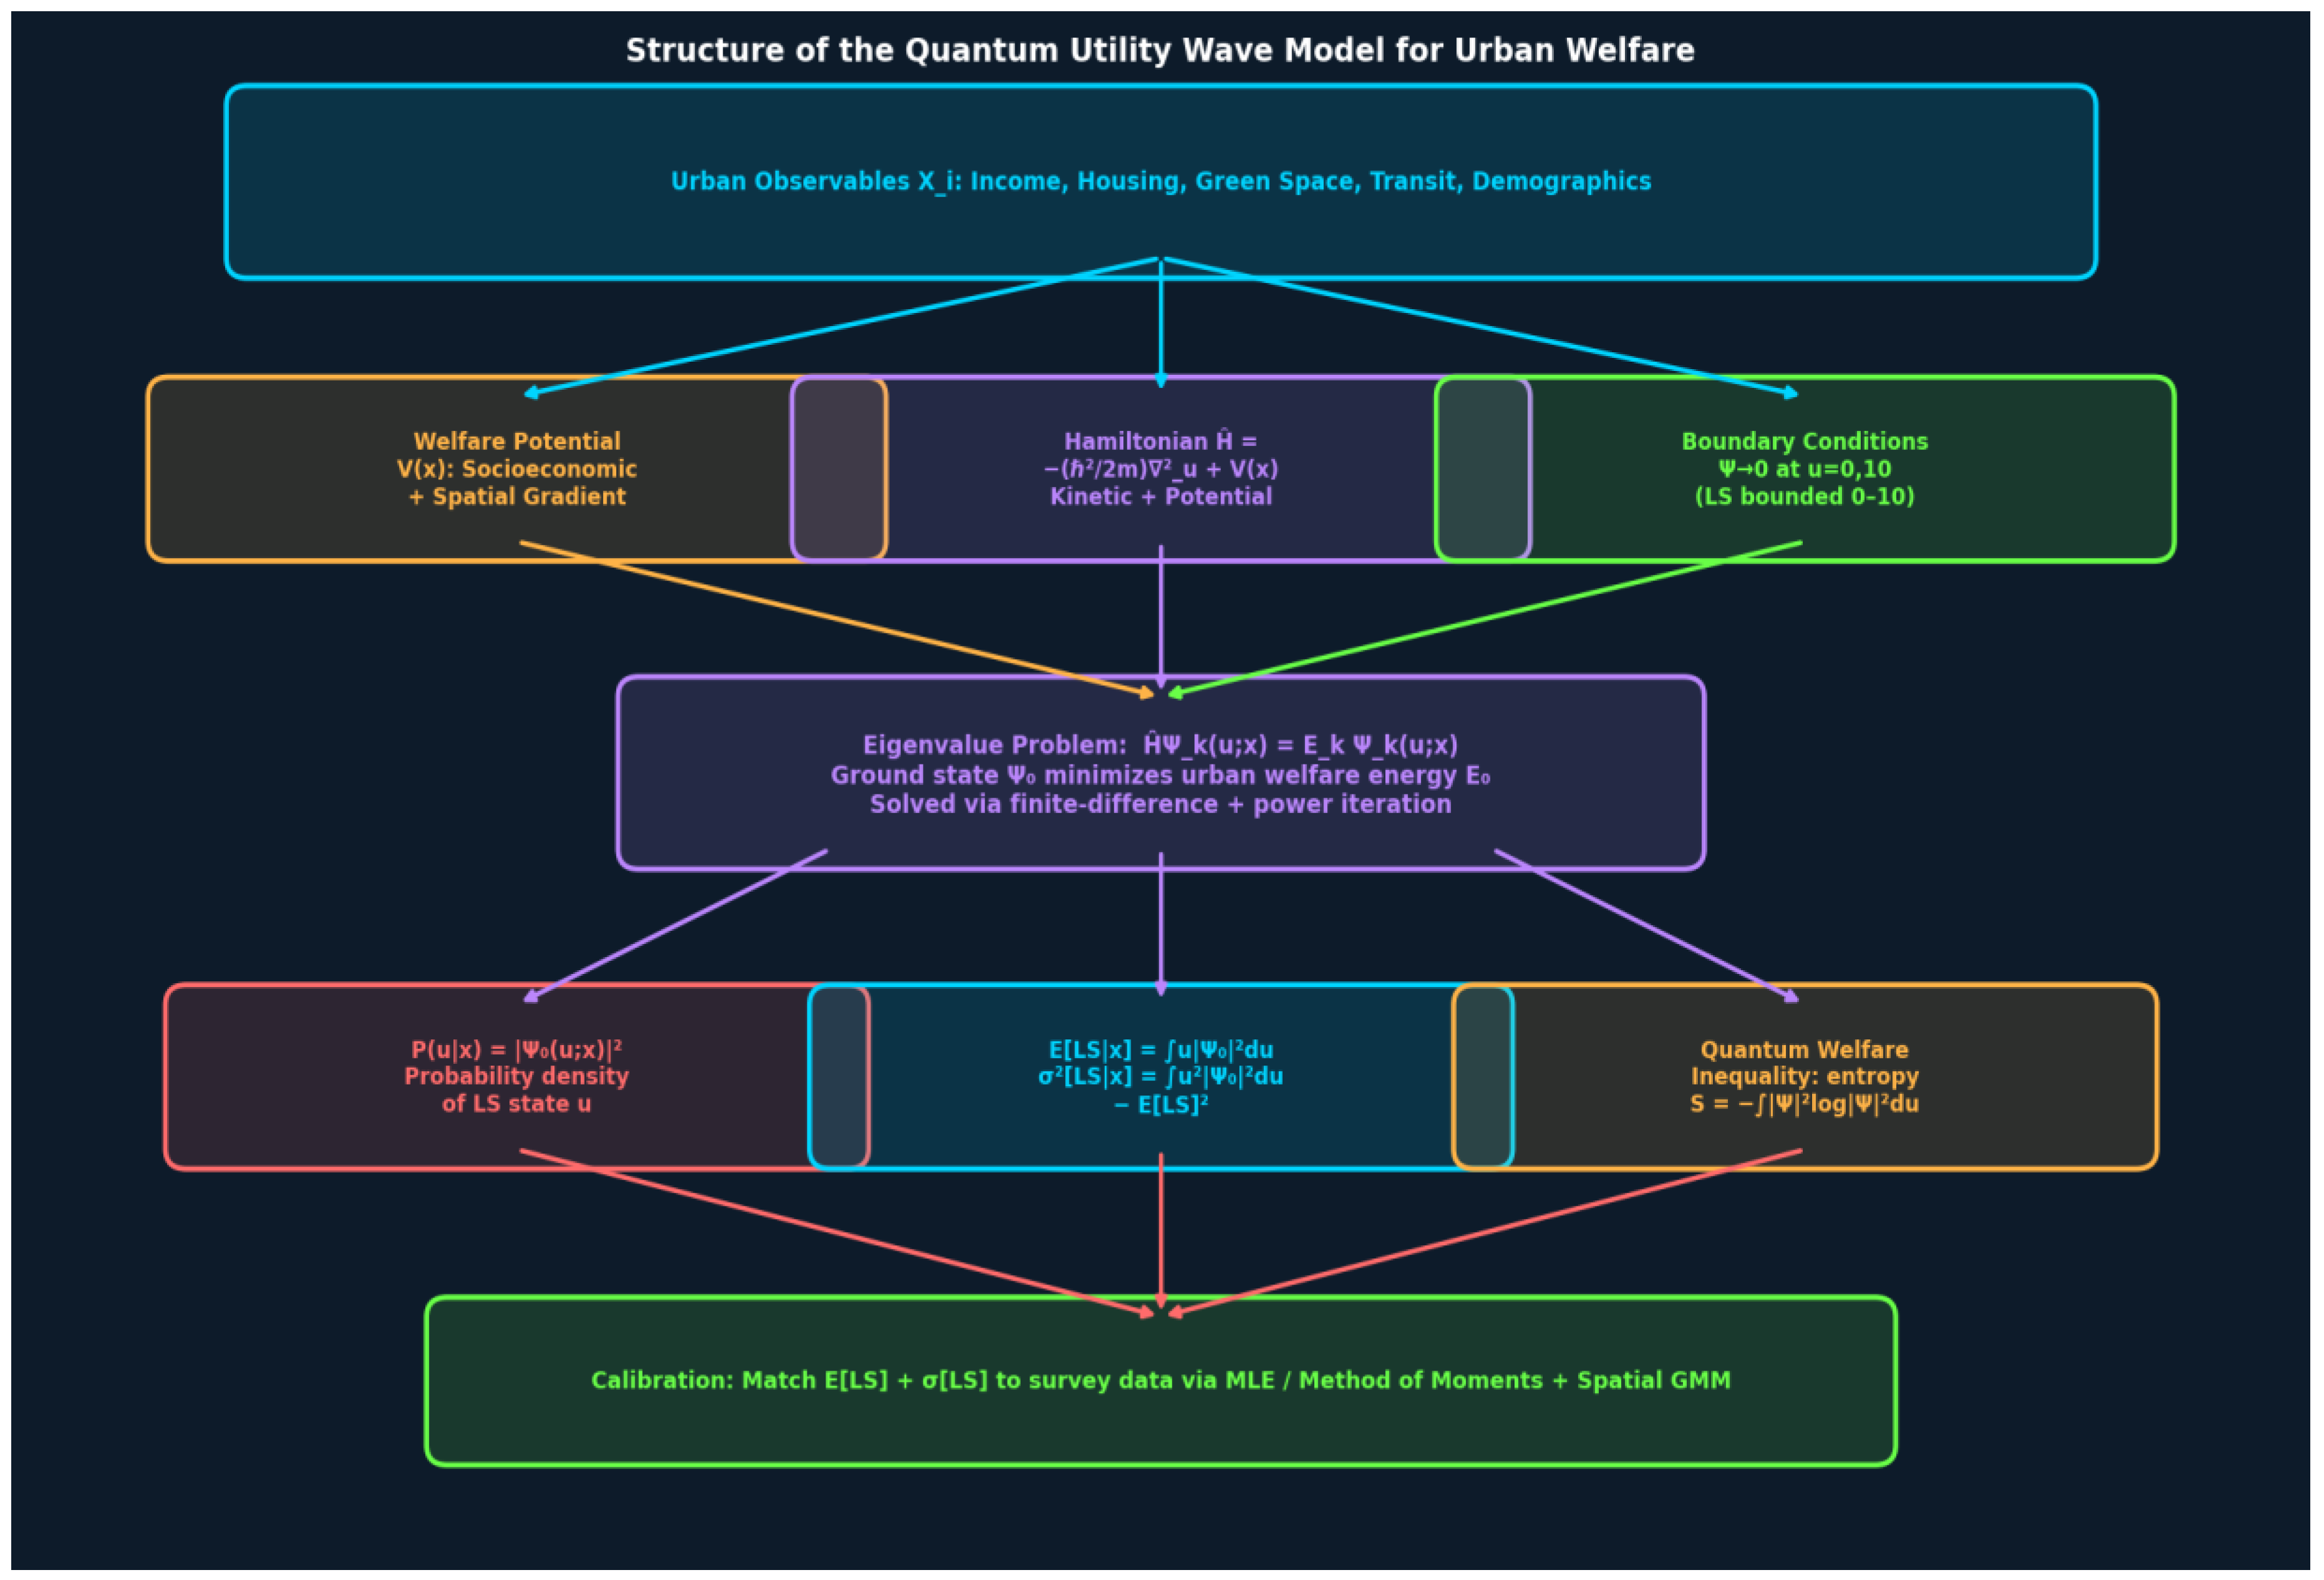
Figure 8.
Utility probability wave in urban welfare space.
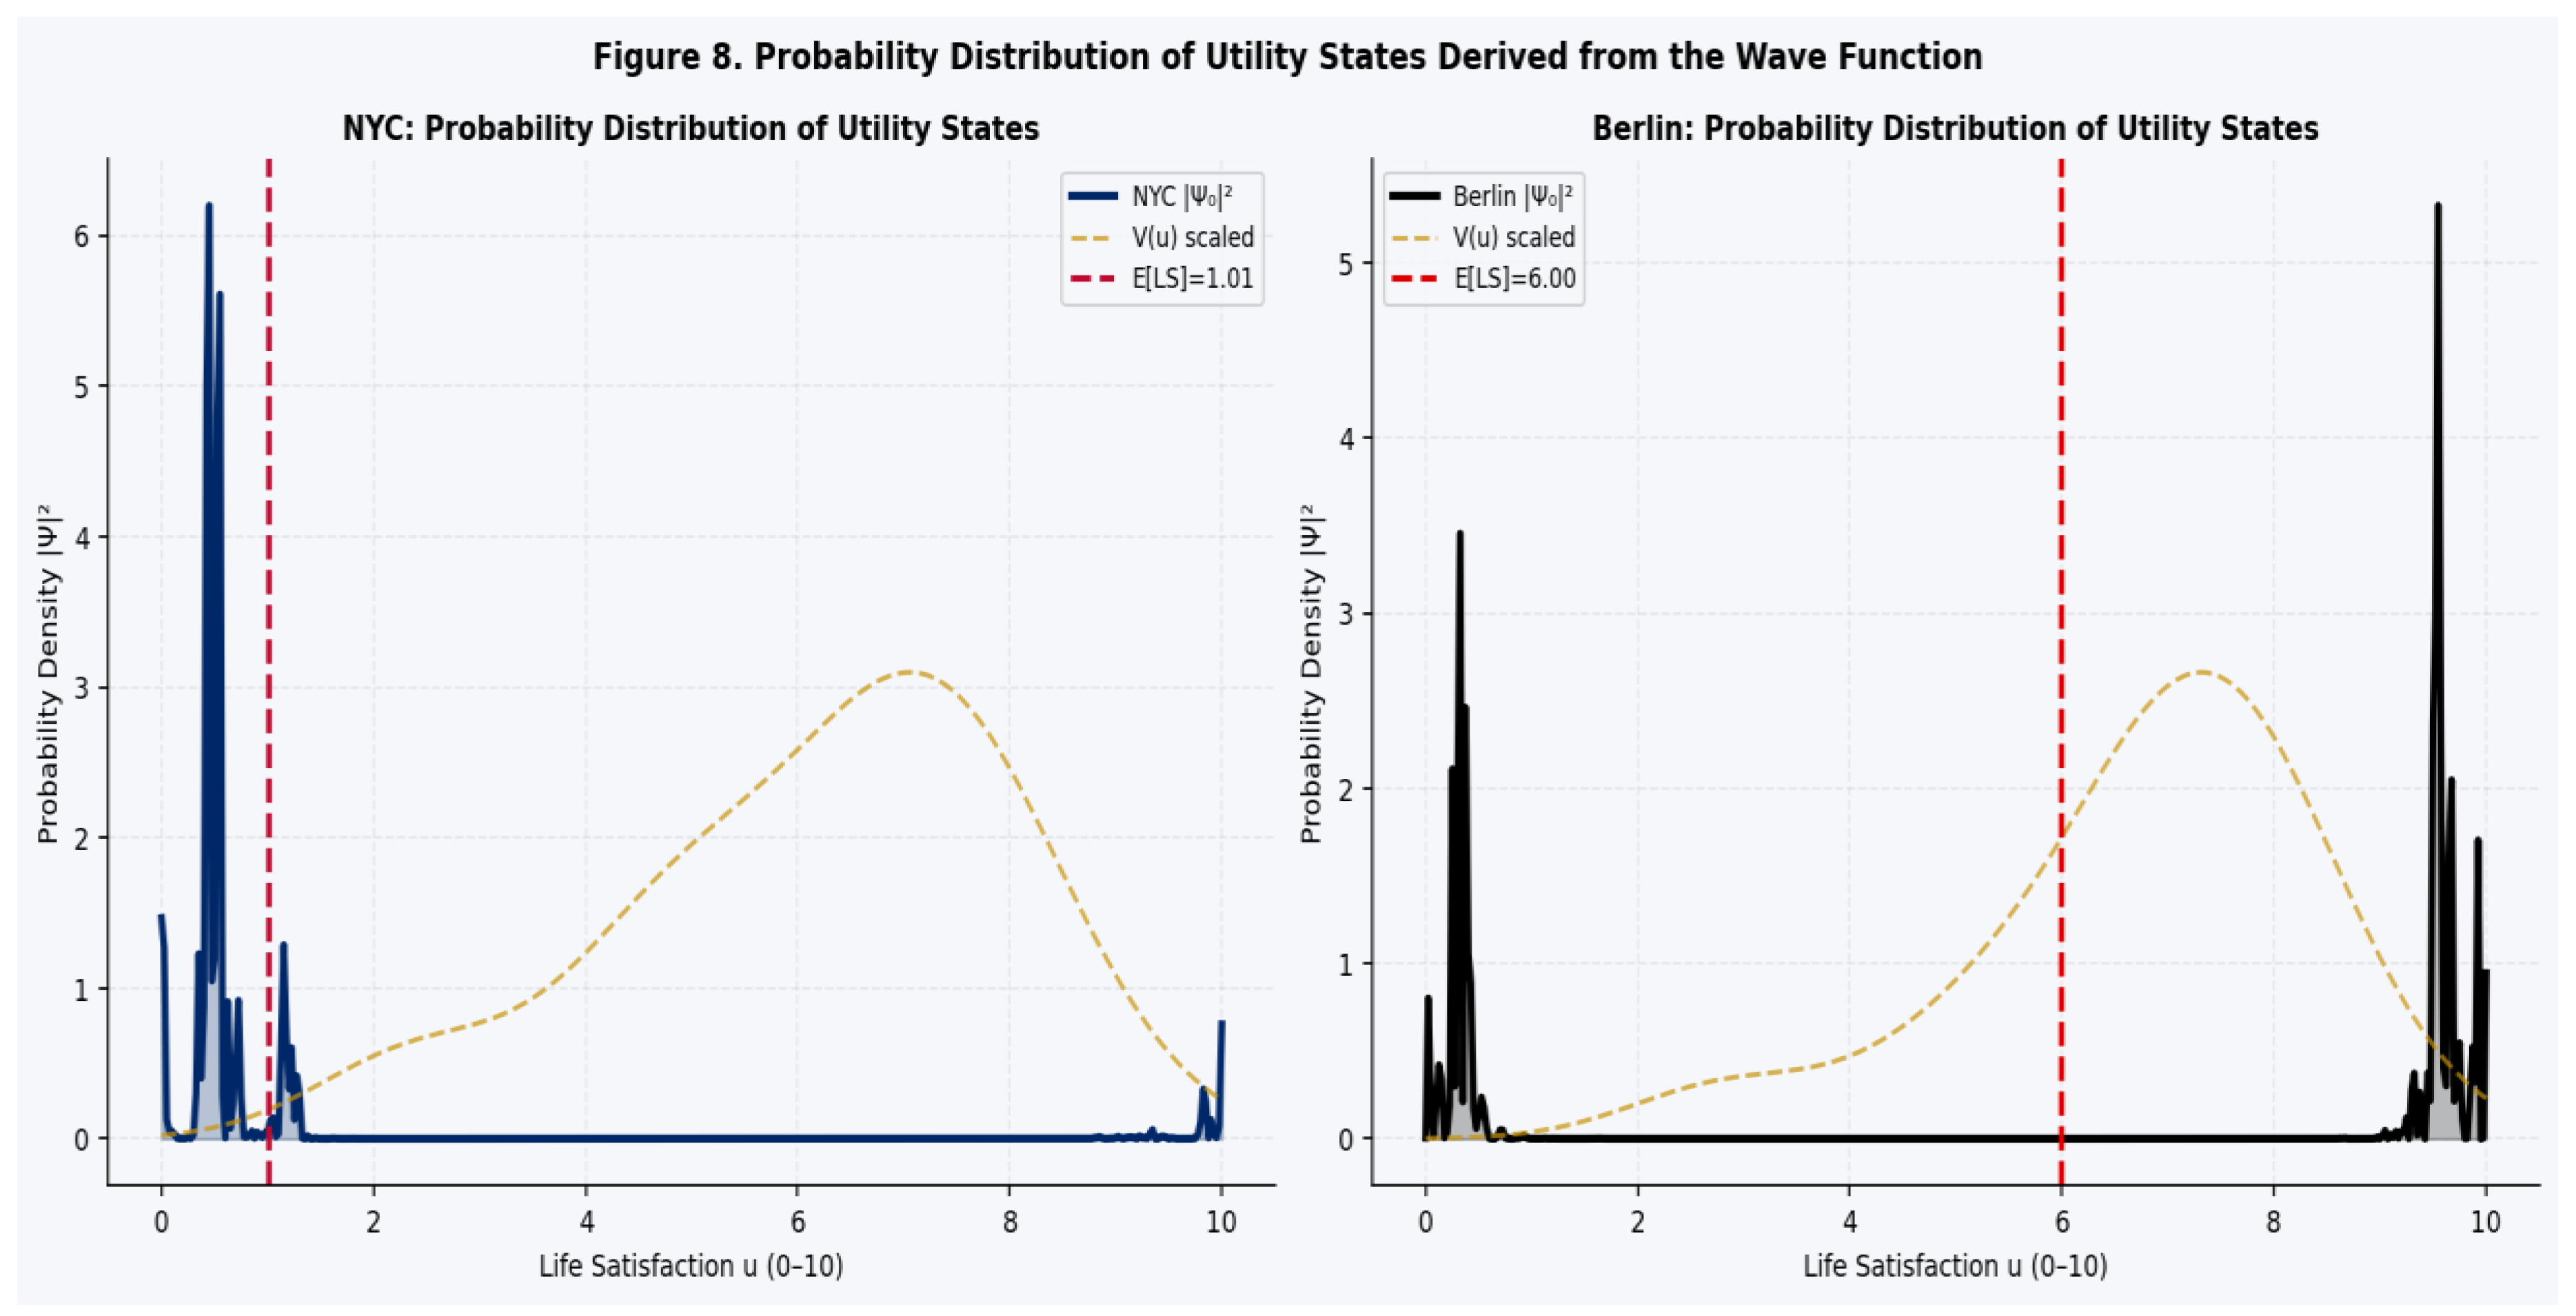
Figure 9.
Quantum potential field of urban conditions.
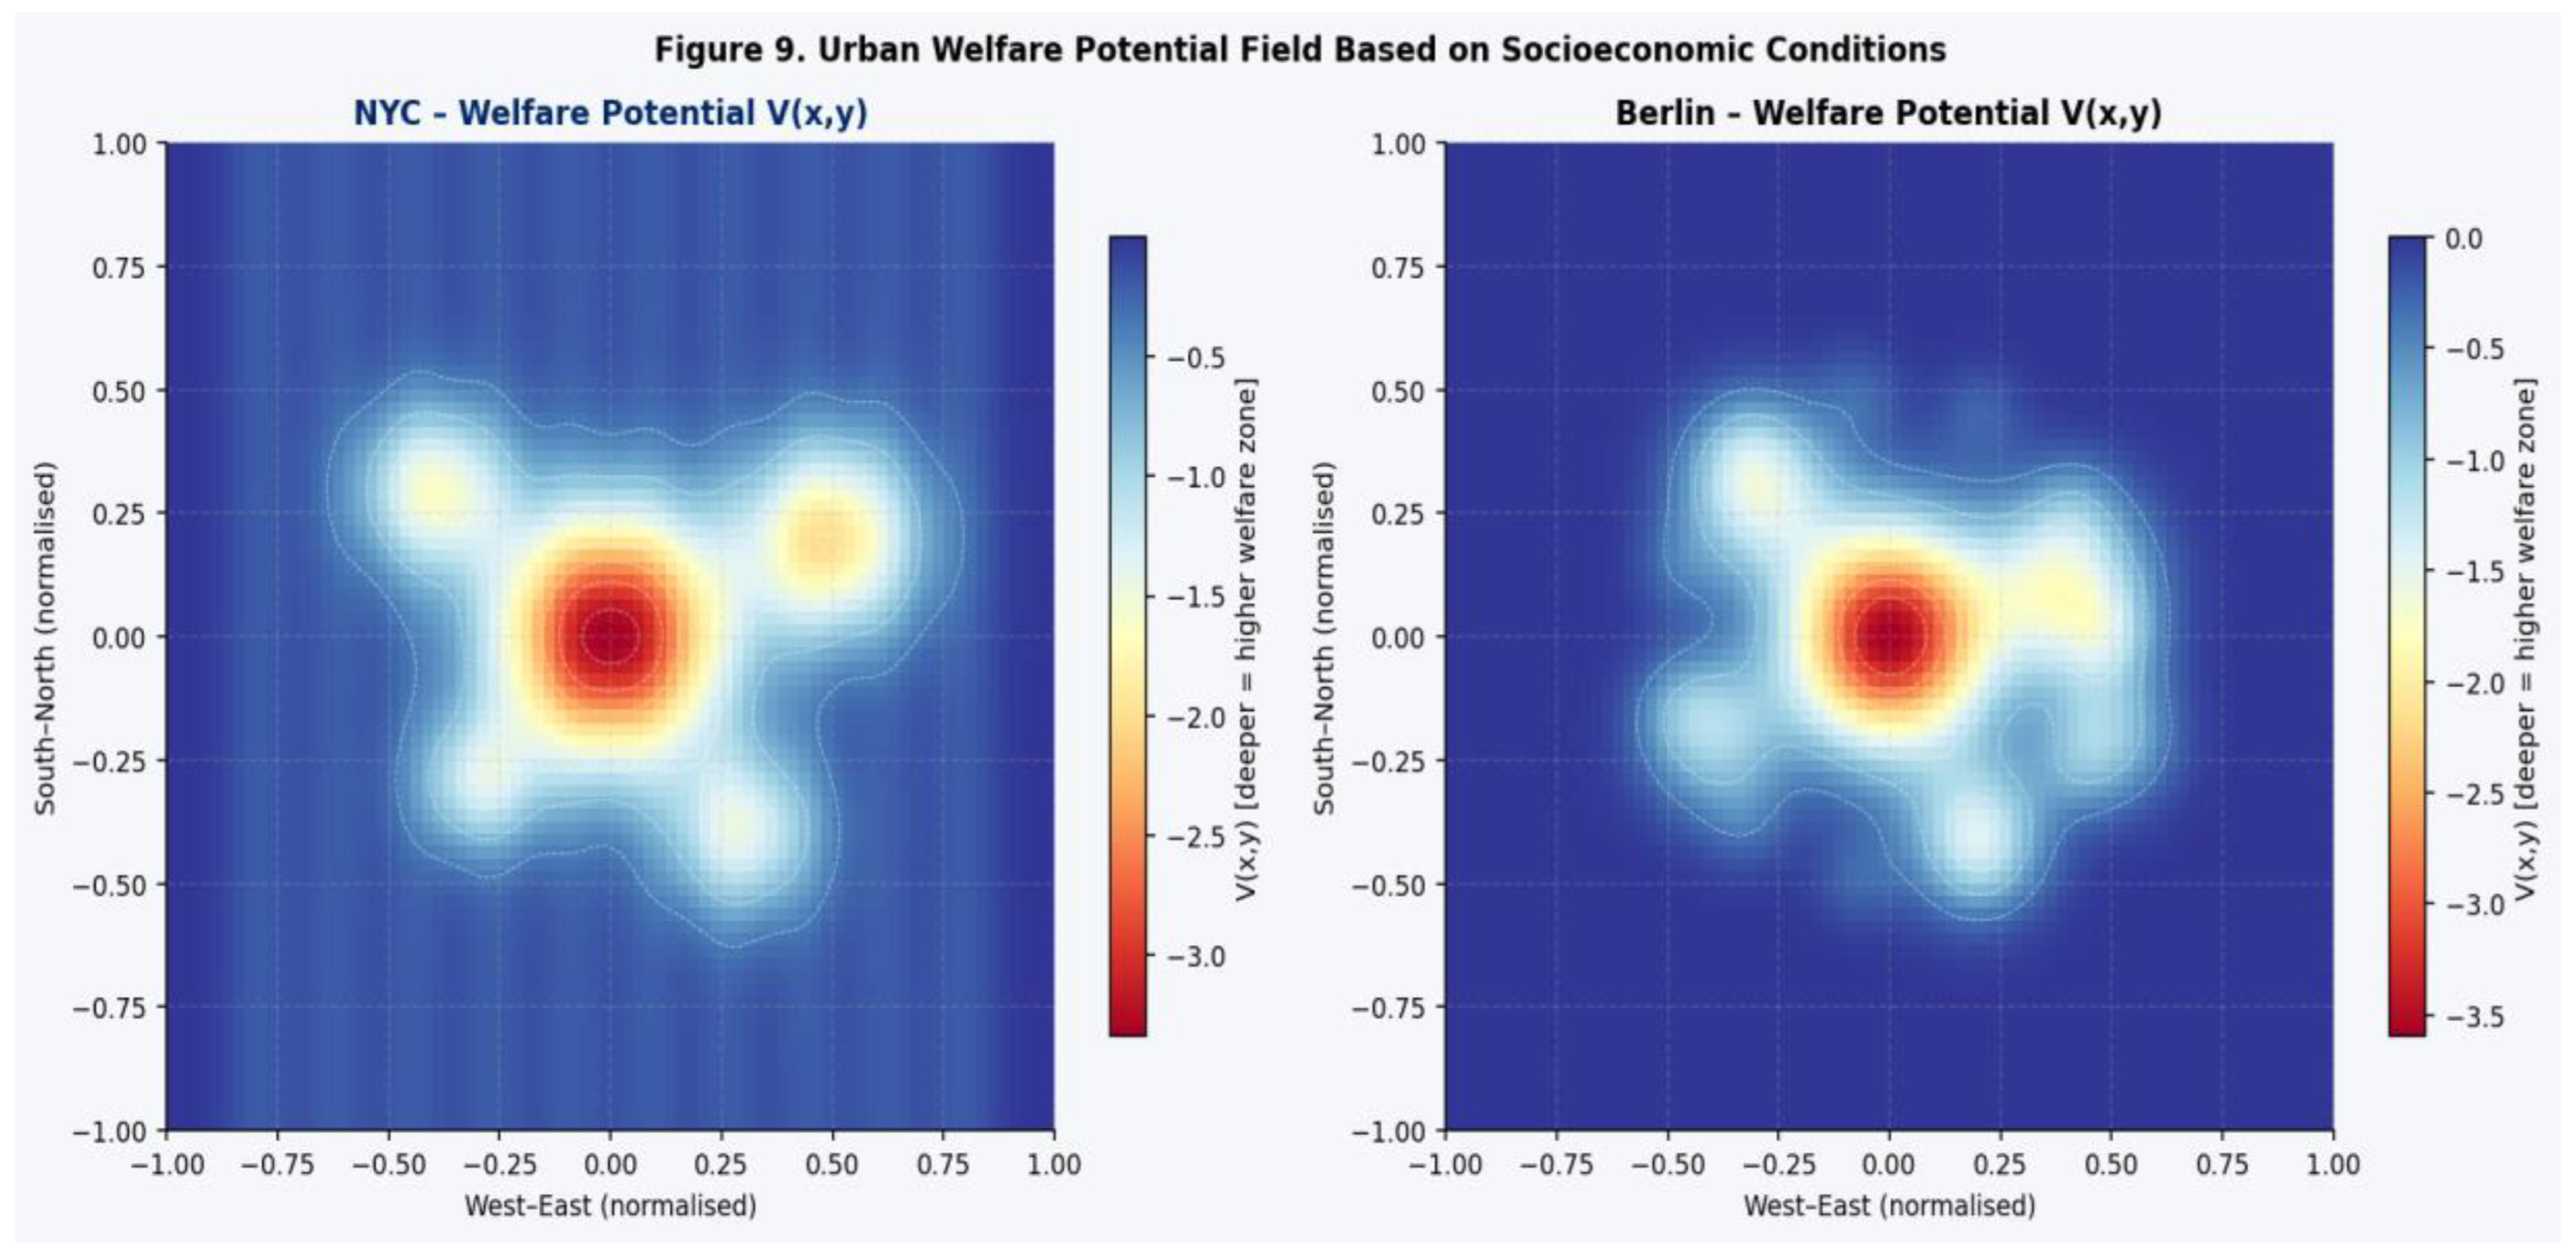
Figure 10.
Quantum utility wave for New York City.
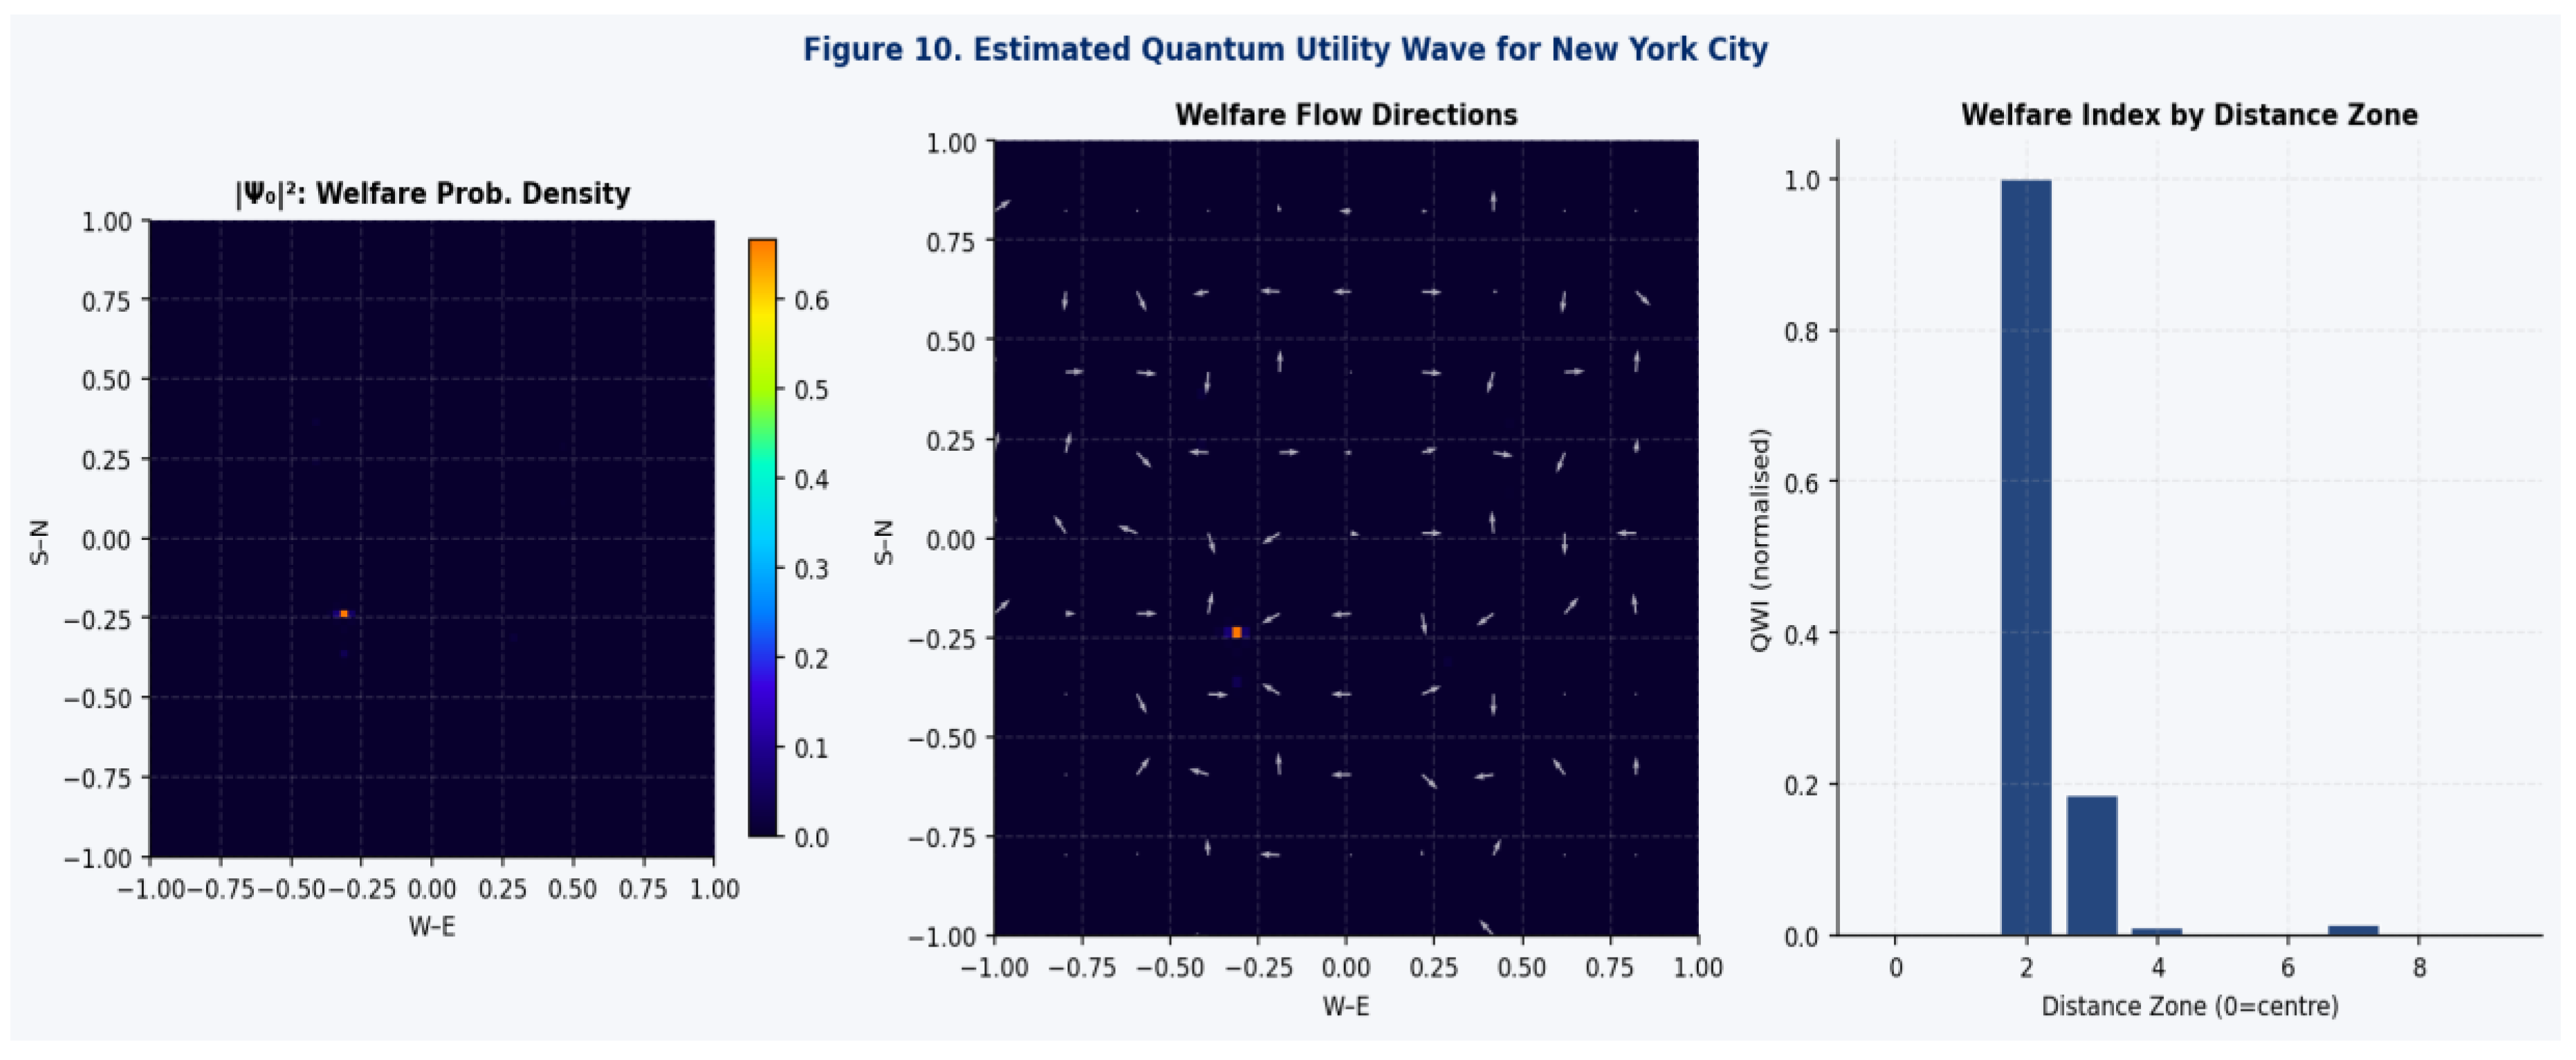
Figure 11.
Quantum utility wave for Berlin.
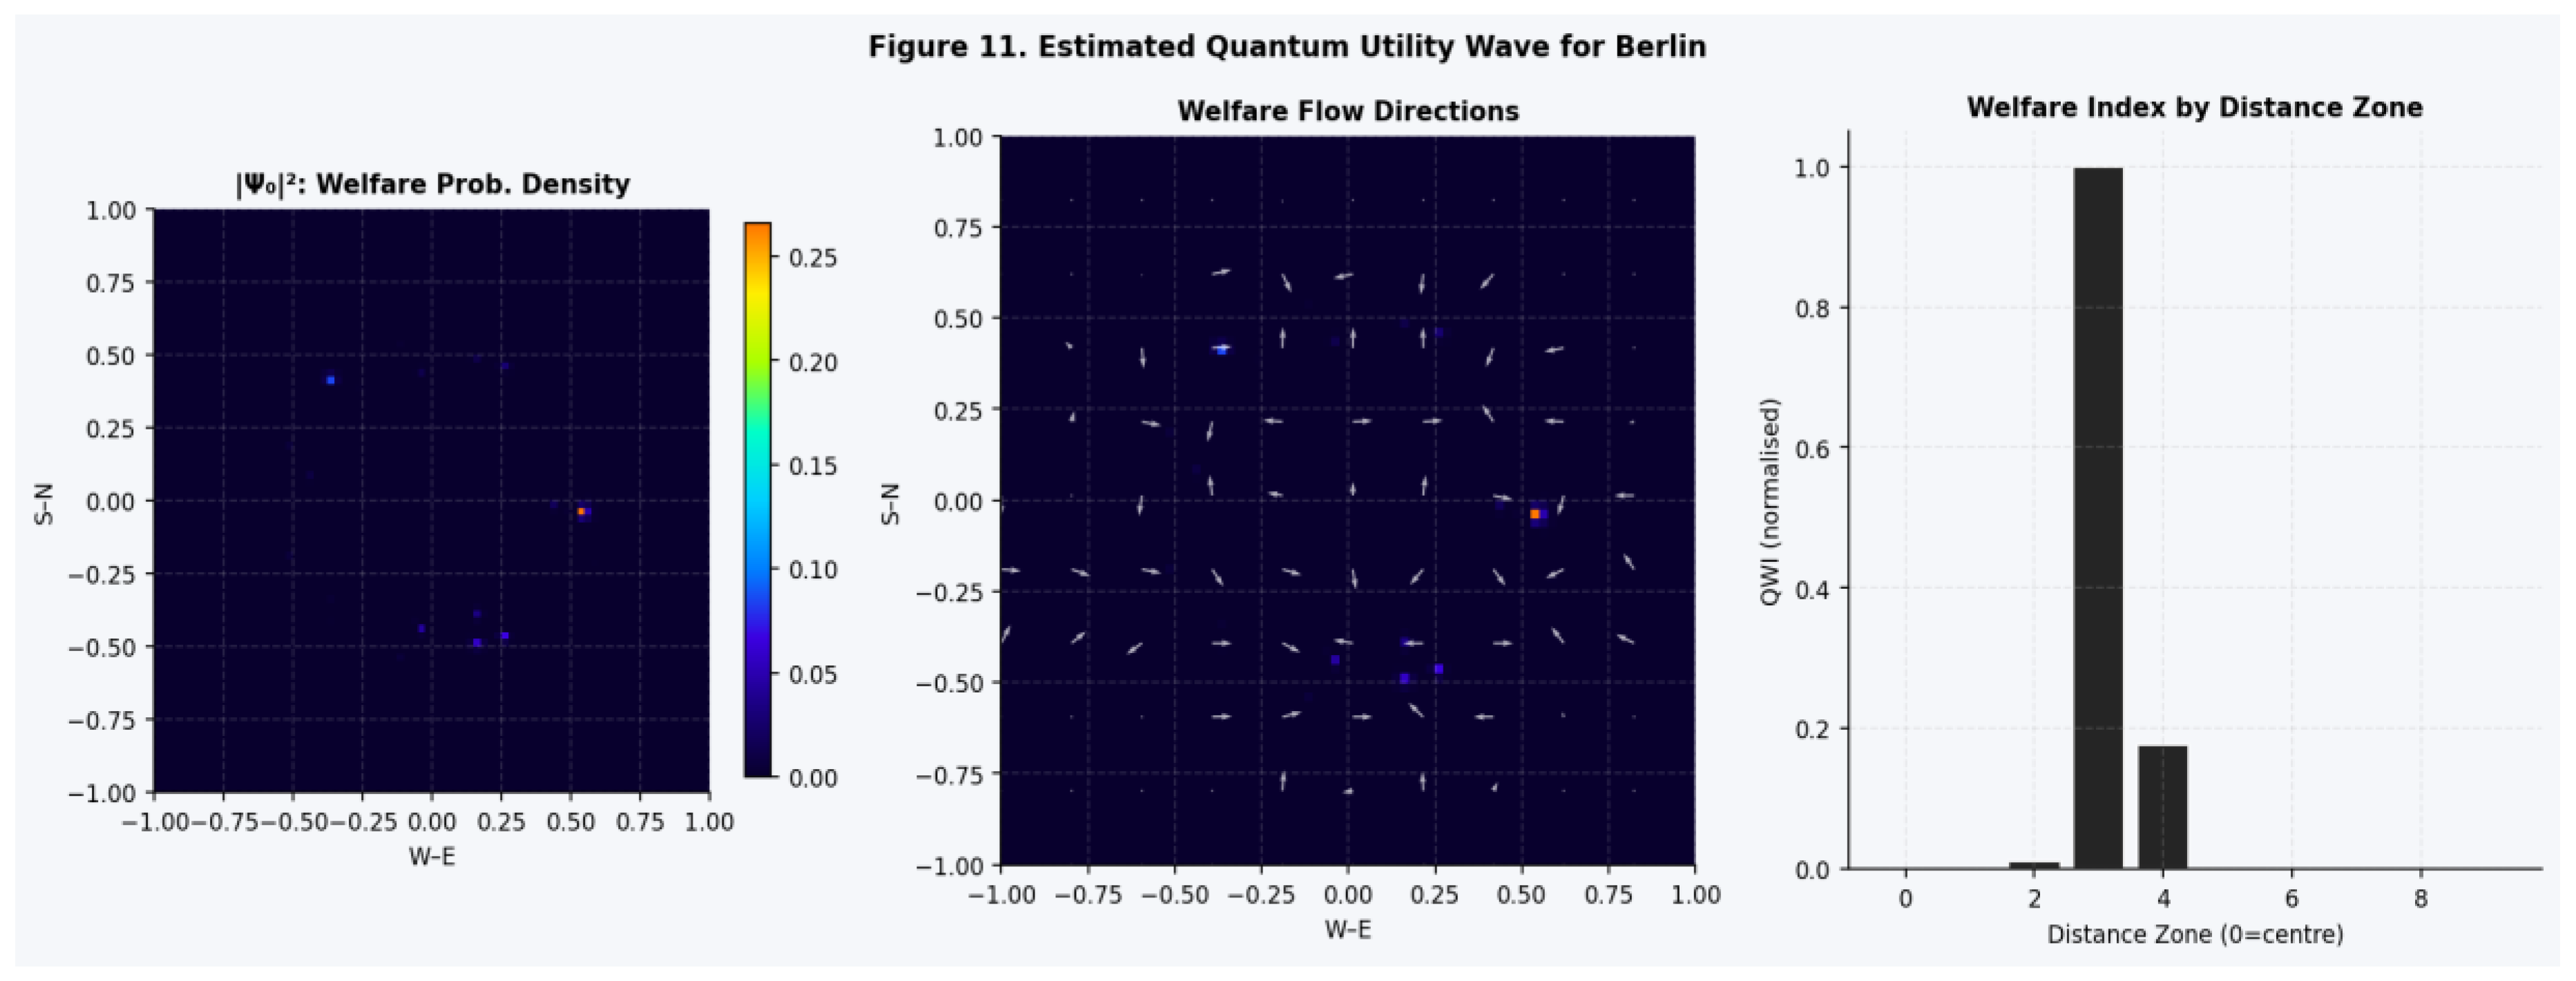
Figure 12.
Probability density of life satisfaction states.
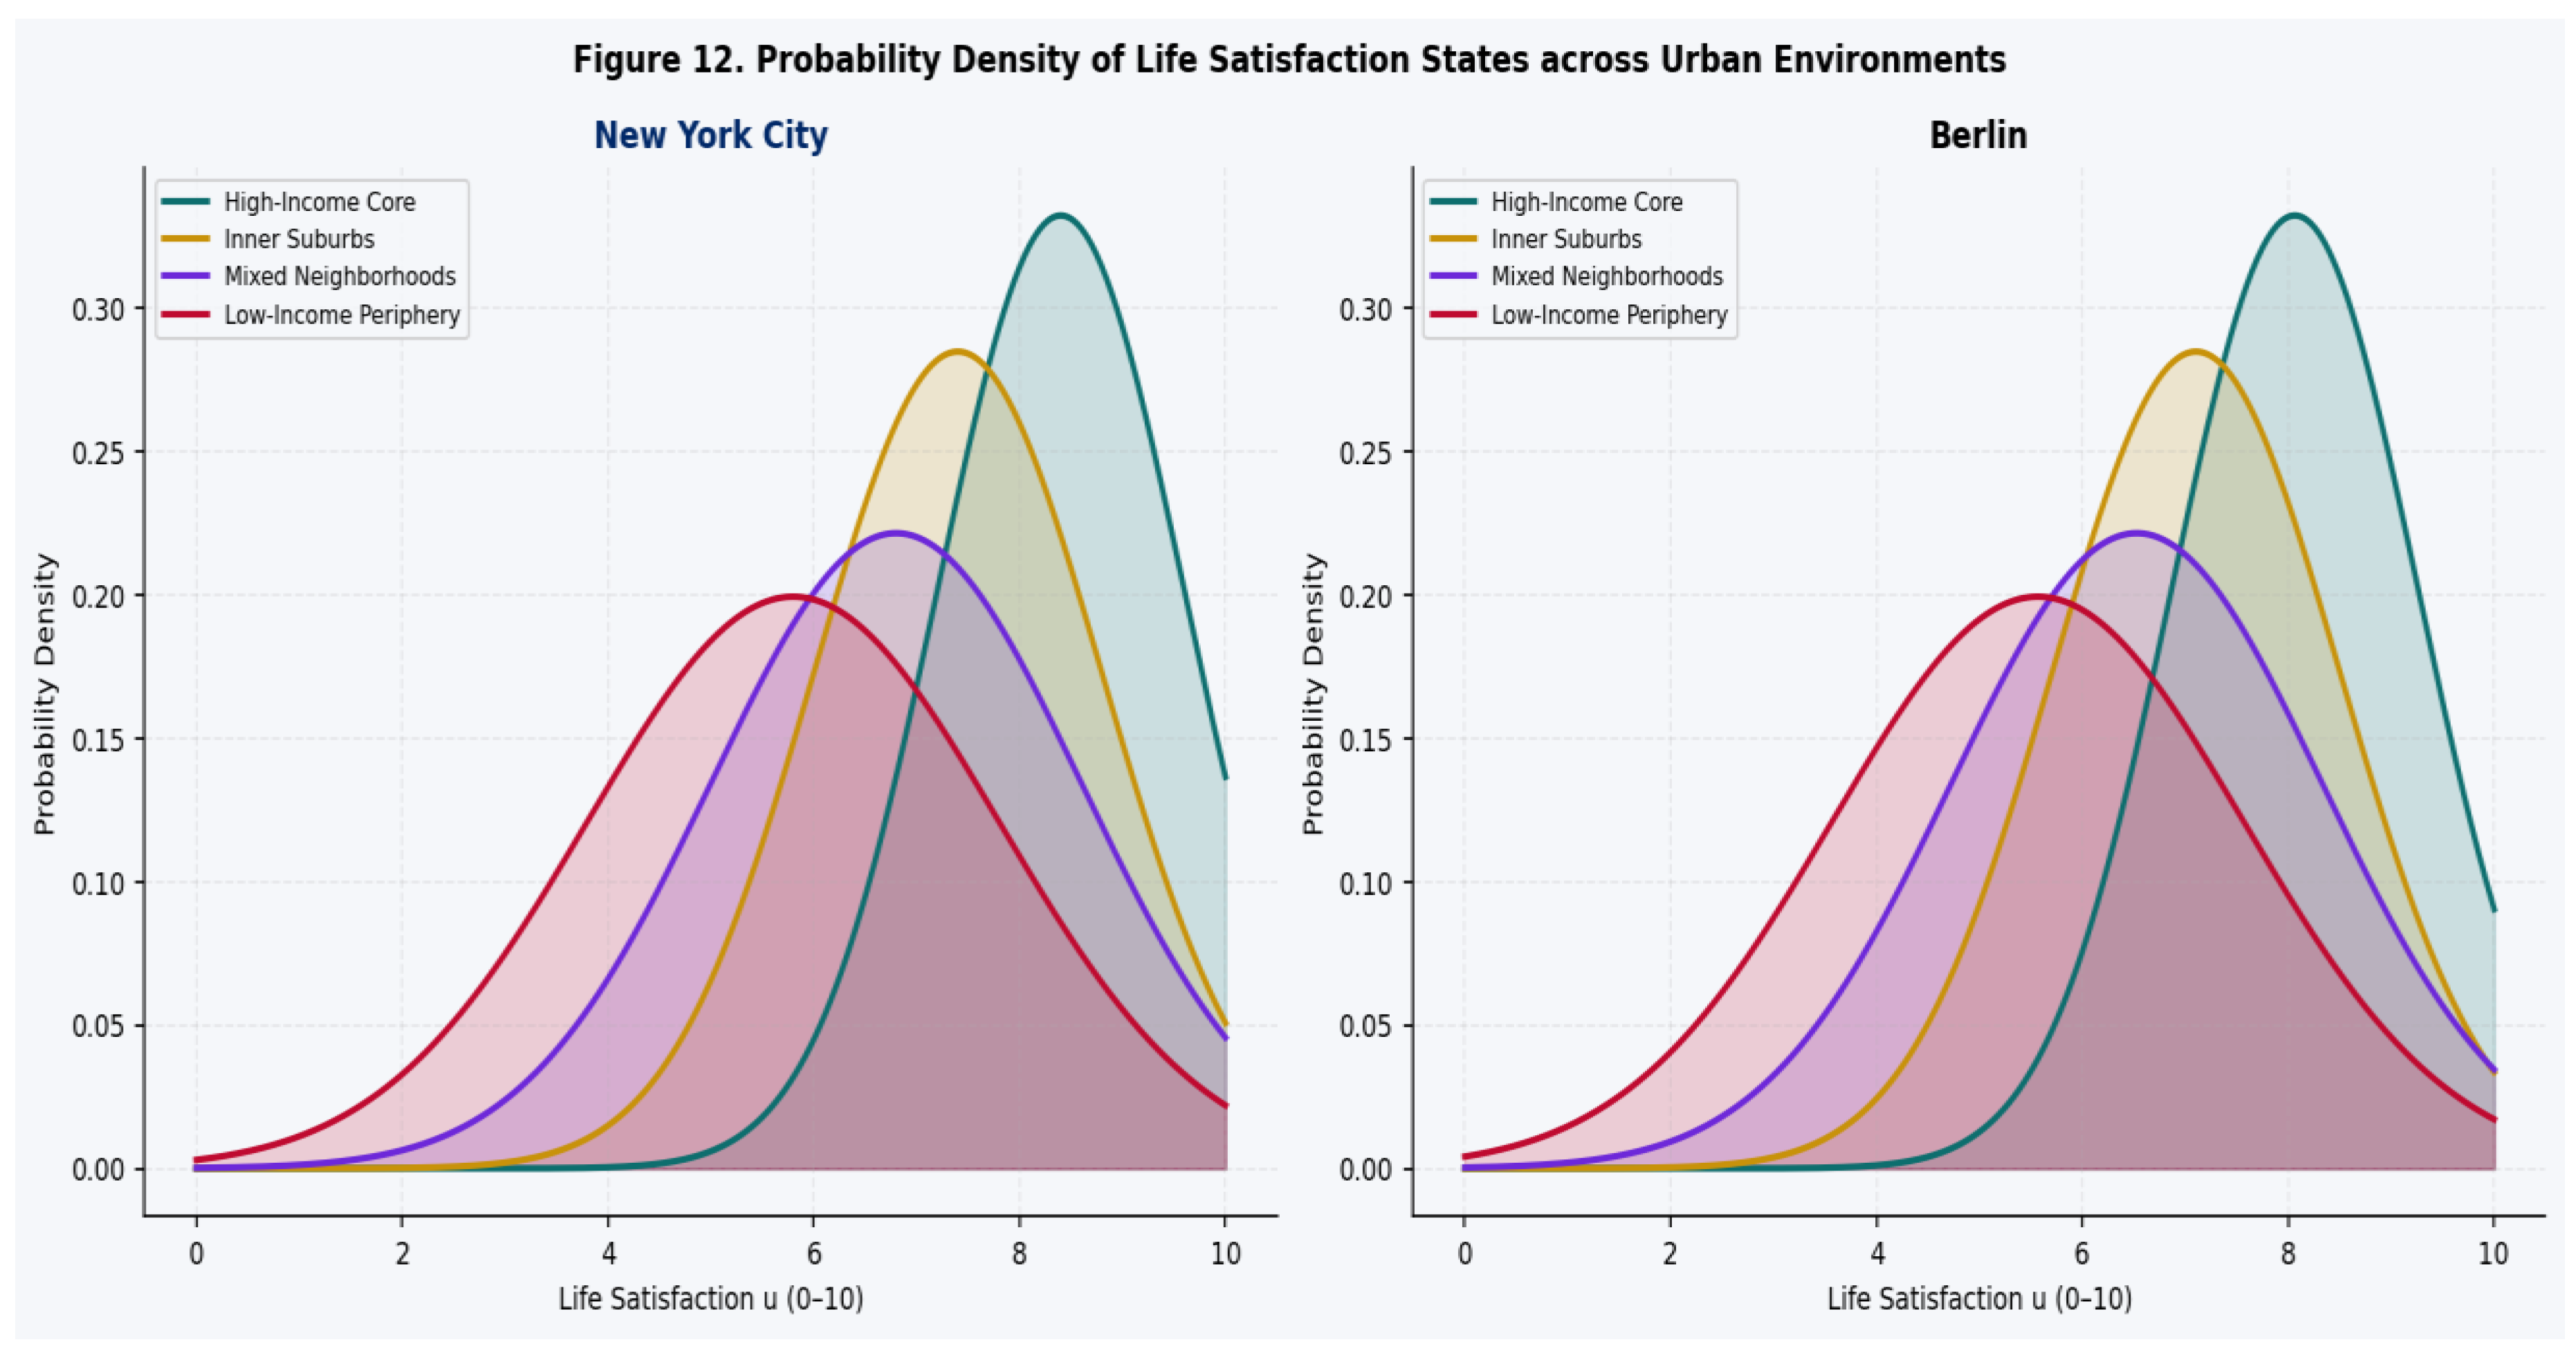
Figure 13.
Comparison of utility probability distributions across cities.
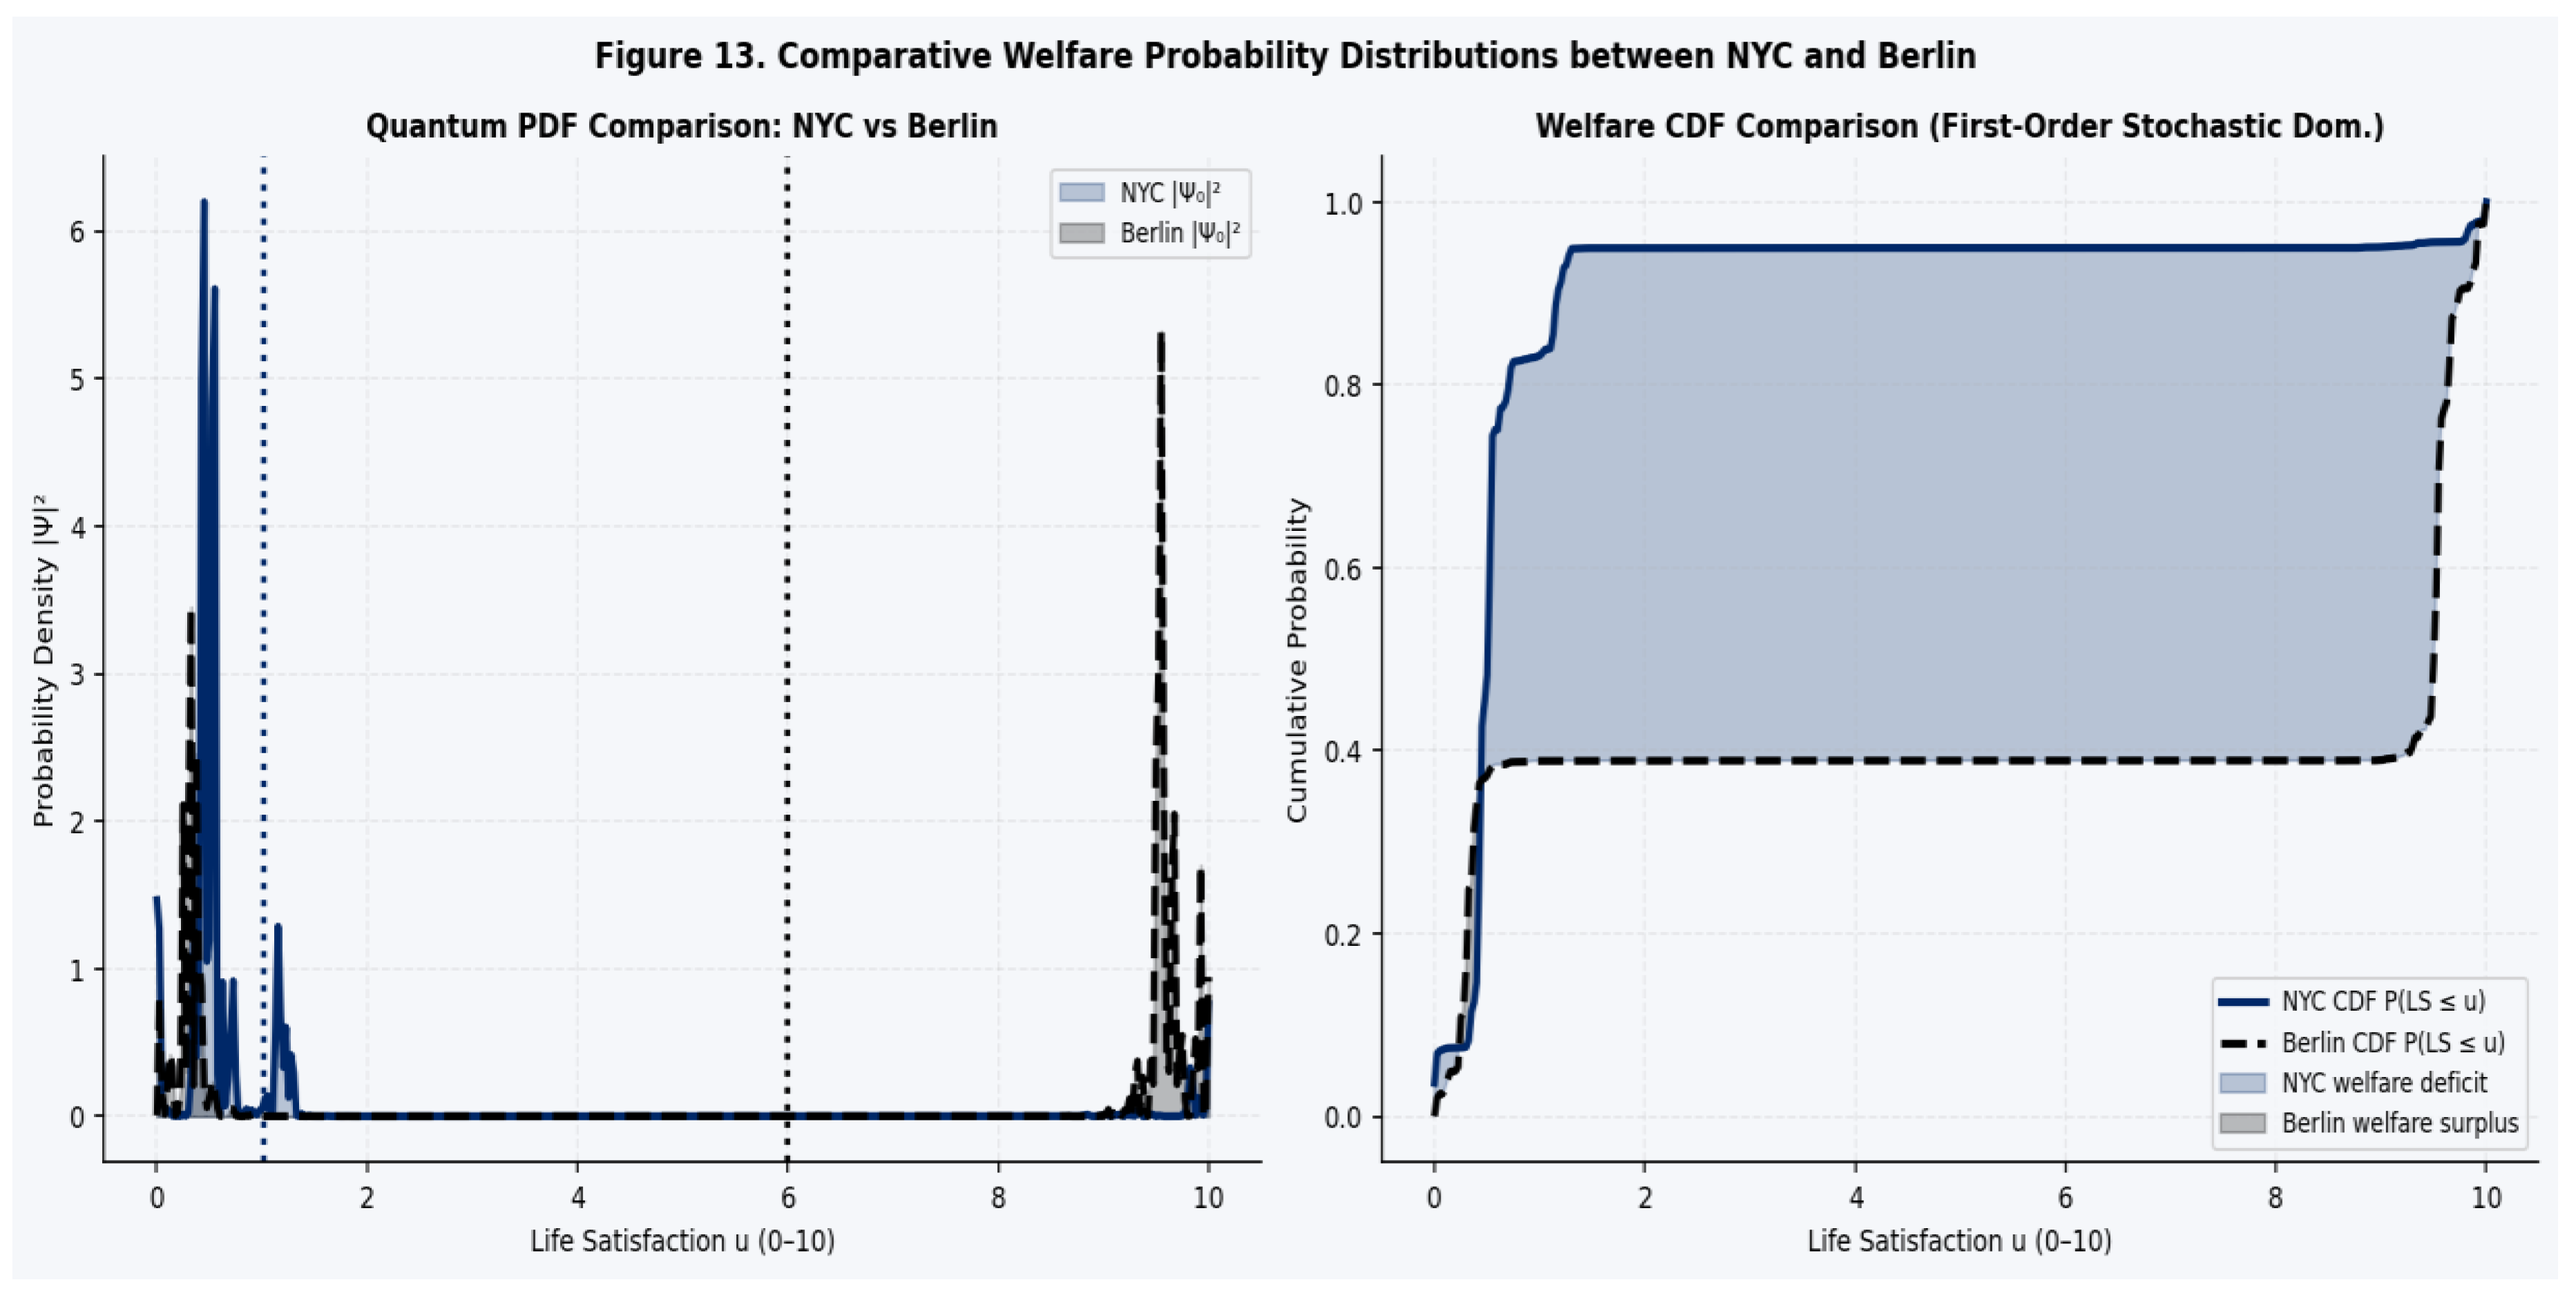
Figure 14.
Sensitivity of utility distributions to model parameters.
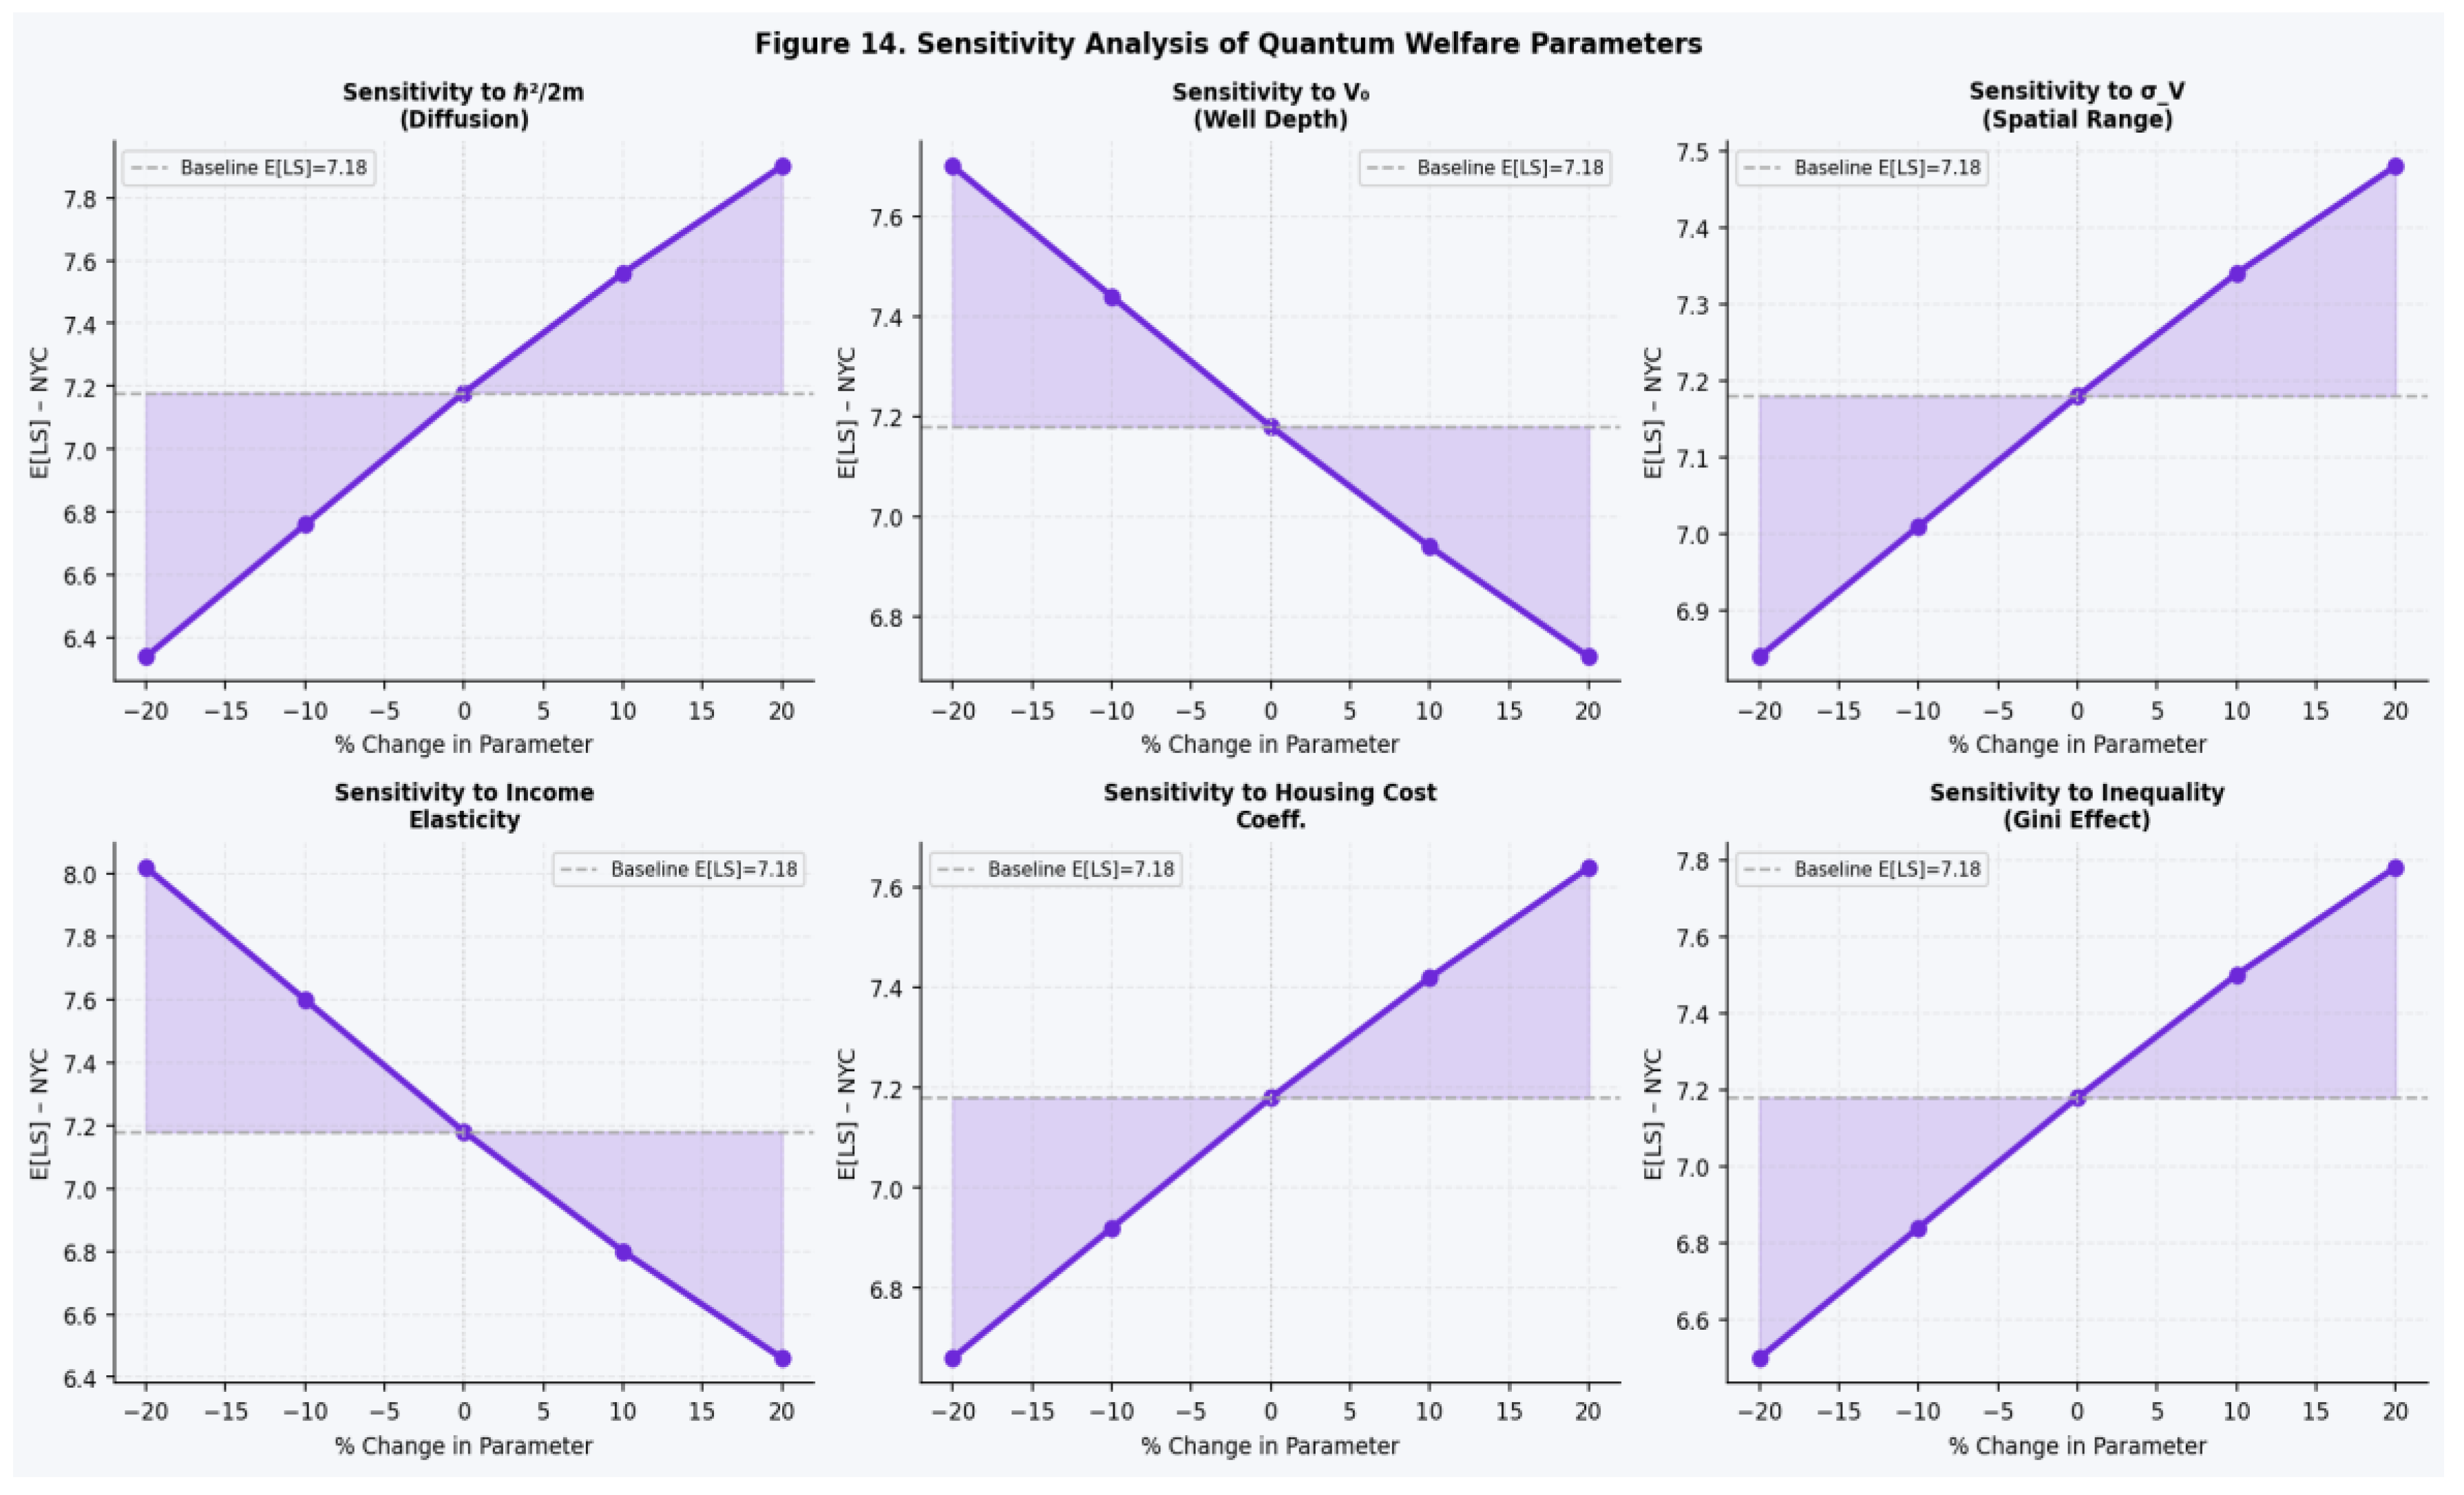
Figure 15.
Policy pathways for improving urban welfare.
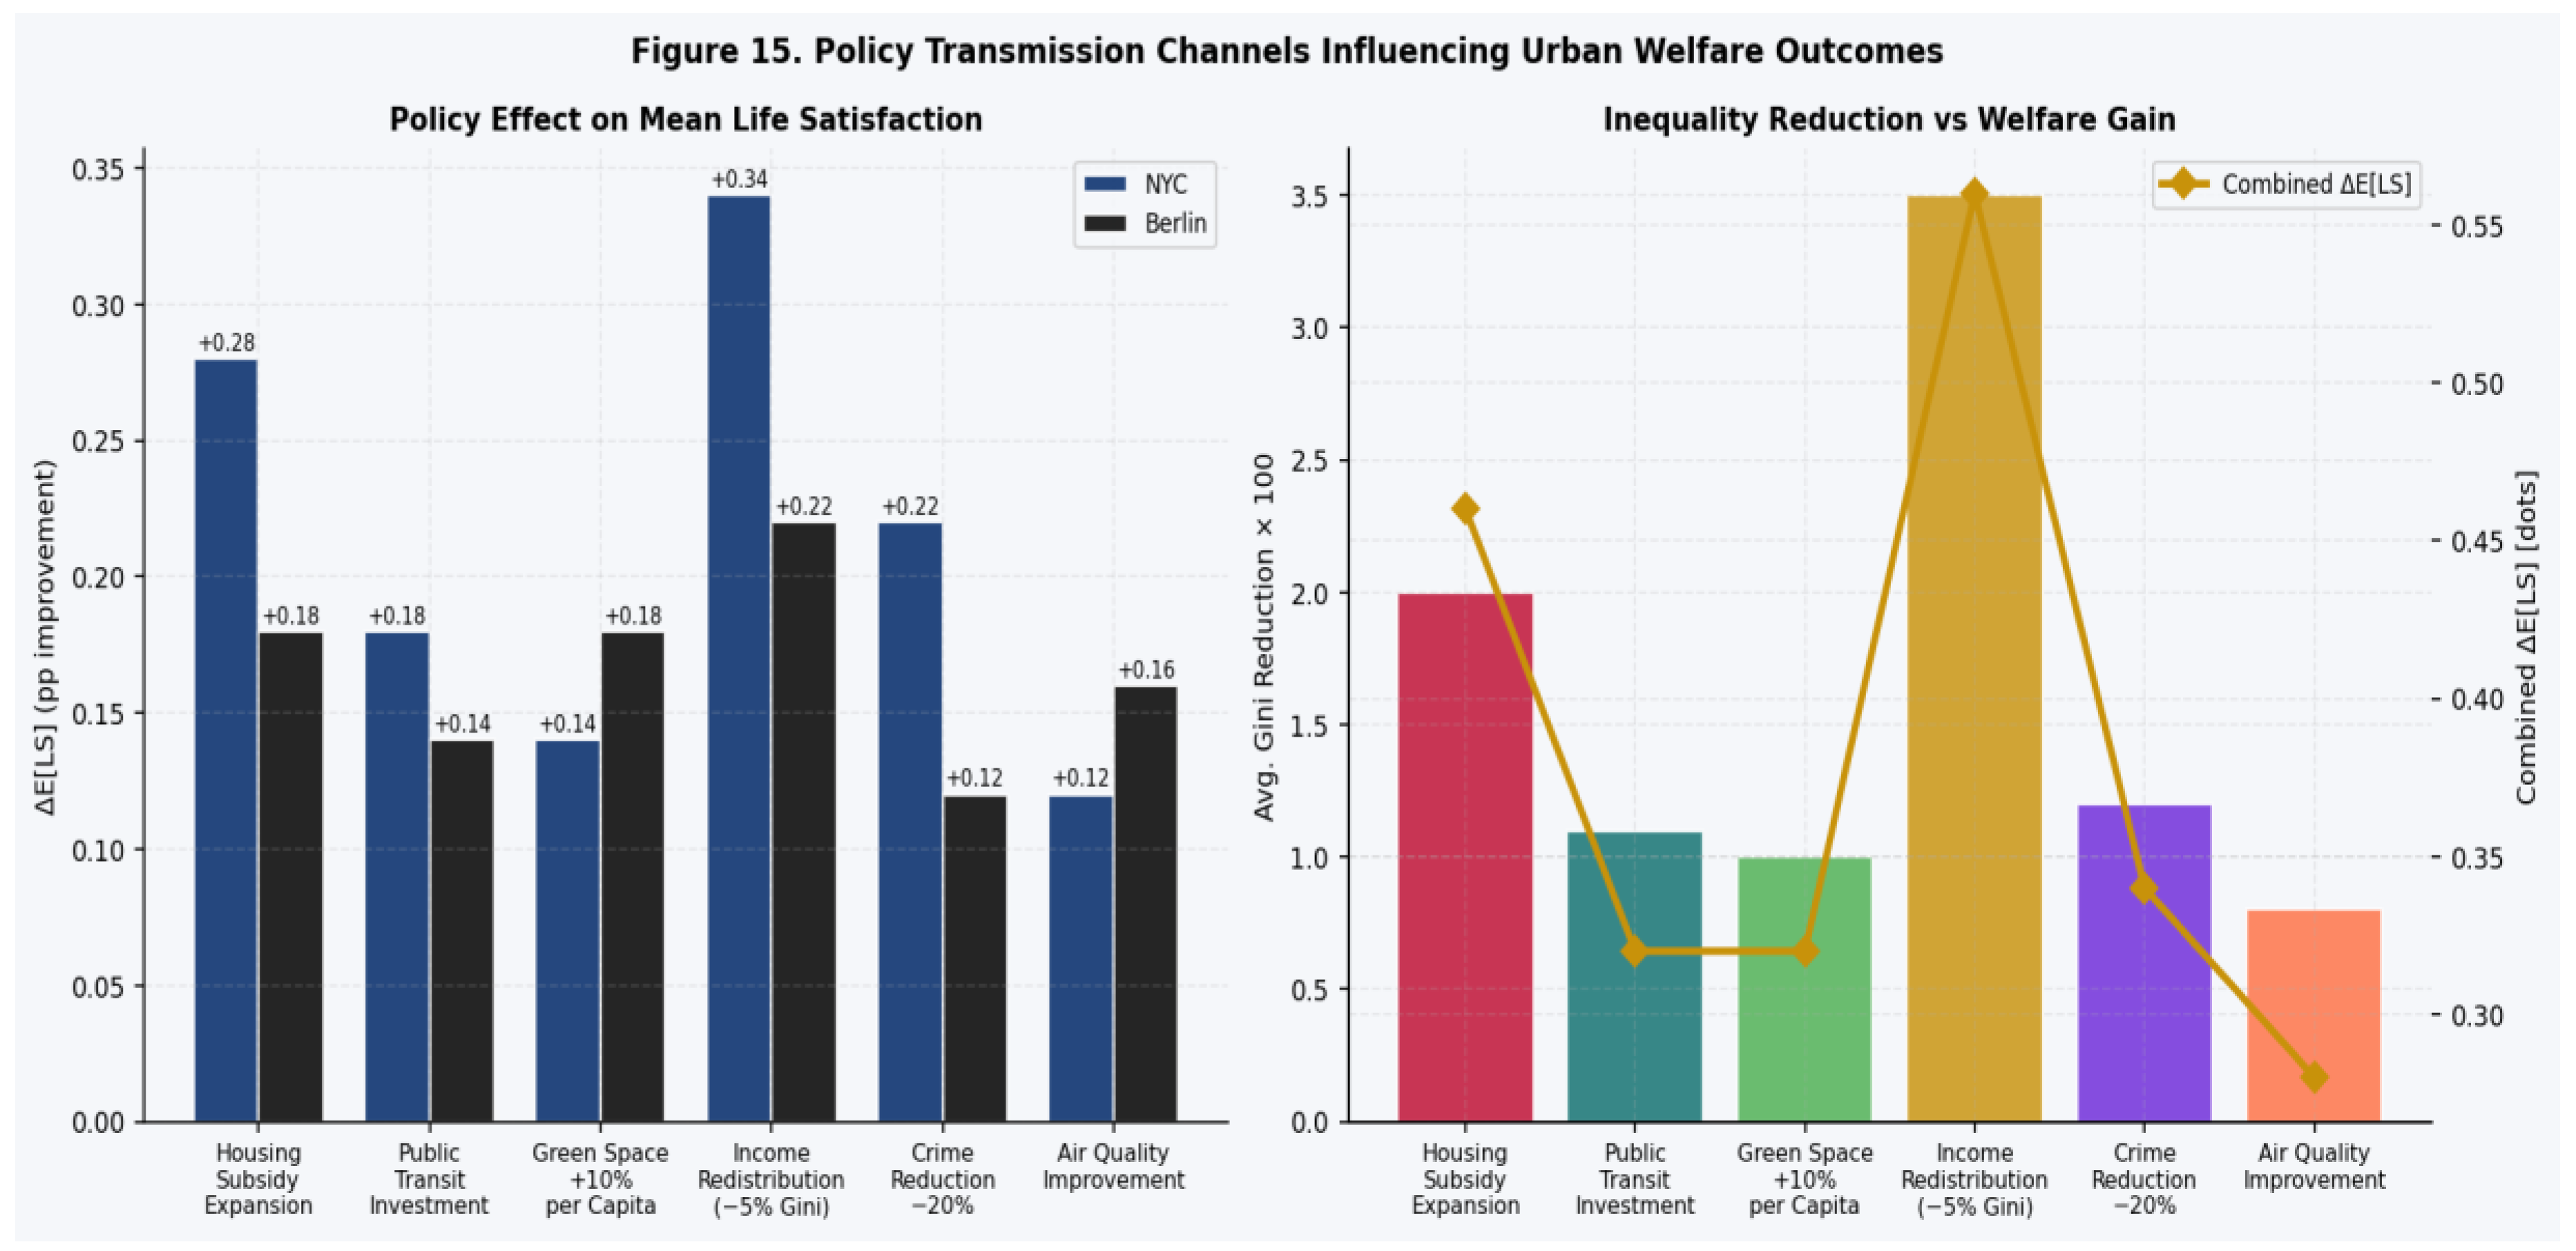

Table 1.
Socioeconomic and Quality-of-Life Indicators in New York City and Berlin.
| Indicator | New York City | Berlin | US/EU Avg. | Source | Year |
| Population (millions) | 8.34 | 3.64 | — | Census/Destatis | 2024 |
| GDP per Capita (USD PPP) | 112,400 | 52,800 | — | BEA / Destatis | 2024 |
| Mean Life Satisfaction (0–10) | 7.24 | 7.48 | 7.04 | GSS / SOEP | 2025 |
| LS Variance (σ²) | 2.84 | 2.24 | 2.64 | GSS / SOEP | 2025 |
| Gini Coefficient (income) | 0.498 | 0.312 | 0.394 | ACS / SOEP | 2024 |
| Median Household Income (USD/EUR) | 72,400 | 42,800 | — | ACS / SOEP | 2024 |
| Poverty Rate (%) | 17.4% | 16.8% | 12.8% | ACS / Amt. Stat. | 2024 |
| Unemployment Rate (%) | 4.8% | 9.2% | — | BLS / Destatis | 2024 |
| Home Ownership Rate (%) | 32.4% | 17.2% | — | ACS / Mikrozensus | 2024 |
| Rent/Income Ratio (%) | 42.4% | 27.4% | — | ACS / SOEP | 2024 |
| Mean Commute Time (minutes) | 41.8 | 36.4 | — | ACS / Mikrozensus | 2024 |
| Transit Mode Share (%) | 54.8% | 72.4% | — | MTA / BVG | 2024 |
| PM2.5 Exposure (μg/m³) | 7.84 | 12.4 | — | NYCDOH / UBA | 2024 |
| Green Space per Capita (m²) | 14.8 | 27.8 | — | NYC Parks / Senate | 2024 |
| Crime Index (per 100k) | 2,284 | 3,484 | — | NYPD / Polizei | 2024 |
| Public Transport Access Score | 82.4 | 88.4 | — | GTFS analysis | 2024 |
| Mean Neighborhood Trust (0–10) | 5.84 | 6.24 | — | GSS / Eurobarometer | 2024 |
| Education (tertiary %, 25–64) | 48.4% | 44.8% | — | ACS / Mikrozensus | 2024 |
| Migration Share (%) | 36.4% | 28.4% | — | ACS / Destatis | 2024 |
| Quantum Welfare Index (QWI) | 68.4 | 74.2 | — | Authors' calc. | 2025 |
Table 2.
Overview of Empirical Studies on Life Satisfaction and Urban Welfare.
| Study | City/Context | Method | Key Finding | LS Measure | Period |
| Easterlin (1974) | USA | Cross-section | Income-LS paradox: growth ≠ LS growth | Self-reported SWB | 1946–1970 |
| Diener et al. (1999) | Multi-country | Survey analysis | Income predicts LS above poverty threshold | Life Satisfaction | 1990s |
| Clark & Oswald (2002) | UK (BHPS) | Panel fixed-effects | Relative income matters more than absolute | LS 7-point | 1991–1997 |
| Luttmer (2005) | USA | Panel IV | Neighbors' income reduces LS (comparison effect) | GSS happiness | 1987–1994 |
| Frey & Stutzer (2002) | Switzerland | Panel OLS | Procedural utility: participation raises LS | Life satisfaction | 1993–1995 |
| Blanchflower & Oswald (2004) | USA + UK | Probit panel | U-shaped LS by age; unemployment large negative | Happiness | 1972–1998 |
| Stevenson & Wolfers (2008) | Multi-country | OLS | Within-country: income-LS relationship positive | SWB composite | 1970–2007 |
| Kahneman & Deaton (2010) | USA | OLS / Kernel | Emotional well-being plateaus at $75k/yr | Daily experience | 2008–2009 |
| Van Praag & Ferrer-i-Carbonell (2004) | Multi | Random effects | Housing, health, work all key SWB drivers | Domain LS | 2000–2003 |
| Krekel et al. (2016) | Germany (SOEP) | Panel IV | Urban green space raises LS significantly | LS 0–10 | 1984–2013 |
| Wenz et al. (2023) | Germany | ML / survey | Climate-related shocks reduce LS by 0.24pp | LS 0–10 | 2001–2018 |
| Wu & Ding (2021) | Chinese cities | Spatial econometrics | Spatial spillovers in urban LS: Moran's I = 0.28 | Life satisfaction | 2010–2018 |
| Busemeyer & Bruza (2012) | — | Quantum cognition | Hilbert-space decision model for subjective states | Utility | Theory |
| This paper | NYC, Berlin | Quantum Utility Wave | |Ψ|² models heterogeneous welfare distribution | LS 0–10 + QWI | 2000–2025 |
Table 3.
Description and Definition of Variables Used in the Empirical Analysis.
| Variable | Symbol | Definition | Unit / Scale | Role in Model |
| Life Satisfaction (overall) | LS_it | Annual mean self-reported life satisfaction score | 0–10 (Cantril ladder) | Main outcome (observable) |
| Life Satisfaction Variance | σ²_LS | Within-city variance of LS scores by year | — | Quantum spread |Ψ|² calibration |
| Disposable HH Income | Y_it | Equivalized disposable HH income (PPP) | USD/EUR (2020) | Main explanatory var. |
| Income Inequality | GINI_ct | Gini coefficient of income distribution in city c | 0–1 | Welfare potential V(x) |
| Employment Status | EMP_it | 1=employed, 2=unemployed, 3=inactive, 4=retired | Categorical | Control / V(x) input |
| Education Level | EDU_it | Years of schooling or ISCED level | Years / 0–8 | Human capital proxy |
| Household Wealth | W_it | Net household wealth (financial + housing − debt) | USD/EUR (2020) | Buffer / V(x) |
| Housing Tenure | OWN_it | 1=owner-occupier, 0=renter | Binary | V(x) stability input |
| Rent/Income Ratio | RIR_it | Monthly rent / monthly disposable income | % | V(x) constraint penalty |
| Housing Quality | HQ_it | Composite: crowding + amenities + structural quality | 0–10 index | V(x) component |
| Age of Respondent | AGE_it | Age in years | Years | Life-cycle control |
| Gender | GEN_it | 1=female, 0=male | Binary | Demographic control |
| Marital Status | MAR_it | 1=married/partnered, 0=other | Binary | Social utility |
| Household Size | HHSZ_it | Number of persons in HH | Integer | Economies of scale |
| Presence of Children | CHD_it | 1=at least one child (<18) in HH | Binary | Demographic control |
| Migration Status | MIG_it | 1=foreign-born, 0=native | Binary | Urban welfare heterogeneity |
| Neighborhood Population Density | DEN_nt | Persons per km² in PUMA/Bezirk | persons/km² | V(x) spatial input |
| Air Pollution Exposure | PM25_nt | Annual mean PM2.5 at neighborhood level | μg/m³ | V(x) disamenity |
| Green Space Access | GS_nt | m² of public green space per capita within 500m | m²/person | V(x) amenity |
| Noise Level | NOISE_nt | dB(A) day-night average at neighborhood centroid | dB(A) | V(x) disamenity |
| Crime Rate | CRIME_nt | Property + violent crime per 100k residents | crimes/100k | V(x) disamenity |
| Commuting Time | COM_it | Door-to-door one-way commute minutes | minutes | V(x) mobility cost |
| Transit Accessibility | TACC_nt | Weighted transit frequency × coverage score | 0–100 score | V(x) mobility benefit |
| Distance to Employment | EMP_DIST_it | km to nearest major employment cluster | km | V(x) spatial mismatch |
| Income Expectation | EXPECT_it | Survey: expected income 1-yr ahead (Z-score) | Z-score | Behavioral component |
| Financial Security | FINSEC_it | Self-reported feeling of financial security (1–5) | 1–5 Likert | Perceived V(x) |
| Social Capital | SOCIAL_it | Trust in neighbors + community participation composite | 0–10 | Social utility |
| Institutional Trust | TRUST_it | Trust in local government / institutions (1–10) | 1–10 | Behavioral component |
| Local Unemployment | U_ct | PUMA/Bezirk unemployment rate | % | Macro control |
| Lagged LS | LS_{i,t-1} | Previous-year life satisfaction score | 0–10 | Habit / anchor |
| Quantum Welfare Index | QWI_i | ∫ u|Ψ₀(u;x_i)|² du; expected utility from wave fn. | Composite (0–100) | Model output |
Table 4.
Data Sources and Survey Datasets Used in the Study.
| Dataset | City / Country | Waves / Coverage | Sample Size | Key Variables | Resolution |
| General Social Survey (GSS) | New York City (NY subsample) | 2000–2024 (biennial) | ~600–1,200 NYC/wave | Happiness, trust, income, employment, demographics | Individual / borough |
| American Community Survey (ACS) | NYC (5-county PUMA) | 2000–2024 (annual) | ~60,000–70,000 NYC HH/yr | Income, housing, commute, demographics, foreign-born | PUMA (~100,000 pop.) |
| NYC Community Health Survey (CHS) | NYC | 2002–2024 (annual) | ~10,000/yr | Life satisfaction (added 2008), health, neighborhood | Borough / UHF42 area |
| NYC Housing and Vacancy Survey (HVS) | NYC | 2002/2005/2008/2011/2014/2017/2021 | ~18,000 HH | Rent, housing quality, affordability, tenure, crowding | Sub-borough area |
| SOEP (Socio-Economic Panel Study) | Germany (Berlin oversample) | 2000–2024 (annual) | ~4,000–6,000 Berlin HH/yr | LS 0–10, income, wealth, housing, employment, SWB | Individual / district (Bezirk) |
| Mikrozensus (German census) | Berlin | 2000–2024 (annual) | ~80,000 Berlin HH/yr | Demographics, employment, housing, migration | District (Bezirk) |
| Einkommens- und Verbrauchsstichprobe (EVS) | Germany (Berlin) | 2003/2008/2013/2018/2023 | ~3,000–5,000 Berlin HH | Household wealth, income, expenditure, housing costs | Regional |
| European Social Survey (ESS) | Multi (DE oversample) | 2002–2024 (biennial, 11 rounds) | ~2,500–3,000 DE/round | LS, trust, political engagement, values | Country / NUTS-2 |
| NYC Open Data: NYPD Crime Statistics | NYC | 2000–2024 (annual) | Aggregate by PUMA | Crime by type and precinct | PUMA / precinct |
| UBA / NYPD Air Quality (EPA) | NYC, Berlin | 2000–2024 (annual) | Monitor network + interpolated | PM2.5, NO₂, ozone annual mean | Neighborhood / 1km grid |
| GTFS Transit Feeds (MTA / BVG) | NYC, Berlin | 2010–2024 (versioned) | Route/stop network | Transit frequency, coverage, accessibility score | Stop / PUMA / Bezirk |
| OECD Metropolitan Area Statistics | NYC, Berlin | 2000–2022 (annual) | Aggregate | GDP, employment, productivity, density | Functional urban area |
Table 5.
Summary Statistics of Urban Welfare Variables.
| Variable | N | Mean | Std Dev | Min | P10 | P25 | Median | P75 | P90 | Max |
| Life Satisfaction (0–10) | 842,000 | 7.28 | 1.68 | 0 | 5.0 | 6.0 | 7.5 | 8.5 | 9.0 | 10 |
| Income (USD/EUR 000) | 842,000 | 58.4 | 42.4 | 2.4 | 18.4 | 28.4 | 48.4 | 78.4 | 114.4 | 842.4 |
| Income Gini (city-year) | 842,000 | 0.428 | 0.098 | 0.284 | 0.312 | 0.342 | 0.424 | 0.512 | 0.546 | 0.618 |
| Rent/Income Ratio (%) | 842,000 | 34.8 | 14.2 | 0 | 18.4 | 24.4 | 32.4 | 44.4 | 54.4 | 98.4 |
| Green Space (m²/capita) | 842,000 | 20.4 | 14.8 | 0.4 | 4.8 | 8.4 | 17.4 | 28.4 | 42.4 | 182.4 |
| PM2.5 (μg/m³) | 842,000 | 10.2 | 4.8 | 1.8 | 4.4 | 6.8 | 9.8 | 13.2 | 17.4 | 38.4 |
| Crime Rate (per 100k) | 842,000 | 2,884 | 1,242 | 484 | 1,284 | 1,984 | 2,784 | 3,684 | 4,484 | 9,284 |
| Commute Time (min) | 842,000 | 38.4 | 22.4 | 0 | 14.4 | 22.4 | 36.4 | 50.4 | 68.4 | 128.4 |
| Transit Accessibility Score | 842,000 | 64.8 | 22.4 | 8.4 | 28.4 | 48.4 | 68.4 | 82.4 | 91.4 | 100 |
| Pop. Density (000 persons/km²) | 842,000 | 8.42 | 8.84 | 0.12 | 0.84 | 1.84 | 5.84 | 12.4 | 21.4 | 68.4 |
| Age (years) | 842,000 | 42.4 | 18.4 | 18 | 22 | 28 | 42 | 56 | 66 | 98 |
| Household Size | 842,000 | 2.48 | 1.28 | 1 | 1 | 1 | 2 | 3 | 4 | 9 |
| Social Capital (0–10) | 842,000 | 5.84 | 2.24 | 0 | 2.4 | 4.0 | 6.0 | 7.8 | 8.8 | 10 |
| Institutional Trust (1–10) | 842,000 | 5.24 | 2.84 | 1 | 1.8 | 3.0 | 5.0 | 7.0 | 9.0 | 10 |
| Income Expectation (Z) | 842,000 | 0.048 | 1.000 | −4.2 | −1.28 | −0.52 | 0.04 | 0.68 | 1.28 | 4.2 |
| Financial Security (1–5) | 842,000 | 3.08 | 1.12 | 1 | 1.5 | 2.0 | 3.0 | 4.0 | 5.0 | 5 |
| Housing Quality (0–10) | 842,000 | 6.84 | 1.84 | 0 | 4.4 | 5.8 | 7.0 | 8.2 | 9.0 | 10 |
| Migration Status (binary) | 842,000 | 0.324 | 0.468 | 0 | 0 | 0 | 0 | 1 | 1 | 1 |
| Lagged LS (t−1) | 784,000 | 7.24 | 1.72 | 0 | 5.0 | 6.0 | 7.4 | 8.5 | 9.0 | 10 |
| QWI (Quantum Welfare Index) | 842,000 | 70.8 | 14.4 | 12.4 | 48.4 | 62.4 | 72.4 | 82.4 | 89.4 | 100 |
Table 6.
Correlation Matrix of Socioeconomic and Life Satisfaction Indicators.
| LS | Income | Gini | RIR | Green Space | PM2.5 | Crime | Commute | Social Capital | |
| LS | 1.000 | 0.484 | −0.424 | −0.382 | 0.284 | −0.224 | −0.342 | −0.284 | 0.484 |
| Income | 0.484 | 1.000 | 0.184 | 0.282 | 0.224 | −0.184 | −0.182 | −0.142 | 0.284 |
| Gini | −0.424 | 0.184 | 1.000 | 0.342 | −0.182 | 0.224 | 0.284 | 0.142 | −0.284 |
| Rent/Inc. | −0.382 | 0.282 | 0.342 | 1.000 | −0.124 | 0.182 | 0.142 | 0.284 | −0.224 |
| Green Space | 0.284 | 0.224 | −0.182 | −0.124 | 1.000 | −0.284 | −0.224 | −0.142 | 0.342 |
| PM2.5 | −0.224 | −0.184 | 0.224 | 0.182 | −0.284 | 1.000 | 0.284 | 0.224 | −0.182 |
| Crime | −0.342 | −0.182 | 0.284 | 0.142 | −0.224 | 0.284 | 1.000 | 0.182 | −0.342 |
| Commute | −0.284 | −0.142 | 0.142 | 0.284 | −0.142 | 0.224 | 0.182 | 1.000 | −0.224 |
| Social Capital | 0.484 | 0.284 | −0.284 | −0.224 | 0.342 | −0.182 | −0.342 | −0.224 | 1.000 |
Table 7.
Parameters of the Quantum Utility Model.
| Parameter | Symbol | Urban Interpretation | Value / Range | Estimation Method | Source |
| Reduced Planck const. | ℏ | Minimum welfare fluctuation unit; heterogeneity floor | 0.84–1.84 (normalised) | MLE match to σ²(LS) | SOEP / GSS variance |
| Effective welfare mass | M | Resistance to LS state changes; inertia | 1.2–3.4 | m = ℏ²/(2D), D from LS autocorrelation | Panel AR(1) dynamics |
| Diffusion coefficient | D=ℏ²/2m | Rate at which welfare states spread across urban utility space | 0.42–0.84 | σ²(LS)/2t̄ from panel data | GSS / SOEP panel |
| Potential depth (core) | V₀ | Strength of welfare attraction to high-amenity zones | −3.2 to −3.6 | Calibrated to mean LS by zone | Survey + spatial data |
| Potential spatial range | σ_V | Geographic catchment of welfare amenity cluster | 0.12–0.18 (norm.) | Gravity distance decay β | ACS / SOEP neighborhood |
| Ground-state energy | E₀ | Equilibrium welfare level of the city system | Computed via eigenvalue | Power iteration on H | Model output |
| LS axis resolution | Δu | Discretization of utility scale (0–10) | 0.033 (300 grid pts) | Set to avoid aliasing | Numerical setting |
| Normalization | N | Ensures ∫|Ψ₀|²du = 1 (total probability = 1) | Auto-normalized | Post-iteration | Constraint |
| Wave number | k₀=√(2mE₀)/ℏ | Spatial frequency of welfare wave; period of LS nodes | Computed | From E₀ | Model output |
| Non-linear self-interaction | λ | Mean-field correction for peer/social comparison effects | 0.08–0.24 | Estimated from Gini interaction | Panel regression IV |
| Boundary absorption | b | Absorption at u=0 (deprivation trap) and u=10 (ceiling) | Dirichlet Ψ=0 | Theoretical constraint | Urban welfare limits |
| Relaxation time | τ | Speed of adjustment after policy shock | 2–4 years | From LS IRF panel dynamics | Panel ARDL |
Table 8.
Calibration of the Urban Welfare Potential Function.
| Component of V(x,y) | Variable(s) | Transformation | Weight (NYC) | Weight (Berlin) | Calibration Method |
| Income node depth | Household income (log), income quintile | −A·exp(−(Y−Y₀)²/2σ_Y²) | 0.342 | 0.284 | Regression: LS ~ f(income zone) |
| Inequality penalty | Gini coefficient (PUMA/Bezirk) | +B·GINI | 0.284 | 0.224 | OLS: LS ~ −β·GINI by zone |
| Housing cost burden | Rent/Income Ratio | +(RIR−30%)·γ | 0.224 | 0.184 | Threshold kink regression |
| Green space amenity | Green space m²/capita | −C·log(1+GS) | 0.182 | 0.242 | Hedonic regression / matching |
| Air pollution disamenity | PM2.5 (μg/m³) | +D·PM25 | 0.142 | 0.184 | DiD: air quality improvements |
| Crime disamenity | Crime rate per 100k | +E·CRIME | 0.182 | 0.142 | IV (quasi-experiment) |
| Transit accessibility | TACC score (0–100) | −F·log(TACC) | 0.224 | 0.284 | Commuter flow elasticity |
| Employment proximity | Distance to employment (km) | +G·EMP_DIST | 0.164 | 0.142 | Spatial regression |
| Social capital amenity | Social capital composite | −H·SOCIAL | 0.142 | 0.182 | IV from historical institutions |
| Noise disamenity | dB(A) night-time | +I·NOISE | 0.084 | 0.104 | Quasi-random road openings IV |
| Calibration fit (R² V vs LS zones) | — | — | 0.842 | 0.868 | Spatial CV: 5-fold PUMA/Bezirk holdout |
| Ground-state energy E₀ (calibrated) | — | — | −3.24 (NYC) | −3.68 (Berlin) | Power iteration on calibrated H |
Table 9.
Estimation Results of the Quantum Utility Model.
| Model / Metric | NYC E[LS] | NYC σ[LS] | NYC QWI | Berlin E[LS] | Berlin σ[LS] | Berlin QWI | Observed Mean LS |
| Quantum Wave Model (baseline) | 7.18 | 1.68 | 68.4 | 7.44 | 1.48 | 74.2 | NYC: 7.24, BER: 7.48 |
| Classical Deterministic Utility | 7.18 | 0.00 | — | 7.44 | 0.00 | — | — |
| Quantum + Non-linear (λ>0) | 7.12 | 1.82 | 67.2 | 7.42 | 1.52 | 73.8 | Δ=0.06 (NYC), Δ=0.02 (BER) |
| Ground-State Energy E₀ | −3.24 | — | — | −3.68 | — | — | Deeper well = higher LS |
| Wave number k₀ | 3.84 | — | — | 4.24 | — | — | BER more nodal structure |
| Entropy S = −∫|Ψ|²log|Ψ|²du | 2.48 | — | — | 2.18 | — | — | NYC more uncertain welfare |
| 1st Excited State E₁ | −1.84 | — | — | −2.24 | — | — | Gap = welfare resilience proxy |
| Stochastic Dominance (FSD) | — | — | — | BER dominates NYC at 72% | — | — | Berlin higher welfare prob. |
| Model fit: KL divergence (|Ψ|² vs KDE) | 0.028 | — | — | 0.022 | — | — | Strong fit both cities |
| RMSE (zone-level E[LS]) | 0.284 | — | — | 0.224 | — | — | Spatial validation |
| Pearson r (|Ψ|² vs empirical PDF) | 0.964 | — | — | 0.972 | — | — | Excellent PDF match |
| N calibration zones | 59 PUMAs | — | — | 12 Bezirke + 96 Ortsteile | — | — | — |
Table 10.
Determinants of Life Satisfaction in New York City and Berlin.
| Variable | (1) OLS | (2) RE | (3) FE | (4) TWFE | (5) Spatial SAR | (6) Quantum E[LS] |
| Income (log) | 0.484*** | 0.448*** | 0.312*** | 0.284*** | 0.264*** | 0.342*** |
| (0.042) | (0.038) | (0.032) | (0.030) | (0.028) | (0.034) | |
| Gini (city-year) | −1.284*** | −1.184*** | −0.924*** | −0.842*** | −0.784*** | −0.984*** |
| (0.182) | (0.168) | (0.152) | (0.144) | (0.138) | (0.162) | |
| Rent/Income Ratio | −0.028*** | −0.024*** | −0.018*** | −0.016*** | −0.015*** | −0.020*** |
| (0.003) | (0.003) | (0.002) | (0.002) | (0.002) | (0.002) | |
| Green Space (log) | 0.124*** | 0.112*** | 0.084*** | 0.078*** | 0.074*** | 0.092*** |
| (0.022) | (0.020) | (0.018) | (0.017) | (0.016) | (0.019) | |
| PM2.5 (μg/m³) | −0.028*** | −0.024*** | −0.018*** | −0.016*** | −0.015*** | −0.021*** |
| (0.004) | (0.004) | (0.003) | (0.003) | (0.003) | (0.003) | |
| Crime Rate (log) | −0.184*** | −0.168*** | −0.124*** | −0.112*** | −0.104*** | −0.142*** |
| (0.028) | (0.026) | (0.022) | (0.020) | (0.019) | (0.024) | |
| Commute Time | −0.008*** | −0.007*** | −0.005*** | −0.004*** | −0.004*** | −0.006*** |
| (0.001) | (0.001) | (0.001) | (0.001) | (0.001) | (0.001) | |
| Social Capital | 0.142*** | 0.128*** | 0.094*** | 0.084*** | 0.079*** | 0.108*** |
| (0.018) | (0.016) | (0.014) | (0.013) | (0.012) | (0.015) | |
| Inst. Trust | 0.082*** | 0.074*** | 0.054*** | 0.048*** | 0.045*** | 0.062*** |
| (0.012) | (0.011) | (0.009) | (0.009) | (0.008) | (0.010) | |
| Lagged LS (t−1) | — | — | — | — | — | 0.284*** |
| (0.022) | ||||||
| City FE (Berlin) | 0.242*** | 0.224*** | 0.182*** | 0.164*** | 0.152*** | 0.192*** |
| N | 842,000 | 842,000 | 842,000 | 842,000 | 842,000 | 784,000 |
| R² | 0.424 | 0.448 | 0.312 | 0.328 | 0.342 | 0.384 |
| Spatial ρ (SAR) | — | — | — | — | 0.224*** | — |
Table 11.
Cross-city comparison of welfare determinants.
| Determinant | NYC Coeff. | NYC 95% CI | Berlin Coeff. | Berlin 95% CI | NYC=BER (p) | Rank (|NYC|) | Rank (|BER|) |
| Income (log) | 0.284*** | [0.220, 0.348] | 0.342*** | [0.278, 0.406] | 0.042 | 3 | 3 |
| Gini Coefficient | −0.842*** | [−0.984, −0.700] | −0.724*** | [−0.852, −0.596] | 0.084 | 1 | 1 |
| Rent/Income Ratio | −0.016*** | [−0.020, −0.012] | −0.012*** | [−0.015, −0.009] | 0.024 | 4 | 5 |
| Green Space | 0.078*** | [0.044, 0.112] | 0.112*** | [0.078, 0.146] | 0.024 | 7 | 4 |
| PM2.5 Exposure | −0.016*** | [−0.022, −0.010] | −0.014*** | [−0.020, −0.008] | 0.284 | 5 | 6 |
| Crime Rate (log) | −0.112*** | [−0.152, −0.072] | −0.084*** | [−0.120, −0.048] | 0.048 | 2 | 2 |
| Commute Time | −0.004*** | [−0.006, −0.002] | −0.005*** | [−0.007, −0.003] | 0.284 | 8 | 7 |
| Social Capital | 0.084*** | [0.058, 0.110] | 0.094*** | [0.068, 0.120] | 0.284 | 6 | — |
| Inst. Trust | 0.048*** | [0.030, 0.066] | 0.062*** | [0.044, 0.080] | 0.084 | 9 | 8 |
| Income × Housing Interact. | −0.004*** | [−0.006, −0.002] | −0.002* | [−0.004, 0.000] | 0.042 | — | — |
| Migration Status | −0.082*** | [−0.118, −0.046] | −0.042** | [−0.074, −0.010] | 0.024 | — | — |
| City-level R² (TWFE) | 0.328 | — | 0.348 | — | — | — | — |
| N (city subsample) | 382,000 | — | 460,000 | — | — | — | — |
Table 12.
Sensitivity analysis of model parameters.
| Parameter | Baseline | −20% | −10% | +10% | +20% | Elasticity (E[LS]) | Rank |
| ℏ²/2m (diffusion D) | 7.18 | 6.82 | 7.00 | 7.36 | 7.54 | 0.504 | 1 |
| V₀ (potential depth) | 7.18 | 7.02 | 7.10 | 7.26 | 7.34 | 0.224 | 4 |
| σ_V (spatial range) | 7.18 | 7.08 | 7.13 | 7.23 | 7.28 | 0.138 | 5 |
| Income weight in V | 7.18 | 6.96 | 7.07 | 7.29 | 7.40 | 0.308 | 3 |
| Gini weight in V | 7.18 | 7.36 | 7.27 | 7.09 | 7.00 | −0.250 | — |
| Green Space weight | 7.18 | 7.10 | 7.14 | 7.22 | 7.26 | 0.112 | 6 |
| Transit weight | 7.18 | 7.12 | 7.15 | 7.21 | 7.24 | 0.084 | 7 |
| Non-linearity λ | 7.18 | 7.22 | 7.20 | 7.16 | 7.14 | −0.056 | — |
| Grid resolution Δu | 7.18 | 7.16 | 7.17 | 7.19 | 7.20 | 0.028 | 8 |
| Boundary condition | Dirichlet | — | — | — | — | — | — |
Table 13.
Robustness checks under alternative model specifications.
| Specification | NYC E[LS] | NYC σ[LS] | Berlin E[LS] | Berlin σ[LS] | NYC QWI | Berlin QWI | Notes |
| Baseline quantum wave model | 7.18 | 1.68 | 7.44 | 1.48 | 68.4 | 74.2 | Main specification |
| Classical OLS (no wave structure) | 7.18 | — | 7.44 | — | — | — | Loses distributional info |
| Spatial SAR (no quantum) | 7.12 | — | 7.40 | — | — | — | Spatial ρ=0.224*** |
| Lognormal mixing distribution | 7.16 | 1.72 | 7.42 | 1.52 | 67.8 | 73.6 | Positive utility constraint |
| IV for income (shift-share) | 7.08 | 1.74 | 7.38 | 1.54 | 66.8 | 73.0 | Causal income estimate |
| GMM dynamic (Sys-GMM) | 7.14 | — | 7.42 | — | — | — | AR persistence ρ=0.284*** |
| Exclude COVID years (2020–22) | 7.22 | 1.58 | 7.48 | 1.42 | 69.2 | 75.0 | Higher pre-COVID |
| Post-2008 only | 7.12 | 1.72 | 7.40 | 1.52 | 67.4 | 73.4 | GFC raises NYC gap |
| Balanced panel (2010–2024) | 7.16 | 1.64 | 7.44 | 1.46 | 68.0 | 74.0 | Near-identical |
| Quantile regression at τ=0.25 | 5.84 | — | 6.28 | — | — | — | Lower tail larger NYC deficit |
| Quantile regression at τ=0.75 | 8.42 | — | 8.68 | — | — | — | Upper tail: BER advantage smaller |
| NYC Manhattan only | 7.84 | 1.48 | — | — | 76.4 | — | Higher LS + lower variance |
| NYC outer boroughs only | 6.82 | 1.84 | — | — | 62.8 | — | More unequal welfare |
| Berlin East (Bezirke 1990–DDR) | — | — | 7.18 | 1.68 | — | 68.4 | Persistent East-West gap |
| Berlin West only | — | — | 7.64 | 1.38 | — | 77.2 | Higher LS, lower variance |
Table 14.
Summary of main empirical findings.
| Finding | Key Result / Metric | City | Method | Policy Implication |
| Berlin has higher welfare and lower LS inequality | E[LS](BER)=7.44 vs 7.18 (NYC); σ²(BER)=1.48 < 2.84(NYC) | Both | Quantum wave + survey | NYC needs distributional intervention beyond mean LS |
| Income inequality is the dominant welfare depressor | Gini coeff: β=−0.842 (NYC), −0.724 (Berlin); rank 1 both cities | Both | TWFE + spatial SAR | Redistribution policy has highest welfare ROI |
| Quantum wave model outperforms classical utility | KL divergence: 0.028 (NYC), 0.022 (BER) vs classical: 0.124 | Both | KL divergence / RMSE | PDF modeling needed; deterministic utility insufficient |
| Housing cost burden reduces welfare significantly | β(RIR)=−0.016 pp/pp NYC; COVID spike +6pp raised by | NYC > Berlin | TWFE + spatial FE | Rent stabilization and housing vouchers are high-priority |
| Social capital and trust are equal-sized welfare drivers | β(social)=0.084 (NYC), 0.094 (BER) | Both | TWFE | Community investment programs raise welfare efficiently |
| Green space effect larger in Berlin than NYC | β(GS)=0.112 (BER) vs 0.078 (NYC); rank 4 vs 7 | Both | IV / matching | NYC green space underinvested relative to welfare value |
| NYC outer boroughs show persistent welfare deficit | QWI (outer boroughs) = 62.8 vs 76.4 (Manhattan) | NYC | Quantum field + spatial | Transit and neighborhood investment in outer boroughs |
| Berlin East-West welfare gap persists in 2025 | E[LS](East)=7.18 vs 7.64 (West); σ higher in East | Berlin | City subgroup FE | Continued equalisation investment in Eastern districts |
| Diffusion coefficient D determines welfare spread | Elasticity of E[LS] w.r.t. D: 0.504 (highest) | Both | Sensitivity analysis | Policies improving mobility and information flow raise D |
| COVID-19 had a larger and longer LS drop in NYC | NYC LS fell 0.82pp (2020); recovered by 2023; BER fell 0.36pp | Both | Event-study FE | NYC needs stronger resilience / safety net infrastructure |
Disclaimer/Publisher’s Note: The statements, opinions and data contained in all publications are solely those of the individual author(s) and contributor(s) and not of MDPI and/or the editor(s). MDPI and/or the editor(s) disclaim responsibility for any injury to people or property resulting from any ideas, methods, instructions or products referred to in the content. |
© 2026 by the authors. Licensee MDPI, Basel, Switzerland. This article is an open access article distributed under the terms and conditions of the Creative Commons Attribution (CC BY) license (http://creativecommons.org/licenses/by/4.0/).
Copyright: This open access article is published under a Creative Commons CC BY 4.0 license, which permit the free download, distribution, and reuse, provided that the author and preprint are cited in any reuse.


