Submitted:
30 March 2026
Posted:
31 March 2026
You are already at the latest version
Abstract
Objective: This study aimed to examine the formation of technology-based New Product Purchase Intention within the framework of motivated consumer innovativeness, tech-nology expertise, perceived ease of use, perceived usefulness, and Attitude Toward Technology. By integrating the Technology Acceptance Model (TAM) with the consumer innovativeness literature, the study aimed to reveal through which cognitive and atti-tudinal mechanisms individual innovation tendencies translate into purchase intention. Method: This study employed a quantitative research design, and data were collected through a questionnaire. The Partial Least Squares Structural Equation Modeling (PLS-SEM) approach was used for measurement and structural model analysis. Reliability and validity were assessed using Cronbach’s Alpha, rho_A, composite reliability (CR), average variance extracted (AVE), Fornell–Larcker criterion, and HTMT ratios. Results: Motivated consumer innovativeness positively affected both technology expertise and perceived ease of use. Technology expertise significantly increased perceived ease of use, while perceived ease of use strongly influenced perceived usefulness and Attitude To-ward Technology. Attitude Toward Technology had a strong effect on New Product Purchase Intention. The effect of consumer innovativeness on purchase intention was largely indirect. Conclusion: New product purchase intention is shaped by sequential cognitive and attitudinal evaluations rather than direct innovation tendencies, supporting TAM and highlighting consumer innovativeness as an important precursor variable.
Keywords:
technology acceptance model
; perceived ease of use
; perceived usefulness
; purchase intention
; PLS-SEM
1. Introduction
In today’s information and technology age, many companies operate in the high-tech field and strive to keep pace with rapidly changing conditions. Customer demands and needs change frequently, and new technologies and products are launched in different areas every day. In this context, understanding factors that support the sustainable adoption of technology-based products has become increasingly important for long-term market sustainability. The emergence of different innovations in products and services along with new technological developments has accelerated academic studies on consumer technology use. Although the importance of consumer innovativeness has long been established, its true definition is still being questioned in the scientific literature by numerous researchers. Therefore, a brief overview of established definitions and explanations in the theoretical literature is provided below. Midgley and Dowling (1978), who took a different approach to the concept of innovation, defined it as “the degree to which an individual is ready for new ideas or new formations and their ability to make decisions independently, free from external social pressures and influences” [1]. The existing literature suggests that consumer innovativeness can be viewed as a set of personal characteristics that is present in every consumer to a greater or lesser degree [2]. It is defined as individuals’ intrinsic motivation to explore new products and technologies, their willingness to learn in the face of uncertainty, and their behavioral tendencies towards early adoption of innovations; this tendency systematically influences both their cognitive evaluations and their attitudes and intentions toward technology [2,3]. Midgley and Dowling (1978) proposed that each consumer has a different level of sense of innovation and that the roots of innovation are related to their level of innovation. Steenkamp, Hofstede and Wedel (1999) also added some features to the definition of consumer innovativeness, and interpreted it as the tendency of consumers to buy new and different products instead of staying with old products [4].
In recent years, consumer innovativeness has become a major research topic, as an important dimension of the entire innovation system that encompasses the market and consumer behavior. As a result of intense competition—especially in sectors developing on a global scale—businesses have started to attach more importance to customer satisfaction and their preferences. In particular, with an increase in new products and services offered on the market, businesses have investigated consumers’ tendency to adopt products and services and changes in this tendency. In this context, businesses that analyze customer potential and tendency can use their resources more effectively to develop innovative products. Furthermore, innovation plays a key role in improving customer well-being while simultaneously lowering prices for companies [5]. When all these factors are considered together, it is understandable why consumer innovativeness has become a key factor in recent years. The emergence of different innovations in products and services with new technological developments is giving impetus to academic studies on consumers’ use of technology. Against this backdrop, it has become a necessity to research perceived ease of use, perceived usefulness, and attitude toward technology.
Studies based on the Technology Acceptance Model (TAM) generally focus on the effects of perceived ease of use and perceived usefulness on consumers’ attitudes and behavioral intentions towards technology. However, the literature only addresses to a limited extent how variables such as consumer innovativeness and technology expertise, which reflect individual differences, are integrated into the acceptance process and the cognitive and attitudinal mechanisms through which these variables exert their effects. In particular, there appears to be a lack of studies examining the indirect effects of these variables on New Product Purchase Intention within a holistic model framework. This research aims to address this knowledge gap, which is important not only for explaining purchase intention, but also for understanding sustainable consumer adoption of technology-based new products.
The aim of this research is to examine consumers’ adoption of new products, specifically focusing on the effects of motivated consumer innovativeness, technology expertise, perceived ease of use, perceived usefulness, and attitude toward technology on New Product Purchase Intention. A fundamental issue that this research addresses is the factors that influence consumers’ adoption of new products and the reasons that increase or decrease their adoption. This study is expected to provide insight into the specific needs and concerns that consumers have when purchasing new technological products and the solutions they look for. The findings may have useful implications for firms seeking to promote the long-term and sustainable market acceptance of technology-based innovations.
2. Materials and Methods
2.1. Consumer Innovativeness and Technology Expertise
Innovative consumers tend to seek novelty and have high motivation to try and learn new things [6,7]. It is reasonable to argue that consumers with high innovativeness possess more knowledge about innovative technologies than those with low innovativeness. It is argued that individuals with high innovativeness tend to have a high risk-taking tendency regarding new information technologies or services [8]. Previous studies have also revealed that consumers allocate various resources (e.g., technology expertise) to multiple needs or goals [2]. Several studies have suggested that individual resources can act as individual goals and moderate the relationships between individual tendencies and behaviors [9]. In this context, individual tendencies and resources may play a role in the sustainable adoption of technology-based new products
However, individuals only engage in comprehensive deliberation on available information when they possess high motivation and capacity to dedicate their cognitive resources to this task, which necessitates a more in-depth evaluation of information. The technology-centric marketing industry offers constantly updated applications, software and tools [10]. Therefore, the more technology expertise consumers possess, the easier it becomes to meet their innovation needs. In other words, while innovation can lead to new challenges for consumers, technology expertise is the key to consumers’ adoption. This means that innovative consumers with high technology expertise are more likely to spend their time on and conduct more transactions through technology applications than consumers with low technology expertise [11]. Based on this, the following hypothesis is proposed.
H1: Consumer innovativeness has a positive impact on technology expertise.
2.2. Consumer Innovativeness and Perceived Ease of Use
Perceived ease of use is defined as the confidence a user has in using a particular system effortlessly [12]. According to Davis et al. (1992), if a technology or system is easier to use, it means that users can expend less effort to accomplish a given task, allowing them to allocate more resources to other tasks, thus leading to increased overall job performance and capacity [13]. According to the Technology Acceptance Model, perceived ease of use significantly influences attitude. Numerous studies have demonstrated a positive correlation between perceived ease of use and intention to use a system [14], with perceived ease of use identified as the most important predictor factor of users’ intention [15,16]. However, some researchers have associated perceived ease of use with difficulty [17] and planned effort [18].
Perceived ease of use is a very important factor in technology-centric markets, as it has a positive effect on technology adoption [19]. Furthermore, when a new technology is easier to use, users will experience comfort while using the technology and be relieved from tedious tasks [20].
Perceived ease of use is a strong factor influencing a consumer’s decision to use a technology and its perceived usefulness. If a technology is perceived as easier to use, users are more likely to adopt and use it [21]. A meta-analysis of technology adoption highlights the factors influencing users’ readiness to adopt and use a system. While studies have mostly analyzed the relationship between perceived ease of use and consumers’ intention to use a new system, the relationship between perceived ease of use and consumers’ attitudes towards a new system has also been analyzed [22]. The following hypothesis is thus proposed.
H.2: Consumer innovativeness has a positive effect on perceived ease of use.
2.3. Technology Expertise and Perceived Ease of Use
According to the Technology Acceptance Model, perceived ease of use is a significant secondary factor influencing consumer intention, while perceived usefulness is a primary factor driving consumer intention [14]. Some studies show that consumers’ intention to use a technology is influenced by perceived usefulness, perceived ease of use, attitude toward the technology, and perceived risk [23,24]. Weng’s (2018) research indicates that when equipment is installed to create multimedia materials and human power is provided to edit these materials, it will increase the perceived ease of use of such materials and instructors’ intention to use them [24]. According to Shaikh et al. (2015), users’ tendency to use a system reflects their intention to use the system. In another study, consumers’ experience with current information technology and their perceived ease of use of online banking influence their intention to use online banking [25]. The following hypothesis is thus proposed.
H3: Technology expertise has a positive impact on perceived ease of use.
2.4. Perceived Ease of Use and Perceived Usefulness
Robey and Zeller (1978) state that perceived usefulness can lead to a significant difference in technology adoption across departments within the same company [26]. According to the Technology Acceptance Model, users’ intentions to use a technology and their attitudes towards the technology are directly influenced by perceived usefulness [12]. Meta-analysis studies on technology adoption have also demonstrated a positive correlation between perceived usefulness and users’ intentions to use a technology [27]. These findings show that perceived usefulness affects a user’s willingness to adopt a technology. Perceived usefulness influences users’ opinions about a new product and their acceptance and adoption of the product in various studies [12,14] [28,29,30,31]. Since perceived usefulness can influence users’ intentions to accept and adopt a product, it has a significant impact on product marketing [32]. Therefore, given that perceived usefulness is a key indicator of product acceptance and adoption [19], the following hypothesis is proposed.
H4: Perceived ease of use has a positive effect on perceived usefulness.
2.5. Perceived Ease of Use and Attitude Toward Technology
The Technology Acceptance Model (TAM) posits that perceived ease of use is one of the main cognitive determinants of attitude toward a new technology in the process of adopting the technology. Perceived ease of use reflects an individual’s perception of the effort that they have to put in while using a technology. The perception that a technology is easy to learn and use is a positive factor influencing its evaluation. Technologies that are thought to require less physical and mental effort to use are met with more positive attitudes and are more likely to be adopted.
On this subject, Davis (1989) states that perceived ease of use directly affects an individual’s attitude toward the adoption of a new technology, and this effect is further strengthened by a decrease in the perceived difficulties of use [12]. In a similar study, Venkatesh and Davis (2000) found that perceived ease of use positively affects individuals’ cognitive evaluations of a technology and plays a critical role in their attitudes towards the technology [14]. Therefore, perceived ease of use reduces the perception of uncertainty and facilitates the development of positive emotional responses towards a new technology.
Perceived ease of use reduces the cognitive load that individuals may encounter when interacting with a technology and facilitates the development of a more positive attitude toward the technology. In this context, perceived ease of use is expected to have a positive impact on attitude toward technology, and the following hypothesis is thus proposed.
H5: Perceived ease of use has a positive impact on attitude toward technology.
2.6. Perceived Usefulness and Attitude Toward Technology
Within the framework of the Technology Acceptance Model (TAM), perceived usefulness is defined as an individual’s belief that the use of a technology will increase their own efficiency, performance, or effectiveness in daily life. It contributes greatly to an individual’s evaluation of a technology, both as a functional tool and as an element that adds value to their life. In general, perceived usefulness is among the main cognitive determinants in the development of a positive attitude toward technology.
In the research conducted by Davis (1989), perceived usefulness strongly and directly affects attitude toward technology; specifically, when an individual perceives a technology as beneficial, they develop a more positive attitude toward it [12]. Similarly, Venkatesh and Davis (2000) found that perceived usefulness is more effective than perceived ease of use in influencing attitudes towards advanced and complex technologies [14]. Consequently, users primarily consider concrete and perceptible gains in their evaluation of a technology.
Perceived usefulness, which is evaluated within the framework of the convenience and solution provided by technology to address individual needs, plays a crucial role in shaping a positive attitude toward technology. In particular, time saving, performance increase and functional convenience, which are important advantages offered by technology, positively affect users’ evaluation and facilitate the development of a positive attitude.
In line with this theoretical framework, it is expected that perceived usefulness will have a positive effect on attitude toward technology. Accordingly, the following hypothesis is proposed.
H6: Perceived usefulness has a positive effect on attitude toward technology.
2.7. Attitude Toward Technology and New Product Purchase Intention
Attitude toward technology is considered a fundamental attitudinal variable reflecting an individual’s overall evaluation, perceptions, and emotional tendencies regarding the use of technology. Within the Technology Acceptance Model (TAM), attitude arises as a result of cognitive evaluations of perceived ease of use and perceived usefulness, and acts as a key mediating variable shaping an individual’s behavioral intention [12,14]. In this context, it is posited that having a positive attitude toward a technology increases an individual’s intention to use the technology and purchase products based on that technology [33,34].
According to the Theory of Planned Behavior (TPB) and the Theory of Reasoned Action (TRA), attitude is one of the strongest determinants of an individual’s intention to perform a behavior, which increases when a behavior is evaluated positively [35]. In this sense, individuals who develop a positive attitude toward technology exhibit more willingness to try, adopt and purchase new technological products [36].
An individual’s attitude toward technology, which reflects their overall evaluation of AI-supported and innovative products, is a critical variable as it has a direct impact on their New Product Purchase Intention. It is argued that individuals who accept technology as a useful and value-creating element have a greater New Product Purchase Intention towards this technology [37,38]. From a sustainability perspective, such a positive attitude may also support the long-term market acceptance and sustainable diffusion of technology-based innovations.
In line with these theoretical approaches, it is expected that attitude toward technology will have a positive effect on New Product Purchase Intention. The following hypothesis is thus proposed.
H7: Attitude toward technology has a positive effect on New Product Purchase Intention.
2.7. Research Model and Methodology
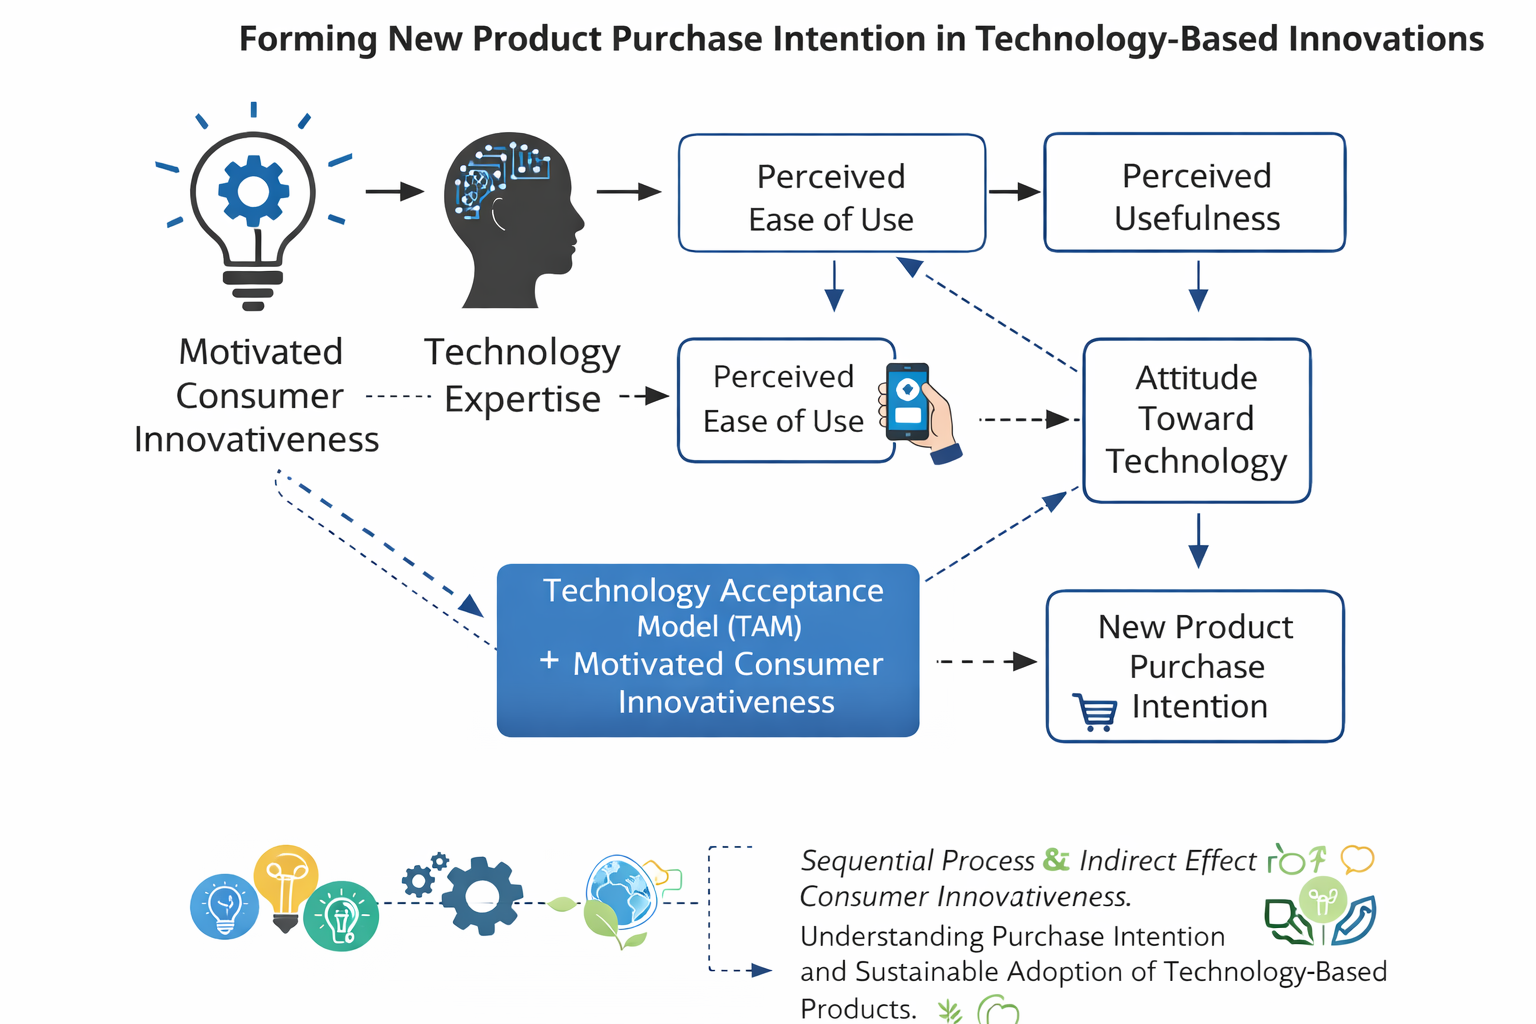
The theoretical model developed in this study based on quantitative research methods was analyzed using the Partial Least Squares Structural Equation Modeling (PLS-SEM) approach [39]. In this respect, the model provides a basis for understanding sustainable consumer adoption of technology-based new products. The PLS-SEM method allows the testing of complex structural relationships and indirect effects. In this study, research analyses were carried out using the SmartPLS software. The relationships between variables, as hypothesized in the research model developed to achieve the study objectives, are shown in Figure 1.
This study used Partial Least Squares Structural Equation Modeling (PLS-SEM) to analyze how consumer innovativeness and technology expertise influence New Product Purchase Intention through perceived ease of use, perceived usefulness, and attitude toward technology within the framework of the Technology Acceptance Model (TAM). The aim of the study is to test the causal relationships between these variables within a holistic model framework. Prior to the PLS-SEM analysis, the dataset was screened for missing values and outliers. Cronbach’s alpha coefficient, composite reliability coefficient, and average variance extracted (AVE) were used to assess the validity and reliability of the measurement model. Discriminant validity was evaluated using the Fornell–Larcker criterion and the HTMT ratio [40]. After the measurement model was found to be acceptable, hypothesis tests were performed with the structural model, and path coefficients, t-values, and p-values were reported. Model fit was assessed based on the SRMR value. The research model, hypotheses, and measurement tools were developed based on the existing literature.
2.8. Study Sample
The study sample consisted of individuals aged 18 and over living in Turkey who interact with technology-based consumer products. The sample of 256 participants was determined using a purposive sampling approach. Purposive sampling aims to reach participants who can make meaningful assessments regarding the phenomenon under study (attitude towards new technology-based products and purchase intention). The criteria for participation in the study were being 18 years of age or older, having purchased at least one technology product in the last 12 months or intending to purchase one in the near future, and being active in the use of technology products.
2.9. Data Collection Tools
The Motivated Consumer Innovativeness (MCI) Scale was used to measure participants’ consumer innovative tendencies. The scale was developed by [2] and adapted into Turkish by [41]. During its adaptation to the Turkish context, the scale items were translated into Turkish based on expert opinions, and then a pre-test was administered to evaluate the comprehensibility and cultural appropriateness of the statements.
The New Product Purchase Intention Scale was developed by adapting scales widely used in the international literature [42,43] and considering the scale form used in a local study [44]. The scale was developed by [44] and its validity and reliability had been previously tested. This scale consists of statements aimed at measuring consumers’ tendencies and intentions to purchase new products in the near future. The fact that this scale has been used previously in the Turkish context provides a significant advantage in terms of the cultural compatibility and validity of the measurement results. In this research, the scale was used to assess participants’ purchase intentions towards new products.
To measure the variable perceived usefulness, scales that have been commonly used in studies on information systems and online consumer behavior were utilized. The Expectation–Confirmation Model developed by [45] and the measurement tools developed by [46] and [47] were used as the basis for the development of the Perceived Usefulness Scale, which includes statements that evaluate the benefits of using products supported by artificial intelligence and their contribution to efficiency and shopping experience. This scale is intended to reliably measure consumers’ perceptions of the functionality and use value of AI-supported products.
The Technology Expertise Scale was developed by Ziefle and Schaar (2010) to measure individuals’ competence in the use of technology supported by artificial intelligence. The scale consists of statements that measure individuals’ interest in technology, their technological literacy and willingness to use technology, and their adoption levels. Within this scale, both the technical knowledge levels of users and their attitudes and tendencies towards technology are evaluated holistically [48].
Perceived ease of use is considered one of the key variables influencing individuals’ behavioral intentions to use a technology under the Technology Acceptance Model (TAM). Accordingly, perceived ease of use was evaluated through a scale consisting of five items. The scale items were created on the basis of the study by Schierz et al. (2010). In addition, scales developed by Bhattacherjee (2001), Davis (1989), Taylor and Todd (1995), and Venkatesh and Davis (2000), which are widely used in the literature, were consulted in the development of the Perceived Ease of Use Scale [12,14,49,50].
The scale items used to measure attitude toward technology were developed based on the Technology Acceptance Model (TAM) and related attitude scales developed by [51] and [52]. The scale was adapted to the context of general technology products, which is the focus of this research; the statements were reorganized with respect to content validity and measured on a five-point Likert scale (1 = Strongly disagree, 5 = Strongly agree).

Table 1.
Variables and their scale items.
| Variable | Source |
| Motivated Consumer Innovativeness (MCI) | |
| I would like to have a new product that will set me apart from others. | [2,41] [42,43,44] [50,52] [50,52] [13] [14] [50] |
| I would immediately buy a new product that saves time. | |
| I would like to try new products that I can show off to my close circle. | |
| The emergence of new products excites me. | |
| Using new products gives me pleasure. | |
| Having a new product makes me happy. | |
| New Product Purchase Intention (NPPI) | |
| I’m looking to buy a new product soon. | |
| I tend to buy new products mostly. | |
| I’m planning to buy a new product in the near future. | |
| Perceived Usefulness (PU) | |
| Buying a new product allows me to do my work faster. | |
| Buying a new product increases my productivity. | |
| I find buying a new product useful. | |
| Buying a new product improves my shopping experience. | |
| Buying a new product enhances my shopping experience. | |
| Technology expertise (TE) | |
| I have a strong interest in the technologies used in new products. | |
| I am very enthusiastic about the use of technology in new products. | |
| My technological literacy regarding new products is excellent. | |
| I am very good at adopting new product technologies. | |
| Perceived Ease of Use (PEOU) | |
| Learning about new products is easy for me. | |
| Using new products is effortless for me. | |
| I can easily grasp how to use new products. | |
| Interacting with new products is clear and understandable for me. | |
| Using new products doesn’t require much effort from me. | |
| Attitude Toward Technology (ATT) | |
| I generally have a positive view of using new products. | |
| Using new products is a good idea for me. | |
| I enjoy using new products. | |
| My attitude towards using new products is positive. | |
3. Results
As presented in Table 2, the majority of participants were male (61.7%). In terms of age distribution, the majority of participants were in the 30-39 age range (40.6%), followed by the 18-29 age group (24.2%) and then the 40-49 age group (22.7%). The proportion of participants aged 50 and over was 12.5%. In terms of educational level, the majority of participants were bachelor’s degree graduates (55.5%), followed by master’s degree graduates (25.8%). The proportion of participants with a high school education or lower was 13.3%, while the proportion of doctoral degree graduates was 5.4%.
3.1. Evaluation of the Measurement Model
SEM analysis essentially consists of two stages. In the first stage, a measurement model is established that represents the relationships between latent variables and indicator variables. In examining the measurement model, the numerical value representing the relationship between a latent variable and an indicator variable is called a factor loading. Reporting the factor loadings obtained from the confirmatory factor analysis performed for this purpose is important for understanding the strength and direction of the relationship between each indicator and its latent construct. In addition to factor loadings, it is often necessary to report the results regarding the reliability and validity of the constructs in the model. Reliability refers to the consistency of a scale. In PLS-SEM analyses, reliability should be checked for both indicator and latent variables. For indicator reliability, the loading value of an indicator on the relevant construct is examined. This value should be at least 0.400 or higher [39]. For construct reliability, Cronbach’s alpha and composite reliability (CR) values should be examined. The recommended value for both statistics is 0.7 or higher, though the composite reliability value should not exceed 0.95. Another statistic to consider for reliability is rho_A. For construct reliability, it is desirable for the rho_A value to be between the Cronbach’s alpha value and the composite reliability value [53].
After the measurement model is established, confirmatory factor analysis (CFA) is performed to understand how well the available data represents the established model. CFA produces a loading table showing the extent to which each indicator loads onto the relevant construct. Using this table, the factor loadings of the indicator variables onto their relevant construct are examined (Table 3 presents the factor loadings for the measurement model of this study). Depending on the factor loadings, it may be necessary to remove some variables and repeat the CFA. The results of the repeated CFA are re-evaluated, and these processes are repeated until acceptable results are obtained.
In the initial analysis, some items (MC4, PU3, PE2-4-5, and AT2-3) that fell below the recommended threshold values were removed from the dataset, and the measurement model was retested. Following the reanalysis, it was determined that all measurement model criteria were satisfied: the factor loadings ranged from 0.588 to 0.925 in the second run of the PLS-SEM algorithm, and all indicators demonstrated sufficient individual reliability.
When the internal consistency coefficients of the measurement model were examined, it was observed that the Cronbach’s alpha and rho_A values were generally above the recommended threshold value of 0.700, and the CR values, which indicate structural reliability, were also at acceptable levels (Table 3). Although the Cronbach’s alpha value was on the borderline for the attitude toward technology (ATT) construct, the adequate CR and rho_A values and the statistically significant factor loadings of the items supported retaining this construct in the measurement model.
Figure 2.
Measurement model.

Validity refers to the accuracy of a scale in measuring the concept it claims to measure. Researchers are expected to demonstrate the construct validity of the scales that they use. For this purpose, statistics showing the presence of convergent and discriminant validity should be included. Convergent validity refers to the high correlation between indicators measuring the same construct. To demonstrate this, the mean variance (AVE) must be greater than 0.5. Discriminant validity, on the other hand, is used to show that one scale is distinct from others and requires that the indicators of a scale do not show a high correlation with the indicators of other scales. While different methods and criteria have been developed to demonstrate discriminant validity, the Fornell–Larcker criterion and HTMT ratio are frequently used in the literature [40]. However, the HTMT ratio is regarded as more accurate in the literature and should be preferred. To demonstrate discriminant validity, the HTMT ratio should be 0.85 or lower.
The findings in Table 4 show that the √AVE values on the diagonal are higher than the correlations between the constructs, and the HTMT values remain within acceptable limits, indicating that discriminant validity has been achieved in the measurement model.
3.2. Evaluating the Structural Model
Within the scope of PLS-SEM analysis, the explanatory power (R²), effect size (f²), predictive power (Q²) and model fit indicators of the model are taken into account. With these indicators, the general level of fit of the model, the extent to which the independent variables in the model explain the dependent variables, and the relative contribution of each path relationship are evaluated together. The findings obtained in this study are presented comprehensively in Table 5.
As indicated by the results presented in Table 5, the variables attitude toward technology (R² = 0.341) and perceived ease of use (R² = 0.288) have moderate explanatory power, while other endogenous variables have low or low-to-moderate explanatory power. In terms of effect size, the effect of perceived ease of use on technology expertise (f² = 0.366) and the effect of attitude toward technology on New Product Purchase Intention (f² = 0.224) are moderate, while other relationships exhibit predominantly small effect sizes. Furthermore, the Q² values are above zero, indicating that the model has acceptable predictive power. Regarding model fit, the SRMR value of 0.082 for the saturated model shows that the overall fit of the structural model is acceptable within the threshold values suggested in the PLS-SEM literature. Overall, these findings demonstrate that the proposed structural model is appropriately defined in terms of both explanatory power and fit.
3.3. Hypothesis Testing
The proposed research hypotheses were tested using the bootstrap method. In evaluating the hypotheses, the path coefficient (β), T statistic, and p-value were considered. At a 95% confidence level, the criteria for considering the relationship between two constructs as significant are that the T statistic exceeds 1.96 and the p-value is lower than 0.05 [54]. The direct and indirect effects tested within the structural model are presented in Table 6.
Figure 3.
Structural model results (PLS-SEM).

The results show that motivated consumer innovativeness (MCI) has positive and statistically significant effects on technology expertise (TE) (H1 supported; β = 0.355, t = 4.919, p < .001) and perceived ease of use (PEOU) (H2 supported; β = 0.450, t = 7.154, p < .001). In turn, technology expertise has a significant and positive effect on perceived ease of use (H3 supported; β = 0.173, t = 2.399, p < .05).
Furthermore, perceived ease of use has a positive and significant effect on both perceived usefulness (PU) (H4 supported; β = 0.234, t = 3.110, p < .01) and attitude toward technology (ATT) (H5 supported; β = 0.505, t = 8.939, p < .001). Similarly, perceived usefulness shows a significant and positive effect on attitude toward technology (H6 supported; β = 0.198, t = 3.233, p < .01).
According to the findings, attitude toward technology has a strong and positive effect on New Product Purchase Intention (NNPI) and, thus, H7 is supported (β = 0.428, t = 7.379, p < .001). This result shows that attitudinal mechanisms play a central role in the formation of purchase intention for new technology-based products.
The findings regarding the indirect effects show that perceived ease of use, perceived usefulness, attitude toward technology, and technology expertise exert significant partial mediating effects in the relationship between motivated consumer innovativeness and New Product Purchase Intention. Overall, the results indicate that the purchase intention of innovative consumers is not shaped directly by a technological product itself, but indirectly by the cognitive and attitudinal processes underlying technology acceptance.
4. Discussion
In this study, the results of the structural model developed within the context of technology-based consumer products show that the relationships expected along the lines of the Technology Acceptance Model (TAM) are largely confirmed. In particular, perceived ease of use (PEOU) exerts a significant and positive effect on both perceived usefulness (PU) and attitude toward technology (ATT); furthermore, the positive effect of PU on ATT is also supported. This pattern is consistent with the basic assumption of the TAM: perceived ease of use strengthens the perception of utility regarding technology and directly influences attitude, thereby supporting the formation of behavioral intention. In the context of technology-based consumer products, this mechanism may also help explain how favorable perceptions support the sustainable market acceptance of new products over time. Davis’s (1989) original TAM framework and Venkatesh and Davis’s (2000) extended TAM approach also emphasize the decisive role of PEOU and PU in the attitude/intention relationship [12,14]. In this study, the relatively strong magnitude of PEOU’s effect on ATT suggests that user experience (convenience/flow) with technology-based products can be a critical “first contact” determinant in attitude formation. In this respect, the finding is consistent with the extensive body of research based on the TAM; indeed, meta-analytic evidence shows that the core relationships in the TAM are consistently reproduced in different contexts [33]. The finding that the ATT→NPPI path is significant and positive is consistent with the “attitude–intention” continuum in the consumer behavior literature. Similarly, in technology use/adoption studies, attitude is frequently reported as a “proximal” antecedent of behavioral intention; for example, the authors of [34] show that attitudes and perceptual evaluations have strong connections with behavioral intention in studies on information behavior/technology use; their results theoretically support the ATT→NPPI path in this study. Therefore, “attitudinal suitability” (benefit–convenience–attitude sequence) still holds central explanatory power in explaining behavioral intention in the context of new technology-based products.
A unique contribution of this study is the positioning of the variable motivated consumer innovativeness (MCI) in the model as a precursor influencing both perceived technological competence/expertise (TE) and perceived ease of use (PEOU). The findings show that the MCI→TE and MCI→PEOU pathways are significant; furthermore, MCI exerts indirect effects on attitude and purchase intention. These findings are consistent with the scale development and validation logic of the MCI concept, which represents a motivational predisposition that initiates interaction with innovations, and this predisposition often fosters positive perceptions of new products by increasing “learning/trial” behaviors [2]. Indeed, studies explaining the effect of consumer innovativeness on New Product Purchase Intention through different mediators also show that consumer innovativeness directly or indirectly strengthens purchase intention [55]. In the proposed model, the indirect contribution of MCI to NPPI is particularly evident through the pathways involving PEOU and ATT, which is consistent with the argument that the impact of innovations on purchase intention is often shaped by perceptual assessments. This indirect pathway is also meaningful for understanding the sustainable diffusion of technology-based innovations, since consumer innovativeness appears to shape adoption through stable perceptual and attitudinal processes rather than through short-term impulse alone.
The findings regarding technology expertise (TE) are noteworthy in two respects. First, TE’s significant positive impact on PEOU (perceived ease of use) is consistent with the “competence/self-efficacy–ease of use” link frequently emphasized in the technology acceptance literature. If users perceive themselves as technologically competent, they may perceive interaction with a new product as less costly/complex; this can positively influence the ease-of-use assessment. Second, TE’s more limited role in directly explaining PU (and its weak influence in some samples) is a point that may be questioned but is theoretically defensible: technology expertise always reduces the effort and learning cost of the usage process, but it does not affect the benefits of using a product (the actual/functional value of the product). Therefore, TE’s effect on PU can be expected to be context-sensitive; especially in technology-based consumer products, the perception of benefits can be more strongly influenced by factors such as the product’s “performance/functional output” and “fit to need”. This finding is also consistent with studies demonstrating the contextual sensitivity of TAM constructs [56]. From this perspective, technology expertise may contribute more to a sustainable adoption process by reducing usage barriers than by directly shaping benefit perceptions.
The findings for hypotheses H1 and H2 tested in this study reveal that motivated consumer innovativeness has positive and significant effects on both technology expertise and perceived ease of use. These results indicate that innovative individuals are more willing to interact with new technologies and perceive this process as more manageable cognitively. These findings are consistent with previous studies showing that consumer innovativeness shapes perceptual and cognitive evaluations of technology [2,57]. The finding related to hypothesis H3 shows that technology expertise has a significant effect on perceived ease of use. This result reveals that individuals’ levels of knowledge and experience regarding technology contribute to their perception of the use of new products as less cumbersome and more manageable, consistent with recent studies emphasizing that technological self-efficacy strengthens the perception of ease of use [55,56]. Supporting H4 and H5, the positive effects of perceived ease of use on both perceived usefulness and attitude toward technology demonstrate that the core assumptions of the Technology Acceptance Model (TAM) remain valid in this study. These findings that perceived ease of use directly and indirectly shapes individuals’ evaluations of the usefulness of technology and their overall attitudes reflect a set of relationships frequently confirmed in the TAM literature [12,33]. Regarding hypothesis H6, the significant effect of perceived usefulness on attitude toward technology shows that individuals develop more positive attitudes when they perceive technology as useful. This finding aligns with classical and recent studies highlighting the central role of perceived usefulness in attitude formation [12,57]. The findings related to H7 reveal a strong and positive influence of attitude toward technology on New Product Purchase Intention. These results emphasize that purchase intention is shaped by perceptual and attitudinal evaluations, which are distinct from direct individual tendencies, and show that attitude is one of the closest and strongest antecedents in studies on technology-based behavioral intention [34].
The findings regarding the indirect effects prove that the effect of motivated consumer innovativeness on New Product Purchase Intention occurs through intermediate variables such as perceived usefulness, perceived ease of use, and attitude toward technology. This multi-stage cognitive–attitudinal mechanism is in line with similar research arguing that consumer innovativeness does not directly affect purchasing behavior but shapes it through perceptual and attitudinal processes [33,52].
When the research findings were evaluated holistically, it was found that motivated consumer innovativeness (MCI) related to intention to purchase technology-based new products is an early determinant shaping user perceptions, while technology expertise (TE) also positively influences perceived ease of use, and attitude toward technology (ATT) is one of the closest and strongest explanatory factors of purchase intention. In this context, the research results are similar to studies based on the TAM and meta-analysis showing that consumer innovativeness facilitates new product adoption [2,33,52,58].
Overall, this research reveals that users’ purchase intention of technology-based new products is shaped by a multi-stage and sequential evaluation process that operates through perceived ease of use, perceived usefulness, and attitude toward technology, aside from individual innovation tendencies.
5. Conclusion
In this research, the relationships between motivated consumer innovativeness, cognitive evaluations of technology acceptance, and attitudinal processes in the context of technology-based consumer products were examined within a holistic structural model. According to the findings, consumers’ purchase intention of new technology-based products is shaped not directly by individual innovation tendencies but by sequential cognitive and attitudinal evaluations involving perceived ease of use, perceived usefulness, and attitude toward technology. These findings also suggest that sustainable market acceptance of technology-based new products depends on a sequential cognitive and attitudinal evaluation process, rather than on innovation alone.
In this study, it was found that motivated consumer innovativeness exerts significant effects on technology expertise and perceived ease of use. Accordingly, individuals with innovative tendencies have higher cognitive readiness and adaptation capacity to interact with new technologies. However, the findings suggest that innovative tendency functions not as a direct determinant of purchase intention, but as a preliminary construct shaping cognitive evaluations of technology that subsequently drive acceptance. In this respect, the findings support research approaches that consider the consumer innovativeness–behavior relationship as a multi-stage process rather than a single-stage effect mechanism.
The model results show that perceived ease of use and perceived usefulness play central roles in the formation of attitude toward technology, and that attitude toward technology is one of the strongest and closest determinants of New Product Purchase Intention. These findings demonstrate that the fundamental assumptions of the Technology Acceptance Model remain valid in the context of technology-based consumer products, and that cognitive evaluations are reflected in behavioral intention indirectly through attitude.
When the overall performance of the structural model, its explanatory power, effect sizes, and model fit indicators were evaluated comprehensively, the proposed model was confirmed to offer a theoretically consistent and empirically supported framework. The moderate effect sizes obtained for some relationships in the evaluation show that the model is not limited to producing statistically significant relationships, but also has the capacity to offer a conceptually and practically meaningful explanation.
This research contributes to the consumer innovativeness literature by revealing that consumer innovativeness affects technology-based product purchase intention through an indirect and process-based mechanism. Furthermore, the research contributes to the technology acceptance literature by integrating consumer innovativeness with perceptual and attitudinal assessments of technology, which provides a more comprehensive framework for explaining consumer behavior. This integrated perspective contributes to a better understanding of how technology-based innovations can achieve more sustainable consumer adoption in competitive markets.
This research reveals that individual innovative tendencies alone are not sufficient to explain the adoption of new technology-based products by consumers, and that these tendencies are reflected in behavioral intention only through cognitive and attitudinal factors such as perceived ease of use, perceived usefulness, and positive attitude. In this respect, the study offers a methodologically cautious and theoretically consistent explanation that integrates the literature on technology adoption and consumer innovativeness. Accordingly, firms aiming to achieve long-term and sustainable adoption of technology-based new products should focus not only on innovations, but also on perceived ease of use, perceived usefulness, and positive attitudes toward technology.
Funding
This research received no external funding.
Institutional Review Board Statement
Ethics Committee approval was obtained from the Istanbul Rumeli University Ethics Committee Presidency for the data collection process (dated 24 December 2025, with approval number 04-63715/2025-12).
Informed Consent Statement
Informed consent was obtained from all participants included in the study. Participants were informed that their participation was entirely voluntary, that the data collected would be used solely for scientific research purposes, and that confidentiality would be maintained throughout the study.
Data Availability Statement
The datasets generated and analyzed during the current study are not publicly available to preserve research participants’ privacy but are available from the corresponding author upon reasonable request.
Conflicts of Interest
The author declares no conflicts of interest.
References
- Midgley, D.F.; Dowling, G.R. Innovativeness: The Concept and Its Measurement. Journal of Consumer Research 1978, 4, 229. [CrossRef]
- Vandecasteele, B.; Geuens, M. Motivated Consumer Innovativeness: Concept, Measurement, and Validation. International Journal of Research in Marketing 2010, 27, 308–318. [CrossRef]
- Hirunyawipada, T.; Paswan, A.K. Consumer Innovativeness and Perceived Risk: Implications for High Technology Product Adoption. Journal of Consumer Marketing 2006, 23, 182–198. [CrossRef]
- Steenkamp, J.-B.E.M.; ter Hofstede, F.; Wedel, M. A Cross-National Investigation into the Individual and National Cultural Antecedents of Consumer Innovativeness. J. Mark. 1999, 63, 55. [CrossRef]
- Tellis, G.J.; Yin, E.; Bell, S. Global Consumer Innovativeness: Cross-Country Differences and Demographic Commonalities. Journal of International Marketing 2009, 17, 1–22. [CrossRef]
- Kalinic, Z.; Marinkovic, V. Determinants of Users’ Intention to Adopt m-Commerce: An Empirical Analysis. Information Systems and e-Business Management 2016, 14, 367–387. [CrossRef]
- Kaushik, A.K.; Rahman, Z. An Alternative Model of Self-Service Retail Technology Adoption. Journal of Services Marketing 2015, 29, 406–420. [CrossRef]
- Lee, C.; Spisto, M. Medical Tourism, the Future of Health Services. In Proceedings of the Proceedings of the 12th International Conference on ISO; 2007; pp. 1–7.
- Lönnqvist, J.E.; Walkowitz, G.; Verkasalo, M.; Wichardt, P.C. Situational Power Moderates the Influence of Self-Transcendence vs. Self-Enhancement Values on Behavior in Ultimatum Bargaining. J. Res. Pers. 2011, 45, 336–339. [CrossRef]
- Lu, J. Are Personal Innovativeness and Social Influence Critical to Continue with Mobile Commerce? Internet Research 2014, 24, 134–159. [CrossRef]
- Gökbulut Özdemir, Ö.; Açıkgöz, O.E. Yenilikçi Tüketime Etki Eden Faktörler: Giyilebilir Teknoloji Üzerine Bir Araştirma. Elektronik Sosyal Bilimler Dergisi 2023, 22, 1027–1048. [CrossRef]
- Davis, F.D. Perceived Usefulness, Perceived Ease of Use, and User Acceptance of Information Technology. MIS Quarterly 1989, 13, 319. [CrossRef]
- Davis, F.D.; Bagozzi, R.P.; Warshaw, P.R. Extrinsic and Intrinsic Motivation to Use Computers in the Workplace 1. J. Appl. Soc. Psychol. 1992, 22, 1111–1132. [CrossRef]
- Venkatesh, V.; Davis, F.D. A Theoretical Extension of the Technology Acceptance Model: Four Longitudinal Field Studies. Manage. Sci. 2000, 46, 186–204. [CrossRef]
- Agarwal, R.; Karahanna, E. Time Flies When You’re Having Fun: Cognitive Absorption and Beliefs About Information Technology Usage1. MIS Quarterly 2000, 24, 665–694. [CrossRef]
- Venkatraman, N.; Ramanujam, V. Measurement of Business Performance in Strategy Research: A Comparison of Approaches. The Academy of Management Review 1986, 11, 801. [CrossRef]
- Rogers, E. Diffusion of Innovations; The Free Press: New York, 2003;
- Venkatesh, V.; Thong, J.Y.L.; Xu, X. Consumer Acceptance and Use of Information Technology: Extending the Unified Theory of Acceptance and Use of Technology1. MIS Quarterly 2012, 36, 157–178. [CrossRef]
- Tsu Wei, T.; Marthandan, G.; Yee-Loong Chong, A.; Ooi, K.; Arumugam, S. What Drives Malaysian M-commerce Adoption? An Empirical Analysis. Industrial Management & Data Systems 2009, 109, 370–388. [CrossRef]
- Hosein, N.Z. Internet Banking: An Empirical Study of Adoption Rates Among Midwest Community Banks. Journal of Business & Economics Research (JBER) 2011, 7. [CrossRef]
- Chen, Y.; Wang, H.; Zhang, D.; Zhang, L.; Tao, L. Multi-Feature Fusion Learning for Alzheimer’s Disease Prediction Using EEG Signals in Resting State. Front. Neurosci. 2023, 17. [CrossRef]
- Chen, X.; Zhang, X. How Environmental Uncertainty Moderates the Effect of Relative Advantage and Perceived Credibility on the Adoption of Mobile Health Services by Chinese Organizations in the Big Data Era. Int. J. Telemed. Appl. 2016, 2016, 1–11. [CrossRef]
- Ha, N.T. The Impact of Perceived Risk on Consumers’ Online Shopping Intention: An Integration of TAM and TPB. Management Science Letters 2020, 2029–2036. [CrossRef]
- Weng, F.; Yang, R.-J.; Ho, H.-J.; Su, H.-M. A TAM-Based Study of the Attitude towards Use Intention of Multimedia among School Teachers. Applied System Innovation 2018, 1, 36. [CrossRef]
- Shaikh, A.A.; Karjaluoto, H. Mobile Banking Adoption: A Literature Review. Telematics and Informatics 2015, 32, 129–142. [CrossRef]
- Robey, D.; Zeller, R.L. Factors Affecting the Success and Failure of an Information System for Product Quality. Interfaces (Providence). 1978, 8, 70–75. [CrossRef]
- Zhang, L.; Zhu, J.; Liu, Q. A Meta-Analysis of Mobile Commerce Adoption and the Moderating Effect of Culture. Comput. Human Behav. 2012, 28, 1902–1911. [CrossRef]
- Akturan, U.; Tezcan, N. Mobile Banking Adoption of the Youth Market. Marketing Intelligence & Planning 2012, 30, 444–459. [CrossRef]
- AlSoufi Ali Customers Perception of M-Banking Adoption in Kingdom of Bahrain: An Empirical Assessment of an Extended TAM Model. International Journal of Managing Information Technology (IJMIT) 2014, 6.
- Dai, H.; Palvi, P.C. Mobile Commerce Adoption in China and the United States. ACM SIGMIS Database: the DATABASE for Advances in Information Systems 2009, 40, 43–61. [CrossRef]
- Deb, M.; Lomo-David, E. An Empirical Examination of Customers’ Adoption of m-Banking in India. Marketing Intelligence & Planning 2014, 32, 475–494. [CrossRef]
- Khalifa, M.; Shen, K. Drivers for Transactional B2C M-Commerce Adoption: Extended Theory of Planned Behavior. Journal of Computer Information Systems 2008, 48, 111–117.
- King, W.R.; He, J. A Meta-Analysis of the Technology Acceptance Model. Information & Management 2006, 43, 740–755. [CrossRef]
- Marikyan, D.; Papagiannidis, S.; Stewart, G. Technology Acceptance Research: Meta-Analysis. J. Inf. Sci. 2023. [CrossRef]
- Ajzen, I. The Theory of Planned Behavior. Organ. Behav. Hum. Decis. Process. 1991, 50, 179–211. [CrossRef]
- Asshidin, N.H.N.; Abidin, N.; Borhan, H.B. Consumer Attitude and Uniqueness towards International Products. Procedia Economics and Finance 2016, 35, 632–638. [CrossRef]
- Dwivedi, Y.K.; Hughes, L.; Ismagilova, E.; Aarts, G.; Coombs, C.; Crick, T.; Duan, Y.; Dwivedi, R.; Edwards, J.; Eirug, A.; et al. Artificial Intelligence (AI): Multidisciplinary Perspectives on Emerging Challenges, Opportunities, and Agenda for Research, Practice and Policy. Int. J. Inf. Manage. 2021, 57, 101994. [CrossRef]
- Tang, Y.; Wang, X.; Lu, P. Chinese Consumer Attitude and Purchase Intent towards Green Products. Asia-Pacific Journal of Business Administration 2014, 6, 84–96. [CrossRef]
- Sarstedt, M.; Ringle, C.M.; Hair, J.F. Partial Least Squares Structural Equation Modeling. In Handbook of Market Research; Springer International Publishing: Cham, 2021; pp. 1–47.
- Fornell, C.; Larcker, D.F. Evaluating Structural Equation Models with Unobservable Variables and Measurement Error. Journal of Marketing Research 1981, 18, 39–50. [CrossRef]
- Özoğlu, B.; Bülbül, H. Güdülenmiş Tüketici Yenilikçiliği ve Algılanan Risk Ölçeklerinin Geçerlilik ve Güvenilirlik Çalışması. Uluslararası Alanya İşletme Fakültesi Dergisi 2013, 5, 131–139.
- Casaló, L. V.; Flavián, C.; Guinalíu, M. Relationship Quality, Community Promotion and Brand Loyalty in Virtual Communities: Evidence from Free Software Communities. Int. J. Inf. Manage. 2010, 30, 357–367. [CrossRef]
- Park, D.-H.; Lee, J.; Han, I. The Effect of On-Line Consumer Reviews on Consumer Purchasing Intention: The Moderating Role of Involvement. International Journal of Electronic Commerce 2007, 11, 125–148. [CrossRef]
- Ecevit, M.Z.; Duman, O. Tüketicilerin Yenilenmiş Ürün Satın Alma Niyetine Etki Eden Faktörlerin Incelenmesi. Business & Management Studies: An International Journal 2022, 10, 997–1010. [CrossRef]
- Bhattacherjee, A. Understanding Information Systems Continuance: An Expectation-Confirmation Model1. MIS Quarterly 2001, 25, 351–370. [CrossRef]
- Devaraj, S.; Fan, M.; Kohli, R. Antecedents of B2C Channel Satisfaction and Preference: Validating e-Commerce Metrics. Information Systems Research 2002, 13, 316–333. [CrossRef]
- van der Heijden, H. Factors Influencing the Usage of Websites: The Case of a Generic Portal in The Netherlands. Information & Management 2003, 40, 541–549. [CrossRef]
- Davis, F.D.; Bagozzi, R.P.; Warshaw, P.R. User Acceptance of Computer Technology: A Comparison of Two Theoretical Models. Manage. Sci. 1989, 35, 982–1003. [CrossRef]
- Taylor, S.; Todd, P.A. Understanding Information Technology Usage: A Test of Competing Models. Information Systems Research 1995, 6, 144–176. [CrossRef]
- Senaviratna, N.A.M.R.; A. Cooray, T.M.J. Diagnosing Multicollinearity of Logistic Regression Model. Asian Journal of Probability and Statistics 2019, 1–9. [CrossRef]
- Hair, J.F.; Hult, G.T.M.; Ringle, C.M.; Sarstedt, M. A Primer on Partial Least Squares Structural Equation Modeling (PLS-SEM); 2nd Edition.; Sage Publications Inc.: Thousand Oaks, CA., 2017;
- Al-Jundi, S.A.; Shuhaiber, A.; Augustine, R. Effect of Consumer Innovativeness on New Product Purchase Intentions through Learning Process and Perceived Value. Cogent Business & Management 2019, 6. [CrossRef]
- AlQudah, A.A.; Al-Emran, M.; Shaalan, K. Technology Acceptance in Healthcare: A Systematic Review. Applied Sciences 2021, 11, 10537. [CrossRef]
- Wu, M.; Lin, A.S.Q.; Yuen, K.F. The Effects of Motivated Consumer Innovativeness on Consumer Acceptance of Autonomous Delivery Robots. Journal of Retailing and Consumer Services 2024, 81, 104030. [CrossRef]
- Holden, H.; Rada, R. Understanding the Influence of Perceived Usability and Technology Self-Efficacy on Teachers’ Technology Acceptance. Journal of Research on Technology in Education 2011, 43, 343–367. [CrossRef]
- Moghavvemi, S. Impact of Perceived Self-Efficacy and Capability to Use IT Innovation on Individual Use Behaviour. SSRN Electronic Journal 2015. [CrossRef]
- Özkaynar, K. Teknoloji Kabul Modeli Çerçevesinde, Tüketicilerin Yapay Zekâ Araçlarini Kullanimlarinda Algilanan Fayda, Tutum ve Niyetler Arasindaki İlişki: Etik Kaygilarin Düzenleyici Etkisi. Yönetim Bilimleri Dergisi 2024. [CrossRef]
- Kim, J.-H.; Kang, E. An Empirical Research: Incorporation of User Innovativeness into TAM and UTAUT in Adopting a Golf App. Sustainability 2023, 15, 8309. [CrossRef]
Figure 1.
Research model and hypothesized relationships. Note: motivated consumer innovativeness (MCI), New Product Purchase Intention (NPPI), perceived usefulness (PU), technology expertise (TE), perceived ease of use (PEOU), and attitude toward technology (ATT).
Figure 1.
Research model and hypothesized relationships. Note: motivated consumer innovativeness (MCI), New Product Purchase Intention (NPPI), perceived usefulness (PU), technology expertise (TE), perceived ease of use (PEOU), and attitude toward technology (ATT).

Table 2.
Demographic characteristics of participants.
| Variable | Category | n | % |
| Gender | Male | 158 | 61.7 |
| Female | 98 | 38.3 | |
| Age | 18–29 | 62 | 24.2 |
| 30–39 | 104 | 40.6 | |
| 40–49 | 58 | 22.7 | |
| 50 and above | 32 | 12.5 | |
| Educational level | High school or below | 34 | 13.3 |
| Bachelor’s degree | 142 | 55.5 | |
| Master’s degree | 66 | 25.8 | |
| Doctorate | 14 | 5.4 |
Table 3.
Findings on the reliability and validity of the measurement model.
| Scale | Item | Factor Load | Cronbach’s alpha | rho_A | CR | AVE | R2 | T value | VIF |
| > 0.70 | > 0.70 | > 0.70 | > 0.70 | > 0.50 | > 0.30 | > 1.96 | < 5 | ||
| Motivated Consumer Innovativeness (MCI) | MC1 | 0.833 | 0.739 | 0.775 | 0.832 | 0.558 | 25.977 | 3.193 | |
| MC2 | 0.588 | 13.387 | 3.271 | ||||||
| MC3 | 0.821 | 19.238 | 3.378 | ||||||
| MC5 | 0.720 | 23.192 | 1.707 | ||||||
| New Product Purchase Intention (NPPI) | NP1 | 0.897 | 0.845 | 0.891 | 0.904 | 0.758 | 0.188 | 7.218 | 1.964 |
| NP2 | 0.871 | 21.913 | 1.575 | ||||||
| NP3 | 0.843 | 10.950 | 1.163 | ||||||
| Perceived Usefulness (PU) | PU1 | 0.885 | 0.895 | 0.897 | 0.928 | 0.762 | 0.055 | 56.195 | 1.537 |
| PU2 | 0.801 | 37.329 | 1.951 | ||||||
| PU4 | 0.903 | 19.029 | 1.855 | ||||||
| PU5 | 0.899 | 37.040 | 1.677 | ||||||
| Technology Expertise (TE) | TE1 | 0.891 | 0.904 | 0.922 | 0.933 | 0.778 | 0.126 | 43.330 | 1.547 |
| TE2 | 0.920 | 28.629 | 1.547 | ||||||
| TE3 | 0.925 | 19.063 | 4.439 | ||||||
| TE4 | 0.785 | 38.218 | 4.611 | ||||||
| Perceived Ease of Use (PEOU) | PE1 | 0.885 | 0.746 | 0.748 | 0.887 | 0.797 | 0.288 | 39.199 | 1.879 |
| PE3 | 0.901 | 47.634 | 2.649 | ||||||
| Attitude Toward Technology (ATT) | AT1 | 0.834 | 0.679 | 0.682 | 0.824 | 0.611 | 0.341 | 58.897 | 2.046 |
| AT4 | 0.718 | 67.509 | 1.904 | ||||||
| AT5 | 0.788 | 19.347 | 2.203 |
Table 4.
Discriminant validity assessment (Fornell–Larcker and HTMT).
| Construct | (PU) | (PEOU) | (TE) | (ATT) | (MCI) | (NNPI) |
| Perceived Usefulness (PU) | 0.873 | 0.281 | 0.689 | 0.402 | 0.336 | 0.317 |
| Perceived Ease of Use (PEOU) | 0.234 | 0.893 | 0.403 | 0.769 | 0.656 | 0.443 |
| Technology Expertise (TE) | 0.629 | 0.333 | 0.882 | 0.462 | 0.425 | 0.296 |
| Attitude Toward Technology (AAT) | 0.316 | 0.551 | 0.365 | 0.781 | 0.671 | 0.528 |
| Motivated Consumer Innovativeness (MCI) | 0.263 | 0.511 | 0.355 | 0.486 | 0.747 | 0.570 |
| New Product Purchase Intention (NNPI) | 0.294 | 0.355 | 0.264 | 0.428 | 0.427 | 0.871 |
| Note: Diagonal values represent √AVE (Fornell–Larcker), below-diagonal values show correlations, and above-diagonal values indicate HTMT ratios. | ||||||
Table 5.
Structural model quality, effect size, and model fit (PLS-SEM).
| Evaluation Dimension | Construct/Path | Indicator | Value | Interpretation |
| Explanatory Power | Perceived Usefulness (PU) | R² | 0.055 | Low |
| Perceived Ease of Use (PEOU) | R² | 0.288 | Moderate | |
| Technology Expertise (TE) | R² | 0.126 | Low | |
| Attitude Toward Technology (ATT) | R² | 0.341 | Moderate | |
| New Product Purchase Intention (NNPI) | R² | 0.183 | Low–Moderate | |
| Effect Size | PU → ATT | f² | 0.056 | Small |
| PEOU → PU | f² | 0.058 | Small | |
| PEOU → TE | f² | 0.366 | Medium | |
| ATT → NNPI | f² | 0.224 | Medium | |
| TE → PEOU | f² | 0.037 | Small | |
| MCI → PEOU | f² | 0.248 | Medium | |
| MCI → TE | f² | 0.144 | Small | |
| Predictive Relevance | Endogenous constructs | Q² | > 0 | Predictive relevance established |
| Model Fit | Saturated Model | SRMR | 0.082 | Acceptable |
| Overall model | NFI | 0.731 | Acceptable |
Table 6.
Direct, indirect, and total effects in the structural model (PLS-SEM).
| Effect Type | Hypothesis/Path | β | Std. dev. | T statistic | p-value | Result |
| Direct effect | H1: MCI → TE | 0.355 | 0.072 | 4.919 | < .001 | Supported |
| H2: MCI → PEOU | 0.450 | 0.063 | 7.154 | < .001 | Supported | |
| H3: TE → PEOU | 0.173 | 0.072 | 2.399 | .016 | Supported | |
| H4: PEOU → PU | 0.234 | 0.075 | 3.110 | .002 | Supported | |
| H5: PEOU → ATT | 0.505 | 0.056 | 8.939 | < .001 | Supported | |
| H6: PU → ATT | 0.198 | 0.061 | 3.233 | .001 | Supported | |
| H7: ATT → NNPI | 0.428 | 0.058 | 7.379 | < .001 | Supported | |
| Indirect effect | H8a: MCI → ATT | 0.282 | 0.050 | 5.611 | < .001 | Partial mediation |
| H8b: MCI → NNPI | 0.121 | 0.031 | 3.854 | < .001 | Partial mediation | |
| H8c: MCI → PEOU | 0.062 | 0.029 | 2.126 | .034 | Partial mediation | |
| H8d: MCI → PU | 0.119 | 0.042 | 2.822 | .005 | Partial mediation | |
| H8e: PEOU → ATT | 0.046 | 0.021 | 2.177 | .030 | Partial mediation | |
| H8f: PEOU → NNPI | 0.236 | 0.046 | 5.118 | < .001 | Partial mediation | |
| H8g: PU → NNPI | 0.085 | 0.032 | 2.655 | .008 | Partial mediation | |
| H8h: TE → ATT | 0.096 | 0.042 | 2.274 | .023 | Partial mediation | |
| H8i: TE → NNPI | 0.041 | 0.020 | 2.025 | .043 | Partial mediation | |
| H8j: TE → PU | 0.041 | 0.028 | 1.444 | .149 | Rejected | |
| Total effect | MCI → ATT | 0.282 | 0.050 | 5.611 | < .001 | Significant |
| MCI → NNPI | 0.121 | 0.031 | 3.854 | < .001 | Significant | |
| PEOU → ATT | 0.551 | 0.057 | 9.624 | < .001 | Significant | |
| PEOU → NNPI | 0.236 | 0.046 | 5.118 | < .001 | Significant | |
| PU → NNPI | 0.085 | 0.032 | 2.655 | .008 | Significant |
Disclaimer/Publisher’s Note: The statements, opinions and data contained in all publications are solely those of the individual author(s) and contributor(s) and not of MDPI and/or the editor(s). MDPI and/or the editor(s) disclaim responsibility for any injury to people or property resulting from any ideas, methods, instructions or products referred to in the content. |
© 2026 by the authors. Licensee MDPI, Basel, Switzerland. This article is an open access article distributed under the terms and conditions of the Creative Commons Attribution (CC BY) license (http://creativecommons.org/licenses/by/4.0/).
Copyright: This open access article is published under a Creative Commons CC BY 4.0 license, which permit the free download, distribution, and reuse, provided that the author and preprint are cited in any reuse.


