

Submitted:
30 March 2026
Posted:
31 March 2026
You are already at the latest version
Abstract
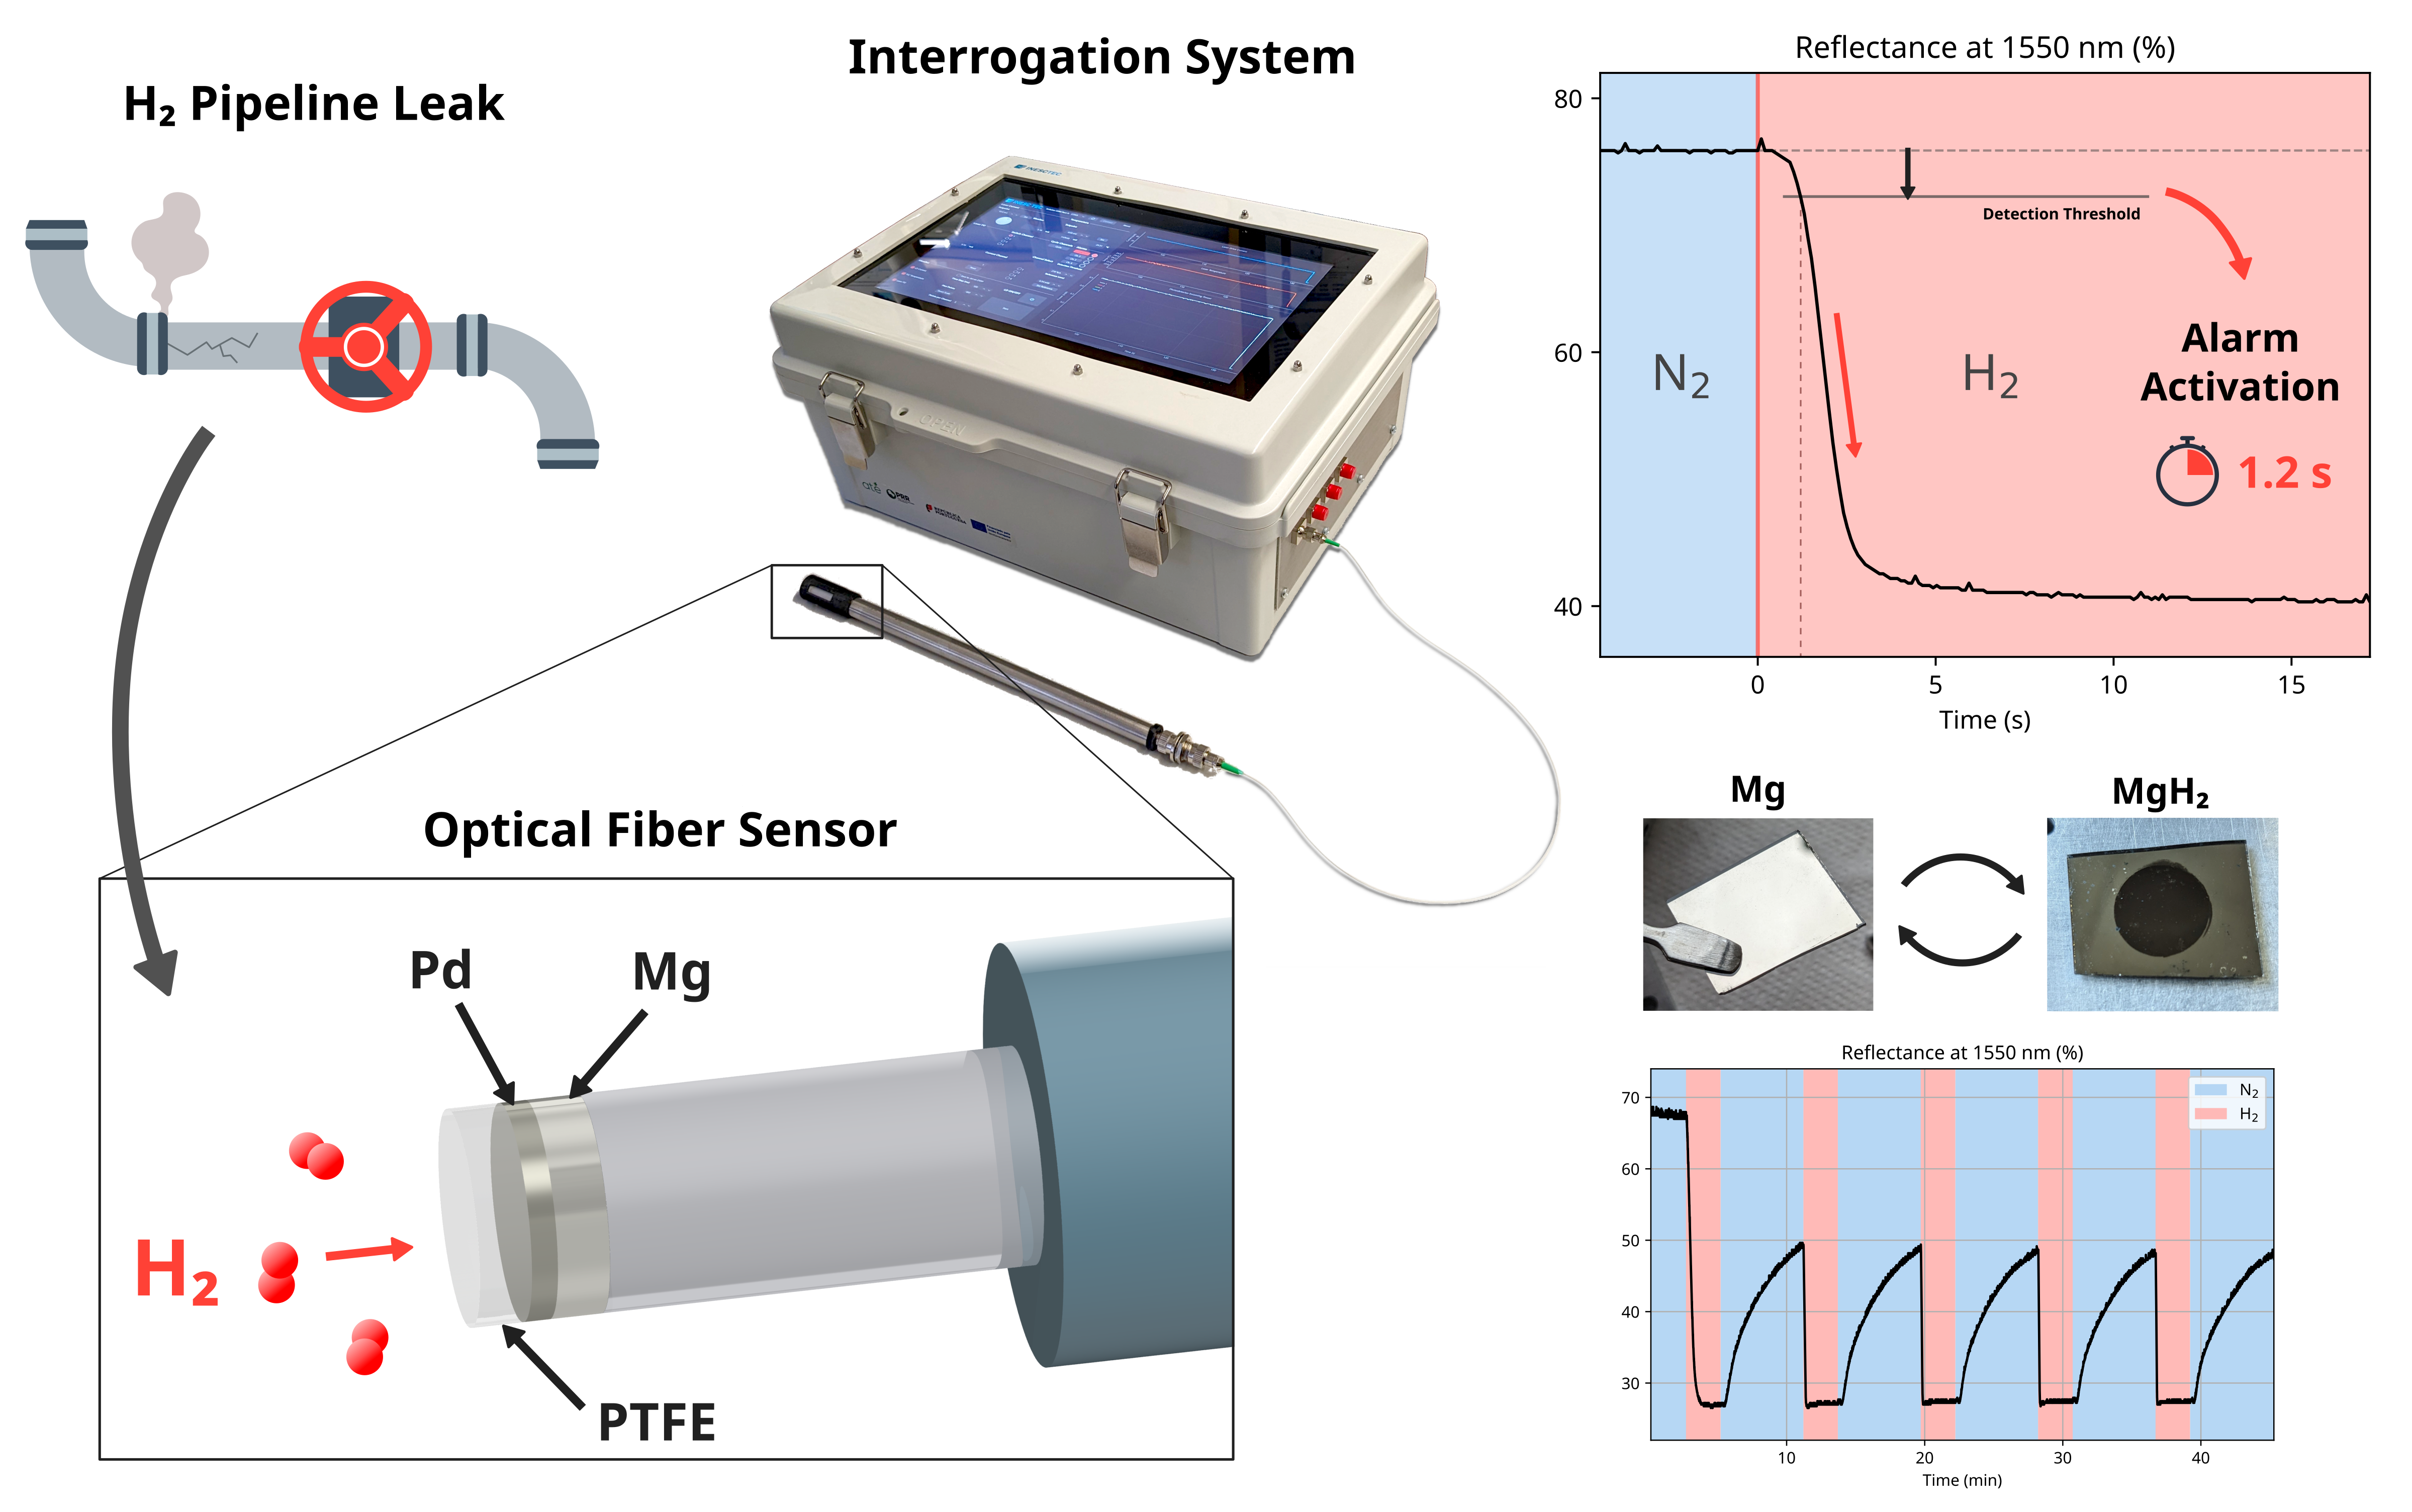
Detection of leaks in hydrogen (H2) infrastructure is required on a large scale to enable a safe widespread use of this clean energy source. Sensing solutions must be low-cost, use scalable fabrication methods and allow multiplexed detection, while providing reliable safety alarms as fast as possible. Optical methods can make this possible while avoiding the risk of ignition due to electronics at the point of detection. Metal hydride-based micro-mirror configurations benefit from a simple interrogation scheme, as long as the sensitive element can produce a large optical response. Magnesium thin films undergo a drastic variation of properties when hydrogenated, making them suitable for this application. In this work, a micro-mirror device using single-mode fibers capable of detecting the presence of H2 with a loading t10 and t90 of 1.2 and 3.0 seconds, respectively, is demonstrated. A complete interrogation unit was developed, presenting a solution suited for widespread deployment using industry-standard optical components and equipment.
Keywords:
hydrogen sensor
; optical fiber sensors
; metal hydrides
; magnesium
; thin films
1. Introduction
Hydrogen (H2) is, nowadays, a significant part of many initiatives for the transition to cleaner energy vectors and sources. Just recently, in the context of COP29, in Azerbaijan, 62 countries pledged to speed up the production of low-carbon hydrogen and include it in their national energy and climate programs, through the "COP29 Hydrogen Declaration" [1]. This is happening in recognition of several advantageous characteristics of H2 - namely, its unparalleled energy density and the lack of environmentally harmful byproducts on combustion [2]. A key point of the above-mentioned initiatives is the widespread construction and re-purposing of gas infrastructure for H2, with tens of thousands of kilometers of pipelines planned to enter operation by 2030 [3]. Together with other structures such as refueling posts or storage tanks, these result in a growing demand for solutions that can ensure safety and maintain public trust.
Due to hydrogen’s wide flammability range (4-75 vol.%) and low ignition energy, this will require adequate monitoring of concentration and quick detection of leaks at any number of points [4]. For leaks in particular, signaling the presence of H2 as fast as possible to prevent fires and explosions is a priority, rather that determining an exact concentration. There is a wide variety of sensing methods available – resistive, electrochemical, catalytic, etc. – but optical sensors have emerged as advantageous for these applications in large part due to the possibility of avoiding the presence of electronics at the point of detection, eliminating the risk of ignition due to sparks or discharges [5]. The use of optical fibers and industry-standard technologies, specifically single-mode fibers (SMFs) and C-band wavelengths (1530–1565 nm), makes other beneficial features such as remote detection or immunity to EM interference possible, while lowering overall costs. Methods employing fibers show a great variety, including intensity measurement, the use of gratings (FBGs), those based on the surface plasmon resonance phenomenon (SPR) [6] or interferometric techniques. Simple configurations like the “micro-mirror” approach can be easily fabricated using physical vapor deposition techniques, requiring little more than guiding optical power to a structure on the tip of a fiber and measuring the reflected intensity.
The use of metal hydrides as micro-mirrors in optical fiber hydrogen sensors has already been shown, for example, by Butler [7], Slaman et al. [8], Yi et al. [9] or more recently, by Verhoeff et al. [10]. In particular, Slaman et al. present a sensitive structure that includes thin films of magnesium (Mg) alloys, such as Mg-Ti or Mg-Ni. Magnesium is considered to have the most drastic variation in optical properties when undergoing its phase transition to a hydride state, compared to other metal hydrides [11], thus providing a larger response amplitude in sensors with intensity measurements, which usually lack the sensitivity of more complex interrogation methods.
Direct hydrogenation of a Mg film does not, however, occur at ambient temperature and low pressures. The use of a thin palladium (Pd) catalyst layer above the film can promote dissociation and adsorption of H2 molecules while also protecting from oxidation [12]. There is also the issue of reversibility: magnesium hydride (MgH2) is highly stable, and efficient dehydrogenation usually requires high pressures and/or temperatures well above ambient conditions [13].
While the use of the afore-mentioned alloys is known to offer improved desorption kinetics and reversibility, the fabrication of these alloys with specific optimal compositions may present financial or technical hurdles to the large-scale implementation or adoption of Mg-based sensors. Meanwhile, the use of simple Pd-capped Mg films has not been investigated enough regarding their applicability in fast sensors for the presence of H2. Furthermore, the measurement of very small response times (on the order of a few seconds) specifically for micro-mirror H2 sensors that use these materials is rarely reported in the literature. Apart from a few examples, such as Yi et al. with a 6 s loading time, Slaman et al. with 12.5 s, or Liu et al. [14] with a t90 of 200s at 4vol.%, these metrics are usually omitted or not measured due to the lack of an appropriate setup (as mentioned by Verhoeff et al., for example). Even when a faster response is obtained, the amplitude of signal variation may be small, making detection more difficult and increasing interrogation equipment costs.
In this work, we demonstrate the feasibility of quick H2 detection with Pd-capped Mg thin films, and show how such micro-mirror devices can be fabricated SMFs using scalable methods, obtaining structures capable of signaling the presence of H2 extremely quickly, with an easily detectable variation in the optical signal. Additionally, a standalone interrogation unit prototype is presented, providing a proof-of-concept for a remote and multi-point leak detection system.
2. Materials and Methods
The optical behavior of thin film structures consisting of Pd-capped Mg layers (on glass substrates) was simulated using the Transfer Matrix Method (TMM), with the variation in reflectance between the metallic and the hydride phase being calculated using refractive index data from Palm et al. [11]. This result was used to determine an optimal range of layer sizes for Mg and Pd, maximizing optical contrast while maintaining an overall low thickness, for quickly reaching a higher degree of hydrogenation in the structure.
2.1. Fabrication
Initially, the hydrogenation at ambient conditions of Pd-capped Mg films, of thicknesses around 100 nm, was verified using planar glass substrates. The samples were fabricated by RF Magnetron Sputtering, using a custom-built setup, which allowed for the deposition of protective polymer layers. The use of a multi-target system proved necessary due to the quick oxidation of the Mg film between vacuum cycles, blocking hydrogen diffusion. Then, 20 nm Mg films capped with 10 nm of Pd where deposited on the tips of Corning SMF-28 single-mode fibers. This was repeated with the addition of a 30 nm polytetrafluoroethylene (PTFE) protective layer, to investigate its impact on the sensor’s performance. In all instances, deposition of Mg, Pd, and PTFE was carried out with applied RF powers of 12W, 12W, and 20W, respectively, with film thickness being monitored using a high-resolution quartz microbalance.
2.2. Characterization
All samples were characterized at room temperature and ambient pressure, in a controlled gas flow setup (Figure 1) which includes a sealed chamber with gas inlets/outlets, optical fiber feed-throughs, and a pressure gauge. Gas flows are routed into the chamber using mass flow controllers, which are managed via computer with software developed for this purpose.
For planar substrates, substrate-side reflectance spectra were monitored by inserting samples into a smaller vessel, placed inside the chamber. This allowed light coming from a multi-mode (MM) fiber feed-through to hit the substrate and be reflected back, while gas was made to flow across the sample’s top side by connecting chamber inlets to holes in the vessel’s top piece. An O-ring, tightly pressed against the sample, avoided leakage of this flow into the surroundings. The sample’s top side was exposed to a 4 vol.% H2 flow after a few minutes of a 100% N2 flow. As for the fiber samples, a different setup was used (Figure 2). The fiber tips were inserted into a small chamber along which the gas is made to flow, covered with a glass slide which is pressed against an O-ring with a screwed-on lid. The inner setups were placed inside the large sealed chamber depicted in Figure 1 for safety reasons, preventing leakage of test gases into the surrounding environment.
In order for measurements of very low response times to be possible, H2 and N2 flows of 300 ml/min are routed separately and fed directly to the fiber tip, minimizing the delay between the change in flow at the mass flow controllers and the actual exposure of the sensing structure to hydrogen. After accounting for the volume of tubing and the error introduced from electronic noise, an upper bound of 300 ms was calculated for the error in the determination of the response times. IR reflectance spectra were recorded using an optical spectrum analyzer, while all time-domain reflectance measurements for fiber samples were made using the interrogation system specifically developed for this work, which employs a 1550 nm fiber-coupled laser diode as a source.
2.3. Interrogation System
A working prototype for a standalone interrogation system was developed, encompassing a 1550 nm laser diode (XYT Sharetop CWDM TEC Pigtail Laser Diode) with built-in thermoelectric temperature control, a laser driver (Wavelength Electronics LDTC0520) capable of setting the diode’s current and temperature, an InGaAs PIN photodiode (EPM 606LL) and a MEMS optical switch (Optosun 1x4 Mini Size). A microcontroller unit controls these devices and acquires the photodetector’s signal, communicating with a computer. Finally, a circulator distributes the optical power from the laser diode to the optical switch, being reflected at one of the several detector fiber tips that can be connected and routed back to the photodetector. This architecture is shown in Figure 3.
The computer, embedded into the prototype, can acquire data and monitor the system at a rate of up to 25 Hz. A software application was specifically developed to control the laser output and channel switching, while providing real-time visualization and the possibility of saving data. It is also able to detect quick decreases in the incoming signals and show alarm warnings based on configurable thresholds.
An enclosure for the sensitive fiber tips was designed, consisting of a hollow steel tube with evenly distributed slits on one of its ends. A similarly slitted cap covers this area, with a sheet of micro-porous mesh underneath. The mesh, with a hole size of 15 m, protects the fiber from dust, mechanical and chemical damage, without restricting airflow. On the opposite end, a connectorized SMF pigtail is spliced to the fiber, providing an easy connection method. Figure 3b shows the prototype, with a detection probe, connected to one of the outputs.
3. Results
3.1. Pd-capped Mg films
TMM calculations showed, for a Pd-capped Mg thin film, that while the reflectance variation upon hydrogenation predictably tends to increase for higher film thicknesses, there is a local maximal region for lower thicknesses, spanning ranges of 20 to 30 nm for Mg, and up to 10 nm for Pd. This is desirable because shorter diffusion paths lead to faster optical responses for the sensitive structure [15].
The deposited stacks were validated using scanning electron microscopy (SEM) on a FEI QUANTA 400 microscope, where the different layers of a Mg-Pd structure were observable (Figure 4a). Samples produced while venting the sputtering chamber between each layer (to switch targets) showed only a very small response to 4 vol.% hydrogen, attributable to the hydrogenation of the Pd cap layer. Meanwhile, those fabricated in a single vacuum cycle, using a multi-target system, had a markedly greater response, measured as a sharp drop of over 30% in reflectance. Their appearance was also visibly changed, from highly reflective to a dark brown, more transparent region where the film was exposed to the gas.
3.2. SM Fiber Detectors
Figure 4b shows the tip of one of the sensors produced on SMFs, where a homogenous coating of the tip is visible. The Mg-Pd-PTFE structures produced significant and very fast responses to exposure to a 4 vol.% H2 flow. Infrared reflectance spectra of these sensors, presented in Figure 5, show a marked decrease upon exposure, in agreement with TMM calculations.
The sensor response was also characterized in the time domain, using the interrogation system mentioned above. Figure 6a shows one such instance, where the reflectance decreased by 36%, with the initial 10% of this variation occurring within 1.2 s of the change in gas flow content. The majority of this decrease (90%) is attained within 3.0 s. Because the signal variation is so large, the alarm for detection of a leak can be triggered even before the full variation occurs, since even a fraction of it is easily discernible. In this context, the definition of t10, commonly employed to describe the recovery time, can also be applied to describe the initial dynamics of the detector’s loading response, giving a better sense of the time required for detection in a real application scenario. On the other hand, a fast recovery is not paramount for a sensing device that should only be triggered infrequently.
The performance of the detectors was also evaluated for repeated exposures to hydrogen, by applying a 4 vol.% H2 flow for 150 s followed by a 100% N2 flow for 360 s. As seen in Figure 6b, although unloading is considerably slower than loading, reversibility is achieved and several consecutive detections are possible.
It should be noted that, as is clear from Figure 6b, the original level of reflectance is not recovered during these cycles. This is because waiting the required time for complete desorption of H2 from the detectors was not feasible, as a full recovery can be very slow. Thus, rather than the recovery time, the focus was verifying reversibility to make repeated detections possible, while studying the response time in more detail.
Figure 7 shows the cycling response in several detectors from the same fabrication batch. The loading t10 and t90 drop sharply across all detectors from cycle 2 onwards, and their performance becomes highly homogenous. However, the same is not true regarding their reflectance variations (), which appear to settle at different values. While some of this behavior can be attributed to the lack of complete desorption during the applied cycles, for the reasons explained above, a "pre-cycling" step before deployment could help ensure a consistent and fast performance.
3.3. Response Time vs. Concentration
The impact of H2 concentration on the detector response time was also studied. Several detectors were subjected to sets of five cycles (similarly to what is shown in Figure 6b) using different concentrations from 0.5% to 4%. These were obtained by diluting the flow from 4% and 1% H2 sources with appropriate N2 flows, with 0.5% being the lowest concentration that could realiably be achieved with the current setup. The detectors promptly indicated the presence of H2 at the various concentration levels.
Figure 8 shows the mean loading t10 and t90 for the 5th cycle, with clear trends indicating that the response time is lower for higher concentrations. This is more noticeable for the t90, while a few-second t10 is still achieved down to a 0.5% concentration. This suggests a wide range of operation for detection, starting at 0.5% H2.
3.4. Cross-Sensitivity
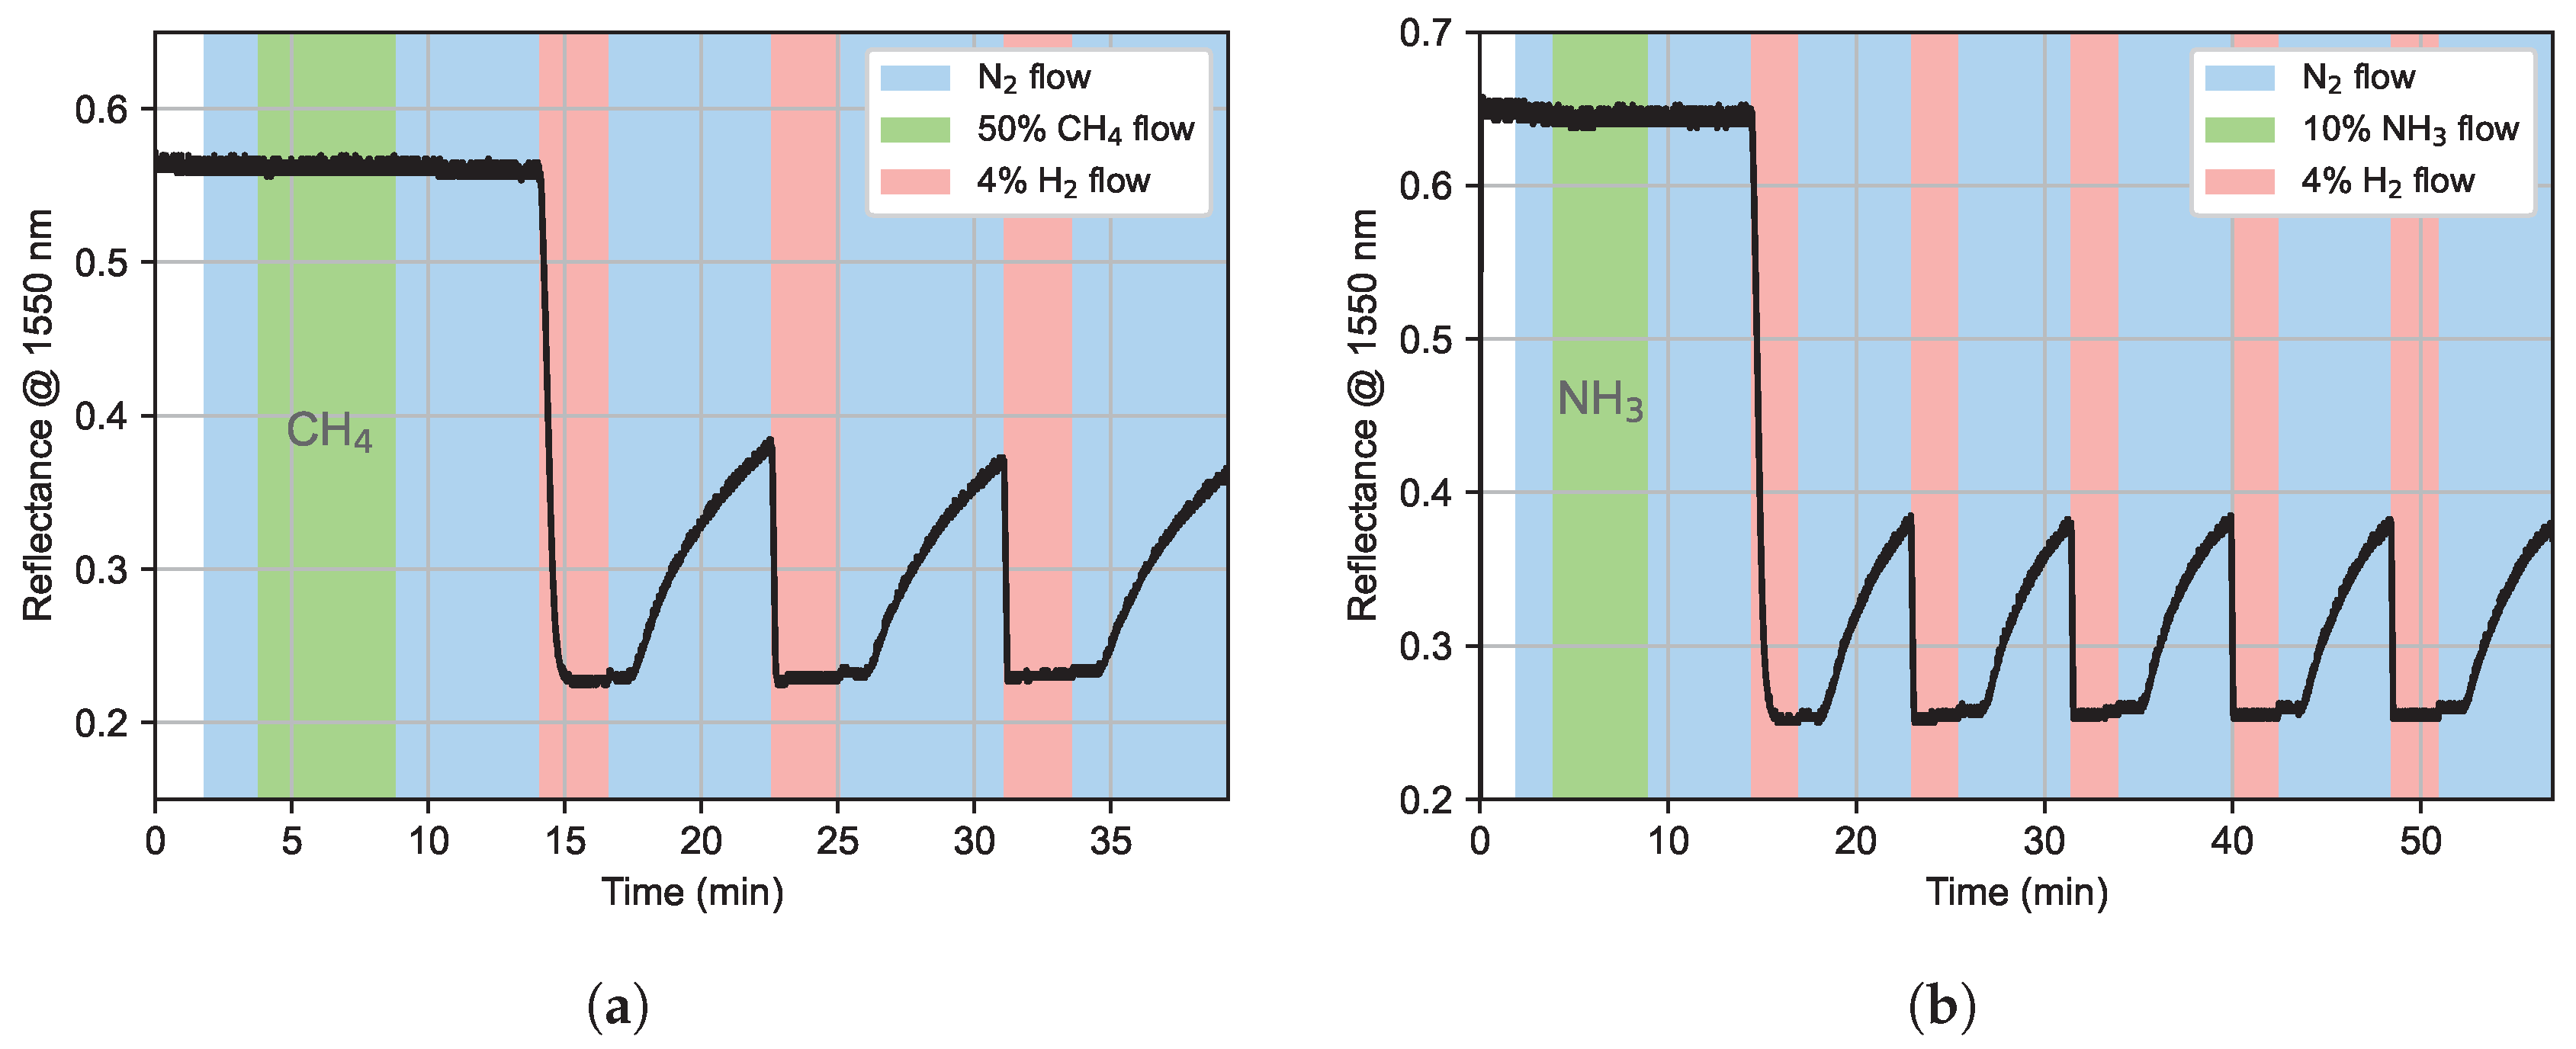
Several molecules are consistently identified in the literature as possible interferents for Pd-based hydrogen sensors. Among these, methane (CH4), ammonia (NH3), carbon dioxide (CO2), carbon monoxide (CO) and water vapor are considered the most relevant [17]. CO2 and CO can be adsorbed by Pd and contribute to the fouling of this layer through the formation of palladium oxide (PdO), but this effect is not the most impactful when taking into account the amounts commonly found in the atmosphere. Meanwhile, water vapor is highlighted as the biggest contributor to this process [18]. Thus, PTFE is highly favored as a protective material due to its hydrophobic properties [19].
As shown in Figure 9, cross-sensitivity with CH4 and NH3 was tested by exposing the detectors to each of these interferents for a period of 5 minutes, before applying several loading-unloading cycles, verifying their correct performance. In both cases, there was no response to the interferent, and no discernible alteration in subsequent detection of H2.
4. Conclusions
As shown in this work, Pd-capped Mg thin films can provide a very fast yet ample optical variation that can enable near-second detection of the presence of H2. While it is not feasible to extract information about the environment’s concentration using these materials and techniques, this method nevertheless provides a solution to the demand for faster H2 monitoring. This is particularly relevant in contexts where one could expect the absence of hydrogen during normal, correct operation, as is the case for leaks in infrastructure. Additionally, interrogation is not restricted to particular wavelength ranges, meaning that single-mode fibers and standard C-band wavelengths can be used, making implementation easier and less expensive, while enabling remote detection.
This type of device is, however, inherently ill-suited for repeated detection, due to poor unloading. For situations where exposure to hydrogen should be infrequent, it allows the use of a simple intensity-based interrogation technique, while the fabrication process itself is potentially quite cost-effective and highly scalable. Thus, the downside of requiring a replacement of sensing probes following the hopefully rare event of infrastructure malfunction may be offset by the ease and lower-cost of manufacturing them. For the purposes of demonstrating the sensor’s functionality, and with field testing in the near-future in mind, an interrogation system was developed and used in the characterization of all fiber-based samples in this work, showing a path for the application of this technology. It is able to monitor several detectors simultaneously, making multi-point detection possible for coverage of large infrastructure. In future work, the thicknesses of the sensitive layers could be further optimized, mainly by reducing the Pd layer while still ensuring an homogenous film.
Author Contributions
Conceptualization, A.S., M.A., J.M., J.A. and L.C.; methodology, A.S., M.A., J.M., J.A. and L.C.; software, A.S.; validation, A.S. and M.A.; formal analysis, A.S.; investiagation, A.S, M.A.; resources, J.M., J.A. and L.C.; data curation, A.S.; writing—original draft preparation, A.S.; writing—review and editing, J.M., J.A. and L.C.; visualization, A.S.; supervision, J.M., J.A. and L.C.; project administration, L.C.; funding acquisition, J.A. and L.C. All authors have read and agreed to the published version of the manuscript.
Funding
This work is co-financed by Component 5 - Capitalization and Business Innovation, integrated in the Resilience Dimension of the Recovery and Resilience Plan within the scope of the Recovery and Resilience Mechanism (MRR) of the European Union (EU), framed in the Next Generation EU, for the period 2021-2026, within project ATE, with reference 56. Miguel Almeida acknowledges the support from FCT through the grant 2023.00890.BD.
Acknowledgments
In this section you can acknowledge any support given which is not covered by the author contribution or funding sections. This may include administrative and technical support, or donations in kind (e.g., materials used for experiments). Where GenAI has been used for purposes such as generating text, data, or graphics, or for study design, data collection, analysis, or interpretation of data, please add “During the preparation of this manuscript/study, the author(s) used [tool name, version information] for the purposes of [description of use]. The authors have reviewed and edited the output and take full responsibility for the content of this publication.”
Conflicts of Interest
The authors declare no conflicts of interest. The funders had no role in the design of the study; in the collection, analyses, or interpretation of data; in the writing of the manuscript; or in the decision to publish the results.
Abbreviations
The following abbreviations are used in this manuscript:
| SMF | Single-mode Fiber |
| MMF | Multi-mode Fiber |
| FBG | Fiber Bragg Grating |
| SPR | Surface Plasmon Resonance |
| TMM | Transfer Matrix Method |
| PTFE | Polytetrafluoroethylene |
| SEM | Scanning Electron Microscopy |
References
- Prasad, M.N.V., Hydrogen agenda in COP29—The way forward to decarbonization. In Accelerating the Transition to a Hydrogen Economy; Elsevier, 2025; pp. 91–112. [CrossRef]
- Stetson, N.; McWhorter, S.; Ahn, C., Introduction to hydrogen storage. In Compendium of Hydrogen Energy; Elsevier, 2016; pp. 3–25. [CrossRef]
- International Energy Agency. Hydrogen Production and Infrastructure Projects Database, 2024.
- Pathak, A.K.; Verma, S.; Sakda, N.; Viphavakit, C.; Chitaree, R.; Rahman, B.M.A. Recent Advances in Optical Hydrogen Sensor including Use of Metal and Metal Alloys: A Review. Photonics 2023, 10, 122. [CrossRef]
- Hübert, T.; Boon-Brett, L.; Black, G.; Banach, U. Hydrogen sensors – A review. Sensors and Actuators B: Chemical 2011, 157, 329–352. [CrossRef]
- Shen, C.; Xie, Z.; Huang, Z.; Yan, S.; Sui, W.; Zhou, J.; Wang, Z.; Han, W.; Zeng, X. Review of the Status and Prospects of Fiber Optic Hydrogen Sensing Technology. Chemosensors 2023, 11, 473. [CrossRef]
- Butler, M.A. Micromirror optical-fiber hydrogen sensor. Sensors and Actuators B: Chemical 1994, 22, 155–163. [CrossRef]
- Slaman, M.; Dam, B.; Pasturel, M.; Borsa, D.; Schreuders, H.; Rector, J.; Griessen, R. Fiber optic hydrogen detectors containing Mg-based metal hydrides. Sensors and Actuators B: Chemical 2007, 123, 538–545. [CrossRef]
- Yi, L.; You-ping, C.; Han, S.; Gang, Z. Hydrogen gas sensor based on palladium and yttrium alloy ultrathin film. Review of Scientific Instruments 2012, 83. [CrossRef]
- Verhoeff, D.; Schreuders, H.; Bannenberg, L. Tantalum-palladium alloy based optical micro-mirror hydrogen sensor. Sensors and Actuators B: Chemical 2025, 428, 137229. [CrossRef]
- Palm, K.J.; Murray, J.B.; Narayan, T.C.; Munday, J.N. Dynamic Optical Properties of Metal Hydrides. ACS Photonics 2018, 5, 4677–4686. [CrossRef]
- Pasturel, M.; Slaman, M.; Schreuders, H.; Rector, J.H.; Borsa, D.M.; Dam, B.; Griessen, R. Hydrogen absorption kinetics and optical properties of Pd-doped Mg thin films. Journal of Applied Physics 2006, 100, 023515. [CrossRef]
- Zhang, X.; Ju, S.; Li, C.; Hao, J.; Sun, Y.; Hu, X.; Chen, W.; Chen, J.; He, L.; Xia, G.; et al. Atomic reconstruction for realizing stable solar-driven reversible hydrogen storage of magnesium hydride. Nature Communications 2024, 15. [CrossRef]
- Liu, Y.; Chen, Y.p.; Song, H.; Zhang, G. Modeling analysis and experimental study on the optical fiber hydrogen sensor based on Pd-Y alloy thin film. Review of Scientific Instruments 2012, 83. [CrossRef]
- Wang, T.; Tang, L.; Zhang, Y.; Hong, Z.; Liu, G.; Li, Z.; Chen, J.; Peng, L.; Ding, W. Interaction between Hydrogen and Magnesium Films: From Hydrogenochromism to Applications. ACS Applied Materials & Interfaces 2025, 17, 8794–8820. [CrossRef]
- Bannenberg, L.J.; Boshuizen, B.; Ardy Nugroho, F.A.; Schreuders, H. Hydrogenation Kinetics of Metal Hydride Catalytic Layers. ACS Applied Materials & Interfaces 2021, 13, 52530–52541. [CrossRef]
- Manjavacas, G.; Nieto, B., Hydrogen sensors and detectors. In Compendium of Hydrogen Energy; Elsevier, 2016; pp. 215–234. [CrossRef]
- Almeida, M.A.; de Almeida, J.M.; Coelho, L.C. Impact of gaseous interferents on palladium expansion for hydrogen optical sensing: A time stability study. Optics & Laser Technology 2024, 170, 110193. [CrossRef]
- Darmadi, I.; Nugroho, F.A.A.; Langhammer, C. High-Performance Nanostructured Palladium-Based Hydrogen Sensors—Current Limitations and Strategies for Their Mitigation. ACS Sensors 2020, 5, 3306–3327. [CrossRef]
Figure 1.
Diagram of the controlled gas flow setup used for characterization of the produced planar and fiber samples.
Figure 1.
Diagram of the controlled gas flow setup used for characterization of the produced planar and fiber samples.
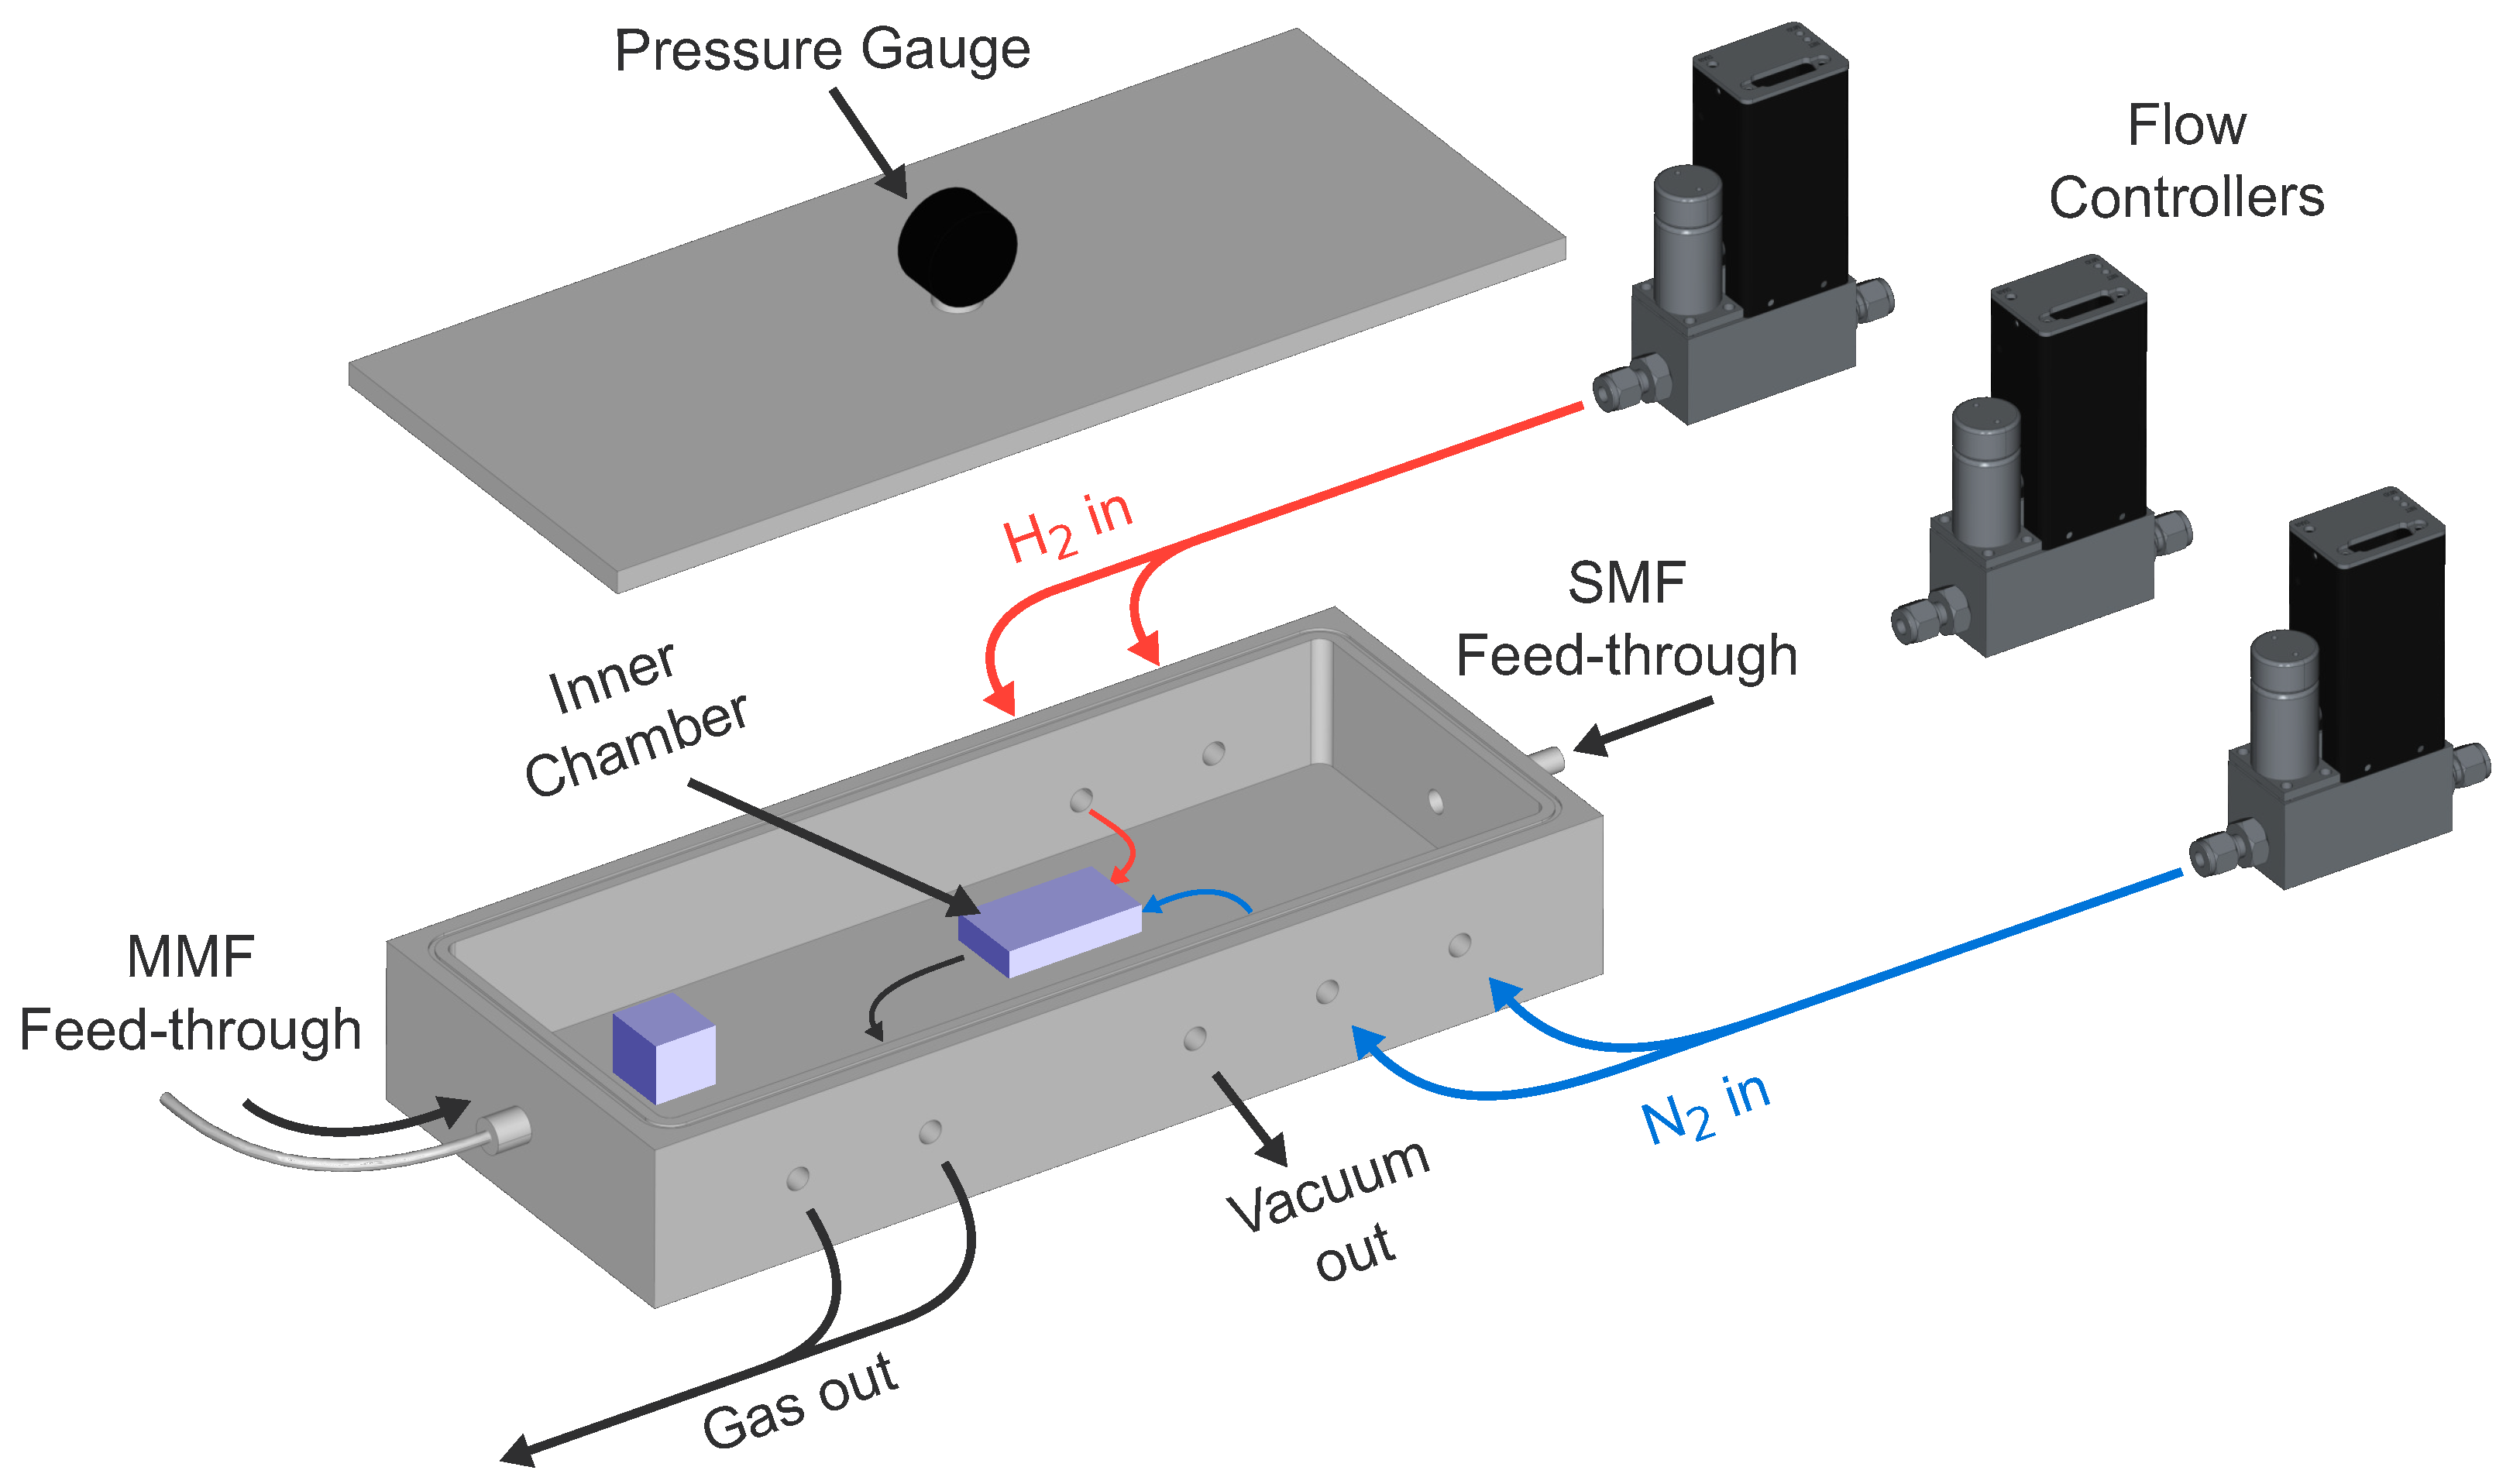
Figure 2.
(a) Diagram of the inner setup used for fiber samples (glass slide and lid are not shown). (b) Photograph of the same inner setup.
Figure 2.
(a) Diagram of the inner setup used for fiber samples (glass slide and lid are not shown). (b) Photograph of the same inner setup.
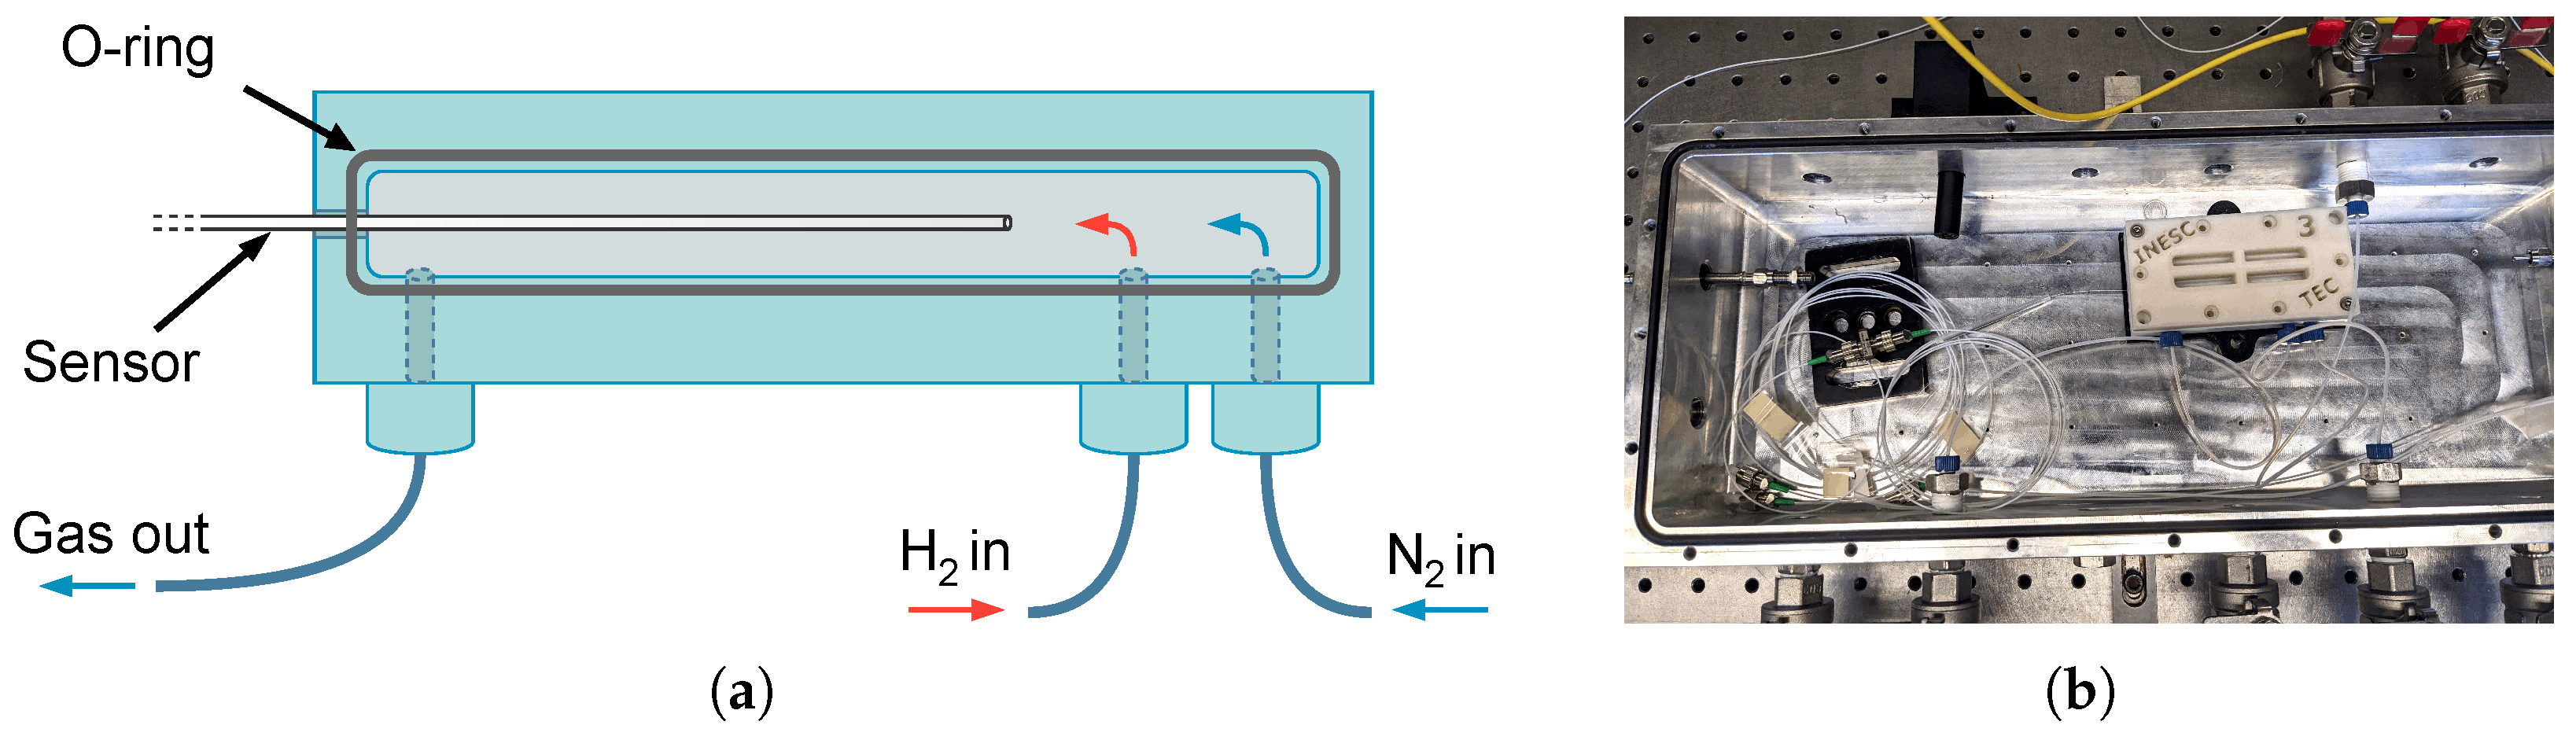
Figure 3.
(a) Block diagram of the developed interrogation system. Simple lines denote optical fiber connections, while lines with arrowheads denote electrical connections. (b) Photograph showing the prototype unit, with one detection probe connected. The screen shows the developed user interface.
Figure 3.
(a) Block diagram of the developed interrogation system. Simple lines denote optical fiber connections, while lines with arrowheads denote electrical connections. (b) Photograph showing the prototype unit, with one detection probe connected. The screen shows the developed user interface.
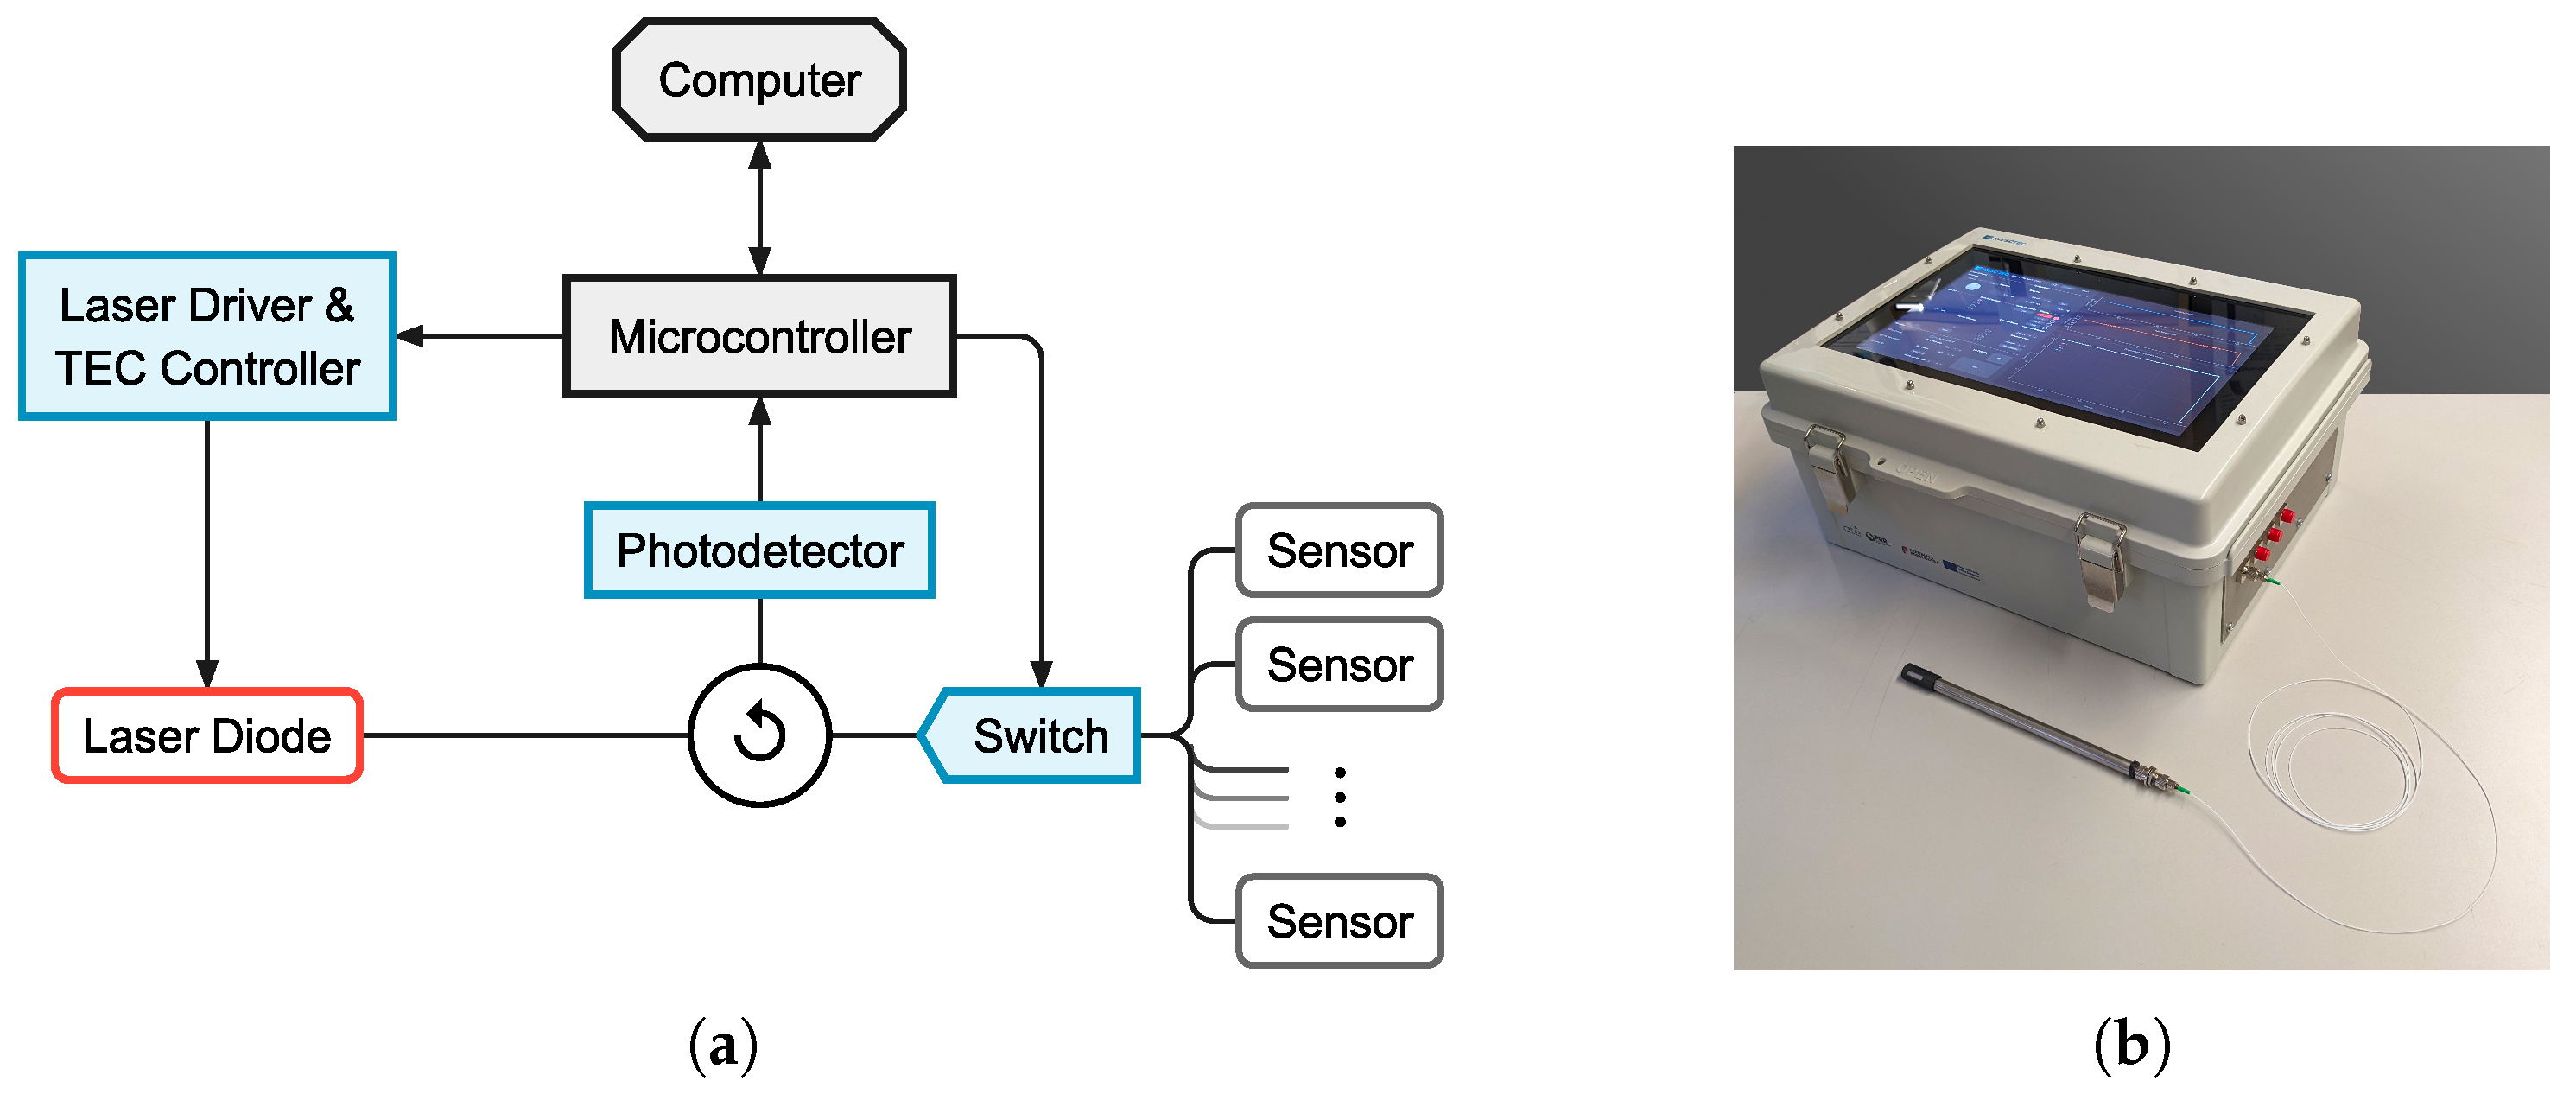
Figure 4.
SEM images of: (a) a thin film stack of Mg (100 nm) and Pd (10 nm); (b) the tip of a SMF, where a Pd-capped (10 nm) Mg film (20 nm) was deposited. The magnification used was (a) 300000x and (b) 1000x, with an accelerating voltage of 15 kV in both images.
Figure 4.
SEM images of: (a) a thin film stack of Mg (100 nm) and Pd (10 nm); (b) the tip of a SMF, where a Pd-capped (10 nm) Mg film (20 nm) was deposited. The magnification used was (a) 300000x and (b) 1000x, with an accelerating voltage of 15 kV in both images.
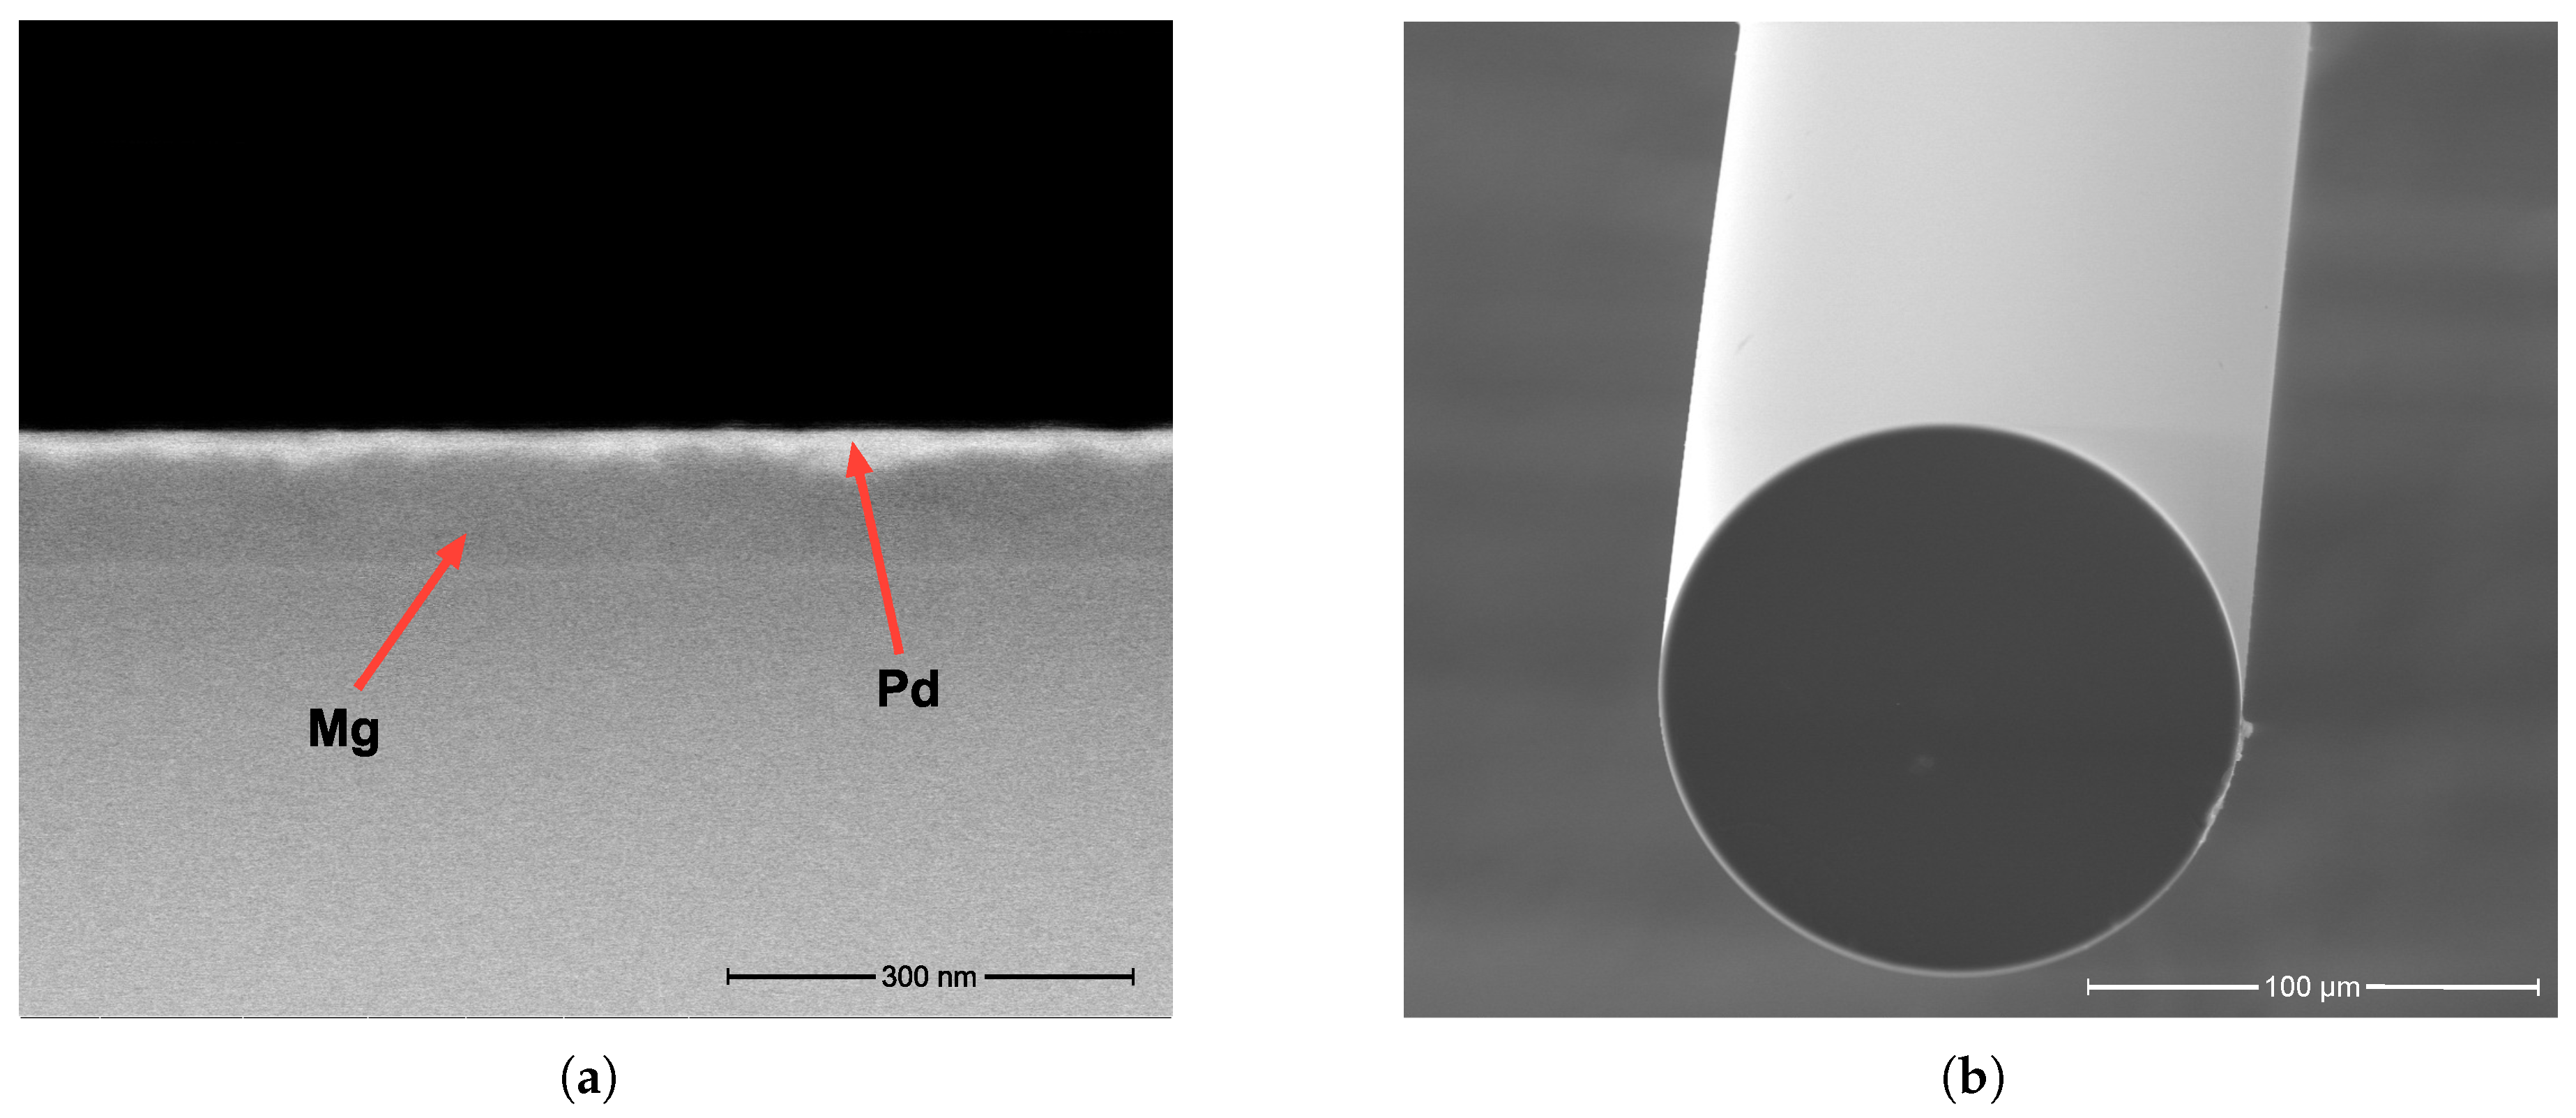
Figure 5.
IR reflectance spectra of the optical fiber detectors, before and after exposure to H2. Black line indicates the laser diode output spectrum used for sensor interrogation (1550 nm).
Figure 5.
IR reflectance spectra of the optical fiber detectors, before and after exposure to H2. Black line indicates the laser diode output spectrum used for sensor interrogation (1550 nm).
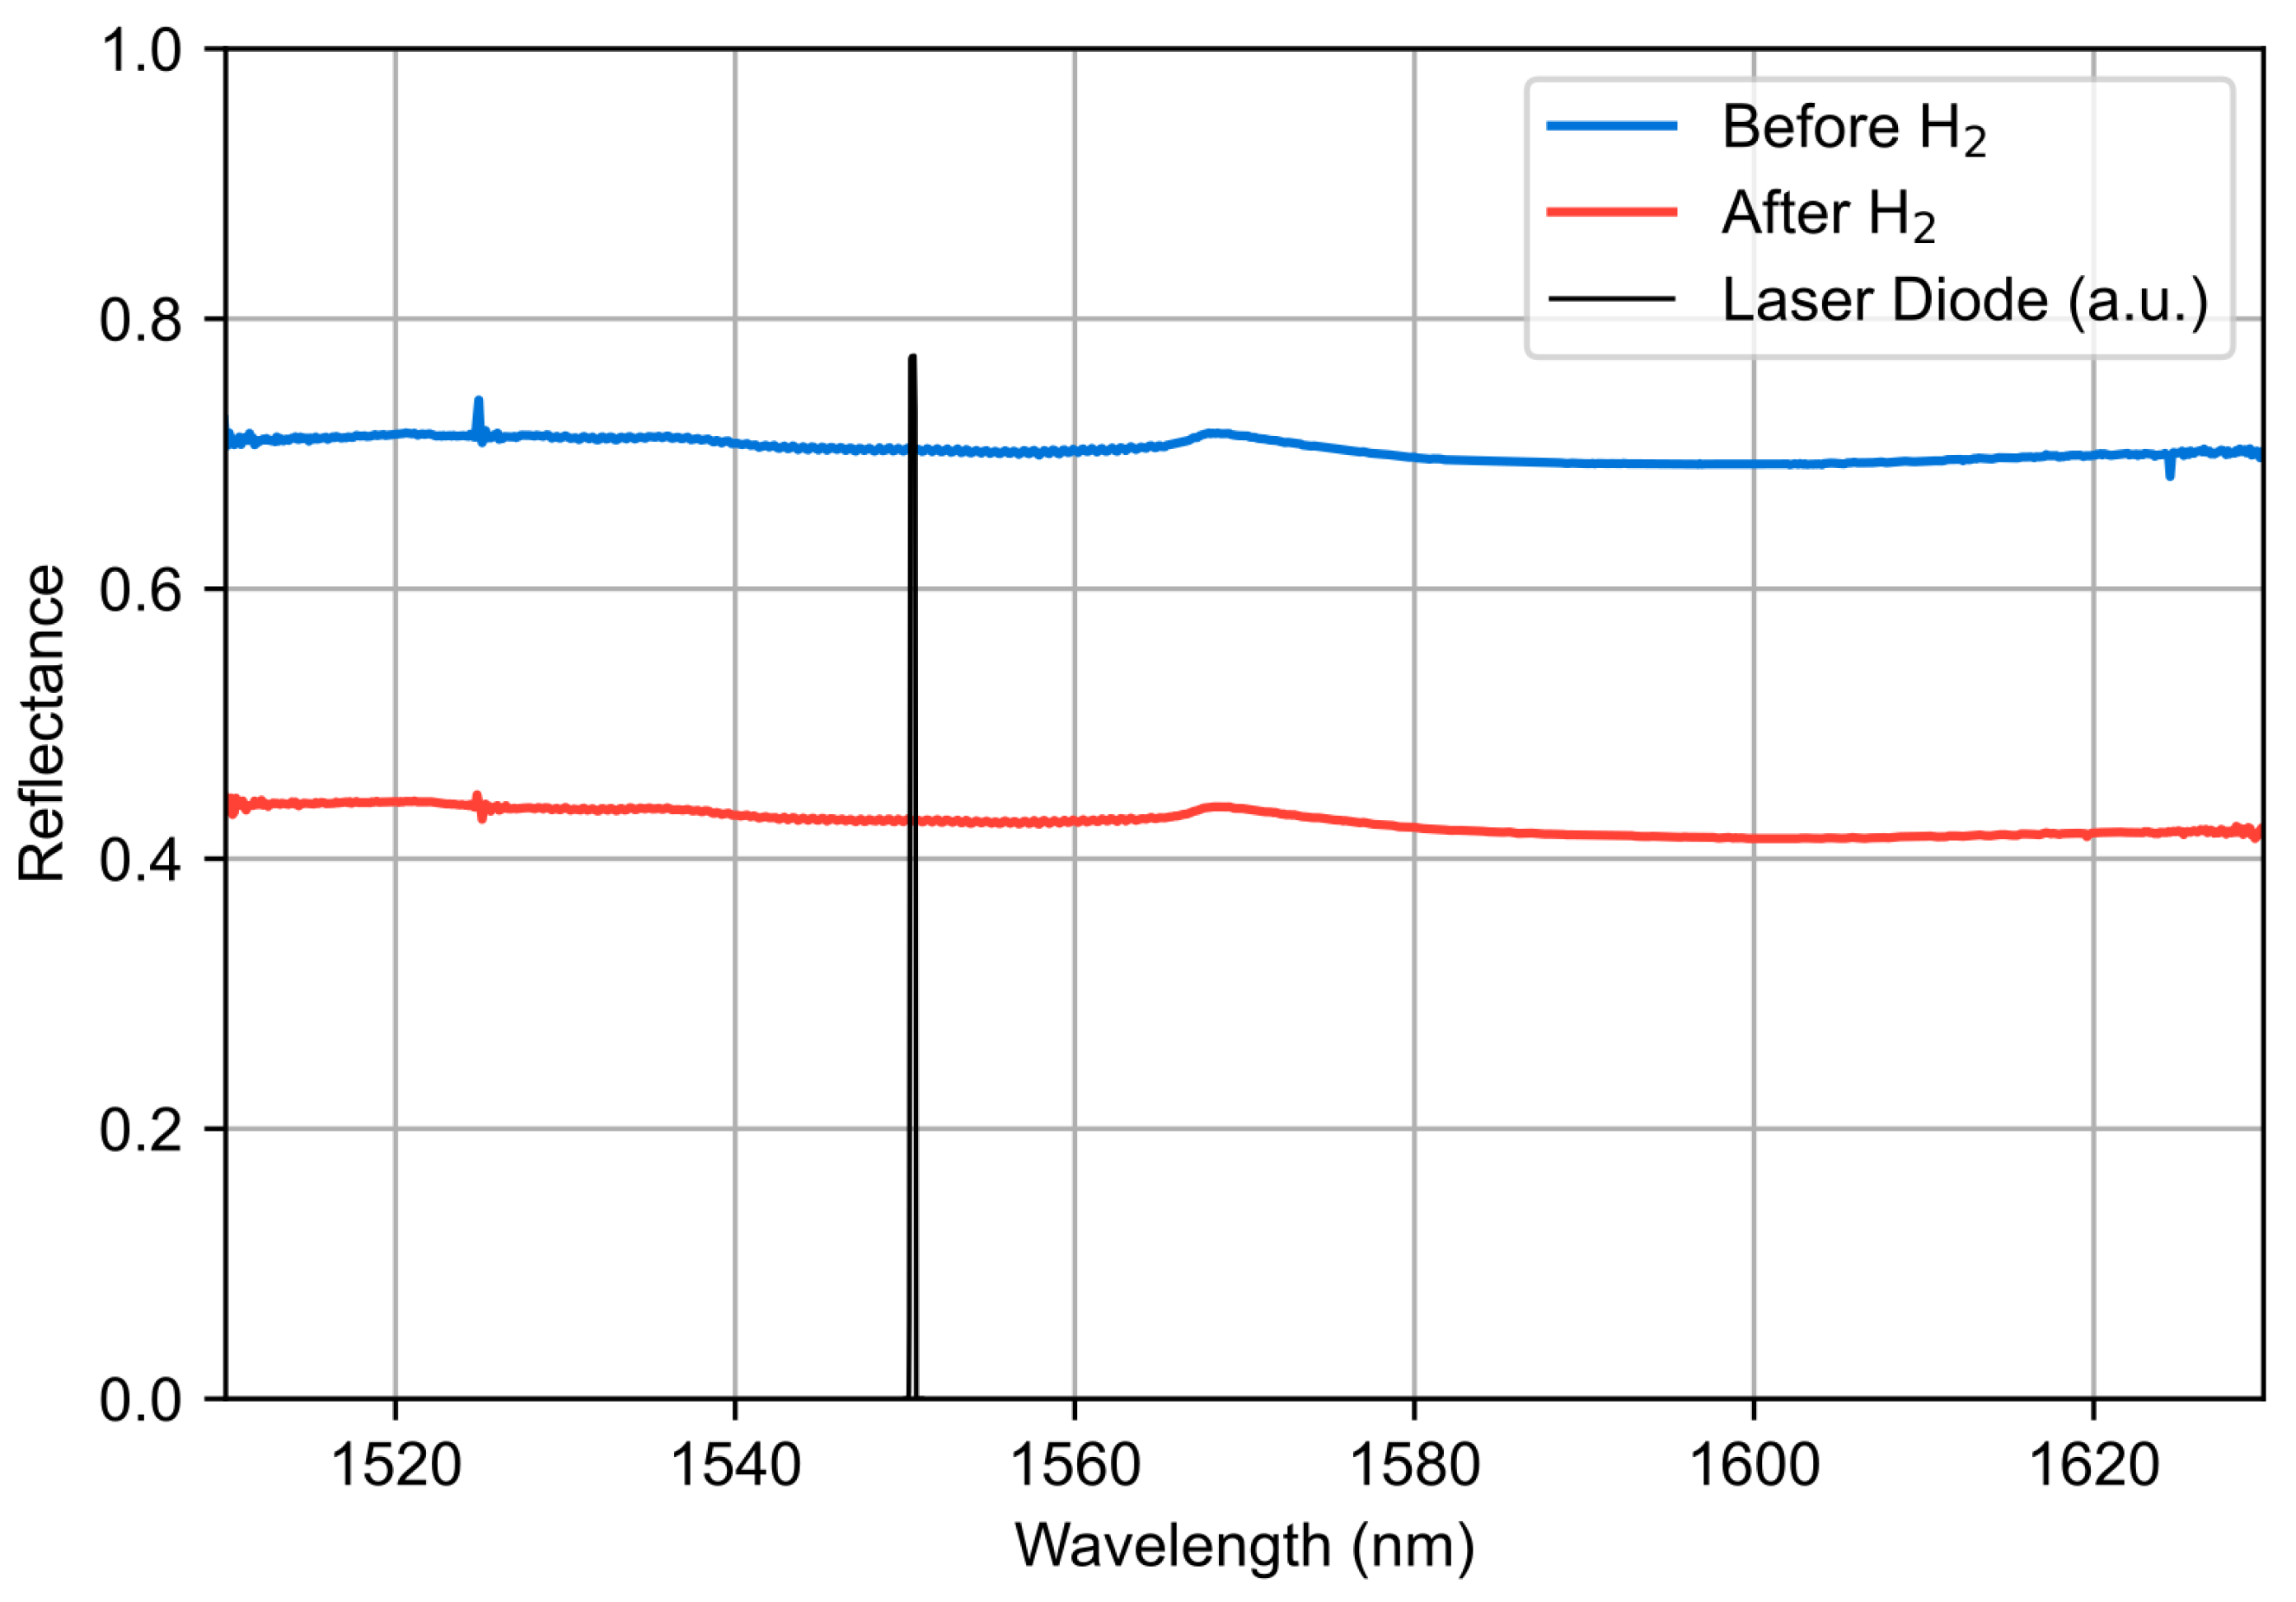
Figure 6.
(a) Measured reflectance at 1550 nm for a fabricated Mg-Pd detector upon first exposure to a 4 vol.% H2 flow. Red and blue vertical lines indicates the loading t10 and t90, respectively. (b) Measured reflectance at 1550 nm for a fabricated Mg-Pd detector for five loading-unloading cycles.
Figure 6.
(a) Measured reflectance at 1550 nm for a fabricated Mg-Pd detector upon first exposure to a 4 vol.% H2 flow. Red and blue vertical lines indicates the loading t10 and t90, respectively. (b) Measured reflectance at 1550 nm for a fabricated Mg-Pd detector for five loading-unloading cycles.
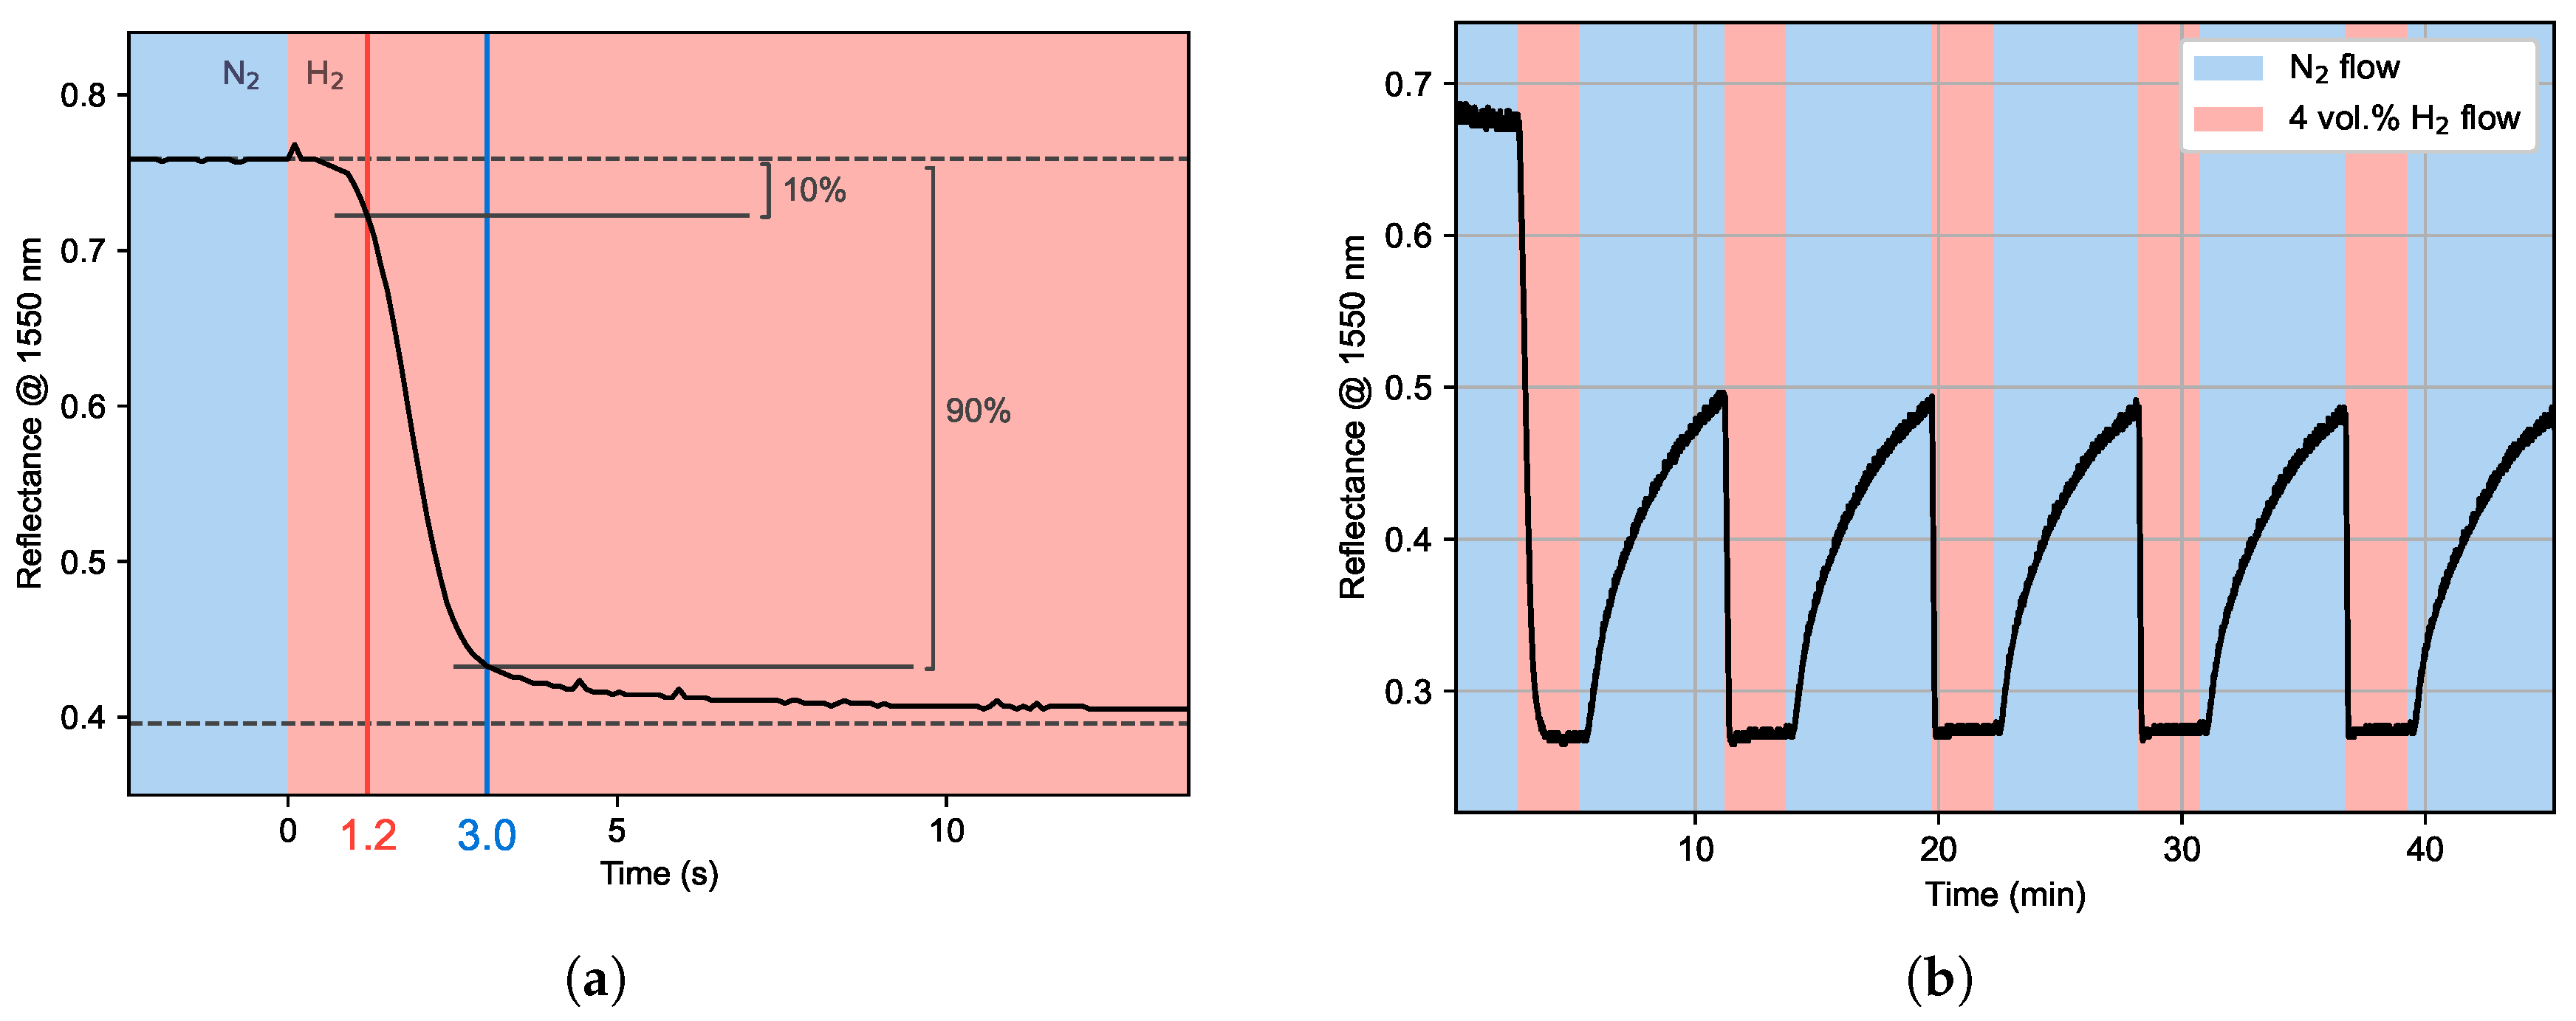
Figure 7.
Performance of three different fabricated detectors for the first five loading-unloading cycles at 4vol.% H2: (a) and (b) loading response t10 and t90; (c) reflectance variation upon H2 exposure.
Figure 7.
Performance of three different fabricated detectors for the first five loading-unloading cycles at 4vol.% H2: (a) and (b) loading response t10 and t90; (c) reflectance variation upon H2 exposure.
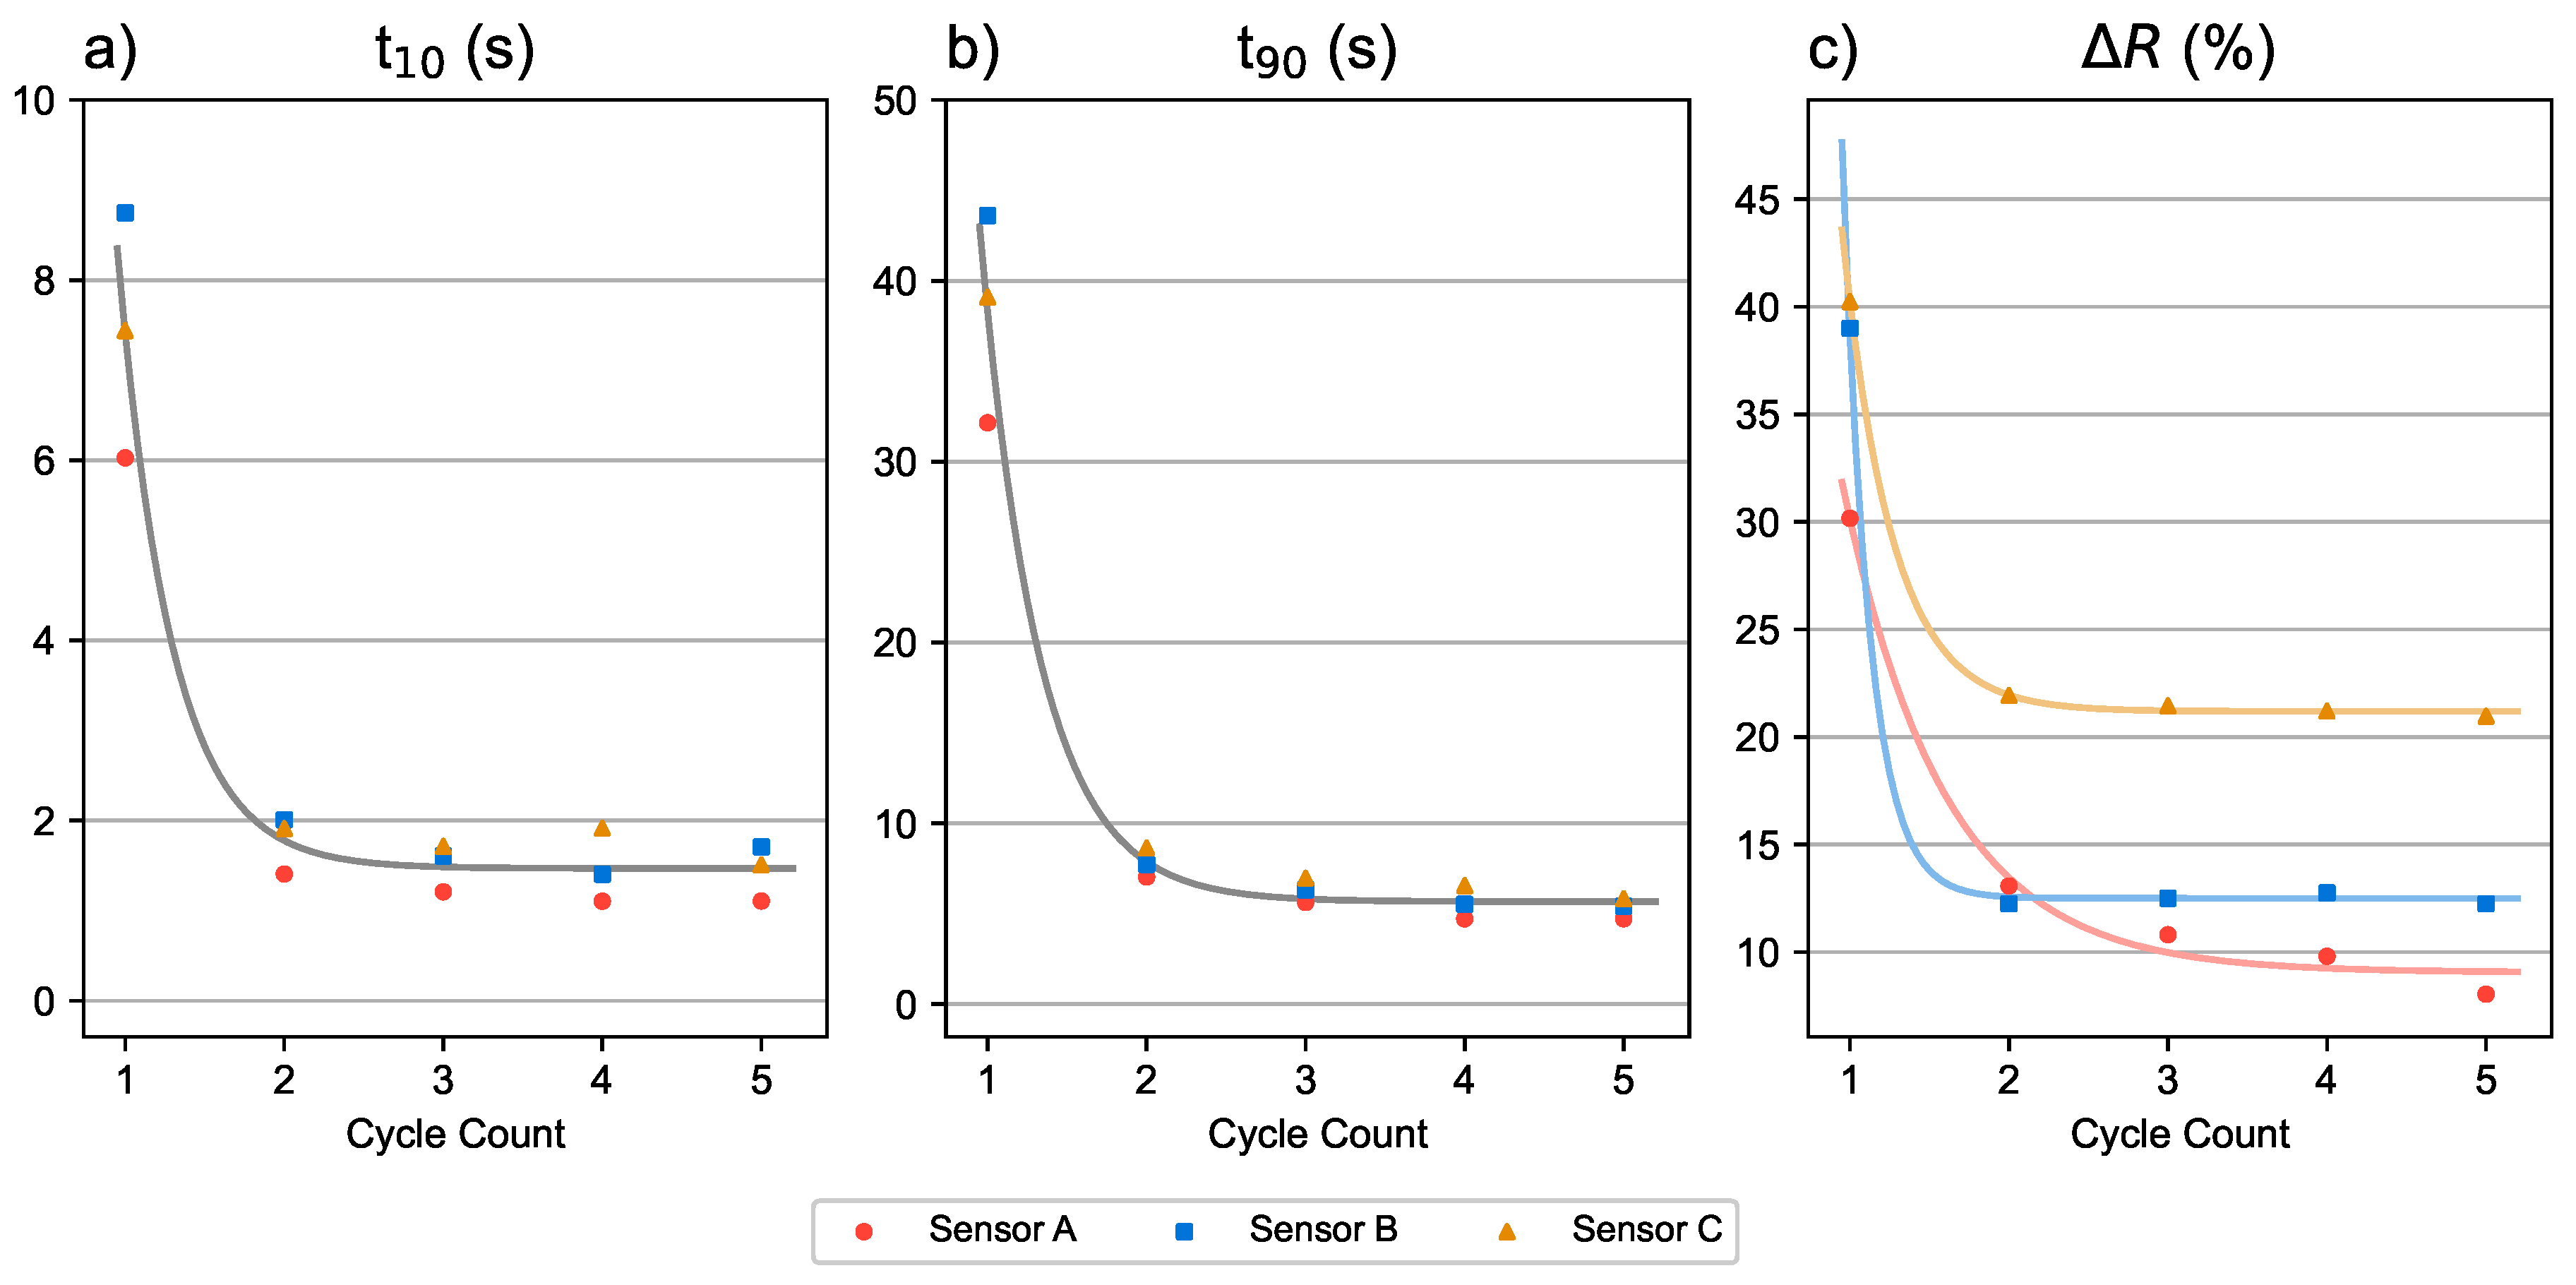
Figure 8.
Average loading performance of fabricated detectors for their 5th cycle loading depending on the concentration of H2 used. (a) 5th cycle loading t10. (b) 5th cycle loading t90. Red dashed lines indicate trends.
Figure 8.
Average loading performance of fabricated detectors for their 5th cycle loading depending on the concentration of H2 used. (a) 5th cycle loading t10. (b) 5th cycle loading t90. Red dashed lines indicate trends.
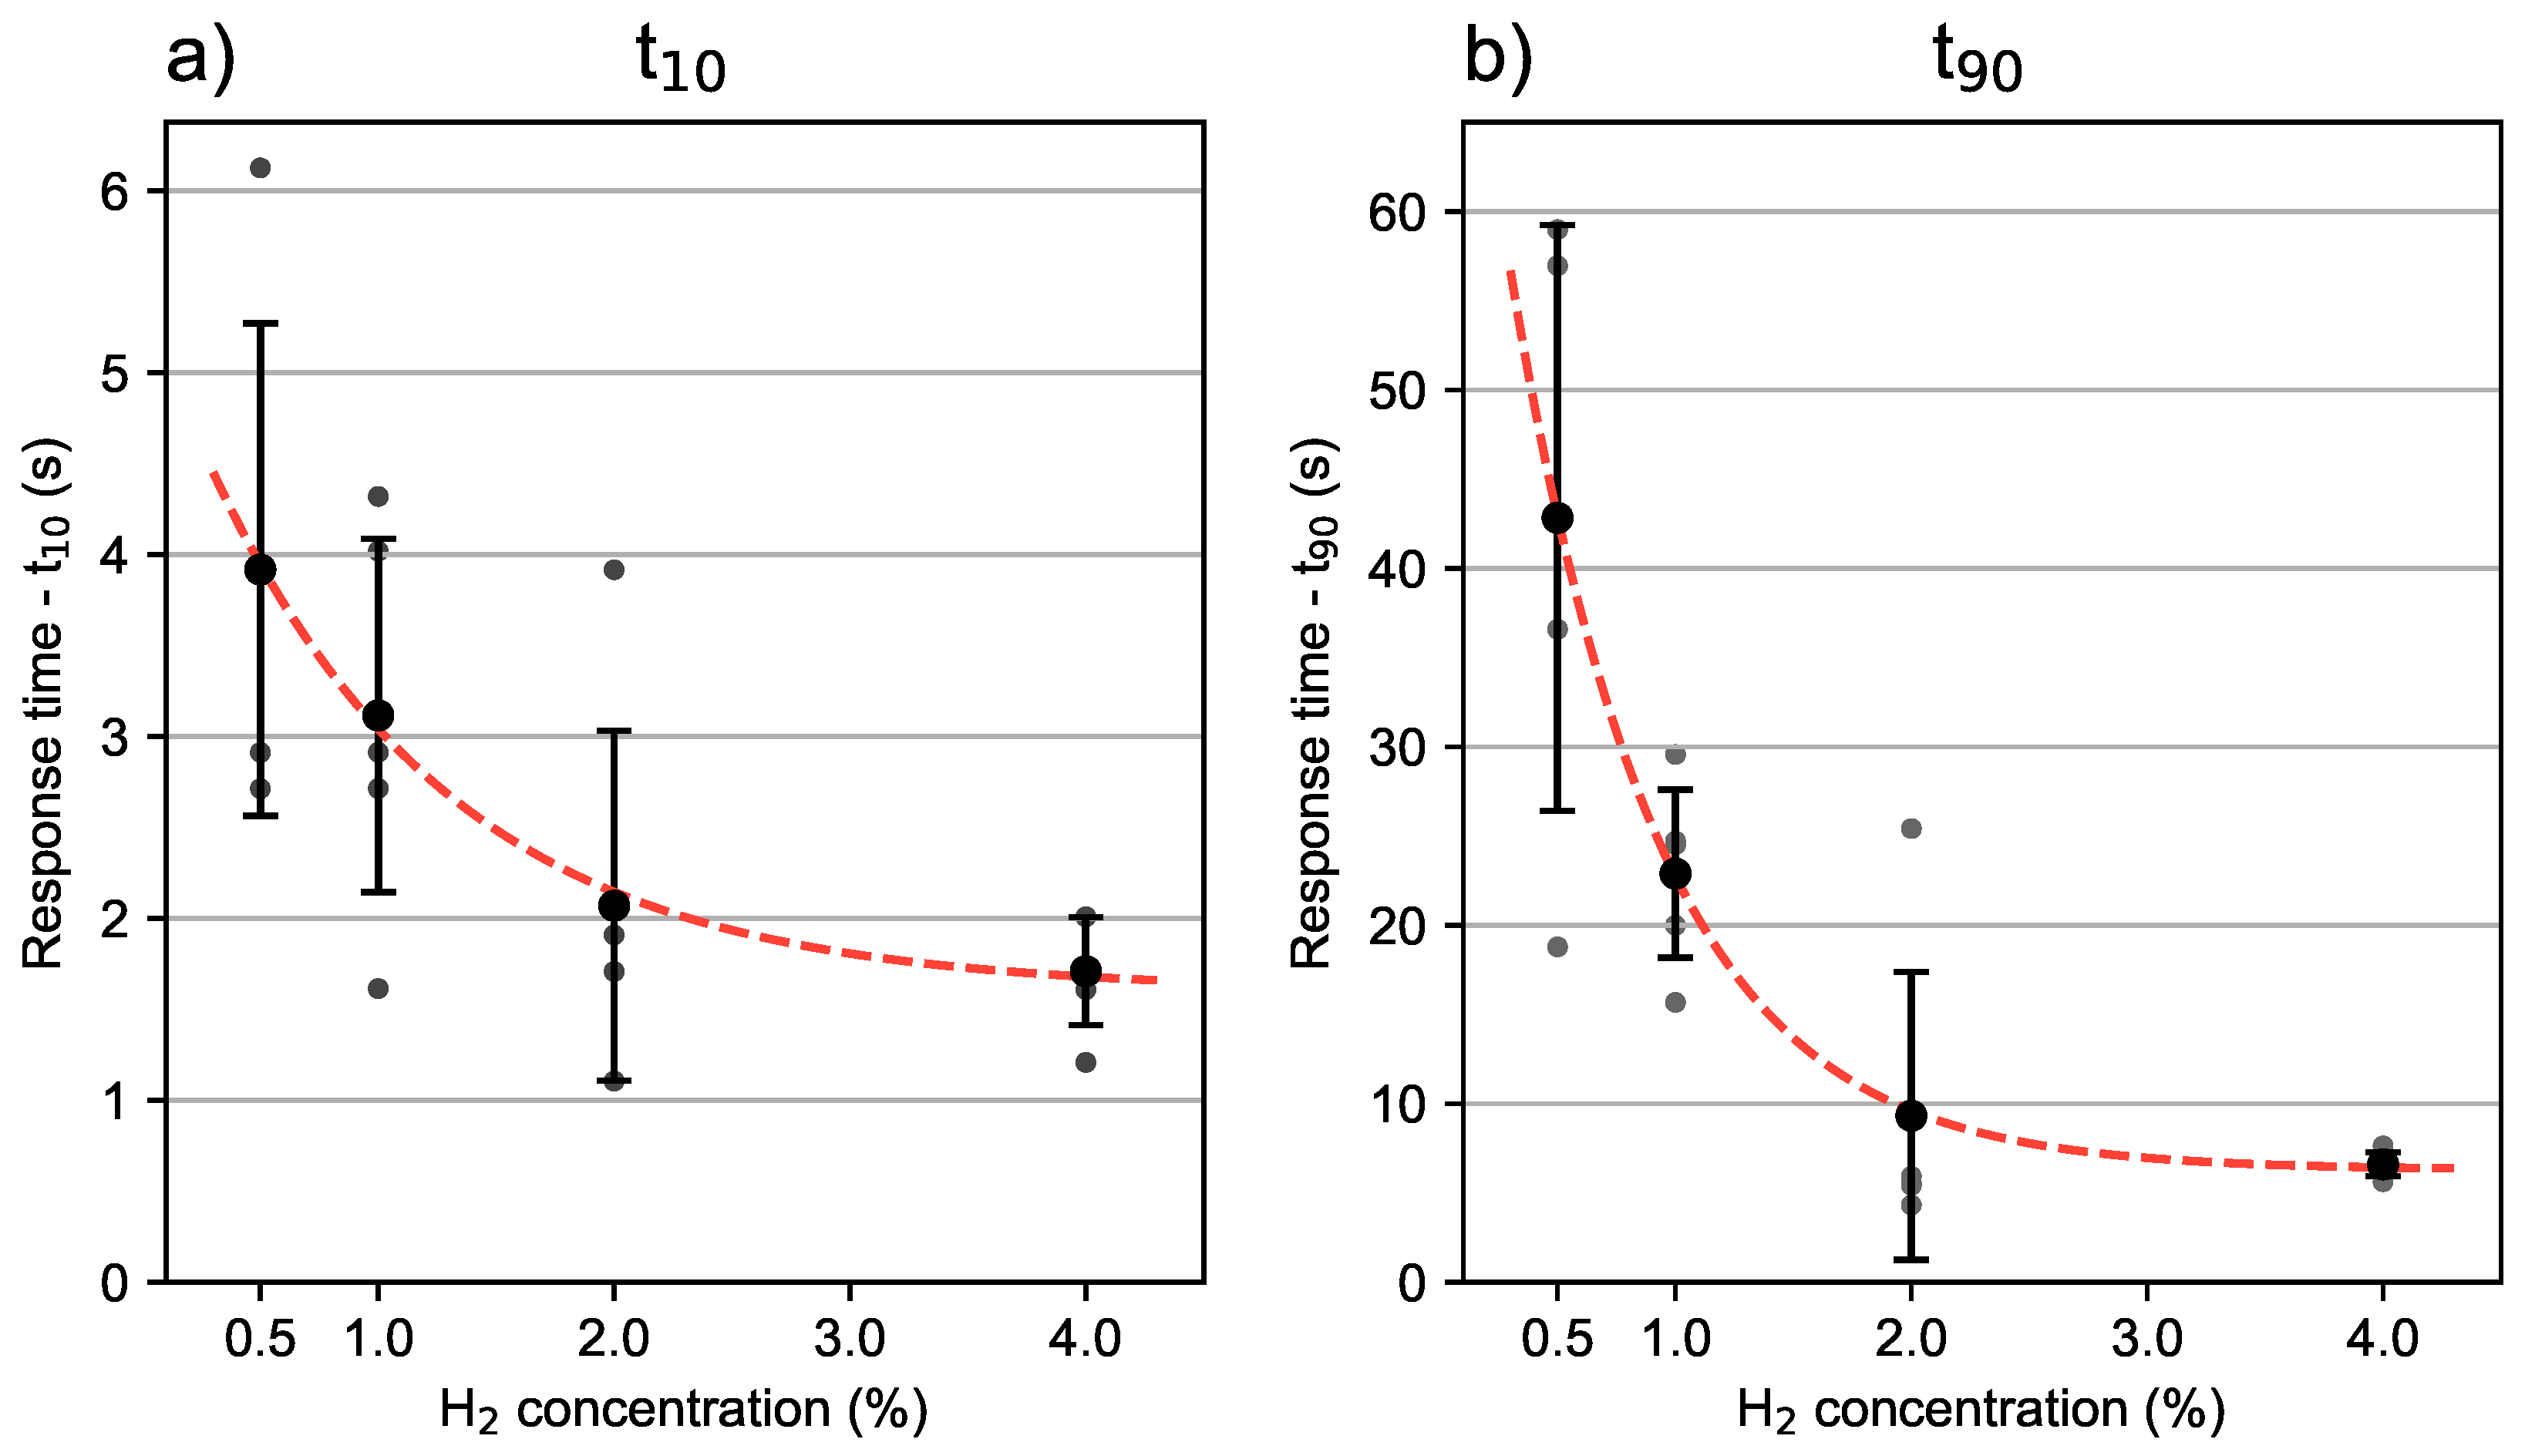
Figure 9.
Detector response in cross-sensitivity tests to CH4 (a) and NH3 (b), showing absence of reflectance variation when exposed to the interferent gas.
Figure 9.
Detector response in cross-sensitivity tests to CH4 (a) and NH3 (b), showing absence of reflectance variation when exposed to the interferent gas.
Disclaimer/Publisher’s Note: The statements, opinions and data contained in all publications are solely those of the individual author(s) and contributor(s) and not of MDPI and/or the editor(s). MDPI and/or the editor(s) disclaim responsibility for any injury to people or property resulting from any ideas, methods, instructions or products referred to in the content. |
© 2026 by the authors. Licensee MDPI, Basel, Switzerland. This article is an open access article distributed under the terms and conditions of the Creative Commons Attribution (CC BY) license (http://creativecommons.org/licenses/by/4.0/).
Copyright: This open access article is published under a Creative Commons CC BY 4.0 license, which permit the free download, distribution, and reuse, provided that the author and preprint are cited in any reuse.