

Submitted:
29 March 2026
Posted:
31 March 2026
You are already at the latest version
Abstract
This article conducts a thorough comparative analysis of public transport systems in Curitiba and Lisbon, focusing on cost-efficiency and structural performance from the user's viewpoint. Curitiba is noted for pioneering the BRT model in the 1970’s, while Lisbon is evolving towards a multimodal system with substantial investments in integration and user-centric policies. Employing a case study methodology and mixed analytical approaches, the analysis examines governance structures, network architecture, financing mechanisms, and service quality indicators.
The findings indicate that although Curitiba imposes a similar or higher fare burden relative to user incomes, it offers significantly lower service value across various dimensions, including modal diversity and infrastructure quality. In contrast, Lisbon's integrated governance model for bus and tram networks proves effective in enhancing accessibility and sustainability, despite some coordination issues with centrally governed transport networks.
This study contributes to the international discourse on the limitations of single-modal transport systems and highlights the necessity of institutional integration, long-term investment, and adaptive governance frameworks for urban mobility transformation in the 21st century.
Keywords:
public transport
; urban mobility
; cost-efficiency
; BRT
; multimodality
1. Introduction
1.1. Background to the Problem and Structure of the Article
The design, construction, implementation, and continuous improvement of efficient urban public transport systems constitute fundamental pillars for promoting sustainable, inclusive, and liveable cities. In contexts characterized by intense urban pressure, accelerating climate change, growing socioeconomic challenges, and rapidly evolving mobility demands, the way city’s structure, finance, and operate their mobility modes directly affects multiple dimensions of urban life including quality of life, social equity, economic productivity, environmental sustainability, and public health outcomes.
Curitiba, the capital of Paraná state in southern Brazil, achieved international recognition as the pioneering city in the implementation of the Bus Rapid Transit (BRT) system during the 1970’s and 1980’s. Through innovative urban planning and integrated land-use transport planning, Curitiba became, throughout the 1980’s and 1990’s, a prominent international reference for integrated urban planning combined with efficient public transport provision. The city’s BRT model has been studied and replicated in over 200 cities across six continents, influencing urban transport policy globally.
Conversely, Lisbon, Portugal’s capital and largest city, has consolidated its position in recent decades as a case of a multimodal system undergoing expansion and modernization. The city’s transport network incorporates metro (underground), suburban trains, historic and modern trams, buses, and river ferries, all increasingly integrated through a unified fare system and collaborative governance structures. This integration is anchored in a semi-integrated metropolitan governance model that, while encompassing bus and tram networks comprehensively, still faces challenges in fully coordinating with centrally managed modes.
While Curitiba represents the emblematic model of the Global South based predominantly on high-capacity road-based transit, Lisbon emerges as a Global North experience that successfully combines modal diversity with substantial structural investments, many of which supported by European Union cohesion and structural funds. This fundamental duality, between a pioneering but potentially stagnating monomodal system and an evolving, investment-rich multimodal network, provides fertile ground for critical comparative analysis focused on cost-efficiency, accessibility, sustainability, and user satisfaction.
The article is structured in 7 sections following this introduction. In section 2 is presented the public transport theoretical framework from a social perspective, and is reviewed key concepts related to BRT systems, multimodality, governance, path dependence, and cost-efficiency. Section 3 presents the methodological approach, including data sources, analytical framework, and research limitations. Section 4 and Section 5 provides detailed analyses of the two case studies, from historical development to recent trends. Section 6 offers a systematic comparative analysis of the two cases. Section 7 discusses the results, with a focus on institutional, economic, and political contexts, and proposed some key issues for transport policy. Finally, Section 8 summarizes the main findings, presenting policy recommendations, and indicating future research.
1.2. The Curitiba Paradox
Despite the Curitiba model having been extensively replicated in developing countries, the system shows signs of stagnation in its structural development and technological advancement. The system that once represented cutting-edge innovation at the time has remained, in many aspects, largely unchanged in its fundamental structure and operational model, despite growing demand for public transport. Simultaneously, fare costs for users have maintained relatively high levels when measured as proportions of local average and minimum wage incomes, generating questions about the system’s continuing effectiveness as a public mobility policy instrument.
Analyses indicate that a typical low-income worker in Curitiba making two round trips daily spends approximately 35-40% of the minimum wage solely on public transport, a proportion that exceeds international benchmarks and raises equity concerns (Pereira & Schwanen, 2013). This high relative cost burden, combined with perceptions of declining service quality, deteriorating infrastructure, and limited technological innovation, has contributed to declining ridership and increasing automobile dependence among those who can afford alternatives (Oliveira, 2018).
1.3. Lisbon’s Transformation
In contrast, Lisbon has demonstrated progress in multiple dimensions of public transport provision. The city has advanced in modal integration, ticketing system simplification, service digitalization, and particularly in fare burden reduction after, the implementation of the Navegante metropolitan pass in 2019 and the national Tariff Reduction Support Plan (PART). These policy innovations have resulted in reductions in user costs (the monthly pass representing approximately 4.6% of the national minimum wage), increases in ridership (around 25%), and improved user satisfaction across demographic groups (TML, 2024).
Furthermore, Lisbon has benefited from sustained investment in infrastructure modernization, fleet renewal, accessibility improvements, and technological advancement including real-time passenger information systems, mobile ticketing applications, and integrated journey planning tools. These investments, supported by European Union funds and Portuguese national government commitments, have allowed Lisbon, in a short space of time, to significantly improve the functioning and attractiveness of its transport system.
1.4. Research Hypothesis and Objectives
Against this contrasting backdrop, this article undertakes a systematic comparative analysis of the public transport systems of Curitiba and Lisbon, focusing on the relationship between user costs, structural efficiency, and service value delivered. The central hypothesis advanced and tested is that Curitiba’s BRT-based system, with less modal and fare integration, are quite unfavourable from a user perspective when compared to Lisbon’s multimodal, digitally integrated, and subsidized transport system.
To test this hypothesis, the analysis focuses on four interconnected dimensions: governance and institutional arrangements, network structure and spatial coverage, financing mechanisms and fare policies, and service quality. Through this multidimensional framework, the analysis evaluates cost-efficiency from the user perspective while also identifying transferable lessons, best practices, and policy implications relevant to other urban contexts facing similar mobility challenges.
By comparing Curitiba and Lisbon - two cities with contrasting yet instructive trajectories, one marked by relative stagnation following early innovation, and the other by sustained transformation supported by political commitment and investment - the analysis sheds light on how institutional, economic, and political contexts shape user outcomes and system performance. The cross-continental comparative approach enriches transport literature by bridging quite different perspectives, while the in-depth case study design allows insights and policy lessons relevant to cities confronting similar challenges related to modal stagnation, financing limitations, governance fragmentation, and accessibility problems.
2. Theoretical Framework
2.1. Public Transport as Public Policy and Social Infrastructure
Public transport networks constitute far more than mere physical infrastructure or service provision (Nikolaev et al. (2022) because they are an essential public service, increasingly recognized as fundamental for exercising citizenship rights, accessing urban opportunities, and participating fully in economic and social life (Vasconcellos, 2018). Beyond its immediate functional dimension of providing accessibility, public transport plays a role as a redistributive policy instrument with capacity to mitigate socioeconomic inequalities by enabling access to employment, education, healthcare, and cultural opportunities (Pereira & Schwanen, 2013; Braga et al., 2023).
Contemporary literature emphasizes that efficient and sustainable public transport systems must balance and integrate three fundamental pillars: accessibility (both spatial coverage and economic affordability), sustainability (encompassing environmental impact and long-term financial viability), and quality (including comfort, safety, reliability, and user experience) (Gwilliam, 2013; Sogbe et al., 2025). These dimensions are interdependent and mutually reinforcing, requiring integrated governance structures, coherent policy frameworks, and consistent long-term investment sustained beyond political cycles.
The recognition of public transport as an essential social infrastructure, rather than merely a commercial service, shape financing models, governance structures, and performance evaluation frameworks (Lucas et al., 2022). This perspective justifies public subsidies, prioritizes accessibility and equity objectives alongside efficiency considerations, and demands democratic accountability and user participation in system planning and operation.
2.2. The BRT Model and Its Innovation, Diffusion, and Limitations
The Bus Rapid Transit model emerged in Curitiba during the early 1970’s as an innovative response to urban mobility challenges in resource-constrained contexts where conventional metro systems appeared financially prohibitive (Prestes et al., 2022). The model’s characteristics include dedicated bus lanes physically separated from mixed traffic, pre-boarding fare collection enabling faster boarding and alighting, level boarding through elevated stations and specially designed vehicles, high-capacity articulated or bi-articulated buses, and integration with urban development through transit-oriented zoning policies (Wright & Hook, 2007).
The BRT concept gained international recognition for offering service characteristics approaching Light Rail Transit (LRT) quality, including high capacity, reliability, and speed, at capital and operational costs lower than rail-based systems. This cost advantage, combined with implementation flexibility and relatively short construction timelines, made BRT attractive for cities in developing countries facing severe mobility challenges with limited financial resources (Hidalgo & Carrigan, 2010).
However, accumulated experience and research have identified structural limitations inherent to BRT systems, particularly those implemented without sustained investment and institutional support. Hidalgo and Carrigan (2010) document that numerous BRT systems across Latin America and Asia suffer from operational saturation, inadequate maintenance, infrastructure deterioration, and limited integration with complementary transport modes. Ardila-Gómez (2012) argues that BRT success depends on continuous investment, strong institutional capacity, political commitment, and effective enforcement - factors frequently absent or inconsistent in developing country contexts.
Cervero (2013) emphasizes that BRT, despite its advantages for medium-capacity corridors, cannot fully substitute for rail-based systems in very high-demand corridors where capacity requirements exceed practical bus system limits. Modal diversity and comprehensive network integration emerge as essential requirements for developing comprehensive, resilient, and adaptable urban mobility systems capable of serving diverse travel patterns and user needs (Du et al., 2022).
In other hand we should also emphasise that BRT are more space consumer than an LRT corridor, namely in stations where express buses can overtake the slowest ones.
2.3. Multimodality and System Integration
Multimodality refers to the coexistence and functional integration of different transport modes, including cycling and micro-mobility options, within a unified coordinated system. Contemporary transport literature emphasises that efficient and user-centred systems are those enabling seamless transitions between modes through integrated ticketing systems, coordinated schedules and service planning, adequate physical integration infrastructure (transfer stations, intermodal hubs), and unified information systems (Mees, 2010).
Givoni and Banister (2010) argue that multimodal integration is crucial for maximizing network coverage, service flexibility, and system resilience. Different modes present distinct advantages: metro and trains excel in high-capacity corridors with concentrated demand; buses provide flexible, cost-effective coverage in medium-density areas; light rail and trams serve medium-capacity corridors while supporting urban development; ferries utilize waterways where available. Integrated multimodal networks leverage these complementary strengths, providing users with options suited to diverse trip purposes, distances, and preferences.
European cities, including Lisbon, Amsterdam, Copenhagen, and Zurich, exemplify this integrated multimodal approach, where metro, trains, light rail, trams, buses, and cycling infrastructure operate in coordinated form under unified or closely coordinated governance structures. Users benefit from seamless transfers, unified fare systems, coordinated scheduling, and integrated information.
However, achieving genuine multimodal integration presents challenges (McIlroy, 2023), particularly regarding: (1) institutional coordination across multiple operators and government levels, (2) sustained investment requirements for infrastructure and technology, (3) fare revenue allocation among operators, (4) service coordination and scheduling, and (5) political commitment sustained beyond electoral cycles. These challenges are particularly acute in developing country contexts characterized by institutional fragmentation, fiscal constraints, and political instability (Sclar & Lönnroth, 2017).
2.4. Governance, Institutions, and Path Dependence
Transport system governance, encompassing institutional structures, regulatory frameworks, decision-making processes, and accountability mechanisms, influences operational efficiency, service quality, investment patterns, and user outcomes. Marsden and Rye (2010) emphasise that fragmented governance characterized by multiple uncoordinated actors, overlapping jurisdictions, and conflicting objectives tends to produce inefficient systems, suboptimal service quality, and poor user experiences.
The new institutionalism in political science (Peters, 2012) offers analytical frameworks for understanding how institutions (formal rules, informal norms, organizational structures, and established practices) shape public policies, constrain or enable change, and produce path-dependent trajectories. Path dependence concepts (Sorensen, 2015) prove particularly relevant for understanding why transport systems frequently resist transformation even when facing evident inefficiencies, changing demands, or technological opportunities.
Path dependence operates through multiple mechanisms: (1) sunk costs in existing infrastructure creating resistance to modal diversification, (2) established institutional structures and routines resisting reorganization, (3) political coalitions defending existing arrangements, (4) technical standards and operational practices becoming locked-in, and (5) user habits and expectations adapting to existing systems. These mechanisms explain why pioneering systems like Curitiba’s BRT, despite evident limitations, resist fundamental transformation toward multimodal integration.
In Curitiba’s case, Oliveira (2018) demonstrates how institutional path dependence rooted in the BRT success contributed to subsequent system stagnation. The success that brought international recognition created institutional resistance to modal diversification, technological innovation, and governance reform. Established interests, including bus operators, municipal agencies, and urban planning professionals, defended the existing BRT-centred model against proposals for metro construction, light rail implementation, or metropolitan governance integration.
Conversely, Lisbon’s metropolitan governance model, despite inherent complexity and coordination challenges, has demonstrated capacity for adaptation, innovation, and sustained investment (Gonçalves et al., 2022). The metropolitan authority (Autoridade Metropolitana de Transportes and its operator, Transportes Metropolitanos de Lisboa - TML) coordinates bus and tram services across 18 municipalities, while maintaining relationships with centrally managed operators. This structure, though imperfect, has enabled implementation of transformative policies like the Navegante pass and sustained infrastructure investment programs.
2.5. Cost-Efficiency, Fare Policy, and Subsidy Economics
Cost-efficiency analysis in public transport contexts involves comparing service costs, including both operational costs and capital investments, with benefits delivered to users, cities, and society (Litman, 2024). From the user perspective, the most directly relevant metric is the relationship between fares paid and service value received, measured through dimensions including network coverage, service frequency, travel time, comfort, reliability, safety, and accessibility.
However, comprehensive cost-efficiency analysis must also consider broader social benefits (positive externalities) generated by public transport, namely: (1) congestion reduction through automobile trip substitution, (2) air quality improvement and greenhouse gas emission reduction, (3) road safety improvements, (4) urban development and land value impacts, (5) social inclusion through mobility access, and (6) economic productivity through labour market accessibility (Litman, 2024). These broader benefits justify public subsidies even when fare revenues fail to cover operational costs.
Fare policy represents a crucial instrument for ensuring accessibility, managing demand, influencing modal choice, and generating revenue. Contemporary fare policy debates increasingly emphasise accessibility and equity objectives, recognizing that high fares relative to incomes effectively exclude low-income populations from mobility opportunities and urban participation (Allen et al., 2023). Progressive fare policies incorporate income-based discounts, comprehensive monthly passes, free or reduced fares for specific groups (students, elderly, unemployed), and integration across modes to minimize transfer penalties (Gwilliam, 2013).
Subsidy levels and structures vary across countries and regions, reflecting different political priorities, fiscal capacities, and institutional traditions. European public transport systems generally receive public subsidies, typically covering 50-70% of operational costs, enabling relatively low fares and high service quality. In contrast, Latin American systems traditionally depend heavily on fare revenue, with subsidies covering only 10-30% of costs, implying higher fares and often compromising service quality and accessibility (Hidalgo & Carrigan, 2010).
Recent trends, however, show increasing recognition, even in developing countries, that subsidies are both economically justified (by positive externalities) and socially needed (for accessibility and equity). Examples include Brazil’s Free Fare Movement advocacy, Colombia’s subsidized fare systems, and various fare reduction programs across Latin America. These policy shifts reflect growing understanding that public transport is an essential social infrastructure deserving public investment.
3. Methodology
3.1. Research Design and Epistemological Approach
This study adopts a predominantly qualitative research approach grounded in comparative case study methodology (Yin, 2014). Case study research enables in-depth, contextualized investigation of contemporary phenomena within real-world settings, proving particularly valuable when boundaries between phenomenon and context are not clearly evident and when understanding requires attention to contextual complexity, historical trajectories, and institutional dynamics. The comparative approach facilitates systematic identification of similarities and differences between cases, enabling pattern recognition, hypothesis generation and testing, and theory development (Goodrick, 2014).
The selection of Curitiba and Lisbon as case studies was based on five criteria: (1) comparable population sizes and metropolitan complexity; (2) distinct yet instructive trajectories (pioneering innovation versus sustained transformation); (3) different institutional and economic contexts; (4) availability of data and documentation; and (5) potential for generating transferable lessons relevant to other cities facing similar challenges.
3.2. Data Collection Strategy and Sources
Data collection combined multiple sources and methods, following established principles for case study research emphasizing triangulation and evidence convergence (Table 1).
3.3. Analytical Framework and Dimensions
The comparative analysis was structured around four core analytical dimensions, each encompassing a set of qualitative and quantitative indicators capturing governance arrangements, network configuration, financing mechanisms, and service quality. Table 2 summarizes the analytical framework and key indicators adopted.
For each dimension, specific quantitative indicators were defined when data permitted, supplemented by qualitative assessments based on document analysis and literature review when quantitative data were unavailable or incomparable.
3.4. Comparative Analysis Approach
The comparative analysis followed a sequential, multi-stage approach. The process progressed from systematic system characterization of each case to cross-case comparison across the four analytical dimensions, followed by explanatory interpretation of observed differences, integrated cost-efficiency assessment from the user perspective, and synthesis of policy implications. This structured approach ensured analytical consistency and transparency throughout the comparative process (Figure 1).
3.5. Research Limitations and Constraints
This comparative case study is subject to several limitations. First, data availability and comparability posed constraints due to differences in institutional frameworks, reporting standards, and transparency practices between the two cases. Some indicators were unavailable or not fully comparable, requiring the use of qualitative assessments and triangulation across sources. Second, the analysis reflects a temporal snapshot, focusing primarily on conditions observed in 2024/5, while incorporating historical context where relevant. Given the dynamic nature of public transport systems, ongoing or future reforms may affect performance beyond the timeframe examined. Third, contextual differences between Curitiba and Lisbon, including socioeconomic conditions, fiscal capacity, governance structures, and political traditions, limit the direct transferability of findings. Finally, the study’s analytical scope is deliberately focused on governance, network structure, financing, service quality, and cost-efficiency from the user perspective, and does not encompass comprehensive environmental, land-use, or broader cost–benefit analyses.
4. Case Study A - Curitiba
4.1. Historical Context and System Development
The development of Curitiba’s public transport system is intrinsically linked to the city’s urban planning, representing one of the most celebrated examples of integration between land use and transport planning in the developing world. During the 1960’s and 1970’s, under the leadership of urban planners at the Institute for Research and Urban Planning of Curitiba (IPPUC), the city implemented an innovative urban development model (Rabinovitch & Leitman, 1996). This model integrated land-use planning, transport infrastructure, and urban design, establishing high-density zoning along designated transport corridors (Cervero, 2013). The BRT system, inaugurated in 1974 with the first exclusive bus lane along the North-South structural axis, became the centrepiece of this integrated model (Wright & Hook, 2007). Its innovations included bus lanes physically separated from general traffic, tube-shaped stations allowing level boarding and off-board fare payment, high-capacity articulated buses, and coordinated feeder networks connecting peripheral neighbourhoods to structural axes (Cervero, 2013).
Throughout the 1980’s and 1990’s, the system gained international recognition, positioning Curitiba as a reference for urban planners and transport experts worldwide. The BRT concept developed was subsequently replicated and adapted in over 200 cities across six continents, including large systems like TransMilenio in Bogotá and Metrobús in Mexico City (Hidalgo & Carrigan, 2010). However, starting around 2000, observers began to note signs of systemic stagnation (Oliveira, 2018). Despite population growth, no new structural BRT axis was built after 1995 (Oliveira, 2018). The reliance on a single mode (buses) presents capacity constraints, infrastructure deterioration, and a sustained decline in ridership (ITDP, 2018). This crisis was exacerbated by the COVID-19 pandemic, which resulted in a 63% drop in user volume at its peak (Freitas, 2020), with the system experiencing a slow recovery that stabilized at around 710,600 passengers transported on weekdays in 2025 (URBS, 2026) (Figure 2).
Recognizing the limits of this institutional path dependence, Curitiba initiated a phase of “transitional modernization” in the 2020’s. Driven by the Curitiba Climate Change Adaptation and Mitigation Plan (PlanClima) approved in 2020, the city pursued an agenda of decarbonization and network upgrading (Prefeitura de Curitiba - PdC, 2023). Instead of pursuing a heavy and financially prohibitive subway system, which had paralyzed local planning for decades, the public administration began testing high-capacity intermediate hybrid technologies (BNDES, 2025).
In late 2025, the operational introduction of the Digital Rail Transit (DRT) occurred on a metropolitan corridor between the municipalities of Pinhais and Piraquara (Governo do Estado do Paraná, 2025). Manufactured by CRRC, this 30-meter-long bidirectional electric vehicle, which operates on rubber tires, is guided by high-precision magnetic sensors embedded in the asphalt. This technology bridges the gap between a traditional BRT and a LRT system without the costs associated with installing railway infrastructure. This shift demonstrates a strategic pivot away from strict monomodality toward a diversified, technology-driven metropolitan network.
4.2. Governance and Institutional Structure
Historically, Curitiba’s public transport system was managed and regulated by URBS (Urbanização de Curitiba S.A.), a mixed-capital company controlled by the municipal government, operating in conjunction with IPPUC, which dictates urban and spatial planning guidelines (IPEA, 2024). The URBS model was based on concession contracts that relied on remuneration tied to the volume of transported passengers, a “net cost” paradigm that incentivized bus overcrowding and restricted private operators’ investments in service quality (URBS, 2025). However, to address accumulated inefficiencies, Curitiba’s governance structure is undergoing a reform, driven by a new concession modelling process led by the Brazilian Development Bank (BNDES) with implementation scheduled for 2025/2026 (BNDES, 2025) (Table 3).
The new concession structured by BNDES introduces a modern governance framework. The 15-year contracts, distributed across five operational lots with an estimated cost of R$ 1.1 billion (approximately €192 million), alter the system’s economic incentives (Diário do Transporte, 2025). The remuneration model transitions from a “per passenger” basis to a “gross cost” model based on the quilometres driven (URBS, 2025). This shift transfers demand risk from private operators to a newly established Public Guarantee Fund, ensuring financial stability for long-term investments in new fleets (PdC, 2025). Furthermore, the governance framework incorporates performance metrics, tying up to 3% of operators’ remuneration directly to service quality and operational efficiency indicators (URBS, 2025).
Simultaneously, metropolitan governance is undergoing formal institutionalization. The State of Paraná has elevated its supramunicipal governance capacity through the creation and empowerment of AMEP (Sclar & Lönnroth, 2017). Tasked with the formulation of the Integrated Urban Development Plan of the Curitiba Metropolitan Region (PDUI-RMC), AMEP acts as a coordinating body for the 29 municipalities adjacent to the capital, establishing unified mobility guidelines (AMEP, 2025). AMEP now manages subsidy transfers, including an annual allocation of R$ 60 million (€10.5 million) directly to URBS and R$ 216 million (€37.7 million) to the broader metropolitan network, intended to maintain physical integration between municipalities and offset operational deficits (AMEP, 2025).
4.3. Network Structure and Modal Coverage
The architecture of Curitiba’s transport network is founded on a hierarchical Trunk-Feeder system, utilizing dedicated structural corridors to form the backbone of the Integrated Transport Network (RIT) (Cervero, 2013). The contemporary system comprises 333 bus lines, 329 tube stations, and 21 integration terminals, operated by a fleet of 1,543 vehicles covering over 217,000 kilometres every weekday (URBS, 2026). Historically, this network was criticized for its monomodality, relying exclusively on buses that faced capacity constraints on high-demand axes, resulting in declining commercial speeds and user experience (ITDP, 2018).
To respond to this structural exhaustion, the network is undergoing its largest physical expansion in three decades, financed by multilateral development banks (BID, 2019). Aiming to break the limitations of the traditional BRT model, Curitiba is executing works focused on increasing commercial speed and infrastructure resilience (Table 4).
Supported by a $ 106.7 million (€95 million) loan from the Inter-American Development Bank (IDB), the “Novo Inter 2” project is requalifying 38 kilometres of routes that transport approximately 181,000 passengers daily across 28 neighbourhoods (PdC, 2025). This project introduces the “Solar Prism” station model, which replaces older tube stations with photovoltaic glass infrastructure that is thermally comfortable, climate-resilient, and equipped with universal accessibility and real-time digital connectivity (PdC, 2022). In parallel, the New Development Bank (NDB) is financing the $75 million (€66,8 million) modernization of the “East-West BRT” axis, which includes rebuilding integration centres and is designed to increase flow capacity by 30%. The infrastructure improvements are calculated to reduce travel times on the East-West axis by up to 23 minutes (PdC, 2025).
Furthermore, modal diversification is being pursued to bypass the constraints of rubber-tired transit. The introduction of the Digital Rail Transit (DRT) pilot in the metropolitan network marks the region’s first operational foray into integrating rail-emulating technologies (GEP, 2025). By operating a 30-meter, 280-passenger bidirectional vehicle guided by virtual magnetic tracks, the network achieves the capacity metrics of an LRT system without the disruption and costs associated with deploying steel tracks.
4.4. Financing and Fare Policy
The political economy of transport financing in Curitiba is historically characterized by a dependence on farebox revenues, which traditionally covered up to 85% of the system’s operational costs (URBS, 2025). This financial architecture generated a cyclical crisis: increasingly higher fares to maintain operational viability, which, in turn, alienated middle-class passengers and imposed a financial burden on low-income populations (Pereira & Schwanen, 2013).
Recognizing that fare affordability is a cornerstone of public transport’s utility as social infrastructure, a lesson demonstrated by the subsidized Navegante pass in Lisbon (TML, 2024), Curitiba implemented intervention mechanisms to shield users from operational cost inflation. For the transition period of the new concession between 2025 and 2026, the municipal and state governments froze the user fare at R$ 6.00 (approximately €1.05) (Bem Paraná, 2026). To maintain this freeze, direct public subsidies were increased. The new BNDES concession modelling incorporates an estimated R$ 800 million (€140 million) in structural public subsidies to bridge the gap between the technical fare required for operations and the social fare paid by the public (Diário do Transporte, 2025). This financial burden is now structurally shared with the State of Paraná through AMEP, bringing Curitiba’s financing structure closer to a model that treats mobility as a subsidized social good (Litman, 2024) (Figure 3).
Beyond freezing the base fare, Curitiba modernized its pricing strategy through the introduction of the Time-based Single Ticket (Digital Temporal Integration). This system allows users to make unlimited transfers between different lines and modes within a designated time window without paying a second fare (URBS, 2025). While Curitiba does not yet offer a universal flat-rate monthly metropolitan pass identical to Lisbon’s Navegante, the introduction of temporal integration - combined with targeted social policies, such as half-fares on Sundays and free passes for registered unemployed individuals - acts as an economic equalizer (Bem Paraná, 2026). State and municipal data indicate that external temporal integration generates direct savings for passengers traveling between Curitiba and metropolitan cities (GEP, 2025).
4.5. Service Quality and User Experience
Service quality and user experience in Curitiba have experienced a measured recovery after years of deterioration. According to the 2025 QualiÔnibus survey, conducted in partnership with the World Resources Institute (WRI Brasil), which evaluated a stratified sample of 958 users, overall system satisfaction registered an increase of +0.5 points compared to 2024 results (URBS, 2025). The system achieved scores of 7.5 out of 10 for Customer Service, 7.3 for Network Integration, and 7.2 for Universal Accessibility (URBS, 2025). The availability of passenger information and digital tools scored 7.0, reflecting the deployment of Mobility as a Service (MaaS) infrastructure, including official applications like Meu Estar Digital and the Curitiba App, and the use of digital payments (RecargaPay, 2025).
Despite these advances, structural challenges persist. The QualiÔnibus data identifies static infrastructure and urban externalities as primary detractors. Comfort at bus stops reached 5.6 points, validating the necessity of the IDB-financed implementation of the Solar Prism stations to replace older infrastructure that suffers from inadequate thermal control (PdC, 2022). Public safety in and around the transit environment registered 4.9, the system’s lowest metric, highlighting broader urban challenges beyond URBS’s operational control (URBS, 2025).
A finding from the 2025 survey is the public support for decarbonization: 82% of transport users support the accelerated transition to electric buses (WRI Brasil, 2025). Respondents correlated Zero Emission vehicles with the mitigation of engine noise and localized air pollution (URBS, 2025).
4.6. Current Challenges and Future Prospects
Curitiba’s public transport system is at a critical inflection point. Rather than facing a trajectory of inevitable decline, institutional spheres have orchestrated a strategic pivot to address its structural vulnerabilities. The current public policy objective is to execute a technological, green, and governance transition while ensuring viability. Curitiba’s long-term prospects are anchored in four fundamental pillars:
- Fleet Decarbonization: In alignment with the 2020 PlanClima, Curitiba has initiated a transition to electromobility budgeted at over R$ 1.5 billion (€262 million) (PdC, 2025). The new concession mandates the introduction of 245 zero-emission electric buses in the first five years of operation (BNDES, 2025). The system is legally bound to achieve a 33% zero-emission fleet by 2030, culminating in the 100% eradication of operational fossil fuels by 2050 (BNDES, 2025).
- Modal Diversification: The planning dogma that confined Curitiba to rubber-on-asphalt monomodality has been challenged. The State Government’s commitment to pilot the Digital Rail Transit (DRT) technology demonstrates a pragmatic approach (GEP, 2025). By adopting vehicles guided by virtual magnetic tracks (capable of transporting up to 280 passengers) the system aims to achieve capacity and comfort comparable to a Light Rail Transit (LRT) system, avoiding the costs associated with underground subway projects.
- Metropolitan Governance: The challenge of municipal fragmentation is being addressed through the maturation of the Integrated Urban Development Plan (PDUI-RMC) led by AMEP, which provides legal foundations for master plans in the region (AMEP, 2025). Ensuring legislative continuity for the annual state subsidy package (currently R$ 216 million / €37.7 million) is crucial to guarantee borderless fare and route integration among 29 municipalities.
- Financial Engineering: The city has bundled transport into the broader “PRO Curitiba” public works program, totalling R$ 6 billion (€1.05 billion) in planned municipal investments through 2028 (Bem Paraná, 2025). To protect this transformation, the city must maintain fiscal governance to service active credit lines of over US$ 180 million from the IDB and NDB. Simultaneously, the BNDES’s gross cost remuneration model will require ongoing auditing to ensure the transfer of revenue risk does not overwhelm municipal solvency (URBS, 2025).
5. Case Study B - Lisbon
5.1. Historical Context and System development
Lisbon’s public transport history extends over 150 years. The tram system, inaugurated in 1873 as a horse-drawn tram and electrified in 1901, represents one of Europe’s oldest urban transport networks. The metro system, inaugurated in December 1959, was the first in the Portuguese-speaking world (Vuchic, 2007).
After the democratic revolution in 1974 and Portugal’s integration into the European Economic Community (now European Union) in 1986, the transport system underwent a transformation. EU membership provided access to structural and cohesion funds targeting infrastructure development. These funds enabled investments in transport infrastructure that would have been financially challenging through Portuguese national resources alone.
During the 1990’s and 2000’s, Lisbon experienced a phase of expansion and modernization of its public transport system. The metro network expanded from its original two-line configuration to a four-line system. The 1998 Lisbon World Exhibition (Expo 98) drove this process, triggering infrastructure projects including the development of the Oriente multimodal hub and the extension of metro services to eastern areas of the city and the airport.
In parallel, suburban rail services operated by the national rail company (Comboios de Portugal - CP) were modernized, with electrification, station upgrades, rolling stock renewal, and service frequency improvements. Since the new century, a private company (Fertagus) operates a train service linking the south bank to Lisbon, and a light rail system (MTS) operates in two municipalities on the south bank. Surface transport also underwent reorganization, as bus and tram networks were progressively restructured to complement metro services.
These investments were accompanied by the development of intermodal transfer facilities designed to facilitate seamless transfers between metro, rail, bus, and river transport. More recently, the 2019 implementation of the Navegante monthly metropolitan pass represented a shift in fare policy. This unified pass, valid across all modes and all 18 municipalities in the metropolitan area, simplified ticketing and reduced costs for users. The policy was enabled by the national Tariff Reduction Support Plan (PART), through which the central government and municipalities compensate operators for revenues lost due to fare reductions (TML, 2024).
5.2. Governance and Institutional Structure
Lisbon’s governance structure reflects the complexity inherent in managing a multimodal metropolitan system encompassing multiple operators, technologies, and jurisdictional scales (Table 5).
This multi-layered structure reflects an institutional evolution attempting to balance operator autonomy with metropolitan coordination. The structure is not without challenges, particularly regarding coordination between bus/tram networks (managed by TML) and rail and ferry networks (managed by central government entities). However, this governance model has enabled advances in integration, service quality, and user-centred policies. The Navegante pass exemplifies successful coordination despite institutional fragmentation, requiring complex negotiations among multiple operators with different cost structures and institutional cultures. The central government’s commitment through PART funding was essential for overcoming operator resistance.
5.3. Network Structure and Modal Coverage
Lisbon’s public transport system exemplifies multimodality through the integration of several transport modes operating at different spatial scales. These modes are designed to be complementary, with each serving distinct demand profiles and spatial functions (Table 6).
Lisbon’s modal diversity generates structural advantages by allowing transport capacity to match different demand profiles. High-capacity metro services serve the city’s highest-demand corridors; suburban trains accommodate longer-distance metropolitan trips; buses and trams provide flexible coverage in medium and lower density areas. This combination enables a degree of geographic coverage and service adaptability that would be unattainable within a single-mode system.
These advantages are reinforced by intermodal integration. Major multimodal stations, such as Oriente, Entrecampos, Sete Rios, Cais do Sodré, and Marquês de Pombal, facilitate connections between metro, rail, bus, and ferry services through coordinated layouts, schedules, and travel information. Fare integration through the Navegante pass reduces barriers to multimodal travel, allowing unlimited use of all modes for a single monthly fee. In parallel, integrated information systems and journey planning applications support multimodal travel by providing users with real-time network-wide information.
5.4. Financing and Fare Policy
Lisbon’s transport system receives public subsidies, reflecting European policies and Portuguese political commitment to public transport accessibility. According to operator financial reports and TML data, approximately 50-60% of operational costs are covered by public funding from municipalities and central government, with the remainder from fare revenues and other minor sources (advertising, commercial activities).
The structure of monthly passes reflects the simplicity and affordability of the fare system (Table 7). Rather than relying on complex zonal pricing, the system offers a limited number of differentiated pass types based on user profile and spatial coverage.
Portugal’s national minimum wage in 2025 is €870 per month (gross). The Navegante Metropolitano pass at €40 represents approximately 4.6% of the minimum wage. For a minimum wage worker, the monthly transport cost is fixed, predictable, and affordable, regardless of trip frequency or distance within the metropolitan area.
Figure 4.
Positive effects of Navegante pass.
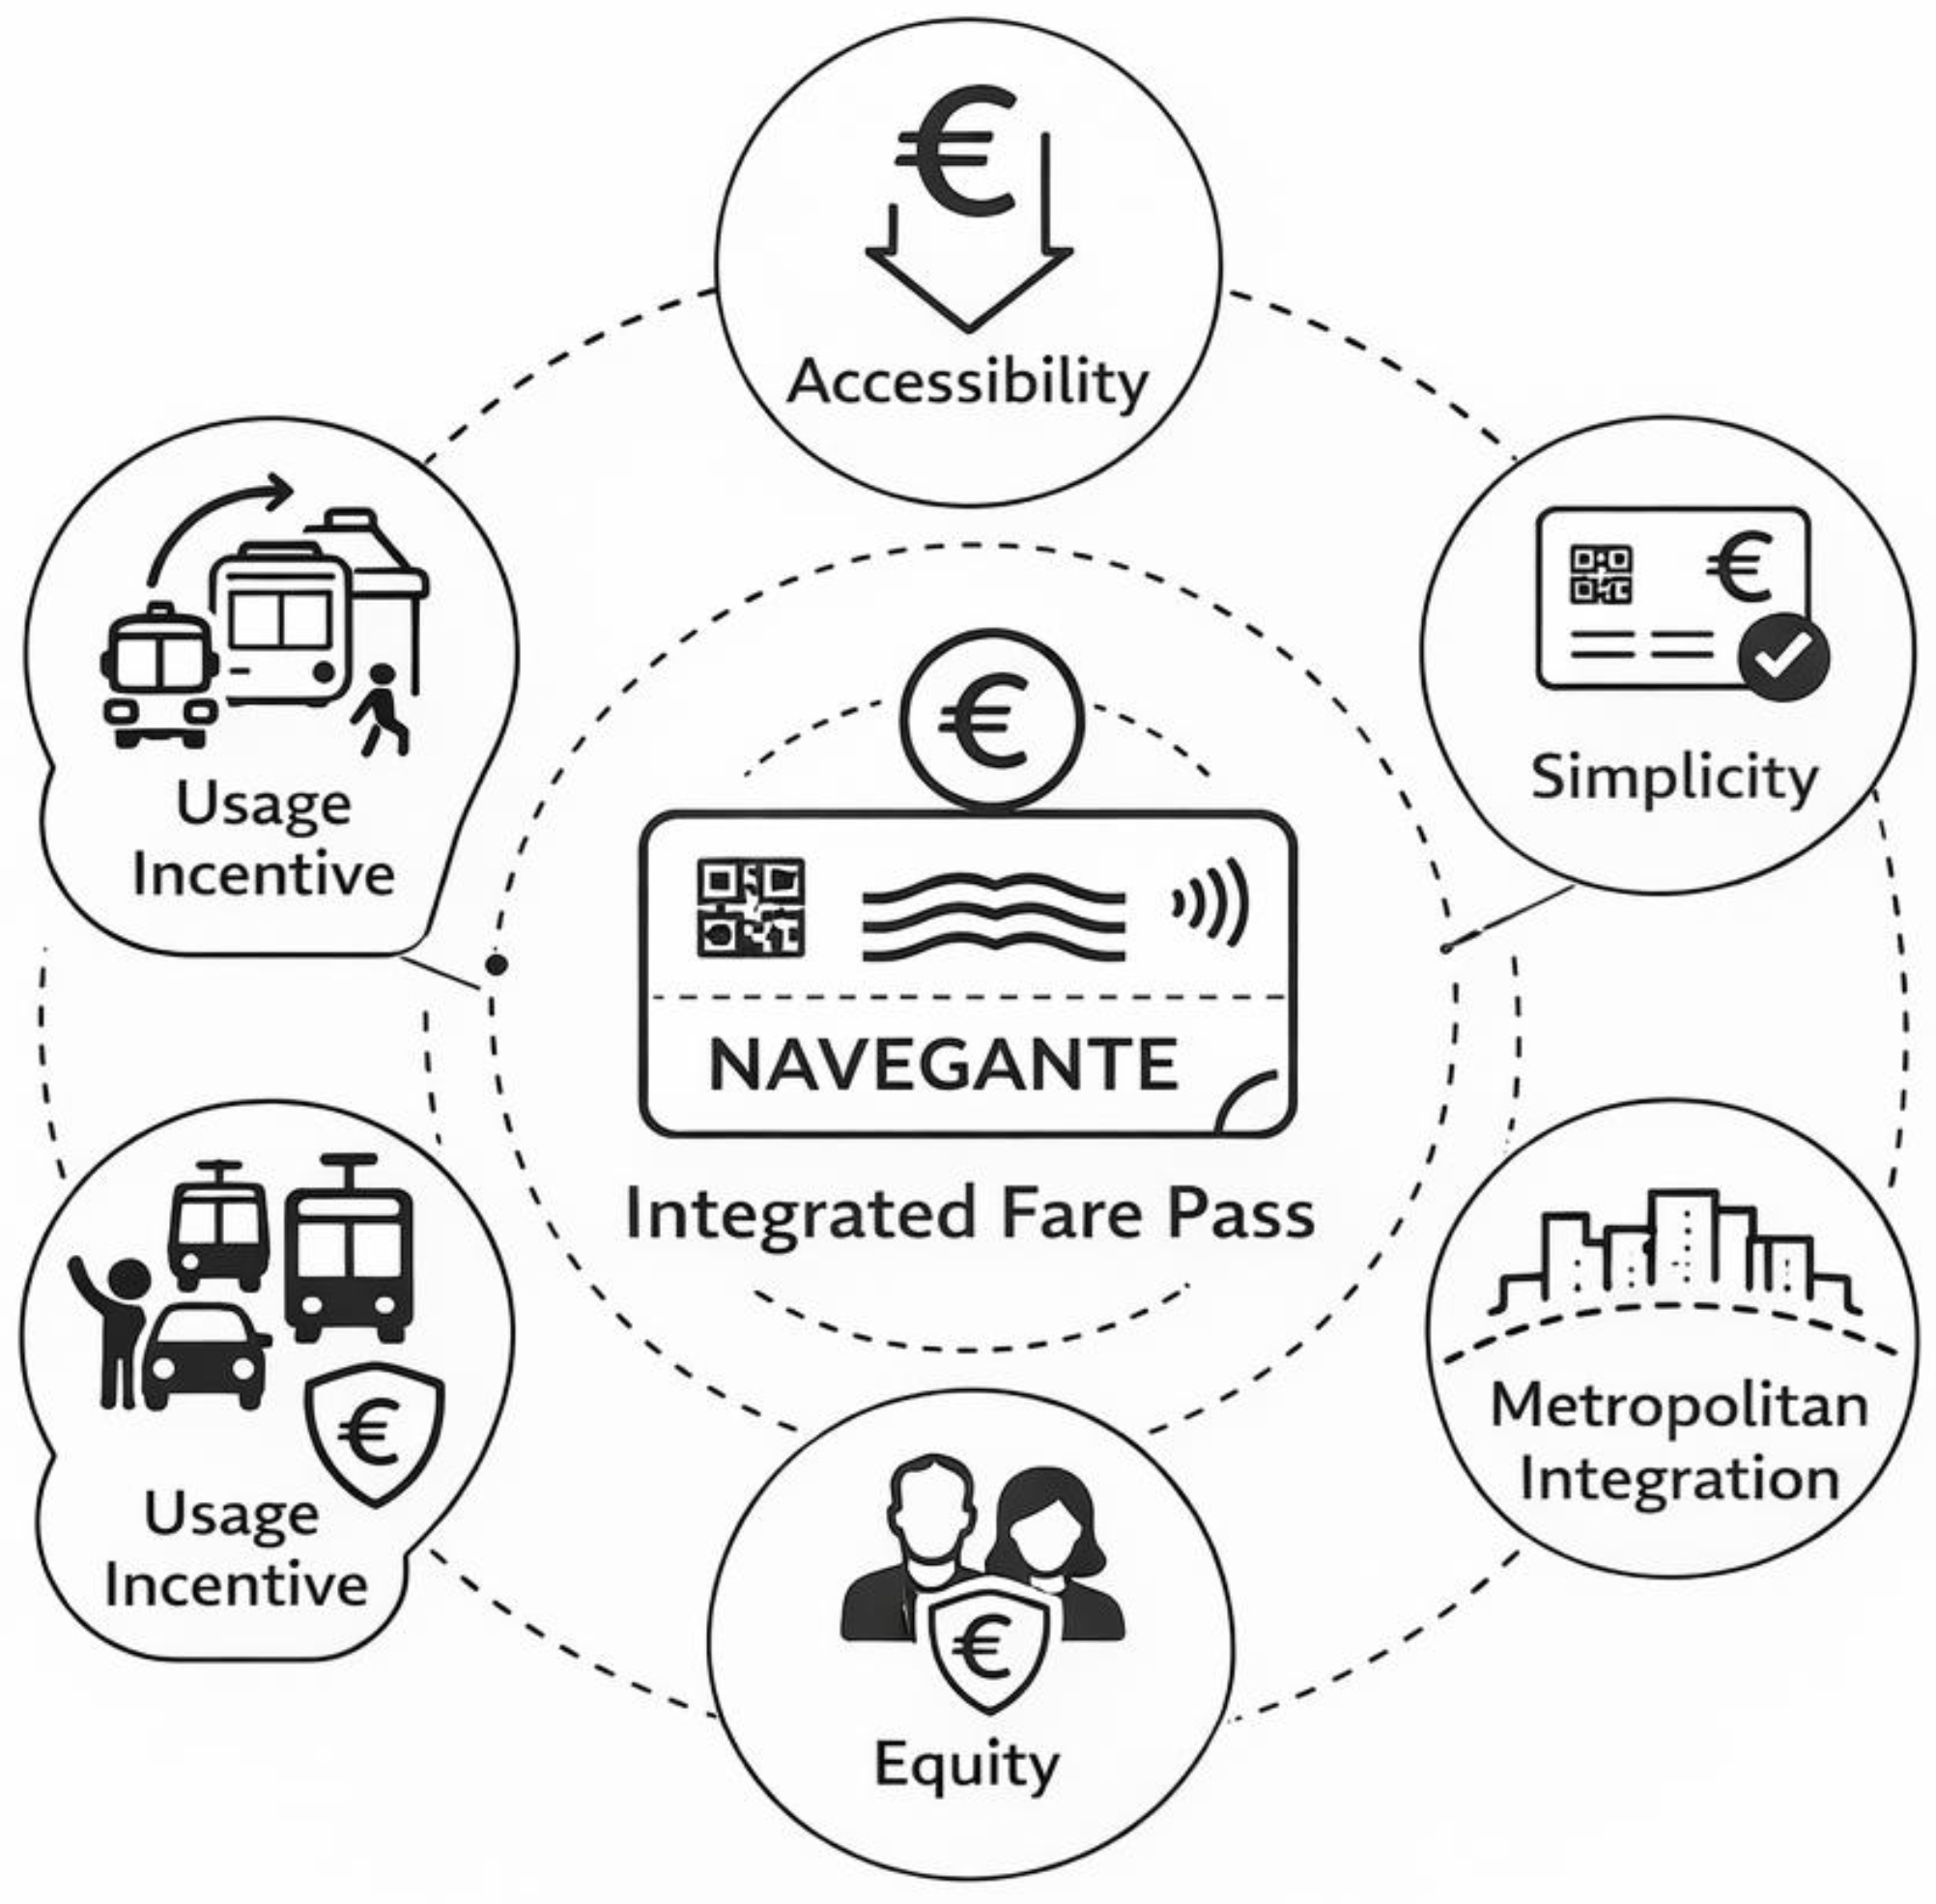
The Tariff Reduction Support Plan (PART) enabled this policy, through which the national government (75% in the first years) and municipalities (25%) compensate transport authorities for revenues lost due to fare reductions compared to previous higher fares. PART represents a financial commitment, approximately €100 million annually, justified by policy objectives including social inclusion, environmental sustainability, congestion reduction, and economic productivity.
Recent data confirms this policy’s success because ridership increased approximately 25-30% in the first year following Navegante implementation, with particularly strong growth among previously underserved populations. User satisfaction surveys show improvements, with the pass consistently rated as one of the most popular public policies in recent Portuguese history. In December 2025, authorities confirmed that Navegante prices would not increase in 2026, maintaining affordability despite rising operational costs (The Portugal News, 2025).
5.5. Service Quality and User Experience
Lisbon’s public transport system exemplifies effective service due to investments in infrastructure, technology, and user-focused policies. Rail modes, especially the metro, are characterized by reliability, modernity, and accessibility, enhancing user experience with minimal wait times. However, recent metro line construction has led to some service disruptions, including delays and frequency reductions. Surface transport modes like buses and light rail enhance urban connectivity, with ongoing improvements in fleet quality and environmental performance. Historic trams serve both transport and cultural functions, despite accessibility limitations. Digital initiatives, including real-time information and electronic ticketing, enhance travel convenience and multimodal integration. Accessibility considerations are increasingly prioritized in metro infrastructure, while retrofitting programs address gaps in older facilities. Safety is generally high, though peak crowding and occasional service interruptions pose challenges. User satisfaction surveys reveal favourable opinions on Lisbon’s transport, notably post-Navegante fare system implementation, although overcrowding and surface service irregularities are common concerns.
5.6. Recent Developments and Future Prospects
Lisbon’s public transport system continues to evolve through a combination of infrastructure expansion, technological innovation, and policy-driven integration. Ongoing investments in metro and LRT expansions constitute a central pillar of this strategy, with new lines improving connectivity to underserved areas and strengthening links between urban and suburban zones. These projects reinforce the role of rail-based transport as the structural backbone of the metropolitan network.
At the same time, resources are being directed toward fleet renewal and decarbonization across surface modes. The progressive replacement of diesel buses with electric and liquefied gas vehicles, alongside investments in energy efficiency for rail operations, aligns Lisbon’s transport policy with broader national and European climate objectives.
Digitalization represents another key axis of ongoing modernization. The gradual integration of Mobility as a Service (MaaS) platform, expanded real-time information systems, and unified digital interfaces is reshaping how users interact with the transport system. These initiatives reinforce multimodal travel and enhance the usability of the network.
Efforts to strengthen metropolitan integration are also continuing, particularly in relation to coordination between metropolitan surface transport managed by TML and centrally governed rail services. While institutional fragmentation remains a challenge, incremental improvements in information sharing, scheduling coordination, and physical integration at transfer points signal a gradual movement toward more cohesive metropolitan governance. Parallel investments in accessibility upgrades aim to close remaining gaps.
6. Comparative Analysis
6.1. Governance and Institutional Capacity
Curitiba is evolving from a historically fragmented, purely municipal model into a multi-tiered governance framework. The establishment of AMEP and the execution of the PDUI-RMC provide a nascent metropolitan coordination mechanism. The strategic partnership with BNDES to restructure concessions from a net-cost to a gross-cost model improves investment security and operator accountability. While still reliant on state-municipal subsidy pacts rather than unified central funding like EU cohesion funds, this new architecture mitigates the institutional path dependence that previously stalled innovation (Oliveira, 2018).
Lisbon presents a more complex governance structure with multiple entities managing different modes at different scales. This complexity creates coordination challenges. However, TML provides metropolitan-scale governance for surface modes, enabling coordinated planning and fare integration. Modal specialization allows different entities to specialize in their respective modes, potentially enabling greater technical expertise. Access to EU funds, national subsidies, and metropolitan resources provides financial backing for investments. Lisbon’s governance, despite greater complexity, demonstrates superior capacity for metropolitan coordination, modal integration, and sustained long-term investment. The metropolitan scale of TML, combined with EU financial support and national government commitment, enables transformative policies (Navegante) and sustained infrastructure investment. However, coordination between TML-managed surface modes and centrally managed rail networks remains imperfect, with different institutional cultures and priorities sometimes creating friction.
6.2. Network Structure and Modal Diversity
While fundamentally anchored in its legacy BRT architecture, Curitiba is actively breaking its strict monomodality to address capacity constraints. The investment for the Novo Inter 2 and BRT Leste-Oeste projects transforms aging corridors into higher-efficiency infrastructure (e.g., Prisma Solar stations). The introduction of the Digital Rail Transit (DRT) pilot demonstrates a pragmatic pivot towards high-capacity, light-rail-equivalent technology, optimizing intermediate technologies for a Global South financial reality.
Lisbon’s genuinely multimodal network (comprising metro, trains, trams, buses, and ferries) provides advantages. Through capacity matching, different modes serve corridors with appropriate capacity, utilizing the metro for the highest demand, trains for suburban connections, and buses for broader coverage. This diversity ensures flexibility and resilience, as multiple modes provide alternatives and redundancy. The combined network achieves comprehensive coverage that would be impossible with any single mode. Lisbon’s modal diversity represents a competitive advantage, enabling superior capacity, flexibility, coverage, and user experience compared to Curitiba’s monomodal system. This difference is not merely quantitative but qualitative; multimodal systems respond to different users’ needs. The contrast is particularly stark on high-demand corridors. Curitiba’s structural BRT axes, despite dedicated infrastructure, face capacity constraints and cannot provide the speed, reliability, or comfort of Lisbon’s metro on comparable corridors.
6.3. Financing and Fare Policy
The contrast between Curitiba and Lisbon is stark in relation to financing structures and fare policy. Curitiba’s public transport system remains heavily dependent on fare revenues, which account for approximately 80–85% of operational costs, with limited public subsidy support. This financing model constrains policy flexibility and creates a self-reinforcing cycle. High fares are required to cover operating costs, imposing a disproportionate burden on low-income users, restricting accessibility. In turn, elevated fares combined with declining service quality encourage users with viable alternatives to shift toward private modes, reducing ridership and further increasing per-passenger costs. This downward spiral limits resources for maintenance and modernization.
In a departure from its historical reliance on farebox revenues, Curitiba froze user tariffs at R$ 6.00 (approximately €1.05) through 2026. This is sustained by state and municipal subsidies, estimated at R$ 800 million (€140 million) under the new BNDES concession structure (Diário do Transporte, 2025), supplemented by R$ 216 million (€37.7 million) in state integration funds via AMEP (AMEP, 2025). Furthermore, the implementation of “Temporal Integration” digital ticket functions as an economic equalizer. While Lisbon’s pass remains cheaper as a proportion of the minimum wage, Curitiba’s shift toward subsidizing transport as an essential social infrastructure represents a closure of the conceptual gap between the two fiscal paradigms.
Lisbon’s approach reflects an understanding of public transport as essential social infrastructure deserving public investment, justified as a social instrument with externalities. The Navegante pass exemplifies how transformative policy innovation, enabled by political commitment and adequate financing, can simultaneously improve accessibility and increase ridership, creating virtuous rather than vicious cycles.
6.4. Service Quality and User Experience
Differences in service quality reflect distinct investment capacities. While Lisbon leverages sustained EU investments for a consistently high-quality experience, Curitiba’s 2025 WRI QualiÔnibus survey reveals measurable user satisfaction improvements (+0.5 overall increase) (URBS, 2025). Strong performance in digital information and temporal integration mitigates legacy infrastructure complaints. While urban security remains a vulnerability (scoring 4.9), the system is poised for a qualitative leap. The BNDES-mandated rollout of 245 electric buses and the IDB-funded Prisma Solar stations directly answer the 82% user mandate for decarbonisation (WRI Brasil, 2025), replacing the narrative of systemic deterioration with one of digital and environmental modernization.
Lisbon delivers higher service quality across most dimensions. Rail-based modes, especially the metro, provide a reliable and high-frequency backbone. Surface modes extend coverage and offer flexibility, while ongoing fleet renewal and electrification programs enhance comfort and environmental performance. Digital tools reduce uncertainty and facilitate seamless multimodal travel. These qualitative differences are reflected in user perceptions. Survey data indicate consistently higher satisfaction levels in Lisbon.
6.5. Integrated Cost-Efficiency Assessment
Synthesizing findings across governance, network structure, financing, and service quality indicates differing cost-efficiency outcomes from the user perspective. In Curitiba, users experience a significant financial strain relative to their income. Consequently, the system yields limited benefits, marked by exclusive bus services, declining infrastructure, inadequate technological capabilities, and poor metropolitan integration. This results in suboptimal value for money, as users incur high fares for a system with restricted coverage and diminishing service quality. Conversely, Lisbon exhibits a favourable cost-efficiency dynamic. Users enjoy a low monthly fare for unlimited travel throughout the metropolitan area. In return, the system offers extensive modal diversity, dependable operations, and strong metropolitan integration.
From the user’s viewpoint, this results in outstanding value for money, where affordability, service quality, and network coverage mutually enhance each other.

Table 8.
Comparative Cost-Efficiency Indicators.
| Indicator | Curitiba | Lisbon | Ratio / Proportion |
|---|---|---|---|
| Monthly Cost (2 trips/day) | R$ 528 (~€92) | €40 | 2.3 : 1 |
| % of Minimum Wage | ~37% | ~4.6% | 8 : 1 |
| Modal Diversity (Modes) | 1 | 5 | 1 : 5 |
| Metro Extent (km) | 0 | 45 | 0 : 45 |
| Real-time Information | Limited | Comprehensive | - |
| Infrastructure Condition | Deteriorating | Modern | - |
| Public Subsidy (% of costs) | ~15% | ~50–60% | 1 : 3.5 |
| User Satisfaction (% good+) | 38% | 72% | 1 : 1.9 |
While the cost-to-income ratio in Curitiba historically painted a dire picture, the integration of R$ 800 million in structural subsidies, the tariff freeze, and the R$ 1.5 billion investments in fleet electrification under the 2025/2026 concession alter the equation (PdC, 2025). Lisbon maintains a cost-efficiency advantage due to its existing rail infrastructure and the macro-financial backing of the European Union. However, Curitiba’s recent institutional rearrangements demonstrate that high-efficiency temporal integration, gross-cost contract governance, and the adoption of hybrid DRT technologies can deliver a value proposition that maximizes accessibility and sustainability within the fiscal constraints of the Global South.
7. Discussion
7.1. Explaining the Differences: Contextual Factors
The differences between Curitiba and Lisbon’s public transport systems stem from structural, economic, institutional, and political factors. Lisbon’s EU integration provides access to funds for transport development, enabling significant long-term investments. This funding supports metro expansion and modernization that local financing cannot match. In contrast, Curitiba lacks comparable international funding and relies on limited local and state resources.
National conditions further emphasize this divergence, as Portugal’s higher income and social welfare commitment enhance fiscal capacity for transport investment. A stable cross-party commitment in Portugal has also supported long-term transport planning and policy. Conversely, Brazil’s political volatility and shifting priorities hinder sustained investment and create uncertainty for transport reforms.
Institutional factors significantly influence these systems; Curitiba’s BRT model has led to path dependence, limiting diversification despite changes in demand. Lisbon’s established multimodal tradition has facilitated ongoing integration across transportation modes. Governance and fiscal organization differences are also critical beacuse Lisbon’s metropolitan structures promote coordinated planning and fare integration, supported by a centralized fiscal framework, and in contrast, Curitiba’s fragmented governance and decentralized fiscal system restrict comprehensive metropolitan solutions.
7.2. Lessons for Urban Transport Policy
The comparison between the two systems put in evidence some lessons for urban transport policy:
- Modal diversity is essential. Monomodal systems, however well-designed initially, face inherent capacity, attractiveness, and flexibility limitations. High-demand corridors require rail modes. Genuine multimodality provides resilience and comprehensive coverage.
- Integration maximizes value. Physical and fare integration between modes maximizes network utility and user convenience. Unified passes like Navegante represent powerful tools for promoting public transport and simplifying user experience.
- Subsidies are justified and necessary. Public transport generates positive externalities justifying public subsidies. Low fares improve accessibility, increase ridership, reduce automobile dependence, and promote equity. The “user pays” model is inappropriate for an essential social infrastructure.
- Long-Term investment is imperative. Transport infrastructure requires sustained investment over decades. Short-term approaches inevitably lead to deterioration, obsolescence, and declining service quality.
- Metropolitan governance is crucial. Urban mobility transcends municipal boundaries. Effective metropolitan governance mechanisms are essential for comprehensive, efficient solutions and guarantee a fair distribution of costs and benefits among municipalities.
- Technology matters. Modern digital technologies substantially improve user experience and system efficiency.
- Accessibility must be prioritized. Universal design and accessibility must be incorporated from the beginning.
- Path Dependence can be overcome. While institutional path dependence is powerful, it can be overcome through political leadership, stakeholder engagement, and demonstration of alternatives.
7.3. The Enabling Role of International Integration
Lisbon exemplifies the critical role of international integration in transport transformation. EU funding has been essential for metro expansion, fleet renewal, and intermodal integration. EU policies on accessibility, environmental standards, procurement, and urban mobility have offered technical guidance and political justification for ongoing improvements.EU membership has also facilitated knowledge transfer through transnational networks and exposure to best practices from other European cities.
Moreover, EU integration has fostered long-term planning, institutional continuity, and sustained public investment. Technical assistance programs have further enhanced local capacity. The Lisbon case reflects a broader implication for resource-constrained cities, lacking access to external funding, policy frameworks, and knowledge networks, transformative investment potential is diminished. For developing nations, this presents the challenge of establishing alternative support mechanisms, such as engaging with multilateral development banks, climate finance instruments, enhanced South-South cooperation, or strong national urban transport investment programs. Without these mechanisms, even well-conceived transport strategies may remain financially and institutionally unattainable.
8. Conclusions
This comparative analysis confirms that Curitiba, despite higher fare burdens, offers lower service value than Lisbon’s integrated transport system. Additionally, an integrated governance model facilitates responsiveness to population changes through innovative planning and fare systems.
Public transport reflects political choices regarding urban development and resource distribution, as evidenced by the contrasting outcomes in Curitiba and Lisbon.
Curitiba, once a model of innovation, now faces stagnation and declining user satisfaction without diversification and modernization of its transport system. Without these changes, urban mobility, social equity, and quality of life in Curitiba may deteriorate further.
Curitiba’s issues are not isolated; many global cities face similar challenges, highlighting the need for ongoing investment and flexibility. Early achievements do not ensure sustained success; ongoing political and financial commitment is crucial.
Lisbon exemplifies successful transformation through political commitment, adequate resources, and effective governance, as seen with the innovative Navegante pass. This initiative illustrates how political will and funding can enhance accessibility and ridership, fostering investment cycles.
The main findings of the comparison can be summarized as follows:
Governance and Institutional Capacity: Lisbon’s governance demonstrates superior coordination and investment capabilities compared to Curitiba’s fragmented approach, aided by EU support for transformative policies.
Modal Diversity and Network Structure: Lisbon’s multimodal system offers significant advantages in capacity and service quality over Curitiba’s singular bus system, thereby enhancing user experience.
Financing and Fare Policy: Lisbon’s substantial subsidies allow for a more affordable fare policy compared to Curitiba, reflecting differing political priorities in public transport funding.
Service Quality and User Experience: Lisbon provides higher service quality across various dimensions, resulting in significantly greater user satisfaction compared to Curitiba.
Cost-Efficiency from User Perspective: Lisbon offers better value for users, who pay significantly less relative to income while receiving superior service.
Based on these findings, several recommendations are proposed for improving transport systems in both cities, summarized in Table 9.
Theoretical Contributions and Further Research
This study empirically evidences performance disparities between monomodal and multimodal transport systems across varied institutional and economic contexts. The analysis reveals multimodal systems’ superiority in capacity, flexibility, service quality, and user cost-efficiency, challenging the sustainability of single-mode solutions in complex metropolitan areas. Moreover, the study elucidates the constraining influence of path dependence, with Curitiba’s scenario exemplifying how initial success can hinder innovation through entrenched institutional structures. This insight enhances discourse on policy lock-in and institutional inertia. Additionally, the analysis underscores international integration’s pivotal role in transport system evolution, as seen in Lisbon’s case, where external financial resources and transnational networks broaden policy options. The research also emphasizes the necessity of metropolitan governance for effective urban mobility, revealing that fragmented local governance is inadequate for metropolitan mobility issues. Lastly, the findings inform debates on transport financing by illustrating the rationale for public subsidies. While this study evaluates cost-efficiency and system performance from the user perspective, future research could broaden the analysis to include environmental impacts, social equity, and wider economic effects. Longitudinal and multi-city comparative studies may validate the findings’ robustness, while a deeper investigation of governance and political dynamics can enhance understanding of transport policy formulation and implementation.
References
- Allen, J.; Higgins, C. D.; Silver, D.; Farber, S. Are low-income residents disproportionately moving away from transit? J. Transp. Geogr. 2023, 110, 103635. [Google Scholar] [CrossRef]
- AMEP - Agência de Assuntos Metropolitanos do Paraná. Plano de desenvolvimento urbano integrado da Região Metropolitana de Curitiba (PDUI-RMC).; AMEP, 2025. [Google Scholar]
- Ardila-Gómez, A. Public transport in Latin America: Structural issues and new challenges. Res. Transp. Econ. 2012, 36(1), 77–87. [Google Scholar]
- Paraná, Bem. (2025, novembro 17). PdC anuncia tarifa de ônibus congelada em R$ 6 durante 2026.
- Paraná, Bem. (2025, março 10). PRO Curitiba: Pacote de obras de R$ 6 bilhões é apresentado.
- Banco Interamericano de Desenvolvimento (BID). Curitiba melhorará a mobilidade urbana com apoio do BID.; 2019. [Google Scholar]
- 7. Banco Nacional de Desenvolvimento Econômico e Social (BNDES). Transporte público com foco em eletrificação e emissão zero: BNDES modelará nova concessão de Curitiba. 2025.
- Braga, C. K. V.; Loureiro, C. F. G.; Pereira, R. H. Evaluating the impact of public transport travel time inaccuracy and variability on socio-spatial inequalities in accessibility. J. Transp. Geogr. 2023, 109, 103590. [Google Scholar] [CrossRef]
- Cervero, R. Bus Rapid Transit (BRT): An efficient and competitive mode of public transport.; University of California: Berkeley, 2013. [Google Scholar]
- Diário do Transporte. Licitação dos transportes por ônibus de Curitiba: 5 lotes, custo de R$ 1,1 bilhão; 245 ônibus elétricos com R$ 800 milhões de subsídios. 2025. [Google Scholar]
- Du, Y.; Wang, H.; Gao, Q.; Pan, N.; Zhao, C.; Liu, C. Resilience concepts in integrated urban transport: a comprehensive review on multi-mode framework. Smart Resilient Transp. 2022, 4(2), 105–133. [Google Scholar] [CrossRef]
- de Freitas, R. C. Transporte coletivo perdeu 63% dos passageiros e continua encolhendo. Plural. 2020. [Google Scholar]
- Givoni, M.; Banister, D. Integrated transport: From policy to practice.; Routledge, 2010. [Google Scholar]
- Goodrick, D. Comparative case studies (Methodological Briefs: Impact Evaluation No. 9); UNICEF Office of Research, 2014. [Google Scholar]
- GEP. (2025, novembro 28). Primeiro na América do Sul: Bonde urbano digital começa a operar entre Pinhais e Piraquara. Agência Estadual de Notícias.
- Gwilliam, K. Cities on the move: Ten years after. Res. Transp. Econ. 2013, 40(1), 3–18. [Google Scholar] [CrossRef]
- Gonçalves, J.; Pinto, P.; Santos, M. Who and how decides when and where? Drifts and deadlocks in metropolitan governance. Urban Res. Pract. 2023, 16(3), 374–393. [Google Scholar] [CrossRef]
- Hidalgo, D.; Carrigan, A. Modernizing public transportation: Lessons learned from major bus improvements in Latin America and Asia.; World Resources Institute, 2010. [Google Scholar]
- Instituto de Pesquisa Econômica Aplicada (IPEA). The equity implications of Transit Oriented Development in Curitiba.; 2024. [Google Scholar]
- Institute for Transportation and Development Policy (ITDP). The BRT standard 2018; 2018. [Google Scholar]
- Litman, T. Evaluating public transit benefits and costs: Best practices guidebook; Victoria Transport Policy Institute, 2024. [Google Scholar]
- Lucas, K.; Philips, I.; Verlinghieri, E. A mixed methods approach to the social assessment of transport infrastructure projects. Transportation 2022, 49(1), 271–291. [Google Scholar] [CrossRef]
- Marsden, G.; Rye, T. The governance of transport and climate change. J. Transp. Geogr. 2010, 18(6), 669–678. [Google Scholar] [CrossRef]
- Mees, P. Transport for suburbia: Beyond the automobile age.; Earthscan, 2010. [Google Scholar]
- McIlroy, R. C. “This is where public transport falls down”: Place based perspectives of multimodal travel. Transp. Res. Part F. Traffic Psychol. Behav. 2023, 98, 29–46. [Google Scholar] [CrossRef]
- Nikolaev, A.; Elkanova, E.; Malov, A.; Dzyuban, V.; Epkhiev, O.; Dudina, O.; Okhotnikov, I.; Pavlova, S. Sociological aspect of the city transport infrastructure management strategy. Transp. Res. Procedia 2022, 63, 2289–2294. [Google Scholar] [CrossRef]
- Oliveira, A. G. Path dependency e inovação em políticas públicas: O caso do transporte em Curitiba. Tese de doutorado, Universidade Federal do Paraná, 2018. [Google Scholar]
- Pereira, R. H. M.; Schwanen, T. Tempo de deslocamento e desigualdades no acesso às oportunidades no Brasil. Rev. Bras. De Estud. Urbanos E Reg. 2013, 15(2), 77–92. [Google Scholar]
- Peters, B. G. Institutional theory in political science: The new institutionalism, 3ª ed.; Continuum, 2012. [Google Scholar]
- PDC. (2022, novembro 10). Técnicos esclarecem detalhes do edital da nova estação do Inter 2 em evento virtual.
- PDC. (2023, dezembro 5). Curitiba avança com eletromobilidade e preparação para nova concessão do transporte coletivo.
- PDC. (2025, fevereiro 14). Nova concessão do transporte prevê R$ 1,5 bilhão em frota elétrica e eletropostos.
- Prestes, O. M.; Ultramari, C.; Caetano, F. D. Public transport innovation and transfer of BRT ideas: Curitiba, Brazil as a reference model. Case Stud. Transp. Policy 2022, 10(1), 700–709. [Google Scholar] [CrossRef]
- Rabinovitch, J.; Leitman, J. Urban planning in Curitiba. Sci. Am. 1996, 274(3), 46–53. [Google Scholar] [CrossRef]
- RecargaPay. Cartão Transporte URBS: Recarga pelo celular com Pix ou cartão. 2025. Available online: https://recargapay.com.br/.
- Sclar, E.; Lönnroth, M. The governance of urban transport: Institutions and policy frameworks for sustainable mobility.; UN-Habitat, 2017. [Google Scholar]
- Sogbe, E.; Susilawati, S.; Pin, T. C. Scaling up public transport usage: a systematic literature review of service quality, satisfaction and attitude towards bus transport systems in developing countries. Public Transp. 2025, 17(1), 1–44. [Google Scholar] [CrossRef]
- Sorensen, A. Taking path dependence seriously: An historical institutionalist research agenda in planning history. Plan. Perspect. 2015, 30(1), 17–38. [Google Scholar] [CrossRef]
- The Portugal News. (2025, dezembro 19). Travel pass price to remain the same. 2025. [Google Scholar]
- Transportes Metropolitanos de Lisboa (TML). Relatório De Atividades 2023. 2024.
- Urbanização de Curitiba S.A. (URBS). Relatório De Avaliação Econômico-Financ. Da Concessão.; 2025. [Google Scholar]
- Urbanização de Curitiba S.A. (URBS) URBS em números. 2026.
- Vasconcellos, E. A. Urban transport policies in Brazil: The creation of a discriminatory mobility system. J. Transp. Geogr. 2018, 67, 85–91. [Google Scholar] [CrossRef]
- Vuchic, V. R. Urban transit systems and technology.; Wiley, 2007. [Google Scholar]
- WRI Brasil. Pesquisa de satisfação QualiÔnibus - Curitiba 2025.; WRI Brasil & URBS, 2025. [Google Scholar]
- Wright, L.; Hook, W. Bus Rapid Transit planning guide.; Institute for Transportation and Development Policy, 2007. [Google Scholar]
- Yin, R. K. Case study research: Design and methods, 5ª ed.; Sage Publications, 2014. [Google Scholar]
Figure 1.
Multi-stage comparative analysis Framework.

Figure 2.
Curitiba Transport System Development Timeline.
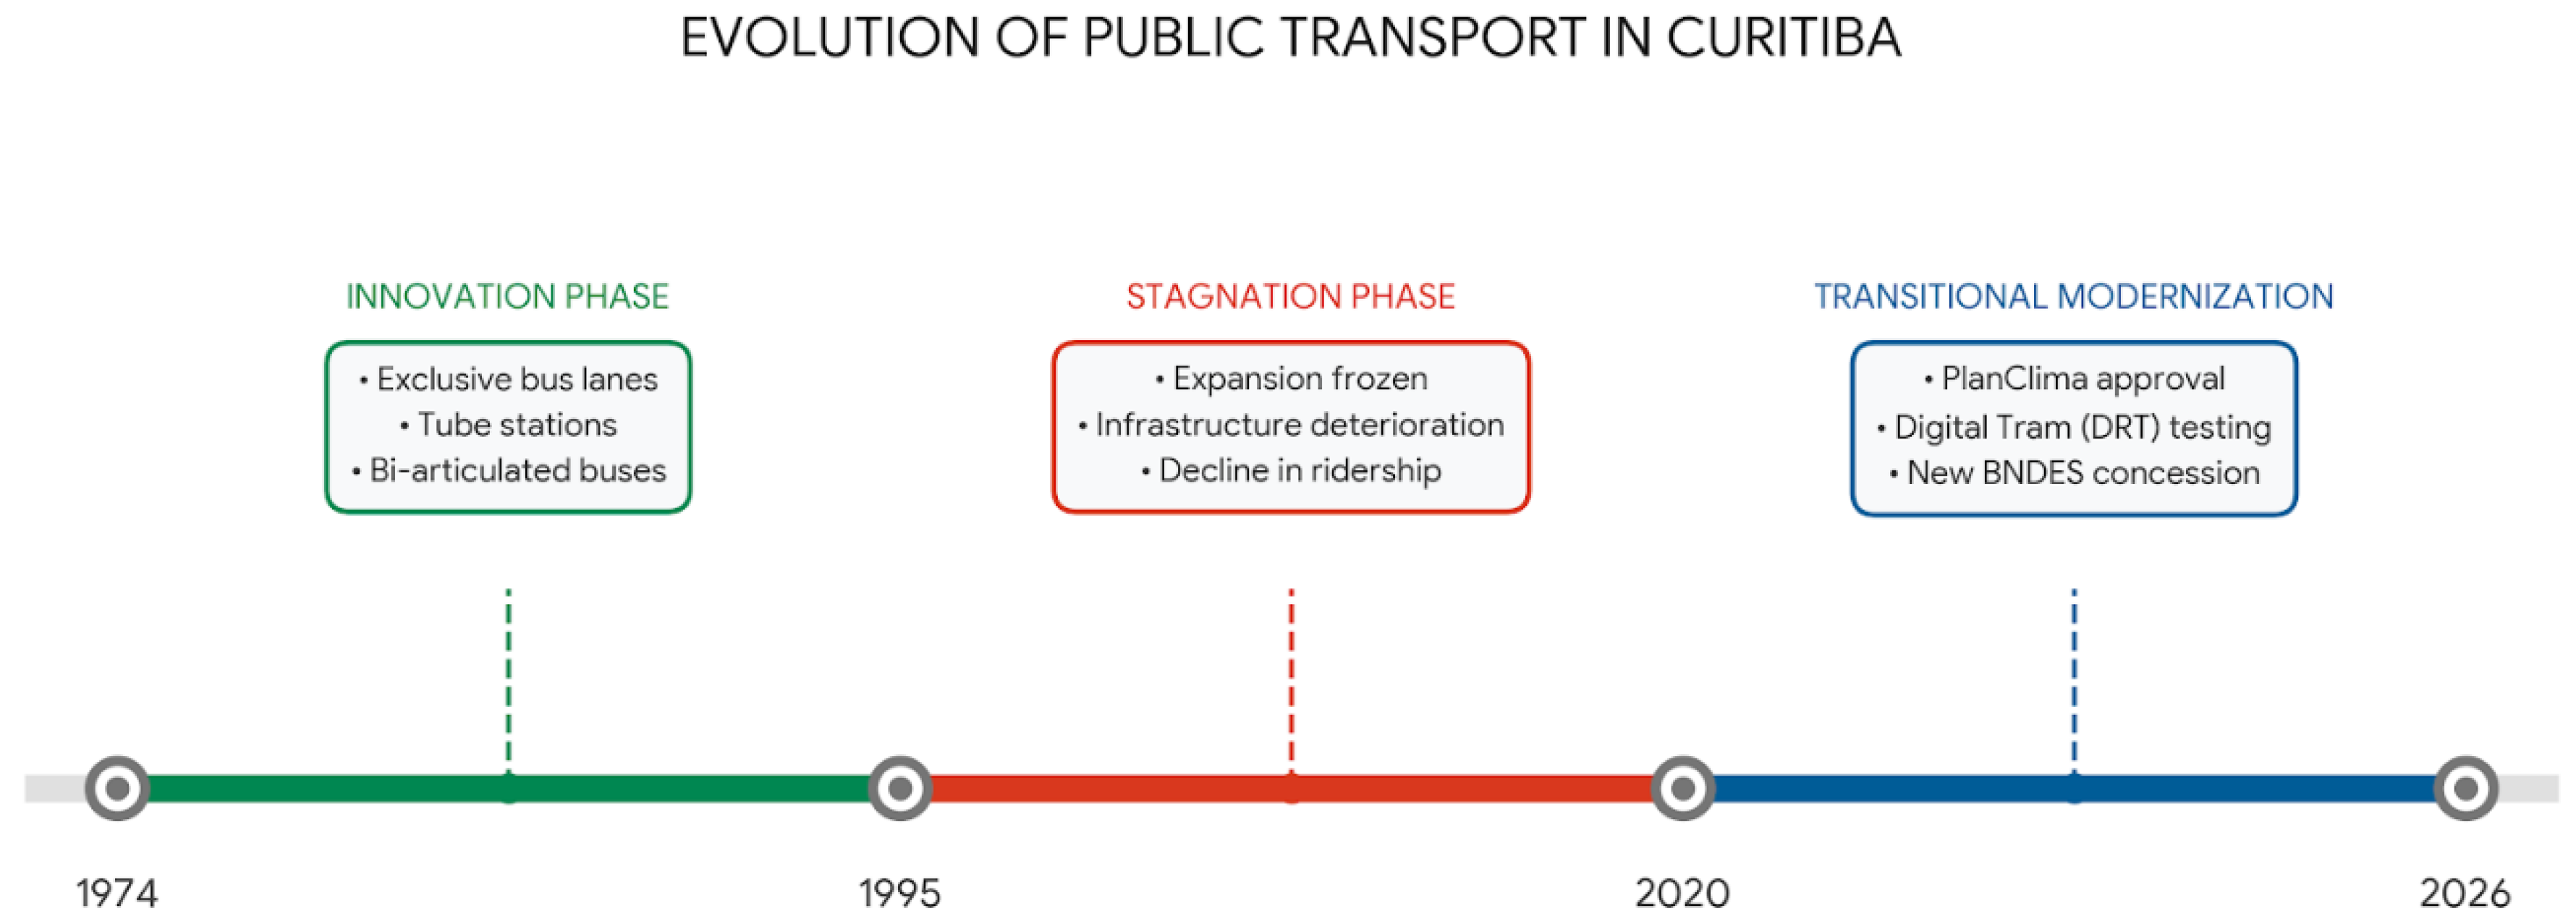
Figure 3.
Cost-Efficiency Impact of Time-Based Integration in Curitiba.
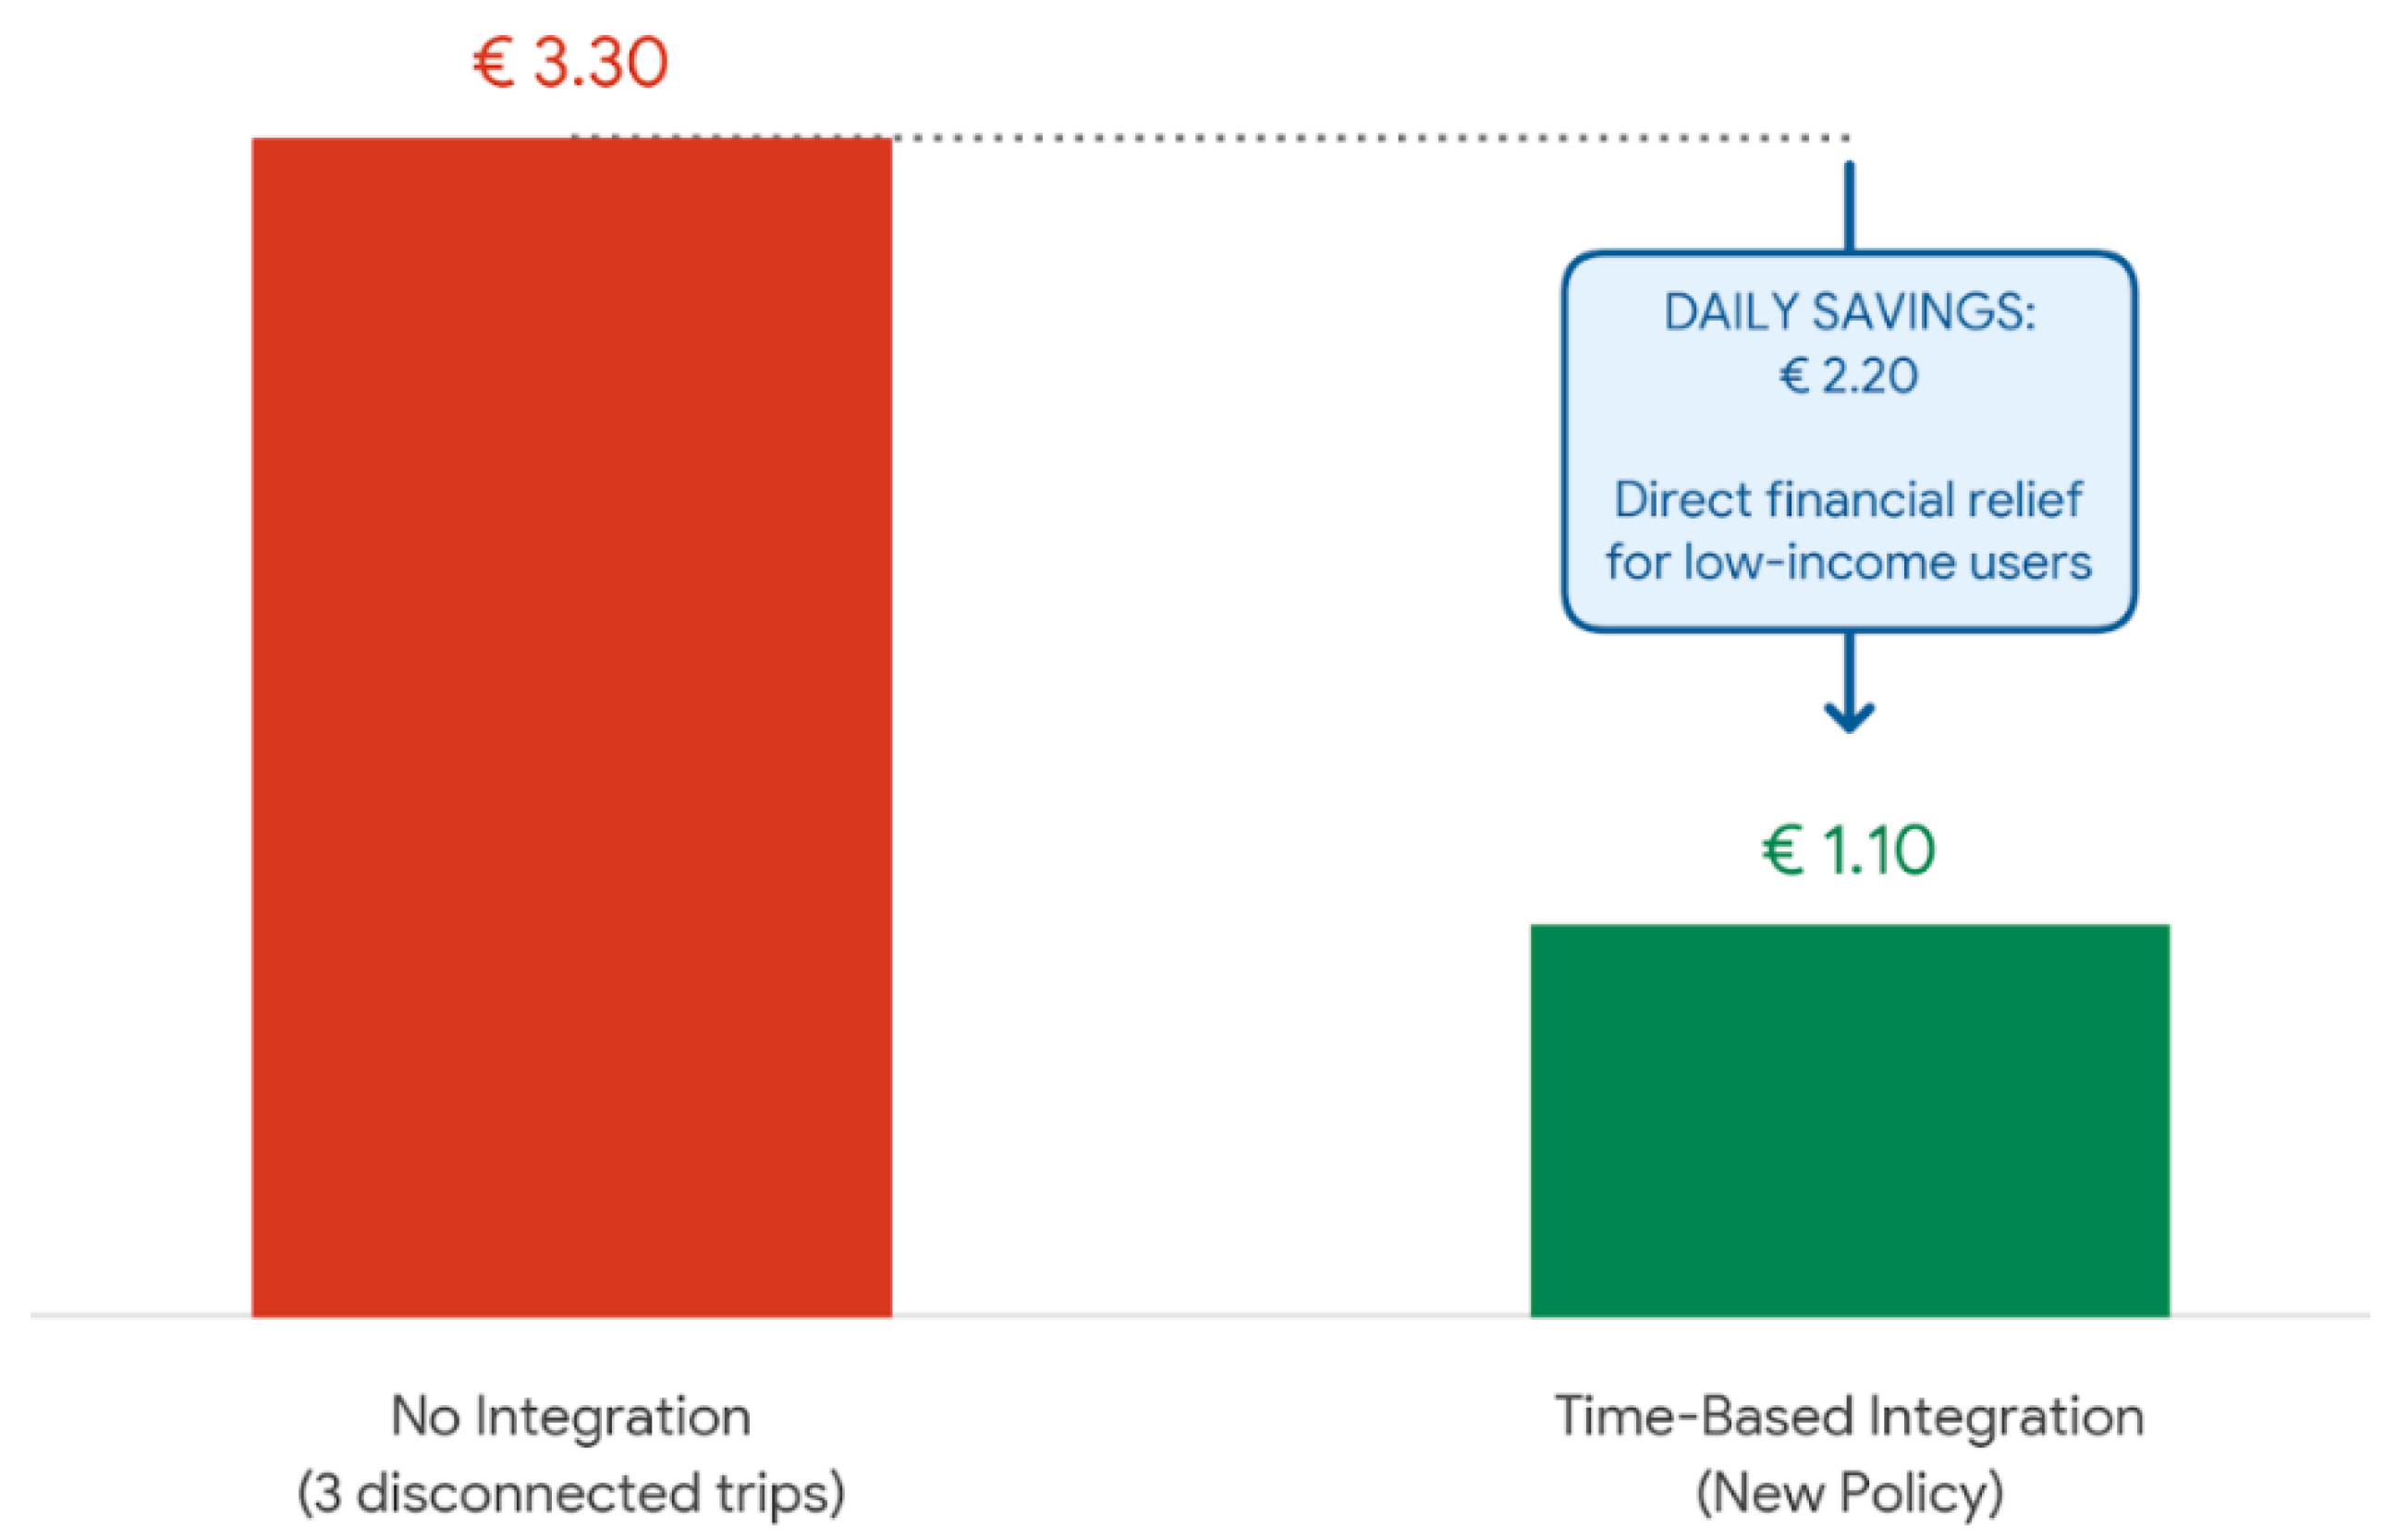
Table 1.
Data collection strategy and sources.
| Source type | Main content | Indicators / information extracted | Geographical scope | Time period |
|---|---|---|---|---|
| Official documents and institutional reports | Annual reports, strategic plans, public policy documents, concession contracts, regulatory frameworks | Governance structures, operational models, institutional arrangements, investment strategies | Curitiba and Lisbon | 2015-2025 |
| Statistical and operational data | Ridership statistics, network characteristics, fleet data, operational performance, financial records | Passenger volumes, network length, number of routes and vehicles, service frequencies, fares, costs, subsidy levels | Curitiba and Lisbon | 2019-2025 |
| Academic and technical literature | Peer-reviewed journal articles, doctoral dissertations, master’s theses, technical studies | Critical analyses, theoretical frameworks, comparative assessments, structural limitations and best practices | International, with focus on both case studies | 2000-2025 |
| International organizations and specialized institutions | Reports from the World Bank, UITP, ITDP and other international bodies | Standardized indicators, international benchmarks, policy recommendations | International | 2010-2025 |
| Recent news and media coverage | News articles, official announcements, interviews, expert commentary | Recent system changes, reforms, institutional conflicts, public perception | Curitiba and Lisbon | 2024-2025 |
| Web-based and digital sources | Operator and authority websites, user information portals, journey planning tools, social media platforms | Up-to-date operational information, digital services, user feedback and public discourse | Curitiba and Lisbon | 2024-2025 |
Table 2.
Analytical framework and evaluation dimensions.
| Analytical dimension | Core focus | Key indicators / variables | Type of analysis |
|---|---|---|---|
| Governance and operational structures | Institutional organization and regulatory framework of public transport systems | Governance model, legal framework, regulatory authority, operator structure, contractual arrangements, metropolitan coordination, stakeholder participation | Qualitative, comparative |
| Network structure and modal coverage | Physical configuration and functional scope of the transport network | Modal diversity, network extension, service coverage, stop/station density, service frequency, operating hours, capacity and crowding levels | Quantitative and qualitative |
| Financing and fare policy | Economic structure and user cost burden | Revenue sources, subsidy levels, fare structure, pricing strategies, affordability (fare as % of income), discount schemes, financial sustainability | Quantitative, comparative |
| Service quality and user experience | Performance and perceived quality of transport services | Infrastructure condition, vehicle quality, technology adoption, accessibility, reliability, safety, punctuality, user satisfaction | Mixed-methods |
Table 3.
Principal institutional actors in Curitiba’s public transport system.
| Institution | Governance Level | Main Responsibilities | Role in System Integration |
|---|---|---|---|
| URBS (Urbanização de Curitiba S.A.) | Municipal (Mixed-Capital Company) | Management, tactical planning, oversight, and tariff regulation of the capital’s fleet and infrastructure. | Operational control of the RIT (Integrated Transport Network) within the municipality and management of the ticketing system. |
| IPPUC (Institute for Research and Urban Planning) | Municipal (Autarchy) | Long-term strategic planning, land use-transport integration, and development of structuring projects (e.g., Novo Inter 2). | Alignment of transport with urban zoning and decarbonization goals (PlanClima). |
| AMEP (Paraná Metropolitan Affairs Agency) | State/Metropolitan (Autarchy) | Coordination of metropolitan transport across 29 municipalities, development of the PDUI-RMC, and management of state subsidies. | Facilitation of physical and tariff integration across municipal borders; fund transfers. |
| BNDES (Brazilian Development Bank) | Federal (Financial Institution) | Technical-financial structuring of the new transport concession, risk modeling, and contract auditing. | Guaranteeing economic viability for the transition to electric (Zero Emission) fleets. |
| Private Operating Consortia | Private (Concessionaires) | Fleet operation, vehicle maintenance, and workforce hiring. | Direct execution of the service under quality metrics (SLA) required by the new contract. |
Table 4.
Major infrastructure projects in Curitiba (2024-2026).
| Project Name | Financing Agency | Investment | Length (km) | Main Technological and Physical Upgrades |
|---|---|---|---|---|
| Novo Inter 2 Program | Inter-American Development Bank (IDB) | US$ 106.7 million | 38 km | Implementation of Solar Prism Stations (energy-autonomous, climate-controlled), concrete road requalification, and traffic light priority. |
| East-West BRT | New Development Bank (NDB) | US$ 75 million | 20 km | Reconstruction of intermodal terminals (e.g., Capão da Imbuia), 30% increase in service capacity, 23-minute reduction in travel time. |
| Digital Rail Transit (DRT) | Government of the State of Paraná (AMEP) | R$ 6 million (Pilot Phase) | 10 km | 100% electric 30m vehicle, guided by virtual magnetic sensors, capacity for 280 passengers, operating on the Pinhais-Piraquara metropolitan connection. |
Table 5.
Principal institutional actors in Lisbon’s public transport system.
| Institution | Governance level | Mode(s) managed | Core responsibilities | Role in system integration |
|---|---|---|---|---|
| Metropolitano de Lisboa, E.P.E. | National (state-owned) | Metro | Planning, construction, operation, and maintenance of the metro system | High-capacity backbone; key urban integration nodes |
| Carris -Companhia de Carris de Ferro de Lisboa, S.A. | Municipal (Lisbon City Council) | Buses, LRT and trams | Operation of surface transport within Lisbon municipality | Urban coverage and feeder services |
| CP - Comboios de Portugal, E.P.E. | National (state-owned) | Suburban and regional trains | Operation of suburban rail services and national rail network | Metropolitan and regional connectivity |
| Transtejo / Soflusa | National (state-owned) | Ferries | Operation of river crossings across the Tagus | Cross-river metropolitan integration |
| TML - Transportes Metropolitanos de Lisboa | Metropolitan | Buses and trams (metropolitan coordination) | Planning, contracting, and coordination of surface transport across 18 municipalities | Fare integration and network coordination |
| AML - Área Metropolitana de Lisboa | Metropolitan | Strategic (all modes) | Strategic planning, policy coordination, management of Navegante system | Metropolitan-scale governance |
| Transportes Coletivos do Barreiro | Municipal | Buses | Operation of surface transport within Barreiro municipality | Urban coverage and feeder services |
| MobiCascais | Municipal | Buses | Operation of surface transport within Cascais municipality | Urban coverage and feeder services |
| Fertagus | Private company (government public concession) |
Suburban train | Train connexions between south and north bank of metropolitan Lisbon | Cross-river metropolitan integration |
| Metro Transportes do Sul - MTS | Private company (government public concession) |
LRT in the municipalities of Almada and Seixal | Operation and maintenance of the LRT network | Urban coverage and feeder services |
Table 6.
Modal structure of Lisbon’s public transport system.
| Mode | Network scale | Key characteristics | Primary function | Integration features |
|---|---|---|---|---|
| Metro | 4 lines, 45 km, 56 stations | High-capacity, high-frequency, fully grade-separated | Backbone for high-demand urban corridors | Interchanges with trains, buses, ferries; unified fare system |
| Suburban trains | 4 main lines, 100+ stations | Electrified, regional reach, higher speeds | Metropolitan and regional connectivity | Integrated fares; major multimodal hubs |
| Buses | 140+ routes (Lisbon) | Flexible routing, surface operation | Area coverage and feeder services | Coordinated with rail; integrated ticketing |
| Trams | 5 routes | Medium-capacity, heritage and modern rolling stock | Urban corridors and tourist flows | Integrated fares; shared stops with buses |
| Ferries | 4 river crossings | High-capacity river transport | Cross-river metropolitan links | Direct connection to metro and rail |
Table 7.
Navegante monthly pass structure in the Lisbon Metropolitan Area.
| Pass Type | Monthly Price (€) | Eligibility | Geographical Coverage | Modes Included |
|---|---|---|---|---|
| Navegante Metropolitano | 40 | Standard adult users | All 18 metropolitan municipalities | Metro, trains, buses, trams, ferries |
| Navegante Municipal | 30 | Users travelling within a single municipality | One municipality (e.g., Lisbon) | Metro, buses, trams (and local services) |
| Navegante 4/18 | 20 | Children and youth aged 4 to 18 | All metropolitan municipalities | All modes |
| Navegante +65 | 20 | Seniors aged 65 and over | All metropolitan municipalities | All modes |
| Navegante Social | Free | Registered low-income individuals | All metropolitan municipalities | All modes |
Table 9.
Recommendations to improve both transport systems.
| Policy Domain | Curitiba - Priority Actions | Lisbon - Priority Actions |
|---|---|---|
| Modal Structure | Prioritize diversification via rail-based systems (metro/LRT) on high-demand corridors. | Maintain and expand multimodal network, particularly metro, LRT, and suburban rail. |
| Governance | Establish a metropolitan transport authority with planning and investment powers. | Strengthen coordination between surface transport and centrally managed rail systems. |
| Financing & Subsidies | Substantially increase public subsidies to reduce fare burden and improve quality. | Ensure long-term sustainability of the Navegante policy through stable funding. |
| Fare Policy | Implement progressive fares, low-income discounts, and metropolitan integration. | Preserve affordability while monitoring fiscal sustainability and new revenue sources. |
| Modernization | Renovate deteriorating stations/corridors and address maintenance backlogs. | Continue infrastructure modernization and capacity expansion. |
| Digitalization | Deploy real-time info, journey planning apps, and open data platforms. | Further develop digital services and integrated information systems. |
| Accessibility | Improve accessibility across legacy stations, vehicles, and terminals. | Eliminate remaining barriers in older stations and heritage vehicles. |
| Capacity | Address structural constraints through significant rail investment. | Invest in capacity expansion to reduce peak-hour crowding. |
| Participation | Strengthen meaningful public participation in planning and decision-making. | Actively share best practices and policy lessons with other global cities. |
Disclaimer/Publisher’s Note: The statements, opinions and data contained in all publications are solely those of the individual author(s) and contributor(s) and not of MDPI and/or the editor(s). MDPI and/or the editor(s) disclaim responsibility for any injury to people or property resulting from any ideas, methods, instructions or products referred to in the content. |
© 2026 by the authors. Licensee MDPI, Basel, Switzerland. This article is an open access article distributed under the terms and conditions of the Creative Commons Attribution (CC BY) license (http://creativecommons.org/licenses/by/4.0/).
Copyright: This open access article is published under a Creative Commons CC BY 4.0 license, which permit the free download, distribution, and reuse, provided that the author and preprint are cited in any reuse.