

Submitted:
30 March 2026
Posted:
31 March 2026
You are already at the latest version
Abstract
E-cargo bikes are niche mode amongst domestic users, with strong potential to reduce car dependence, particularly in suburban areas where usage is growing. However, there is a lack of research on both domestic e-cargo bike use and suburban use. Policy makers lack basic metrics for average speed, trip distance, as well as more detailed analysis of routes taken and the types of roads / paths used. Using GPS data from trackers on 12 household e-cargo bikes (7150km travelled, 1750 trips in Leeds, Brighton, Oxford), we, calculate key metrics and information about the types of routes used. Average speeds per trip are 11.8km/ hr, mean trip length 4.6km. Speeds vary with route type. Domestic e-cargo bikes are largely unhindered by hills. Major roads are used where cycle infrastructure is lacking (Leeds 48% of km travelled). Cycle infrastructure is used where present and suitable quality (Oxford 37% of km travelled).
Keywords:
e-cargo bike
; E-bike
; GPS
; trip length
; route choice
; elevation
1. Introduction
This paper focuses on domestic Electric Cargo bikes (ECBs) sometimes referred to as family e-cargo bikes,are designed to have a total ladened weight of around 200kg and have electrical assist Which meets UK EAPC regulations ( https://www.gov.uk/government/publications/electrically-assisted-pedal-cycles-eapcs/electrically-assisted-pedal-cycles-eapcs-in-great-britain-information-sheet ). They are capable of carrying children, other passengers and / or shopping and other items. Their design is oriented towards use by families. The two most common model types are “long-tail” – typically with small wheels (20-24 inch) for a low centre of gravity a longer wheelbase than a standard bike and a long heavy duty rear pannier / seating rack. Examples of this type of bike are the Tern GSD and the Riese and Muller Multitinker. The other common model type is the “long-john” typically with a 26 inch rear wheel and a 20 inch front wheel and featuring a large cargo area in-front of the rider (example models include the Raleigh Stride 2 and the Gazelle Maki Load). There are also trike and adapted cycle formats produced but these are less common. ECBs for domestic use are very niche in the UK but are growing in popularity the total e-cargo bikes sold in 2022 was approximately 4000 (Garidis, 2023). This trend follows and lags behind some EU countries where popularity has grown quickly e.g., sales in France in 2022 were approximately 90000 (Garidis, 2023).
E-cargo bikes are a novel niche mode which show great potential in urban freight and logistics (Cyclelogistics Ahead project 2017). However, they also show promise for suburban domestic use as they show potential to address “car dependent practices” (Mattioli et al. 2016)– particularly trips that involve carrying passengers (e.g., small children) and items such as shopping which few people are willing to carry on foot or by bicycle (Cass et al., 2025; Philips et al., 2024). Reducing car dependent practices using e-cargo bikes may have physical activity benefits. There are also potential CO2 reduction benefits. The need to reduce transport emissions as part of measures to minimise impacts of climate change is well established (Climate Change Committee, 2023). Car use reduction through direct substitution contributes to carbon reduction though this can be modest where trips distances are short, but e-bikes and e-cargo bikes have potential to make longer journeys giving additional benefits. Further benefits may also accrue if e-cargo bike use leads to lifestyle changes that further reduce car use and /or car ownership (Brand et al. 2021).
Prior to 2022 there were few studies focussing on domestic ECB usage (Narayanan and Antoniou, 2022), most research attention on ECBs had focussed on logistics applications where there is considerable potential. Research into different facets of domestic e-cargo bike use have been published in recent years focussed on European countries particularly in Switzerland (Marincek et al., 2024) and In Ireland (Egan et al., 2025). Until recently there have also been few studies of domestic ECB in suburban and peri-urban areas and little based in the UK (Philips et al., 2025). E-bikes and other e-micromobility studies also focus more on urban cores than suburban areas, but e-bikes in suburbs and peri-urban areas have high potential to contribute to transport decarbonisation and provide other co-benefits (Philips et al., 2022).
Understanding where ECB go in terms of usage of different route types (e.g., segregated infrastructure, minor roads, major roads) and avoidance or not of hills, can provide insights to planners and researchers in terms of the useability of this newly emerging mode.
There has been some useful qualitative research in this area: Egan et al., (2026) examines infrastructure use and find that this is sometimes avoided because some e-cargo bikes do not fit through barriers designed to keep motorbikes out, but also that the larger size of e-cargo bikes and the electric assist makes it easier and empowers riders to use the bikes on busier roads. The authors also found that using the bikes whilst carrying children makes them feel like they are seen and treated favourably by motorists. The importance of e-bikes in terms of allowing cyclists to overcome hills is discussed in (Behrendt et al., 2021).
There have been studies producing quantitative metrics for e-bikes (e.g., Mohamed and Bigazzi, 2019). There is very little research on the type of road and route infrastructure used by of household e-cargo bikes. The study by (Singh et al., 2025) in Ireland includes tracking some household e-cargo bikes in their sample and this is the only study we are aware of at the time of writing.
There are a wide range of methods to analyse GPS trace data. A considerable amount of research has been carried out using Origin-Destination data of shared bikes, shared e-bikes (Ross-Perez et al., 2022), There have been studies using sources such as Strava Metro Data (Liang et al., 2025). These studies tend to only have access to the spatial data and tend not to have access to richer data about the user such as socio-demographics and other information such as home location when bikes were transported in a vehicle – which can require complex pre-processing. There have also been studies of personal e-bikes where there is some contextual information about participants (Maurer et al., 2025). There can be a range of errors within the data which require cleaning and pre-processing (Lißner and Huber, 2021).
Our research questions are:
What are the mean trip distances and their distribution?
Do e-cargo bikes avoid hills?
How does the average speed vary on different route types?
What proportion of distance travelled occurs on different route types?
2. Materials and Methods
We first give an overview of data collected and used, then explain the methods used to process the data.
In 2023, between May and October, 45 GPS tracked domestic ECBs were loaned to households in the suburbs of three UK provincial cities as part of a research project (Philips et al., 2025, 2024). Participants were loaned a household e-cargo bike for approximately one month. The GPS data collection and analysis presented in this paper is one strand of this research. This section describes the data processing.
We used Pow Unity GPS trackers fitted to 12 ECBs with Bosch motors https://powunity.com/en . The Pow Unity trackers did not require any user input – this was noted as an advantage in data gathering by Cairns et al., (2017). The GPS unit collects data every 10 seconds when the bike is in use (though sometimes signal is lost), transmitting data to a server using a 2G phone signal. Account holders access the data through an API. The API endpoints are as follows: ROUTES – a point file containing every recorded location. TRIPS an API endpoint which uses code on the Pow Unity server side (not available to the researchers) which estimates the start and end points of trips made. However, exploratory analysis and visualisation showed that this was not accurate enough to use in the main analysis. A STOPS API endpoint estimates places where the bike stopped, again the code / algorithm was not available to researchers. The STOPS api sometimes captured very short stops which may include waiting in traffic. TRIPS and STOPS files were derived from ROUTES point data. The TRIPS and STOPS files were not completely consistent with the ROUTES file. Because of this we did not use the provided STOPS and TRIPS data. We cleaned the ROUTES data and then estimated stop locations and trips (explained below).
In this analysis, which is a study forming part of a larger research project, we have contextual data from participants, such as home address, common trips made, dates on which bikes were taken places in a car or on a train. This means that complex algorithms that can differentiate whether the bike is being ridden or transported in a vehicle do not need to be developed or applied. Participants also provided socio-demographic variables and information about their cycling confidence as part of pre-trial surveys. Ethical approval was gained before data collection.
For the analysis we also made use of secondary data. Open Streetmap Data (Open Streetmap, 2025a) was used to describe the types of routes used by participants.
OpenStreetMap is a long-standing open geographical data initiative that has been used extensively by academics in diverse fields(Jokar Arsanjani et al., 2015). This includes examining cycling route choice (Yeboah and Alvanides, 2015) and cycling infrastructure (e.g., Tait et al., 2024). It has also been used by governments in developing accessibility and connectivity indicators (DfT, 2025). Ordnance Survey, Terrain 5 ASCii format Digital Elevation Model data accessed from Edina-digimap (Ordnance Survey, 2026) was used to derive elevations for the Pow Unity ROUTES points as this has a finer spatial resolution and vertical accuracy than the open SRTM elevation data (Earth Resources Observation and Science (EROS) Center, 2000).
We next describe the data processing. Initial analysis showed that though the data was very effective at enabling the location of the bike for security purposes 1, to carry out transport analysis further cleaning by the researchers was required. The format of the ROUTES data obtained from the API is shown in Table 1.
Initially route points were visualised for a single day for a single participant to gain an appreciation of the types of error in the data. From visual inspection the following types of error could be seen. Points where the E-cargo bike was in a vehicle: these points were removed using information from the participants. There were duplicate points where there was a duplicate timestamp. These first two types of error points were easily removed. Further errors required more processing. Points appearing in the wrong location when the device is first switched on a particular day. This is known as Time to first fix errors (TTFF) (Hernando-Ramiro et al., 2025). These errors occur when the GPS unit in the bike is first switched on. The GPS takes a period between a few seconds and a few minutes to accurately ascertain its position. During this time the GPS may record several points at inaccurate locations. Points may be recorded in the wrong location whilst the e-cargo bike is making a trip. These Erroneous points may occur because GPS location data can lose accuracy when the device only has line of sight to a small number of satellites in the same portion of the sky – for example where buildings obscure the line of sight. This is called Dilution of Precision (DOP) (Langley, 1999). Errors may occur because signals bounce off buildings, variations in the ionosphere and variation in the orbit of satellites (Karaim et al., 2018). TTFF and erroneous points made during trips were both identified where the effective speed between a point and it’s preceding or following point was implausibly high. Some further points were removed where a bike did not make any trips on a particular day. Sometimes a bike recorded a point on a particular day but did not move. The main steps in the cleaning process are given in Figure 1. Note that a copy of code is available from the authors on request.
Following cleaning, points were allocated to trips. A set of conditions were used: If the point is the first point on a particular day by a participant, then it is the start of a trip (pre-inspection of the data found there was little late-night usage and no trips that were occurring at midnight). If there is a gap of more than 6 minutes between two consecutive points then this is a candidate for a break in trips. The pseudocode in Figure 2 outlines the process.
Minimum trip length was assumed to be 300m. We decided that 300m is a suitable threshold for a short trip based on our observations. Based on participant interviews and research team usage of the bikes, we think that because there is some effort and time needed to begin a journey such as getting a bike out of the shed / garage etc then we would expect almost no trips under 300m and very few trips under 500m.
We use the process described in Figure 3, to estimate the type of road or cycleway e-cargo bike used. OSM uses the generic attribute or tag “highway” to denote roads, routes, cycle infrastructure, paths and other ways that connect locations and allow travel by motorised vehicles, cyclists, pedestrians and others (Open Streetmap, 2025b). Highway data are labelled to reflect their type such as primary and secondary roads, cycleway and footway. We spatially join the labelled highway data to our trip data to understand the types of infrastructure our participants use. To allow for road lane width and spatial inaccuracies we apply a 10m buffer either side of our trip line. This is consistent with the 10m buffer used in several other studies (Tait et al., 2024). As shown in the pseudocode, there are cases where a segment of an e-cargo bike route may link to both a road and a segregated cycleway. This is because the spatial and temporal resolution of the GPS tracker being used does not allow the infrastructure type to always be measured with absolute precision. However, we make the simplifying assumption that where there is segregated infrastructure next to a road then the rider is likely to use it. However we appreciate that this is not necessarily always the case. Egan et al., (2025) note issues with cycle infrastructure that make it difficult for e-cargo bike riders to use.
3. Results
Table 2 shows the proportion of points removed by each cleaning step.
Overall median trip distance is 3.3km and the mean was 4.6km. The longest trip was 38.7km. Figure 4 shows the distribution of trip lengths for each study city.
The mean trip speed including stops at traffic lights etc was 11.8km/ hr. There is a moderately strong positive correlation between distance and trip speed (r = 0.6 Pearson). We matched our CLEANED_ROUTES points to Open Streetmap data. Mean moving speeds for each route type categories are given in Table 3.
On busy roads speeds are higher than on minor roads. The mean speeds on OSM cycleway are higher than in pedestrian areas and on footways. or on paths and tracks. OSM defines pedestrian as “For roads used mainly/exclusively for pedestrians in shopping and some residential areas which may allow access by motorised vehicles only for very limited periods of the day.”(Open Streetmap, 2025b). Footways may or may not be surfaced and may run through parks and other open spaces. OSM links which are tagged as cycleway are fully segregated infrastructure. Tracks and paths are less likely to be surfaced. Reference images of pedestrian, footway and cycleway are shown in Figure 5.
Table 4 shows key metrics for height gain. Brighton participants took the most hilly routes, followed by Leeds then Oxford. There are some Leeds and Brighton participants who make very little ascent per trip (mostly people who use the bike very little). Oxford has no trips where the total ascent is over 200m, whereas Leeds and Brighton have a number of such trips and there are even some outliers with over 600m of ascent in one trip.
The usage of different route types was analysed. Table 5 shows the total kms travelled on each route type in each city, and Figure 6 shows the relative proportions. Leeds has a much higher proportion of A road usage than the other two cities. Across all participants 44% of travel in Leeds is on A roads, compared to only 6% in Oxford and 13% in Brighton. The most direct routes from our study sites to central Leeds and through these areas use major arterials (the A65 and the A660) neither of which have continuous segregated cycleway or painted cycle lane markings.
In Leeds only 10% of kms travelled were on cycleways. It was much higher in the other two cities. 22% in Brighton and 37% in Oxford. Kennington, the Oxford study area is well connected to a more coherent network of cycle infrastructure then the other two cities. The people for bikes city ratings gives Leeds a score of 50 but Oxford 78 https://cityratings.peopleforbikes.org/ratings . Brighton is not included in the data.
In Leeds and Oxford, a negligible amount of travel occurred on tracks and paths. It was somewhat higher in Brighton. Parks and green spaces in the city appear to provide elements of connectivity segregated from motor traffic. Also, as much of the usage of the bikes was in inner suburbs, the dense network of minor roads and residential streets was used far more than major roads.
We examined the relationship between participant characteristics and usage of cycleways and A Roads. There is no statistically significant difference in A road use or cycle way use based on gender or having children under 11, for either all participants or just the participants in each city. Participants were asked, in a pre-trial survey about cycle confidence in a 5 point scale (not confident at all – very confident). There was a significant difference (p =0.05) between not confident at all and very confident using a Kruskal test with a Dunn post hoc test. There was also a significant difference between fairly confident and very confident. There were only 2 participants who said they were not at all confident. There was one participant who said they were “not very confident” – however they did not use A roads at all. When we collapse to 2 categories ‘not confident’ and ‘confident’ there is not a statistically significant difference at the 0.05 level possibly due to the small sample.
4. Discussion and Conclusion
The mean trip length is highest in Leeds and lowest in Brighton - an increase with distance of the study area from the city centre. Longer trips tend to have greater height gain as would be expected. The data shows considerable height gain by e-cargo bikes, which themselves weigh between 35 and 60kg and are frequently carrying children or luggage, suggests that household e-cargo bikes are unhindered by hills. This aligns with previous work that highlights the benefits of e-bike for overcoming hilliness (Behrendt et al., 2021). Brighton is a hilly coastal city and shows the steepest average gradient and the greatest total ascent. Leeds is also hilly, but the higher proportion of A road use may have reduced the average gradient as major roads are typically designed to have shallower gradients than minor roads.
Also expected is the positive correlation between overall trip speed and distance. The variation in moving speed can be partly explained by the route types. The highest speeds being on the more major roads is explained by participants wanting to take quick direct routes. Also participants may ride quickly to reduce speed difference with motor traffic. (Landis et al., 1997). The low speeds on tracks and paths may also be explained by the fact that these may not be be surfaced in some cases so are less amenable to going fast as discussed by Egan et al., (2025). On segregated cycleway infrastructure average moving speeds are higher than minor roads. This may be partly explained by the need to stop frequently at junctions on minor roads such as residential streets whereas fully segregated cycle routes may be more continuous.
Infrastructure use is high where it is present (Oxford and to a lesser extent Brighton). However, where cycle infrastructure is lacking (Leeds) major “A” roads are used extensively. Most of the participants were fairly confident / very confident cyclists. It suggests that there is some preference for cycle infrastructure where it is of good enough quality for e-cargo bike use – where it is wide enough, there are no barriers or steps preventing access, where surfacing is good quality and where there are not excessively tight turns. In Oxford there is high quality convenient and relatively direct access to the city centre from the study area following a cycleway. In Leeds a high proportion of kms travelled are on major roads, and very little use is made of cycle infrastructure. This may be a result of cycle infrastructure not being well suited to e-cargo bikes - barriers at the entrance to cycle routes can bar access, tight radius turns may not suit e-cargo bikes (which are longer heavier and sometimes wider than ordinary cycles) and narrow routes may not be suitable. For some users, simply using the roads may be more direct and convenient. The larger size and visibility of an e-cargo bike may make it easier to adopt the primary road position improving perceived and objective safety. The novelty of domestic e-cargo bikes may also reduce the chance of conflict and negative behaviours from drivers as is sometimes the case with for example recreational road cyclists. These points are made in recent work by (Egan et al., 2026, 2025), and is observed in qualitative comments reported by trial participants in this study (Cass, 2024).
The data suggests non-confident cyclists are less likely to use busy roads. However, the small number of non-confident participants means that only very tentative inference can be drawn. It is well established in cycling research in general that having to cycle on busy roads inhibits cycle uptake, though some research finds that motor assist and being able to keep up with traffic may help some partially overcome the barrier of riding on the road (Melia and Bartle, 2021). Infrastructure need should be addressed if e-cargo bikes are to move beyond niche adoption to a wider range of potential users. Provision of cycle infrastructure would need to be of high quality and designed to accommodate household e-cargo bikes. The UK design standards LTN120 aim to do this (DfT, 2020). Car restraint policies such speed restrictions are less politically palatable but are associated with safety gains.(Aldred et al., 2018; Ekmekci et al., 2024). Future scenarios of much lower demand for car travel are also considered radical but could also address issues of traffic on roads (Brand et al., 2025; Tight et al., 2011). As literature referenced above states – there are some advantages to riding on roads so if the level of car traffic and the threat that is poses can be reduced it could be advantageous to e-cargo bike use.
There are a number of opportunities for further work: Some assumptions which may be dealt with better in further work are as follows: We made the assumption that the minimum length of time between the end of one trip and the start of another would be 6 minutes as we think activities would take longer than this. To shorten this threshold risks deeming stops in traffic as the end of a trip. However, the 6 minute threshold may have made some school drop-offs and pick-ups appear to be a single trip when they were actually two. Future work may benefit from using more precise GPS units with finer spatial and temporal resolution, but these would need to be units that do not require participants to manually start and stop trip recording. As uptake increases and the variety of users increases then further studies would also beneficial to understand trip length distribution, and route use characteristics of these new users.
This work provides a range of key metrics about the usage of a novel mode of transport, the domestic electric cargo bike, which will help practitioners to understand the potential of e-cargo bikes, and their needs.
Funding
his project is funded by the Engineering and Physical Sciences Research Council/UKRI, grant reference: UKRI EP/S030700/1.
Data availability statement
The raw participant cannot be made available for privacy reasons. The study has ethical approval from the Business, Environment, Social Sciences Faculty Research Ethics Committee (FREC) of the University of Leeds, UK. Reference FREC 2023–0477–1198. Code used in the analysis is available on request from the Authors. .
Acknowledgments
Grateful thanks to all members of the project team, to participants at the 2025 UTSG conference in Dublin who gave feedback on an early version of this work.
Disclosure statement
We believe that we do not have any competing interests.
| 1 | One of the project e-cargo bikes was stolen from Brighton. It was taken by train to London. It was recovered several days later by tracking its movements. When it was taken to a bike shop, researchers informed the shop it was stolen and contacted the police, the bike was then recovered. |
References
- Brand, C; Dons, E; Anaya-Boig, E; Avila-Palencia, I; Clark, A; de Nazelle, A; Gascon, M; Gaupp-Berghausen, M; Gerike, R; Götschi, T; Iacorossi, F; Kahlmeier, S; Laeremans, M; Nieuwenhuijsen, MJ; Orjuela, JB; Racioppi, F; Raser, E; Rojas-Rueda, D; Standaert, A; Stigell, E; Sulikova, S; Wegener, S; Int Panis, L. The climate change mitigation effects of daily active travel in cities. Transportation Research Part D: Transport and Environment (93) 2021. [Google Scholar] [CrossRef]
- Climate Change Committee. Progress in reducing UK emissions 2023 Report to Parliament Climate Change Committee; London, 2023; ISBN 978-1-5286-4092-3. [Google Scholar]
- Cyclelogistics Ahead project (undated, c2017) CycleLogistics – Moving Europe Forward. Final EU project report.
- Aldred, R.; Goodman, A.; Gulliver, J.; Woodcock, J. Cycling injury risk in London: A case-control study exploring the impact of cycle volumes, motor vehicle volumes, and road characteristics including speed limits. Accident Analysis & Prevention 2018, 117, 75–84. [Google Scholar] [CrossRef]
- Behrendt, F.; Cairns, S.; Raffo, D.; Philips, I. Impact of E-Bikes on Cycling in Hilly Areas: Participants’ Experience of Electrically-Assisted Cycling in a UK Study. Sustainability 2021, 13, 8946. [Google Scholar] [CrossRef]
- Brand, C.; Marsden, G.; Anable, J.L.; Dixon, J.; Barrett, J. Achieving deep transport energy demand reductions in the United Kingdom. Renewable and Sustainable Energy Reviews 2025, 207, 114941. [Google Scholar] [CrossRef]
- Cairns, S.; Behrendt, F.; Raffo, D.; Beaumont, C.; Kiefer, C. Electrically-assisted bikes: Potential impacts on travel behaviour. Transportation Research Part A: Policy and Practice 2017, 103, 327–342. [Google Scholar] [CrossRef]
- Cass, N. E-cargo bikes: how does a bike-car hybrid negotiate velomobility and automobility geographies and infrastructures in the UK? 2024. [Google Scholar]
- Cass, N.; Philips, I.; Azzouz, L.; Marks, N. How do electric cargo bikes fit with real life? A social practice analysis in the United Kingdom. Energy Research & Social Science 2025, 130, 104439. [Google Scholar] [CrossRef]
- Climate Change Committee. 2023 Progress Report to Parliament; London, 2023. [Google Scholar]
- DfT. Transport connectivity metric [WWW Document]. GOV.UK. 2025. Available online: https://www.gov.uk/government/publications/transport-connectivity-metric/transport-connectivity-metric (accessed on 1.30.26).
- DfT Cycle infrastructure design (LTN 1/20). 2020.
- Shuttle Radar Topography Mission (SRTM) 1 Arc-Second Global; Earth Resources Observation and Science (EROS) Center, 2000. [CrossRef]
- Egan, R.; Julienne, H.; Caulfield, B. A cyclist, a family or a vehicle? Claiming the road with the e-cargo bike. Applied Mobilities 2026, 0, 1–21. [Google Scholar] [CrossRef]
- Egan, R.; Julienne, H.; Philbin, M.; Caulfield, B. Situating the E-Cargo Bike in an Emerging Cycling Network: A Qualitative Study. Active Travel Studies 2025, 5. [Google Scholar] [CrossRef]
- Ekmekci, M.; Dadashzadeh, N.; Woods, L. Assessing the impact of low-speed limit zones’ policy implications on cyclist safety: Evidence from the UK. Transport Policy 2024, 152, 29–39. [Google Scholar] [CrossRef]
- Garidis, S. Bicycle Association UK ebike market results. 2023. [Google Scholar]
- Hernando-Ramiro, C.; Gamallo-Palomares, Ó.; Junquera-Sánchez, J.; Gómez-Sánchez, J.A. Time to First Fix Robustness of Global Navigation Satellite Systems: Comparison Study. Sensors (Basel) 2025, 25, 1599. [Google Scholar] [CrossRef]
- OpenStreetMap in GIScience: Experiences, Research, and Applications. In Lecture Notes in Geoinformation and Cartography; Arsanjani, Jokar, Zipf, J., Mooney, A., Helbich, P.M., Eds.; Springer International Publishing: Cham, 2015. [Google Scholar] [CrossRef]
- Karaim, M.; Elsheikh, M.; Noureldin, A.; Karaim, M.; Elsheikh, M.; Noureldin, A. GNSS Error Sources, in: Multifunctional Operation and Application of GPS; IntechOpen, 2018. [Google Scholar] [CrossRef]
- Landis, B.; Vattikuti, V.; Brannick, M. Real-Time Human Perceptions: Toward a Bicycle Level of Service. Transportation Research Record: Journal of the Transportation Research Board 1997, 1578, 119–126. [Google Scholar] [CrossRef]
- Langley, R. Dilution of Precision. 1999. [Google Scholar]
- Liang, Y.; Rolando, A.; van der Spek, S. Transport infrastructure renewal and active mobility: a longitudinal analysis of pedestrian and cyclist behavior across demographic and temporal dimensions. Transportation Planning and Technology 2025, 0, 1–39. [Google Scholar] [CrossRef]
- Lißner, S.; Huber, S. Facing the needs for clean bicycle data – a bicycle-specific approach of GPS data processing. Eur. Transp. Res. Rev. 2021, 13, 8. [Google Scholar] [CrossRef]
- Marincek, D.; Rérat, P.; Lurkin, V. Cargo bikes and their modal shift effects: from substitution to car renunciation. Transportation 2024. [Google Scholar] [CrossRef]
- Maurer, L.F.; Meister, A.; Axhausen, K.W. Cycling speed profiles from GPS data: Insights for conventional and electrified bicycles in Switzerland. Journal of Cycling and Micromobility Research 2025, 5, 100077. [Google Scholar] [CrossRef]
- Melia, S.; Bartle, C. Who uses e-bikes in the UK and why? International Journal of Sustainable Transportation 2021, 0, 1–13. [Google Scholar] [CrossRef]
- Mohamed, A.; Bigazzi, A. Speed and road grade dynamics of urban trips on electric and conventional bicycles. Transportmetrica B: Transport Dynamics 2019, 7, 1467–1480. [Google Scholar] [CrossRef]
- Narayanan, S.; Antoniou, C. Electric cargo cycles - A comprehensive review. Transport Policy 2022, 116, 278–303. [Google Scholar] [CrossRef]
- Open Streetmap Open Streetmap. 2025a.
- Open Streetmap Key:highway - OpenStreetMap Wiki [WWW Document]. 2025b. Available online: https://wiki.openstreetmap.org/wiki/Key:highway (accessed on 1.29.26).
- Ordnance Survey. Terrain 5 ASCii format Digital Elevation Model. 2026. [Google Scholar]
- Philips, I.; Anable, J.; Chatterton, T. E-bikes and their capability to reduce car CO2 emissions. Transport Policy 2022, 116, 11–23. [Google Scholar] [CrossRef]
- Philips, I.; Azzouz, L.; de Séjournet, A.; Anable, J.; Behrendt, F.; Cairns, S.; Cass, N.; Darking, M.; Glachant, C.; Heinen, E.; Marks, N.; Nelson, T.; Brand, C. Domestic Use of E-Cargo Bikes and Other E-Micromobility: Protocol for a Multi-Centre, Mixed Methods Study. International Journal of Environmental Research and Public Health 2024, 21, 1690. [Google Scholar] [CrossRef]
- Philips, I.; Cairns, S.; de Séjournet, A.; Anable, J.; Azzouz, L.; Behrendt, F.; Brand, C.; Cass, N.; Darking, M.; Glachant, C.; Heinen, E.; Marks, N.; Nelson, T. E-Cargo Bikes as a Personal Transport Mode in the UK: Insights from National Surveys and Suburban Trials. 2025. [Google Scholar] [CrossRef]
- Ross-Perez, A.; Walton, N.; Pinto, N. Identifying trip purpose from a dockless bike-sharing system in Manchester. Journal of Transport Geography 2022, 99, 103293. [Google Scholar] [CrossRef]
- Singh, M.; Tafidis, P.; Pilla, F. Analysing the influence of electric bike types on route preferences in urban cycling environments: A GPS data-driven approach. Journal of Transport Geography 2025, 128, 104312. [Google Scholar] [CrossRef]
- Tait, C.; Beecham, R.; Lovelace, R.; Barber, S. Build it but will they come? Exploring the impact of introducing contraflow cycling on cycling volumes with crowd-sourced data. Journal of Transport & Health 2024, 35, 101758. [Google Scholar] [CrossRef]
- Tight, M.; Timms, P.; Banister, D.; Bowmaker, J.; Copas, J.; Day, A.; Drinkwater, D.; Givoni, M.; Gühnemann, A.; Lawler, M.; Macmillen, J.; Miles, A.; Moore, N.; Newton, R.; Ngoduy, D.; Ormerod, M.; O’Sullivan, M.; Watling, D. Visions for a walking and cycling focussed urban transport system. Journal of Transport Geography 2011, 19, 1580–1589. [Google Scholar] [CrossRef]
- Yeboah, G.; Alvanides, S. Route Choice Analysis of Urban Cycling Behaviors Using OpenStreetMap: Evidence from a British Urban Environment. In OpenStreetMap in GIScience: Experiences, Research, and Applications; Arsanjani, Jokar, Zipf, J., Mooney, A., Helbich, P.M., Eds.; Springer International Publishing: Cham, 2015; pp. 189–210. [Google Scholar] [CrossRef]
Figure 1.
pseudocode representation of the data cleaning process.

Figure 2.
pseudocode representation of the trip allocation process.

Figure 3.
pseudocode representation of the map matching process.
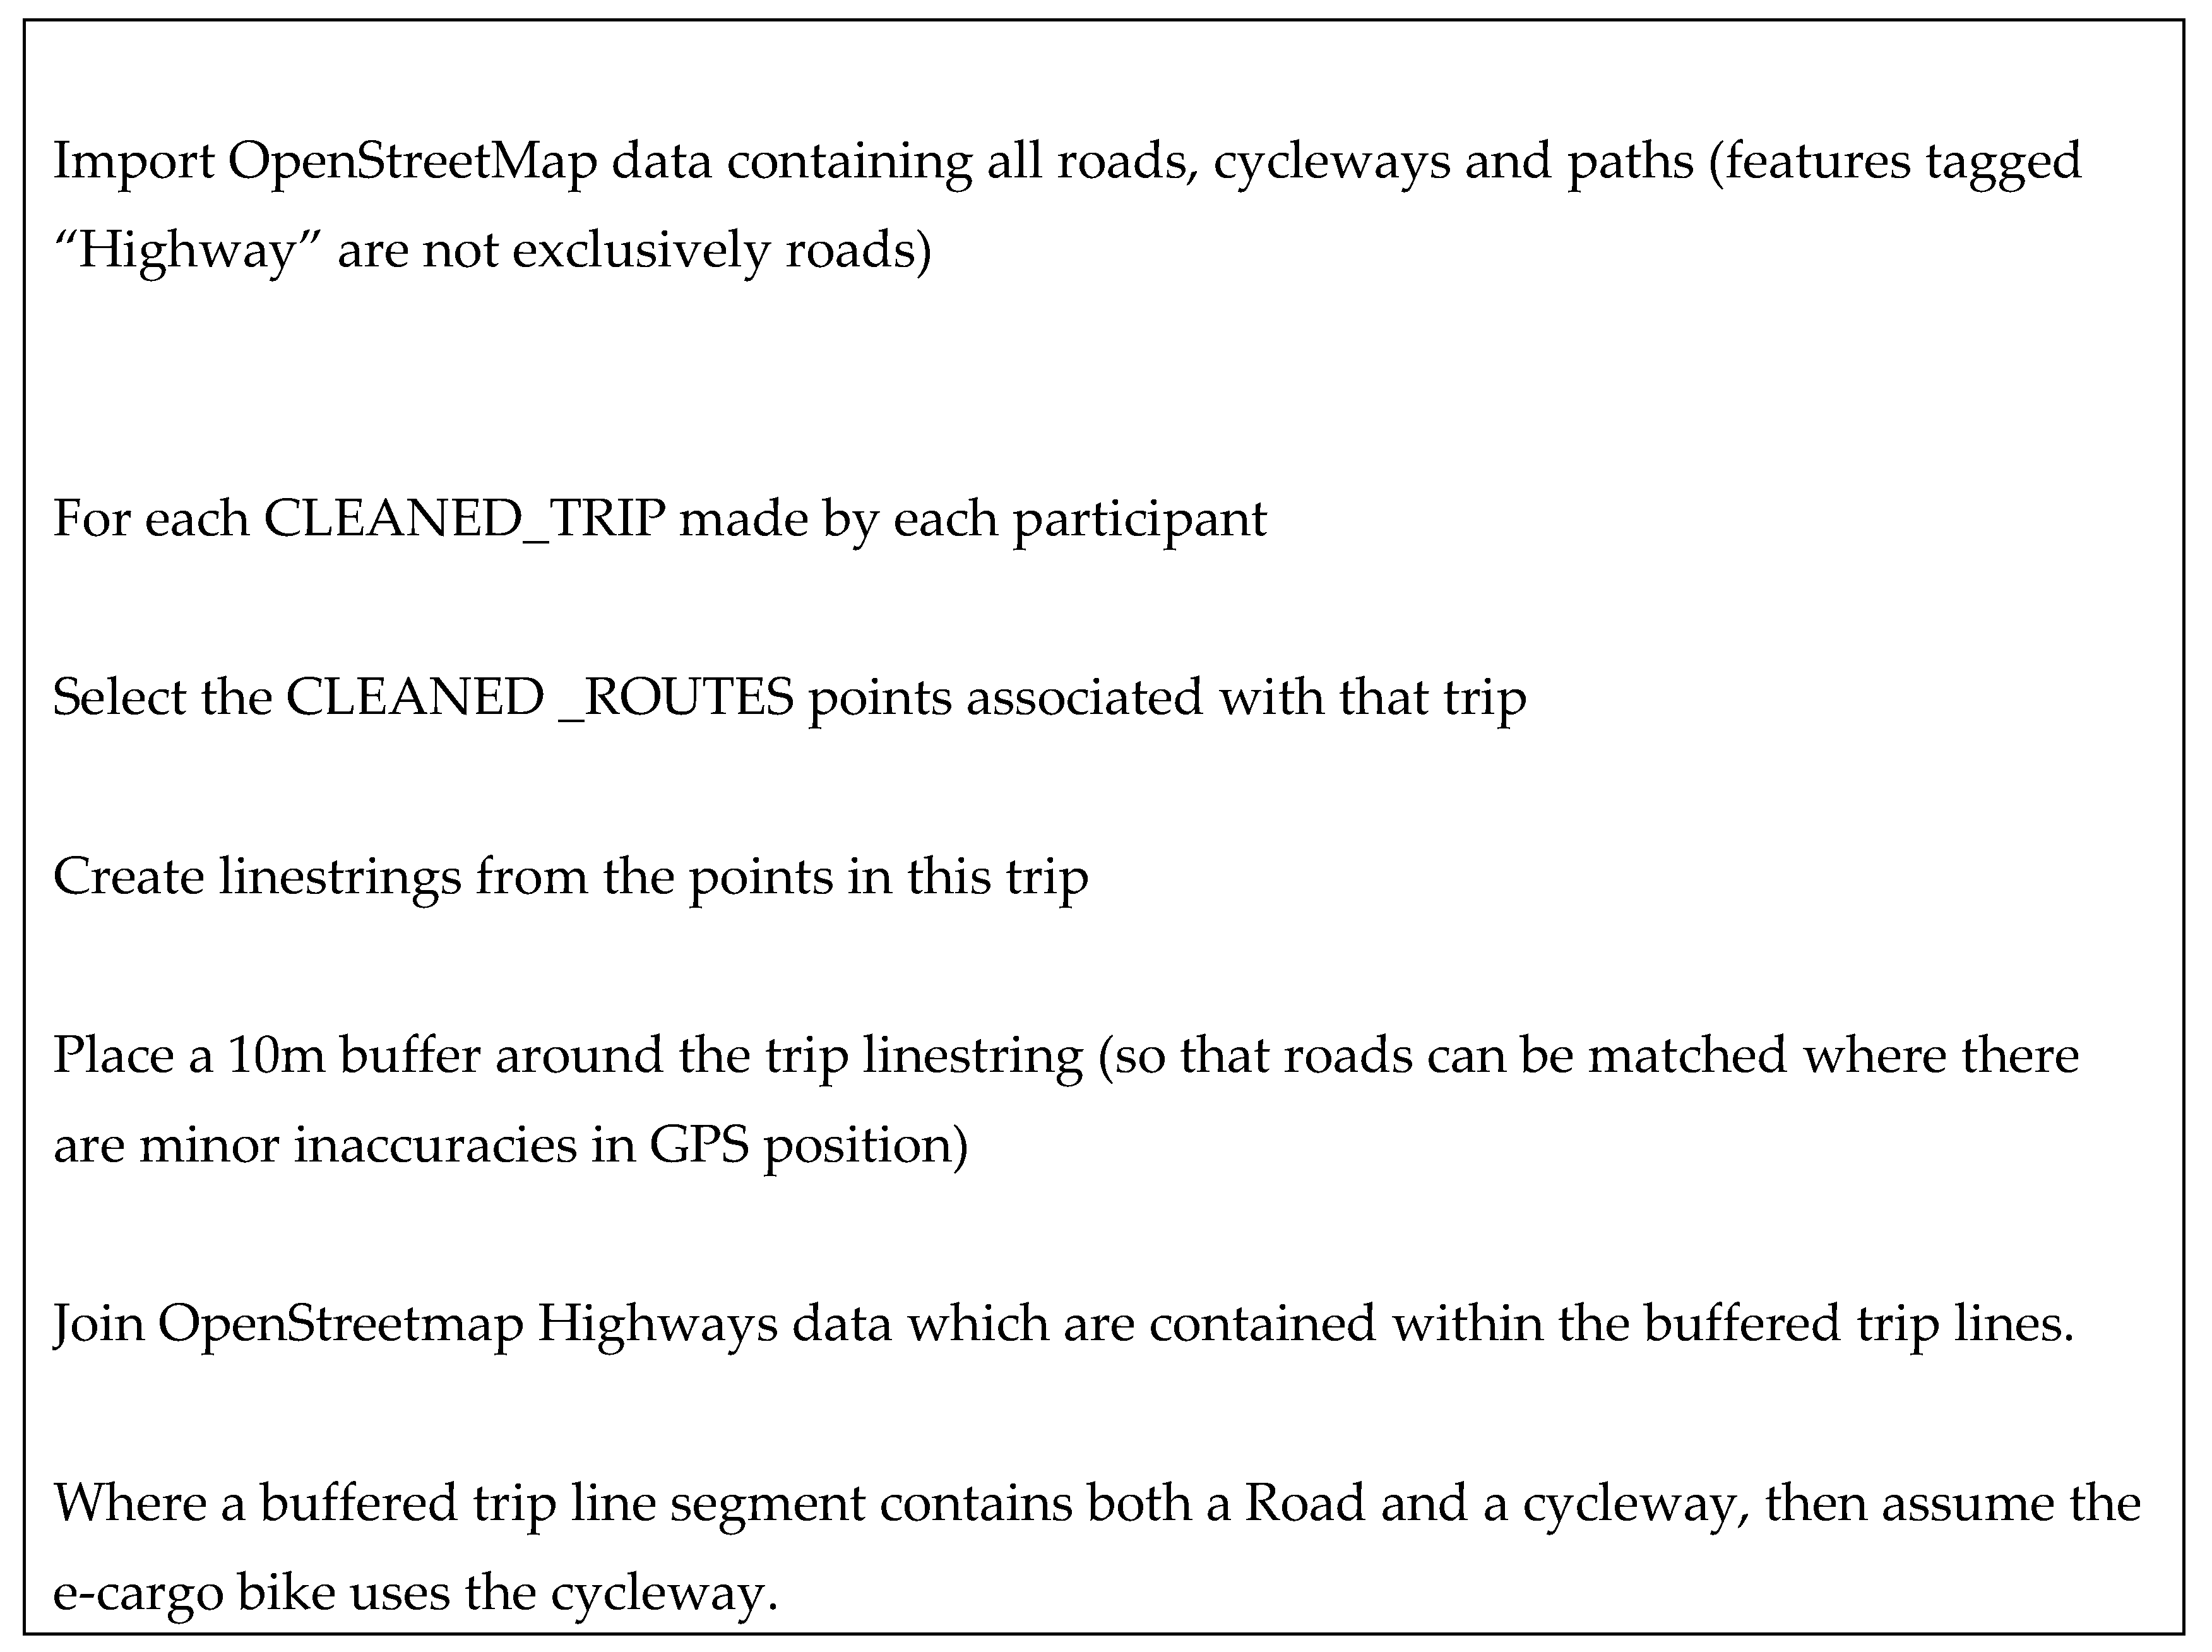
Figure 4.
Trip length distribution by study area. Brighton study participants live principally in inner suburbs, Oxford participants live in outer suburbs and Leeds participants live in satellite towns on the edge of the conurbation.
Figure 4.
Trip length distribution by study area. Brighton study participants live principally in inner suburbs, Oxford participants live in outer suburbs and Leeds participants live in satellite towns on the edge of the conurbation.
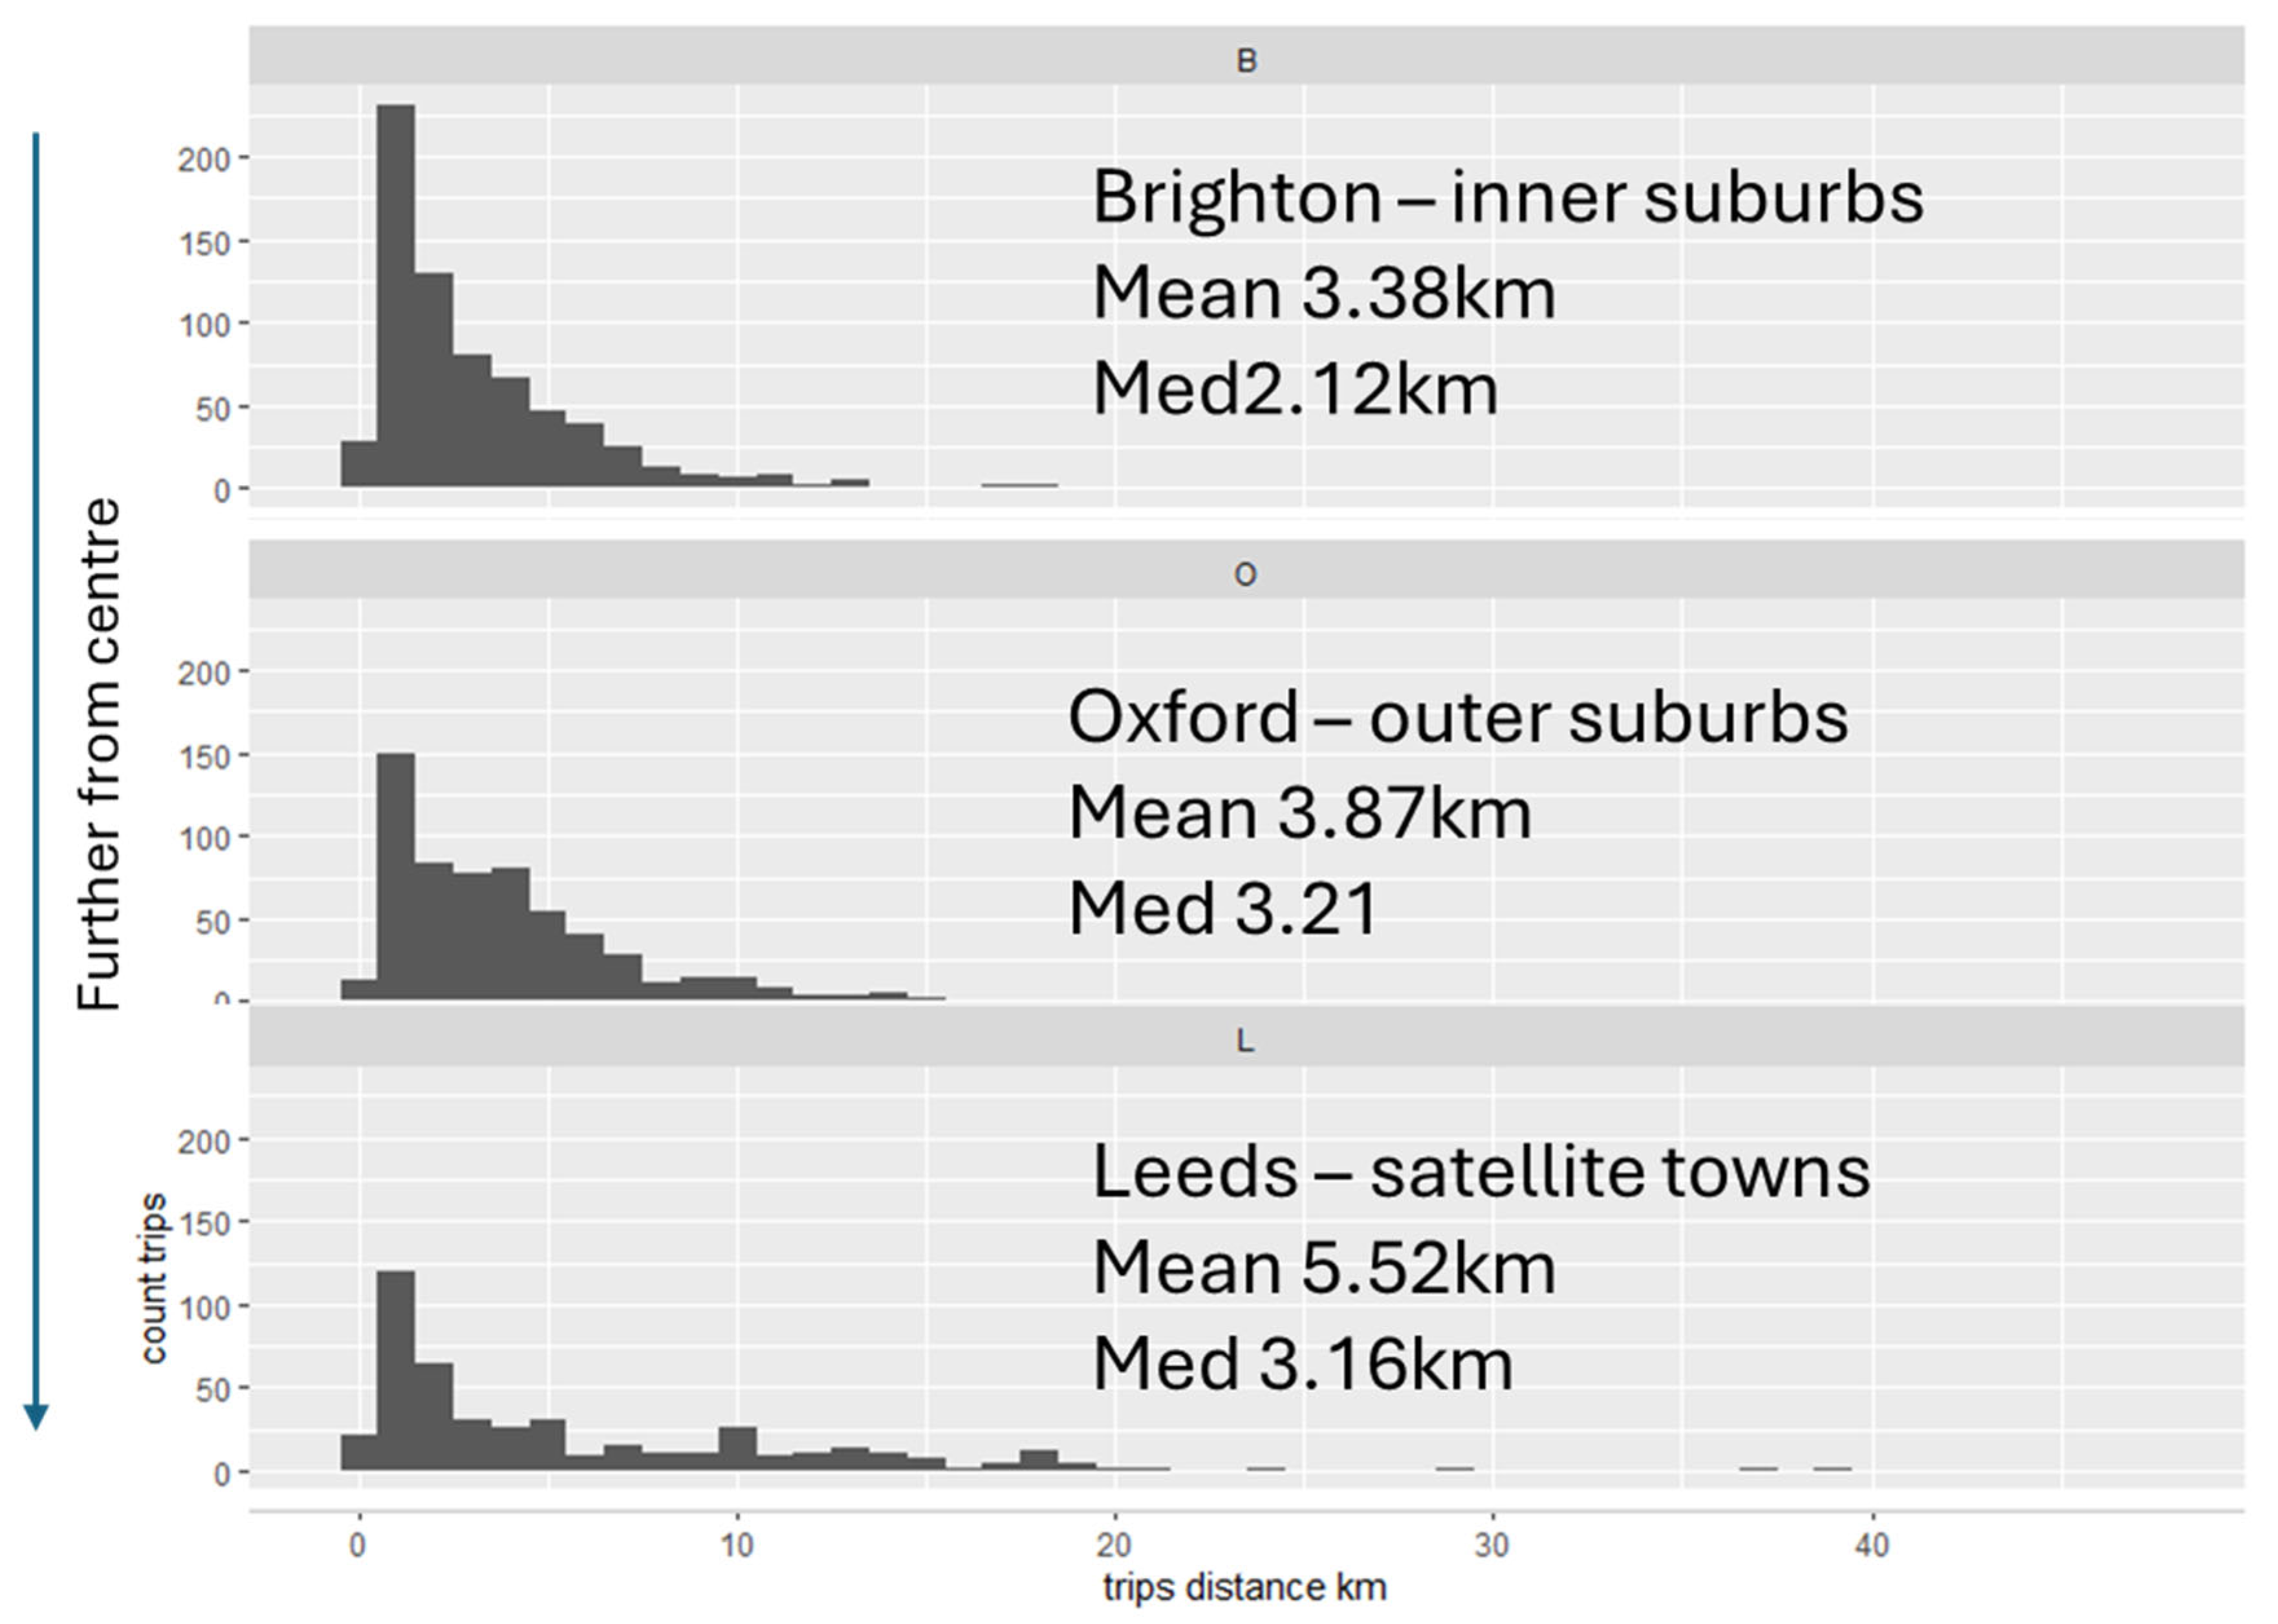
Figure 5.
above left, reference image for highway = pedestrian OSM tag. above right reference image highway = cycleway OSM tag. Lower reference image highway = footway. Sources: left; Nigel Chadwick, Wikimedia commons Nigel Chadwick, Wikimedia commons https://wiki.openstreetmap.org/wiki/File:Cambridge_Rd_-_geograph.org.uk_-_1189572.jpg , right; Source: https://wiki.openstreetmap.org/wiki/File:Rotterdam_Fietspad_Westzeedijk.jpg below: https://wiki.openstreetmap.org/wiki/File:Footway_in_Stowupland_-_geograph.org.uk_-_1044849.jpg.
Figure 5.
above left, reference image for highway = pedestrian OSM tag. above right reference image highway = cycleway OSM tag. Lower reference image highway = footway. Sources: left; Nigel Chadwick, Wikimedia commons Nigel Chadwick, Wikimedia commons https://wiki.openstreetmap.org/wiki/File:Cambridge_Rd_-_geograph.org.uk_-_1189572.jpg , right; Source: https://wiki.openstreetmap.org/wiki/File:Rotterdam_Fietspad_Westzeedijk.jpg below: https://wiki.openstreetmap.org/wiki/File:Footway_in_Stowupland_-_geograph.org.uk_-_1044849.jpg.
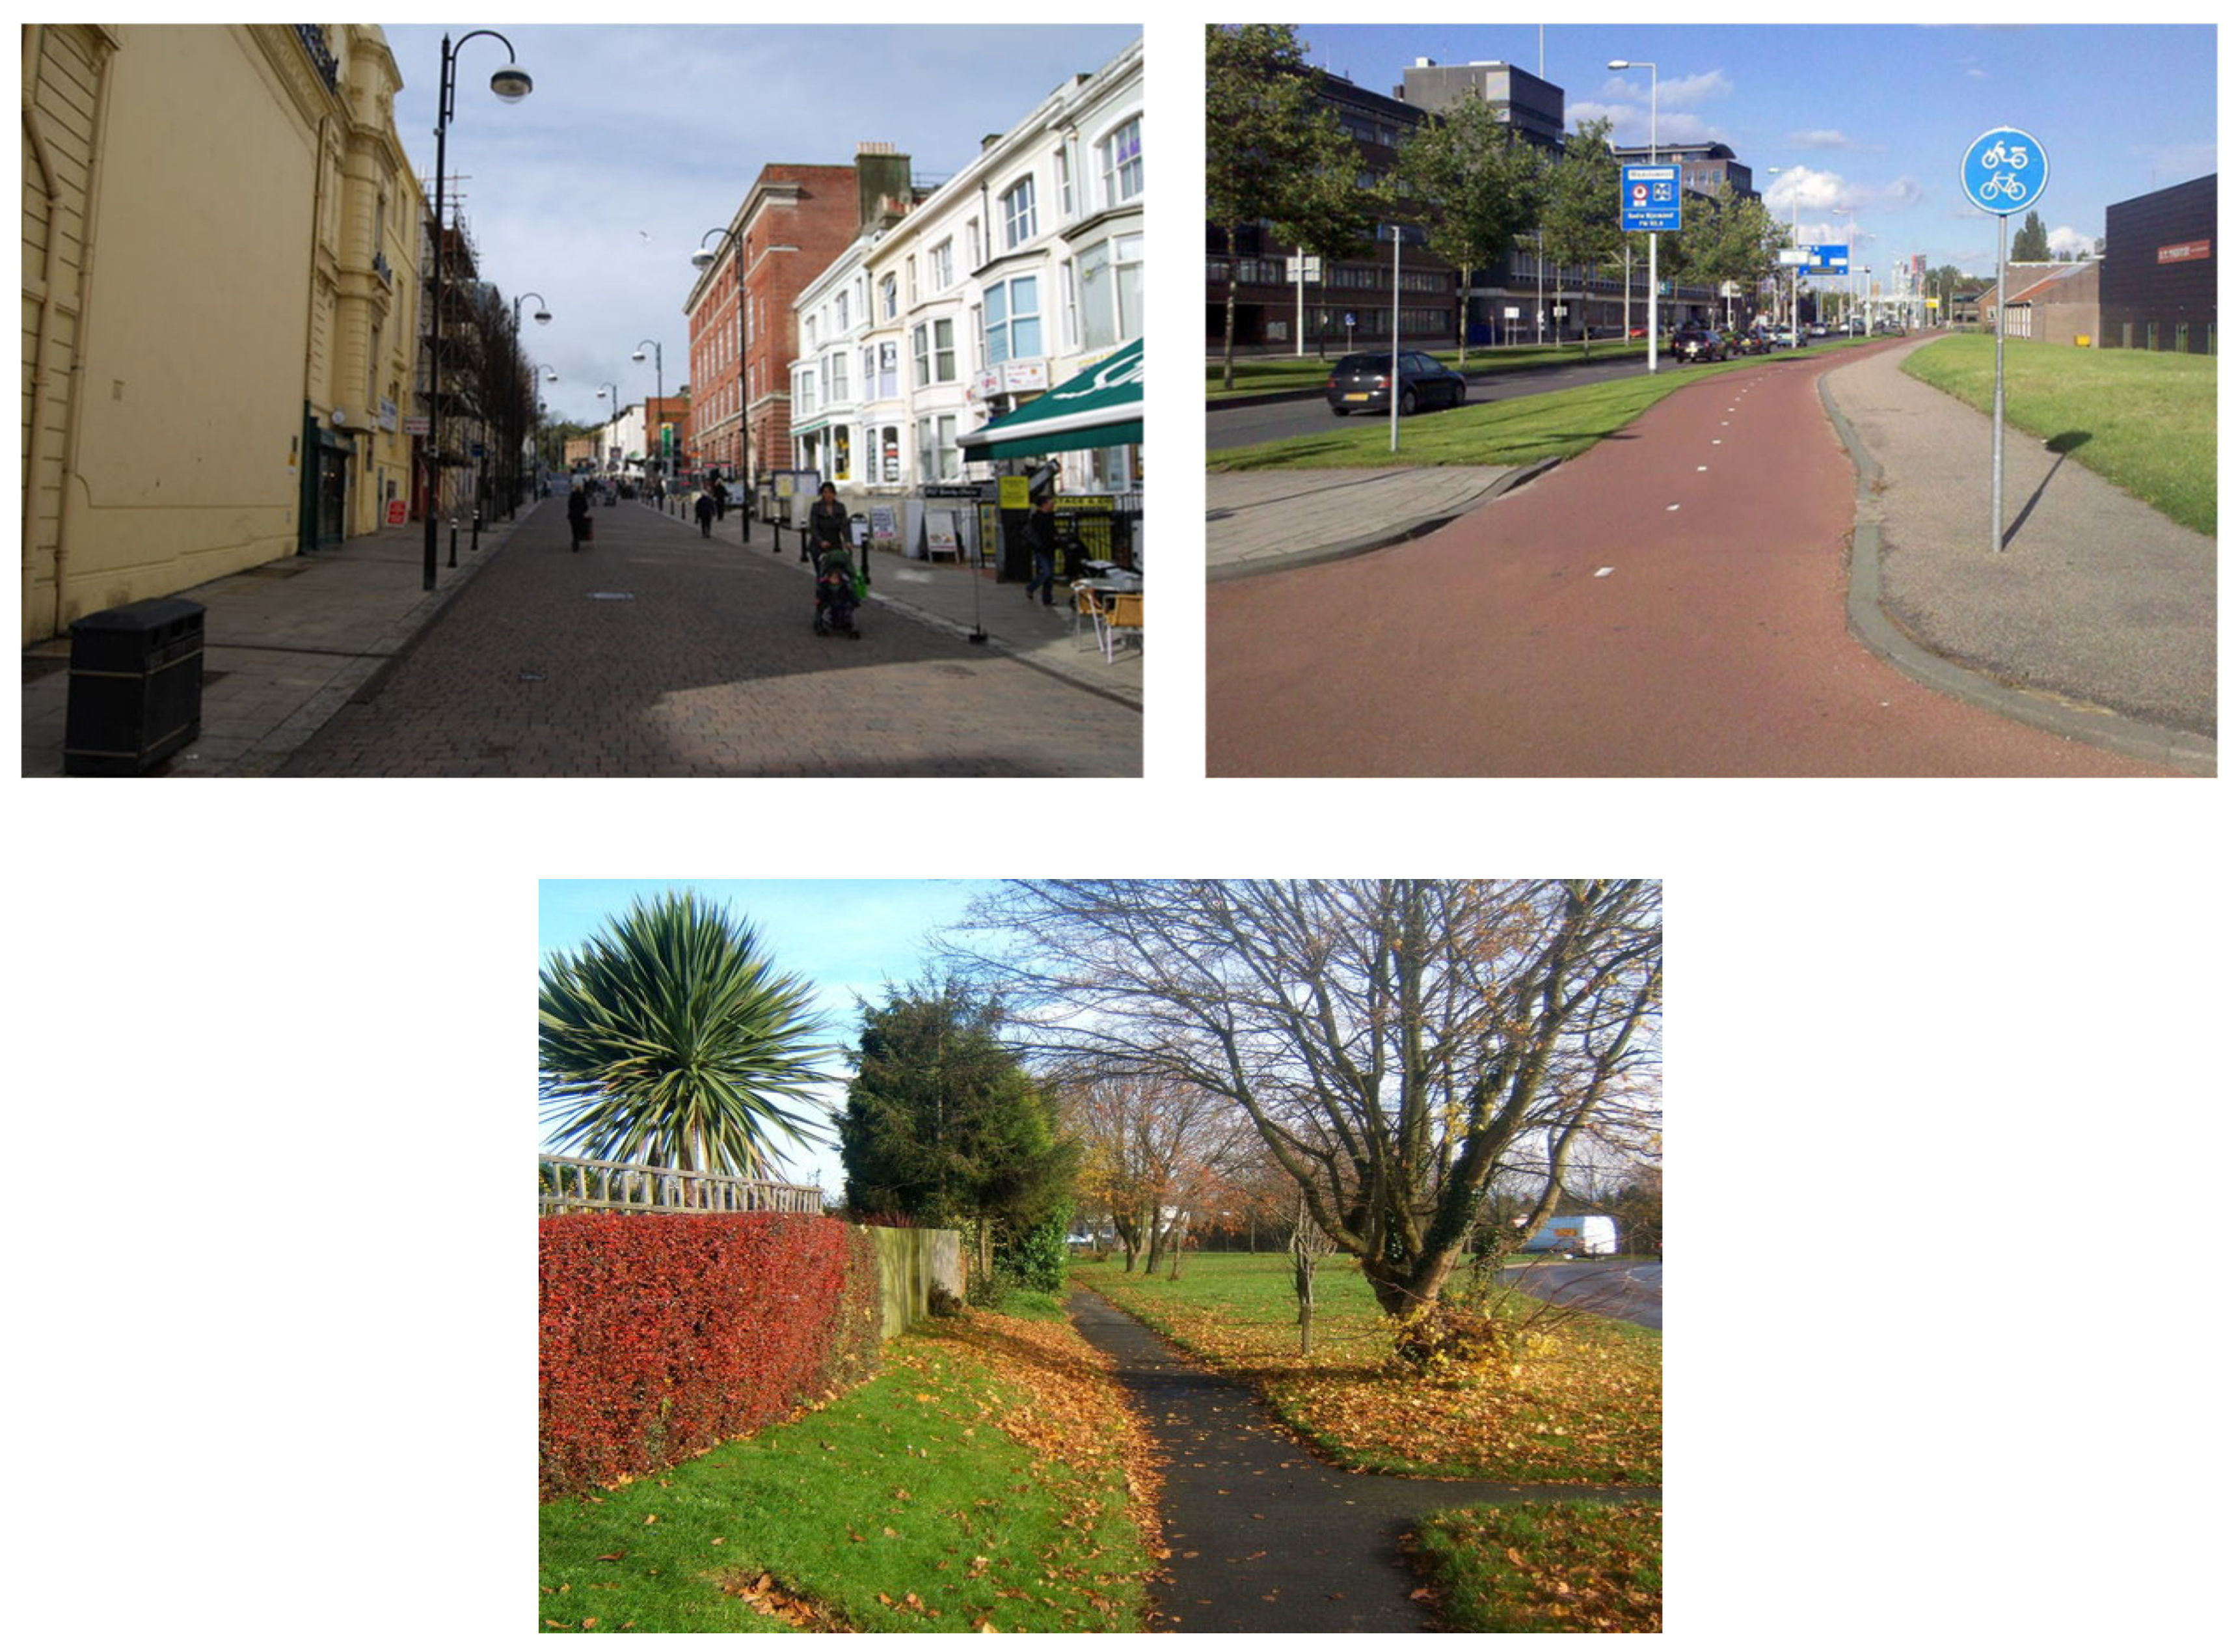
Figure 6.
Percentage of kms travelled in each study area using each route type.
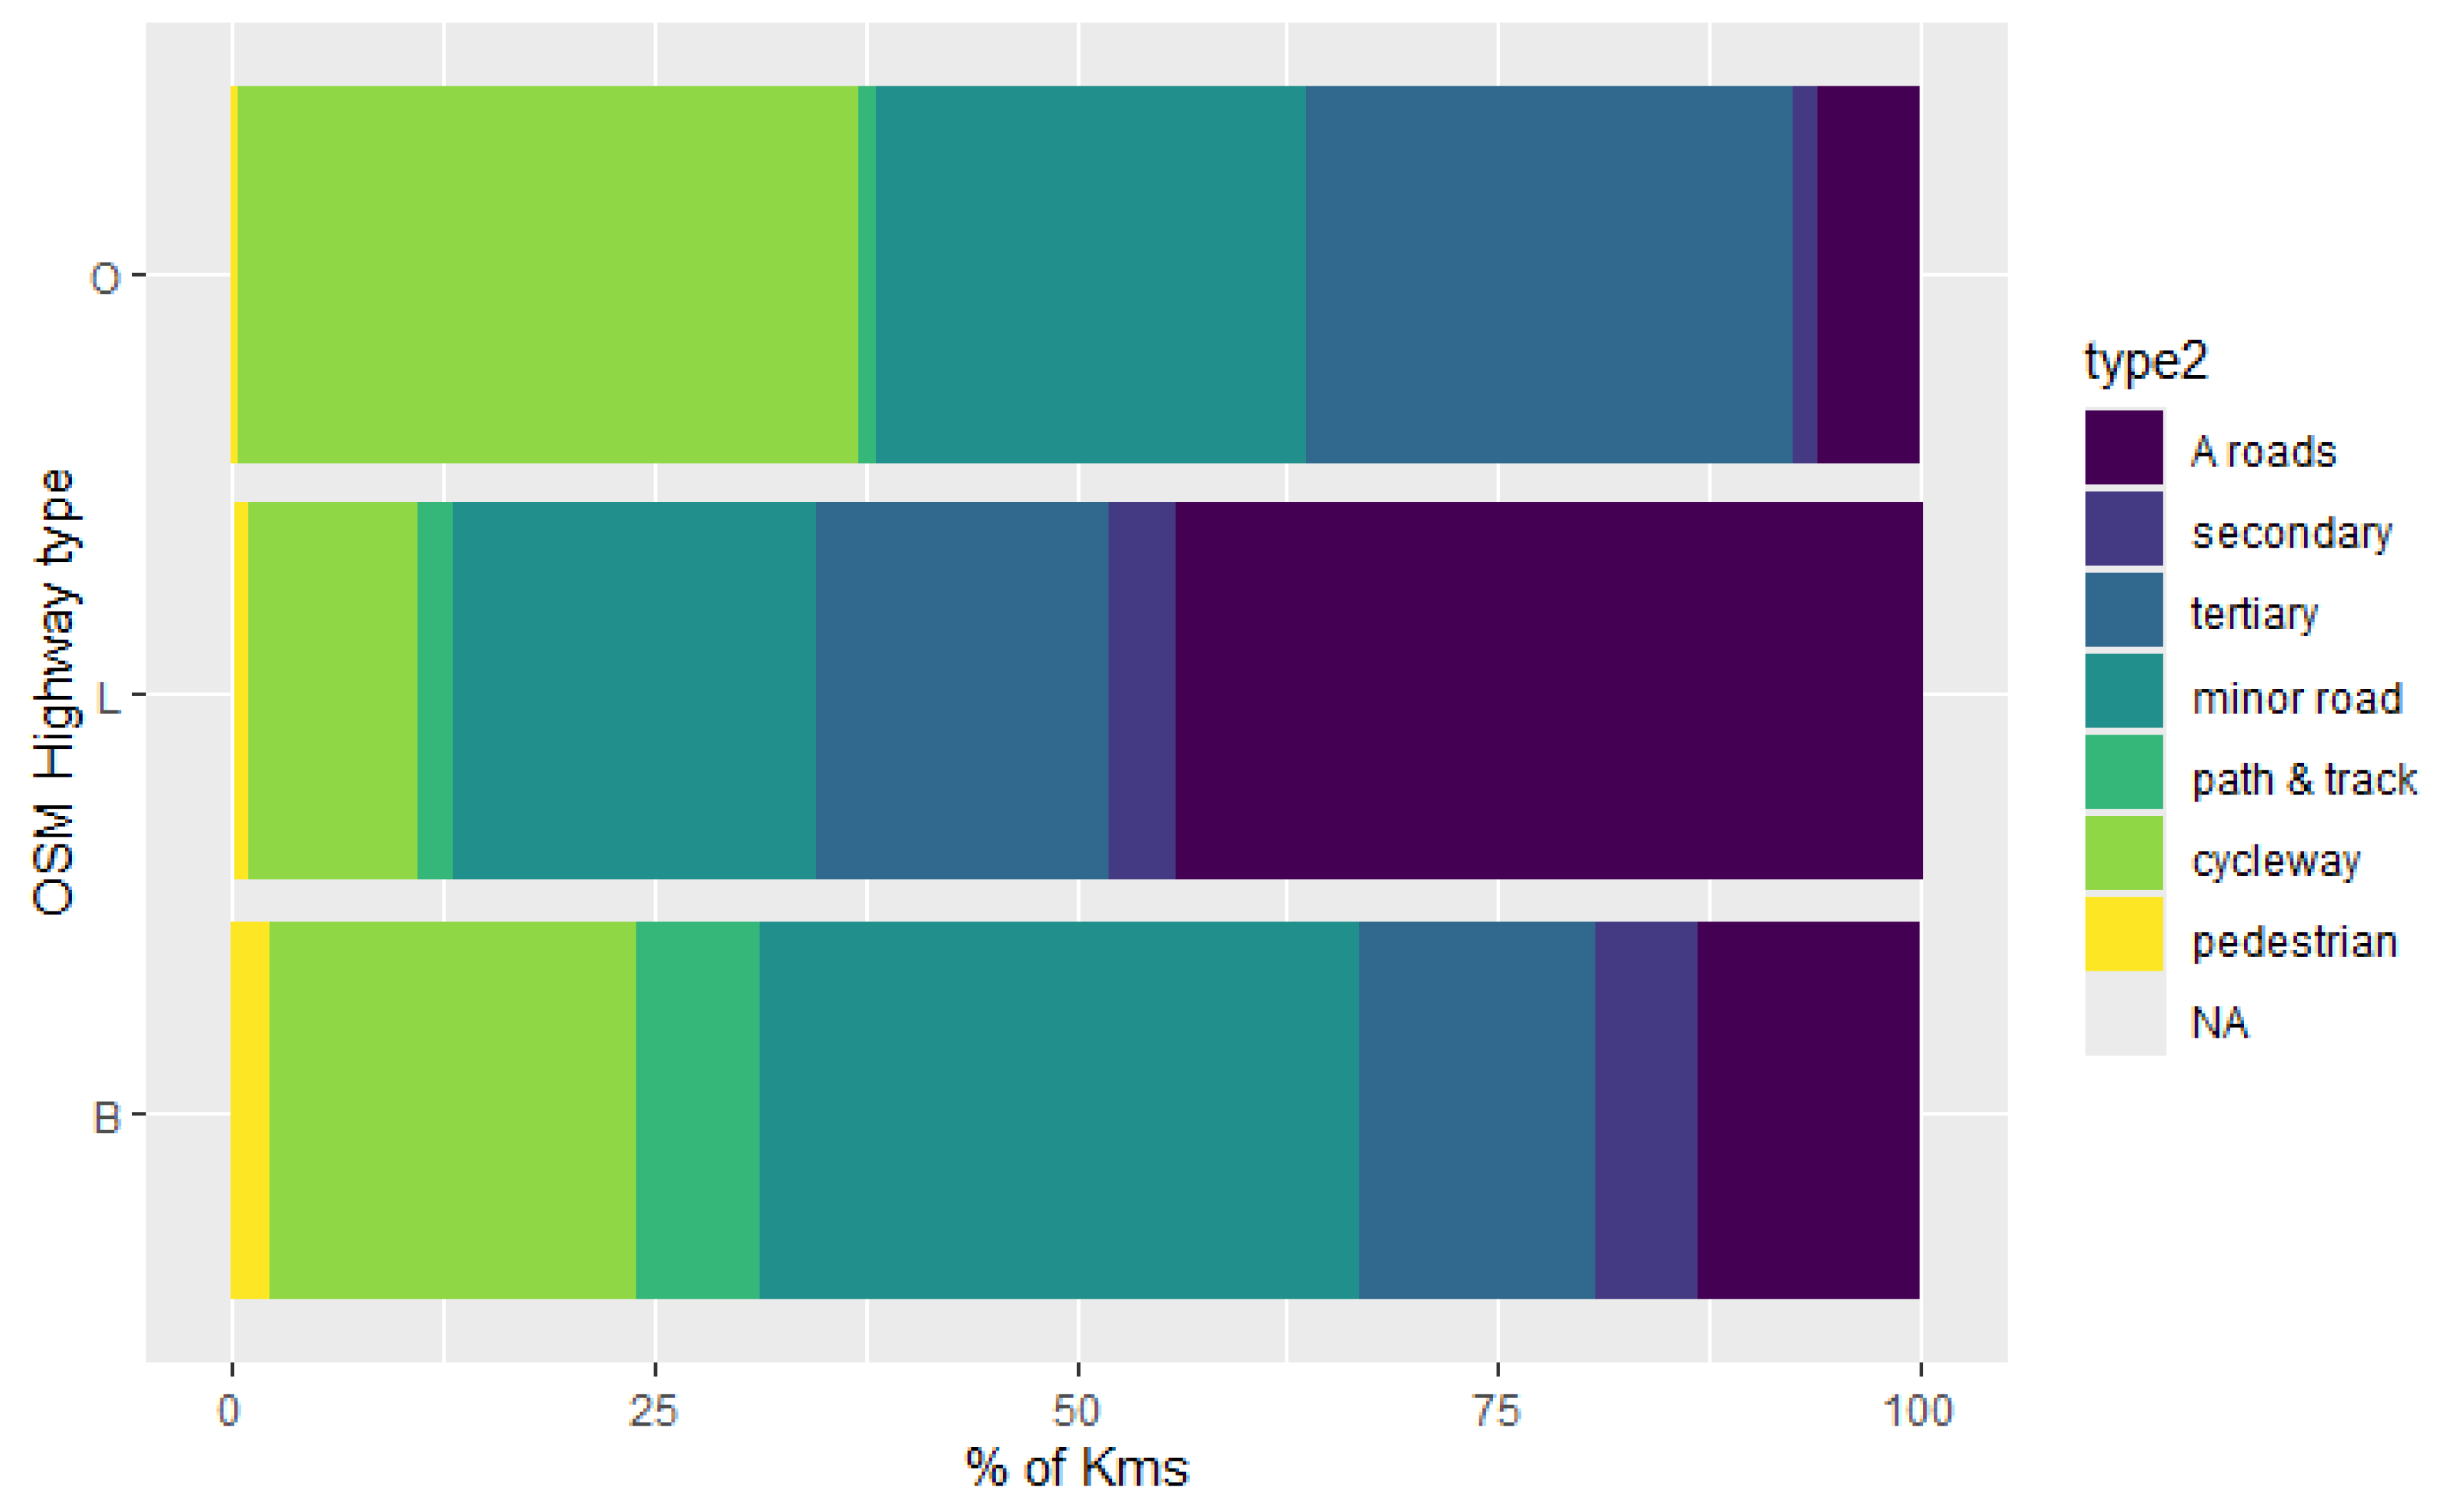

Table 1.
ROUTES data format downloaded from the Pow-Unity API.
| column and <data format> | description |
|---|---|
| id <dbl> | Unique ID for point |
| deviceId <dbl> | ID for the GPS device |
| serverTime <dttm> | This is the date and time when the server has received the message |
| deviceTime <dttm> | This is the date and time the message was formed for the device |
| fixTime <dttm> | This is the date and time when the GPS device has established the fix for the position |
| latitude <dbl> | latitude |
| longitude <dbl> | longitude |
| speed <dbl> | inferred from non-cleaned points |
| course <dbl> | inferred from non-cleaned points |
| deviceName <chr> | Name of the GPS tracker assigned by research team |
Table 2.
proportion of points removed during cleaning.
| Duplicate points | 1.5% |
| Erroneous points, TTFF errors, and too fast | 11.8% |
| Known in vehicle points | 1% |
| Points where bike did not move more than 300m on that day | 0.45% |
Table 3.
mean speed on different route types.
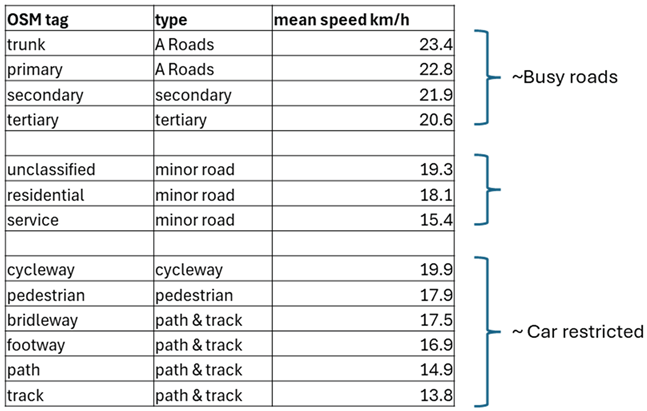 |
Table 4.
summary of elevation gain by the e-cargo bikes in use.
| City | mean height gain per trip (m) | mean height gain per km travelled (m) |
|---|---|---|
| Brighton | 54 | 16 |
| Oxford | 36 | 9 |
| Leeds | 70 | 13 |
Table 5.
Distance travelled on different route types by e-cargo bikes.
| kms travelled | |||
|---|---|---|---|
| route_type | Leeds | Oxford | Brighton |
| A roads | 1096 | 138 | 314 |
| secondary | 98 | 35 | 143 |
| tertiary | 426 | 660 | 332 |
| minor road | 534 | 585 | 839 |
| path & track | 51 | 21 | 177 |
| cycleway | 251 | 844 | 514 |
| pedestrian | 21 | 8 | 53 |
Disclaimer/Publisher’s Note: The statements, opinions and data contained in all publications are solely those of the individual author(s) and contributor(s) and not of MDPI and/or the editor(s). MDPI and/or the editor(s) disclaim responsibility for any injury to people or property resulting from any ideas, methods, instructions or products referred to in the content. |
© 2026 by the authors. Licensee MDPI, Basel, Switzerland. This article is an open access article distributed under the terms and conditions of the Creative Commons Attribution (CC BY) license (http://creativecommons.org/licenses/by/4.0/).
Copyright: This open access article is published under a Creative Commons CC BY 4.0 license, which permit the free download, distribution, and reuse, provided that the author and preprint are cited in any reuse.