

Submitted:
27 March 2026
Posted:
31 March 2026
You are already at the latest version
Abstract
Martian missions call for renewable supply chains of the 3D-printable bioplastic polyhydroxybutyrate (PHB). Because food waste can be anaerobically digested into methane and then bacterially converted into PHB, we analyzed the possible coupling between food waste produced from exploration life support (ELS) crop cultivation and the space biomanufacturing process of PHB generation. We designed 45,116 nutritionally complete menus from 23 ELS crops, calculated how much PHB demand each menu attains after its crop waste is converted into PHB (loop closure), evaluated menu crop cultivation and PHB generation costs using the equivalent system mass (ESM) metric, and contrasted ESM cost with that of existing Mars menus, which include shipped foods. We demonstrate that our menus meet astronaut macronutrient and energy requirements, yield up to 10 times the daily PHB required for a 600-day crewed Mars mission, and have 19-32% lower ESM cost per unit loop closure than previous Mars menus.
Keywords:
astronaut nutrition
; space biomanufacturing
; space bioprocess engineering
; in situ resource utilization
; anaerobic digestion
; bioregenerative bioplastic production
; Mars
Introduction
Crewed Mars missions will contend with large travel distances and long timescales that make it economically and energetically infeasible to ship all consumables needed for astronaut survival with the initial payload or with periodic resupply[1]. Instead, the resilience of the first Martian crewed missions will be determined by a biotechnologically-driven circular bioeconomy that generates mission-critical consumables and that also recycles to recover raw materials [1,2,3,4,5,6,7,8,9]. This circular bioeconomy can be established for six astronauts on the Mars surface by a factory of space bioprocess systems that integrate physicochemical in situ resource utilization (ISRU) with biological ISRU [10,11]. Destination resources such as atmospheric carbon dioxide and nitrogen will be feedstocks for microbial carbon and nitrogen fixation, respectively, to build inventories of keystone substrates like acetate, methane, and ammonium for conversion to food, fuel, and building materials [10,11,12]. Recycling to close the loop and minimize system losses can be accomplished by, for example, anaerobic digestion (AD) [13,14,15,16,17], a biochemical process that converts organic biomass compounds into a mixture of methane, carbon dioxide, and volatile fatty acids (VFAs) through the concerted action of diverse populations of syntrophic microorganisms in the absence of oxygen [18]. Alternative physicochemical waste-treatment strategies are not preferred because they rely on high-temperature and/or high-pressure processes such as pyrolysis, incineration, steam reforming, ozone oxidation, and catalytic wet-air oxidation [19,20]. These processes are energetically costly, and also require complex infrastructure to be shipped from Earth, which increases economic costs.
Any supply chain for biomanufacturing critical space commodities like building materials must be assessed, tested, and found reliable[21,22,23]. One such key commodity is poly(3-hydroxybutyrate) (PHB), an aliphatic biopolymer that is a biological alternative to synthetic plastics and that is natively synthesized by a wide range of microorganisms [24]. PHB has similar mechanical properties to polypropylene [25,26], with a high elastic modulus [26,27], a high tensile strength [26,27], and a resistance to hydrolytic degradation [26,28]. Thus, PHB is a biodegradable, easily-replenishable alternative to the synthetic filaments that are needed to 3D-print tools or habitat components on Mars [1,10]. To produce PHB in a circular Mars bioeconomy, AD is a promising supply chain element[29] because AD can convert the substantial biodegradable waste accumulated during a standard 600-day Mars mission [30] into methane, which can then be used as a feedstock for microbial PHB synthesis [10,12] (Figure 1). Current assessments of planned astronaut meals suggest that up to 6.66 kg of inedible biomass per crew member per day will be generated from exploration life support (ELS) crops [31]. Simply discarding this waste into a Martian landfill will exacerbate pollution and forfeit the recovery of organic elements from over three tonnes of lignocellulosic biomass that will be generated during a standard Mars mission. Instead, AD can process waste streams from ELS crops into methane for PHB production at near-ambient temperatures and pressures. Moreover, the use of anaerobic microorganisms will prevent diverting oxygen from other life support roles. However, the coupling between AD and space biomanufacturing is relatively unexplored, apart from our group’s prior analysis on a limited version of the concept [29].
Impacting this coupling between PHB production and AD-sourced methane is astronaut nutrition. First, astronaut meals must be purely plant-based to be compatible with the bioregenerative framework of a circular Mars bioeconomy [30], due to the disproportionately higher energy, land use, and water consumption costs of animal farming [32,33,34,35,36]. Bioregenerative meals can be derived from the crop cultivars listed in the NASA Life Support Baseline Values and Assumptions Document (BVAD) [31]. However, completely plant-based astronaut meals will accumulate substantial amounts of lignocellulosic waste during crop harvesting and meal preparation, which further necessitates AD. Second, each space farm harvest must be nutritionally healthy. Except for vitamin B12, a plant-based diet provides sufficient levels of all essential micronutrients (vitamins and minerals), and vitamin B12 can be supplemented separately through microbial production [37,38]. In fact, a purely plant-based diet has also been linked to many health benefits[39,40,41]. Ensuring sufficient crop nutrition and variety will perturb the inputs to, and outputs from, AD because the overall space farm crop composition can fluctuate between timepoints, and the crops that are being harvested and digested at different timepoints can also change.
Although NASA menus for crewed Mars missions are palatable and nutritionally complete[30] (Supplementary Information Section S1, Table S1A, Table S1B, and Table S1C), these menus are not composed solely of ELS crops, and animal products such as eggs are included. Some of these menus rely on packaged foods, and require electronic cooking equipment such as grinders. Therefore, current NASA Mars menus are not fully bioregenerative. Restricting menus to only ELS crops and simplifying food preparation will reduce shipping and operational costs, as measured by the equivalent system mass (ESM) metric[42], without necessarily having to compromise on taste (Figure 2). No prior studies have evaluated the energy costs of assembling these menus for a crewed Mars mission, nor has the coupling between astronaut menu planning and AD-driven PHB supply chains been evaluated. Accordingly, here, we quantify how much methane can be recovered from the AD of ELS crop waste, how much PHB can be produced from that methane, and what the associated energy costs are.
Specifically, we demonstrate that: (i) all daily astronaut macronutrient requirements [31] can be fulfilled by a fully bioregenerative plant-based diet that is composed solely of ELS crops; and (ii) the daily mission PHB demand can be fulfilled by using AD to convert the inedible biomass of these crops in various fully-bioregenerative menus into methane, followed by microbial conversion of that methane into PHB. Thus, our intellectual contributions include:
- 1.
- designing a palatable array of new, fully bioregenerative astronaut menus assembled solely from ELS crops;
- 2.
- confirming that our menus fulfill astronaut dietary reference intakes (DRIs) for carbohydrate, protein, fiber, fat, and calories;
- 3.
- demonstrating that the daily mission demand for PHB can be surpassed by converting the inedible biomass from our fully bioregenerative menus to methane via AD, followed by microbial conversion of that methane to PHB; and
- 4.
Consequently, we establish that astronaut nutrition and PHB production can be coupled via AD, which will be a central recycling operation in a circular Mars bioeconomy. The low ESM cost of this coupling will further increase PHB availability for additional astronaut operations on Mars.
Results
We developed 45,116 fully bioregenerative, nutritionally complete menus. All menus are listed in Supplementary Information Section S3, along with their crop makeup, nutrition content, percentage difference from each target DRI, 30-day methane yield, 30-day PHB yield, ESM costs, and ESM per loop closure.
There were 5,065 menus that achieved a mean percentage difference of less than 2% from all target DRIs, Figure 3A. These menus had a mean loop closure of 214.33% of the daily mission demand of 200 g-PHB/day, and mean ESM per loop closure of 1,776.57 kg/%. Strawberries were the single most dominant first-choice crop in all of these 5,065 menus (Figure 3B), while carrots, sweet potatoes, and green onions were the second-choice crops in 2,493, 1,961, and 611 menus, respectively. In all 5,065 of these menus, peanuts were the sole third-choice crop.
There were 42,007 menus that completely fulfilled the daily mission demand of 200 g-PHB/day, Figure 3A. When sorted by contribution to loop closure, the top 1% of menus, 709 of them, achieved a mean loop closure of 898.85%, almost nine times the daily mission demand for PHB, with a mean ESM per loop closure of 746.48 kg/%. Wheat was the most popular top-choice crop in 396 of these menus, followed by radish (top choice in 120 menus) and onions (top choice in 84 menus), Figure 3C. Carrots were the second-choice crop in 366 of the menus in the top 1% of loop closure fulfillment, followed by wheat (313 menus) and red beets (17 menus). Sweet potatoes were the most frequent third-choice crop (364 menus), followed by peanuts (291 menus) and peppers (30 menus).
Nutritional Performance of Nutrient Focused Menus
We designated the four menus with the smallest mean percentage difference between achieved and target DRIs as our "Nutrient Focused" menus.
The best menu in the Nutrient Focused category consisted of 2,784 g strawberries, 754 g green onions, 104 g peanuts, 44 g peas, 17 g carrots, and 7 g sweet potatoes (Figure 4A), for a daily meal mass of 3,710 g. This combination met all five target DRIs with just +1.27% overall mean deviation. Replacing strawberries with other ELS crops in the subsequently ordered Nutrient Focused menus achieved up to five-fold reduction in the total menu mass to meet all DRIs, dropping from 3,710 g to a mean meal mass of 919 g across strawberry-free menus (Figure 4B–D). The mean meal mass across all four menus in the Nutrient Focused category was 1,617 g.
All four Nutrient Focused menus fulfilled carbohydrate, protein, fat, dietary fiber, and energy DRIs nearly perfectly, with a mean difference from all target macronutrient DRIs of +2.2%. Carbohydrate, fat, and energy DRIs were fulfilled with exceptional stability, each deviating from its target DRI by +0.2%, -0.4%, and 0.4%, respectively, across all four menus. Dietary fiber was the second most difficult nutrient target to fulfill, reaching a maximum of +3.9% above its target DRI, and mean deviation of +2.5% across all four menus. Protein was consistently the macronutrient group that experienced the highest deviation, ranging between +3.8% to +11.6% difference from its target DRI, with a mean percentage difference of +9%. The increased deviation observed for protein from its target DRI was exacerbated most when strawberries were replaced with other ELS crops.
Nutritional Performance of Bioplastic Focused Menus
We designated the four menus associated with the highest total loop closure as our "Bioplastic Focused" menus.
The menu with the highest loop closure among all 45,116 fully bioregenerative menus at 1,058.20% of daily mission PHB demand consisted of 740 g radishes, 684 g wheat, 127 g peanuts, and 3 g snap beans (Figure 5A). The total meal mass was 1,554 g, nearly two and a half times smaller than that of the best Nutrient Focused menu. Replacing radishes with other ELS crops in the subsequently ordered Bioplastic Focused menus did not substantially reduce total meal mass (Figure 5B–D). The mean meal mass was 1,605 g across this category.
All four Bioplastic Focused menus fulfilled carbohydrate, protein, fat, dietary fiber, and energy DRIs worse than the Nutrient Focused menus, with a mean difference from all target macronutrient DRIs of +22.8%. Protein content deviated the most, between +66.5% to +71.6% from target across all four menus. Carbohydrate, fiber, and energy DRIs were fulfilled with lower mean deviation from their targets across all menus, at +15.0%, +20.6%, and +10.1%, respectively. The fat DRI was fulfilled with exceptional stability, achieving a mean deviation of just -0.8% from target across all four menus. Although positive deviation from targets was high due to difficulty fulfilling the protein DRI without sacrificing incredient heterogeneity, no DRIs were substantially underfilled, with percentage differences between target and achieved macronutrient DRIs never below -1% for any menu. Thus, the four Bioplastic Focused menus successfully fulfilled all macronutrient DRIs with 12 g lower mean daily meal mass than the Nutrient Focused menus.
Nutritional Performance of ESM Saver Menus
We designated the four menus with the lowest overall ESM cost per unit loop closure as our "ESM Saver" menus.
The Bioplastic Focused menu with the highest loop closure also doubled as the menu with the lowest ESM per loop closure among all 45,116 fully bioregenerative menus, at 730.21 kg/% (Figure 6A). Replacing radishes as the dominant crop with tomatoes yielded the third menu in the Bioplastic Focused category, with total meal mass increasing from 1,554 g to 1,929 g (Figure 6B), while replacing radishes with wheat reduced meal mass to 996 g (Figure 6C). Selecting green onions as the dominant crop in the ESM Saver category did not substantially impact meal mass (Figure 6D). The mean meal mass was 1,495 g across this category, the lowest among the three categories.
The ESM Saver menus fulfilled the carbohydrate, protein, fat, dietary fiber, and energy DRIs better than the Bioplastic Focused menus but worse than the Nutrient Focused menus. The mean difference from all target macronutrient DRIs was +19.6%. Once again, protein content deviated the most, between +50.9% to +71.6% from target across all four ESM Saver menus. Carbohydrate, fiber, and energy DRIs were fulfilled with lower mean deviation from their targets across all menus, at +13.2%, +15.7%, and +7.3%, respectively. Fat content fulfillment remained exceptionally stable, deviating just -0.7% from target across all four menus. As before, no DRIs were substantially underfilled, with percentage differences between target and achieved DRIs never below -1% for any ESM Saver menu. Thus, the ESM Saver menus successfully fulfilled all macronutrient DRIs, and had 122 g lower mean daily meal mass than the Nutrient Focused menus.
Loop Closure and ESM
For each of the 45,116 menus, Supplementary Information Section S7 lists the methane yield, PHB yield, loop closure, ESM of Cultivation, ESM of AD, and ESM of PHB Synthesis, each with mass, power, volume, thermal control, and crew time breakdowns. The four Nutrient Focused menus achieved a mean loop closure of 251%, with rice straw contributing the most PHB (Figure 7A). The Bioplastic Focused and ESM Saver menus yielded on average approximately four times as much PHB as the Nutrient Focused menus, with mean loop closures of 1,004% and 970%, respectively (Figure 7A). For both these categories, wheat straw was the single most dominant PHB contributor across all four menus.
The Bioplastic Focused menus incurred the highest ESM of the three menu categories, with a mean ESM of 746,438 kg across all four menus, followed by the ESM Saver menus at a mean of 711,937 kg, and Nutrient Focused menus at a mean of 441,297 kg (Figure 7B). The best Nutrient Focused menu, which had the highest edible biomass of all menus (Figure 4A), incurred the highest ESM of cultivation of all menus (Table 1). In general, menus comprised of crops with lower productivity and higher mass tended to incur a higher ESM of cultivation. The ESM of AD contributed the most to overall ESM for all three menu categories. ESM of AD was a function of inedible rather than edible crop mass; menus whose constituent crops had higher inedible productivity tended to incur a higher ESM of AD (Table 2). For example, the Bioplastic Focused and ESM Saver menus utilized highly lignocellulosic crops like radish and wheat for majority portions of their meal mass (Figure 5 and Figure 6), and incurred a mean ESM of AD of 283,470 kg and 273,391 kg, respectively. Meanwhile, the Nutrient Focused menus prioritized less lignocellulosic crops (Figure 4) and incurred a mean ESM of AD of 152,444 kg, nearly half that Bioplastic Focused and ESM Saver menus. ESM of PHB Synthesis closely followed previous trends observed across all menus for PHB yield and loop closure, because higher methane availability for PHB production required a higher number of microbial bioreactors for conversion to PHB (Table 3). Generally, Nutrient Focused menus incurred lower ESM than their counterparts, due to their inedible biomass yielding substantially less methane and PHB each month.
The ESM Saver menus achieved the best ESM per loop closure of all menus, with a mean cost of 733.94 kg/% loop closure (Figure 7C). Bioplastic Focused menus were a close second best at a mean cost of 743.58 kg/% loop closure, while Nutrient Focused menus trailed substantially at a mean cost of 1,762.44 kg/% loop closure.
Comparison with Published NASA Mars Menus
The methane yield, PHB yield, loop closure, ESM of Cultivation, ESM of AD, and ESM of PHB Synthesis of the three NASA menus are listed in Supplementary Information Section S8, along with the mass, power, volume, thermal control, and crew time breakdowns for each ESM component. We compared our selection of fully bioregenerative Nutrient Focused, Bioplastic Focused, and ESM Saver menus with three sets of partially bioregenerative menus published by NASA, on the basis of ESM, PHB loop closure, and ESM per loop closure. Due to the absence of specific crop masses for meals within NASA’s Mars menu, we used the mean ESM and loop closure values for all four menus in our three menu categories for the comparisons.
Our Bioplastic Focused and ESM Saver menus achieved the highest mean loop closure of all six menu categories, while the three NASA menu categories achieved higher mean loop closure than our Nutrient Focused menus, Figure 8A. The crop waste streams that contributed most to the loop closure of the Nutrient Focused and NASA bulk commodity (BVAD) menus were rice straw and soybean hulls, respectively. For all other menu categories, wheat straw was the dominant contributor to loop closure.
Our Bioplastic Focused and ESM Saver menu categories incurred higher mean ESM than the NASA Vegetarian and Mixed menus (Figure 8B and Table 4). However, the higher loop closure of the Bioplastic Focused and ESM Saver menus resulted in their outperformance of the NASA menus in final ESM per loop closure (Figure 8C). On average, the Bioplastic Focused menus achieved each unit increase in loop closure at 30% less ESM cost than the NASA Vegetarian menus, 32% less cost than the NASA Mixed menus, and 19% less cost than the BVAD menu. The ESM Saver menus achieved 31% lower ESM per loop closure than the NASA Vegetarian menu, 32% lower than NASA Mixed menu, and 20% lower ESM cost than the BVAD menu.
Discussion
Closing the loop in astronaut nutrition is a cost reduction optimization opportunity on early Mars missions. Nutrition involves constant waste production. All ELS crops listed in the NASA BVAD for a crewed Mars mission have inedible fractions, and the consequent accumulation of lignocellulosic waste is a massive loss of energy that must be efficiently recycled back into a nascent Martian bioeconomy. PHB supply chains on future Mars missions can be passively augmented with astronaut nutrition by switching to fully bioregenerative food menus, and converting their crop waste to methane via AD. By directly integrating astronaut nutrition with a microbial PHB production pipeline, we leveraged a previously untapped procedural opportunity for reducing mission costs. In doing so, we coupled the design of astronaut food menus with the recycling objectives of downstream AD. The realization of a circular Mars bioeconomy where astronaut nutrition is founded on fully bioregenerative plant-based food extends beyond energetic efficiency. Plant-based astronaut diets also inherently avoid animal cruelty and exploitation by removing the need for forced captivity and the eventual dispatching of animals for food in space.
We used a greedy algorithm to parse crop macronutrient profiles and successfully assemble tens of thousands of crop combinations that are nutritionally complete. Despite the algorithmic search process being suboptimal, we observed only minor positive deviations between our target and achieved DRIs. We created over 5,000 food menus composed solely of ELS crops that fulfill all NASA macronutrient and energy targets within 2%, with no underfilling. Overall, we offer over 45,000 menus that fulfill all NASA macronutrient and energy targets within 25%, with no underfilling. We demonstrated the feasibility of completely relying on ELS crops to fulfill astronaut macronutrient targets, and we showed that the coupling of astronaut nutrition with downstream PHB production compared to existing NASA Mars menus can be achieved at a lower ESM cost. The few fractional negative deviations from DRIs that we observed, such as -0.5%, are not problematic as this is at most a few grams of food, and small negative deviations can be corrected by slightly inflating the target DRI for that nutrient when next running our algorithm. Because no menus generated in the year 2025 will perfectly encapsulate the personalized nutrition profiles of astronauts assigned to the first crewed Mars mission ten years or more from today, we did not opt for this modification.
Across all menus, protein is the macronutrient group that is most difficult to optimize, likely due to less uniform distribution of nutritional content across the five DRIs, relative to other ELS crops. The difficulty of optimizing protein intake can be explained by the individual nutrient profiles of the ELS crops. The protein DRI target of 50 g is six times smaller than the carbohydrate DRI of 300 g, yet the mean protein content of the ELS crops is 4.5 g-protein/100 g-biomass, less than 10% of its target DRI. In contrast, the mean carbohydrate content of the ELS crops of 14.7 g-protein/100 g-biomass amounts to less than 5% of its target DRI. The mean fat content of the ELS crops, 2.7 g-fat/100 g-biomass, is also less than 5% of its 65 g DRI. Since each ELS crop contributes a smaller fraction of the carbohydrate and fat DRIs compared to the protein DRI with each iteration of the greedy algorithm, it follows that there will be a broad deviation of protein from its target DRI in non-protein-biased menus. For example, 18 of the 23 ELS crops contain less than 1 g fat/100 g biomass, while only nine of the 23 ELS crops have a protein content less than 1 g-protein/100 g-biomass: sweet potatoes, strawberries, peppers, carrots, tomatoes, radish, green onions, celery, and lettuce. In all 5,065 menus that achieved a mean percentage difference of less than 2% from all target DRIs, the top four dominant crops that contributed the highest or second-highest mass per menu belonged to this set of low-protein crops.
Although the mean dietary fiber content of the ELS crops of 2.5 g-fiber/100 g-biomass accounts for 10% of its target DRI of 25 g, it has a much narrower range than relative protein content; all but two crops have dietary fiber content between 0–4.5 g-fiber/100 g-biomass, while protein content ranges from 0.68–23.7 g-protein/100 g-biomass. Interestingly, strawberries appear to be particularly nutritionally uniform across all macronutrient groups, given that they were the dominant crop in over 5,000 of the most nutritionally precise menus that achieved less than 2% mean deviation across all five nutrition targets. Removing strawberries from the top-choice Nutrient Focused menu was associated with an increase in positive deviation of protein from its target DRI, as well as substantial reduction in overall meal mass. A future in-depth exploratory analysis of the most nutritionally uniform crops will assist with identifying ELS crops that can help precisely tailor astronaut food menus to individual nutrition profiles.
When ranked by contribution to daily mission loop closure, the top 1% of menus achieved nearly 900% loop closure or higher with wheat as the dominant crop, despite contributing up to 70% less mass than strawberries did in the best Nutrient Focused menu. This is easily explained in terms of relative lignocellulosic content, as wheat straw has only 8.44% non-lignocellulosic organic content, while over 65% of strawberry seeds biomass is non-lignocellulosic.
Our complete reliance on ELS crops allows for dynamic tailoring of meals to astronaut nutrition preferences and needs, which may change as a Mars mission unfolds. There is no partial reliance on commodity foods or shipped prepared foods, which are not bioregenerative nor replaceable in situ. Our bottom-up approach for menu development, with clearly defined ingredients and masses, enables precise computational coupling of nutrition with any downstream space bioprocess engineering demand than can utilize the outputs of AD as a feedstock. Thus, our successful approach to generate nutritionally complete menus can be easily adapted in the future to personalize nutrition goals on Mars missions. These menus can be applied across a wider range of nutrient groups tailored to individual astronaut age, gender, and body composition.
Our massive dataset of fully bioregenerative menus presents astronauts with thousands of menus whose waste streams are similarly compositionally tailored to methane production. This will enable astronauts to respond to mission scenarios where methane production is critical for maintaining a given life support supply chain by simply changing their daily food menu without compromising palatability or nutritional precision. The crop waste from all these menus can be fully recycled via AD, enabling astronauts to select food menus whose waste is compositionally tailored to the daily methane and PHB demand of the mission.
Our work on coupling astronaut nutrition with PHB production is a first step towards process optimization of AD to attain maximum loop closure for each mission consumable, also representing a step towards improving self-sufficiency for future astronauts on Mars. The choice of best food menu will depend on priorities determined by the astronaut crew. In scenarios where mission demand for these consumables increases due to an unpredictable life support challenge, astronauts can augment PHB supply chains by merely selecting menus that are associated with high lignocellulosic waste. If PHB production needs to be prioritized in addition to nutritional completion, then the Bioplastic Focused menus can be selected for daily rotation. If precisely filling each nutrition target is a priority, then any of the Nutrient Specific menus can serve as a suitable middle ground between loop closure and nutritional precision. If PHB supply is prioritized, any among the Bioplastic Focused and ESM Saver menus will be appropriate choices. Our greedy algorithm will enable any additional ELS crops to be incorporated easily into future astronaut menu recommendations.
A major limitation of our work is the dearth of comprehensive compositional analysis of all waste streams associated with a given food crop. Reliable data was available primarily for popular AD feedstocks such as rice straw and wheat straw, but most ELS crops did not have published data on all their inedible components. In particular, compositional data for the waste streams for chard and red beets had to be obtained from sugar beets, while that of onions and green onions had to be obtained from whole onions. Furthermore, strawberry seeds are not a traditional waste stream from strawberry plants, but had to be selected due to absence of compositional data for strawberry plant roots, stems, or leaves.
Finally, spaceflight imposes numerous physiological stresses on some microbes, which will impact growth rates and transcriptional and translational responses, leading to changes in cell growth, cell morphology including biofilm formation, pathogenicity, and metabolic activity, and thus potential output and scale [43,44,45,46]. The methanotrophs selected to convert methane to PHB and the microbial consortia that mediate AD may experience differential gene expression in reduced Earth gravity relative to Earth-based experiments, which is not accounted for in any current predictive AD model. Although some steps have been taken to optimize AD for extraterrestrial surface missions [14,15,17], there has been no exploration of partial gravity effects nor the ability to restore microbial fitness losses under space environment stresses. Furthermore, there are no studies that capture the parametric effects of variable gravity on microbial bioplastic production. There is a need for future evaluation of both AD and microbial PHB synthesis in the reduced gravity environment of space.
A primary future direction for our work is improving our algorithmic approach to menu design, such as by switching to mixed integer linear programming for provably optimal rather than Pareto optimal fulfilment of our nutrient DRIs. This will enable more economical coupling of meal design with supply-chains that can be augmented by any intermediate outputs within the AD process, such as acetate during acetogenesis, or hydrogen during acidogenesis and acetogenesis. A second major future direction will be to improve the accuracy with which we can predict methane yields from the anaerobic digestion of lignocellulosic biomass. These predictions will be tailored to feedstock characteristics across different digester operating conditions while incorporating variable gravity effects. This will include gathering our own compositional data for less studied waste streams, such as chard and red beets, for which data on elemental and lignocellulosic content is not readily available. Currently, the best predictive models for anaerobic digestion are inconsistent at predicting the optimal set of digester operating conditions capable of maximizing methane yields from AD, for a given set of feedstock characteristics. The operating conditions optimal to space missions will differ substantially from those optimal to Earth-based models like the ADM1 model. Moreover, there are few studies on the viability of applying solid-state anaerobic digestion in the space environment. A shift from Earth-based mechanistic models to more flexible data-driven models may couple partial gravity and space radiation effects with predictive modeling of methane and by-products of arrested anaerobic digestion, such as acetic acid. These models must be expanded to account for the effects of the space environment beyond AD, such as on downstream production of PHB, fuel, and fertilizer from nitrogen-rich digestate. Our work is a first step towards AD process optimization to deliver maximum loop closure for all AD-associated mission consumables, and to improve the self-sufficiency of future astronauts on Mars.
Methods
Developing Fully Bioregenerative Mars Menus
We first established daily targets for astronaut macronutrient intake according to DRIs in the NASA BVAD (Table 5). We next obtained nutrition values for the carbohydrate, protein, fat, dietary fiber, and energy content of all 23 ELS crops in the BVAD from the U.S. Department of Agriculture Food Data Central Database (Table 6).
We then constructed a greedy algorithm (Supplementary Information Section S2) to assemble all possible combinations of seven or fewer ELS crops that simultaneously approached all five nutrient targets while minimizing total meal mass. Our choice of seven as an upper bound for the number of crops in a crop combination was arbitrary, and we selected this bound to ensure substantial variety in crop combinations. Our greedy algorithm takes as input: a set of n crops, each with m nutrients, such that for each crop i, nutrient j has mass per unit mass of the crop; a set of nutrient targets for each jth nutrient, having lower bound and upper bound ; and a set of mass constraints for each ith crop, with required minimum quantity and available maximum quantity . Our algorithm minimizes total crop mass , where is the algorithm-chosen mass of crop i, and our algorithm also minimizes the nutrition error over all crops relative to nutrient targets , where . This minimization is performed subject to: (1) nutrient constraints , ; (2) mass constraints , ; and (3) non-negativity , . We include a brief analysis of our algorithm’s four “co-” properties in Supplementary Information Section S2, showing that our algorithm is convergent, complete, not complex, and correct.
We looped our greedy algorithm over every possible combination of seven or fewer ELS crops, which yielded = 245,157 menus, of which 45,116 menus achieved a mean percentage difference between 1–25% across all five target DRIs, Supplementary Information Section S3. For each of these 45,116 fully-bioregenerative menus, we computed: (i) the maximum methane from AD of each menu’s inedible biomass; (ii) the maximum PHB that is attainable from microbial conversion of that AD-sourced methane; and (iii) the ESM cost of assembling and recycling each menu.
Predicting Methane and PHB Yield from Crop Waste
We used the Biomass Characteristics and Biomethane Production Database (BCBPD) model [47] to predict the cumulative methane yield (CMY) from AD of crop waste generated by each menu. BCBPD was developed using an automated machine learning platform called a tree-based pipeline optimization tool that was applied to a dataset of more than 4,500 observations using eleven input predictor variables, of which nine were from feedstock characteristics and two were from digester operating conditions (Table 7). We ran the BCBPD model using published data on the feedstock characteristics of the crop waste streams of every ELS crop (Supplementary Information Section S4) with a digestion time of 30 days and an organic load of 30 g of volatile solids (VS)/L. The BCBPD model generated 30-day CMY values in mL/g-VS for each crop waste stream. Supplementary Information Section S4.1 contains an example calculation of methane and PHB yield from AD of the daily crop waste generated by one of our fully bioregenerative menus.
Costing Fully Bioregenerative Mars Menus
ESM is the weighted sum of the mass and energy requirements to operate a payload at a mission destination[42]. It is calculated by first identifying the mass [kg], pressurized volume [m3], power demand [kW], thermal control demand [kW], and crew labor time [h] to operate the payload, and then multiplying these values by equivalency factors defined in the NASA BVAD for a specific implementation scenario [31,42,48] to convert all requirements into common (mass) units [kg]. We used ESM to quantify the costs of: (i) growing the crops needed to assemble each astronaut menu (ESM of Cultivation); (ii) converting crop waste from each menu into methane by AD (ESM of AD); and (iii) converting methane to PHB in a microbial bioreactor (ESM of PHB Synthesis). Our ESM calculation method is detailed in Supplementary Information Section S5.1.
We define “loop closure” as the percentage of total mission PHB demand that is supplied by recycling crop waste generated by the astronaut food menus. Previous work at the NASA Center for the Utilization of Biological Engineering in Space identified total daily mission PHB demand as 200 g/day[29] or 6 kg/month. For each of the 45,116 menus, we calculated loop closure as the percentage of that 200 g/day or 6 kg/month PHB demand that could be supplied by PHB produced from recycling each menu’s crop waste via AD. Finally, we divided the total ESM cost for assembling and recycling the inedible biomass of a menu into PHB by the loop closure of each menu. This returned a single ESM per loop closure value for each menu, with lower values indicating better PHB return on energy investment for assembling and recycling that menu. Supplementary Information Section S6 contains an example calculation for loop closure and ESM per loop closure for one of our fully bioregenerative menus.
Distinguishing Fully Bioregenerative Mars Menus
We analyzed costs for all our 45,116 menus. However, we identified twelve menus that were most important to further analyze and evaluate. First, we put all menus into each of three categories as described below, and then sorted. In each category, we sorted our 45,116 menus according to:
- 1.
- nutritional precision, with all menus sorted in ascending order according to mean percentage difference between each menu’s achieved and target DRIs. We called this the Nutrient Focused menu category.
- 2.
- bioplastic production, with all menus sorted in descending order according to total loop closure. We called this the Bioplastic Focused menu category.
- 3.
- return on energy investment, with all menus sorted in ascending order according to ESM per unit loop closure. We called this the ESM Saver menu category.
We selected four menus from each category for comparison with published NASA menus. These menus were at or near the top of each category’s ordering. To ensure a diversity of crop composition to increase palatability, we selected menus that did not repeat the highest mass crops from each of the other three chosen menus in their category. That is, we selected the single top-ordered menu in each category, the next ordered menu in that category that did not have the highest mass crop of the top menu, the next ordered menu that did not have the highest mass crops of the preceding two menus, and the next ordered menu that did not have the highest mass crops of the preceding three menus. Thus, we obtained twelve menus from the original 45,116 menus that represented one of nutritional precision, PHB maximization, or ESM efficiency that could be compared with previously published NASA menus. Because two menus appeared in both Bioplastic Focused and ESM Saver categories, there were ten unique menus available for comparison.
Current NASA Mars Menus for Comparison with Fully Bioregenerative Mars Menus
The NASA 10-day vegetarian menu (Table S1A) [30], 10-day mixed commodity menu (Table S1B) [30], and 10-day bulk commodity (BVAD) menu (Table S1C) [31,49] are highly palatable and report the total mass of ELS crops, commodity foods, and prepared foods, respectively, that are needed to sustain these menus across a 600-day Mars mission with six astronauts (Table 8). However, only the BVAD menu reports the individual ingredients needed to assemble each daily meal, along with their masses, which makes ESM comparisons for the vegetarian and mixed commodity menus (that did not specify these values) challenging. To address this, we assumed that:
- 1.
- the only AD-compatible elements of the vegetarian and mixed-commodity menus were meals with a specific ELS crop listed in its name, e.g., “strawberry shortcake” must have strawberries, an ELS crop, as an ingredient, but “herb biscuit” does not have any ELS crops as an ingredient since none were declared in the meal name.
- 2.
- meal items that did not declare any ELS crop in their name, nor explicitly identified as shipped or prepared foods, were classified as commodity foods.
- 3.
- the individual mass of each declared ELS crop needed per day per six astronauts was estimated by dividing the total reported mass of ELS crops needed by the number of ELS crops.
Once we estimated the individual masses of each ELS crop needed to assemble the NASA Mars menus, we calculated methane yield [g/30d], PHB yield [g/30d], ESM of cultivation [kg], ESM of AD [kg], ESM of PHB synthesis [kg], and loop closure [%] identically to our fully bioregenerative menus. Additionally, the non-bioregenerative components of each NASA menu also incurred a separate ESM of Shipping [kg], to account for the cost to ship commodity foods, store the packaged foods, and so on, as detailed in Supplementary Information Section S5.2.
Supplementary Materials
The following supporting information can be downloaded at the website of this paper posted on Preprints.org.
Author Contributions
J.N.W.E., A.A.M., and A.D.M. conceptualized the research; J.N.W.E. and S.S.G. implemented the research and analyzed the data; H.S. developed the described algorithm; and J.N.W.E., C.P.N., P.C.P., A.A.M., and A.D.M. wrote this article.
Funding
This work was supported by funding from the Florida Department of Environmental Protection through the Hinkley Center for Solid and Hazardous Waste Management (grant number AGR DTD 7-6-2020), the University of Central Florida Space Research Institute (SRI) (grant number UCF01-0000381921), and the NASA Center for the Utilization of Biological Engineering in Space (award number NNX17AJ31G). The funders played no role in study design, data collection, analysis and interpretation of data, or the writing of this manuscript.
Data Availability Statement
All data supporting the findings of this study are available either directly in the article, Supplementary Information, or hosted on our public Github repository. All code used to generate our datasets is available on our public Github repository.
Use of Artificial Intelligence: Text
No use of AI. Images: AI was used to generate images for Figure 1 and 2. Code: AI was used to write scripts to automate Microsoft Excel calculations, convert author-generated Microsoft Excel tables to LaTeX format, and debug plotting code. No AI was used to develop the greedy algorithm.
Conflicts of Interest
The authors declare that they have no competing interests.
References
- Menezes, A.A.; Cumbers, J.; Hogan, J.A.; Arkin, A.P. Towards Synthetic Biological Approaches to Resource Utilization on Space Missions. J. R. Soc. Interface 2015, 12, 20140715. [Google Scholar] [CrossRef]
- Cumbers, J.; Rothchild, L. BISRU: Synthetic Microbes for Moon, Mars and Beyond. Proceedings of the Astrobiology Science Conference 2010: Evolution and Life: Surviving Catastrophes and Extremes on Earth and Beyond 2010, Vol. 1538, 5672. [Google Scholar]
- Montague, M.; McArthur, G.H., IV; Cockell, C.S.; Held, J.; Marshall, W.; Sherman, L.A.; Wang, N.; Nicholson, W.L.; Tarjan, D.R.; Cumbers, J. The Role of Synthetic Biology for in Situ Resource Utilization (ISRU). Astrobiology 2012, 12, 1135–1142. [Google Scholar] [CrossRef]
- Menezes, A.A.; Montague, M.G.; Cumbers, J.; Hogan, J.A.; Arkin, A.P. Grand Challenges in Space Synthetic Biology. J. R. Soc. Interface 2015, 12, 20150803. [Google Scholar] [CrossRef] [PubMed]
- Verseux, C.N.; Paulino-Lima, I.G.; Baqué, M.; Billi, D.; Rothschild, L.J. Synthetic Biology for Space Exploration: Promises and Societal Implications. In Ambivalences of Creating Life; Springer, 2016; pp. 73–100. [Google Scholar]
- Nangle, S.N.; Wolfson, M.Y.; Hartsough, L.; Ma, N.J.; Mason, C.E.; Merighi, M.; Nathan, V.; Silver, P.A.; Simon, M.; Swett, J.; et al. The Case for Biotech on Mars. Nat. Biotechnol. 2020, 38, 401–407. [Google Scholar] [CrossRef] [PubMed]
- Santomartino, R.; Averesch, N.J.H.; Bhuiyan, M.; Cockell, C.S.; Colangelo, J.; Gumulya, Y.; Lehner, B.; Lopez-Ayala, I.; McMahon, S.; Mohanty, A.; et al. Toward Sustainable Space Exploration: A Roadmap for Harnessing the Power of Microorganisms. Nat. Commun. 2023, 14, 1391. [Google Scholar] [CrossRef] [PubMed]
- Vora, T.J.; Averesch, N.J.; DeBenedictis, E.A.; Rothschild, L.J. Space synthetic biology: A paradigm for sustainability on Earth and beyond. New Space 2024, 12, 252–258. [Google Scholar] [CrossRef]
- Onofri, S.; Moeller, R.; Billi, D.; Balsamo, M.; Becker, A.; Benvenuto, E.; Cassaro, A.; Catanzaro, I.; Cockell, C.S.; Desiderio, A.; et al. Synthetic biology for space exploration. npj Microgravity 2025, 11, 41. [Google Scholar] [CrossRef]
- Berliner, A.J.; Hilzinger, J.M.; Abel, A.J.; McNulty, M.J.; Makrygiorgos, G.; Averesch, N.J.H.; Sen Gupta, S.; Benvenuti, A.; Caddell, D.F.; Cestellos-Blanco, S.; et al. Towards a Biomanufactory on Mars. Front. Astron. Space Sci. 2021, 8, 711550. [Google Scholar] [CrossRef]
- Berliner, A.J.; Lipsky, I.; Ho, D.; Hilzinger, J.M.; Vengerova, G.; Makrygiorgos, G.; McNulty, M.J.; Yates, K.; Averesch, N.J.H.; Cockell, C.S.; et al. Space Bioprocess Engineering on the Horizon. Commun. Eng. 2022, 1, 13. [Google Scholar] [CrossRef]
- Averesch, N.J.H.; Berliner, A.J.; Nangle, S.N.; Zezulka, S.; Vengerova, G.L.; Ho, D.; Casale, C.A.; Lehner, B.A.E.; Snyder, J.E.; Clark, K.B.; et al. Microbial Biomanufacturing for Space Exploration—What to Take and When to Make. Nat. Commun. 2023, 14, 2311. [Google Scholar] [CrossRef] [PubMed]
- Chynoweth, D.; Haley, P.; Owens, J.; Teixeira, A.; Welt, B.; Rich, E.; Townsend, T.; Choi, H.L. Anaerobic Digestion for Reduction and Stabilization of Organic Solid Waste During Space Missions: Laboratory Studies. In Proceedings of the 32nd International Conference on Environmental Systems, 2002; p. 2002-01-2351. [Google Scholar]
- Xu, Q.; Townsend, T.; Chynoweth, D.; Haley, P.; Owens, J.; Rich, E.; Maxwell, S.; Choi, H.L. Anaerobic Digestion for Reduction and Stabilization of Organic Solid Waste During Space Missions: Systems Analysis. In Proceedings of the 32nd International Conference on Environmental Systems, 2002; p. 2002-01-2521. [Google Scholar]
- Lissens, G.; Verstraete, W.; Albrecht, T.; Brunner, G.; Creuly, C.; Seon, J.; Dussap, G.; Lasseur, C. Advanced Anaerobic Bioconversion of Lignocellulosic Waste for Bioregenerative Life Support Following Thermal Water Treatment and Biodegradation by Fibrobacter succinogenes. Biodegradation 2004, 15, 173–183. [Google Scholar] [CrossRef] [PubMed]
- Chynoweth, D.; Owens, J.; Teixeira, A.; Pullammanappallil, P.; Luniya, S. Anaerobic digestion of space mission wastes. Water Science and Technology 2006, 53, 177–185. [Google Scholar] [CrossRef] [PubMed]
- Dhoble, A.S.; Pullammanappallil, P.C. Design and Operation of an Anaerobic Digester for Waste Management and Fuel Generation During Long-Term Lunar Mission. Adv. Space Res. 2014, 54, 1502–1512. [Google Scholar] [CrossRef]
- Yang, Z.; Larsen, O.C.; Muhayodin, F.; Hu, J.; Xue, B.; Rotter, V.S. Review of Anaerobic Digestion Models for Organic Solid Waste Treatment With a Focus on the Fates of C, N, and P. Energy Ecol. Environ. 2025, 10, 1–14. [Google Scholar] [CrossRef]
- Hintze, P.; Santiago-Maldonado, E.; Kulis, M.; Lytle, J.; Fisher, J.; Lee, J.; Vaccaro, H.; Ewert, M.; Broyan, J. Trash to Supply Gas (TtSG) Project Overview. In Proceedings of the AIAA SPACE 2012 Conference and Exposition, 2012; p. 5254. [Google Scholar]
- Linne, D.L.; Palaszewski, B.A.; Gokoglu, S.A.; Balasubramaniam, B.; Hegde, U.G.; Gallo, C. Waste Management Options for Long-Duration Space Missions: When to Reject, Reuse, or Recycle. In Proceedings of the 7th Symposium on Space Resource Utilization, 2014; p. 0497. [Google Scholar]
- Cestellos-Blanco, S.; Friedline, S.; Sander, K.B.; Abel, A.J.; Kim, J.M.; Clark, D.S.; Arkin, A.P.; Yang, P. Production of PHB from CO2-derived acetate with minimal processing assessed for space biomanufacturing. Frontiers in microbiology 2021, 12, 700010. [Google Scholar] [CrossRef]
- Lee, H.; Diao, J.; Tian, Y.; Guleria, R.; Lee, E.; Smith, A.; Savage, M.; Yeh, D.; Roberson, L.; Blenner, M.; et al. Developing an alternative medium for in-space biomanufacturing. Nature Communications 2025, 16, 728. [Google Scholar] [CrossRef]
- Liu, X.; Pataranutaporn, P.; Fram, B.; Werner, A.Z.; Sharma, S.; Gauthier, N.P.; Erickson, E.; Chwalek, P.; Ramirez, K.J.; Ingraham, M.A.; et al. Development and flight-testing of modular autonomous cultivation systems for biological plastics upcycling aboard the ISS. npj Microgravity 2025, 11, 23. [Google Scholar] [CrossRef]
- Myung, J.; Flanagan, J.C.A.; Waymouth, R.M.; Criddle, C.S. Expanding the Range of Polyhydroxyalkanoates Synthesized by Methanotrophic Bacteria Through the Utilization of Omega-Hydroxyalkanoate Co-Substrates. AMB Express 2017, 7, 118. [Google Scholar] [CrossRef]
- Keskin, G.; Kızıl, G.; Bechelany, M.; Pochat-Bohatier, C.; Öner, M. Potential of Polyhydroxyalkanoate (PHA) Polymer Family as Substitutes of Petroleum-Based Polymers for Packaging Applications and Solutions Brought by Their Composites to Form Barrier Materials. Pure Appl. Chem. 2017, 89, 1841–1848. [Google Scholar] [CrossRef]
- Abu Bakar, A.A.; Zainuddin, M.Z.; Abdullah, S.M.; Tamchek, N.; Mohd Noor, I.S.; Alauddin, M.S.; Alforidi, A.; Mohd Ghazali, M.I. The 3D Printability and Mechanical Properties of Polyhydroxybutyrate (PHB) as Additives in Urethane Dimethacrylate (UDMA) Blends Polymer for Medical Application. Polymers 2022, 14, 4518. [Google Scholar] [CrossRef]
- McAdam, B.; Brennan Fournet, M.; McDonald, P.; Mojicevic, M. Production of Polyhydroxybutyrate (PHB) and Factors Impacting Its Chemical and Mechanical Characteristics. Polymers 2020, 12, 2908. [Google Scholar] [CrossRef]
- Iglesias-Montes, M.L.; Soccio, M.; Luzi, F.; Puglia, D.; Gazzano, M.; Lotti, N.; Manfredi, L.B.; Cyras, V.P. Evaluation of the Factors Affecting the Disintegration Under a Composting Process of Poly(Lactic Acid)/Poly(3-Hydroxybutyrate) (PLA/PHB) Blends. Polymers 2021, 13, 3171. [Google Scholar] [CrossRef] [PubMed]
- Benvenuti, A.J.; Drecksler, S.R.; Sen Gupta, S.; Menezes, A.A. Design of Anaerobic Digestion Systems for Closed-Loop Space Biomanufacturing. In Proceedings of the Proceedings of the 50th International Conference on Environmental Systems, 2020; p. number ICES-2020-498. [Google Scholar]
- Cooper, M.R.; Catauro, P.; Perchonok, M. Development and Evaluation of Bioregenerative Menus for Mars Habitat Missions. Acta Astronaut. 2012, 81, 555–562. [Google Scholar] [CrossRef]
- Ewert, M.K.; Chen, T.T.; Powell, C.D. Life Support Baseline Values and Assumptions Document. Technical Report NASA/TP-2015–218570/REV2, NASA, 2022.
- Baroni, L.; Cenci, L.; Tettamanti, M.; Berati, M. Evaluating the Environmental Impact of Various Dietary Patterns Combined With Different Food Production Systems. Eur. J. Clin. Nutr. 2007, 61, 279–286. [Google Scholar] [CrossRef] [PubMed]
- Shepon, A.; Eshel, G.; Noor, E.; Milo, R. The Opportunity Cost of Animal-Based Diets Exceeds All Food Losses. Proc. Natl. Acad. Sci. U. S. A. 2018, 115, 3804–3809. [Google Scholar] [CrossRef]
- Springmann, M.; Clark, M.; Mason-D’Croz, D.; Wiebe, K.; Bodirsky, B.L.; Lassaletta, L.; de Vries, W.; Vermeulen, S.J.; Herrero, M.; Carlson, K.M.; et al. Options for Keeping the Food System Within Environmental Limits. Nature 2018, 562, 519–525. [Google Scholar] [CrossRef]
- Xu, X.; Sharma, P.; Shu, S.; Lin, T.S.; Ciais, P.; Tubiello, F.N.; Smith, P.; Campbell, N.; Jain, A.K. Global Greenhouse Gas Emissions From Animal-Based Foods Are Twice Those of Plant-Based Foods. Nat. Food 2021, 2, 724–732. [Google Scholar] [CrossRef]
- Scarborough, P.; Clark, M.; Cobiac, L.; Papier, K.; Knuppel, A.; Lynch, J.; Harrington, R.; Key, T.; Springmann, M. Vegans, Vegetarians, Fish-Eaters and Meat-Eaters in the UK Show Discrepant Environmental Impacts. Nat. Food 2023, 4, 565–574. [Google Scholar] [CrossRef]
- Antony, A.C. Vegetarianism and Vitamin B-12 (Cobalamin) Deficiency. Am. J. Clin. Nutr. 2003, 78, 3–6. [Google Scholar] [CrossRef]
- Dawczynski, C.; Weidauer, T.; Richert, C.; Schlattmann, P.; Dawczynski, K.; Kiehntopf, M. Nutrient Intake and Nutrition Status in Vegetarians and Vegans in Comparison to Omnivores—The Nutritional Evaluation (NuEva) Study. Front. Nutr. 2022, 9, 819106. [Google Scholar] [CrossRef]
- Waldmann, A.; Koschizke, J.W.; Leitzmann, C.; Hahn, A. Dietary Intakes and Lifestyle Factors of a Vegan Population in Germany: Results From the German Vegan Study. Eur. J. Clin. Nutr. 2003, 57, 947–955. [Google Scholar] [CrossRef] [PubMed]
- Segovia-Siapco, G.; Sabaté, J. Health and Sustainability Outcomes of Vegetarian Dietary Patterns: A Revisit of the EPIC-Oxford and the Adventist Health Study-2 Cohorts. Eur. J. Clin. Nutr. 2019, 72, 60–70. [Google Scholar] [CrossRef] [PubMed]
- Sakkas, H.; Bozidis, P.; Touzios, C.; Kolios, D.; Athanasiou, G.; Athanasopoulou, E.; Gerou, I.; Gartzonika, C. Nutritional Status and the Influence of the Vegan Diet on the Gut Microbiota and Human Health. Medicina 2020, 56, 88. [Google Scholar] [CrossRef]
- Levri, J.A.; Drysdale, A.E.; Ewert, M.K.; Fisher, J.W.; Hanford, A.J.; Hogan, J.A.; Jones, H.W.; Joshi, J.A.; Vaccari, D.A. Advanced Life Support Equivalent System Mass Guidelines Document. NASA Ames Research Center 2003.
- Nickerson, C.A.; Ott, C.M.; Wilson, J.W.; Ramamurthy, R.; Pierson, D.L. Microbial Responses to Microgravity and Other Low-Shear Environments. Microbiol. Mol. Biol. Rev. 2004, 68, 345–361. [Google Scholar] [CrossRef]
- Foster, J.S.; Wheeler, R.M.; Pamphile, R. Host-Microbe Interactions in Microgravity: Assessment and Implications. Life 2014, 4, 250–266. [Google Scholar] [CrossRef]
- Zea, L.; Prasad, N.; Levy, S.E.; Stodieck, L.; Jones, A.; Shrestha, S.; Klaus, D. A Molecular Genetic Basis Explaining Altered Bacterial Behavior in Space. PLoS One 2016, 11, e0164359. [Google Scholar] [CrossRef]
- Zea, L.; Larsen, M.; Estante, F.; Qvortrup, K.; Moeller, R.; Dias de Oliveira, S.; Stodieck, L.; Klaus, D. Phenotypic Changes Exhibited by E. coli Cultured in Space. Front. Microbiol. 2017, 8, 1598. [Google Scholar] [CrossRef]
- Song, C.; Cai, F.; Yang, S.; Wang, L.; Liu, G.; Chen, C. Machine Learning-Based Prediction of Methane Production From Lignocellulosic Wastes. Bioresour. Technol. 2024, 393, 129953. [Google Scholar] [CrossRef]
- Ho, D.; Makrygiorgos, G.; Hill, A.; Berliner, A.J. Towards an Extension of Equivalent System Mass for Human Exploration Missions on Mars. NPJ Microgravity 2022, 8, 30. [Google Scholar] [CrossRef]
- French, S.J.; Perchonok, M.H. Evaluation of a 10-Day Menu Using a Bulk Commodity Supply Scenario. NASA Technical Report JSC-63366, NASA Lyndon B. Johnson Space Center, Houston, Texas, 2006.
Figure 1.
Life support elements that must be jointly optimized to bolster PHB supply chains. (A) Crops selected for astronaut menus will enable PHB production. (B) A DALL-E-generated impression of our bioplastic production approach. First, a control scheme (e.g., an offline, pre-mission, greedy algorithm) tailors crop cultivation to meet crew dietary reference intakes (DRIs) and to minimize overall cost. Next, this cultivation scheme is implemented in a space farm. Thereafter, AD mineralizes crop waste into methane. Finally, methanotrophic bacteria convert this AD-sourced methane into PHB for downstream 3D-printing.
Figure 1.
Life support elements that must be jointly optimized to bolster PHB supply chains. (A) Crops selected for astronaut menus will enable PHB production. (B) A DALL-E-generated impression of our bioplastic production approach. First, a control scheme (e.g., an offline, pre-mission, greedy algorithm) tailors crop cultivation to meet crew dietary reference intakes (DRIs) and to minimize overall cost. Next, this cultivation scheme is implemented in a space farm. Thereafter, AD mineralizes crop waste into methane. Finally, methanotrophic bacteria convert this AD-sourced methane into PHB for downstream 3D-printing.
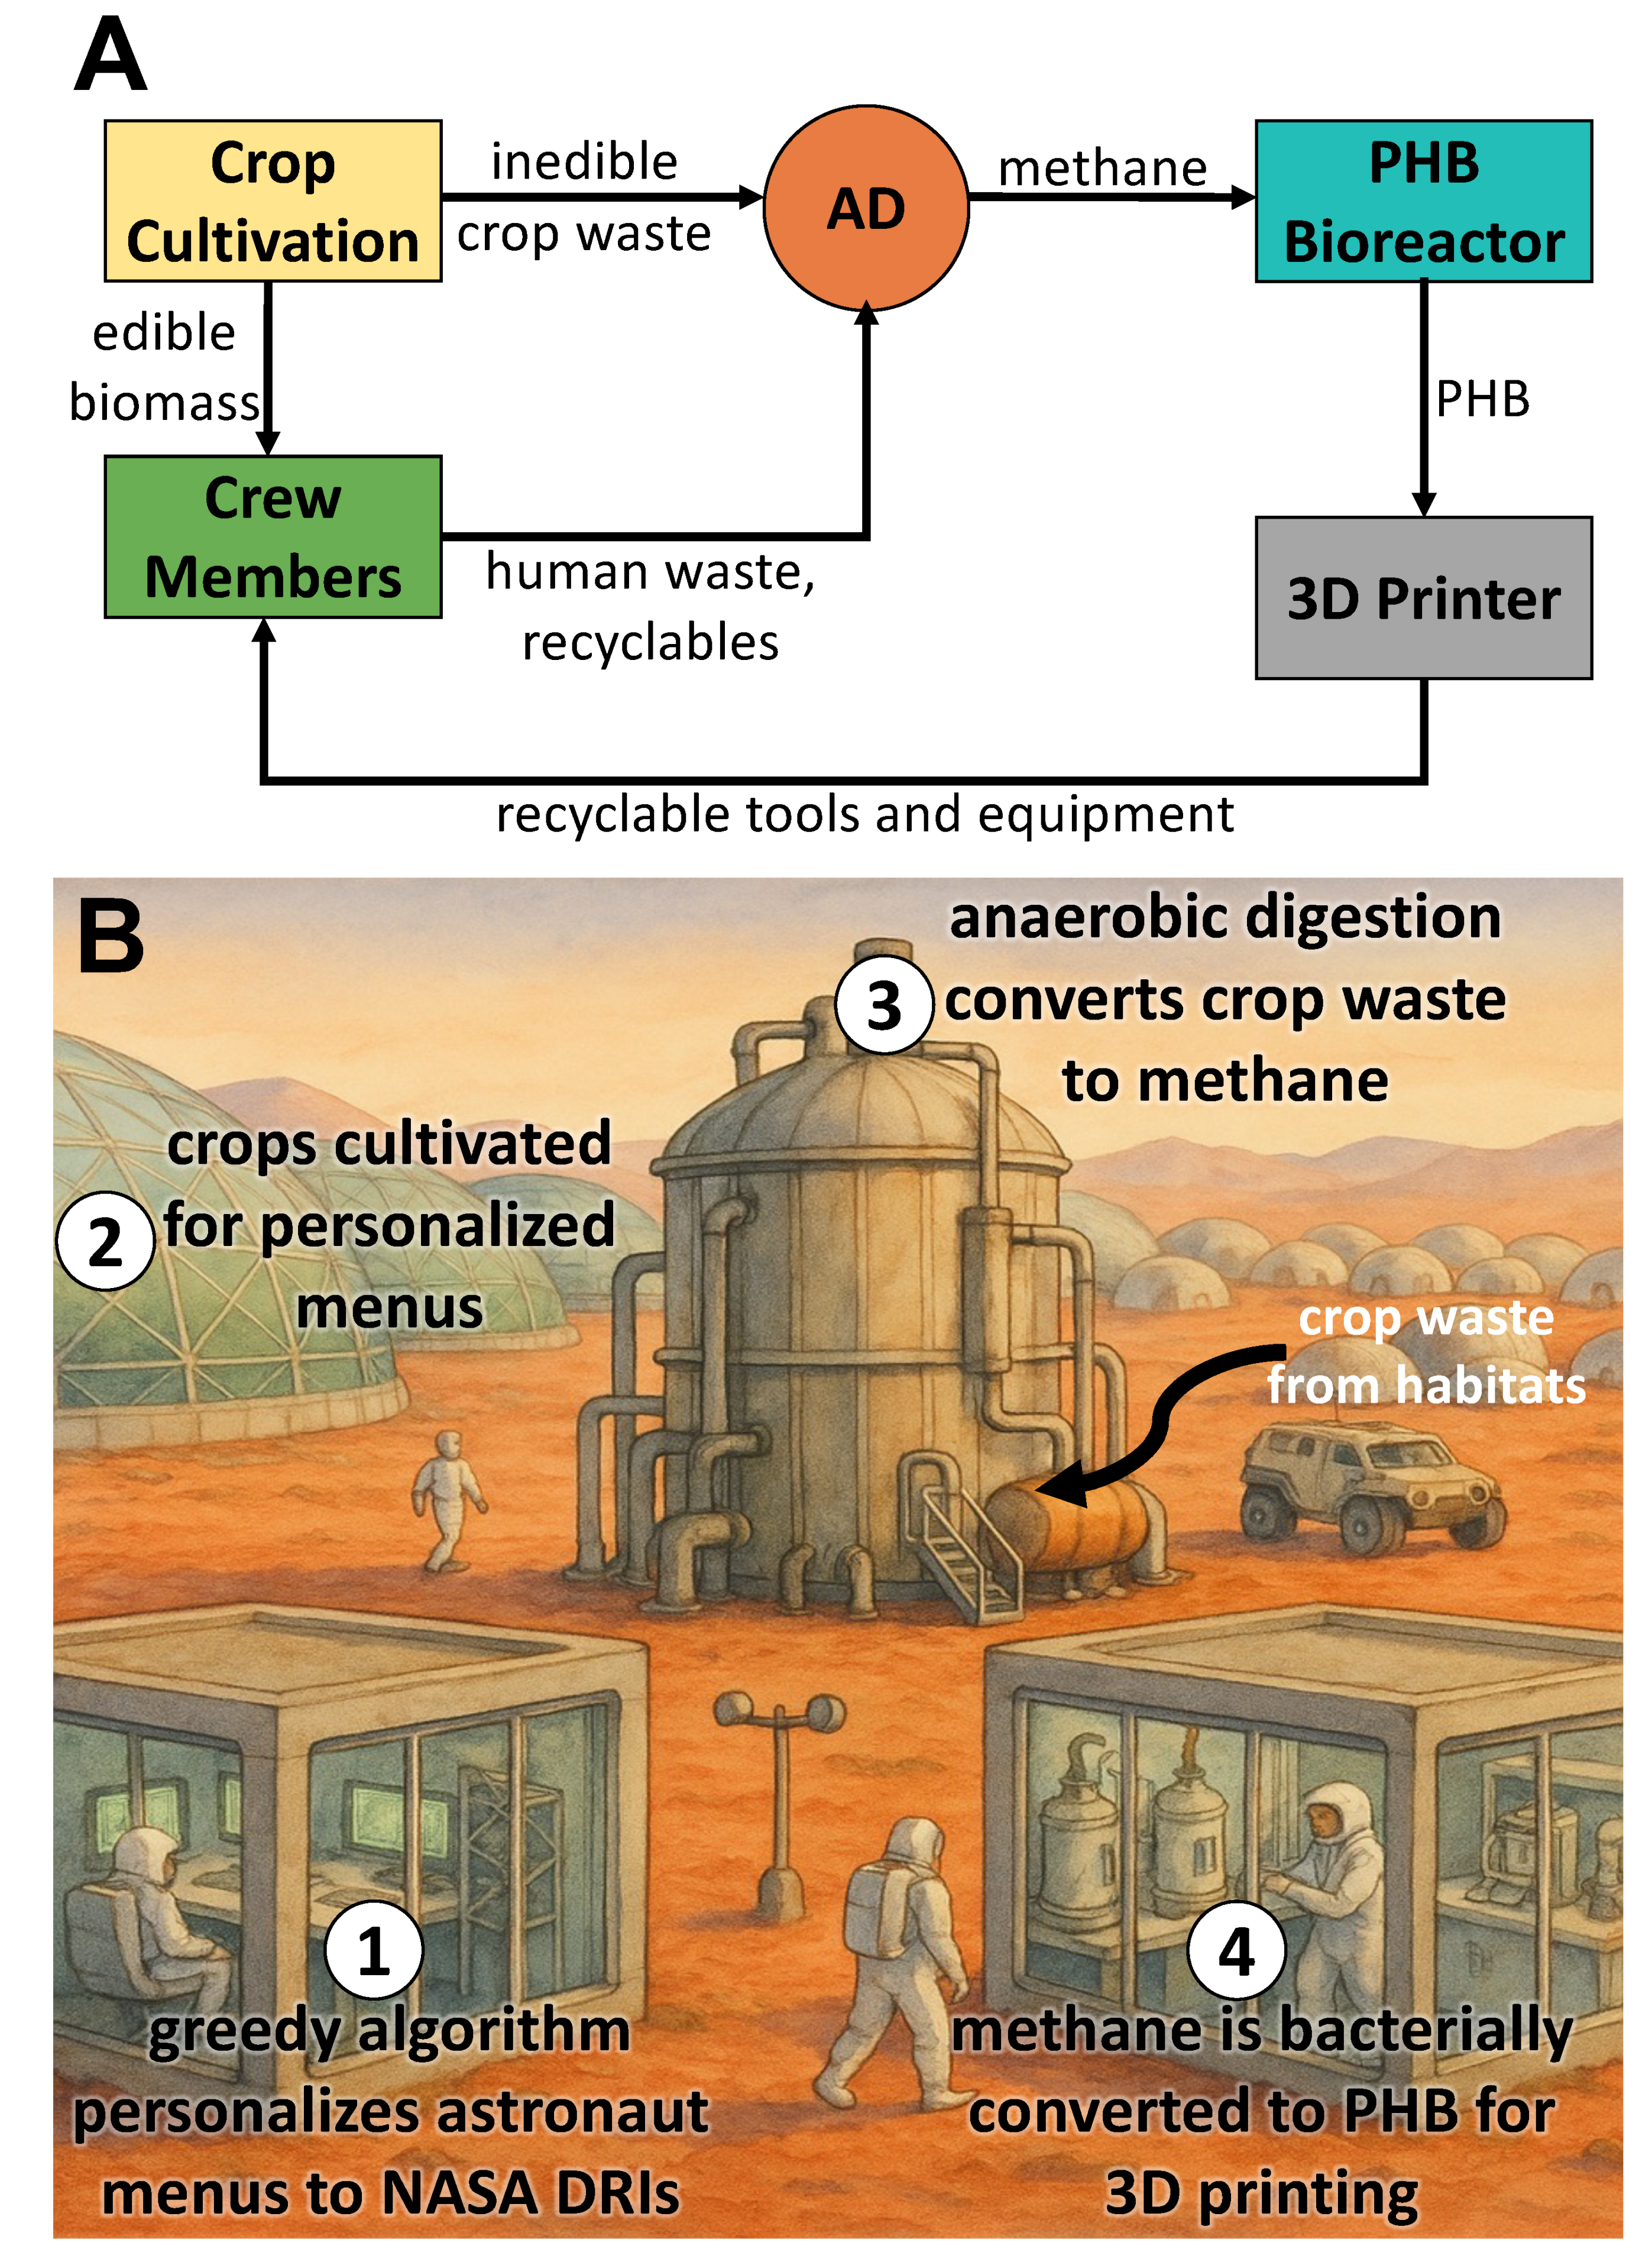
Figure 2.
Existing astronaut menus incorporate foods beyond ELS crops (images generated by DALL-E). (A) Current Mars mission food menus are tailored for astronaut nutrition and taste, but are too complex to be synthesized only from crops that are currently anticipated to constitute a rudimentary circular Mars bioeconomy. (B) Fully bioregenerative food menus can instead be constructed solely from ELS crops, and processed with utensils that are 3D printed from biodegradable resins such as PHB.
Figure 2.
Existing astronaut menus incorporate foods beyond ELS crops (images generated by DALL-E). (A) Current Mars mission food menus are tailored for astronaut nutrition and taste, but are too complex to be synthesized only from crops that are currently anticipated to constitute a rudimentary circular Mars bioeconomy. (B) Fully bioregenerative food menus can instead be constructed solely from ELS crops, and processed with utensils that are 3D printed from biodegradable resins such as PHB.
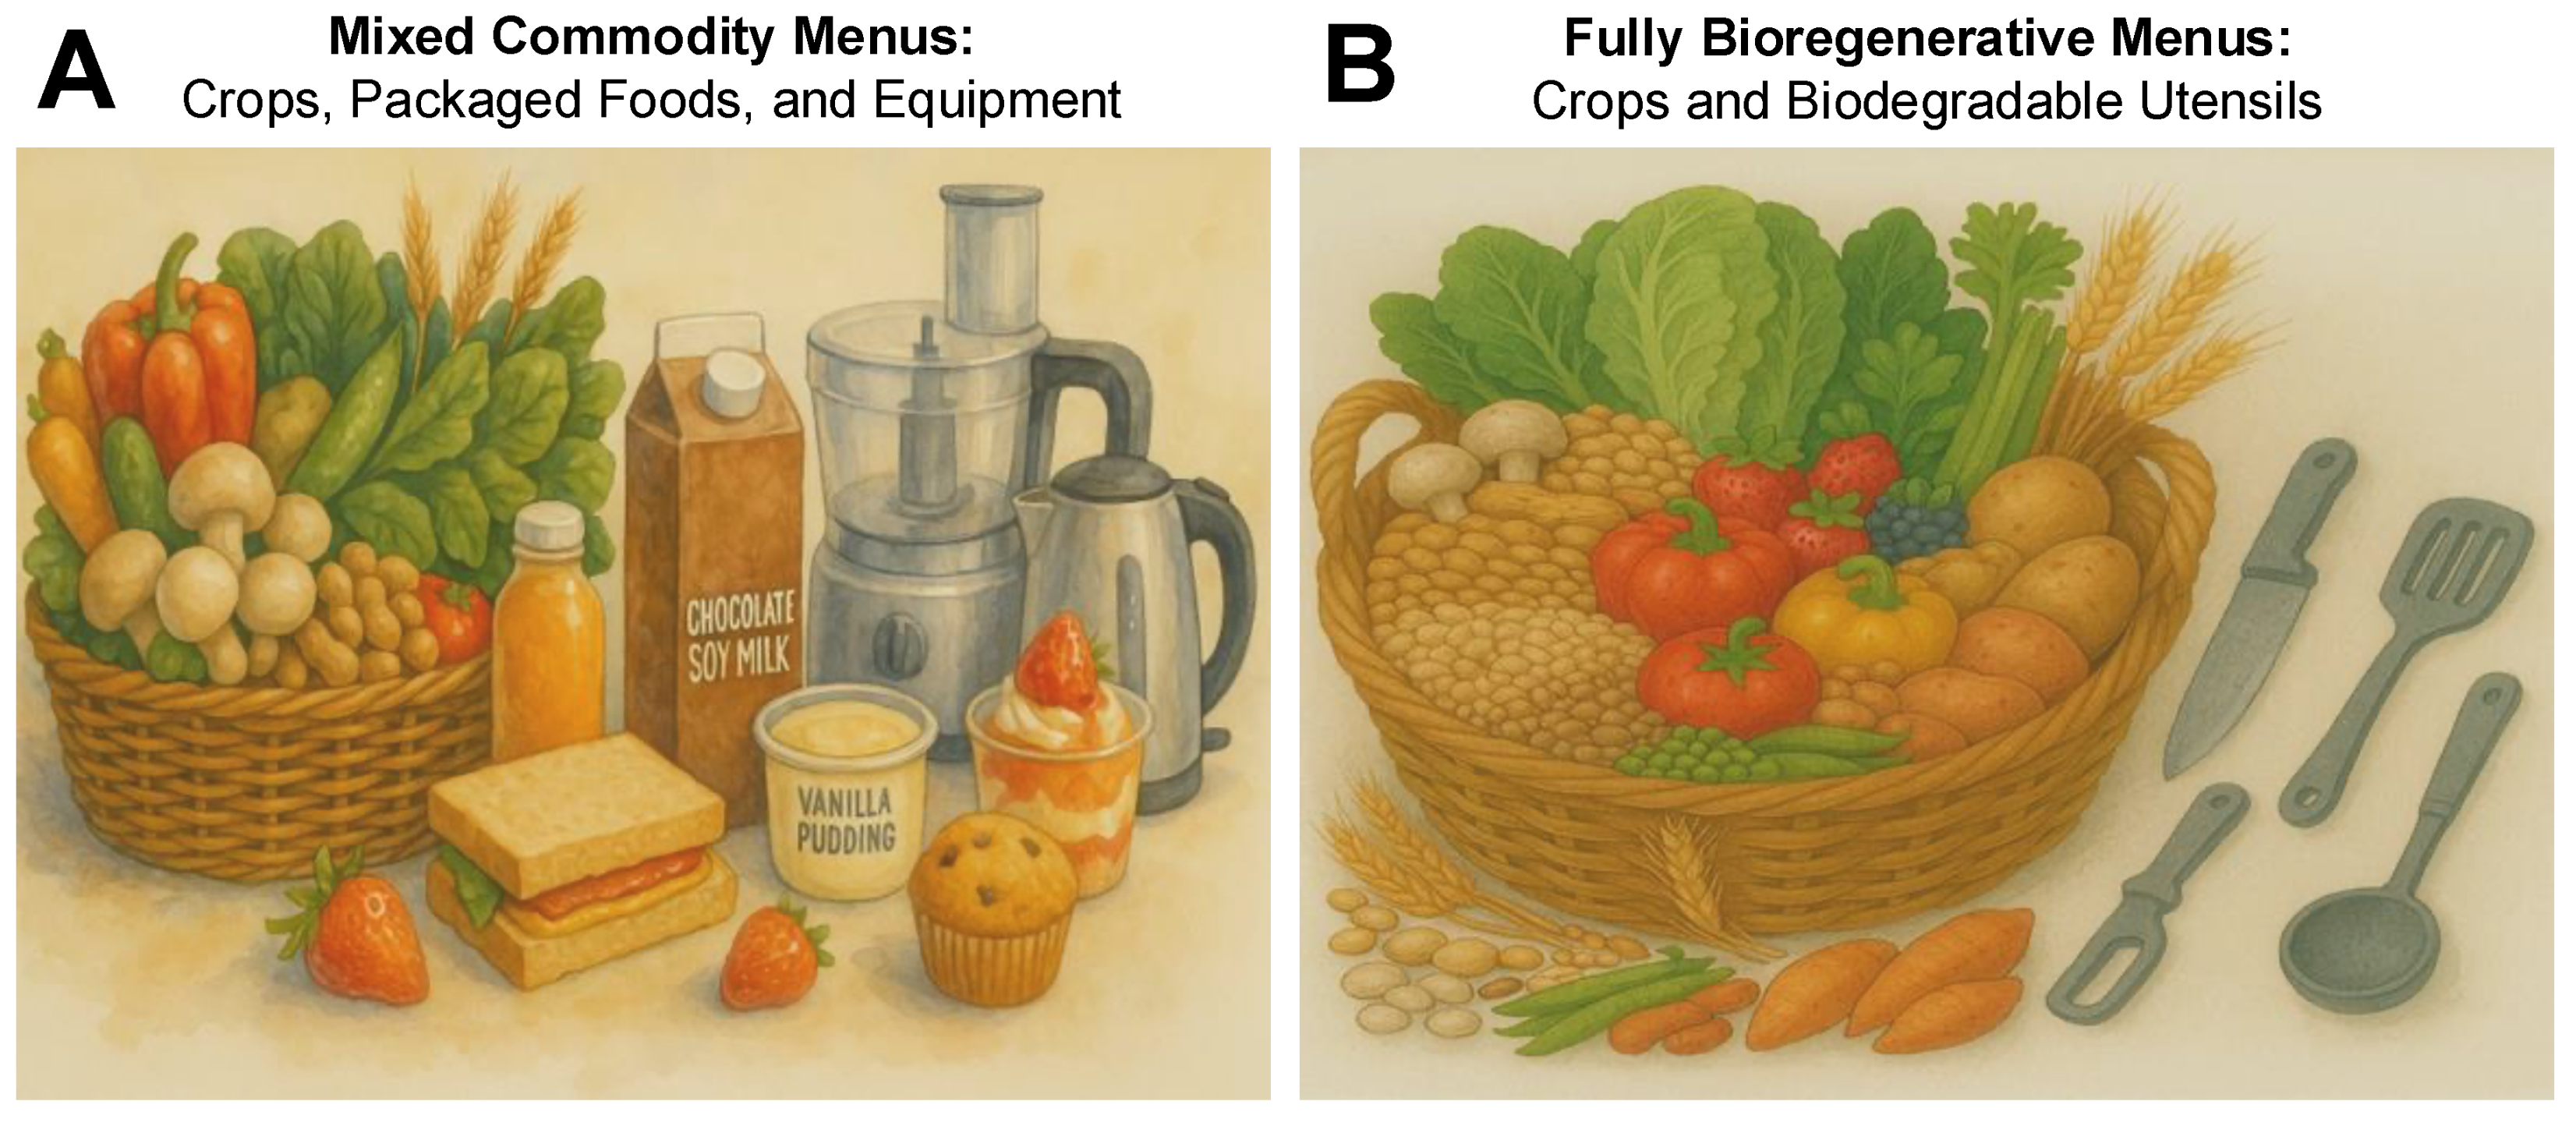
Figure 3.
Distribution of nutritional precision and ESM per loop closure of our 45,116 fully bioregenerative menus. (A) Over 5,000 menus simultaneously fulfilled all five nutrition targets within 1-2% while contributing up to (B) nine times over the daily mission PHB demand. (C) Distribution of the highest-mass crop in each menu.
Figure 3.
Distribution of nutritional precision and ESM per loop closure of our 45,116 fully bioregenerative menus. (A) Over 5,000 menus simultaneously fulfilled all five nutrition targets within 1-2% while contributing up to (B) nine times over the daily mission PHB demand. (C) Distribution of the highest-mass crop in each menu.
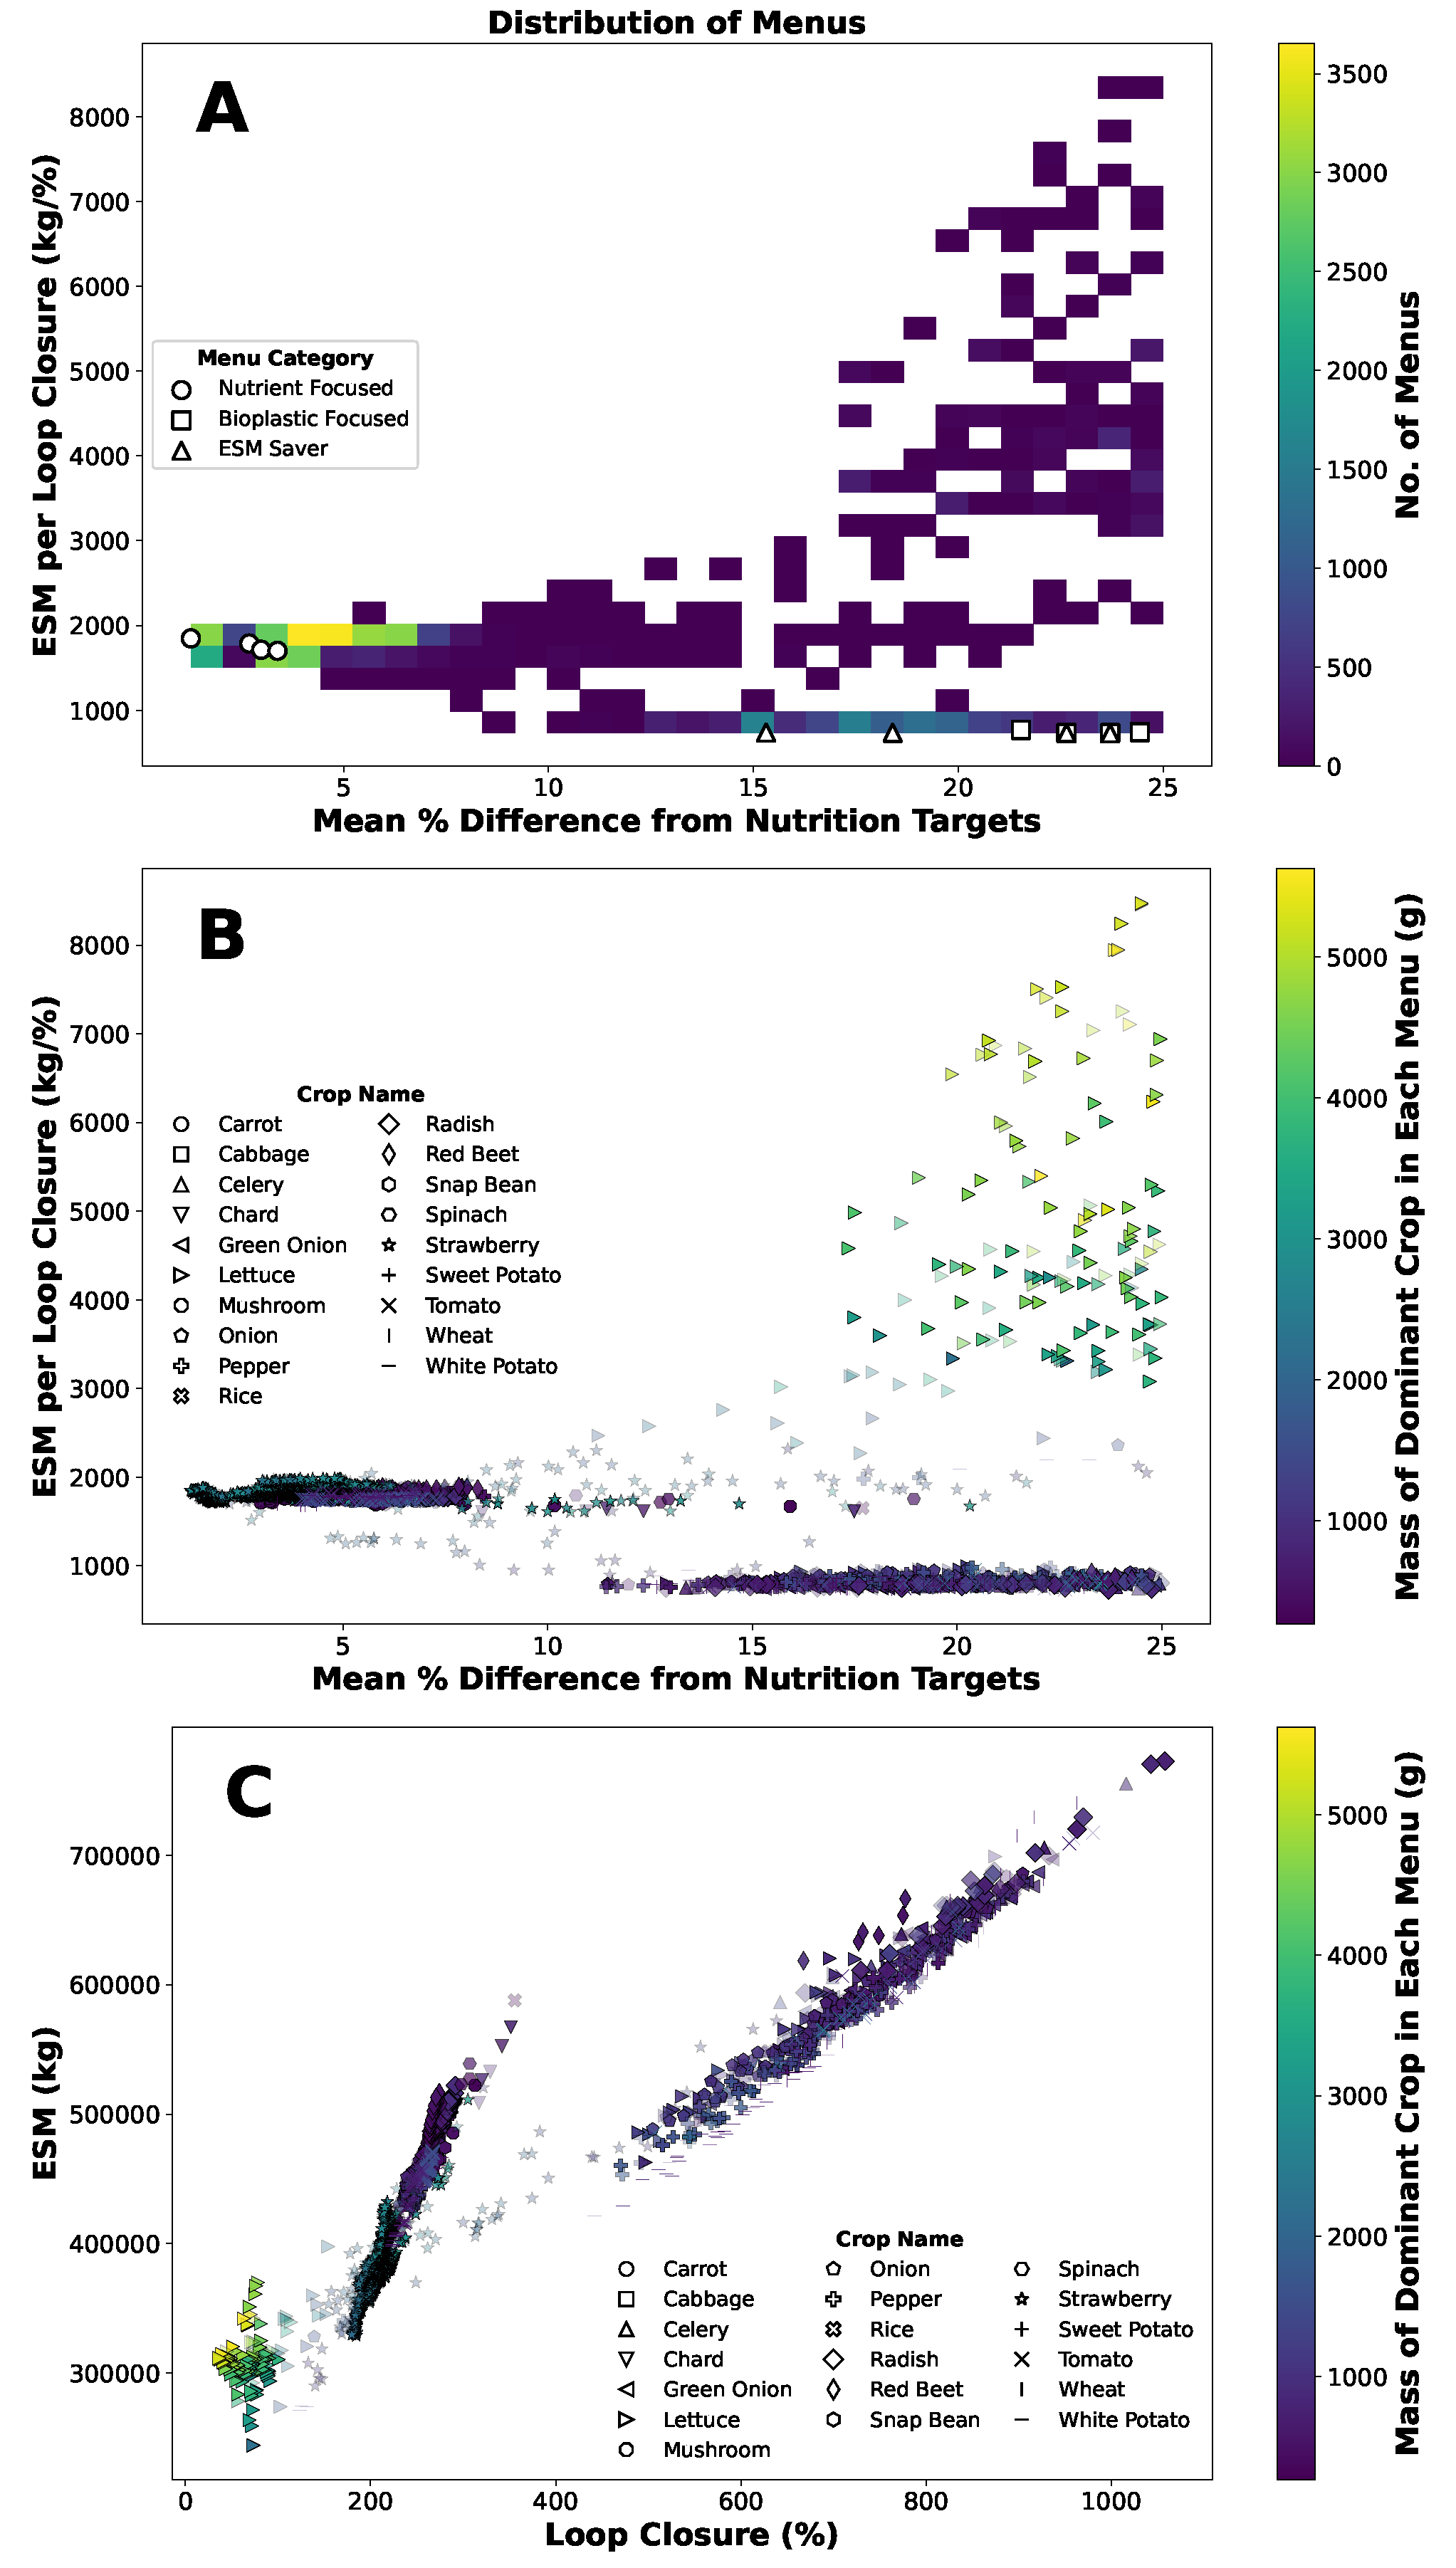
Figure 4.
Four selected Nutrient Focused menus. (A) Nutrient Focused Menu 1 achieved the lowest mean percentage difference across all five target astronaut DRIs, within 1% for carbohydrates, fat, dietary fiber, and energy, while protein was only +3.8% above target. (B) Nutrient Focused Menu 2 achieved the next best mean deviation from all five DRIs without including strawberries, the highest mass crop from Menu 1. Carbohydrates, fat, and energy were within 1% of targets, while fiber and protein were +2.5% and +9.8% above targets, respectively. (C) Nutrient Focused Menu 3 achieved the next best mean deviation from all five DRIs, while omitting both strawberries and green onions, the highest mass crops from Menus 1 and 2. Carbohydrate, fat, and energy content remained within 1% of its target DRIs, with fiber and protein content similar to Menu 2, at +2.7% and +10.8% and above their target DRIs, respectively. (D) Nutrient Focused Menu 4 achieved the next best mean deviation from all five DRIs, while omitting strawberries, green onions, and carrots, the highest mass crops from Menus 1, 2, and 3. Carbohydrate, fat, and energy content were within 1% of target DRIs, while protein and fiber content slightly worsened to +11.6% and +3.9% over their targets, respectively.
Figure 4.
Four selected Nutrient Focused menus. (A) Nutrient Focused Menu 1 achieved the lowest mean percentage difference across all five target astronaut DRIs, within 1% for carbohydrates, fat, dietary fiber, and energy, while protein was only +3.8% above target. (B) Nutrient Focused Menu 2 achieved the next best mean deviation from all five DRIs without including strawberries, the highest mass crop from Menu 1. Carbohydrates, fat, and energy were within 1% of targets, while fiber and protein were +2.5% and +9.8% above targets, respectively. (C) Nutrient Focused Menu 3 achieved the next best mean deviation from all five DRIs, while omitting both strawberries and green onions, the highest mass crops from Menus 1 and 2. Carbohydrate, fat, and energy content remained within 1% of its target DRIs, with fiber and protein content similar to Menu 2, at +2.7% and +10.8% and above their target DRIs, respectively. (D) Nutrient Focused Menu 4 achieved the next best mean deviation from all five DRIs, while omitting strawberries, green onions, and carrots, the highest mass crops from Menus 1, 2, and 3. Carbohydrate, fat, and energy content were within 1% of target DRIs, while protein and fiber content slightly worsened to +11.6% and +3.9% over their targets, respectively.
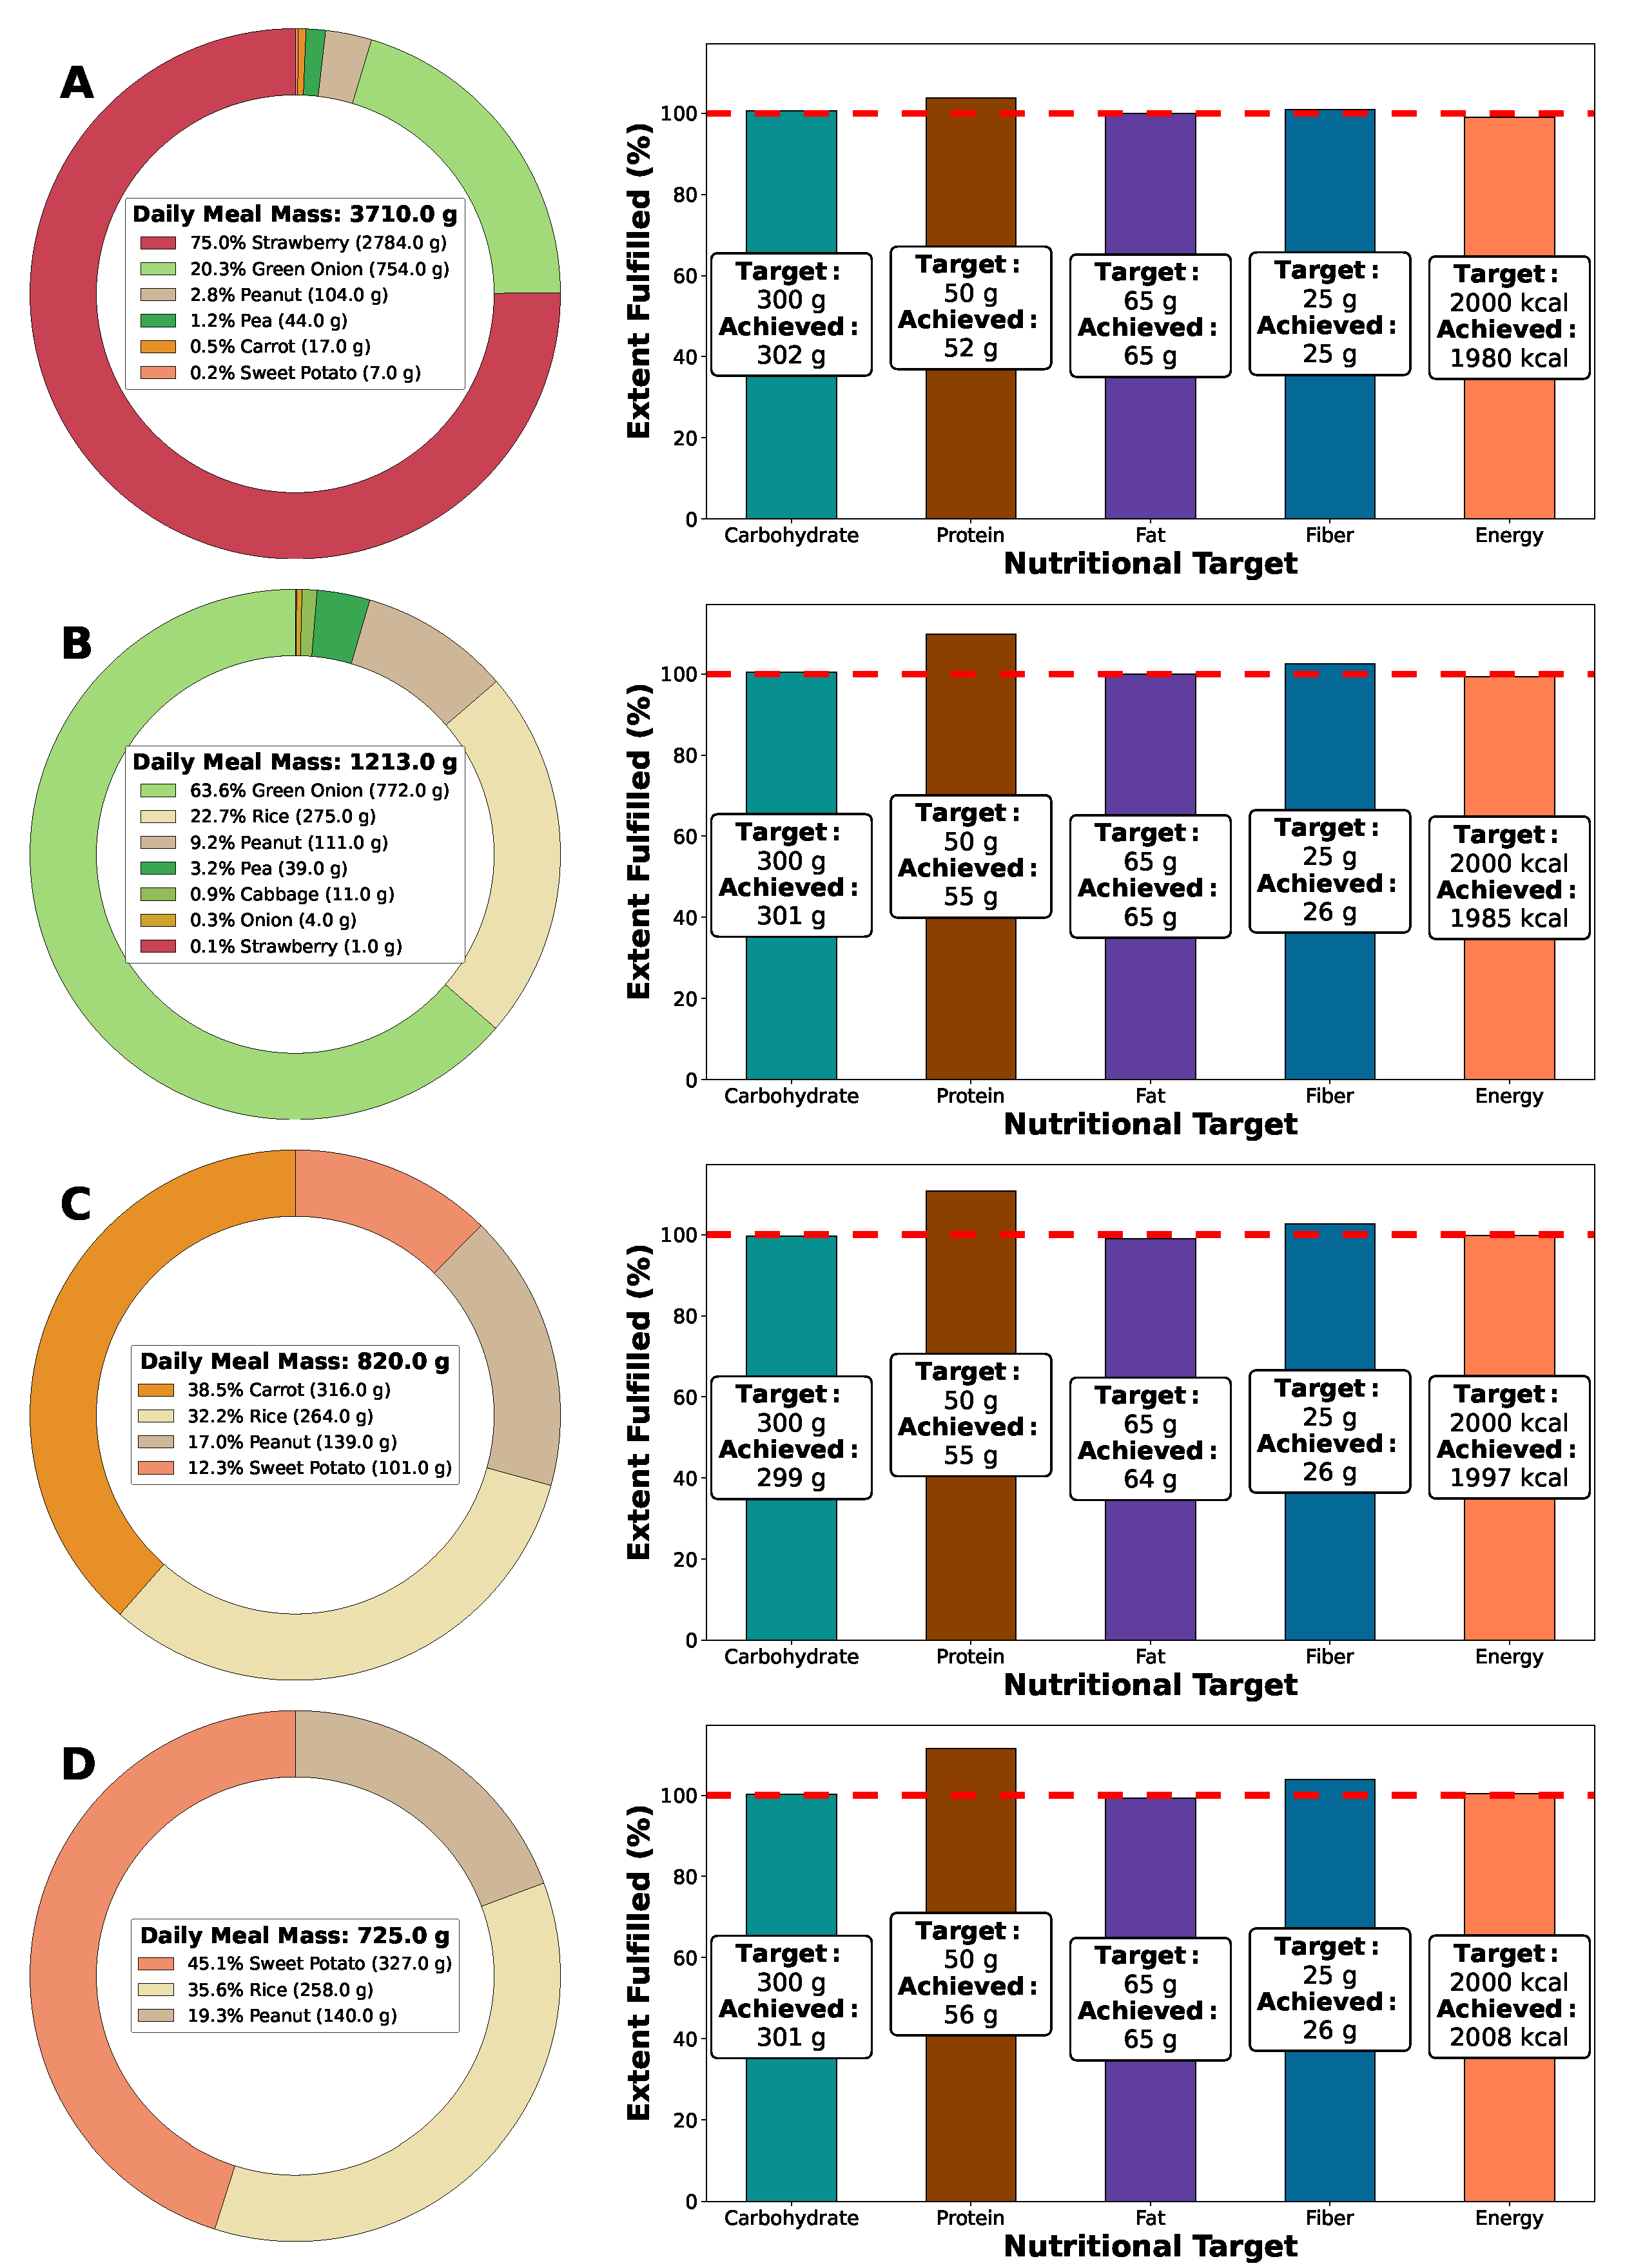
Figure 5.
Four selected Bioplastic Focused menus. (A) Bioplastic Focused Menu 1 achieved the highest loop closure, with fat content within 1% of target, and energy content at 11.0% above target. Carbohydrate and fiber content fared worse, at +16.6% and +18.5% above their targets, respectively. Protein content was overfilled the most of all five DRIs, at +71.6% above target. (B) Bioplastic Focused Menu 2 achieved the next best loop closure, without including radishes, the highest mass crop from Menu 1. Fat content remained stable at only -0.8% below target. Carbohydrate, protein, and energy content improved to +13.7%, +70.0%, and +8.80% above their targets, respectively. However, fiber content increased to +28.9% above target. (C) Bioplastic Focused Menu 3 achieved the next best loop closure while omitting both radishes and wheat, the highest mass crops from Menus 1 and 2. This menu had slightly worse DRIs for carbohydrate and energy content, at +17.1% and 12.0%, respectively, while protein and fiber content improved to +67.8% and +15.7% above target, respectively. Fat content remained stable at -0.6% from target. (D) Bioplastic Focused Menu 4 achieved the next best loop closure while omitting radishes, wheat, and celery, the highest mass crops from Menus 1, 2 and 3. This menu had the best carbohydrate, protein, and energy content of the four Bioplastic Focused menus, at +12.7%, +66.5% and +8.4% above their targets, respectively. Fat content remained stable at -0.8% from target, while fiber increased to +19.3% above target.
Figure 5.
Four selected Bioplastic Focused menus. (A) Bioplastic Focused Menu 1 achieved the highest loop closure, with fat content within 1% of target, and energy content at 11.0% above target. Carbohydrate and fiber content fared worse, at +16.6% and +18.5% above their targets, respectively. Protein content was overfilled the most of all five DRIs, at +71.6% above target. (B) Bioplastic Focused Menu 2 achieved the next best loop closure, without including radishes, the highest mass crop from Menu 1. Fat content remained stable at only -0.8% below target. Carbohydrate, protein, and energy content improved to +13.7%, +70.0%, and +8.80% above their targets, respectively. However, fiber content increased to +28.9% above target. (C) Bioplastic Focused Menu 3 achieved the next best loop closure while omitting both radishes and wheat, the highest mass crops from Menus 1 and 2. This menu had slightly worse DRIs for carbohydrate and energy content, at +17.1% and 12.0%, respectively, while protein and fiber content improved to +67.8% and +15.7% above target, respectively. Fat content remained stable at -0.6% from target. (D) Bioplastic Focused Menu 4 achieved the next best loop closure while omitting radishes, wheat, and celery, the highest mass crops from Menus 1, 2 and 3. This menu had the best carbohydrate, protein, and energy content of the four Bioplastic Focused menus, at +12.7%, +66.5% and +8.4% above their targets, respectively. Fat content remained stable at -0.8% from target, while fiber increased to +19.3% above target.
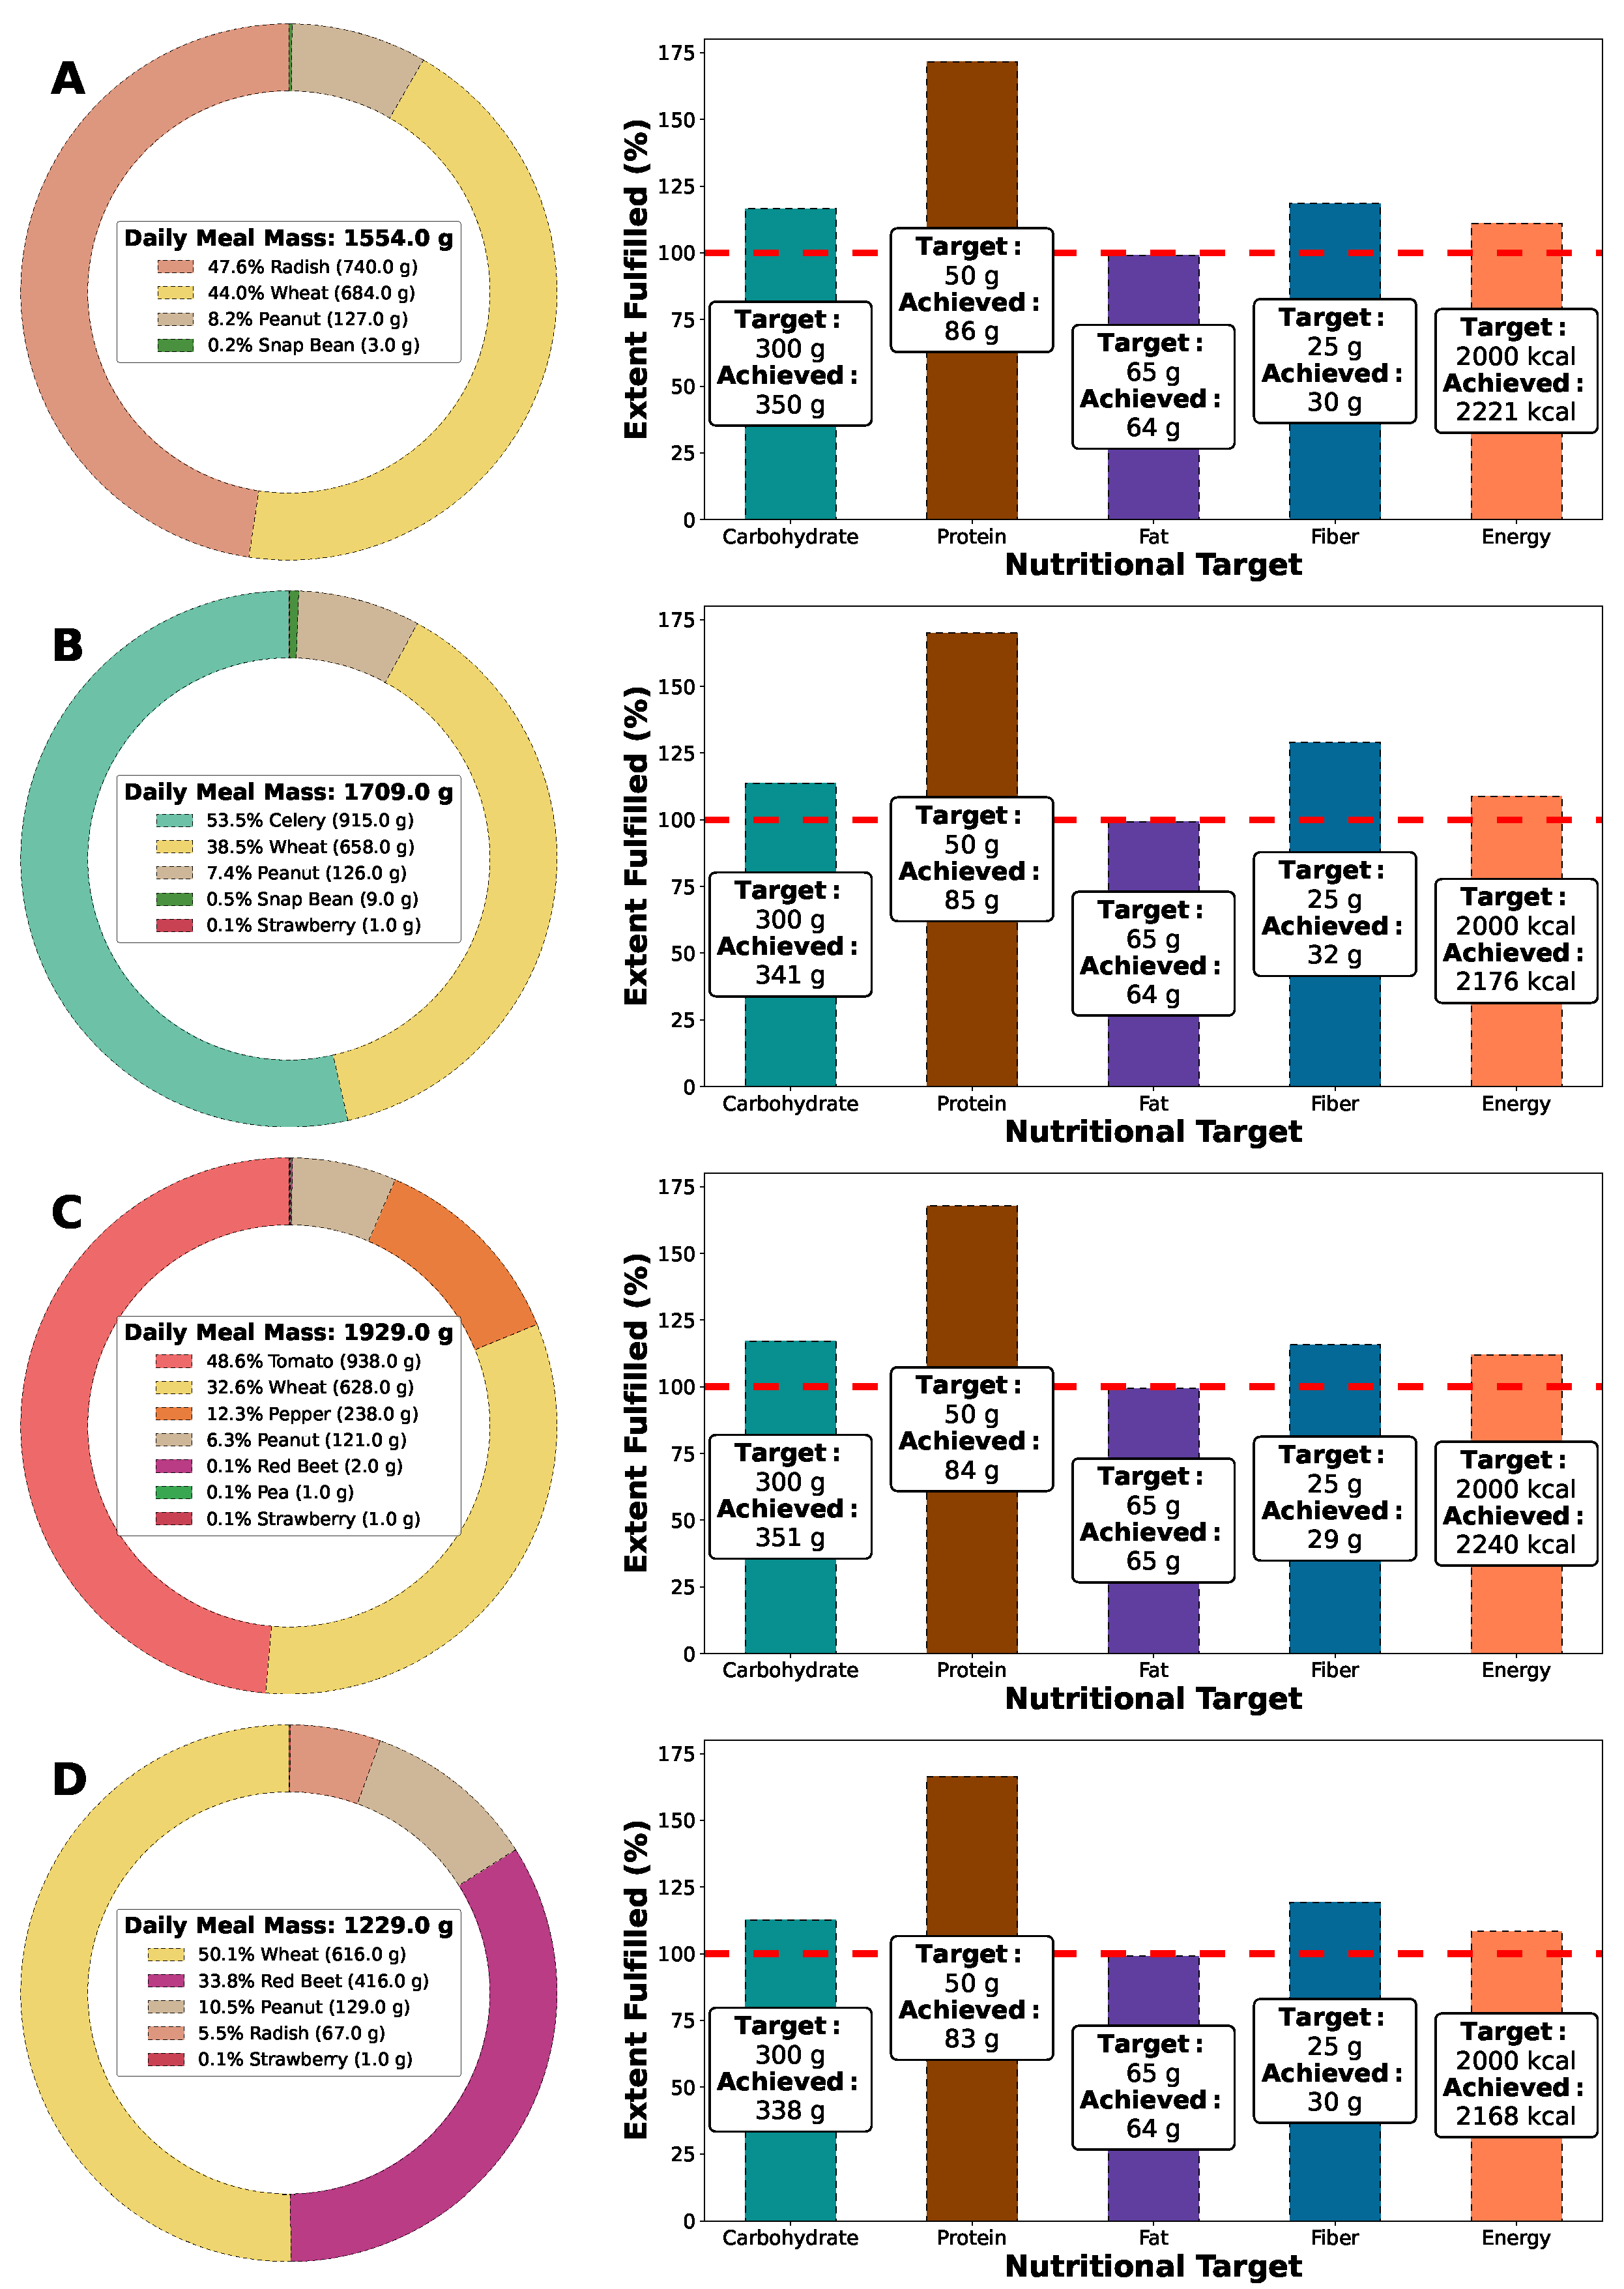
Figure 6.
Four selected ESM Saver menus. (A) ESM Saver Menu 1 achieved the lowest ESM per loop closure of all 45,116 fully bioregenerative menus, identical to Bioplastic Focused Menu 1. (B) ESM Saver Menu 2 achieved the the next lowest ESM per loop closure, without including wheat, the highest mass crop from Menu 1. This menu was identical to Bioplastic Focused Menu 3, and achieved similar DRIs for all five nutrition targets as ESM Saver Menu 1, except for protein content which improved to +61.7% over target. (C) ESM Saver Menu 3 achieved the next lowest ESM per loop closure while omitting both radishes and wheat, the highest mass crops from Menus 1 and 2. Carbohydrate, protein, and energy content improved to +10.5%, +56.5%, and +7.1% above their targets, respectively. Fat and fiber content slightly worsened to -1.0% and +17.0% from their targets, respectively. (D) ESM Saver Menu 4 achieved the next lowest ESM per loop closure while omitting radishes, wheat, and tomatoes, the highest mass crops from Menus 1, 2 and 3. This menu had the best nutritional content of the four ESM Saver menus at +8.7%, +51.0%, -0.3%, +15.7%, and -0.9% deviation from the carbohydrate, protein, fat, fiber, and energy DRIs, respectively.
Figure 6.
Four selected ESM Saver menus. (A) ESM Saver Menu 1 achieved the lowest ESM per loop closure of all 45,116 fully bioregenerative menus, identical to Bioplastic Focused Menu 1. (B) ESM Saver Menu 2 achieved the the next lowest ESM per loop closure, without including wheat, the highest mass crop from Menu 1. This menu was identical to Bioplastic Focused Menu 3, and achieved similar DRIs for all five nutrition targets as ESM Saver Menu 1, except for protein content which improved to +61.7% over target. (C) ESM Saver Menu 3 achieved the next lowest ESM per loop closure while omitting both radishes and wheat, the highest mass crops from Menus 1 and 2. Carbohydrate, protein, and energy content improved to +10.5%, +56.5%, and +7.1% above their targets, respectively. Fat and fiber content slightly worsened to -1.0% and +17.0% from their targets, respectively. (D) ESM Saver Menu 4 achieved the next lowest ESM per loop closure while omitting radishes, wheat, and tomatoes, the highest mass crops from Menus 1, 2 and 3. This menu had the best nutritional content of the four ESM Saver menus at +8.7%, +51.0%, -0.3%, +15.7%, and -0.9% deviation from the carbohydrate, protein, fat, fiber, and energy DRIs, respectively.
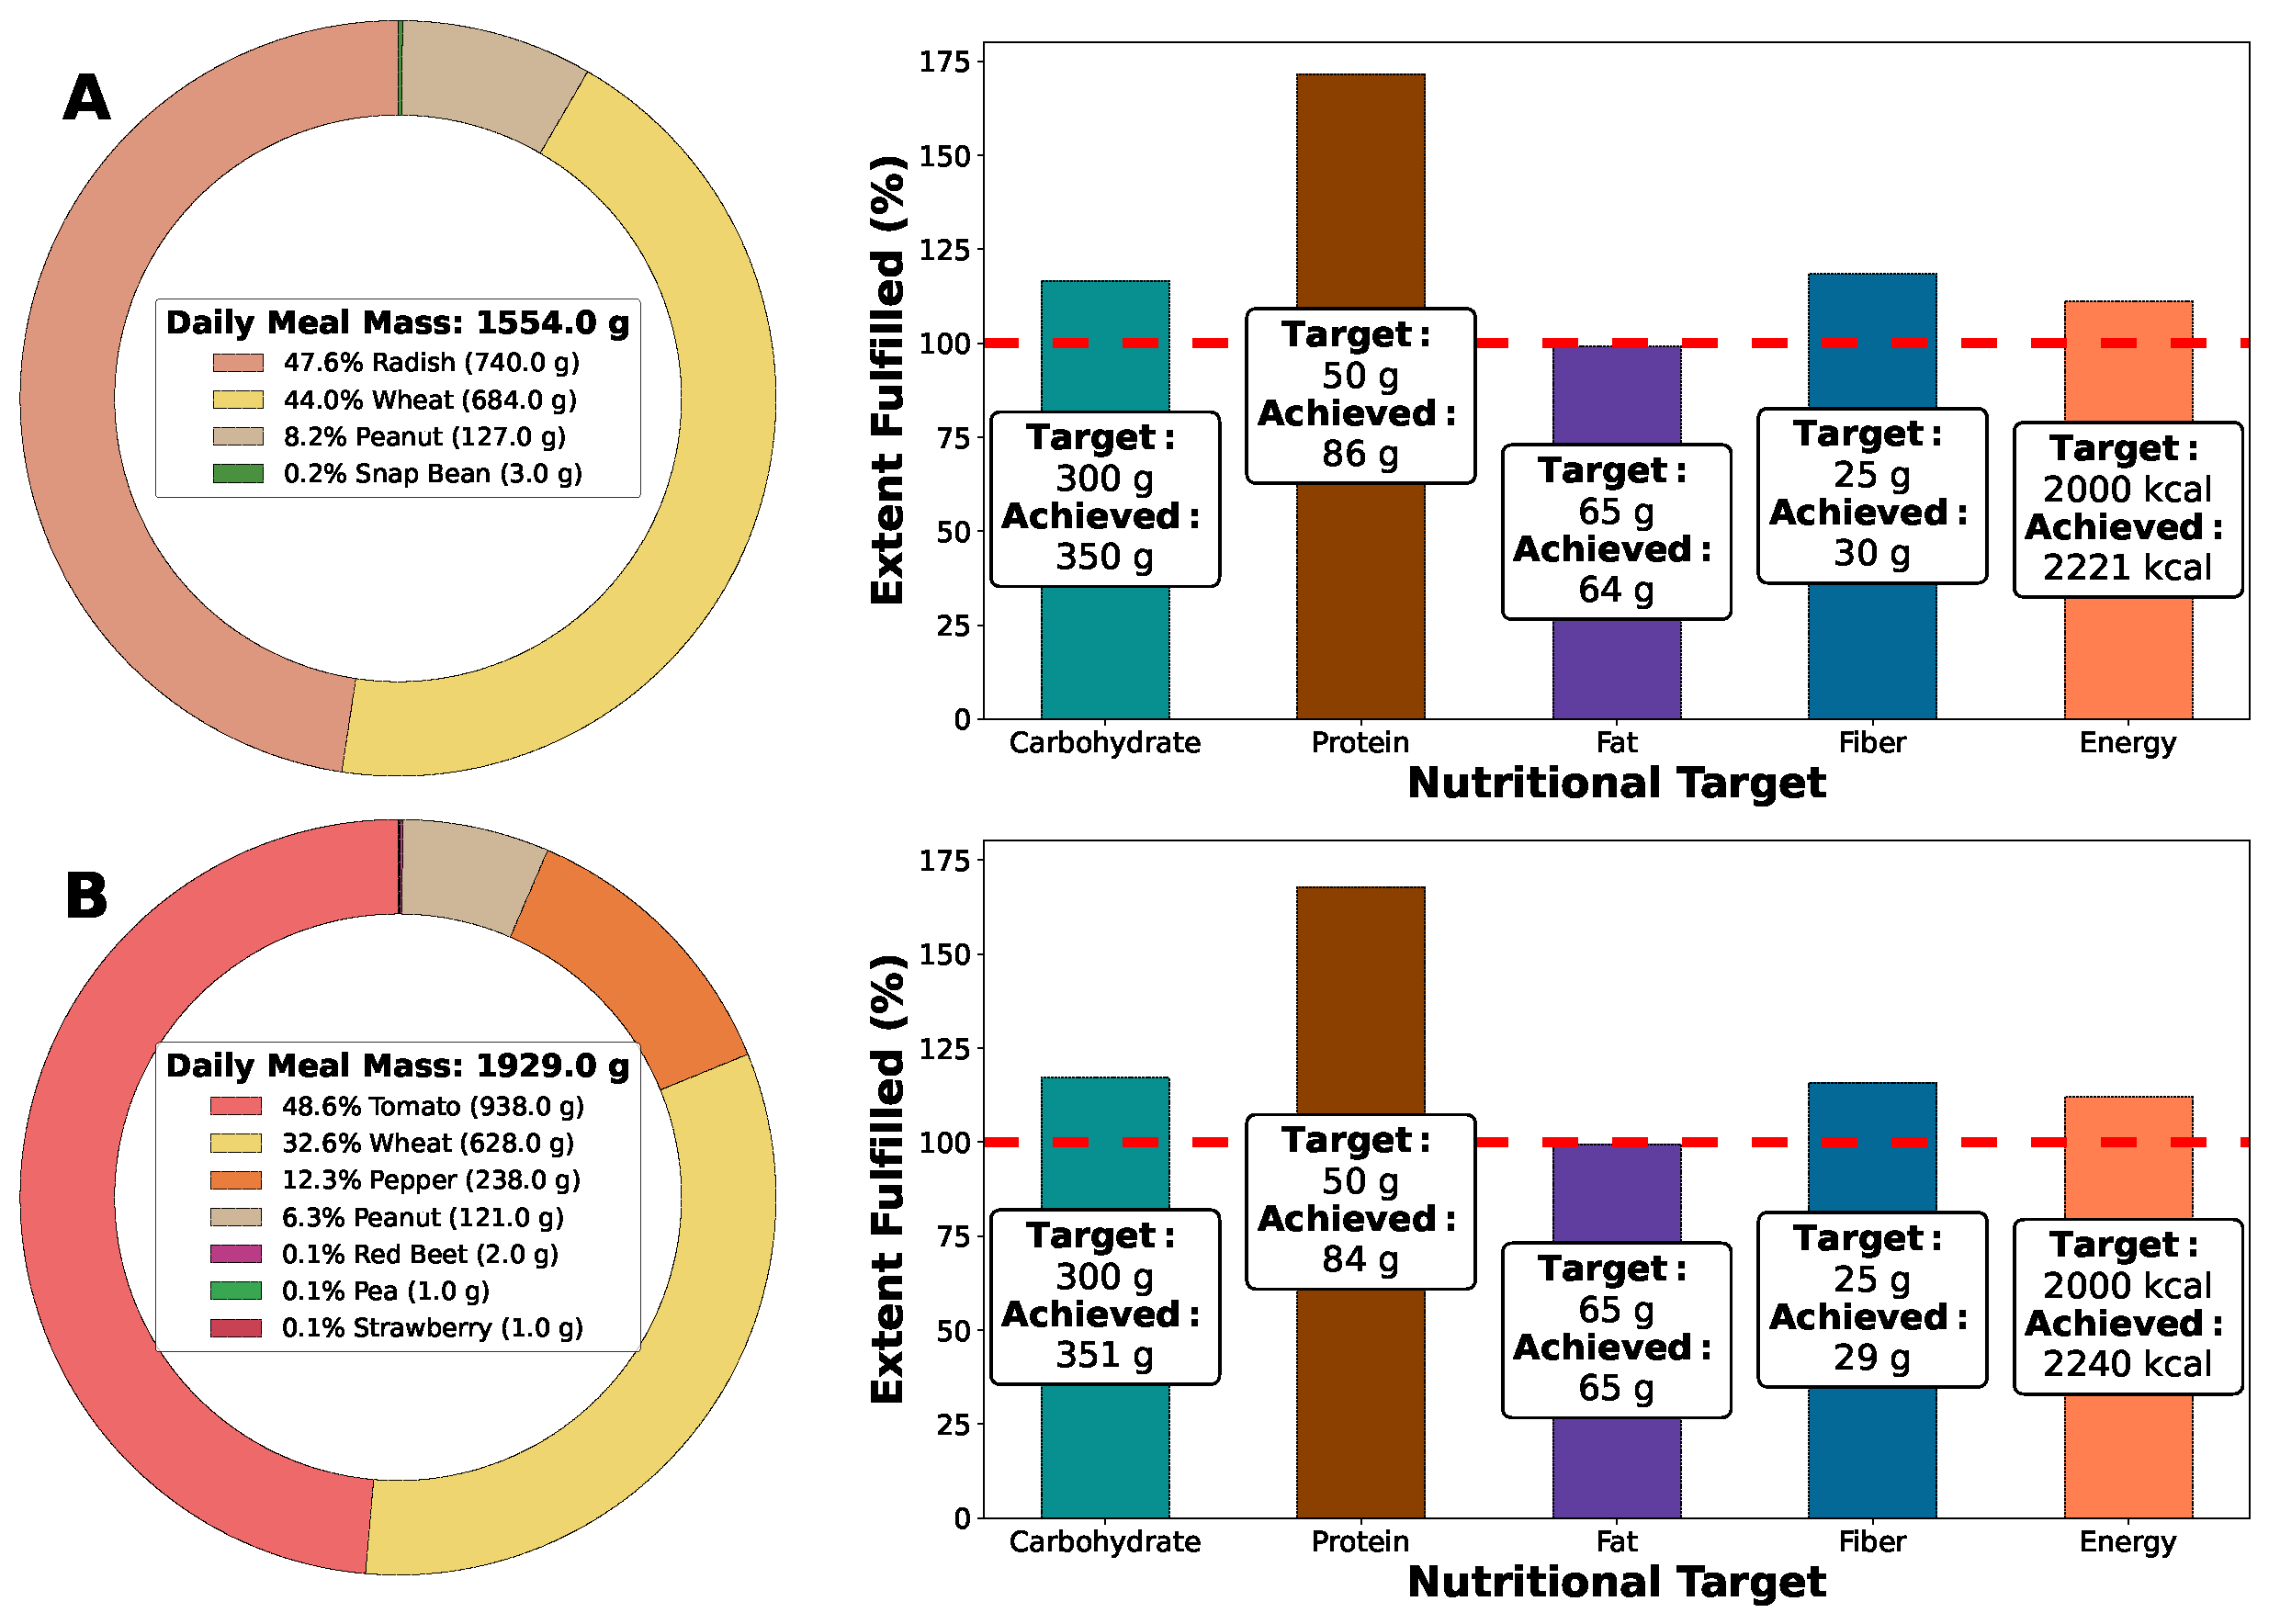
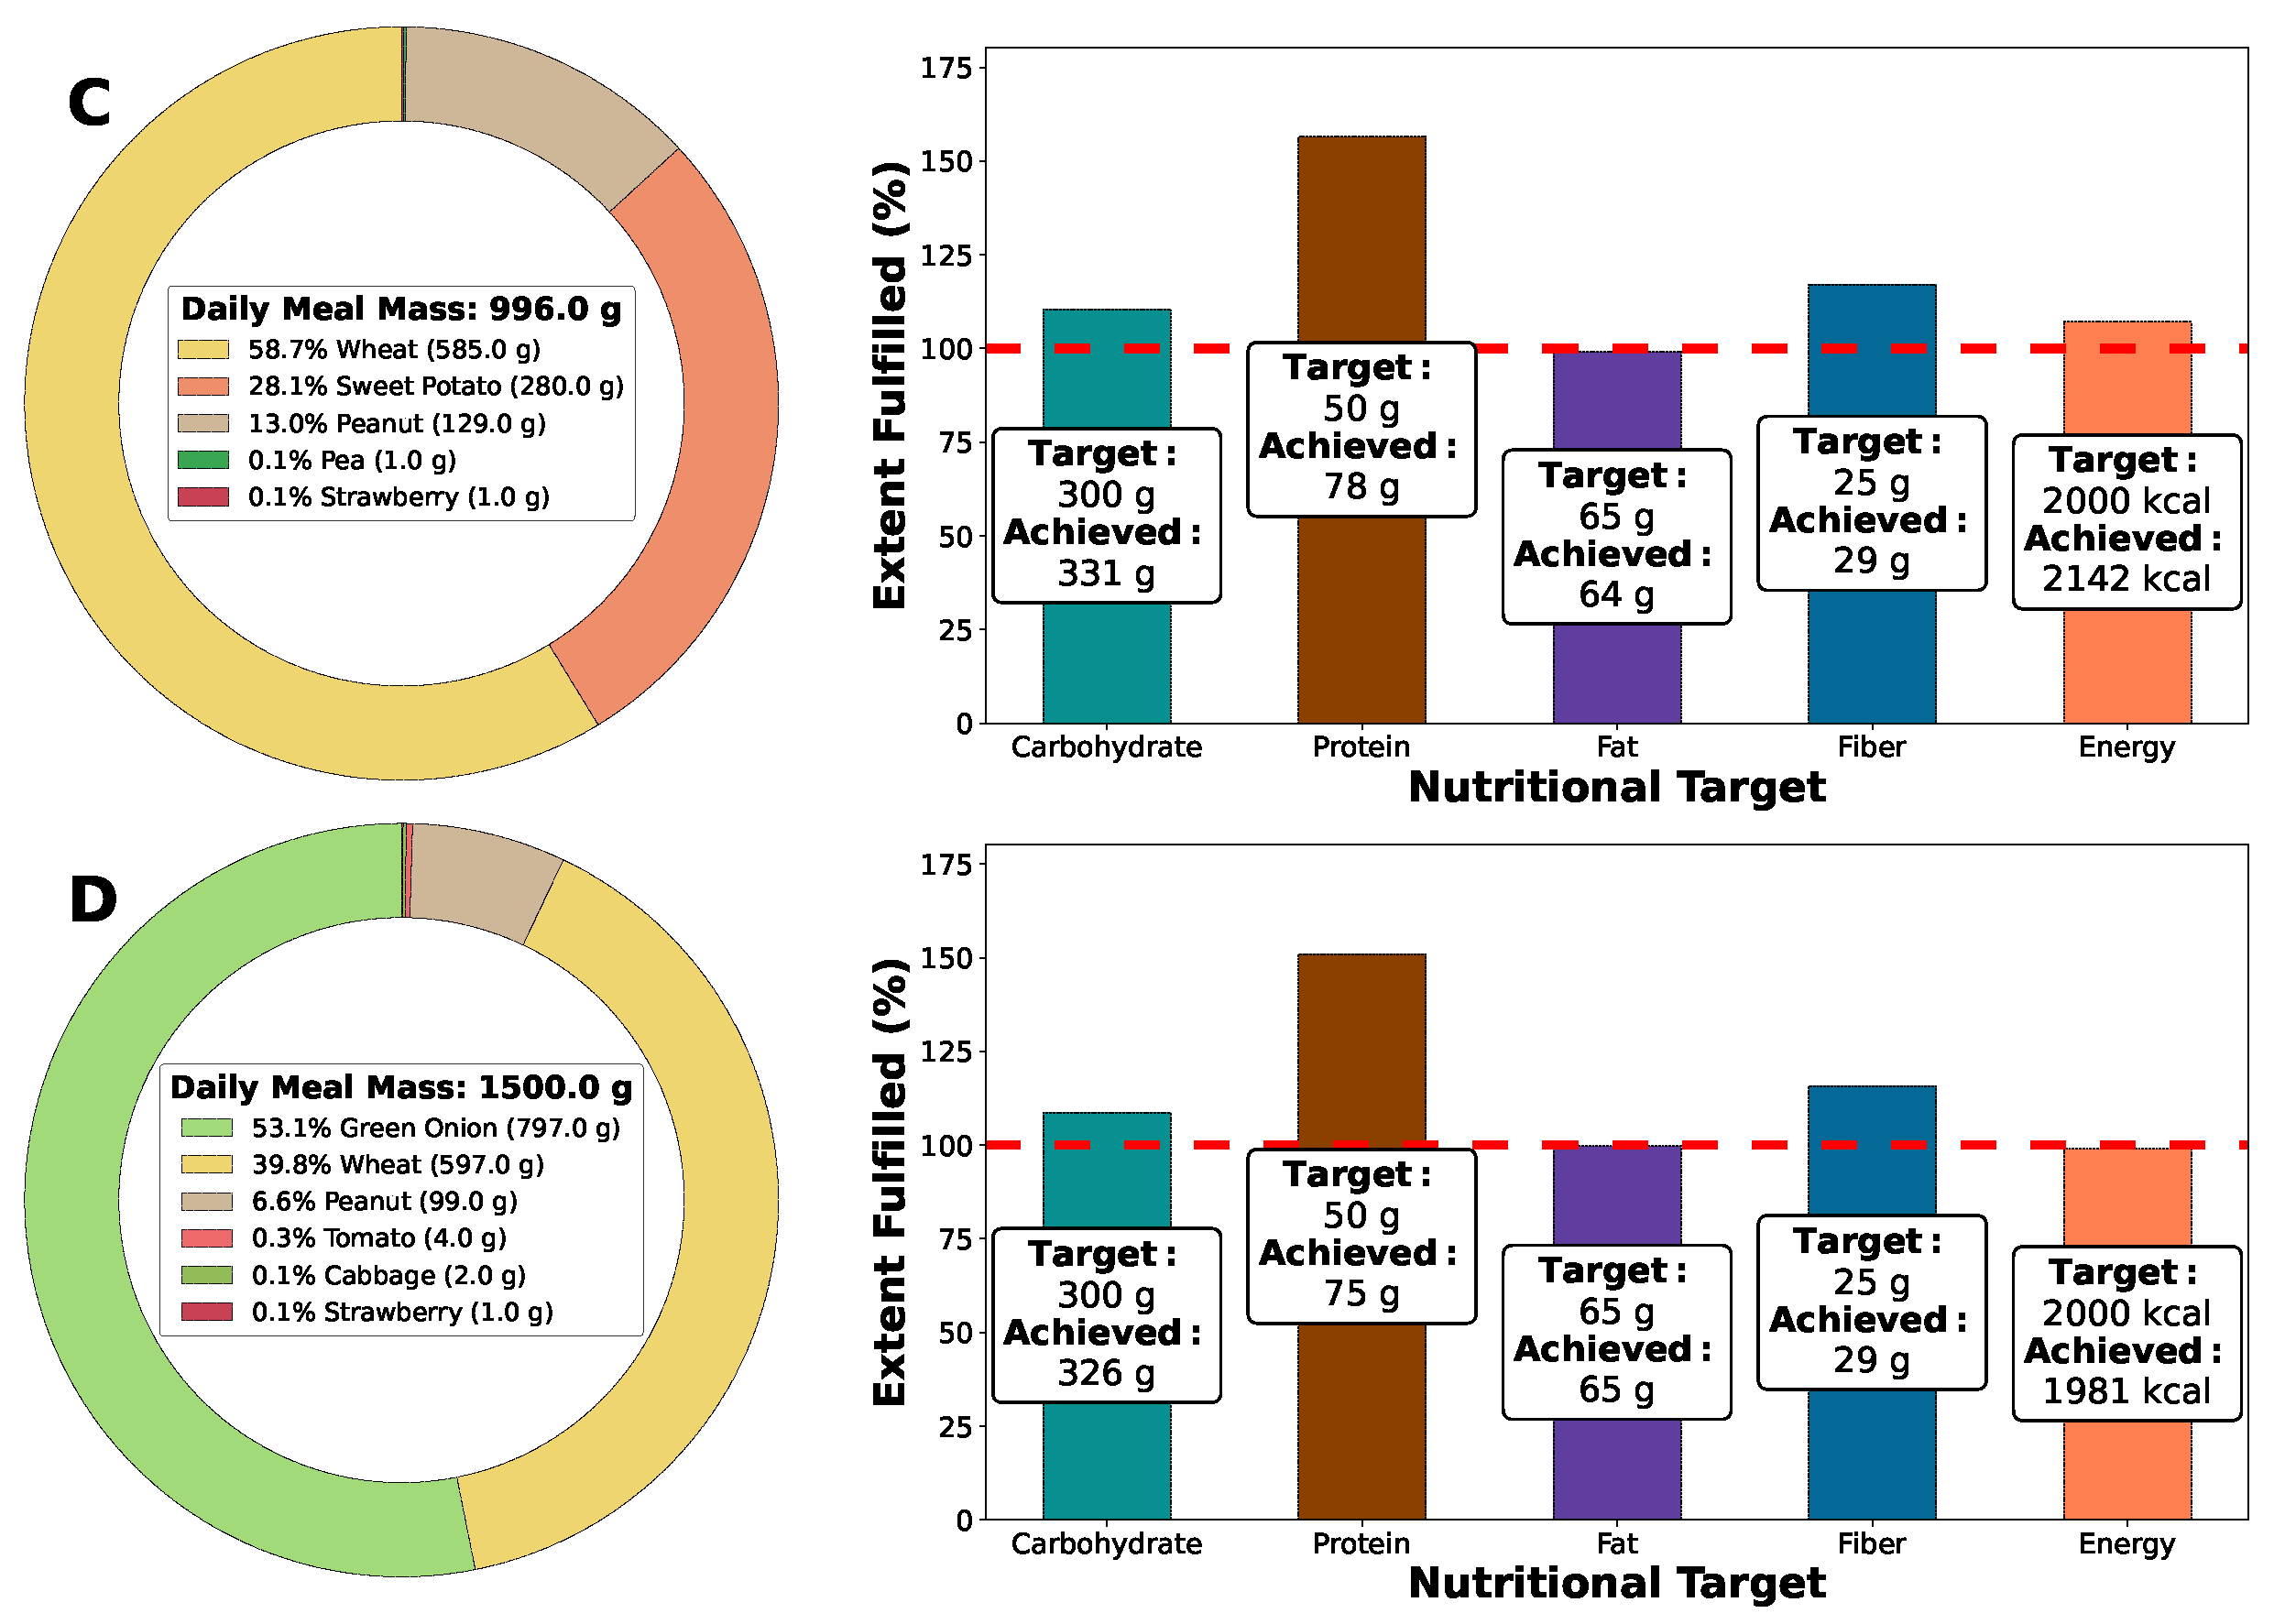
Figure 7.
Loop closure and ESM costs of the three menu categories. (A) The Bioplastic Focused and ESM Saver menus achieved up to six times the loop closure of Nutrient Focused menus. (B) The Nutrient Focused menus were nearly twice as cost effective as the Bioplastic Focused and ESM Saver menus. (C) The Bioplastic Focused and ESM Saver menus incurred 3–7 times lower ESM per loop closure than Nutrient Focused menus.
Figure 7.
Loop closure and ESM costs of the three menu categories. (A) The Bioplastic Focused and ESM Saver menus achieved up to six times the loop closure of Nutrient Focused menus. (B) The Nutrient Focused menus were nearly twice as cost effective as the Bioplastic Focused and ESM Saver menus. (C) The Bioplastic Focused and ESM Saver menus incurred 3–7 times lower ESM per loop closure than Nutrient Focused menus.
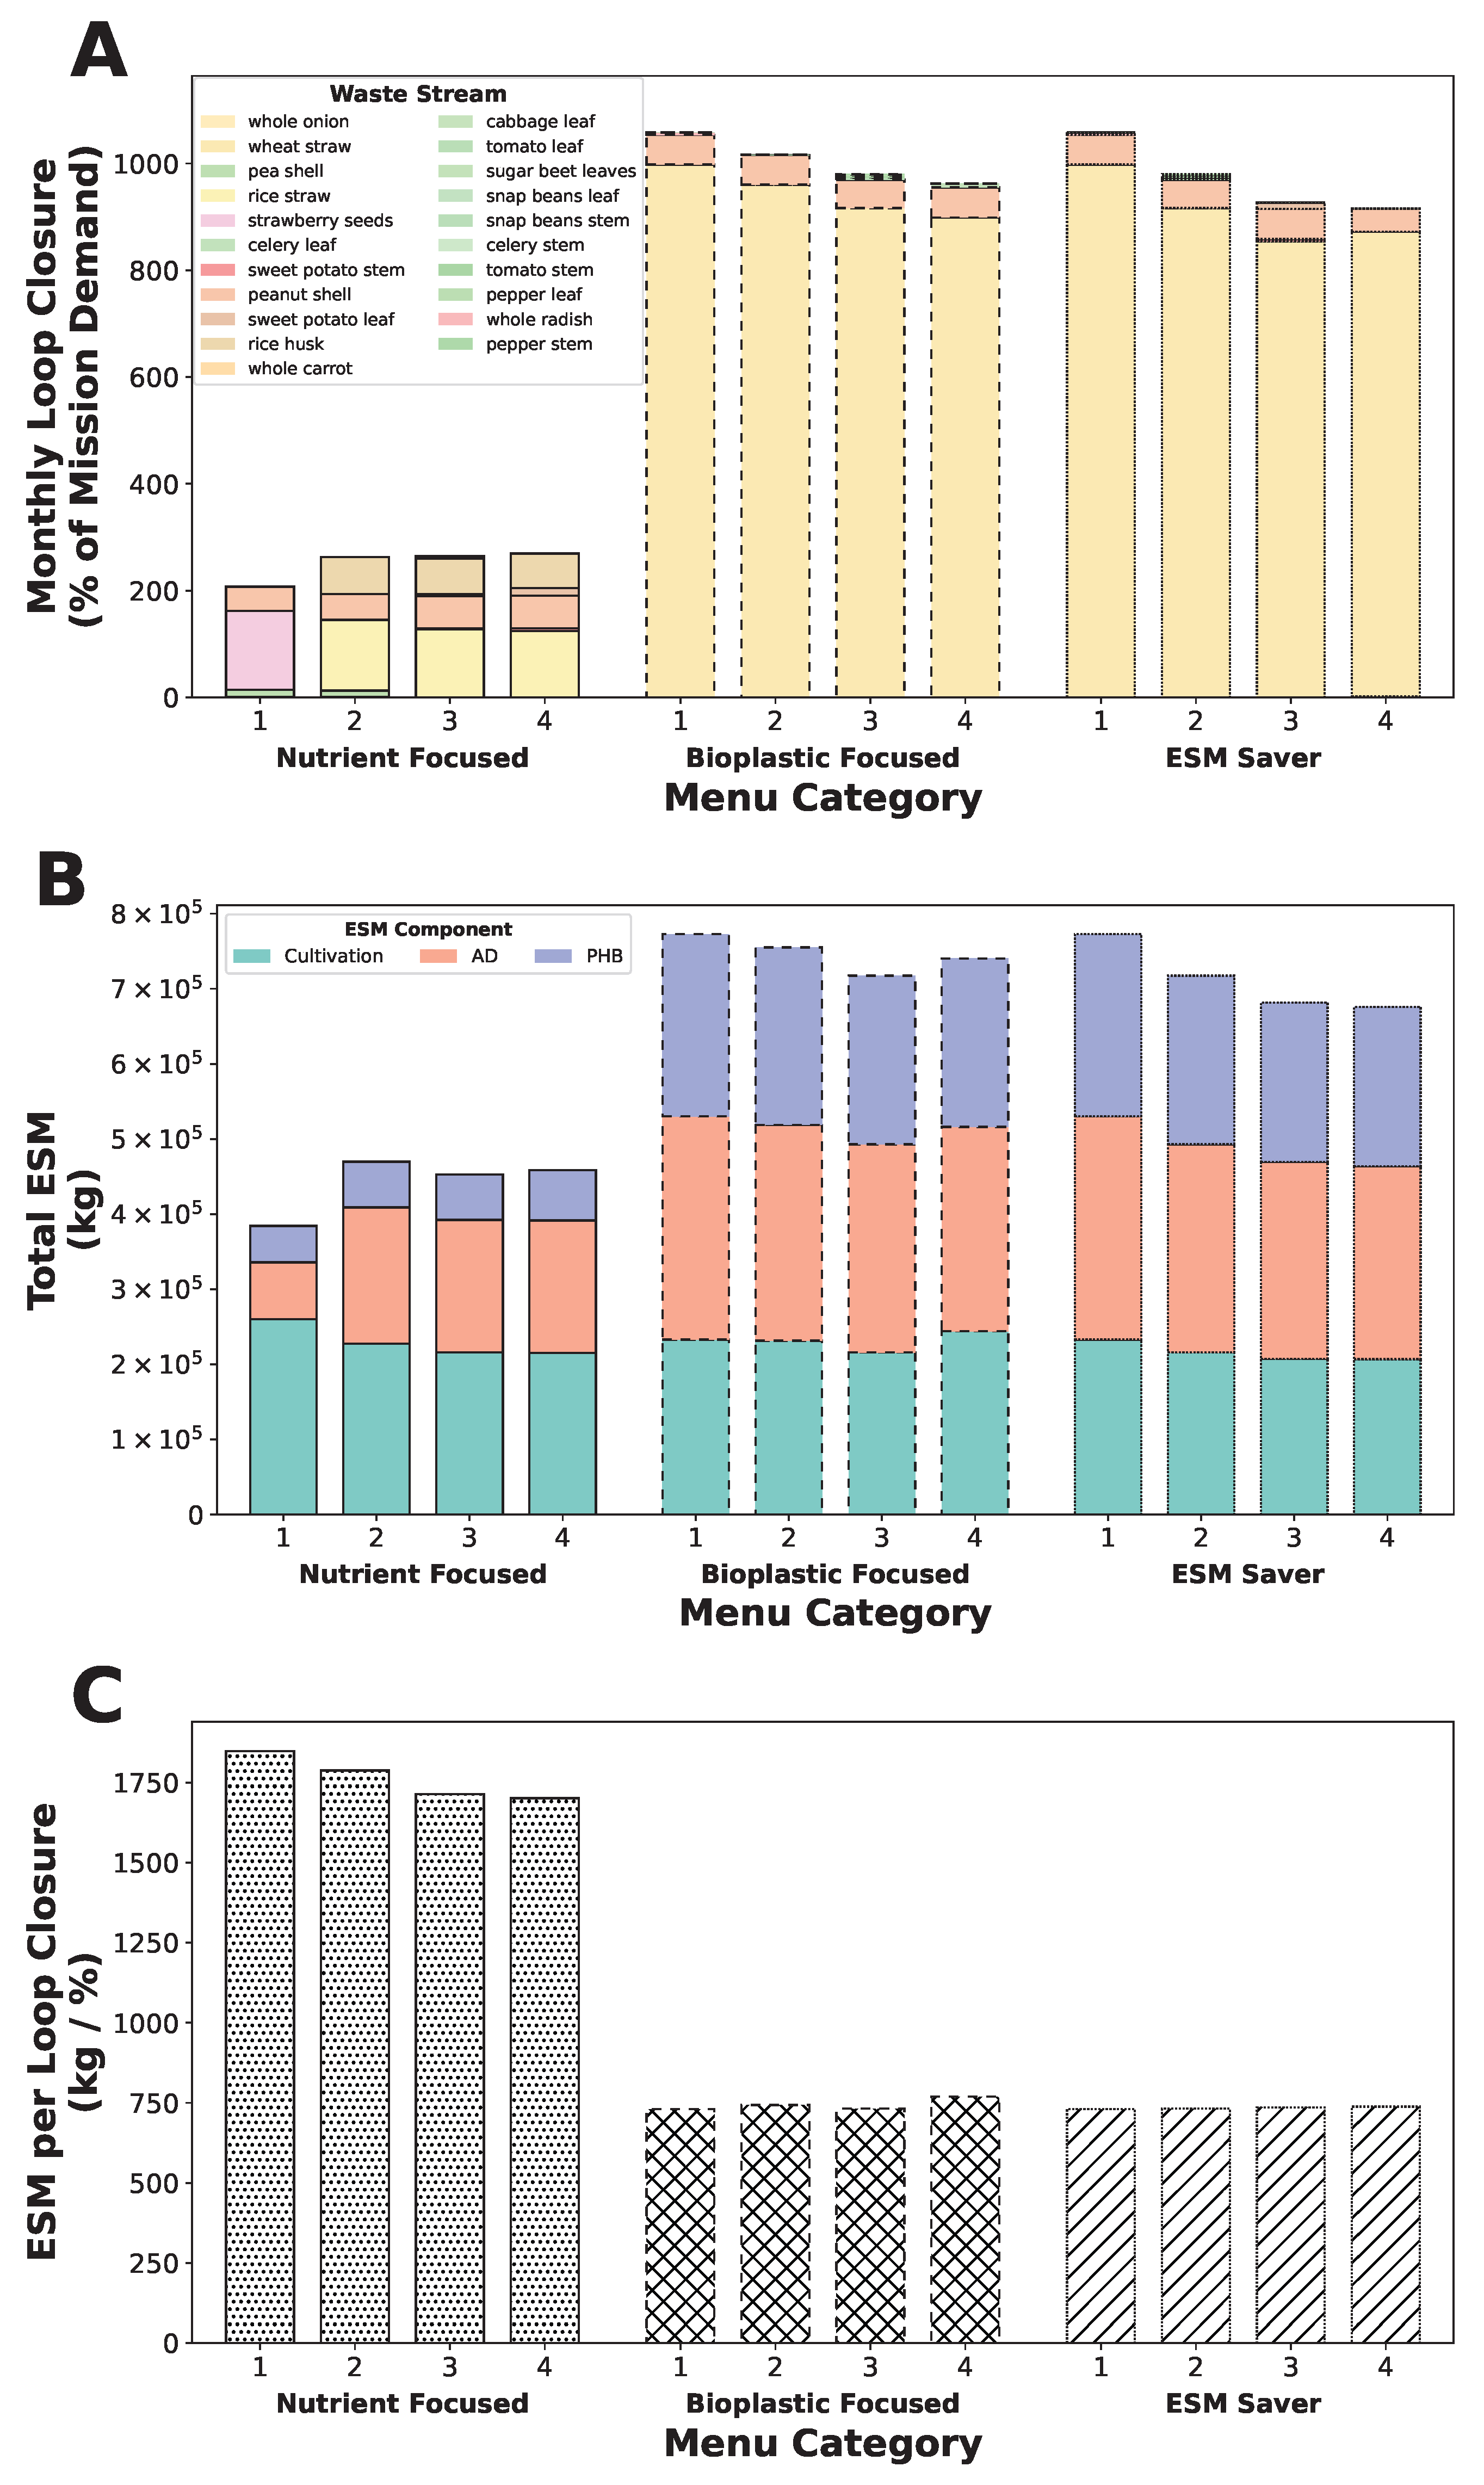
Figure 8.
Comparison of ESM and loop closure between our fully bioregenerative menus and published NASA Mars menus. (A) Average loop closure. (B) Combined average ESM of cultivation, AD, PHB synthesis, and shipping. Error bars represent standard deviation across the menus in each category, which is zero for the NASA categories since they have one menu each. (C) ESM cost per unit loop closure. Error bars represent standard deviation across the menus in each category, which is zero for the NASA categories since they have one menu each.
Figure 8.
Comparison of ESM and loop closure between our fully bioregenerative menus and published NASA Mars menus. (A) Average loop closure. (B) Combined average ESM of cultivation, AD, PHB synthesis, and shipping. Error bars represent standard deviation across the menus in each category, which is zero for the NASA categories since they have one menu each. (C) ESM cost per unit loop closure. Error bars represent standard deviation across the menus in each category, which is zero for the NASA categories since they have one menu each.
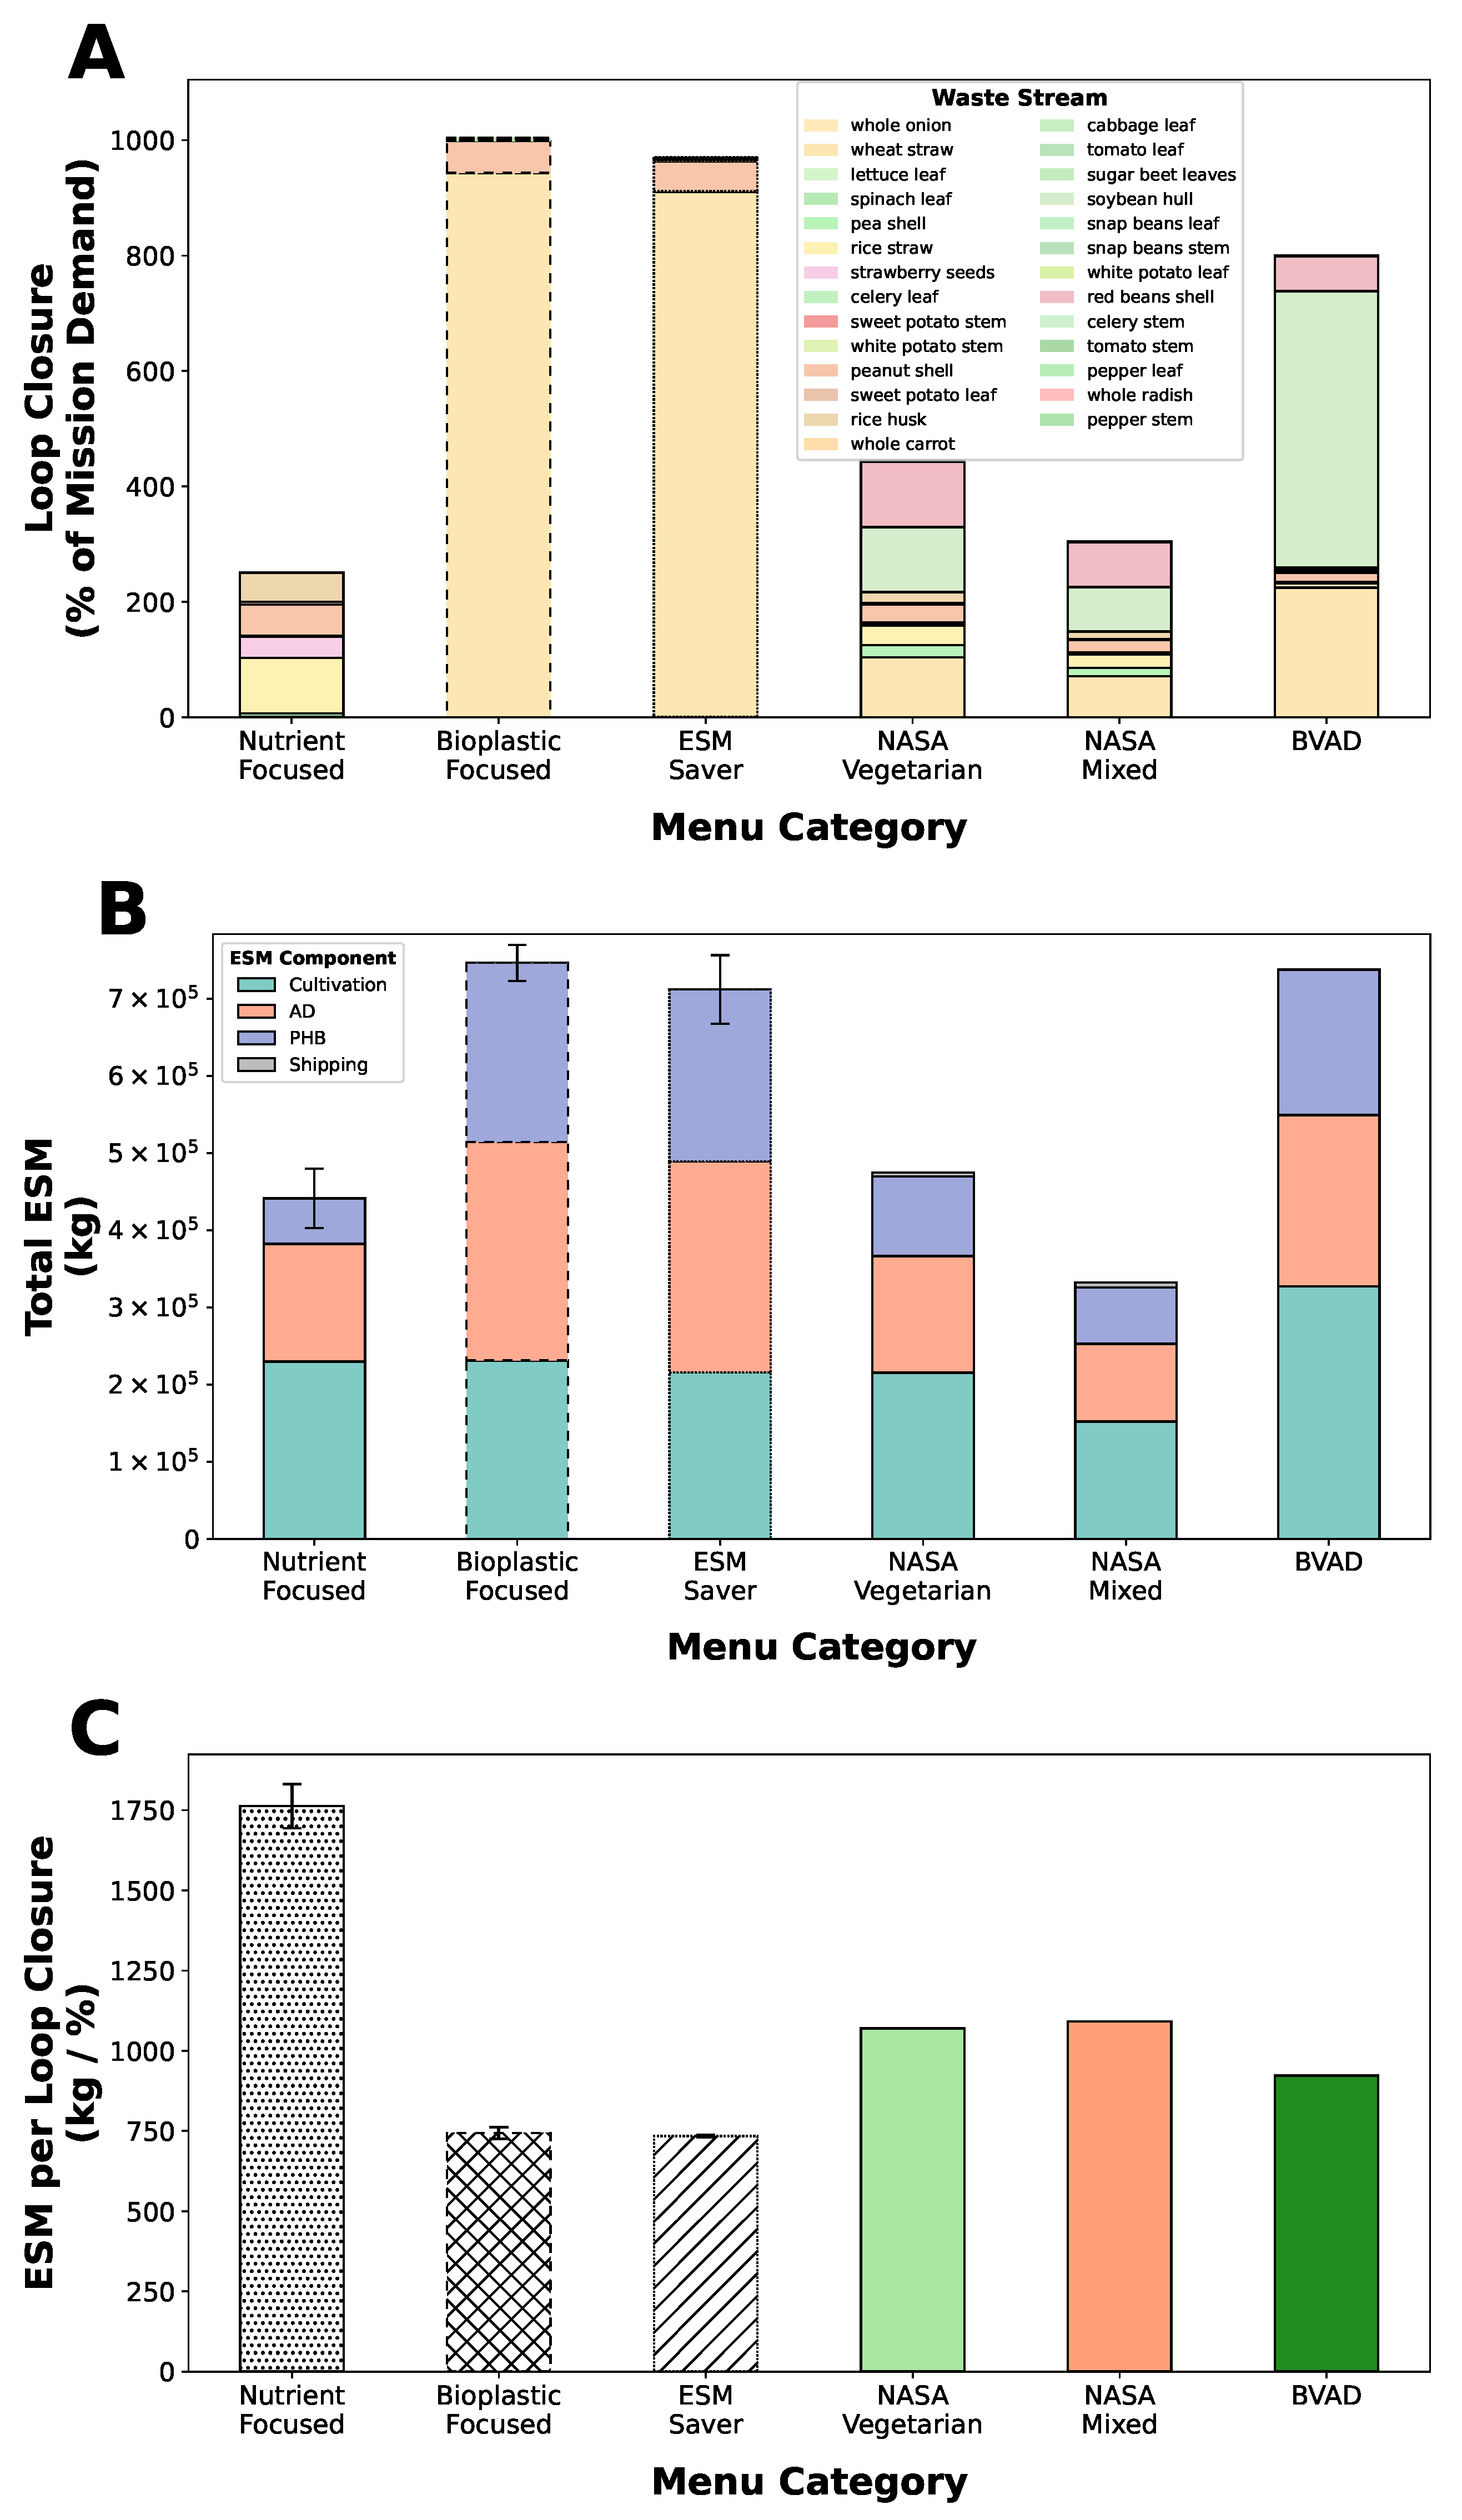

Table 1.
ESM of Cultivation [kg].
| Category | Menu | Mass | Power | Volume | Thermal | Crew Time | Total |
|---|---|---|---|---|---|---|---|
| Nutrient-Focused | 1 | 49,003.18 | 56,019.60 | 3,764.49 | 150,423.00 | 1,012.66 | 260,222.93 |
| 2 | 42,862.43 | 48,999.60 | 3,292.75 | 131,573.00 | 885.76 | 227,613.54 | |
| 3 | 40,651.76 | 46,472.40 | 3,122.92 | 124,787.00 | 840.08 | 215,874.16 | |
| 4 | 40,528.95 | 46,332.00 | 3,113.48 | 124,410.00 | 837.54 | 215,221.97 | |
| Mean | 43,261.58 | 49,455.90 | 3,323.41 | 132,798.25 | 894.01 | 229,733.15 | |
| Bioplastic-Focused | 1 | 43,844.96 | 50,122.80 | 3,368.22 | 134,589.00 | 906.07 | 232,831.04 |
| 2 | 43,599.32 | 49,842.00 | 3,349.35 | 133,835.00 | 900.99 | 231,526.67 | |
| 3 | 40,651.76 | 46,472.40 | 3,122.92 | 124,787.00 | 840.08 | 215,874.16 | |
| 4 | 45,932.81 | 52,509.60 | 3,528.62 | 140,998.00 | 949.21 | 243,918.24 | |
| Mean | 43,507.21 | 49,736.70 | 3,342.28 | 133,552.25 | 899.09 | 231,037.53 | |
| ESM Saver | 1 | 43,844.96 | 50,122.80 | 3,368.22 | 134,589.00 | 906.07 | 232,831.04 |
| 2 | 40,651.76 | 46,472.40 | 3,122.92 | 124,787.00 | 840.08 | 215,874.16 | |
| 3 | 39,055.17 | 44,647.20 | 3,000.27 | 119,886.00 | 807.08 | 207,395.72 | |
| 4 | 38,932.36 | 44,506.80 | 2,990.83 | 119,509.00 | 804.55 | 206,743.53 | |
| Mean | 40,621.06 | 46,437.30 | 3,120.56 | 124,692.75 | 839.44 | 215,711.11 |
Table 2.
ESM of Anaerobic Digestion [kg].
| Category | Menu | Mass | Power | Volume | Thermal | Crew Time | Total |
|---|---|---|---|---|---|---|---|
| Nutrient-Focused | 1 | 27,738.83 | 12,466.71 | 642.00 | 33,475.43 | 1,269.00 | 75,591.96 |
| 2 | 66,573.18 | 29,920.10 | 1,540.80 | 80,341.02 | 3,045.60 | 181,420.71 | |
| 3 | 64,723.93 | 29,088.99 | 1,498.00 | 78,109.33 | 2,961.00 | 176,381.25 | |
| 4 | 64,723.93 | 29,088.99 | 1,498.00 | 78,109.33 | 2,961.00 | 176,381.25 | |
| Mean | 55,939.97 | 25,141.20 | 1,294.70 | 67,508.77 | 2,559.15 | 152,443.79 | |
| Bioplastic-Focused | 1 | 109,106.05 | 49,035.73 | 2,525.21 | 131,670.01 | 4,991.40 | 297,328.39 |
| 2 | 105,407.54 | 47,373.50 | 2,439.61 | 127,206.62 | 4,822.20 | 287,249.46 | |
| 3 | 101,709.03 | 45,711.27 | 2,354.01 | 122,743.23 | 4,653.00 | 277,170.53 | |
| 4 | 99,859.78 | 44,880.16 | 2,311.21 | 120,511.53 | 4,568.40 | 272,131.07 | |
| Mean | 104,020.60 | 46,750.16 | 2,407.51 | 125,532.84 | 4,758.75 | 283,469.86 | |
| ESM Saver | 1 | 109,106.05 | 49,035.73 | 2,525.21 | 131,670.01 | 4,991.40 | 297,328.39 |
| 2 | 101,709.03 | 45,711.27 | 2,354.01 | 122,743.23 | 4,653.00 | 277,170.53 | |
| 3 | 96,161.27 | 43,217.93 | 2,225.61 | 116,048.14 | 4,399.20 | 262,052.14 | |
| 4 | 94,312.01 | 42,386.81 | 2,182.81 | 113,816.45 | 4,314.60 | 257,012.67 | |
| Mean | 100,322.09 | 45,087.93 | 2,321.91 | 121,069.45 | 4,589.55 | 273,390.93 |
Table 3.
ESM of PHB Synthesis [kg].
| Category | Menu | Mass | Power | Volume | Thermal | Crew Time | Total |
|---|---|---|---|---|---|---|---|
| Nutrient-Focused | 1 | 13,485.60 | 6,639.41 | 150.47 | 28,221.64 | 11.28 | 48,508.39 |
| 2 | 16,856.99 | 8,299.26 | 188.08 | 35,277.05 | 14.10 | 60,635.49 | |
| 3 | 16,856.99 | 8,299.26 | 188.08 | 35,277.05 | 14.10 | 60,635.49 | |
| 4 | 18,542.69 | 9,129.19 | 206.89 | 38,804.75 | 15.51 | 66,699.03 | |
| Mean | 16,435.57 | 8,091.78 | 183.38 | 34,395.12 | 13.75 | 59,119.60 | |
| Bioplastic-Focused | 1 | 67,427.98 | 33,197.04 | 752.33 | 141,108.20 | 56.40 | 242,541.95 |
| 2 | 65,742.28 | 32,367.11 | 733.52 | 137,580.49 | 54.99 | 236,478.40 | |
| 3 | 62,370.88 | 30,707.26 | 695.90 | 130,525.09 | 52.17 | 224,351.30 | |
| 4 | 62,370.88 | 30,707.26 | 695.90 | 130,525.09 | 52.17 | 224,351.30 | |
| Mean | 64,478.00 | 31,744.67 | 719.41 | 134,934.72 | 53.93 | 231,930.74 | |
| ESM Saver | 1 | 67,427.98 | 33,197.04 | 752.33 | 141,108.20 | 56.40 | 242,541.95 |
| 2 | 62,370.88 | 30,707.26 | 695.90 | 130,525.09 | 52.17 | 224,351.30 | |
| 3 | 58,999.48 | 29,047.41 | 658.29 | 123,469.68 | 49.35 | 212,224.20 | |
| 4 | 58,999.48 | 29,047.41 | 658.29 | 123,469.68 | 49.35 | 212,224.20 | |
| Mean | 61,949.45 | 30,499.78 | 691.20 | 129,643.16 | 51.82 | 222,835.41 |
Table 4.
Mean ESM and ESM per Loop Closure of Fully Bioregenerative vs. Published NASA Menus.
| Menu Category | ESM Component [kg] | Mean ESM per Loop Closure [kg / %] | ||||
|---|---|---|---|---|---|---|
| Cultivation | AD | PHB Synthesis | Shipping | Total ESM | ||
| Nutrient Focused | 229,733.15 | 152,443.79 | 59,119.60 | 0.00 | 441,296.54 | 1,762.44 |
| Bioplastic Focused | 231,037.53 | 283,469.86 | 231,930.74 | 0.00 | 746,438.12 | 743.58 |
| ESM Saver | 215,711.11 | 273,390.93 | 222,835.41 | 0.00 | 711,937.46 | 733.94 |
| NASA Vegetarian | 215,221.97 | 151,183.93 | 103,080.33 | 5,399.31 | 474,885.54 | 1,069.89 |
| NASA Mixed | 151,959.76 | 100,789.28 | 72,762.58 | 6,592.95 | 332,104.57 | 1,091.62 |
| NASA Bulk Commodity (BVAD) | 327,398.28 | 221,736.42 | 187,970.01 | 841.18 | 737,945.89 | 922.76 |
Table 5.
Astronaut Dietary Reference Intake (DRI) Values.
| Nutrient | DRI |
|---|---|
| Total Carbohydrate | 300 g |
| Protein | 50 g |
| Fat | 65 g |
| Fiber | 25 g |
| Energy | 2,000 kcal |
Table 6.
Macronutrient and Energy Content of 23 ELS Crops.
| Crop | Carbohydrates [g] | Protein [g] | Fat [g] | Dietary Fiber [g] | Energy [kcal] | USDA FoodData Central ID |
|---|---|---|---|---|---|---|
| Mushroom | 6.94 | 2.90 | 0.19 | 2.80 | 44 | 1999627 |
| Peanut | 26.50 | 23.20 | 43.30 | 8.00 | 588 | 2515376 |
| Rice | 80.30 | 7.04 | 1.03 | 0.10 | 359 | 2512381 |
| Dry Bean | 39.70 | 21.30 | 1.16 | 4.00 | 52 | 747431 |
| Soybean | 11.00 | 13.00 | 6.80 | 4.20 | 147 | 169282 |
| Wheat | 42.50 | 7.49 | 1.27 | 1.10 | 198 | 169725 |
| Pea | 14.40 | 5.42 | 0.40 | 5.70 | 339 | 170419 |
| Sweet Potato | 17.30 | 1.58 | 0.38 | 4.44 | 79 | 2346404 |
| Strawberry | 7.96 | 0.64 | 0.22 | 0.00 | 36 | 2346409 |
| Snap Bean | 7.41 | 1.97 | 0.28 | 3.00 | 40 | 2346400 |
| Red Beet | 9.56 | 1.61 | 0.17 | 2.80 | 43 | 169145 |
| White Potato | 15.70 | 1.68 | 0.10 | 2.40 | 69 | 170028 |
| Pepper | 6.65 | 0.90 | 0.13 | 1.20 | 31 | 2258590 |
| Carrot | 10.30 | 0.94 | 0.35 | 3.10 | 48 | 2258586 |
| Tomato | 3.84 | 0.70 | 0.42 | 1.00 | 22 | 1999634 |
| Radish | 3.40 | 0.68 | 0.10 | 1.60 | 16 | 169276 |
| Chard | 3.74 | 1.80 | 0.20 | 1.60 | 19 | 169991 |
| Onion | 9.34 | 1.10 | 0.10 | 1.70 | 40 | 170000 |
| Green Onion | 5.74 | 0.97 | 1.80 | 1.80 | 27 | 170006 |
| Celery | 2.97 | 0.69 | 0.17 | 1.60 | 14 | 169988 |
| Spinach | 3.63 | 2.86 | 0.39 | 2.20 | 23 | 168462 |
| Cabbage | 5.80 | 1.28 | 0.10 | 2.50 | 25 | 169975 |
| Lettuce | 4.06 | 0.98 | 0.07 | 0.00 | 21 | 2346389 |
Table 7.
Input Predictor Variables to the BCBPD Model[47].
Table 7.
Input Predictor Variables to the BCBPD Model[47].
| Feedstock Characteristics | Digester Operating Conditions |
|---|---|
| Total Solids (TS) [%] | Substrate/Inoculum Ratio (S/I) |
| Volatile Solids (VS) [%] | Organic Loading (OL) [g-VS/L] |
| VS/TS [%] | Digestion Time (DT) [days] |
| Carbohydrate Content [% TS] | |
| Cellulose Content [% TS] | |
| Hemicellulose Content [% TS] | |
| Carbon Content [% TS] | |
| Hydrogen Content [% TS] | |
| Oxygen Content [% TS] | |
| Nitrogen Content [% TS] |
Table 8.
Masses of ELS Crops and Shipped Foods for NASA Mars Menus.
| Menu Type | Mass of ELS crops [kg] | Mass of Non-Refrigerable | Mass of Refrigerable |
|---|---|---|---|
| Commodity Foods [kg] | Prepared Foods [kg] | ||
| Vegetarian | 3,839 | 2,975 | 0 |
| Mixed Commodity | 2,975 | 2,465 | 807 |
| Bulk Commodity (BVAD) | 1,390 | 463 | 0 |
Disclaimer/Publisher’s Note: The statements, opinions and data contained in all publications are solely those of the individual author(s) and contributor(s) and not of MDPI and/or the editor(s). MDPI and/or the editor(s) disclaim responsibility for any injury to people or property resulting from any ideas, methods, instructions or products referred to in the content. |
© 2026 by the authors. Licensee MDPI, Basel, Switzerland. This article is an open access article distributed under the terms and conditions of the Creative Commons Attribution (CC BY) license (http://creativecommons.org/licenses/by/4.0/).
Copyright: This open access article is published under a Creative Commons CC BY 4.0 license, which permit the free download, distribution, and reuse, provided that the author and preprint are cited in any reuse.