

Submitted:
28 March 2026
Posted:
31 March 2026
You are already at the latest version
Abstract
Molecular mimicry — structural or sequence similarity between pathogen-derived and host self-peptides sufficient to trigger cross-reactive immune responses — has been proposed as a mechanism of autoimmune triggering across rheumatoid arthritis, systemic lupus erythematosus, ankylosing spondylitis, systemic sclerosis, antiphospholipid syndrome, dermatomyositis, and Guillain-Barré syndrome. Computational identification of mimicry candidates has historically relied on sequence-based metrics, resting on the untested assumption that sequence similarity predicts structural similarity at the MHC-presented peptide level. We present MimicryDB-Auto, to our knowledge the first curated, labelled multi-pathogen dataset integrating MHC epitope prediction, sequence alignment, and atomic structural validation at the individual epitope level across both MHC class I and II presentations, comprising 399 pathogen-host peptide pairs spanning 32 organisms constructed through a reproducible seven-step pipeline. Following structural validation using TM-align with RMSD < 2.0 Å, 262 pairs were classified as confirmed unbound structural mimics and 137 as non-mimics. Within the confirmed mimic pool, sequence identity explained at most 1.6% of variance in structural RMSD at both the 2.0 Å threshold (r = −0.127, p = 0.036, n = 272) and the stricter 1.0 Å threshold (r = −0.046, p = 0.562, n = 159) — a relationship of no practical predictive utility across threshold definitions. A Random Forest classifier trained exclusively on sequence and immunological features achieved AUC-ROC = 0.958 (95% CI: 0.886–0.999), confirming a multivariate sequence signal exists but is insufficient as a standalone substitute for structural validation. Cross-pairing validation further confirmed that 99.2% of structurally equivalent non-matched pairs had zero detectable sequence similarity, quantifying the scope of sequence-dissimilar structural mimicry invisible to conventional screening. All structural comparisons were performed on unbound peptide conformations, representing a proxy for MHC-presented structure rather than direct immunological validation. MimicryDB-Auto and the complete pipeline are publicly available at https://github.com/minbaku/molecular-mimicry-RA-pipeline.
Keywords:
molecular mimicry
; autoimmune rheumatic diseases
; structural bioinformatics
; MHC epitope prediction
; TM-align
; sequence-structure relationship
; Random Forest
; Guillain-Barré syndrome
; pathogen-host peptide pairs
; computational immunology
1. Introduction
1.1. Autoimmune Rheumatic and Neurological Diseases: A Convergent Pathogenic Framework
Autoimmune diseases collectively affect an estimated 5–8% of the global population, unified by a common pathogenic feature: failure of immune self-tolerance resulting in sustained immune-mediated tissue damage. Among these, autoimmune rheumatic diseases — including rheumatoid arthritis (RA), systemic lupus erythematosus (SLE), ankylosing spondylitis (AS), systemic sclerosis (SSc), antiphospholipid syndrome (APS), and dermatomyositis — share several defining features: female preponderance, strong HLA class II allele associations, disease-specific autoantibodies that precede clinical onset by years, and a consistent epidemiological signal linking prior infection to disease initiation in genetically susceptible individuals. Guillain-Barré syndrome (GBS) is included here not as a rheumatic disease but as a condition sharing the core mechanistic framework of pathogen-driven molecular mimicry, with well-characterised ganglioside-mimicking antigens in its pathogenesis.
Rheumatoid arthritis serves as the primary case study, with a global prevalence of 0.5–1% and healthcare costs exceeding $39 billion annually in the United States; in lower-middle income settings including South Asia, catastrophic health expenditure affects 25–50% of households [2]. Anti-citrullinated protein antibodies (ACPAs) frequently appear years before clinical onset, marking a pre-clinical window of immune dysregulation that raises the central question this study addresses: what molecular events initiate autoimmune activation in a genetically susceptible individual?
1.2. Molecular Mimicry: A Recurring Mechanism Across Autoimmune Disease
Formally articulated by Oldstone in 1987 [6], molecular mimicry proposes that immune responses against pathogen antigens cross-react with structurally or sequentially similar host self-antigens, breaking immune tolerance. The most established example is acute rheumatic fever, where mimicry between Group A streptococcal M protein and cardiac myosin drives valve damage [7]. In SLE, immunisation with an EBNA-1 peptide induced anti-Sm antibodies and lupus-like manifestations in mice, providing direct evidence for EBV as a trigger [5]. Similar evidence implicates EBV in multiple sclerosis [8] and coxsackievirus B4 in type 1 diabetes [9]. In RA, Ebringer and colleagues proposed that Proteus mirabilis shares sequence homology with HLA-DRB1 alleles and type XI collagen [10], with subsequent work extending mimicry candidates to Campylobacter jejuni, EBV glycoprotein 110, and Mycobacterium tuberculosis Hsp65 [11,12]. Across the broader disease spectrum, Klebsiella pneumoniae nitrogenase shares homology with HLA-B27 in AS [24], CMV drives cross-reactive responses against topoisomerase I in SSc [25], and ganglioside-mimicking Campylobacter antigens trigger GBS [19]. This cross-disease convergence suggests molecular mimicry is a general rather than disease-specific mechanism of autoimmune triggering.
1.3. Epidemiological Evidence Linking Infection History to Autoimmune Onset
Population-level observations reinforce the mimicry hypothesis. RA patients show elevated antibody titres against Proteus mirabilis and EBV compared to healthy controls [10], and Rantapää-Dahlqvist et al. demonstrated that ACPAs appear in serum years before clinical onset [1] — consistent with an infection-triggered priming event during the pre-clinical window. Pre-clinical autoantibody windows are similarly documented in SLE [13] and AS [24]. The association between Helicobacter pylori eradication and reduced RA risk, and post-infectious disease onset timing across multiple conditions, collectively support a causal rather than merely associative relationship [16]. Identifying which pathogen-host peptide pairs constitute genuine structural mimicry candidates is therefore of direct clinical relevance — informing biomarker development, vaccine design, and mechanistic interpretation of infection-autoimmunity associations.
1.4. The Computational Gap: Sequence Similarity Is Not Structural Similarity
Despite this importance, computational mimicry identification has relied almost exclusively on sequence-based metrics — BLAST alignment scores, percentage sequence identity, and BLOSUM substitution matrices — resting on an implicit and largely unexamined assumption: that sequence similarity predicts structural similarity and therefore immunological cross-reactivity.
This assumption is biologically questionable. Structure is estimated to be three to ten times more conserved than sequence across evolutionary time, meaning structurally similar proteins can arise from sequences sharing as little as 20–30% identity [15]. For short MHC-presented peptides of 8–15 residues, the relationship is even less predictable: small sequence differences can produce dramatically different backbone conformations, while divergent sequences can converge on similar MHC-bound conformations through groove-imposed conformational constraints. T cell receptor recognition depends on the three-dimensional shape of the peptide-MHC complex, not sequence per se — meaning structurally similar but sequentially dissimilar peptides could activate the same T cell clone, a mechanism sequence-only screening would entirely miss.
No prior study has constructed a labelled, multi-pathogen dataset integrating immunogenicity prediction, sequence alignment, and atomic structural validation at the individual epitope level across both MHC class I and II, nor empirically characterised the quantitative sequence-structure relationship within a systematically curated pre-filtered candidate pool [4,14].
1.5. The Present Study
We present MimicryDB-Auto, a curated, labelled dataset of 399 pathogen-host peptide pairs spanning 32 organisms, constructed through a reproducible seven-step pipeline integrating MHC epitope prediction via NetMHCpan 4.1 and NetMHCIIpan 4.0, BLASTp sequence alignment with BLOSUM80, and atomic structural validation via TM-align with RMSD < 2.0 Å. The dataset covers both MHC class I and II epitopes across bacterial, viral, mycobacterial, parasitic, and endogenous retroviral pathogens associated with autoimmune rheumatic diseases and GBS. All structural comparisons were performed on unbound peptide conformations extracted from full-length protein structures — a necessary proxy for MHC-presented conformation and a field-wide limitation discussed in Section 4.4.
We address three questions: Does sequence identity predict structural similarity in pathogen-host peptide pairs? Do sequence-based features discriminate structurally confirmed mimics from non-mimics? Can a machine learning classifier trained on sequence and immunological features achieve reliable mimicry classification without structural information? Our central finding is that within a high-confidence pre-filtered pool (≥50% identity, ≥90% coverage), sequence identity shows near-zero correlation with structural RMSD across threshold definitions, and no individual sequence feature significantly discriminates the two classes. A Random Forest trained on sequence and immunological features confirms a weak multivariate signal exists but cannot substitute for structural validation.
2. Materials and Method
2.1. Pathogen and Epitope Selection
The selection of pathogens and their associated molecular structures included in MimicryDB-Auto was guided by a systematic review of the published molecular mimicry literature across autoimmune rheumatic and neurological diseases. Rather than restricting the dataset to RA-associated organisms alone, we deliberately incorporated pathogens implicated in a broader spectrum of autoimmune conditions — including systemic lupus erythematosus (SLE), Guillain-Barré syndrome (GBS), ankylosing spondylitis (AS), systemic sclerosis (SSc), antiphospholipid syndrome (APS), and myositis — to enable cross-disease comparison of mimicry patterns and to capture the full structural diversity of pathogen-host peptide overlaps documented in the literature. The primary sources informing pathogen selection were Fehringer and Vogl’s comprehensive review of molecular mimicry in autoimmune rheumatic diseases, Poole et al.’s systematic analysis of EBV and molecular mimicry in SLE, Yuki and Odaka’s characterisation of ganglioside mimicry in GBS, Blank et al.’s framework of autoimmunity through molecular mimicry, and Levin et al.’s characterisation of mimicry-driven neurological disease [17,18,19,20,21].
A total of 32 organisms were selected, spanning bacterial, viral, mycobacterial, parasitic, and endogenous retroviral origins (Table 1), based on documented structural or sequence overlap with disease-relevant autoantigens. Organisms with evidence across multiple disease contexts — particularly EBV across RA, SLE, and SSc, and CMV across SLE and SSc — were included once per disease category. A conceptually important category is mimotopes — structures mediating immunological equivalence through three-dimensional complementarity rather than sequence homology [20]. Of mimotope-class structures identified, only C. jejuni CMP-N-acetylneuraminic acid synthetase (NeuA) was amenable to protein-level TM-align comparison and was included in the analytical dataset (17 pairs); the Akkermansia muciniphila Fas mimotope and HCV IgG1 Fc mimotope were excluded due to the absence of suitable structures.
2.2. MHC Epitope Prediction
Epitope prediction was performed using two complementary tools to capture both MHC class I and class II presentation: NetMHCpan 4.1 for class I alleles and NetMHCIIpan 4.0 for class II alleles, accessed via the IEDB Analysis Resource. Pathogen protein sequences were retrieved from UniProt and submitted as full-length FASTA sequences for peptide scanning. Host protein sequences were similarly sourced from UniProt following preliminary review of the autoimmune mimicry literature to identify target autoantigens relevant to each disease context, with three-dimensional structures retrieved from Swiss-Prot, the Protein Data Bank (PDB), and AlphaFold model repositories as required for downstream structural validation.
For MHC class I prediction, peptides of 9-mer length were scanned as the primary target length, consistent with the dominant peptide length presented by class I molecules. A subset of early candidate pairs was also evaluated at 10-mer length during preliminary pipeline development. For MHC class II prediction, 15-mer peptides were used as the scan length, falling within the core 13–25 residue range characteristic of class II-presented epitopes and providing sufficient flanking context for accurate binding prediction by NetMHCIIpan.
The HLA allele panel covered major class I supertypes (HLA-A02:01, A11:01, A24:02, B07:02, B35:01, C07:01) and class II alleles associated with RA, SLE, and AS susceptibility (DRB1*03:01, 04:01, 04:04, 04:05, 07:01, 15:01).
Peptides were retained using a two-stage approach: first, all peptides achieving %Rank EL ≤ 0.5 across any allele were retained as strong binder candidates; second, a single best-scoring representative was selected per pathogen protein and MHC class combination based on globally lowest %Rank EL. This stringent threshold (%Rank EL ≤ 0.5, IC50 ≤ 50 nM) — more conservative than the standard weak binder cutoff (%Rank ≤ 2.0, IC50 ≤ 500 nM) — ensured that pairs advanced to structural validation represented high-confidence immunological candidates, with each protein contributing at most two epitope candidates to the dataset.
2.3. Sequence Alignment and Feature Extraction
Sequence-based alignment of predicted epitope candidates against the human proteome was performed using BLASTp via the NCBI BLAST web interface, querying each pathogen-derived peptide sequence against the Homo sapiens RefSeq Protein database. Non-default BLASTp parameters: max targets = 250, short query adjustment enabled, E-value = 0.05, word size = 3, BLOSUM80 substitution matrix (selected over BLOSUM62 for greater sensitivity at high sequence identity), gap costs 10/1, conditional compositional score matrix adjustment.
Human proteome matches were retained for downstream structural validation if they satisfied both a percentage sequence identity threshold of ≥ 50% and a query coverage threshold of ≥ 90%, ensuring that retained alignments represented substantial and contiguous sequence overlap between pathogen and host peptides rather than partial or fragmented matches. BLOSUM80 raw alignment scores were recorded without a threshold filter, capturing the full distribution of substitution-weighted similarity across both retained and borderline pairs for subsequent statistical analysis.
From the raw BLAST output, the following features were extracted and incorporated into the MimicryDB-Auto dataset: percentage identity, alignment length, BLOSUM80 raw score, and pathogen peptide length. Two derived features were computed from these primary values. BLOSUM80 per residue was calculated as the BLOSUM80 raw score divided by the alignment length, normalising the substitution-weighted similarity score for peptide length to enable fair comparison across pairs of differing lengths. Alignment coverage of sequence was calculated as the alignment length divided by the pathogen peptide length, multiplied by 100, and clipped to a maximum of 100% — capturing the proportion of the pathogen peptide that was represented in the aligned human match and providing a measure of alignment completeness independent of absolute sequence identity.
Following filtering, retained human matches were manually reviewed against the primary mimicry literature for biological plausibility before advancement to structural validation; a small number of pairs were excluded due to the absence of three-dimensional structures in PDB, Swiss-Prot, or AlphaFold repositories. These thresholds were selected to capture pairs that should, by sequence-based reasoning, be structurally similar — directly operationalising the central hypothesis that even high-confidence sequence candidates may fail structural validation. Pairs below these thresholds, potentially representing sequence-dissimilar structural mimics, represent a direction for future extension.
2.4. Structural Validation via TM-align
Atomic structural comparison of pathogen-host peptide pairs was performed using the TM-align algorithm, accessed via the AiDeepMed TM-align web server (https://aideepmed.com/TM-align/). TM-align performs sequence-order-independent structural superposition of two protein or peptide structures, optimising the TM-score to identify the maximum structural overlap between input chains without requiring prior sequence alignment.
Input structures for both pathogen and host peptides were prepared by extracting the relevant peptide chain coordinates from full-length protein three-dimensional structures using PyMOL. For pathogen peptides, the predicted epitope sequence identified in Section 2.2 was located within the available pathogen protein structure — sourced from the PDB, Swiss-Prot, or AlphaFold model repositories as described in Section 2.1 — and the corresponding residue range was extracted as an isolated chain for submission. For human peptide matches, the aligned sequence region identified by BLASTp (Section 2.3) was similarly extracted from the human protein structure, with the extracted residue range corresponding exactly to the aligned match coordinates reported by BLAST. All extractions were performed at the residue level to ensure that only the structurally relevant segment of each protein was submitted for comparison, excluding flanking regions that would introduce spurious alignment contributions.
The following outputs were recorded for each pair from the TM-align structural superposition: structural alignment length (the number of residue pairs included in the optimal structural alignment), structural RMSD (root mean square deviation of Cα backbone atoms between aligned residue pairs, reported in Ångströms), and TM-score computed with respect to the human peptide match chain length as the normalisation reference. A fourth metric, structural alignment coverage, was derived from the TM-align output as follows:
Input structures were sourced from PDB, Swiss-Prot, and AlphaFold repositories. Post-hoc pLDDT assessment revealed that 173 of 388 AlphaFold-sourced entries (44.6%) had mean pLDDT < 70 across the extracted peptide region, representing a meaningful source of structural noise. A sensitivity analysis excluding these low-confidence entries confirmed that the central finding remained robust (r = −0.226, p = 0.005, R2 = 0.051, n = 156 within the high-confidence subset).
2.5. Statistical Analysis
All statistical analyses were performed in Python 3.12 using pandas 2.x, NumPy, SciPy, and scikit-learn, executed in Google Colab. The analysis code and annotated notebook are publicly available at https://github.com/minbaku/molecular-mimicry-RA-pipeline.
2.5.1. Class definition and Missing Value Handling
The dataset of 399 peptide pairs was partitioned into two classes based on the RMSD < 2.0 Å threshold defined in Section 2.4: confirmed mimics (Y, n = 262) and non-mimics (N, n = 137), yielding a class ratio of approximately 1.9:1. Missing values in sequence alignment columns arose from the 137 N-class cross-pairs, which carry no biologically meaningful BLAST signal for the labelled pairing. These were excluded from univariate tests; N-class entries returning no BLAST hit were assigned zero values for machine learning analyses, reflecting genuine absence of sequence similarity rather than missing data.
2.5.2. Mann-Whitney U Tests
Non-parametric Mann-Whitney U tests (two-tailed, significance threshold α = 0.05) were used to compare the distributions of three sequence-derived features between confirmed mimic and non-mimic classes: BLOSUM80 raw score, identity percentage, and alignment coverage sequence. The Mann-Whitney U test was selected in preference to parametric alternatives given the non-normal distribution of peptide alignment features and the class size imbalance. Bonferroni correction was applied for three simultaneous comparisons (corrected threshold α = 0.017). Given that the N-class is zero-coded by construction, these tests serve as a validity check on class construction rather than a test of biological sequence discrimination; the within-Y-class Pearson correlation is the primary inferential statistic. Tests were implemented using scipy.stats.mannwhitneyu with alternative = ‘two-sided’.
2.5.3. Effect Size Analysis
Cohen’s d was computed for each tested feature to quantify the practical magnitude of between-class differences independently of sample size, using a custom function implementing the pooled standard deviation formula:
2.5.4. Correlation Analysis
Pearson correlation coefficients were computed between all continuous features in the dataset using pandas DataFrame.corr(), generating a full pairwise correlation matrix visualised as a lower-triangular heatmap. Key correlations reported include identity percentage versus structural RMSD (r = -0.127, p = 0.036, n = 272), and BLOSUM80 score versus TM-align score (r = −0.039).
The n = 272 comprises 262 Y-class pairs and 10 N-class pairs with genuine BLAST data; zero-coded N-class entries were excluded to avoid systematic artefact.
2.5.5. Negative Pair Construction
The 137 non-mimic pairs (N class) were constructed by cross-pairing pathogen peptides with human peptide matches drawn from the same pre-filtered pool of BLAST-confirmed sequence-similar human proteins, but paired with a different pathogen peptide than their original match. Specifically, for each pathogen peptide that yielded a valid BLAST hit and passed the sequence identity ≥ 50% and coverage ≥ 90% thresholds, the corresponding human match was reassigned to a different pathogen peptide from the dataset — one with which it had not been originally paired — and the resulting cross-pair was submitted to TM-align structural validation. Pairs yielding RMSD ≥ 2.0 Å under this cross-pairing were assigned to the non-mimic class.
This construction strategy means Mann-Whitney comparisons between Y and N classes reflect categorical class design rather than biological sequence discrimination — a consequence discussed fully in Section 3.2. The sole valid test of the sequence-structure relationship is the within-Y-class Pearson correlation.
To quantify the prevalence of structural equivalence among sequence-similar but non-matched peptide pairs, a systematic cross-pairing validation analysis was performed on the 9-aa subset. Each of the 133 Y-class 9-aa human peptide regions was paired with a randomly assigned pathogen peptide from the dataset pool, explicitly excluding its original matched partner, and submitted to TM-align structural validation. Three additional pairs arising from subsequent literature review additions to the dataset pool were included in the cross-pairing analysis, bringing the total to 136. Of these, 125 (91.9%) achieved RMSD < 2.0 Å, indicating that structural equivalence is the modal outcome — not the exception — among randomly cross-paired sequence-similar 9-aa peptide pairs. The mean RMSD of reclassified pairs was 0.75 Å, indistinguishable from the main dataset confirmed mimic mean of 0.825 Å. Only 11 pairs (8.1%) yielded RMSD ≥ 2.0 Å, all clustering just above the threshold (range 2.01–2.72 Å).
The 91.9% reclassification rate is itself a primary finding — it quantifies the structural promiscuity of short sequence-similar peptides and directly supports the paper’s central argument. The negative class represents a methodological control for within-pool sequence discrimination, not a biologically representative sample of non-mimicking peptides.
2.5.6. Machine Learning Classifier
A Random Forest classifier was trained to assess whether the combined multivariate sequence and immunological feature set could achieve reliable structural mimicry classification in the absence of structural information. RMSD and TM-align score were explicitly excluded from the feature set to prevent label leakage. The eleven features used were: BLOSUM80 score, identity percentage, alignment length (sequence), identical residue count, pathogen peptide length, human peptide length, %Rank EL, binding affinity (nM), structural alignment coverage percentage, BLOSUM80 per residue, and alignment coverage sequence.
N-class entries with no BLAST hit were zero-coded (genuine absence of similarity, not missing data). The dataset was split 80/20 (stratified, random_state = 42; training: 209 Y, 110 N; test: 53 Y, 27 N). The Random Forest was trained with n_estimators = 200, max_depth = 10, min_samples_split = 5, min_samples_leaf = 2, class_weight = ‘balanced’. The class_weight = ‘balanced’ setting automatically adjusts sample weights inversely proportional to class frequencies to account for the 1.9:1 class imbalance. Model performance was evaluated on the held-out test set using AUC-ROC, sensitivity (recall for the positive class), specificity (recall for the negative class), precision, and F1-score. Feature importances were extracted from the trained model using the built-in sklearn impurity-based importance scores.
To evaluate the specificity of RMSD thresholds for short peptide structural comparison, we computed mimic classification rates for the main dataset and the cross-paired validation set at three thresholds (1.0 Å, 1.5 Å, and 2.0 Å). The discrimination ratio—defined as the main dataset mimic rate divided by the cross-pair background rate—was calculated as a threshold-independent measure of classification specificity. This analysis informed the selection of 1.0 Å as the primary threshold for distinguishing strong from weak mimics in subsequent analyses.
The complete seven-step pipeline is summarised in Figure 1.
3. Results
3.1. Dataset Composition and Structural Validation Outcomes
MimicryDB-Auto comprises 399 pathogen-host peptide pairs spanning 32 organisms implicated in autoimmune rheumatic diseases and Guillain-Barré syndrome. Following TM-align structural superposition and application of the RMSD threshold criteria, the dataset was stratified into three biologically meaningful classes: strong mimics (RMSD < 1.0 Å, n = 159, 39.8%), weak mimics (1.0 Å ≤ RMSD < 2.0 Å, n = 103, 25.8%), and non-mimics (RMSD ≥ 2.0 Å, n = 137, 34.3%).
3.2. Between-Class Sequence Differences Reflect Dataset Construction; Within-Class Correlation Provides the Valid Test of the Sequence-Structure Relationship
Mann-Whitney U tests between Y and N classes yielded highly significant differences for all three sequence features (BLOSUM80: U = 34423.00, p < 0.0001, d = 3.892; Identity %: U = 35044.00, p < 0.0001, d = 4.608; Coverage: U = 34406.50, p < 0.0001, d = 3.749; Table 2, Figure 6).
Figure 6.
Boxplots comparing distributions of three sequence-derived features — BLOSUM80 raw score, identity percentage, and alignment coverage sequence — between confirmed mimic (Y) and non-mimic (N) classes. Highly significant between-class differences were observed (Mann-Whitney U, all p < 0.0001), reflecting categorical class construction rather than independent sequence discrimination. See Section 3.2. Effect sizes (Cohen’s d) ranged from small-to-medium (BLOSUM80, d = −0.470) to large (alignment coverage, d = −0.850).
Figure 6.
Boxplots comparing distributions of three sequence-derived features — BLOSUM80 raw score, identity percentage, and alignment coverage sequence — between confirmed mimic (Y) and non-mimic (N) classes. Highly significant between-class differences were observed (Mann-Whitney U, all p < 0.0001), reflecting categorical class construction rather than independent sequence discrimination. See Section 3.2. Effect sizes (Cohen’s d) ranged from small-to-medium (BLOSUM80, d = −0.470) to large (alignment coverage, d = −0.850).
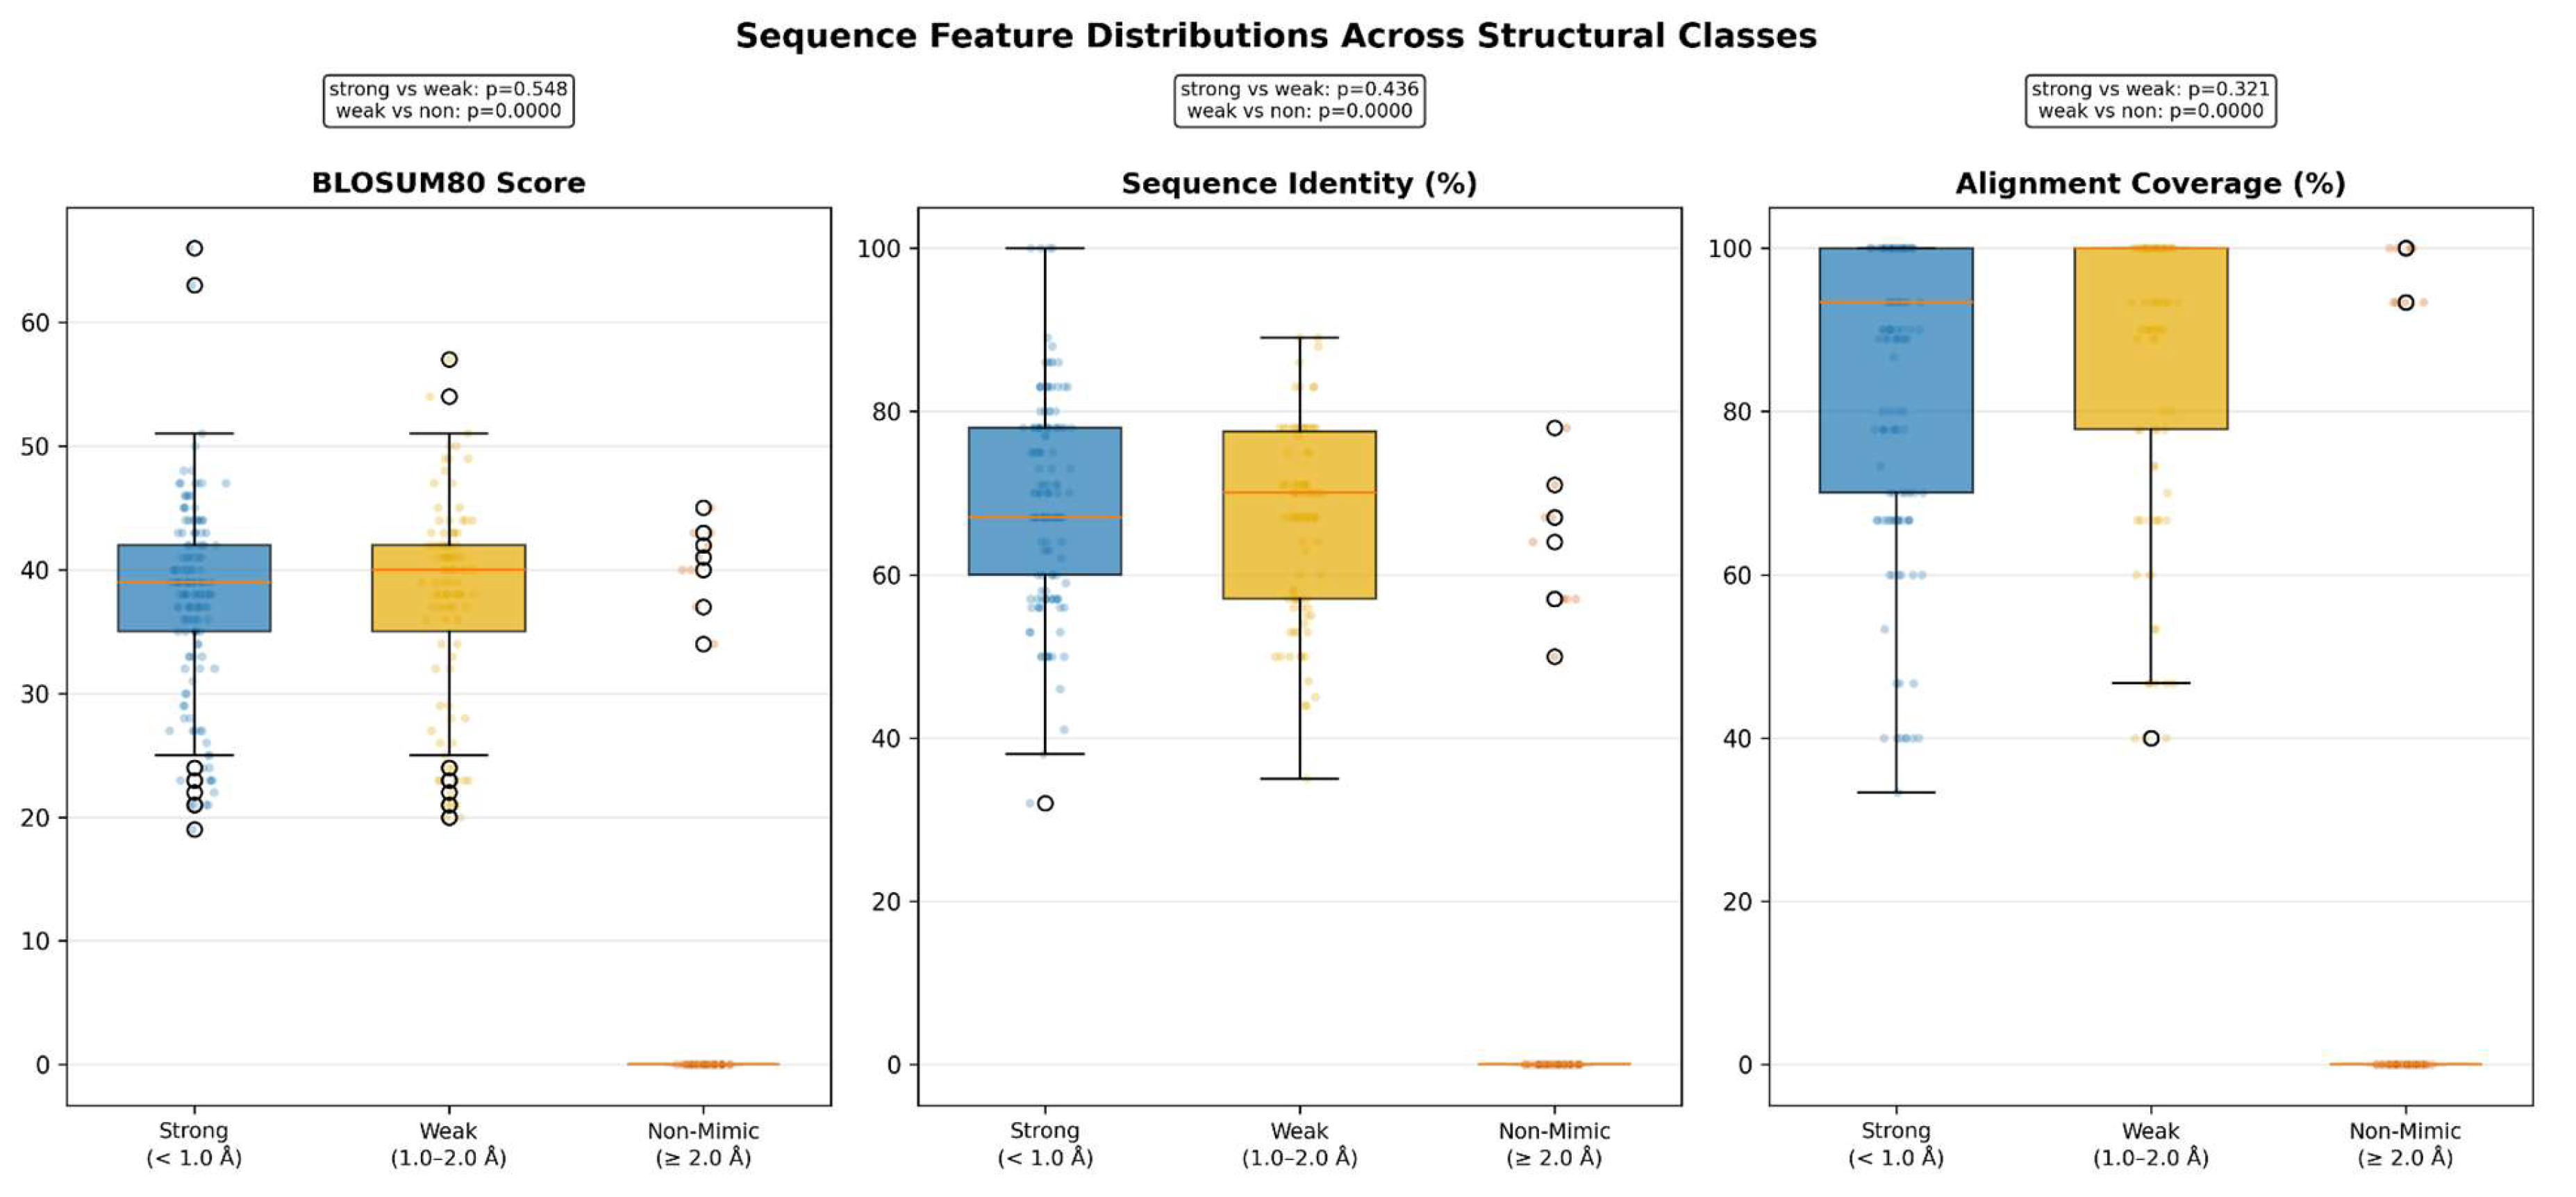

Table 2.
Mann-Whitney U results.
All tests two-tailed, α = 0.05. Cohen’s d calculated using pooled standard deviation formula. Positive d indicates Y mean > N mean. Negative d indicates N mean > Y mean. Effect size thresholds: |d| < 0.2 negligible, 0.2–0.5 small, 0.5–0.8 medium, > 0.8 large.
Table 2.
Mann-Whitney U results.
All tests two-tailed, α = 0.05. Cohen’s d calculated using pooled standard deviation formula. Positive d indicates Y mean > N mean. Negative d indicates N mean > Y mean. Effect size thresholds: |d| < 0.2 negligible, 0.2–0.5 small, 0.5–0.8 medium, > 0.8 large.
| Feature | U Statistic | P - value | Y Mean | N Mean | Cohen’s d | Bonferroni threshold | Significant | Interpretation | Achieved Power |
|---|---|---|---|---|---|---|---|---|---|
| BLOSUM80 Score | 34423.00 | <0.0001 | 37.72 | 2.66 | 3.892 | 0.0167 | Yes | Highly significant. Very large effect. Reflects categorical class construction — Y-class selected for ≥50% identity, N-class cross-pairs have zero BLAST similarity by design. Effect size confirms structural validity of class construction rather than independent sequence discrimination of mimicry outcomes. | 1.000 |
| Identity Percentage (%) | 35044.00 | <0.0001 |
68.08 | 4.15 | 4.608 | 0.0167 | Yes | Highly significant. Very large effect. Same interpretation as above — the categorical separation between classes by design produces large identity differences. Does not constitute independent evidence that identity predicts structural mimicry within a pre-filtered pool. | 1.000 |
| Alignment Coverage Sequence (%) | 34406.50 | <0.0001 | 86.30 | 6.37 | 3.749 | 0.0167 | Yes | Highly significant. Very large effect. Coverage difference reflects class construction. Y-class pairs have genuine alignment coverage from original BLAST matching; N-class cross-pairs have zero coverage by design. | 1.000 |
Significant differences reflect the categorical construction of Y and N classes — Y-class pairs were selected for ≥50% sequence identity while N-class cross-pairs have zero detectable BLAST similarity by design. These results confirm the structural validity of class construction rather than providing independent evidence of sequence-based mimicry discrimination. The primary evidence for the sequence-structure relationship is the Pearson correlation (r = −0.127, n = 272) computed within the Y-class only. Achieved power = 1.000 for all features reflects the very large Cohen’s d values produced by categorical class construction (Y-class: genuine sequence values; N-class: zero-coded by design) rather than biological signal strength. See Section 2.5.5.
It is important to note that these significant differences reflect the categorical construction of the two classes rather than independent evidence of sequence-based mimicry discrimination. Y-class pairs were selected specifically because they passed ≥50% identity and ≥90% coverage thresholds; N-class cross-pairs have zero detectable sequence similarity to their assigned human peptide by design. The significant Mann-Whitney results therefore confirm the structural validity of the class construction — that the two classes genuinely differ in sequence properties — rather than demonstrating that sequence metrics predict structural mimicry outcomes within a pre-filtered pool. The primary quantitative evidence for the sequence-structure relationship remains the Pearson correlation (r = −0.127, p = 0.036, R2 = 0.016, n = 272), which tests whether sequence variation within the Y-class predicts structural RMSD independently of class membership. Statistical significance reflects the sample size (n = 272) rather than meaningful effect; the analysis evaluates predictive power within high-confidence sequence candidates, not across the full sequence space, and range restriction within the pre-filtered pool may conservatively attenuate the observed correlation.
The central evidence for the sequence-structure relationship comes from Pearson correlation computed within the Y-class only—pairs that all passed the ≥50% identity and ≥90% coverage thresholds. At the stricter 1.0 Å threshold, sequence identity showed no statistically significant correlation with structural RMSD among strong mimics (r = -0.046, p = 0.562, n = 159, R2 = 0.002), explaining only 0.2% of variance in structural RMSD—a relationship of no predictive utility. Note that the restricted RMSD range within the strong mimic class (0.010–0.997 Å) may attenuate the correlation relative to the full Y-class analysis; the non-significance is therefore conservative and should be interpreted alongside the 2.0 Å result rather than replacing it. This finding is robust to threshold selection and strengthens the central conclusion that sequence similarity does not predict structural correspondence at the peptide level.
Pairwise strong vs. weak mimic comparisons within the Y-class yielded no significant differences for any sequence feature (all p > 0.05), while weak vs. non-mimic comparisons showed highly significant differences (all p < 0.0001) reflecting expected categorical separation by construction.
The full pairwise correlation matrix (Figure 7) confirms these findings visually: the RMSD row shows uniformly near-zero correlations with all sequence features (identity vs RMSD r = −0.127; BLOSUM80 vs TM-score r = −0.039), confirming that structural mimicry status is orthogonal to the sequence feature space.
3.3. A Multivariate Sequence Signal Exists But Is Insufficient Without Structural Validation
A Random Forest trained on sequence and immunological features (RMSD and TM-score excluded) achieved AUC-ROC = 0.958 (95% CI: 0.886–0.999) on the held-out test set (n = 80), with stable 5-fold CV performance (AUC = 0.979 ± 0.018).
To test whether sequence features can discriminate structural mimic quality within the sequence-similar pool — addressing the concern that the original Y vs N classification is trivially easy due to categorical sequence separation — we trained a Random Forest to distinguish strong mimics (RMSD < 1.0 Å, n = 159) from weak mimics (1.0 Å ≤ RMSD < 2.0 Å, n = 103) within the Y-class only. Both classes passed identical sequence thresholds (≥50% identity, ≥90% coverage), making this a genuinely hard classification task with no categorical sequence separation. The classifier achieved AUC-ROC = 0.841 on the held-out test set (n = 53; strong n = 32, weak n = 21), with 5-fold cross-validation confirming stable performance (AUC = 0.823 ± 0.053, range 0.746–0.888). The drop from AUC = 0.958 in the original Y vs N analysis to AUC = 0.841 in this within-Y-class analysis directly quantifies the inflation attributable to categorical class construction and confirms that sequence features have substantially reduced discriminative power when evaluated on a biologically realistic task. This result confirms that a genuine multivariate sequence signal exists but at a reduced magnitude consistent with the weak individual discriminability of sequence features demonstrated in Section 3.2.
Full held-out test set performance metrics are reported in Table 3.
Table 3.
Random Forest Classifier Performance on Held-Out Test Set (n = 80). 5-fold CV AUC = 0.979 ± 0.018 (range 0.957–1.000) Note: This classifier distinguishes Y-class (sequence-similar, n=262) from N-class (zero sequence similarity by construction, n=137) and represents an upper bound on classifier performance. The biologically relevant test is the strong vs. weak mimic classifier (AUC = 0.841), described in Section 3.3.
Table 3.
Random Forest Classifier Performance on Held-Out Test Set (n = 80). 5-fold CV AUC = 0.979 ± 0.018 (range 0.957–1.000) Note: This classifier distinguishes Y-class (sequence-similar, n=262) from N-class (zero sequence similarity by construction, n=137) and represents an upper bound on classifier performance. The biologically relevant test is the strong vs. weak mimic classifier (AUC = 0.841), described in Section 3.3.
| Metric | Value | 95% Bootstrap CI | Description |
|---|---|---|---|
| AUC-ROC | 0.958 | 0.886–0.999 | Overall discriminative ability across all thresholds |
| Sensitivity (Recall Y) | 1.000 | 1.000–1.000 | Proportion of confirmed mimics correctly identified — 0 false negatives across all bootstrap samples |
| Specificity (Recall N) | 0.852 | 0.708–0.967 | Proportion of non-mimics correctly identified |
| Precision (Y class) | 0.930 | 0.860–0.984 | Proportion of predicted mimics that were true mimics |
| Overall Accuracy | 0.950 | 0.900–0.988 | Proportion of all test pairs correctly classified |
| F1-score (Y class) | 0.96 | — | Harmonic mean of sensitivity and precision |
| F1-score (N class) | 0.92 | — | Harmonic mean of specificity and N-class precision |
Figure 8.
Random Forest classifier performance. Left: Feature importance scores ranked by contribution to impurity reduction across 200 trees. Sequence features (blue) dominate model importance, with BLOSUM80 per residue ranking highest (0.257). Immunological features (coral) rank lowest. Right: ROC curve for the held-out test set (n = 80), achieving AUC = 0.954.
Figure 8.
Random Forest classifier performance. Left: Feature importance scores ranked by contribution to impurity reduction across 200 trees. Sequence features (blue) dominate model importance, with BLOSUM80 per residue ranking highest (0.257). Immunological features (coral) rank lowest. Right: ROC curve for the held-out test set (n = 80), achieving AUC = 0.954.
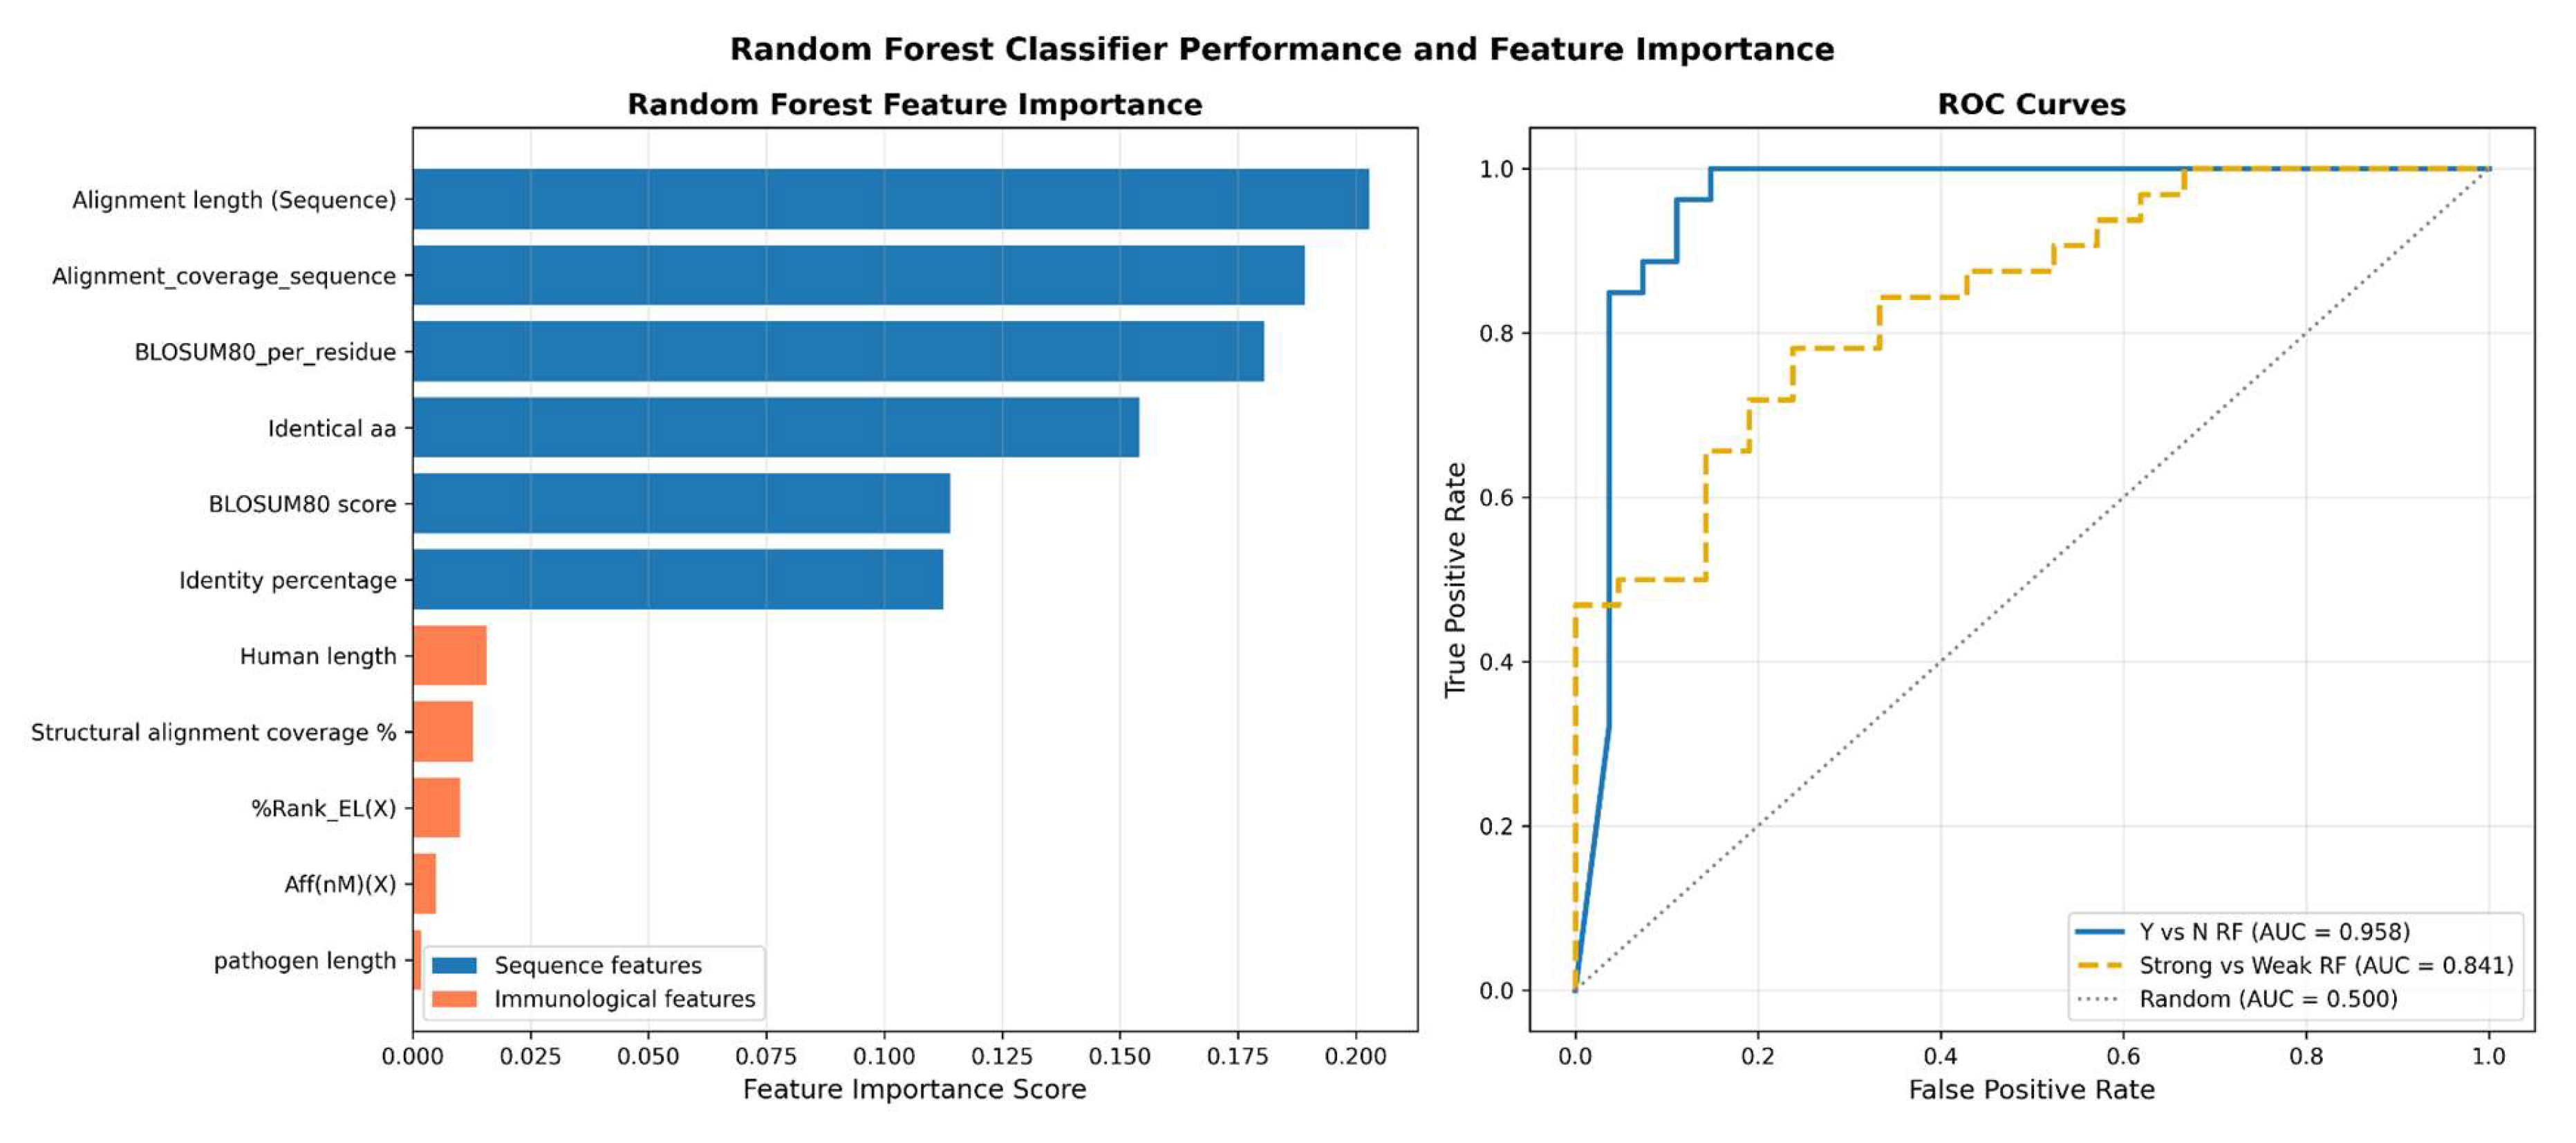
Figure 9.
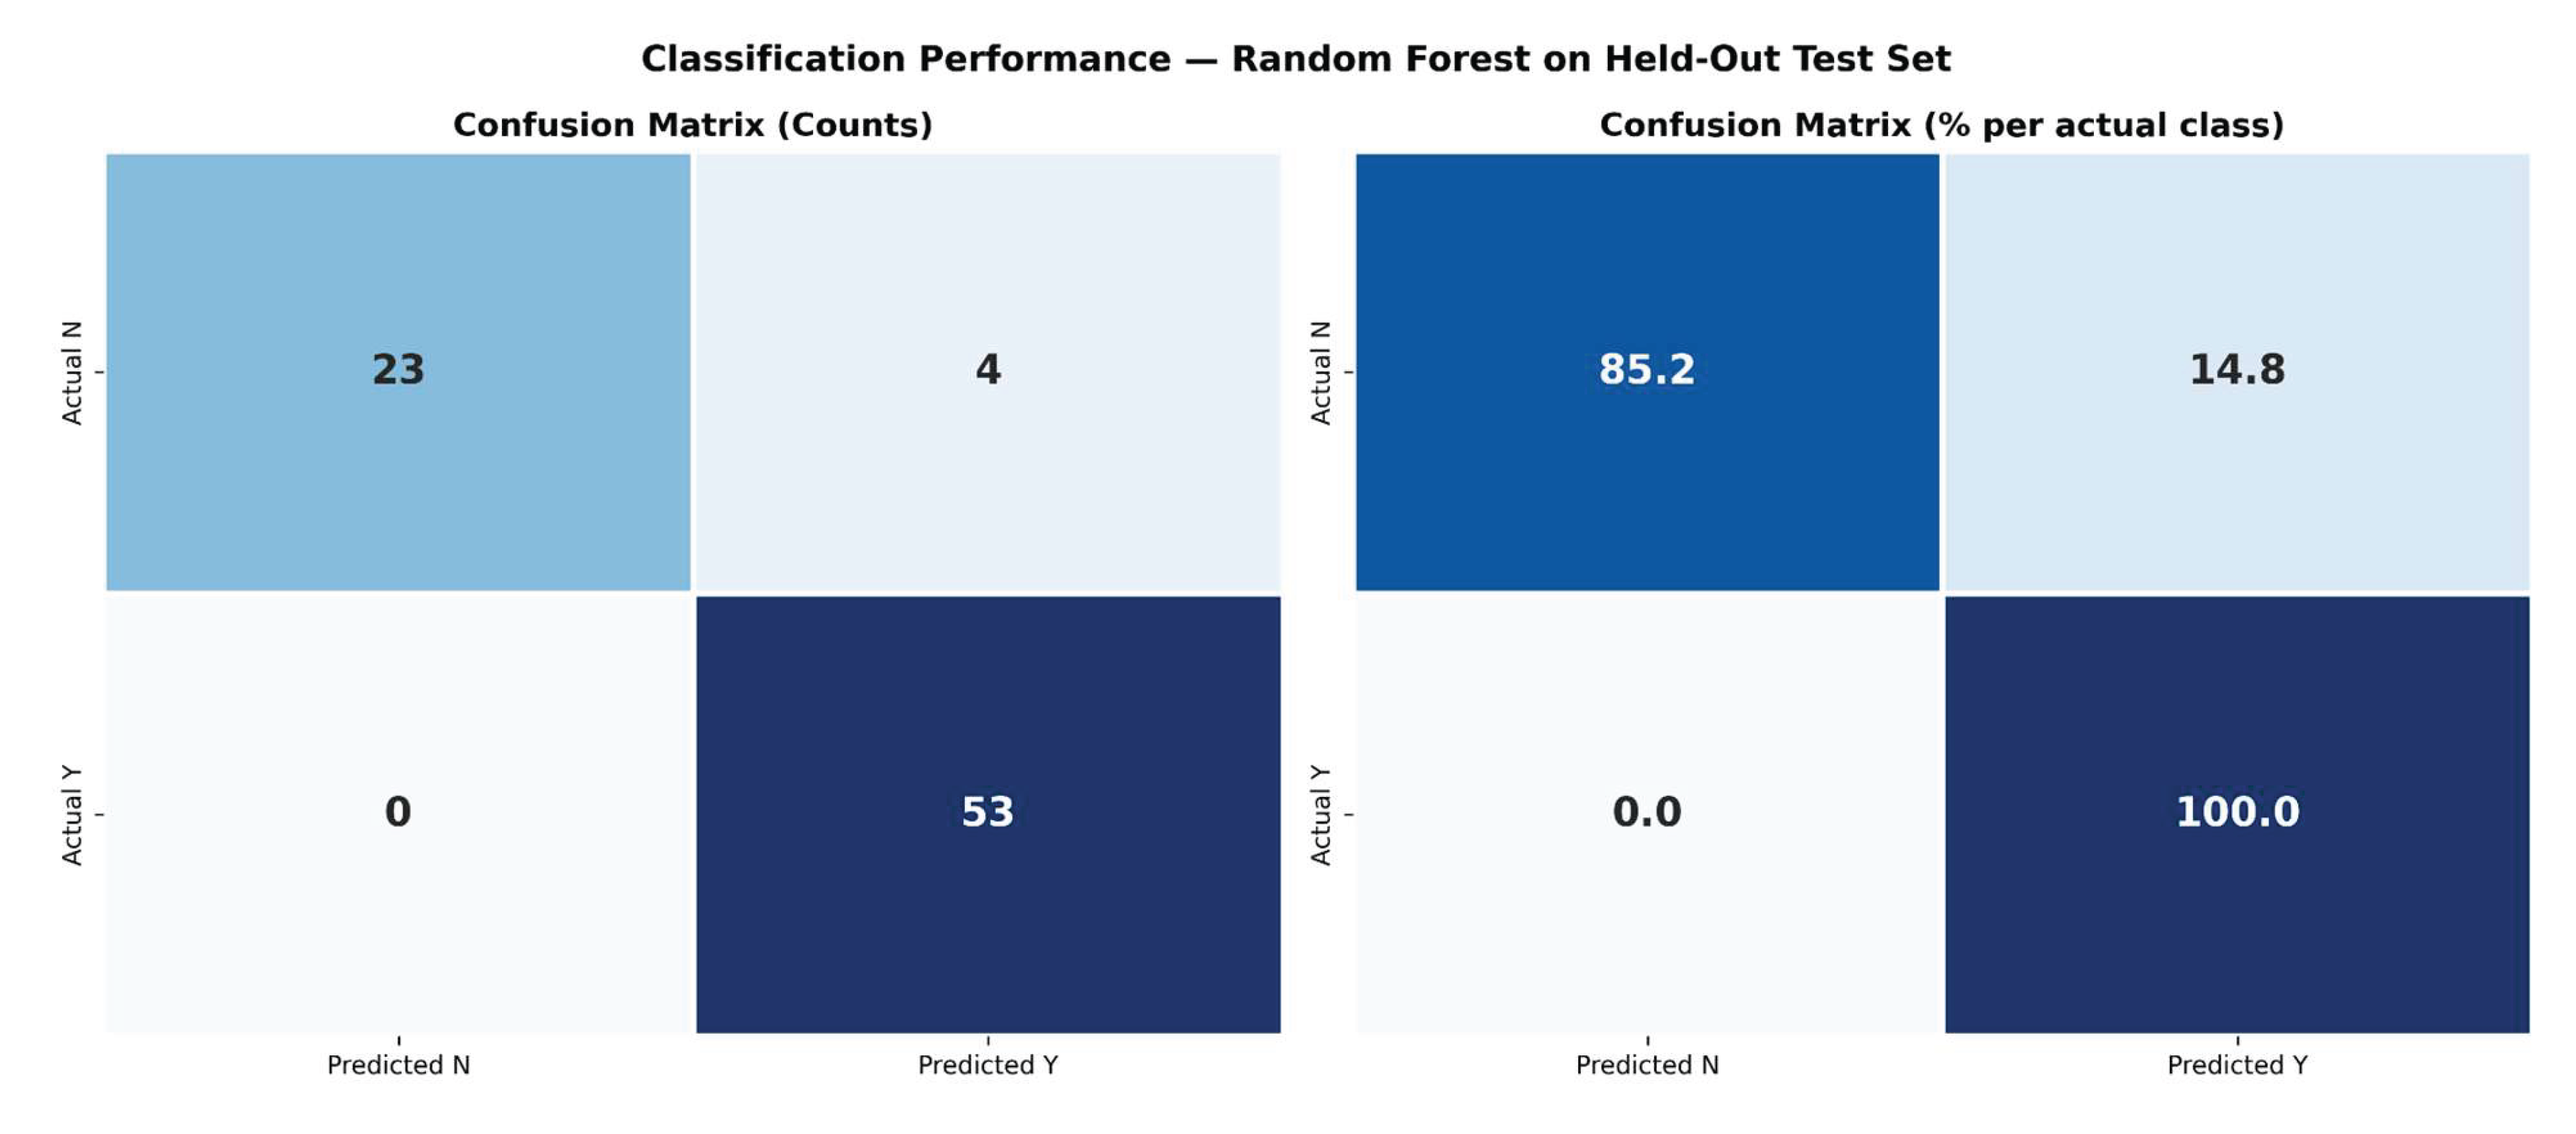
Confusion matrix for Random Forest classifier predictions on the held-out test set (n = 80). Left: raw counts. Right: percentage normalised per actual class. The model achieved 100% sensitivity (0 false negatives) and 85.2% specificity (4 false positives).
Figure 9.
Confusion matrix for Random Forest classifier predictions on the held-out test set (n = 80). Left: raw counts. Right: percentage normalised per actual class. The model achieved 100% sensitivity (0 false negatives) and 85.2% specificity (4 false positives).
Feature importance analysis revealed that BLOSUM80 per residue was the top-ranked predictive feature (importance = 0.257), followed by alignment coverage sequence (0.187), identical residue count (0.130), identity percentage (0.125), and BLOSUM80 raw score (0.117). The five top features were all sequence-derived, collectively accounting for 81.6% of total model importance. Immunological features — %Rank EL (0.013) and binding affinity (0.008) — ranked among the lowest importance features, indicating that the classifier’s discriminative power derives primarily from the sequence feature set rather than from MHC binding predictions.
The high AUC reflects a genuine multivariate signal — the discrepancy between BLOSUM80 per residue’s top feature importance (0.257) and its non-significant univariate p-value (0.193) confirms that discriminative power emerges from feature interactions rather than individual predictors. The AUC of 0.958 should be interpreted as an upper bound given the categorical class construction.
Table 4.
Random Forest Feature Importance Scores.
Importance scores represent the mean decrease in Gini impurity across all splits in all 200 trees, normalised to sum to 1.000. Sequence features collectively account for 81.1% of total model importance. Immunological features (%Rank EL and binding affinity) collectively account for 2.1% of total importance.
Table 4.
Random Forest Feature Importance Scores.
Importance scores represent the mean decrease in Gini impurity across all splits in all 200 trees, normalised to sum to 1.000. Sequence features collectively account for 81.1% of total model importance. Immunological features (%Rank EL and binding affinity) collectively account for 2.1% of total importance.
| Rank | Feature | Importance Score | Feature Type |
|---|---|---|---|
| 1 | BLOSUM80 per residue | 0.257 | Sequence |
| 2 | Alignment coverage sequence | 0.187 | Sequence |
| 3 | Identical residue count | 0.130 | Sequence |
| 4 | Identity percentage | 0.125 | Sequence |
| 5 | BLOSUM80 raw score | 0.117 | Sequence |
| 6 | Alignment length (sequence) | 0.095 | Sequence |
| 7 | Human peptide length | 0.045 | Structural |
| 8 | Structural alignment coverage | 0.017 | Structural |
| 9 | %Rank EL | 0.013 | Immunological |
| 10 | Binding affinity (nM) | 0.008 | Immunological |
| 11 | Pathogen peptide length | 0.006 | Structural |
Table 5.
Summary of all the findings.
| Finding | Statistical Evidence | Interpretation |
|---|---|---|
| Sequence identity vs RMSD | r = −0.127, p = 0.036, n=272, R2 = 0.016 | Significant but negligible relationship |
| BLOSUM80 discriminability | p < 0.0001 (MW-U) | Significant but reflects class construction, not independent sequence discrimination |
| Identity % discriminability | p < 0.0001 (MW-U) | Significant but reflects class construction, not independent sequence discrimination |
| RF multivariate signal | AUC = 0.958 (held-out test, 95% CI: 0.886–0.999); 0.979 ± 0.018 (5-fold CV) | Exists but insufficient alone |
| Sequence identity vs RMSD (pLDDT ≥ 70 subset) | r = −0.226, p = 0.005, n = 156, R2 = 0.051 | Robust to AlphaFold confidence filtering |
3.4. Threshold Sensitivity Analysis: RMSD Specificity for Short Peptide Structural Mimicry
The cross-pairing validation (Section 2.5.5) revealed that structural equivalence is the modal outcome among randomly assigned sequence-similar 9-aa pairs, raising the question of whether the 2.0 Å threshold provides adequate specificity for short peptide comparison. To evaluate threshold sensitivity, we computed mimic classification rates for the main dataset and the cross-paired validation set at three RMSD thresholds (Table 6).
At 1.5 Å and 2.0 Å, background rates of 85.3% and 91.9% produced discrimination ratios of 0.66 and 0.71, respectively. These results confirm that the 1.0 Å threshold provides optimal discrimination between biologically relevant structural mimics and sequence-similar but structurally distinct pairs, while the 2.0 Å threshold lacks sufficient specificity for short peptide structural comparison.
4. Discussion
4.1. Sequence Similarity Is an Unreliable Predictor of Structural Mimicry at the Peptide Level
The primary evidence for the inadequacy of sequence-based mimicry screening is not the between-class Mann-Whitney results, which are expected by construction, but the near-zero Pearson correlation within the Y-class (r = −0.127, R2 = 0.016), which demonstrates that among pairs that all passed stringent sequence thresholds, higher sequence identity does not predict better structural correspondence.
This empirical result validates the theoretical prediction of Illergård et al. [15] that structure is three to ten times more conserved than sequence, and extends it specifically to the immunologically critical domain of MHC-presented short peptides across a multi-disease pathogen landscape.
4.2. Structural Equivalence Without Sequence Similarity: Evidence from Cross-Pairing Validation
The more substantive finding in this section concerns what happens when sequence similarity is absent entirely. The cross-pairing validation analysis demonstrates that structural equivalence is achievable in the complete absence of sequence signal, challenging the foundational premise of sequence-based mimicry screening more directly than any within-pool analysis could.
Notably, during negative pair construction a substantial proportion of cross-paired candidates achieved RMSD < 2.0 Å and were therefore reclassified as confirmed mimics rather than negatives. This observation — that randomly shuffled sequence-similar pairs frequently produce structural equivalence — suggests that structural mimicry may be more prevalent across the autoimmune-associated pathogen landscape than sequence-based screening would predict, with implications for the underestimation of mimicry-driven autoimmune risk in current computational frameworks.
As shown in Section 3.4 and 91.9% of randomly cross-paired 9-aa pairs achieved RMSD < 2.0 Å, confirming that sequence metrics cannot distinguish genuine mimicry candidates from arbitrary cross-pairings within the sequence-similar pool. This high equivalence rate reflects geometric structural promiscuity of short peptides in the unbound state rather than confirmed immunological mimicry — a distinction addressed in Section 4.4 — and underscores that structural equivalence in the unbound state is a necessary but not sufficient criterion for biological mimicry.
BLAST analysis of the 125 structurally equivalent cross-pairs confirmed that 124 (99.2%) returned no significant BLAST hit at E-value ≤ 0.05, indicating zero detectable sequence similarity despite achieving RMSD < 2.0 Å. Only one cross-pair showed any sequence similarity (TNFSF12 paired with E. coli Aquaporin Z, identity 57%, RMSD = 0.29 Å). These 124 pairs represent sequence-dissimilar structural mimicry candidates — peptide pairs achieving backbone equivalence in the complete absence of sequence signal — that conventional sequence-based screening would never identify, directly quantifying the scope of sequence-dissimilar structural mimicry within the autoimmune-associated pathogen landscape.
4.3. The Random Forest Result: Multivariate Signal Without Univariate Significance
The AUC = 0.958 (Table 3) coexists with non-significant univariate tests because the Random Forest captures non-linear feature interactions invisible to individual Mann-Whitney tests — directly illustrated by BLOSUM80 per residue’s top importance score (0.257) despite its non-significant univariate p-value (0.193).
Two caveats contextualise the classifier performance. First, the categorical class construction — Y-class with genuine sequence similarity, N-class with zero — makes the classification problem easier than real-world screening where candidates span a continuous sequence range. Second, the 100% sensitivity with four false positives confirms the model correctly prioritises sensitivity over specificity, appropriate for an autoimmune risk screening context where missing a genuine mimic carries greater clinical consequence than a false alarm.
A Random Forest classifier trained to distinguish strong mimics (RMSD < 1.0 Å) from weak mimics (1.0-2.0 Å) within the sequence-similar Y-class achieved AUC-ROC = 0.841 (95% CI: 0.729–0.935) on held-out test data, with 5-fold cross-validation confirming stable performance (AUC = 0.823 ± 0.053, range 0.746-0.888). This demonstrates that a multivariate sequence signal exists, but with substantially reduced discriminative power compared to the original 2.0 Å analysis—consistent with the weak individual discriminability of sequence features demonstrated in Section 3.2.
Crucially, the classifier’s performance (AUC = 0.841) falls well short of the near-perfect classification (AUC = 0.954) achieved in the original 2.0 Å analysis, which was inflated by the categorical separation between Y and N classes. This result confirms that while sequence features contain some predictive signal, they cannot substitute for structural validation in distinguishing biologically relevant mimicry events. The persistent misclassification of weak mimics as strong mimics (and vice versa) underscores the fundamental limitation of sequence-based approaches: among pairs that all meet the same sequence similarity threshold, structural outcomes remain poorly predicted by sequence metrics.
4.4. Limitations
The dataset of 399 pairs, while the largest labelled multi-pathogen mimicry dataset at the individual epitope level, remains modest relative to the full diversity of pathogen-host peptide space. The negative sampling strategy draws non-mimics from the same sequence-similar pool as positives, producing a conservative bias that may inflate machine learning performance; future work should incorporate structure-first generated negatives. Structural validation was performed via the AiDeepMed TM-align web server rather than a command-line implementation, precluding batch automation. The RMSD < 2.0 Å threshold, while widely applied [3], has not been experimentally validated for immunological cross-recognition at the MHC-TCR level for short peptides; threshold sensitivity analysis suggests 1.0 Å may offer better specificity. The dataset is restricted to protein-based candidates amenable to TM-align; carbohydrate-based mimotopes such as the C. jejuni LOS ganglioside mimic [19] and citrullinated neo-epitopes fall outside the current pipeline scope. Post-hoc pLDDT assessment confirmed that 44.6% of AlphaFold-sourced entries had mean pLDDT < 70; a sensitivity analysis excluding these entries confirmed the central finding is robust (r = −0.226, R2 = 0.051, n = 156; Section 2.4). Most critically, all structural comparisons were performed on unbound peptide conformations. The MHC-bound conformation — which determines TCR recognition — can differ substantially from the unbound state, and the direction of this bias is not predictable without pMHC structural data for each allele-peptide pair. The present analysis therefore identifies candidate structural mimics for experimental prioritisation rather than confirmed cross-reactive epitopes. Future work integrating pMHC crystal structures from the IEDB structural database would enable a more immunologically direct test.
4.5. Implications for Computational Mimicry Screening and Future Directions
The results of this study have direct implications for how computational mimicry screening pipelines should be designed and interpreted. The near-zero correlation between sequence identity and structural RMSD at the peptide level (r = -0.127, p = 0.036) means that sequence-only screening cannot reliably rank or prioritise structural mimicry candidates even after stringent pre-filtering at ≥ 50% identity and ≥ 90% coverage, as the structural outcome within a pre-filtered pool is not predicted by sequence variation. Every sequence-identified mimicry candidate should be considered unvalidated without structural superposition; sequence-dissimilar candidates may equally harbour genuine structural mimics invisible to conventional screening, with direct implications for vaccine design and pre-clinical autoimmune risk assessment.
The cross-disease consistency of the sequence-structure decoupling — observed across RA, SLE, AS, SSc, APS, dermatomyositis, and GBS — strengthens the case for structure-first validation as a general standard in mimicry research rather than a disease-specific addition.
Future work should prioritise three directions. First, expansion of MimicryDB-Auto to incorporate structure-first generated candidate pairs — using AlphaFold proteome-wide structural comparison to identify mimicry candidates regardless of sequence similarity — would provide an unbiased test of structural mimicry prevalence and enable identification of sequence-dissimilar structural mimicry candidates excluded from the present dataset. Second, integration of patient HLA genotyping data with structural mimicry profiles could enable personalised mimicry risk stratification, identifying which patients are most susceptible to ADA formation or autoimmune triggering based on the intersection of their HLA allele repertoire and the structural mimicry landscape of their infection history. Third, experimental validation of top-ranked structural mimicry candidates through T cell cross-reactivity assays — testing whether T cells primed against the pathogen epitope respond to the structurally similar host peptide — would provide the functional confirmation that the present computational pipeline cannot supply and would establish the biological validity of the RMSD < 2.0 Å structural equivalence criterion in an immunological context.
5. Conclusion
This study presents MimicryDB-Auto, the first curated, labelled dataset of pathogen-host peptide pairs constructed through a reproducible seven-step pipeline integrating MHC epitope prediction, sequence alignment, and atomic structural validation at the individual epitope level across multiple autoimmune rheumatic diseases and Guillain-Barré syndrome. The central empirical finding — that sequence identity shows near-zero correlation with structural RMSD (r = -0.127, p = 0.036) and that no individual sequence feature significantly discriminates structurally confirmed mimics from non-mimics — provides systematic quantitative evidence against the implicit assumption that sequence similarity predicts structural mimicry at the MHC-presented peptide level.
Three conclusions follow. First, sequence-based screening is insufficient for reliable structural mimicry identification even at stringent thresholds. Second, a multivariate sequence signal exists — RF AUC = 0.958 in Y vs N, reduced to 0.841 for the biologically harder strong vs weak mimic task — but cannot substitute for structural validation. Third, the structural mimicry landscape appears richer than sequence-based estimates suggest: 91.9% of randomly cross-paired sequence-similar 9-aa pairs achieved RMSD < 2.0 Å, and 99.2% of structurally equivalent cross-pairs had zero detectable sequence similarity, quantifying the scope of mimicry invisible to conventional screening.
MimicryDB-Auto, the complete annotated pipeline, and pLDDT assessment data are publicly available at https://github.com/minbaku/molecular-mimicry-RA-pipeline.
Supplementary Materials
The following supporting information can be downloaded at the website of this paper posted on Preprints.org.
Author Contributions
Minza Ilahi: Conceptualization; Data curation; Formal analysis; Investigation; Methodology; Resources; Software; Validation; Visualization; Writing — original draft; Writing — review and editing.
Funding
This research received no external funding.
Institutional Review Board Statement
Not applicable. This study is entirely computational and involves no human participants, animal subjects, or identifiable personal data.
Data Availability Statement
The complete MimicryDB-Auto dataset, annotated analysis notebook, and reproducible pipeline are publicly available at https://github.com/minbaku/molecular-mimicry-RA-pipeline.
Acknowledgments
The author acknowledges the support and guidance of Sayan Chatterjee (Assistant Professor, Guru Gobind Singh Indraprastha University).The author used Claude (Anthropic) to assist with manuscript drafting, structural revision, and articulation of analytical arguments; Grammarly for grammar checking; and NotebookLM for literature database management. All scientific decisions, data generation, and analysis were performed by the author, who reviewed all AI-assisted content and takes full responsibility for the published work.
Conflicts of Interest
The author declares no conflict of interest.
References
- Rantapää-Dahlqvist, S., de Jong, B.A.W., Berglin, E., Hallmans, G., Wadell, G., Stenlund, H., Sundin, U. and van Venrooij, W.J. (2003), Antibodies against cyclic citrullinated peptide and IgA rheumatoid factor predict the development of rheumatoid arthritis. Arthritis & Rheumatism, 48: 2741-2749. [CrossRef]
- Shobha V, Singhai S, Haridas V, et al. The financial repercussions of rheumatoid arthritis and determinants of catastrophic healthcare expenditure: insights from the Karnataka chapter of the Indian rheumatology association. Health Econ Rev 2025;15:90. [CrossRef]
- Zhang Y. TM-align: a protein structure alignment algorithm based on the TM-score. Nucleic Acids Research 2005;33:2302–9. [CrossRef]
- Maguire C, Wang C, Ramasamy A, et al. Molecular mimicry as a mechanism of viral immune evasion and autoimmunity. Nat Commun 2024;15:9403. [CrossRef]
- Poole BD, Gross T, Maier S, Harley JB, James JA. Lupus-like autoantibody development in rabbits and mice after immunization with EBNA-1 fragments. J Autoimmun. 2008 Dec;31(4):362-71. Epub 2008 Oct 11. PMID: 18849143; PMCID: PMC2852321 . [CrossRef]
- Oldstone MB. Molecular mimicry and autoimmune disease. Cell. 1987 Sep 11;50(6):819-20. Erratum in: Cell 1987 Dec 4;51(5):878. PMID: 3621346. [CrossRef]
- Cunningham MW. Pathogenesis of group A streptococcal infections. Clin Microbiol Rev. 2000 Jul;13(3):470-511. PMID: 10885988; PMCID: PMC88944. [CrossRef]
- Bjornevik K, Cortese M, Healy BC, Kuhle J, Mina MJ, Leng Y, Elledge SJ, Niebuhr DW, Scher AI, Munger KL, Ascherio A. Longitudinal analysis reveals high prevalence of Epstein-Barr virus associated with multiple sclerosis. Science. 2022 Jan 21;375(6578):296-301. Epub 2022 Jan 13. PMID: 35025605. [CrossRef]
- Atkinson MA, Bowman MA, Campbell L, Darrow BL, Kaufman DL, Maclaren NK. Cellular immunity to a determinant common to glutamate decarboxylase and coxsackie virus in insulin-dependent diabetes. J Clin Invest. 1994 Nov;94(5):2125-9. PMID: 7962558; PMCID: PMC294659. [CrossRef]
- Ebringer A, Rashid T. Rheumatoid arthritis is caused by a Proteus urinary tract infection. APMIS. 2014 May;122(5):363-8. Epub 2013 Aug 29. PMID: 23992372. [CrossRef]
- Albani S, Tuckwell JE, Esparza L, Carson DA, Roudier J. The susceptibility sequence to rheumatoid arthritis is a cross-reactive B cell epitope shared by the Escherichia coli heat shock protein dnaJ and the histocompatibility leukocyte antigen DRB10401 molecule. J Clin Invest. 1992 Jan;89(1):327-31. PMID: 1370300; PMCID: PMC442852. [CrossRef]
- Wegner N, Lundberg K, Kinloch A, Fisher B, Malmström V, Feldmann M, Venables PJ. Autoimmunity to specific citrullinated proteins gives the first clues to the etiology of rheumatoid arthritis. Immunol Rev. 2010 Jan;233(1):34-54. PMID: 20192991. [CrossRef]
- Arbuckle MR, McClain MT, Rubertone MV, et al. Development of Autoantibodies before the Clinical Onset of Systemic Lupus Erythematosus. N Engl J Med 2003;349:1526–33. [CrossRef]
- Kanduc D. Peptide cross-reactivity: the original sin of vaccines. Front Biosci (Schol Ed). 2012 Jun 1;4(4):1393-401. PMID: 22652881. [CrossRef]
- Illergård K, Ardell DH, Elofsson A. Structure is three to ten times more conserved than sequence--a study of structural response in protein cores. Proteins. 2009 Nov 15;77(3):499-508. PMID: 19507241. [CrossRef]
- Lee TH, Wu MC, Lee MH, Liao PL, Lin CC, Wei JC. Influence of Helicobacter pylori infection on risk of rheumatoid arthritis: a nationwide population-based study. Sci Rep. 2023 Sep 13;13(1):15125. PMID: 37704688; PMCID: PMC10499872. [CrossRef]
- Fehringer M, Vogl T. Molecular mimicry in the pathogenesis of autoimmune rheumatic diseases. Journal of Translational Autoimmunity 2025;10:100269. [CrossRef]
- Poole BD, Scofield RH, Harley JB, et al. Epstein-Barr virus and molecular mimicry in systemic lupus erythematosus. Autoimmunity 2006;39:63–70. [CrossRef]
- Yuki N, Odaka M. Ganglioside mimicry as a cause of Guillain–Barré syndrome. Current Opinion in Neurology 2005;18:557–61. [CrossRef]
- Blank M, Barzilai O, Shoenfeld Y. Molecular mimicry and auto-immunity. Clinic Rev Allerg Immunol 2007;32:111–8. [CrossRef]
- Levin MC, Lee SM, Kalume F, et al. Autoimmunity due to molecular mimicry as a cause of neurological disease. Nat Med 2002;8:509–13. [CrossRef]
- Scher JU, Sczesnak A, Longman RS, et al. Expansion of intestinal Prevotella copri correlates with enhanced susceptibility to arthritis. eLife 2013;2:e01202. [CrossRef]
- Wegner N, Wait R, Sroka A, et al. Peptidylarginine deiminase from Porphyromonas gingivalis citrullinates human fibrinogen and α-enolase: Implications for autoimmunity in rheumatoid arthritis. Arthritis & Rheumatism 2010;62:2662–72. [CrossRef]
- Ebringer A, Rashid T, Wilson C, Ptaszynska T, Fielder M. Ankylosing Spondylitis, HLA-B27 and Klebsiella-an overview: proposal for early diagnosis and treatment. Current Rheumatology Reviews. 2006 Feb 1; 2(1):55-68.
- Lunardi C, Bason C, Navone R, et al. Systemic sclerosis immunoglobulin G autoantibodies bind the human cytomegalovirus late protein UL94 and induce apoptosis in human endothelial cells. Nat Med 2000;6:1183–6. [CrossRef]
- Agmon-Levin N, Blank M, Paz Z, et al. Molecular mimicry in systemic lupus erythematosus. Lupus 2009;18:1181–5. [CrossRef]
- Megremis S, Walker TDJ, He X, et al. Analysis of human total antibody repertoires in TIF1γ autoantibody positive dermatomyositis. Commun Biol 2021;4:419. [CrossRef]
- Gilbert M, Karwaski M-F, Bernatchez S, et al. The Genetic Bases for the Variation in the Lipo-oligosaccharide of the Mucosal Pathogen, Campylobacter jejuni. Journal of Biological Chemistry 2002;277:327–37. [CrossRef]
- Nelson PN, Roden D, Nevill A, et al. Rheumatoid Arthritis is Associated with IgG Antibodies to Human Endogenous Retrovirus Gag Matrix: A Potential Pathogenic Mechanism of Disease? J Rheumatol 2014;41:1952–60. [CrossRef]
- Trela M, Nelson PN, Rylance PB. The role of molecular mimicry and other factors in the association of Human Endogenous Retroviruses and autoimmunity. APMIS 2016;124:88–104. [CrossRef]
- Rost B. Twilight zone of protein sequence alignments. Protein Engineering, Design and Selection 1999;12:85–94. [CrossRef]
- Linton D, Karlyshev AV, Hitchen PG, et al. Multiple N-acetyl neuraminic acid synthetase (neuB ) genes in Campylobacter jejuni : identification and characterization of the gene involved in sialylation of lipo-oligosaccharide. Molecular Microbiology 2000;35:1120–34. [CrossRef]
Figure 1.
The diagram of the Pipeline used.
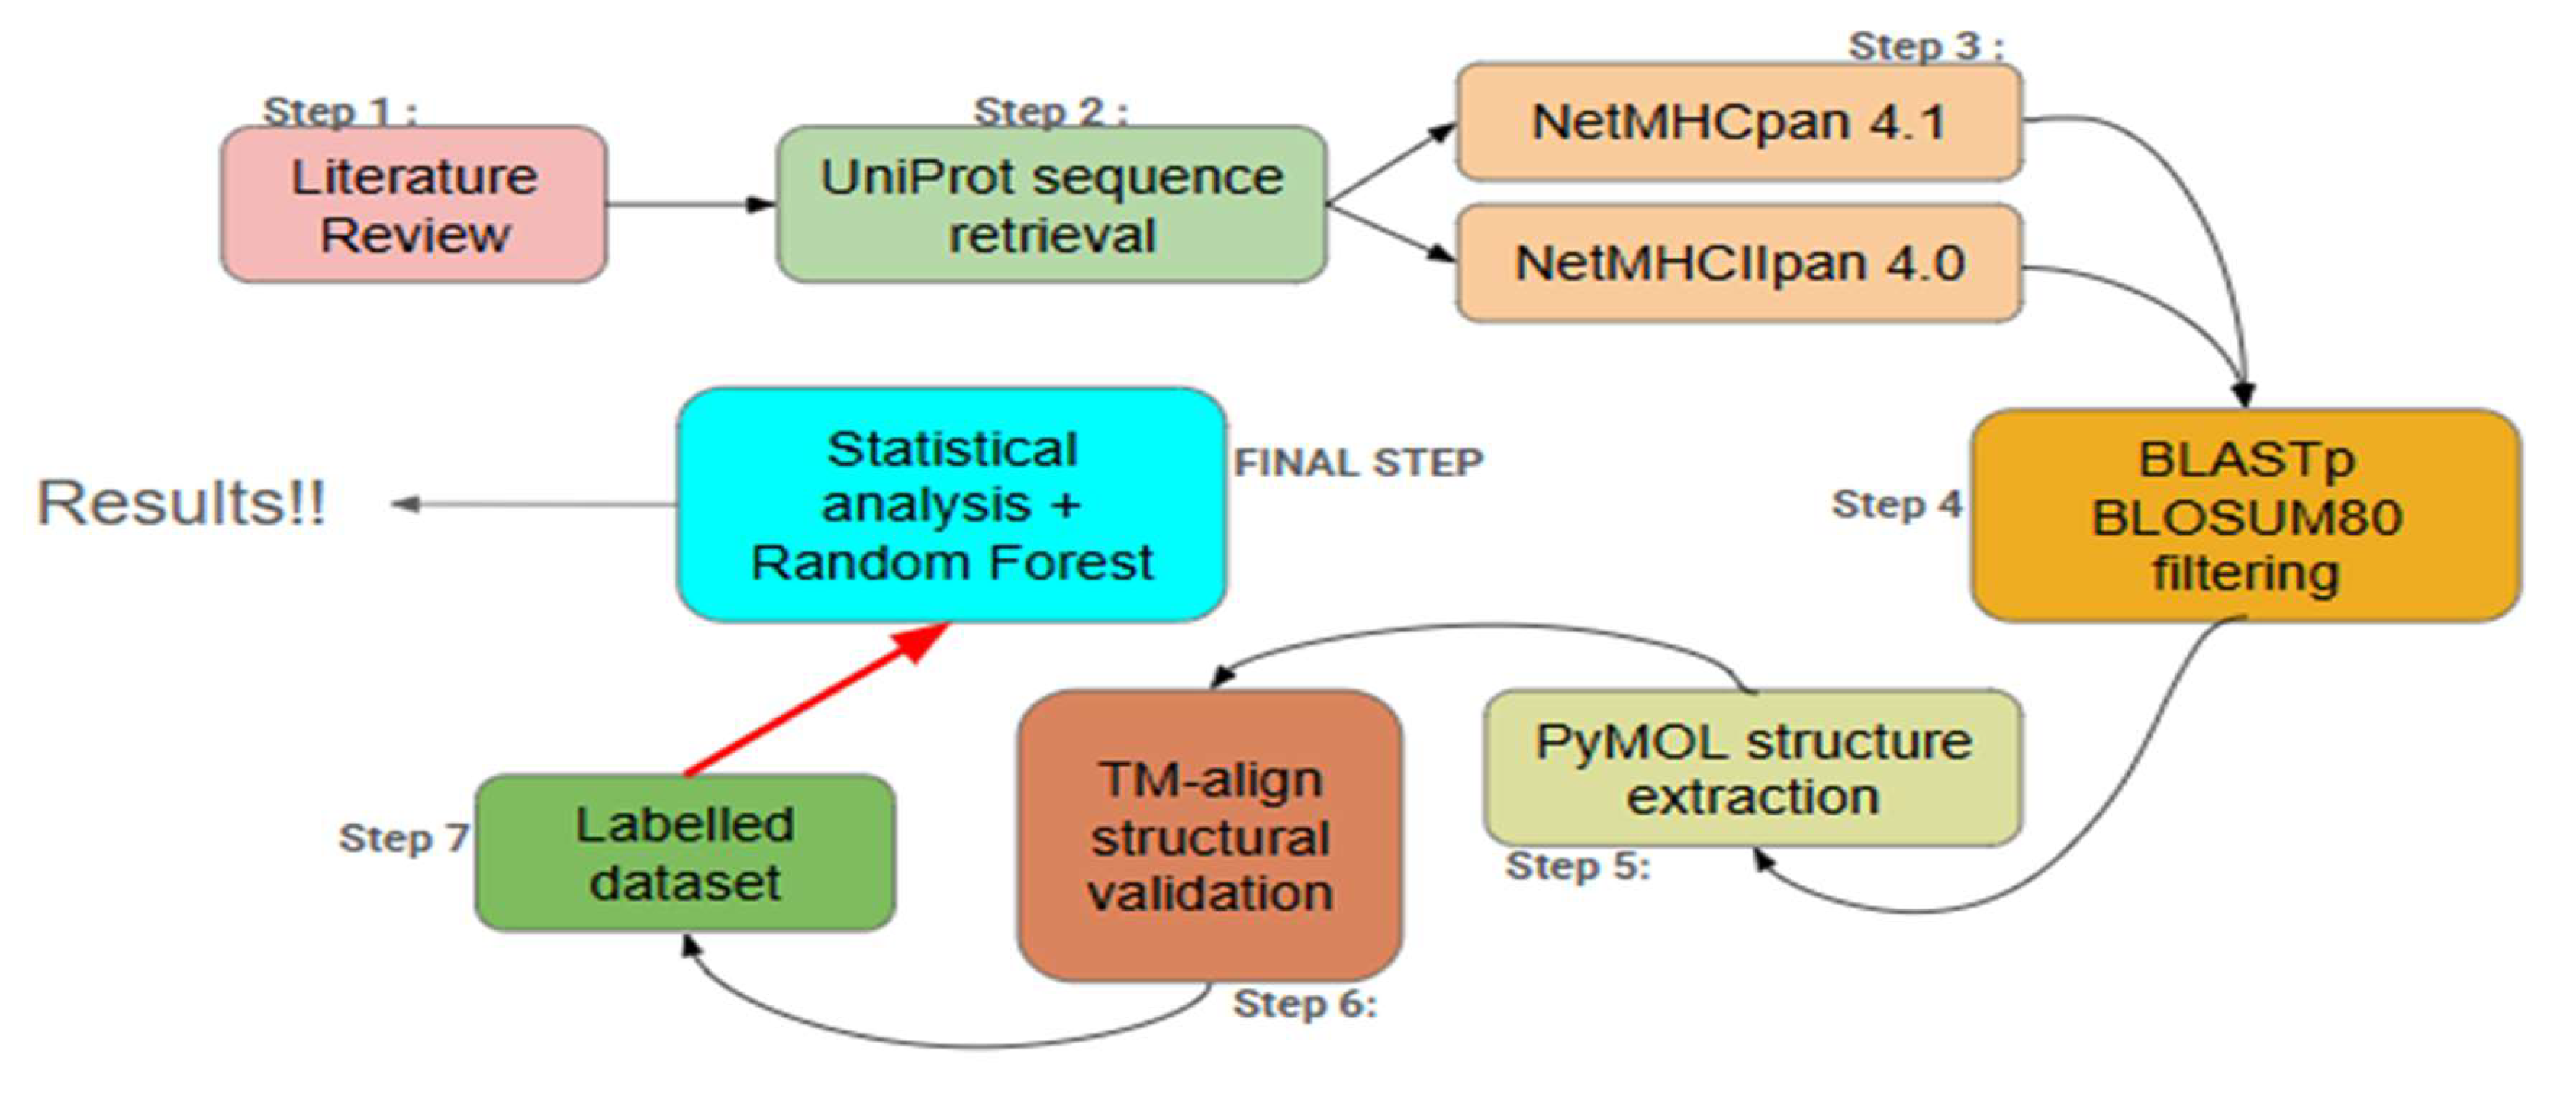
Figure 2.
The distribution of 32 organisms and 399 Pathogen-Host pairs by Autoimmune disorders.
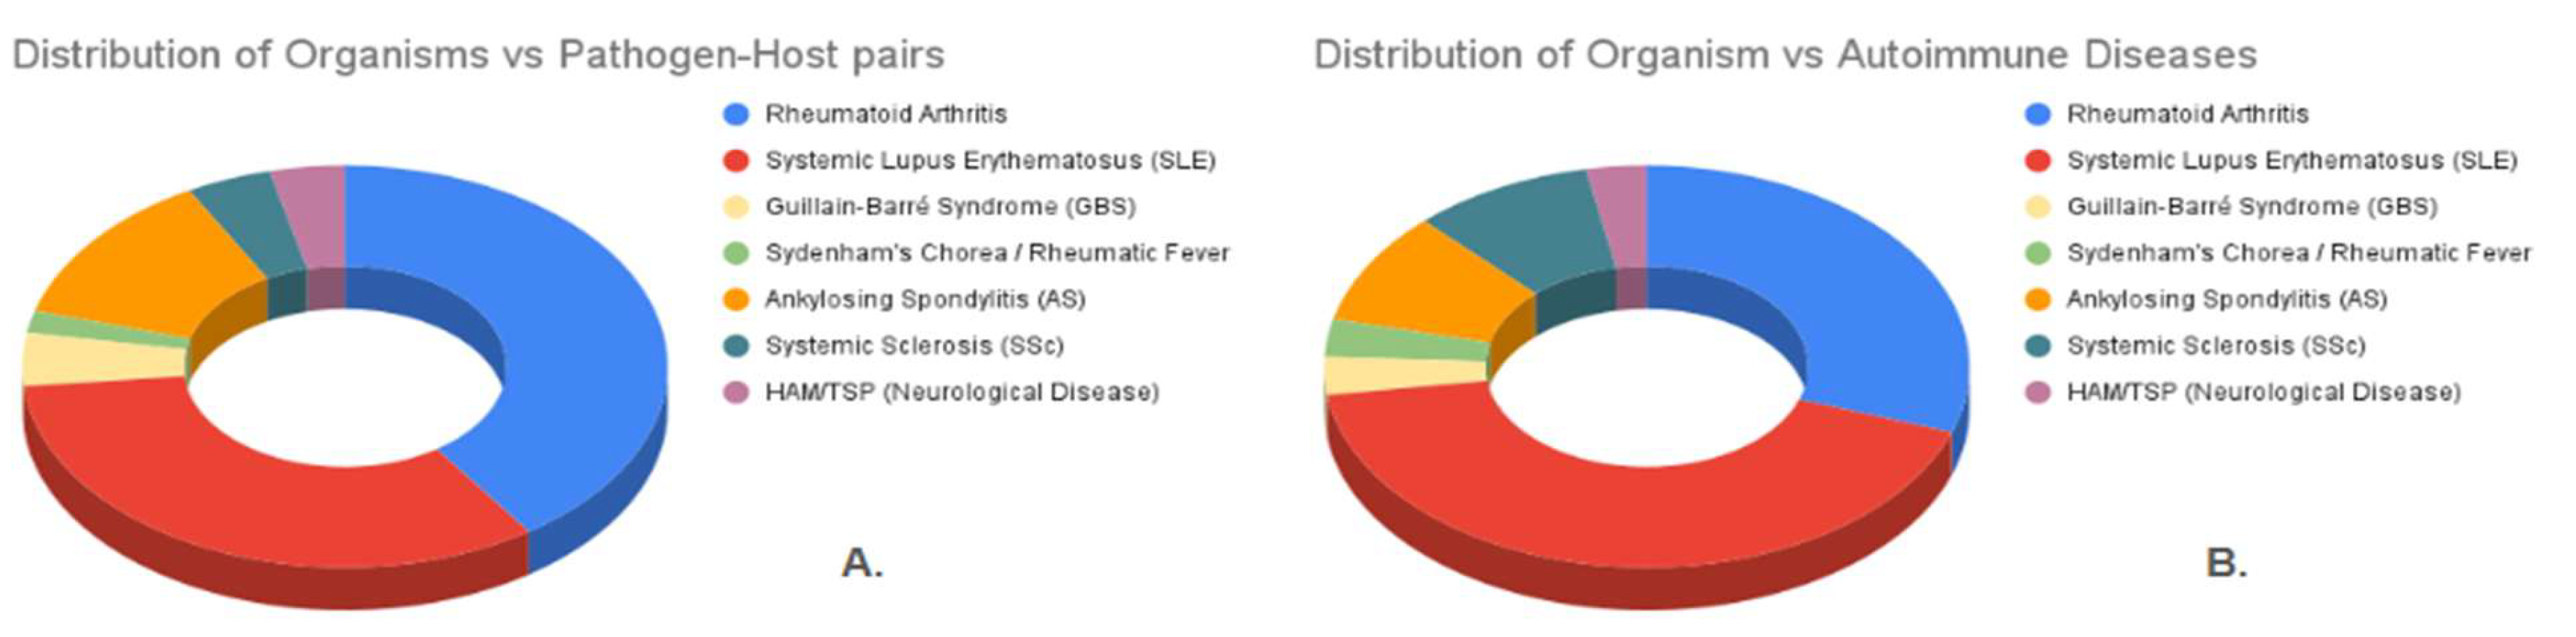
Figure 3.
Structural RMSD versus sequence identity across all 399 pathogen-host peptide pairs. Confirmed mimics (RMSD < 2.0 Å, n = 262, blue) and non-mimics (RMSD ≥ 2.0 Å, n = 137, coral) are shown separately. The correlation is computed across the full 399-pair dataset including zero-coded N-class entries, and reflects the categorical separation between classes by construction rather than a within-pool sequence-structure relationship. The interpretively valid statistic — the correlation between sequence identity and structural RMSD within the Y-class only, where all pairs share the same sequence threshold and variation is genuine — is r = −0.127 (p = 0.036, R2 = 0.016, n = 272), reported throughout the manuscript. The dashed horizontal line indicates the 2.0 Å confirmation threshold. Jitter applied to x-axis for visibility of overlapping points.
Figure 3.
Structural RMSD versus sequence identity across all 399 pathogen-host peptide pairs. Confirmed mimics (RMSD < 2.0 Å, n = 262, blue) and non-mimics (RMSD ≥ 2.0 Å, n = 137, coral) are shown separately. The correlation is computed across the full 399-pair dataset including zero-coded N-class entries, and reflects the categorical separation between classes by construction rather than a within-pool sequence-structure relationship. The interpretively valid statistic — the correlation between sequence identity and structural RMSD within the Y-class only, where all pairs share the same sequence threshold and variation is genuine — is r = −0.127 (p = 0.036, R2 = 0.016, n = 272), reported throughout the manuscript. The dashed horizontal line indicates the 2.0 Å confirmation threshold. Jitter applied to x-axis for visibility of overlapping points.
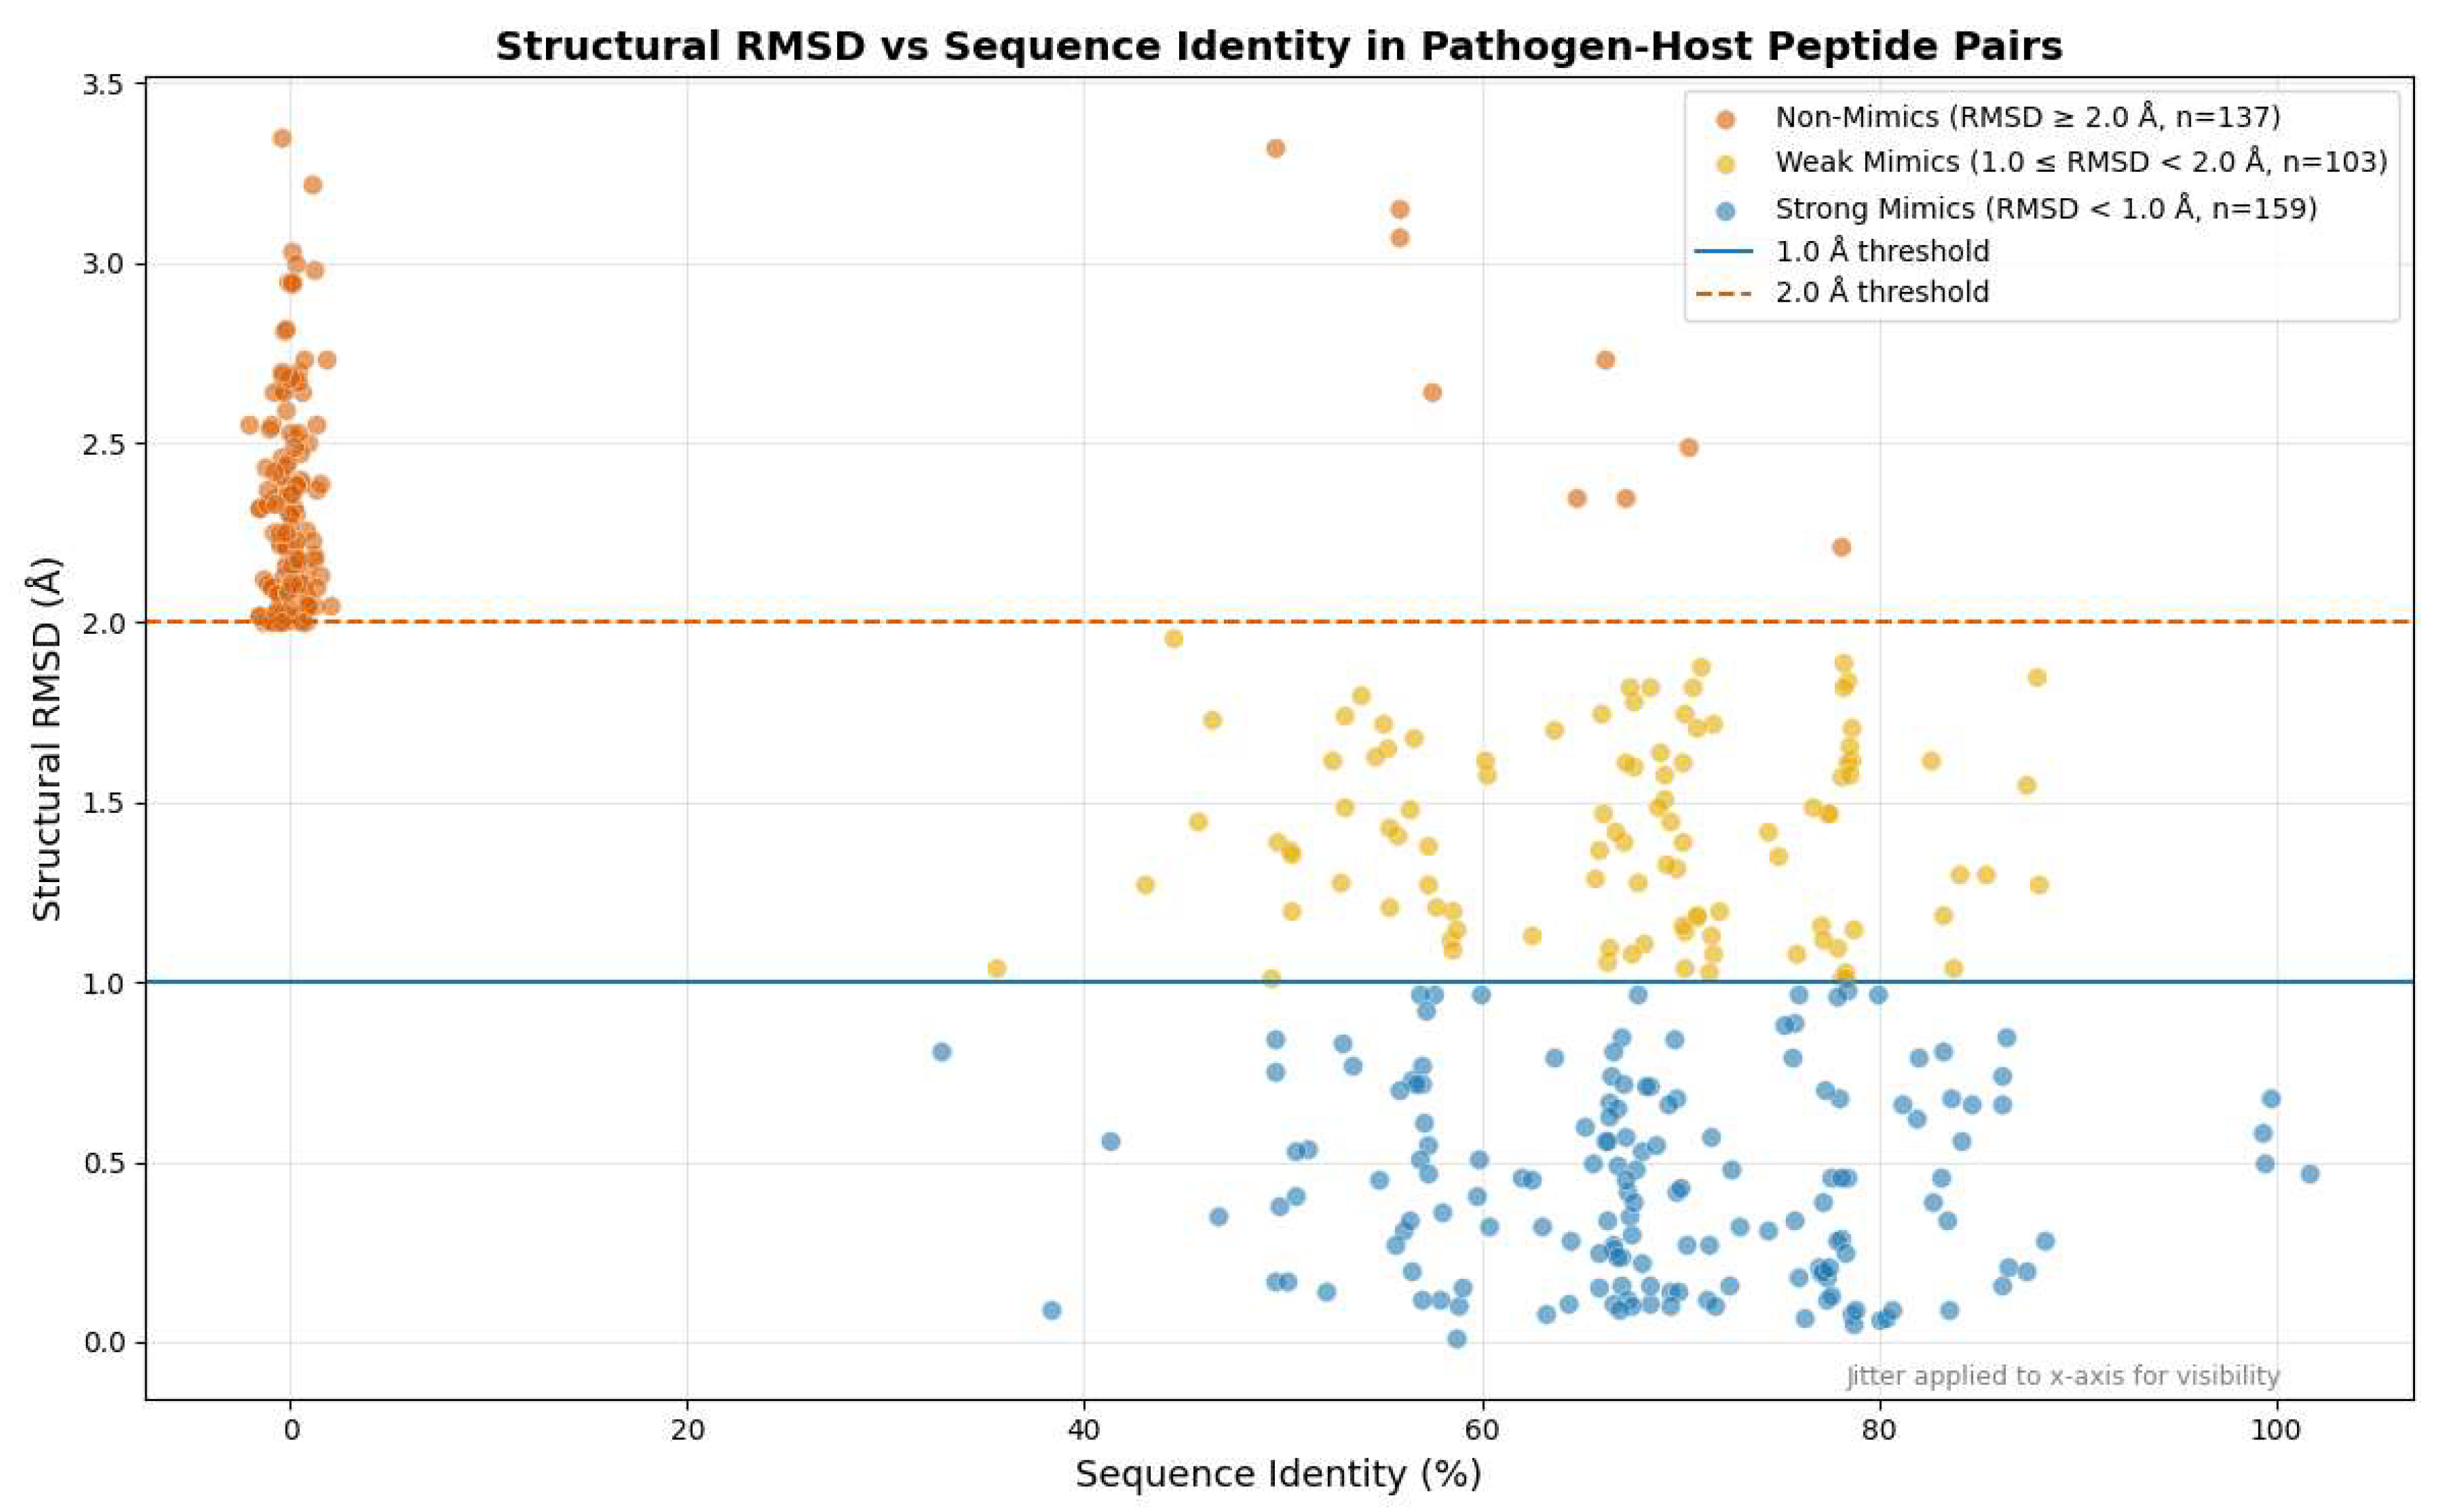
Figure 4.
Structural RMSD distributions by autoimmune disease category across MimicryDB-Auto. Violin plots with overlaid individual data points show the distribution of structural RMSD values for confirmed mimics (blue, Y) and non-mimics (coral, N) within each disease category. The dashed horizontal line indicates the 2.0 Å confirmation threshold. Confirmed mimics cluster below 2.0 Å and non-mimics cluster immediately above it across all disease contexts, demonstrating cross-disease consistency of the structural validation outcome. SC = Sydenham’s Chorea. Cross-disease comparisons are limited by unequal sample sizes across categories (RA n=161, SLE n=132 vs. SSc n=17, SC n=7). Violin plots for categories with fewer than 20 pairs are shown for completeness but should not be interpreted as statistically representative of those disease contexts.
Figure 4.
Structural RMSD distributions by autoimmune disease category across MimicryDB-Auto. Violin plots with overlaid individual data points show the distribution of structural RMSD values for confirmed mimics (blue, Y) and non-mimics (coral, N) within each disease category. The dashed horizontal line indicates the 2.0 Å confirmation threshold. Confirmed mimics cluster below 2.0 Å and non-mimics cluster immediately above it across all disease contexts, demonstrating cross-disease consistency of the structural validation outcome. SC = Sydenham’s Chorea. Cross-disease comparisons are limited by unequal sample sizes across categories (RA n=161, SLE n=132 vs. SSc n=17, SC n=7). Violin plots for categories with fewer than 20 pairs are shown for completeness but should not be interpreted as statistically representative of those disease contexts.
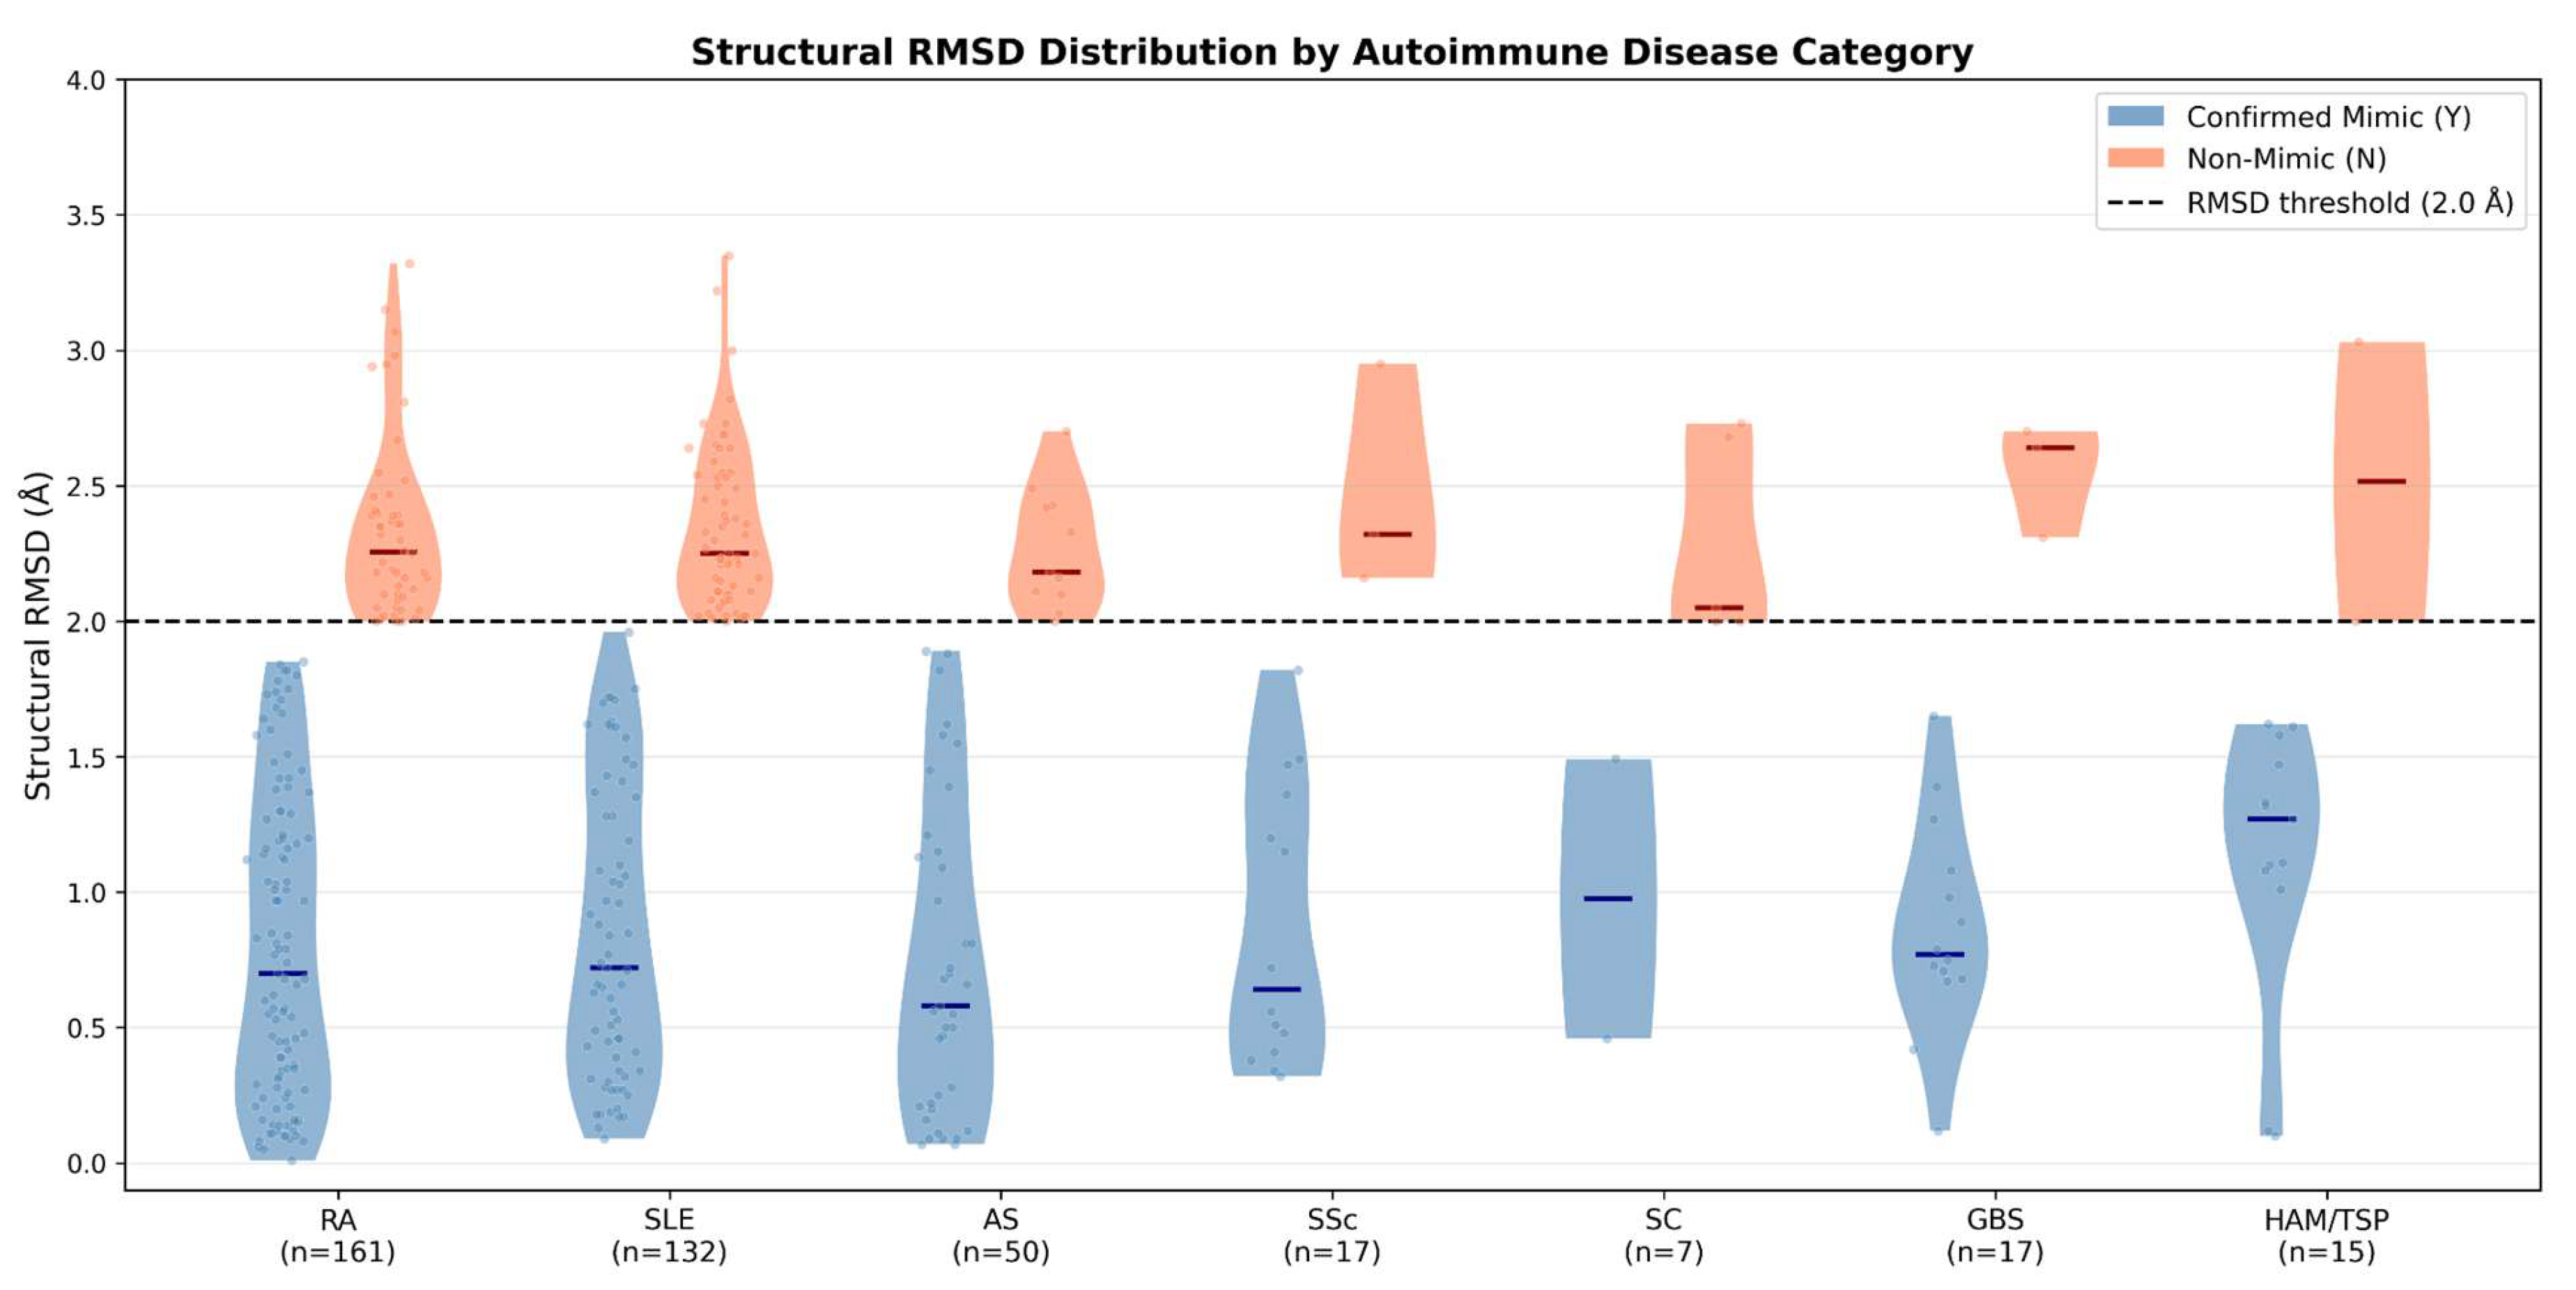
Figure 5.
Distribution of structural RMSD values across confirmed mimic (Y, n = 262, blue) and non-mimic (N, n = 137, coral) classes. Confirmed mimics cluster below the 2.0 Å threshold (mean 0.825 Å, SD 0.546 Å) while non-mimics cluster immediately above it (mean 2.344 Å, SD 0.313 Å), reflecting the cross-pairing negative construction strategy. Dashed line indicates the 2.0 Å confirmation threshold.
Figure 5.
Distribution of structural RMSD values across confirmed mimic (Y, n = 262, blue) and non-mimic (N, n = 137, coral) classes. Confirmed mimics cluster below the 2.0 Å threshold (mean 0.825 Å, SD 0.546 Å) while non-mimics cluster immediately above it (mean 2.344 Å, SD 0.313 Å), reflecting the cross-pairing negative construction strategy. Dashed line indicates the 2.0 Å confirmation threshold.
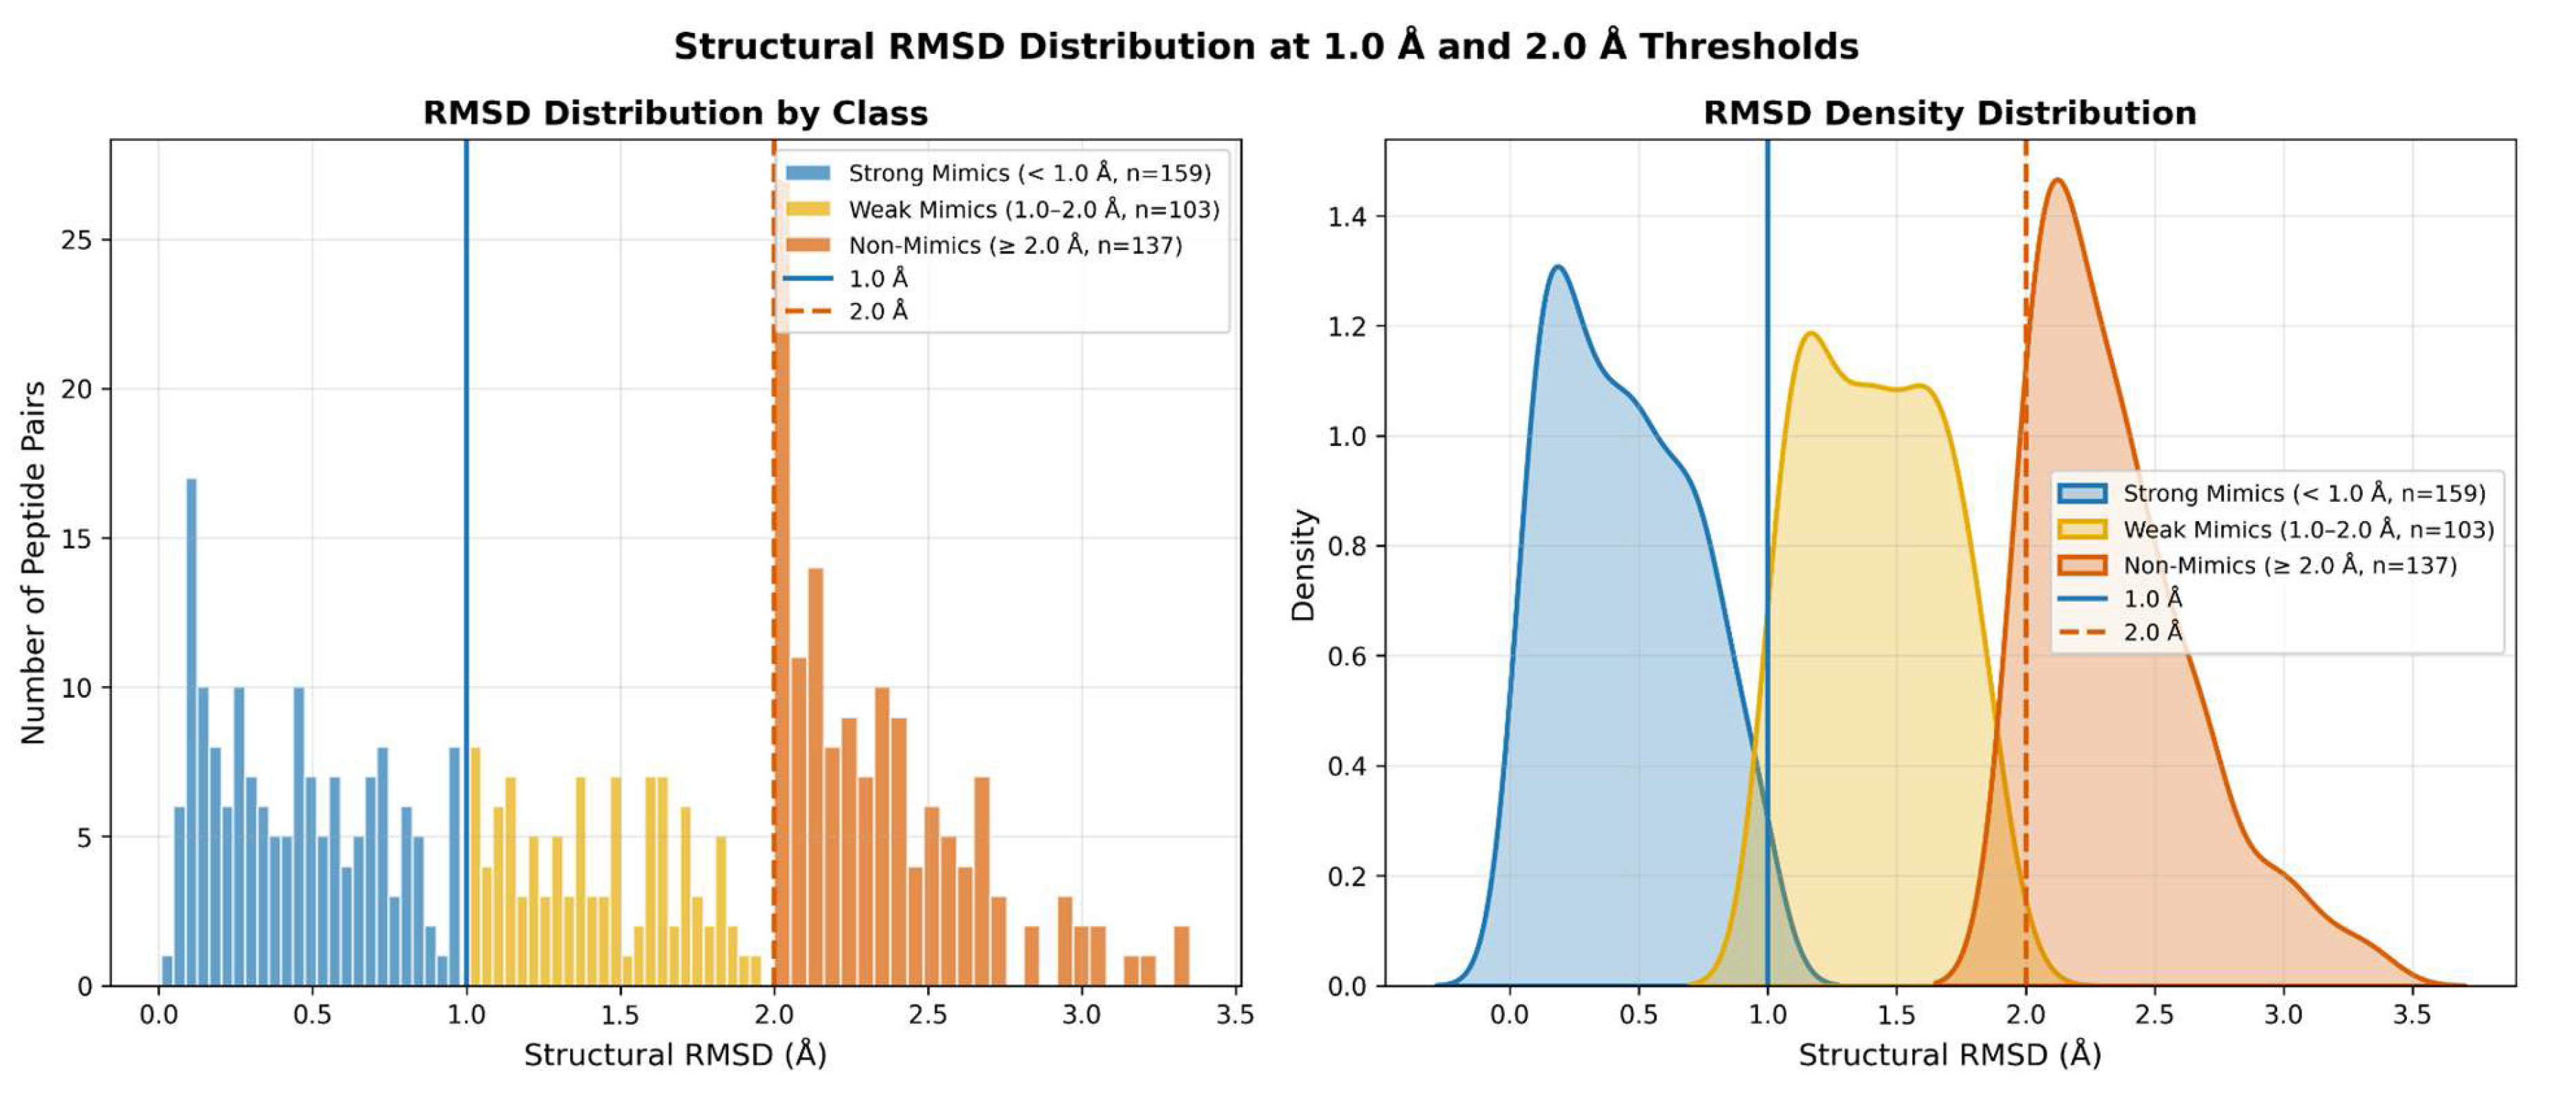
Figure 7.
Pairwise Pearson correlation heatmap of all continuous features in MimicryDB-Auto (lower triangle shown). The structural RMSD row shows uniformly near-zero correlations with all sequence features, confirming that structural mimicry status is orthogonal to the sequence feature space. Key correlations: identity percentage vs structural RMSD r = −0.127; BLOSUM80 score vs TM-align score r = −0.039.
Figure 7.
Pairwise Pearson correlation heatmap of all continuous features in MimicryDB-Auto (lower triangle shown). The structural RMSD row shows uniformly near-zero correlations with all sequence features, confirming that structural mimicry status is orthogonal to the sequence feature space. Key correlations: identity percentage vs structural RMSD r = −0.127; BLOSUM80 score vs TM-align score r = −0.039.
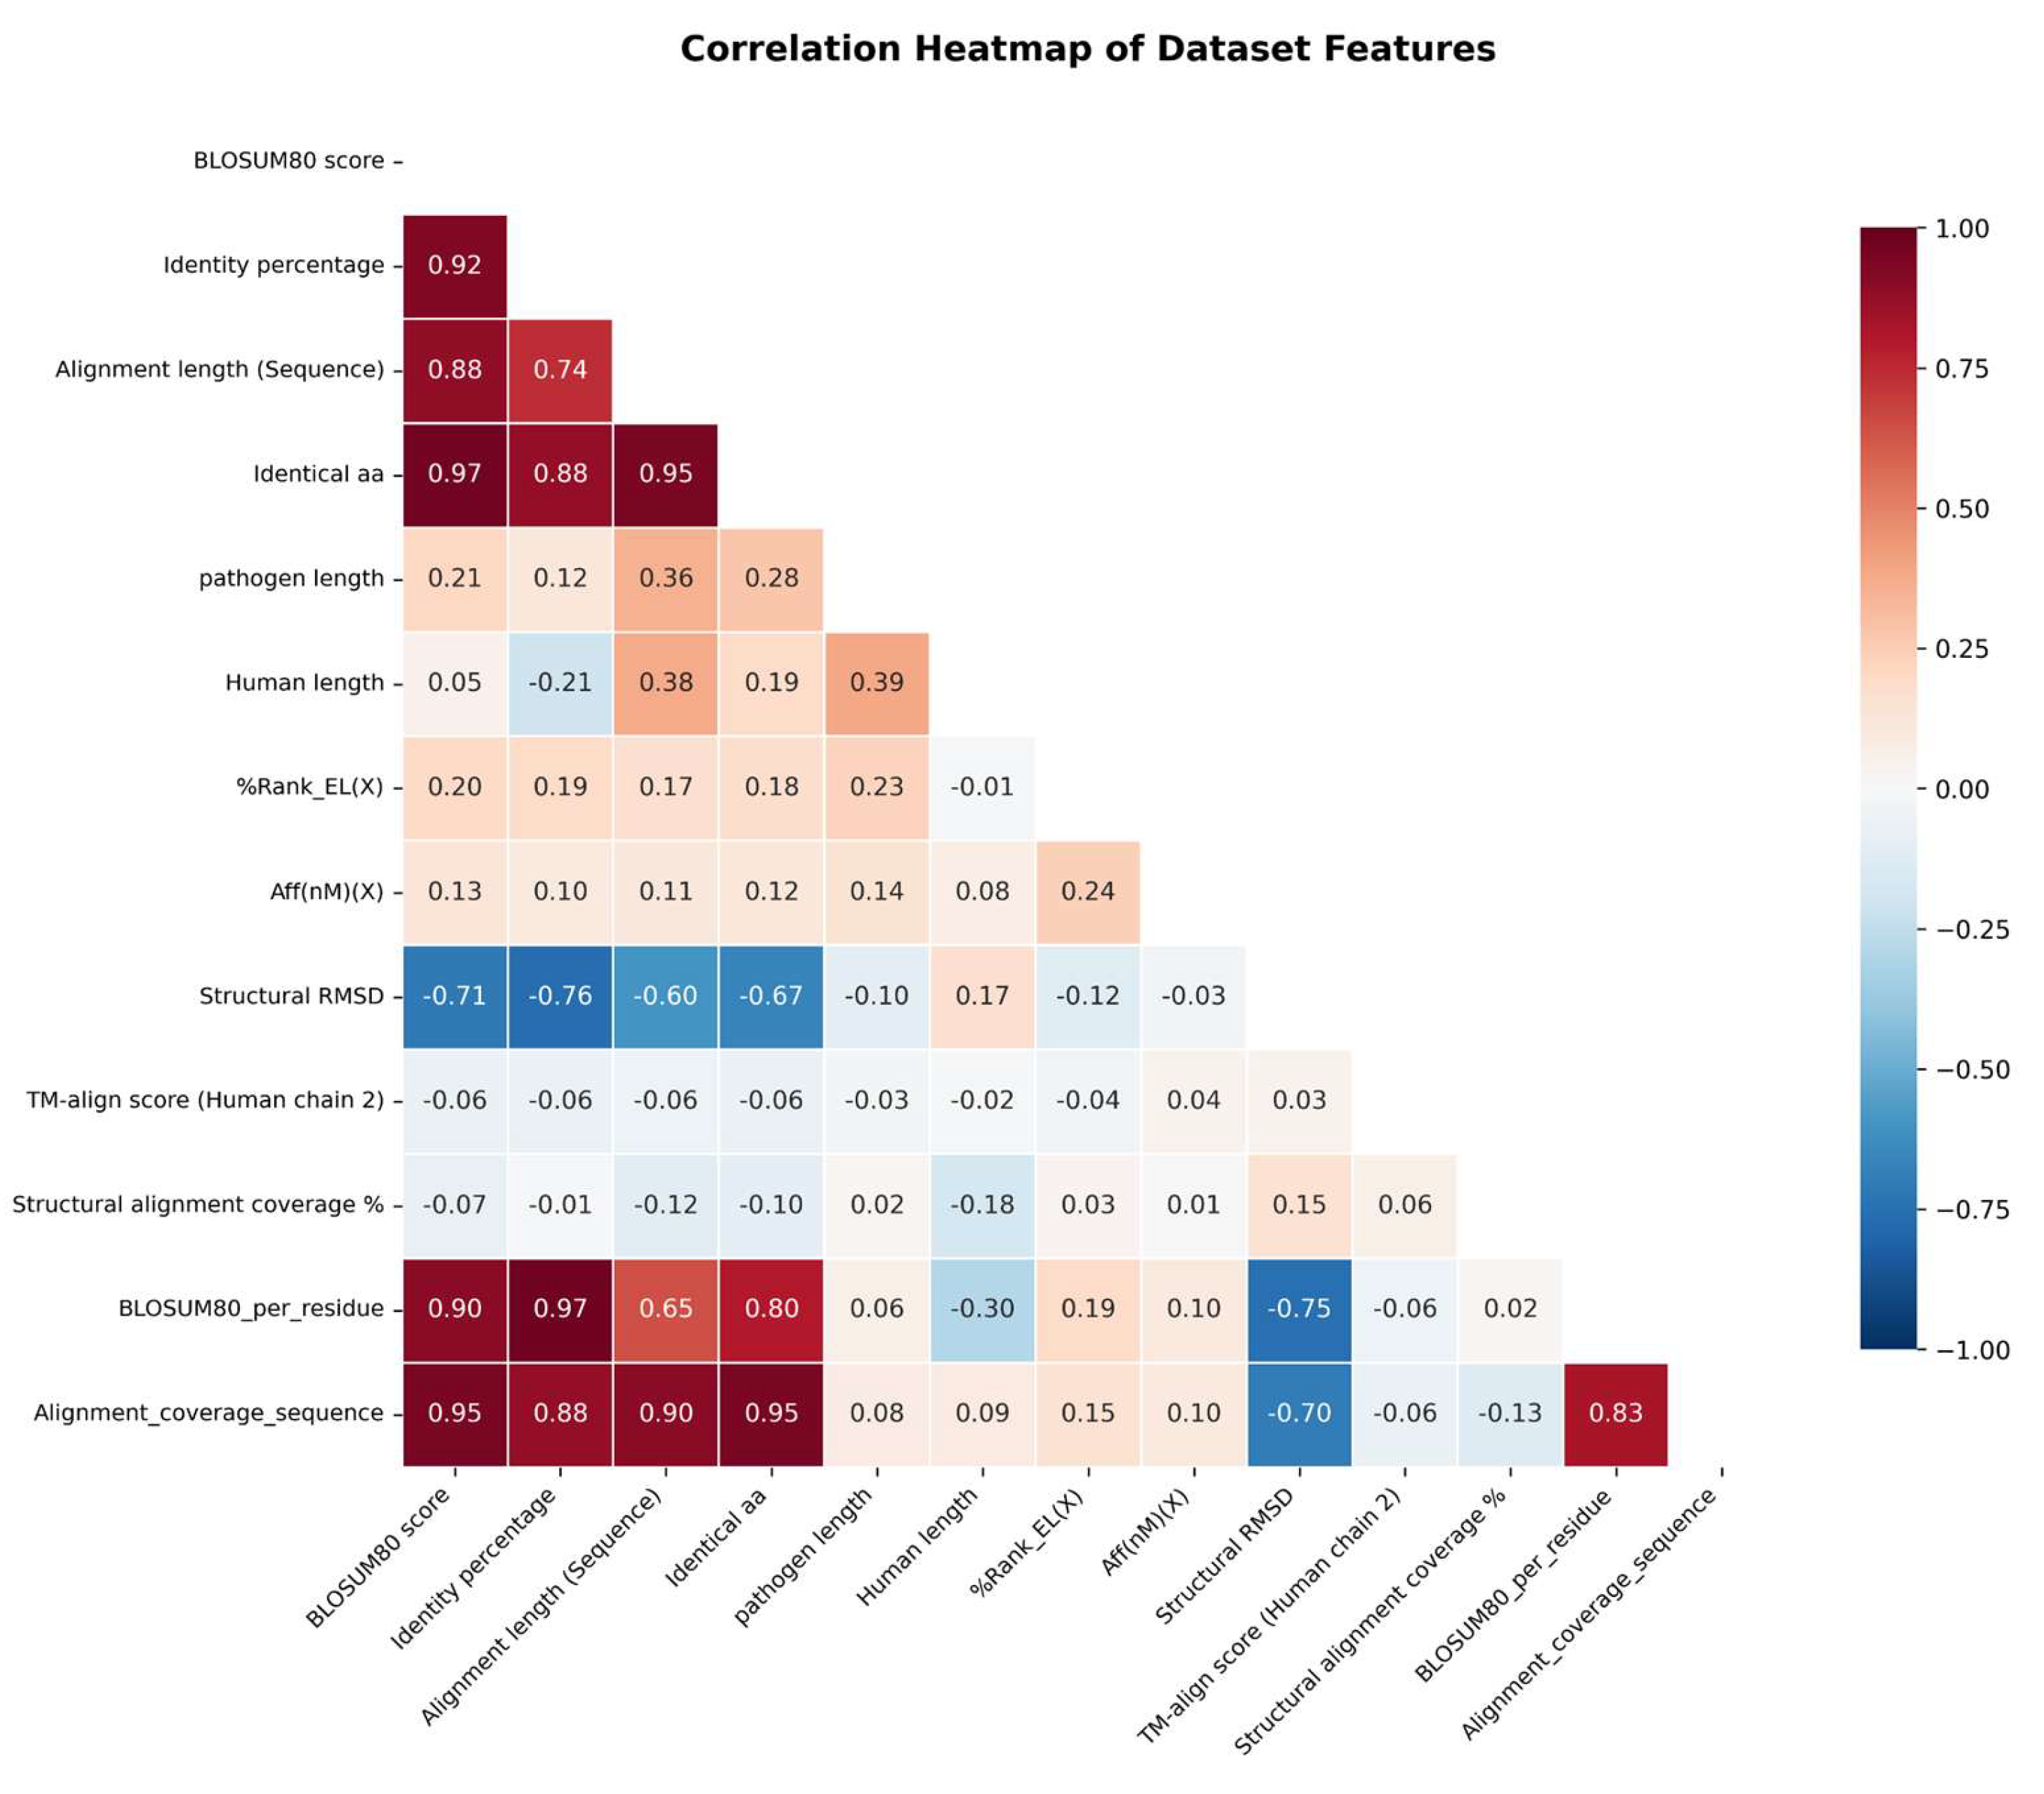
Table 1.
Pathogens and Candidate Molecular Structures Initially Screened for Inclusion. The initial list of Pathogens, Microbial Protein and their functions to select as candidates for the study.
Table 1.
Pathogens and Candidate Molecular Structures Initially Screened for Inclusion. The initial list of Pathogens, Microbial Protein and their functions to select as candidates for the study.
| Autoimmune Disease | Pathogen | Microbial Protein / Molecular Structure | Function / Description |
| Rheumatoid Arthritis (RA) | Prevotella copri | Arylsulfatase, extracellular protein (WP_028897633), and Molecular chaperone DnaK. | DnaK acts as a molecular chaperone assisting in protein folding; Arylsulfatase is an enzyme; the other is a secreted extracellular protein. |
| Proteus mirabilis | Hemolysin B (Hpm B) and Urease C (UreC). | Hpm B is a membrane hemolysin/pore-forming toxin; UreC is an enzyme. | |
| Escherichia coli | Heat shock protein DnaJ and L-asparaginase. | DnaJ is a heat shock/chaperone protein; L-asparaginase is a bacterial enzyme. | |
| Klebsiella pneumoniae | L-asparaginase. | Bacterial enzyme. | |
| Mycobacterium genus (e.g., M. tuberculosis) | L-asparaginase and Hsp65. | L-asparaginase is an enzyme; Hsp65 is a mycobacterial heat shock/stress-response protein. | |
| Porphyromonas gingivalis | Enolase (ENO1) and Peptidylarginine Deiminase (PAD). | ENO1 is a metabolic enzyme; PAD is a bacterial enzyme that facilitates the post-translational citrullination of proteins. | |
| Bacteroides fragilis | Ubiquitin (BfUbb) and Hsp70. | BfUbb is a bacterial protein modifier (homologue to human ubiquitin); Hsp70 is a heat shock protein. | |
| Epstein-Barr Virus (EBV) | Viral glycoprotein gp110, EBNA-1, EBNA-6, and vIL-10. | gp110 is a viral envelope glycoprotein; EBNA-1 and EBNA-6 are viral nuclear antigens; vIL-10 is a viral cytokine synthesis inhibitory factor. | |
| Roseburia intestinalis | DNA cytosine methyltransferase. | Bacterial enzyme involved in DNA methylation. | |
| Hepatitis C virus (HCV) | Mimotope of IgG1Fc. | Viral peptide/structure mimicking the human Fc region of immunoglobulin G. | |
| Human Endogenous Retrovirus K10 (HERV-K10) | Gag protein. | Endogenous retroviral structural/matrix protein. | |
| Systemic Lupus Erythematosus (SLE) | Bacteroides thetaiotaomicron | Bacterial Ro60 (bRo60). | Commensal bacterial ortholog of the human RNA-binding autoantigen Ro60. |
| Bacteroides fragilis | Ubiquitin (BfUbb) and BatA. | BfUbb is a ubiquitin homologue; BatA is a bacterial protein containing a sequence mimicking human Ro60. | |
| Alistipes finegoldii | Mg-chelatase subunit ChID. | Bacterial enzyme subunit. | |
| B. finegoldii, B. intestinalis, C. ochracea, C. sputigena, P. disiens, P. mendocina | vWFA protein. | von Willebrand factor type A domain-containing protein. | |
| Actinomyces massiliensis, Corynebacterium amycolatum, Propionibacterium propionicum | Bacterial Ro60 (bRo60). | Commensal bacterial orthologs of the human RNA-binding autoantigen Ro60. | |
| Acinetobacter johnsonii | Aldehyde dehydrogenase. | Bacterial enzyme and orthologue to human Ro60. | |
| Akkermansia muciniphila | Mimotope of Fas. | Bacterial peptide acting as a mimic of the human Fas cell surface receptor. | |
| Odoribacter splanchnicus | IS66 family transposase. | Enzyme involved in DNA transfer/mobility. | |
| Ruminococcus gnavus | Cell wall lipoglycans. | Structural components of the bacterial cell wall. | |
| Roseburia intestinalis | DNA methyltransferase. | Bacterial enzyme involved in DNA methylation. | |
| Listeria grayi | Beta lactamase. | Bacterial enzyme. | |
| Escherichia coli | Bacterial aquaporin. | Bacterial water channel protein in the membrane. | |
| Mycobacterium tuberculosis | Glycolipids of the cell wall and Hsp70. | Structural components of the bacterial cell envelope and a heat shock protein. | |
| Epstein-Barr virus (EBV) | EBNA-1, EBNA-2, EBNA-3C, and EBV-LF3. | Viral nuclear antigens involved in viral latency and replication. | |
| Cytomegalovirus (CMV / HCMV) | ULB0-HCMVA, HCMVpp65, and gB. | Viral peptides and envelope glycoproteins. | |
| Coxsackie virus | 2B protein (pepCoxs). | Viral protein. | |
| Parvovirus B19 | VP1 protein. | Viral capsid (structural) protein. | |
| Transfusion-transmitted virus (Torque teno virus)(TTV) | ORF2a. | Viral open reading frame/peptide. | |
| Human Immunodeficiency Virus (HIV) | p24 capsid antigen. | Viral capsid (structural) protein. | |
| HTLV-1 / HRES-1 (endogenous retrovirus) | p28 protein. | Endogenous retroviral nuclear autoantigen/protein. | |
| Guillain-Barré Syndrome (GBS) | Campylobacter jejuni🞡 | Lipo-oligosaccharide (LOS) structurally mimicking human gangliosides (e.g., GM1, GD1a). | Major cell-surface glycolipid structure on the outer core of the bacteria. |
| Cytomegalovirus (CMV) | Structures inducing antibodies that cross-react with GM2. | Viral structures inducing cross-reactive immune responses. | |
| Mycoplasma pneumoniae | Structures inducing antibodies that cross-react with galactocerebroside. | Bacterial structures inducing cross-reactive immune responses. | |
| Sydenham’s Chorea / Rheumatic Fever | Streptococcus pyogenes (Group A Streptococcus) | M protein and N-acetyl-beta-D-glucosamine (GlcNAc). | M protein is a cell wall structural protein; GlcNAc is a structural carbohydrate in the bacterial envelope. |
| Ankylosing Spondylitis (AS) | Klebsiella pneumoniae | Nitrogenase enzyme and Pullulanase. | Bacterial enzymes. |
| Yersinia enterocolitica, Y. pseudotuberculosis | Yersinia adhesin (YadA). | Outer membrane protein (adhesin). | |
| Salmonella typhimurium | Outer membrane protein OmpH. | Outer membrane protein. | |
| Systemic Sclerosis (SSc) | Human cytomegalovirus (HCMV) | UL70 protein and UL94. | Viral late proteins. |
| Epstein-Barr virus (EBV) | EBNA-1 and an unnamed nuclear protein. | Viral nuclear antigens. | |
| Herpes simplex virus (HSV) type I | P40 protein. | Viral protein. | |
| Helicobacter pylori | Hsp60. | Bacterial heat shock protein. | |
| Klebsiella pneumoniae | Partial histone H3. | Bacterial sequence functioning as a DNA-packaging protein component. | |
| HAM/TSP (Neurological Disease) | Human T-lymphotropic virus type 1 (HTLV-1) | Tax protein. | Viral regulatory protein. |
□C. jejuni is represented in the analytical dataset through its NeuA protein rather than LOS, as carbohydrate structures are not amenable to TM-align comparison (see Section 2.1). The final MimicryDB-Auto dataset comprises 399 pairs from 32 organisms; Table 1 reflects the initial candidate screen including structures subsequently excluded due to pipeline constraints.
Table 6.
The discrimination ratio is consistent across thresholds, indicating that the high cross-pair background rate is not specific to the 2.0 Å cutoff but reflects the inherent structural promiscuity of short sequence-similar peptides. These results suggest that no single RMSD threshold provides high specificity for short peptide mimicry classification in the unbound state, and that threshold refinement alone will not resolve the specificity problem. Structural validation in MHC-bound conformations, rather than threshold adjustment, is the appropriate direction for improving specificity (see Section 4.4).
Table 6.
The discrimination ratio is consistent across thresholds, indicating that the high cross-pair background rate is not specific to the 2.0 Å cutoff but reflects the inherent structural promiscuity of short sequence-similar peptides. These results suggest that no single RMSD threshold provides high specificity for short peptide mimicry classification in the unbound state, and that threshold refinement alone will not resolve the specificity problem. Structural validation in MHC-bound conformations, rather than threshold adjustment, is the appropriate direction for improving specificity (see Section 4.4).
| RMSD Threshold | Main Dataset Mimic Rate | Cross-Pair Background Rate | Discrimination Ratio |
|---|---|---|---|
| 1.0 Å | 39.8% (159/399) | 55.9% (76/136) | 0.71 |
| 1.5 Å | 55.9% (223/399) | 85.3% (116/136) | 0.66 |
| 2.0 Å | 65.7% (262/399) | 91.9% (125/136) | 0.71 |
Disclaimer/Publisher’s Note: The statements, opinions and data contained in all publications are solely those of the individual author(s) and contributor(s) and not of MDPI and/or the editor(s). MDPI and/or the editor(s) disclaim responsibility for any injury to people or property resulting from any ideas, methods, instructions or products referred to in the content. |
© 2026 by the authors. Licensee MDPI, Basel, Switzerland. This article is an open access article distributed under the terms and conditions of the Creative Commons Attribution (CC BY) license (http://creativecommons.org/licenses/by/4.0/).
Copyright: This open access article is published under a Creative Commons CC BY 4.0 license, which permit the free download, distribution, and reuse, provided that the author and preprint are cited in any reuse.