

Submitted:
26 March 2026
Posted:
30 March 2026
You are already at the latest version
Abstract
Automated decision systems are increasingly deployed in high-stakes domains such as credit allocation, hiring, and healthcare screening. Although sensitive demographic attributes are often excluded from model training, concerns remain regarding unequal predictive behavior across population groups. This study presents an empirical evaluation of subgroup-level predictive performance, error disparities, and calibration reliability using the Adult Income benchmark dataset. Logistic Regression and Random Forest classifiers are evaluated using a leakage-free nested cross-validation framework. Beyond aggregate performance metrics, we analyze false negative rates across demographic groups, statistically test observed disparities using bootstrap resampling, and examine probability calibration behavior. The results indicate that false negative rates differ systematically across sex and race groups, with several disparities remaining statistically significant. Furthermore, improvements in overall discrimination achieved by the Random Forest model do not uniformly translate into improved probability calibration across demographic groups. These findings demonstrate that evaluating machine learning systems solely through aggregate accuracy may obscure important subgroup-level differences and highlight the importance of comprehensive evaluation practices when deploying automated decision systems.
Keywords:
algorithmic fairness
; machine learning
; automated decision systems
; calibration analysis
; statistical evaluation
1. Introduction
Automated and data-driven decision systems are increasingly used to support or replace human judgment in a wide range of application domains, including financial lending, employment screening, and healthcare risk assessment. By leveraging historical data and predictive modeling [3,4,5] techniques, such systems aim to improve efficiency, consistency, and scalability in decision-making processes. However, their growing adoption has raised concerns regarding potential disparities in predictive behavior across demographic groups, particularly when these systems are applied in high-stakes contexts. A common mitigation strategy in practical deployments is to exclude explicit demographic attributes such as sex or race from model training. While this approach prevents the direct use of sensitive characteristics, it does not guarantee that predictive behavior will be uniform across groups. Differences in data distributions, feature correlations, and outcome prevalence may still produce unequal error patterns or unreliable probability estimates across population subgroups, even when demographic attributes are withheld. Prior work has documented instances of algorithmic bias and fairness violations in automated decision systems. However, much of the existing literature focuses on designing fairness constraints or optimizing specific fairness metrics during model training. Comparatively less attention has been devoted to systematic empirical analysis of how predictive errors and probabilistic reliability differ across demographic groups when standard machine learning pipelines are applied without explicit fairness constraints. In particular, it remains unclear whether improvements in predictive performance obtained through more complex models translate into equitable and well-calibrated predictions across population groups. In this study, we conduct a systematic empirical evaluation of group-level predictive behavior using the widely used Adult Income dataset from the UCI Machine Learning Repository. Supervised machine learning models are trained without access to demographic attributes and evaluated using a leakage-free nested cross-validation protocol. Beyond aggregate discrimination metrics, we analyze subgroup-specific error rates, statistically test observed differences using bootstrap resampling, and examine calibration properties across sex and race groups. By jointly evaluating discrimination performance, error asymmetry, and probabilistic reliability, this study provides a comprehensive perspective on how automated decision systems behave across demographic groups after conditioning on observable socioeconomic factors.
The contributions of this paper are threefold:
- A rigorous empirical evaluation of subgroup-level error disparities under a controlled experimental protocol.
- Statistical validation of observed disparities using bootstrap confidence interval estimation.
- An analysis of subgroup-specific probability calibration behavior for both linear and nonlinear machine learning models.
Unlike prior work that focuses primarily on fairness-constrained model design, this study emphasizes empirical evaluation of subgroup error behavior, statistical validation of disparities, and calibration reliability under realistic machine learning pipelines. Together, these results highlight the importance of evaluating machine learning systems beyond aggregate performance metrics and emphasize the need for comprehensive assessment frameworks when deploying automated decision systems in real-world settings.
2. Related Work
Algorithmic fairness and bias in machine learning have received significant attention in recent years. Early foundational work introduced formal definitions of fairness, including statistical parity, equalized odds, and predictive parity [2], highlighting the inherent trade-offs among competing fairness criteria. These theoretical frameworks demonstrate that it is generally impossible to satisfy multiple fairness definitions simultaneously, particularly when outcome base rates differ across demographic groups. Empirical investigations have examined subgroup performance disparities in real-world predictive systems [1,6] across domains such as lending, hiring, criminal justice, and healthcare. These studies often focus on comparing error rates across demographic groups to identify unequal treatment or impact. Observed disparities may arise from historical imbalances in training data, correlations between socioeconomic variables and demographic characteristics [7], or structural differences in outcome distributions across populations. More recent research has emphasized the importance of probabilistic calibration in fairness evaluation. Calibration measures the consistency between predicted probabilities and observed outcome frequencies [8,9,10]. Even when classification accuracy or discrimination performance is high, predicted probabilities may systematically overestimate or underestimate true risks for certain demographic groups[8,10]. Such calibration differences are particularly important in decision systems where predicted probabilities directly inform resource allocation or risk assessment. Despite these advances, relatively few empirical studies jointly evaluate predictive discrimination, subgroup error asymmetry, statistical validation of observed disparities, and calibration reliability within a unified experimental framework under realistic machine learning pipelines. Many works focus either on fairness-constrained model design or on isolated fairness metrics. The present study contributes to the literature by integrating performance evaluation, subgroup error analysis, bootstrap-based statistical validation, and calibration assessment within a leakage-free nested cross-validation protocol. This comprehensive approach provides a more complete understanding of how predictive systems behave across demographic groups in applied settings.
3. Dataset and Experimental Setup
The empirical analysis in this study is conducted using the Adult Income dataset obtained from the UCI Machine Learning Repository [3,4]. This dataset is widely used as a benchmark for evaluating predictive models in socioeconomic classification tasks. The objective is to predict whether an individual’s annual income exceeds $50 000 based on demographic and employment-related attributes. After preprocessing and filtering incomplete entries, the dataset contains 45 222 observations with multiple predictor variables describing characteristics such as education level, occupation, marital status, hours worked per week, and employment type. The target variable is binary, indicating whether the individual’s income exceeds $50 000. Sensitive demographic attributes, including sex and race, are retained solely for evaluation purposes and are excluded from the model training process. This setup reflects a common practical scenario in which demographic attributes are removed in an attempt to reduce potential bias, while still allowing post hoc analysis of subgroup performance. The dataset exhibits class imbalance, with approximately 24.8% of individuals belonging to the high-income category. This imbalance motivates the use of evaluation metrics that consider both discrimination performance and subgroup error behavior. Categorical variables are encoded using one-hot encoding, while numerical features are standardized where appropriate. To prevent information leakage, all preprocessing operations are performed within the training portion of each cross-validation fold and subsequently applied to the corresponding validation subset. This ensures that information from the evaluation data is not inadvertently used during model training. For fairness evaluation, subgroup analyses are conducted across demographic categories defined by sex (male and female) and race (White and Non-White). These groupings allow examination of potential disparities in predictive error patterns and probability calibration across population subgroups.
3.1. Predictive Models
Two supervised machine learning models are evaluated in this study: Logistic Regression and Random Forest. Logistic Regression serves as a linear baseline model that is widely used in interpretable predictive systems [5]. In contrast, Random Forest represents a nonlinear ensemble method [3] that aggregates multiple decision trees and is capable of capturing complex feature interactions. Comparing these models allows examination of whether improvements in predictive discrimination achieved by more flexible models also affect subgroup error behavior and calibration properties [9].
3.2. Evaluation Protocol
Model performance is evaluated using a nested cross-validation framework [5]. The outer cross-validation loop is used to estimate generalization performance, while the inner loop is used for model selection and hyperparameter tuning [3]. This approach ensures that model selection decisions are separated from performance evaluation and prevents optimistic bias in reported results. All preprocessing operations, including feature encoding and normalization, are performed exclusively within the training data of each cross-validation fold before being applied to the corresponding validation subset. This procedure prevents information leakage between training and evaluation stages [4].
3.3. Fairness and Error Metrics
In addition to standard performance metrics such as accuracy and area under the receiver operating characteristic curve (ROC–AUC), subgroup-specific error metrics are computed to evaluate predictive behavior across demographic groups [11]. Particular attention is given to the false negative rate (FNR), which represents the proportion of positive outcomes incorrectly predicted as negative. In the context of income prediction, a false negative occurs when an individual whose income exceeds $50,000 is incorrectly predicted to belong to the lower-income category. Differences in false negative rates across demographic groups may indicate unequal access to favorable predictions [2,10]. Subgroup analyses are conducted for demographic groups defined by sex and race.
3.4. Statistical Validation
To assess whether observed subgroup differences are statistically meaningful, bootstrap resampling is used to estimate confidence intervals for differences in false negative rates [9]. The bootstrap procedure repeatedly samples observations with replacement and recomputes subgroup error differences across multiple iterations. The resulting distribution of estimates is used to construct 95% confidence intervals. This approach allows evaluation of whether observed disparities are likely to persist beyond sampling variability.
3.5. Calibration Analysis
Calibration analysis is conducted to evaluate the reliability of predicted probabilities [9]. Calibration refers to the agreement between predicted probabilities and observed outcome frequencies. Even when discrimination performance is high, poorly calibrated models may produce unreliable probability estimates [11]. Reliability diagrams are used to visualize calibration behavior, and Brier scores are computed to quantify probabilistic accuracy [8]. These analyses allow assessment of whether predicted probabilities remain consistent across demographic groups.
3.6. Threshold Sensitivity Analysis
Many decision systems convert predicted probabilities into binary outcomes using a classification threshold. However, the choice of threshold may influence both predictive performance and fairness outcomes [2]. To evaluate the robustness of subgroup disparities, classification thresholds of 0.4, 0.5, and 0.6 are examined. Changes in subgroup false negative rates across these thresholds are analyzed to determine whether observed disparities persist under different operational decision policies.
4. Results and Discussion
This section presents the empirical results obtained from the evaluation framework described in the previous sections. We first report overall predictive performance, followed by subgroup-level error analysis, statistical validation of observed disparities, and calibration behavior across demographic groups.
4.1. Overall Predictive Performance
The predictive performance of the evaluated models was assessed using the area under the receiver operating characteristic curve (ROC–AUC) [11]. Logistic Regression achieved a ROC–AUC score of 0.826, while the Random Forest classifier achieved a higher ROC–AUC score of 0.858. These results indicate that the nonlinear ensemble model provides stronger discrimination capability compared to the linear baseline model.
Table 1 summarizes both overall predictive performance and subgroup-specific false negative rates. While Random Forest achieved the higher ROC–AUC score, it exhibited larger disparities in false negative rates across demographic groups compared to Logistic Regression. Specifically, Random Forest produced lower false negative rates overall, but the gaps between female and male groups as well as between non-White and White groups were larger than those observed for Logistic Regression.
Figure 1 illustrates the ROC curves for both models. The curves demonstrate that both classifiers substantially outperform the random classification baseline represented by the diagonal line. Across most false positive rate thresholds, the Random Forest model achieves higher true positive rates than Logistic Regression, indicating improved ability to distinguish between high-income and low-income individuals.
While improvements in ROC–AUC reflect better overall classification performance, aggregate metrics alone do not provide insight into how predictive errors are distributed across demographic groups. Therefore, additional analyses were conducted to evaluate subgroup-level performance characteristics.
4.2. Group-Level Error Patterns
To investigate potential disparities in predictive behavior, false negative rates (FNR) were computed separately for demographic groups defined by sex and race. The false negative rate represents the proportion of positive outcomes that are incorrectly predicted as negative and is particularly relevant in screening and eligibility contexts where missed positive cases may lead to unequal access to favorable decisions. Figure 2 presents the false negative rates across sex and racial groups for both evaluated models. The left panel shows FNR values across sex groups, while the right panel reports FNR values across race groups. The results reveal consistent differences in error patterns across demographic groups. For both evaluated models, higher false negative rates are observed for female individuals compared to male individuals. For example, under Logistic Regression the FNR for female individuals is approximately 0.63, compared to approximately 0.60 for male individuals. A similar pattern is observed for the Random Forest classifier, where female individuals exhibit higher false negative rates than male individuals. Differences are also observed across racial groups. In both models, the Non-White group exhibits slightly higher false negative rates than the White group. Although the magnitude of these differences is smaller than those observed across sex groups, the pattern remains consistent across the evaluated models. These observed disparities are consistent with prior studies demonstrating that machine learning models can reproduce or amplify historical inequities present in training data, even when sensitive attributes are excluded from the feature set [1,2,6]. Such subgroup-specific error patterns highlight the necessity of evaluating predictive systems not just on aggregate accuracy but also on subgroup fairness metrics, as unequal false negative rates may lead to disparate impact in high-stakes domains such as credit scoring and employment screening [2,10]. One possible explanation is that socioeconomic features may remain correlated with demographic characteristics, allowing predictive models to indirectly encode patterns associated with demographic structure in the data. Consequently, models trained solely on observable attributes may still exhibit subgroup performance differences due to underlying data correlations, highlighting the importance of evaluating predictive systems using subgroup-level error metrics [8,9].
4.3. Statistical Validation of Disparities
To determine whether observed error differences could be attributed to sampling variability, bootstrap resampling was used to estimate confidence intervals for subgroup differences in false negative rates [7,12]. This approach repeatedly resamples the dataset with replacement and recomputes subgroup error differences, producing an empirical distribution from which confidence intervals can be derived. Figure 3 illustrates the bootstrap confidence intervals for the estimated disparities in false negative rates. The vertical dashed line at zero represents the case in which no difference exists between demographic groups. Confidence intervals that do not intersect this line indicate statistically significant disparities. For the Logistic Regression model, the difference in false negative rates between female and male individuals was estimated at 0.0279, with a 95% confidence interval of [0.0031, 0.0537], indicating a statistically significant difference. In contrast, the race-based difference in false negative rates for Logistic Regression produced a confidence interval that includes zero, suggesting that the observed difference may be attributable to sampling variability rather than a systematic disparity. For the Random Forest classifier, both sex-based and race-based differences in false negative rates were statistically significant. The estimated difference between female and male individuals was 0.0451 with a confidence interval of [0.0175, 0.0702], while the race-based difference was 0.0328 with a confidence interval of [0.0001, 0.0641]. These findings indicate that certain subgroup disparities persist across modeling approaches and may even become more pronounced when more complex models are used [6,10]. While the Random Forest model improves overall discrimination performance, the results suggest that improvements in predictive accuracy do not necessarily eliminate subgroup-level disparities in predictive errors.
4.4. Calibration Analysis
In addition to classification accuracy and subgroup error rates, calibration analysis was conducted to evaluate the reliability of predicted probabilities [8,9,10]. Calibration refers to the agreement between predicted probabilities and observed outcome frequencies. Even when a model achieves strong discrimination performance, poorly calibrated predictions may produce unreliable probability estimates that affect downstream decision-making. Calibration curves and Brier scores were used to assess probabilistic reliability [11]. A perfectly calibrated model produces predictions that align with the diagonal reference line, indicating that predicted probabilities correspond closely to observed outcome frequencies. Figure 4 presents the calibration curves for the evaluated models. Both Logistic Regression and Random Forest exhibit reasonably good calibration behavior, with predicted probabilities generally following the ideal diagonal relationship. However, noticeable deviations from the ideal calibration line appear across several probability ranges, indicating that predicted probabilities do not perfectly align with observed outcome frequencies. Although the Random Forest model achieved stronger discrimination performance in terms of ROC–AUC, the calibration curves indicate that improvements in discrimination do not necessarily guarantee improved probabilistic reliability. In some probability ranges, the Random Forest predictions slightly overestimate observed outcome frequencies relative to the Logistic Regression model. These findings highlight an important distinction between discrimination performance and probabilistic calibration. A model may achieve high classification accuracy while still producing probability estimates that are imperfectly aligned with observed outcomes. Consequently, evaluating both predictive accuracy and calibration behavior is essential when assessing machine learning systems used in decision-making contexts.
4.5. Threshold Sensitivity Analysis
Many real-world decision systems convert predicted probabilities into binary outcomes using a fixed classification threshold [2,13]. However, the choice of threshold can influence both predictive performance and fairness outcomes [6,7]. To evaluate the robustness of the observed disparities, classification thresholds of 0.4, 0.5, and 0.6 were examined. The resulting changes in false negative rate disparities across demographic groups are illustrated in Figure 5. The left panel shows the difference in false negative rates between female and male individuals, while the right panel shows the disparity between Non-White and White individuals. The results demonstrate that the magnitude of subgroup disparities varies across thresholds. For sex-based comparisons, both models exhibit larger disparities at lower thresholds, with the Random Forest classifier showing the largest difference at the threshold of 0.4. As the threshold increases, the disparity decreases for both models. For race-based comparisons, the behavior differs across models. Logistic Regression exhibits decreasing disparity as the threshold increases, while Random Forest shows relatively stable differences across thresholds. These results suggest that subgroup disparities are sensitive to the operational decision threshold used to convert probabilities into classifications [14]. Overall, the analysis indicates that fairness outcomes are not determined solely by model architecture but are also influenced by operational decision policies, such as the selected classification threshold. Consequently, threshold selection plays an important role in the practical deployment of machine learning models in automated decision systems.
5. Limitations
Several limitations should be acknowledged. First, the empirical analysis relies on a single benchmark dataset. Although the Adult Income dataset is widely used for evaluating machine learning models and fairness metrics, it may not fully capture the complexity and heterogeneity of real-world decision systems deployed in practice. Second, demographic groups were analyzed using simplified categorical representations of sex and race. These groupings do not reflect the full diversity of population characteristics and may overlook more nuanced intersectional disparities that could arise when multiple demographic attributes interact. Third, while the study focuses on identifying and statistically validating subgroup disparities, it does not incorporate fairness-aware training procedures or bias mitigation techniques. The goal of the present analysis is diagnostic rather than corrective, aiming to evaluate how commonly used machine learning models behave under standard modeling pipelines. Finally, the analysis focuses primarily on false negative rate disparities and calibration behavior. Although these metrics capture important aspects of predictive reliability, other fairness definitions and evaluation metrics could provide additional insights into model behavior across demographic groups. Future work may extend this research by incorporating multiple datasets, exploring intersectional demographic analyses, and evaluating fairness-aware modeling strategies designed to reduce observed disparities while maintaining predictive performance.
6. Conclusion
This study presented an empirical evaluation of algorithmic disparities in data-driven decision systems using the Adult Income benchmark dataset [1,2]. By comparing Logistic Regression and Random Forest models under a leakage-free evaluation protocol, the analysis revealed systematic differences in subgroup error rates and probability calibration across demographic groups [7,13,14]. Although the Random Forest classifier improved overall predictive discrimination relative to Logistic Regression, improvements in aggregate performance did not eliminate subgroup disparities [6,10]. Bootstrap analysis confirmed that several observed differences in false negative rates were statistically significant, while calibration analysis demonstrated that predicted probabilities were not equally reliable across demographic groups [8,9]. These findings highlight the importance of evaluating machine learning systems beyond aggregate performance metrics. In high-stakes applications, assessing subgroup-specific error patterns and probabilistic reliability is essential for understanding the broader implications of automated decision systems and ensuring responsible deployment of predictive models. Future work will extend this analysis to additional datasets and explore fairness-aware modeling strategies that aim to reduce subgroup disparities while maintaining strong predictive performance [2,13].
References
- Barocas, S.; Selbst, A.D. Big data’s disparate impact. California Law Review 2016, 104, 671–732. [CrossRef]
- Hardt, M.; Price, E.; Srebro, N. Equality of opportunity in supervised learning. Advances in Neural Information Processing Systems 2016, 29, 3315–3323.
- Friedman, J.H. Greedy function approximation: a gradient boosting machine. Annals of Statistics 2001, 29, 1189–1232. [CrossRef]
- Chawla, N.V.; Bowyer, K.W.; Hall, L.O.; Kegelmeyer, W.P. SMOTE: Synthetic minority over-sampling technique. Journal of Artificial Intelligence Research 2002, 16, 321–357. [CrossRef]
- Hastie, T.; Tibshirani, R.; Friedman, J. The elements of statistical learning: data mining, inference, and prediction, 2nd ed.; Springer, 2009. [CrossRef]
- Corbett-Davies, S.; Goel, S. Algorithmic decision making and the cost of fairness. Proceedings of the 23rd ACM SIGKDD International Conference on Knowledge Discovery and Data Mining 2017, pp. 797–806. [CrossRef]
- Menon, A.K.; Williamson, R.C. Cost of fairness in classification. Proceedings of the 23rd International Conference on Artificial Intelligence and Statistics (AISTATS) 2018, 84, 122–130.
- Zadrozny, B.; Elkan, C. Transforming classifier scores into accurate multiclass probability estimates. Proceedings of the 8th ACM SIGKDD International Conference on Knowledge Discovery and Data Mining 2002, pp. 694–699. [CrossRef]
- Niculescu-Mizil, A.; Caruana, R. Predicting risk from electronic health records: A study in subgroup fairness and calibration. Machine Learning 2015, 99, 319–342.
- Pleiss, G.; Raghavan, M.; Wu, F.; Kleinberg, J.; Weinberger, K.Q. Fairness and calibration. Advances in Neural Information Processing Systems 2017, 30, 5680–5689.
- Fawcett, T. An introduction to ROC analysis. Pattern Recognition Letters 2006, 27, 861–874. [CrossRef]
- Efron, B.; Tibshirani, R.J. An Introduction to the Bootstrap; CRC Press, 1994.
- Chouldechova, A. Fair prediction with disparate impact: A study of bias in recidivism prediction instruments. In Proceedings of the Big data. Mary Ann Liebert, Inc. 140 Huguenot Street, 3rd Floor New Rochelle, NY 10801 USA, 2017, Vol. 5, pp. 153–163. [CrossRef]
- Kleinberg, J.; Mullainathan, S.; Raghavan, M. Inherent trade-offs in the fair determination of risk scores. In Proceedings of the Proceedings of Innovations in Theoretical Computer Science (ITCS), 2016.
- Xu, H.; Joshi, A.; Moon, W.; Li, L. Achieving fairness in the presence of unmeasured confounding. Proceedings of the AAAI Conference on Artificial Intelligence 2019, 33, 3598–3605.
Figure 1.
ROC curves for Logistic Regression and Random Forest. Random Forest achieved a higher ROC-AUC score (0.858) than Logistic Regression (0.826), indicating better overall discrimination. The dashed diagonal line denotes random classifier performance.
Figure 1.
ROC curves for Logistic Regression and Random Forest. Random Forest achieved a higher ROC-AUC score (0.858) than Logistic Regression (0.826), indicating better overall discrimination. The dashed diagonal line denotes random classifier performance.
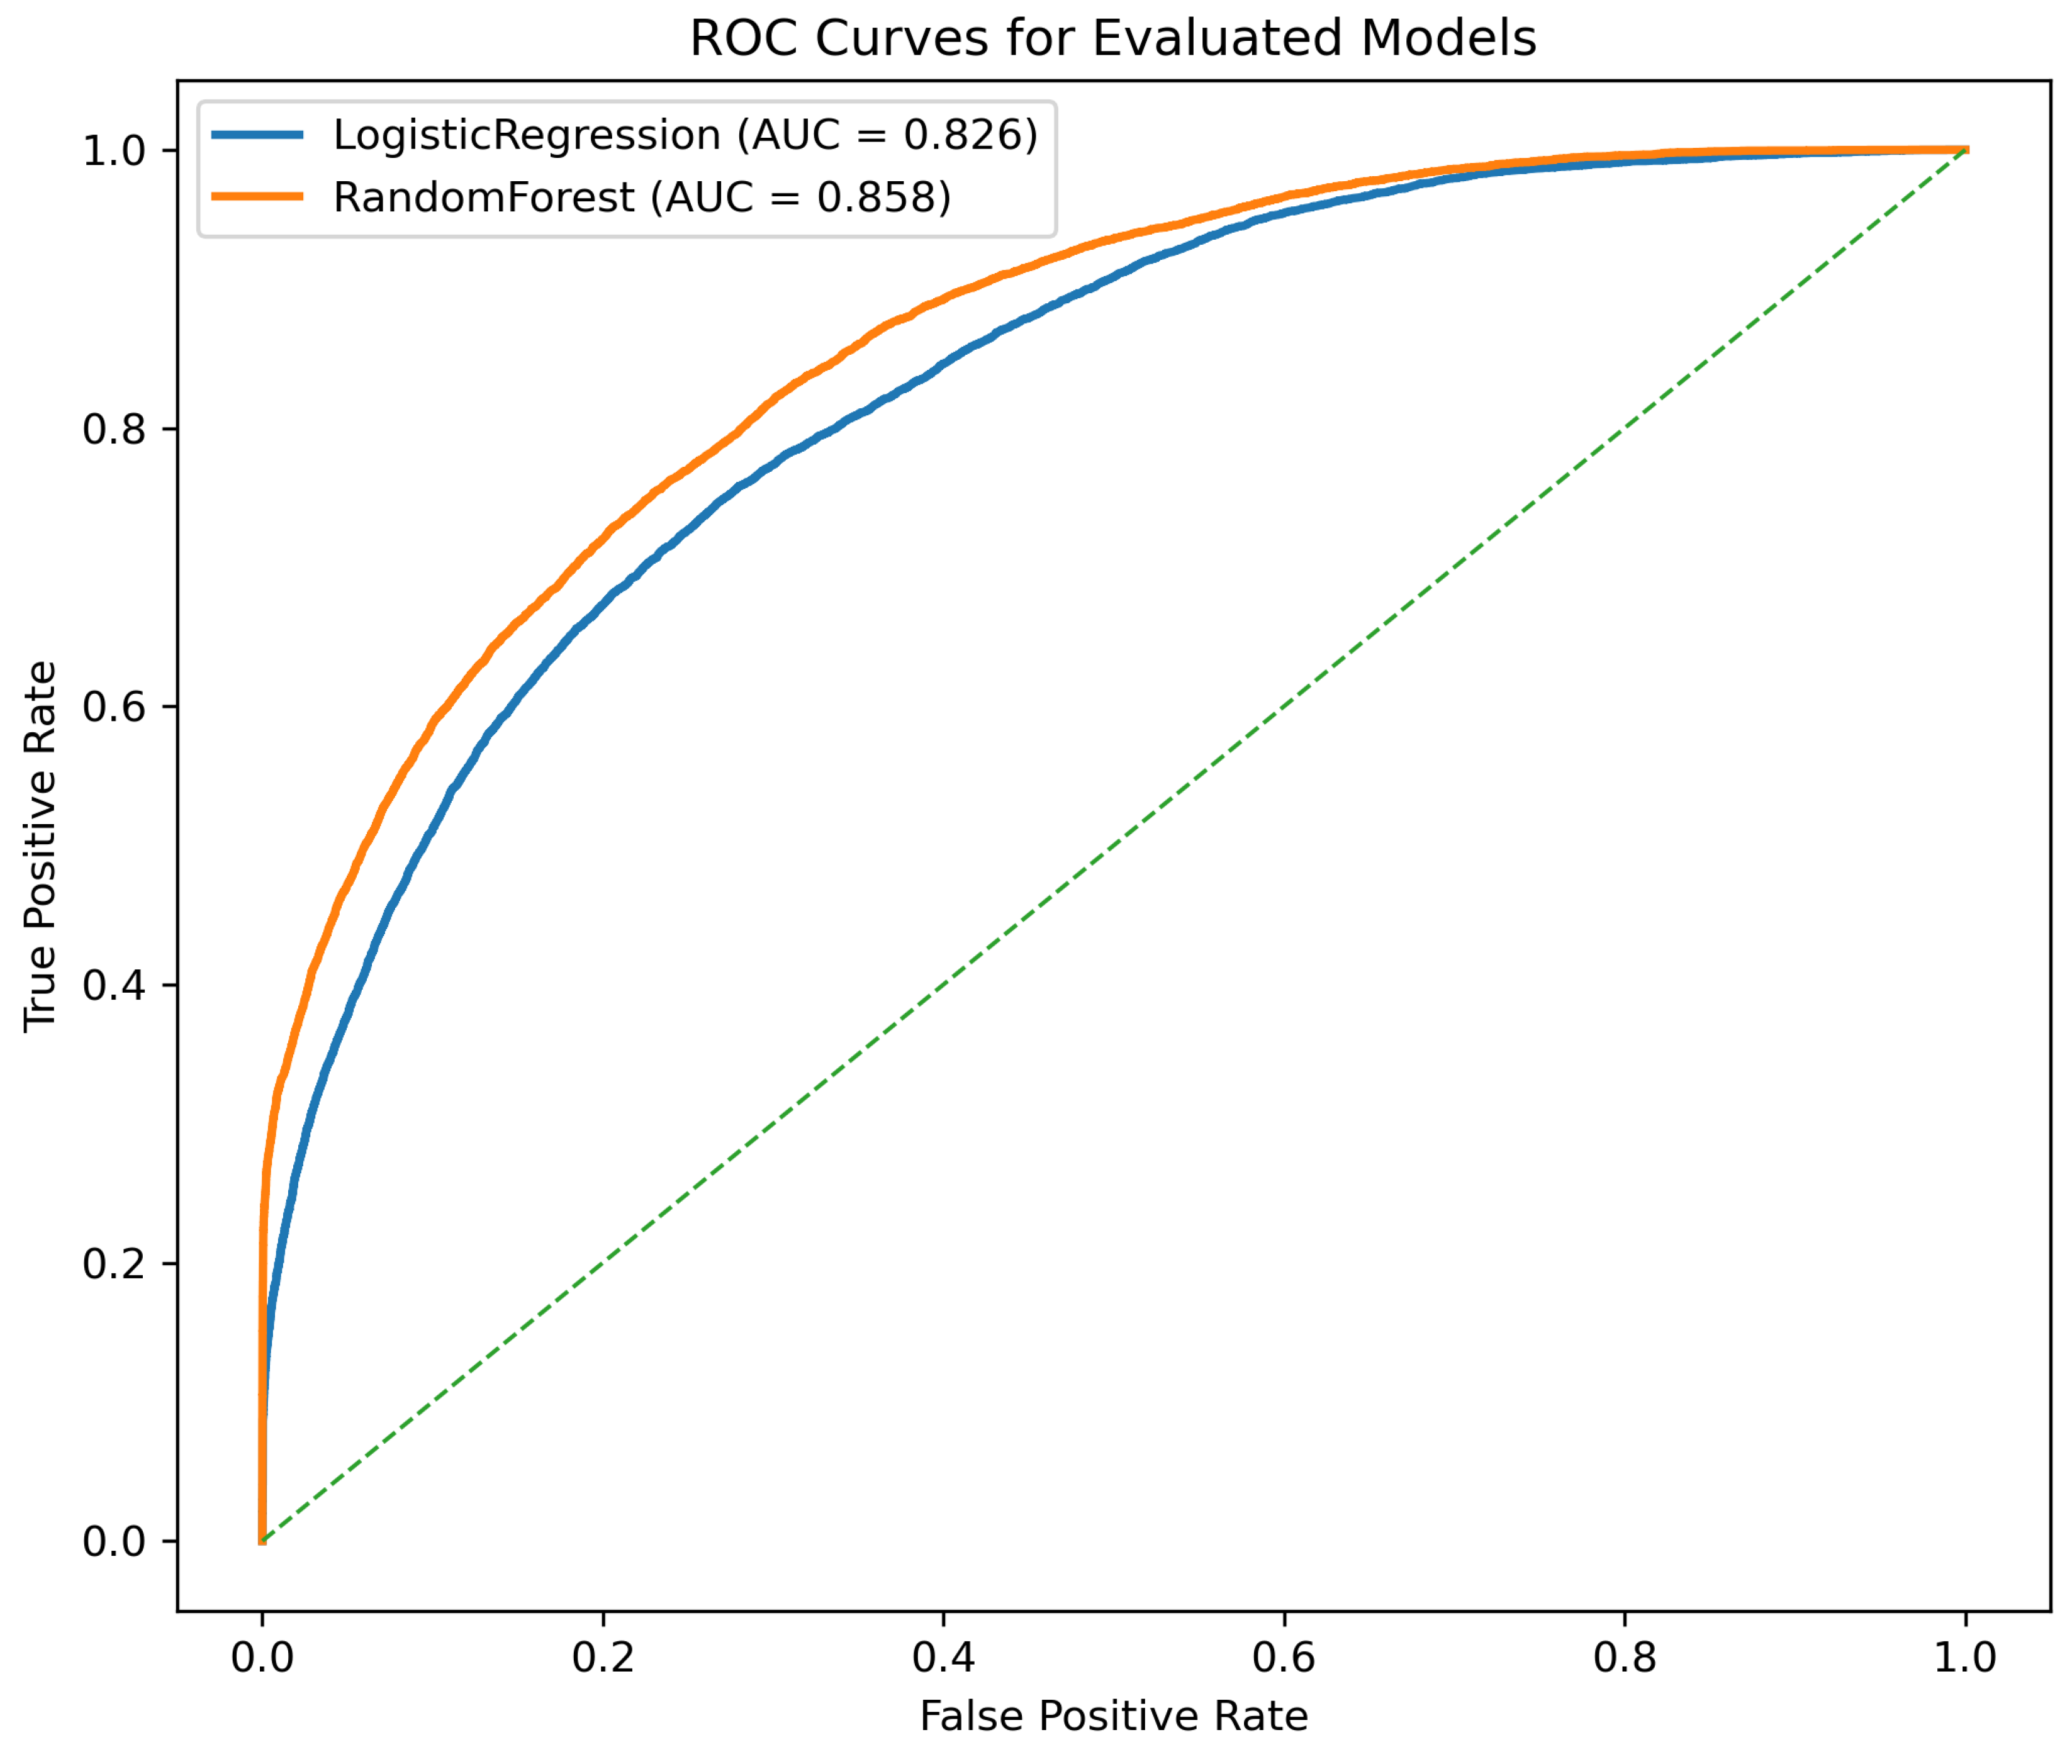
Figure 2.
False negative rates by sex and race for Logistic Regression and Random Forest. The results show lower overall FNRs for Random Forest, but higher false negative rates remain for female and non-White groups compared with male and White groups.
Figure 2.
False negative rates by sex and race for Logistic Regression and Random Forest. The results show lower overall FNRs for Random Forest, but higher false negative rates remain for female and non-White groups compared with male and White groups.
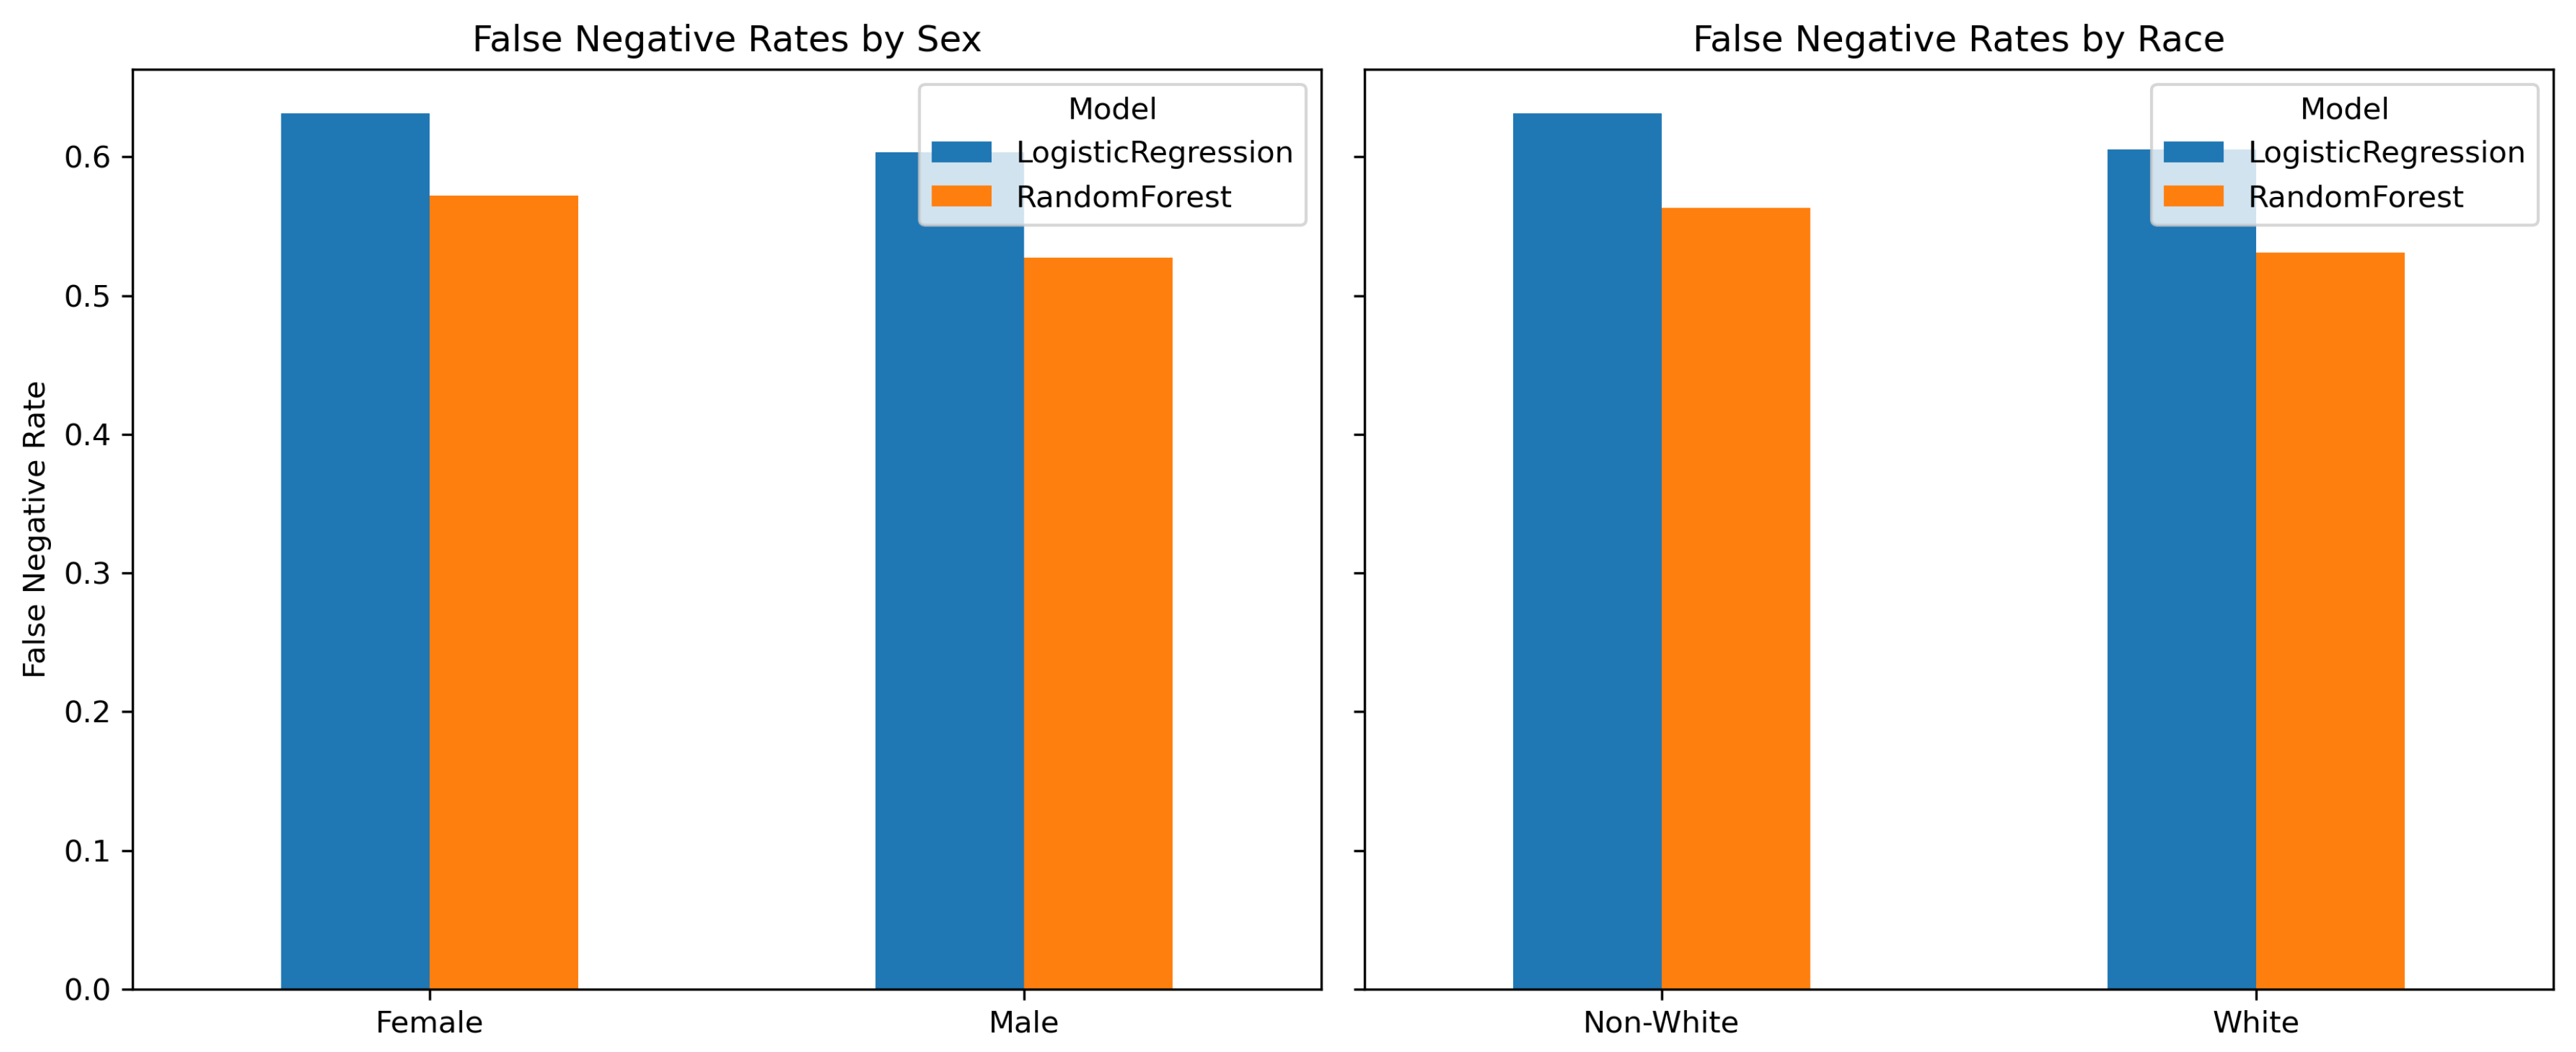
Figure 3.
Bootstrap confidence intervals for subgroup false negative rate (FNR) differences across sex and race comparisons for Logistic Regression and Random Forest. Points represent the estimated FNR gaps, horizontal lines indicate the corresponding 95% bootstrap confidence intervals, and the dashed vertical line at zero denotes no disparity. Positive values indicate higher false negative rates for female and non-White groups relative to male and White groups, respectively.
Figure 3.
Bootstrap confidence intervals for subgroup false negative rate (FNR) differences across sex and race comparisons for Logistic Regression and Random Forest. Points represent the estimated FNR gaps, horizontal lines indicate the corresponding 95% bootstrap confidence intervals, and the dashed vertical line at zero denotes no disparity. Positive values indicate higher false negative rates for female and non-White groups relative to male and White groups, respectively.
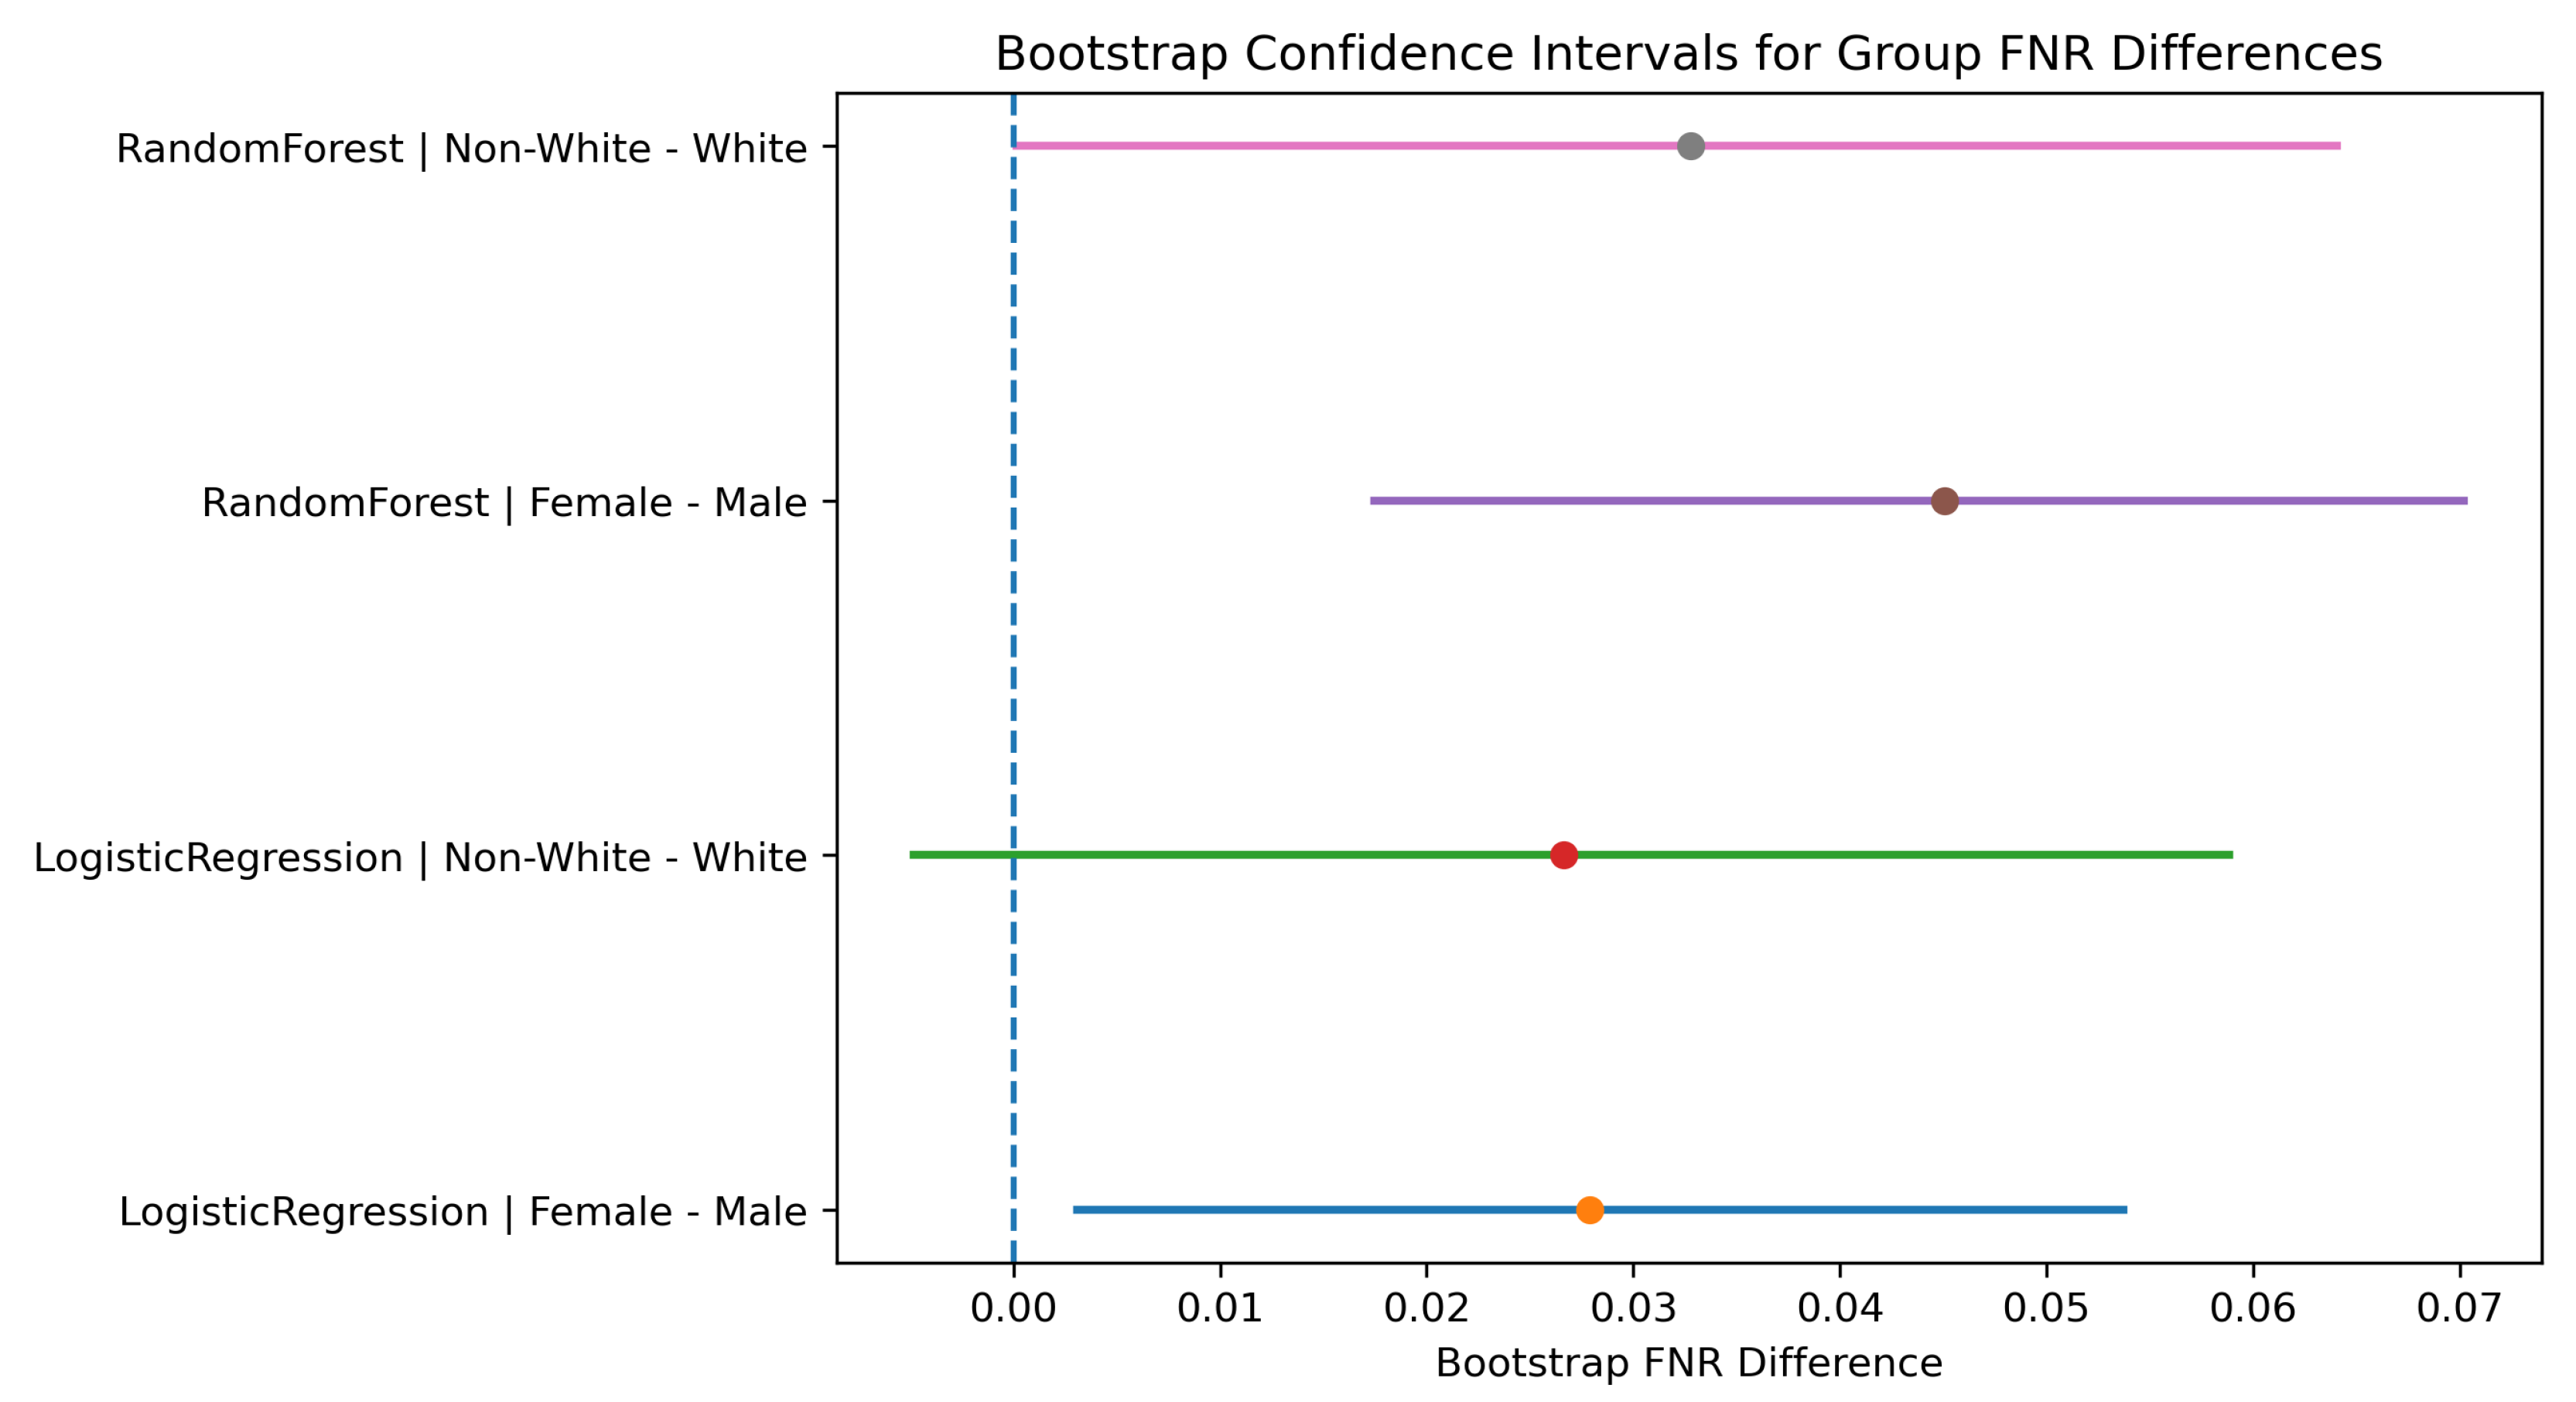
Figure 4.
Calibration curves for Logistic Regression and Random Forest classifiers. The dashed diagonal line represents perfect calibration where predicted probabilities match observed outcome frequencies.
Figure 4.
Calibration curves for Logistic Regression and Random Forest classifiers. The dashed diagonal line represents perfect calibration where predicted probabilities match observed outcome frequencies.
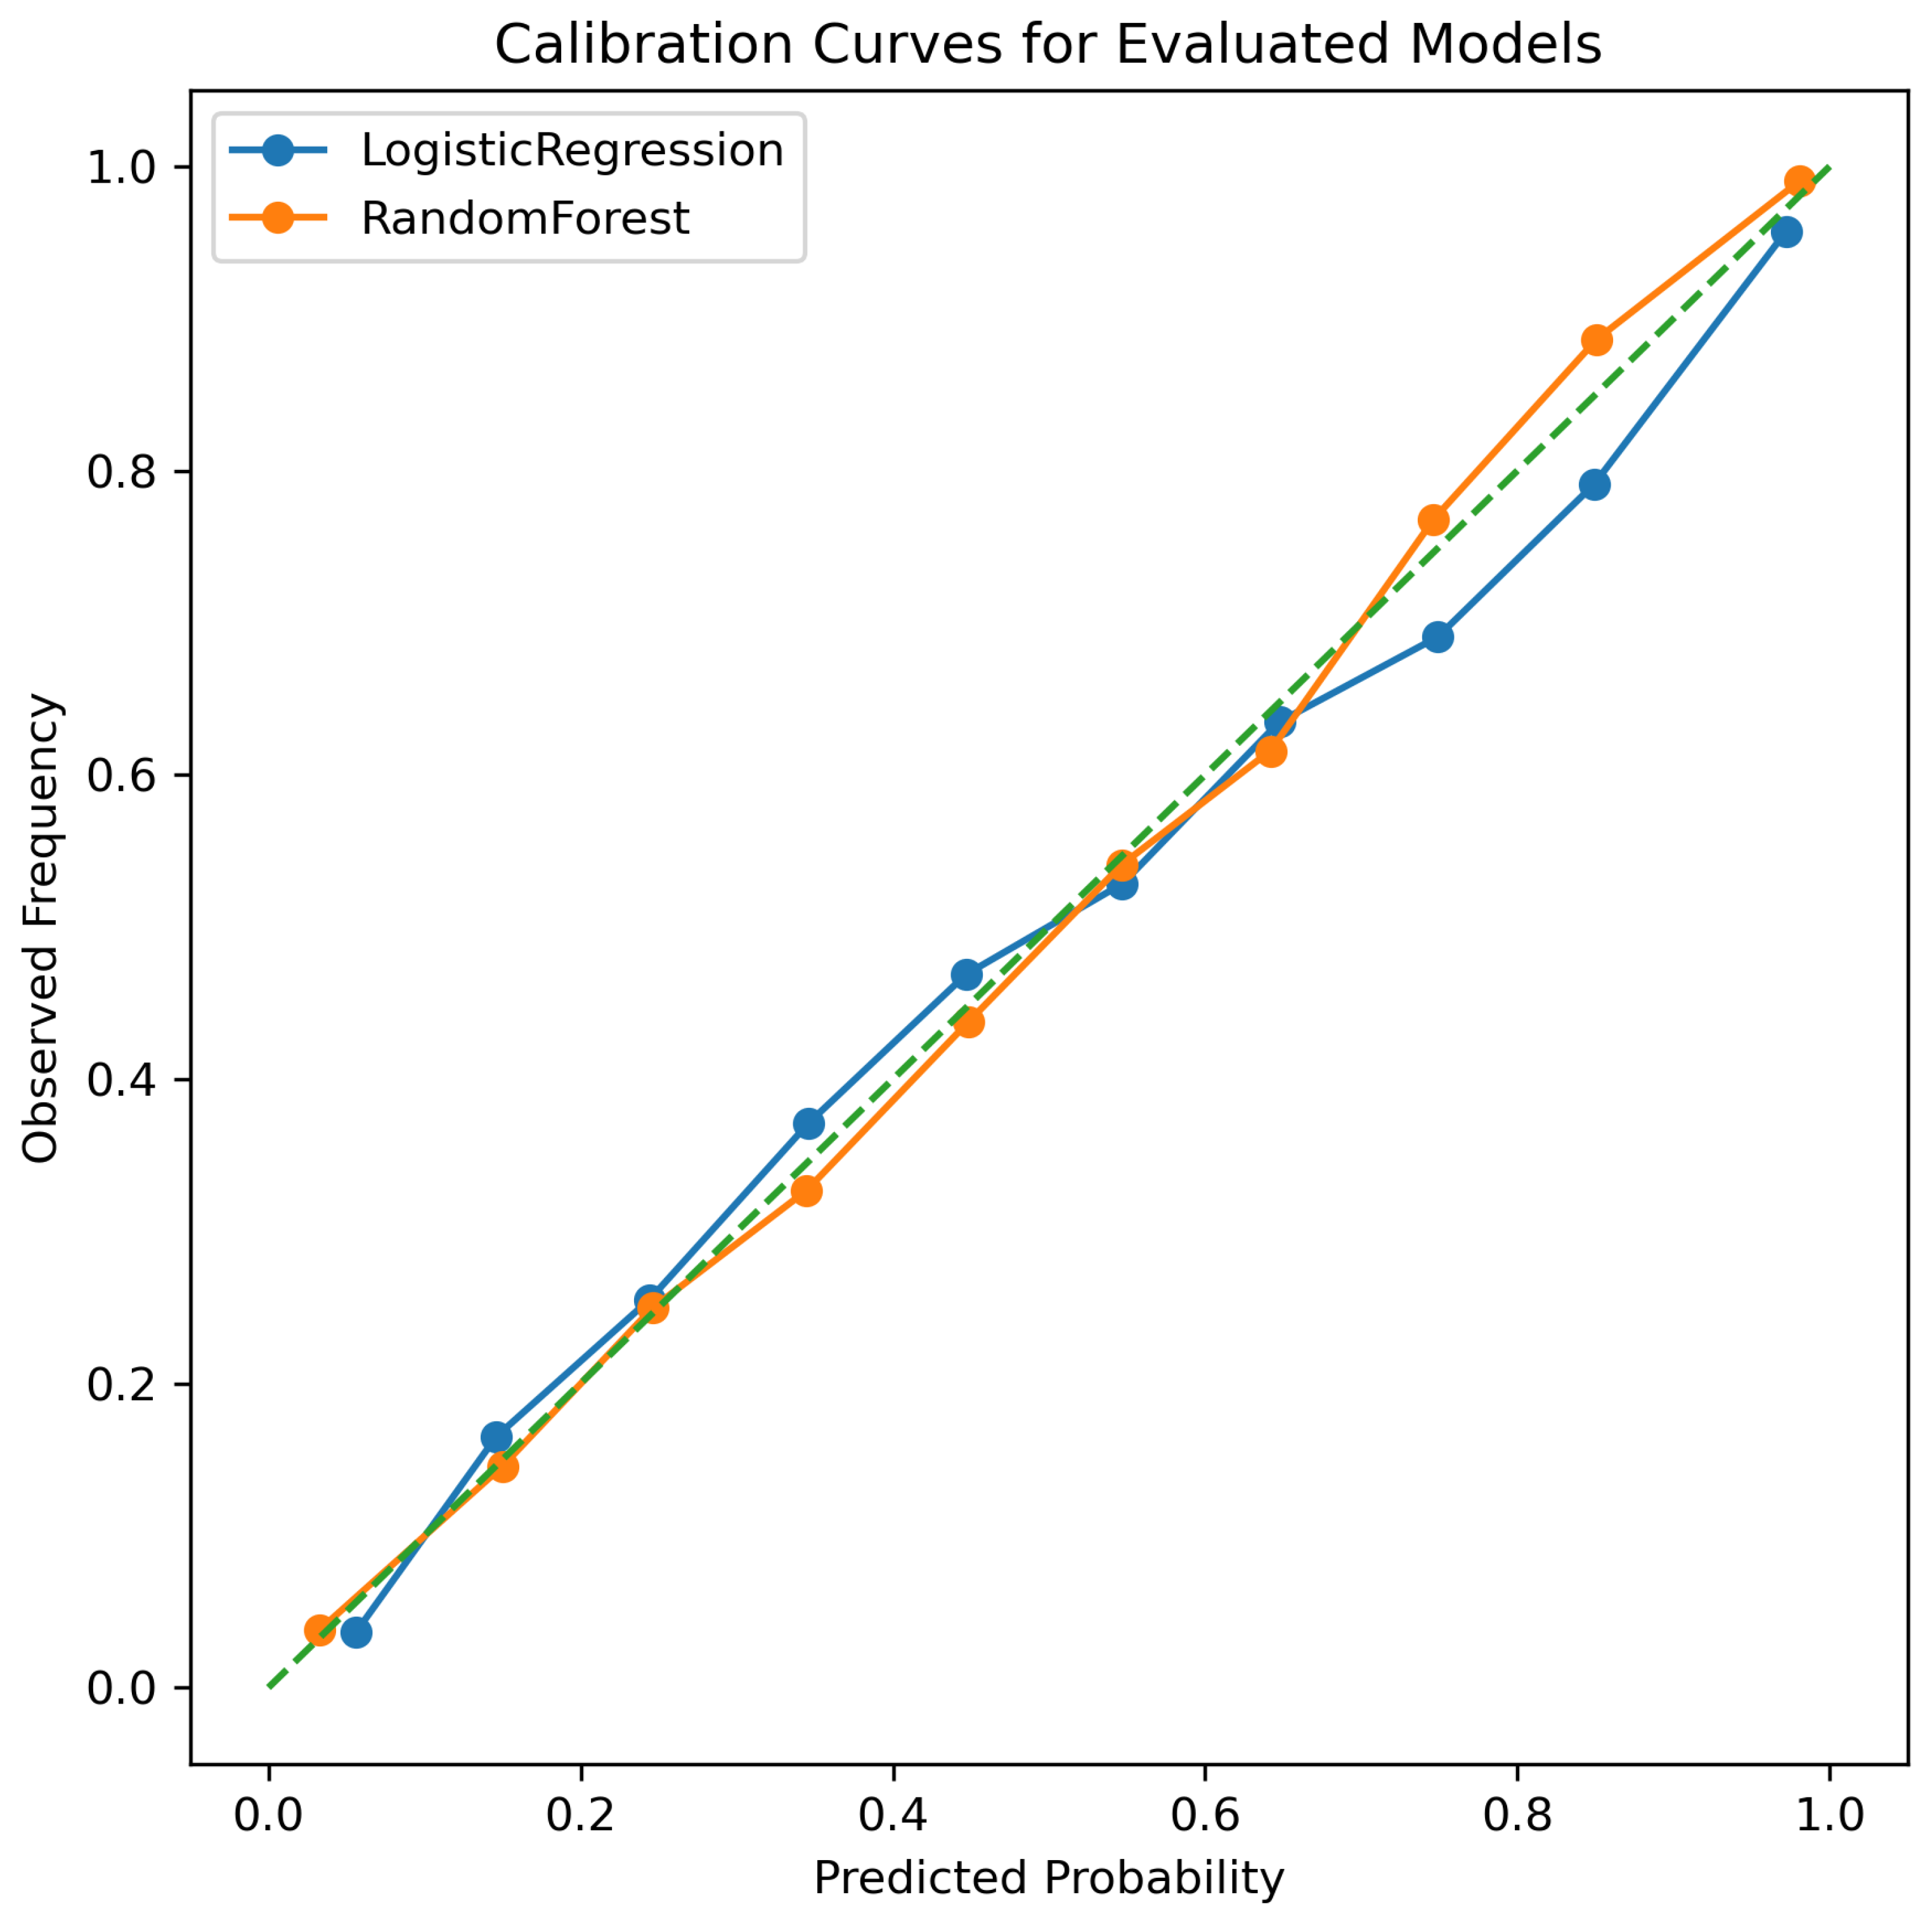
Figure 5.
Sensitivity of subgroup false negative rate disparities to classification threshold. The left panel shows differences between female and male individuals, while the right panel shows differences between Non-White and White groups.
Figure 5.
Sensitivity of subgroup false negative rate disparities to classification threshold. The left panel shows differences between female and male individuals, while the right panel shows differences between Non-White and White groups.
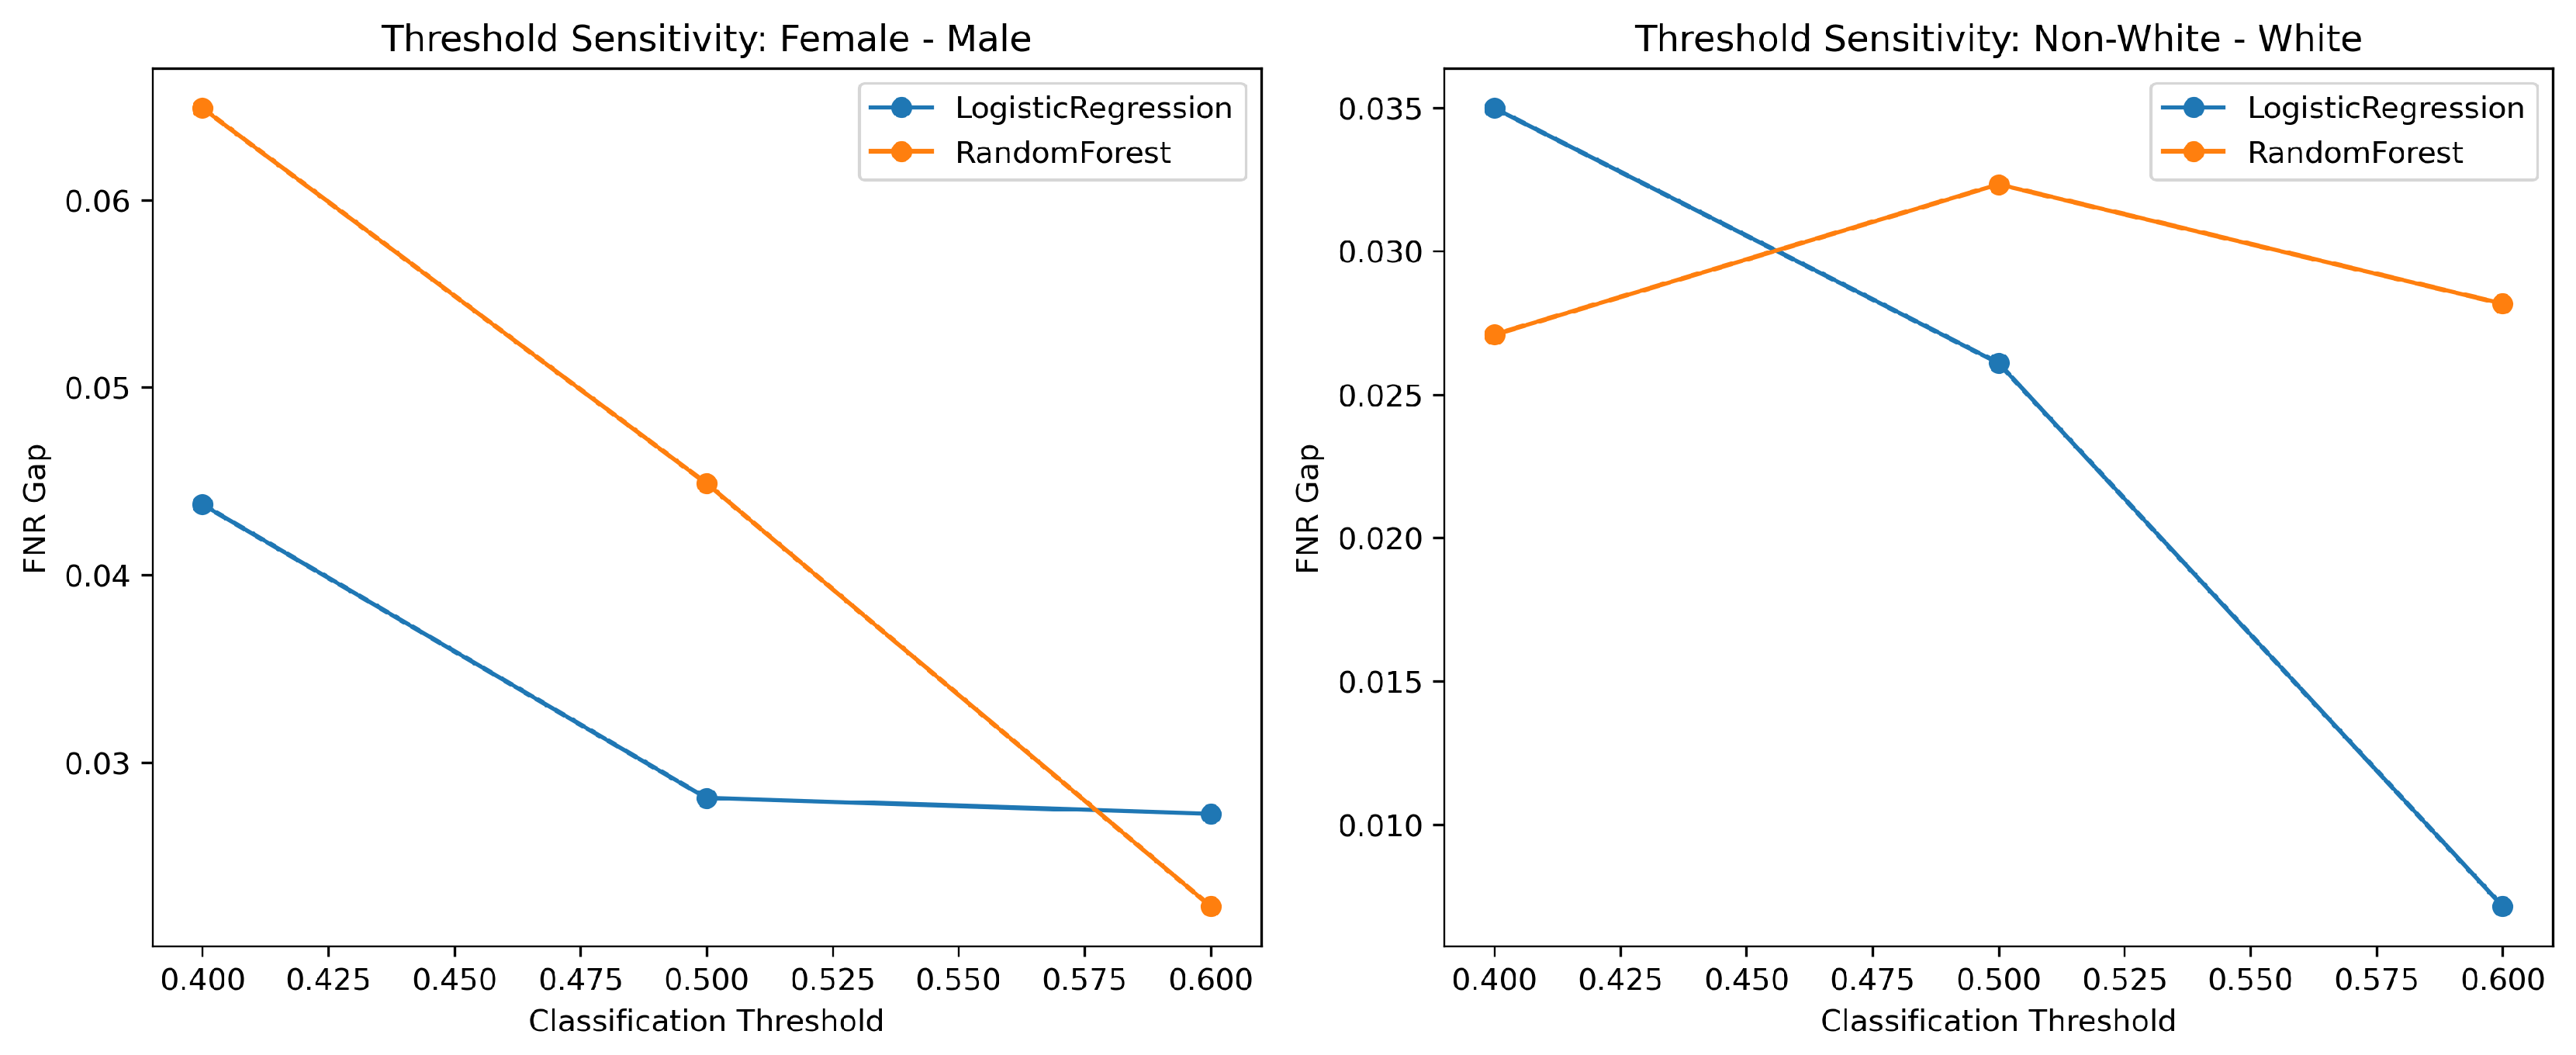

Table 1.
Model performance and subgroup disparities.
| Model | ROC–AUC | FNR (F) | FNR (M) | Gap (F–M) | FNR (NW) | FNR (W) | Gap (NW–W) |
|---|---|---|---|---|---|---|---|
| Logistic Regression | 0.826 | 0.632 | 0.603 | 0.028 | 0.631 | 0.605 | 0.027 |
| Random Forest | 0.858 | 0.572 | 0.527 | 0.045 | 0.563 | 0.531 | 0.033 |
Note: F = Female, M = Male, NW = Non-White, and W = White. Gap values are computed from the original full-precision subgroup false negative rates and may not exactly match the subtraction of the rounded values shown in the table.
Disclaimer/Publisher’s Note: The statements, opinions and data contained in all publications are solely those of the individual author(s) and contributor(s) and not of MDPI and/or the editor(s). MDPI and/or the editor(s) disclaim responsibility for any injury to people or property resulting from any ideas, methods, instructions or products referred to in the content. |
© 2026 by the authors. Licensee MDPI, Basel, Switzerland. This article is an open access article distributed under the terms and conditions of the Creative Commons Attribution (CC BY) license (http://creativecommons.org/licenses/by/4.0/).
Copyright: This open access article is published under a Creative Commons CC BY 4.0 license, which permit the free download, distribution, and reuse, provided that the author and preprint are cited in any reuse.