Preprint
Article

This version is not peer-reviewed.

Targeting Cancer Metabolism: Modulation of Metformin Antitumor Effects by Caffeine with Involvement of p53 Signaling

Submitted:

26 March 2026

Posted:

27 March 2026

You are already at the latest version

Abstract

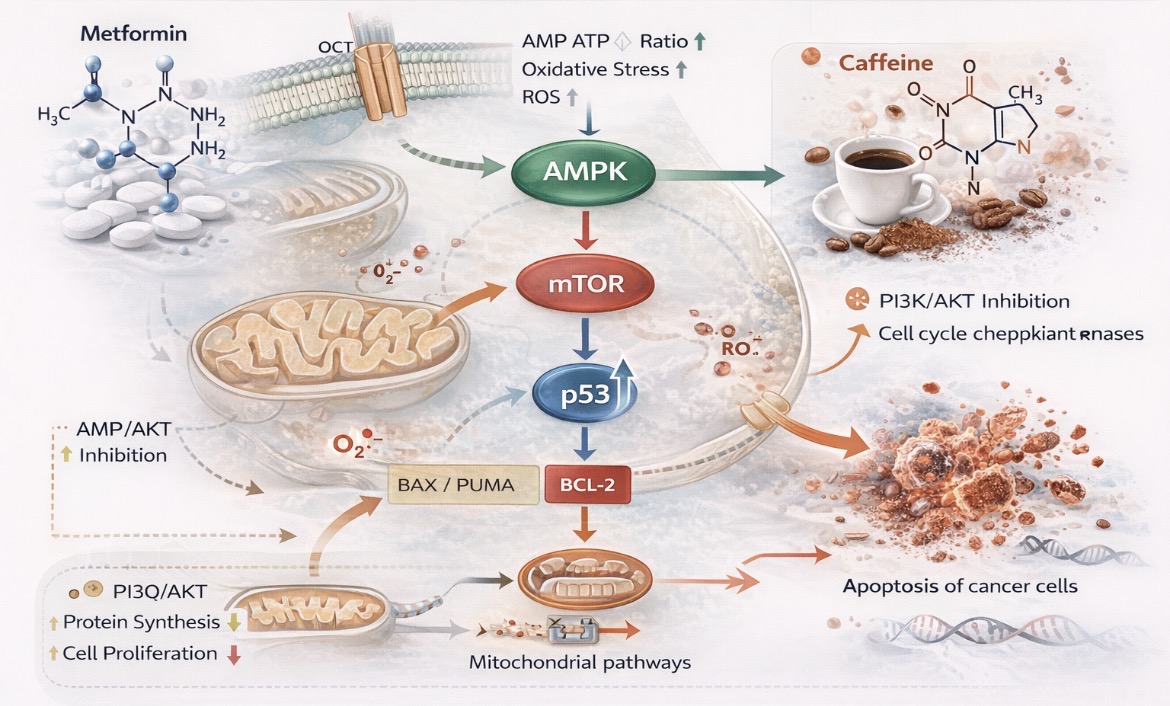
Background: Cancer remains a major global health challenge, with treatment efficacy limited by drug resistance and adverse effects. Drug repurposing offers opportunities for novel anticancer strategies. This study evaluated the cytotoxic, antiproliferative, and pro-apoptotic effects of metformin and caffeine, alone and in combination, in human cancer cell lines, and their potentialinteraction mechanisms. Methods: Human cervical carcinoma (HeLa), lung adenocarcinoma (A549), and colorectal carcinoma (HT29) cell lines were treated with metformin (0.05–50 mM) and caffeine (0.5–5 mM), alone or combined, for 24 and 48 h. Cell viability and proliferation were assessed using Trypan Blue and sulforhodamine B (SRB) assays. Apoptosis was analyzed by Annexin V/propidium iodide flow cytometry, and p53 expression in HeLa cells was determined by ELISA. Statistical analysis was performed using one-way ANOVA with Tukey’s post hoc test. Results: Metformin induced dose- and time-dependent cytotoxicity in all cell lines, with the lowest IC₅₀ values in HeLa and A549 cells after 48 h (2.28 and 3.30 mM; p < 0.05). Caffeine showed moderate antiproliferative activity, with strongest effects at 2.03 mM in HeLa and 2.01 mM in HT29 cells (p < 0.05). Combined treatment demonstrated variable effects depending on the cell line and treatment duration, with limited synergistic interaction observed only under specific conditions, while predominantly antagonistic effects were detected overall. Increased apoptosis and elevated p53 expression suggest activation of tumor-suppressive pathways. Conclusions: Metformin exhibits significant anticancer activity in vitro, supporting metformin repurposing in oncology. However,the addition of caffeine does not uniformly enhance its efficacy and appears to exert context-dependent effects.Further in vivo studies are required to confirm its clinical relevance.

Keywords: 
;  ;  ;  ;  ;  ;  ;  

1. Introduction

Cancer remains one of the leading causes of death worldwide, alongside cardiovascular diseases, highlighting the urgent need for effective and affordable anticancer therapies [1]. The COVID-19 pandemic significantly disrupted routine medical care, including cancer screening, diagnosis, and treatment. As a result, epidemiological data from 2021 indicate that tracheal, bronchial, and lung cancers ranked among the leading causes of death globally [1,2]. According to the World Health Organization (WHO), fluctuations in cancer mortality during 2020–2021 were influenced by the high burden of COVID-19-related deaths, either directly or indirectly through associated comorbidities such as chronic respiratory and cardiovascular diseases [1,2,3].
Recent global cancer statistics continue to demonstrate the substantial burden of malignancies. Although current incidence and mortality data typically lag by several years due to collection and validation processes (Siegel et al., 2025), available estimates suggest a significant increase in cancer cases in the post-pandemic period [2]. According to GLOBOCAN 2025, approximately 21.3 million new cancer cases and 10.4 million
cancer-related deaths were reported worldwide, with lung cancer remaining the leading cause of cancer mortality, accounting for approximately 1.8 million deaths (18%) [3]. Lung, colorectal, and cervical cancers together represent a substantial proportion of global cancer incidence.
In Serbia, epidemiological data indicate that lung cancer has the highest incidence among men, followed by colorectal and prostate cancer, while breast cancer is the most common malignancy among women, followed by colorectal, lung, and cervical cancers [4]. Treatment strategies for these malignancies vary depending on disease stage, tumor localization, and patient condition, and include surgery, radiotherapy, chemotherapy, targeted therapy, and hormonal therapy [5]. However, these approaches are often associated with significant adverse effects, including nausea, fatigue, and gastrointestinal disturbances, emphasizing the need for safer and more effective therapeutic alternatives [6,7].
Metformin (1,1-dimethylbiguanide hydrochloride) is a biguanide oral hypoglycaemic agent and the first-line therapy for type 2 diabetes mellitus [8]. Its widespread clinical use is attributed to its favorable safety profile, good tolerability, and efficacy in reducing hyperglycaemia without inducing weight gain or hypoglycaemia. Beyond glycaemic control, metformin has attracted considerable attention for its potential role in cancer prevention and therapy, making it a strong candidate for drug repurposing [9,10].
After oral administration of 500–1000 mg of immediate-release formulations, metformin is rapidly absorbed in the small intestine, reaching peak plasma concentrations (Tmax) at approximately 2.5 h, with an absolute bioavailability of ~50%. Peak plasma concentrations (Cmax) are typically ~2 μg/mL and rarely exceed 4 μg/mL, while steady-state concentrations range from 0.3 to 1.5 μg/mL. Plasma protein binding is negligible, and metformin exhibits extensive tissue distribution, with a volume of distribution (V_d) of 100–300 L. The elimination half-life (T1/2) is approximately 6–7 h but may be prolonged in patients with impaired renal function. Metformin is not metabolized and is excreted unchanged in the urine, with renal clearance accounting for the majority of its elimination [10].
Epidemiological data first reported by Evans et al. demonstrated that metformin use is associated with a reduced cancer risk of up to 25% [11]. Subsequent studies have confirmed its antiproliferative effects in a broad range of malignancies, including breast, liver, colorectal, pancreatic, prostate, lung, ovarian, cervical, and skin cancers [12]. However, the molecular mechanisms underlying these effects remain incompletely defined.
The anticancer activity of metformin involves both indirect and direct mechanisms. Indirectly, metformin reduces systemic glucose levels by suppressing hepatic gluconeogenesis, increasing insulin sensitivity, and enhancing peripheral glucose uptake through activation of AMP-activated protein kinase (AMPK) [13]. This leads to decreased circulating insulin and insulin-like growth factor-1 (IGF-1) levels, thereby limiting tumor growth stimulation [8,13,14].
Directly, metformin exerts antiproliferative effects on tumor cells by inducing apoptosis and inhibiting protein synthesis [15,16]. It promotes cell cycle arrest in the G1 phase, primarily via AMPK activation and inhibition of the mammalian target of rapamycin (mTOR) signalling pathway. In addition, metformin modulates autophagy, while the STK11/AMPK/mTOR axis plays a central role in regulating cellular processes, including survival, proliferation, apoptosis, and metabolism [17,18].
Caffeine is a well-known central nervous system stimulant that acts via adenosine receptors and catecholamine neurotransmitters, adrenaline and noradrenaline. It is a prevalent compound in various ingredients, especially coffee, tea, and soft drinks, making it a staple of modern life. The mechanism of its impact involves inhibiting various protein kinases, including ATM and ATR (ataxia telangiectasia mutated and ataxia telangiectasia and Rad3-related), key enzymes in DNA-induced cell death and apoptosis [19,20]. Caffeine also shows antitumor activity and as a non-selective phosphodiesterase (PDE) inhibitor. It acts by competing for the catalytic site of phosphodiesterases (PDE), thereby preventing the degradation of cyclic adenosine monophosphate (cAMP) and cyclic guanosine monophosphate (cGMP). Elevated intracellular levels of cAMP and cGMP suppress cancer cell growth and induce its apoptosis [20,21]. Moreover, caffeine is used as both a chemo- and radiosensitizer, i.e. enhancing the effects of chemotherapy and radiotherapy [20,22].
Given these properties, the present study aimed to evaluate the antitumor effects of metformin, alone and in combination with caffeine, in human cancer cell lines, and to further elucidate the underlying mechanisms of their potential synergistic/antagonistic activity.

2. Materials and Methods

2.1. Reagents

Metformin hydrochloride (99.99%, Galenika, Serbia) was dissolved in phosphate-buffered saline (PBS, Dulbecco’s PBS, Capricorn Scientific GmbH, Germany) immediately before use. The following reagents were used: 2-deoxy-D-glucose (2DG) and caffeine (Abcam, Cambridge, UK); sulforhodamine B, Tris base, dimethyl sulfoxide (DMSO), and DMEM (Sigma-Aldrich Chemie GmbH, Germany); trichloroacetic acid (Merck Chemie GmbH, Germany); acetic acid and sodium chloride (Zorka Pharma Hemija, Serbia); Annexin V-FITC and propidium iodide (Becton Dickinson Pharmingen, Germany); viability kit (Invitrogen); and SYBR-14/PI (Sigma-Aldrich Chemie GmbH, Germany). Metformin and other pharmacological modulators were added before treatment.

2.2. Cell Culture

Human cervical carcinoma cells HeLa cells (ATCC® CCL-2™), A549 lung adenocarcinoma cells (ATCC® CCL-185™), and HT29 colorectal carcinoma cells (ATCC® HTB-38™) were obtained from the American Type Culture Collection (ATCC), Manassas, VA, USA. Cells were cultured in Dulbecco’s Modified Eagle Medium (DMEM) containing 4.5 g/L glucose, supplemented with 10% fetal bovine serum (FBS) and 1% antibiotic/antimycotic solution.
Cells were incubated at 37 °C in a humidified atmosphere containing 5% CO₂. Cell lines were passaged twice weekly and used during the exponential growth phase (passages 3–10). After thawing, cells were cultured in 25 cm² flasks at a density of 1×10⁶ cells in 10 mL medium. When confluence was reached, cells were detached using 0.1% trypsin and seeded for experiments.
For viability assays, cells were seeded in 96-well plates (1×10⁵ cells per well), while for flow cytometry analysis cells were seeded in 25 cm² flasks at 1×10⁶ cells per flask.

2.3. Cell Viability Assayand Proliferation Assays

2.3.1. Trypan Blue Exclusion Assay:

Only viable cells were used in the experiment.Cell viability was determined using the Trypan Blue exclusion method[23].Cells were mixed with 0.1% Trypan Blue and counted using a hemocytometer under an inverted microscope.

2.3.2. Sulforhodamine B (SRB) Assay

The cytotoxic effects of metformin and caffeine on HeLa, A549, and HT29 cell proliferation were evaluated using the SRB assay. Cells in the exponential growth phase were treated with increasing concentrations of metformin (0.05–50 mM) and caffeine (0.5–5 mM), individually or in combination, for 24 and 48 h.The SRB assay, is based on measuringthe cell protein content, with sulforhodamine binding to amino acid residues of cellular proteins [24]. Following treatment, cells were fixed with 10% trichloroacetic acid, stained with SRB, and washed with 1% acetic acid. The bound dye was solubilized, and absorbance was measured at 540 nm[25].

2.4. Apoptosis Analysis by Flow Cytometry

Apoptosis was assessed using Annexin V-FITC/propidium iodide (PI) staining. Following treatment, cells were trypsinized, collected, and centrifuged (250 × g, 5 min), then resuspended in binding buffer and stained with Annexin V-FITC and PI. Samples were incubated for 15 min in the dark at room temperature and analyzed within 1 h using flow cytometry (Guava EasyCyte). Annexin V-positive/PI-negative cells were classified as early apoptotic, while Annexin V-positive/PI-positive cells were considered late apoptotic or necrotic[26]. Staining was performed according to the manufacturer’s instructions (BD Pharmingen, San Diego, CA, USA).
Cell death parameters were analysed by flow cytometry, by Annexin V-FITC on Guava EasyCyte, Guava Technologies, Hayward, CA, USA. At least 10,000 particles were analysed per sample. Different cell cultures were automatically photographed using an Olympus BX40 microscope, with images archived via Olympus SP/500 UZ software (Japan).

2.5. ELISA Assay: Determination of Tumor-Suppressor Genes for p53

Expression of the tumor suppressor protein p53 in HeLa cells was quantified using a commercially available ELISA kit (Abcam, Cambridge, UK) according to the manufacturer’s instructions.
Briefly, standards, control samples, and treated cell lysates were added to 96-well microplates and incubated with a biotinylated anti-p53 antibody. Following washing steps, streptavidin–horseradish peroxidase (HRP) conjugate was added and incubated under standard conditions. After removal of unbound components, tetramethylbenzidine (TMB) substrate was applied, resulting in a colorimetric reaction proportional to the p53 concentration.The reaction was terminated using a stop solution, and absorbance was measured at 450 nm using a microplate reader. p53 concentrations were calculated based on a standard calibration curve generated using known concentrations of the protein.
All measurements were performed in triplicate, and results are presented as mean ± standard deviation (SD).

2.6. Statistics

All experiments were performed in at least three independent experiments, and results are presented as mean ± standard deviation (SD). Statistical analysis was performed using one-way ANOVA followed by Tukey’s post hoc test for multiple comparisons. Statistical comparisons were performed between treated groups and control, as well as between combination and individual treatments. Differences were considered statistically significant at p ≤ 0.05.IC50 values were calculated using nonlinear regression analysis (log[inhibitor] vs. response). The interaction between metformin and caffeine was evaluated using the Chou–Talalay method [27,28], and combination index (CI) values were calculated using CalcuSyn software (Biosoft, Cambridge, UK) based on the median-effect principle to assess synergistic, additive, or antagonistic effects.

3. Results

To investigate the cytotoxicity of metformin and caffeine, individually and in combination, on cell lines HeLa, A549, HT29, as well as on healthy lung fibroblasts (MRC5), the SRB assay was applied. Flow cytometry was used to determine the cytotoxic impact of metformin on the HeLa cell line, while ELISA was employed to measure p53 expression in the same cell culture. Based on data obtained from the readings, the concentrations of metformin applied to various cell cultures ranged from 1 mM to 80 mM [29,30,31]. Assessment of metformin's ability to inhibit proliferation in cervical, colorectal, and colon cancer cell cultures was performed by incubating the cells with metformin (1 mM, 5 mM, 10 mM, 20 mM, and 50 mM) and analysing them by flow cytometry after 24 hours, followed by a SRB assay after 48 hours. Representative histograms and dot plots from at least three independent experiments are presented (Figure 1, Figure 10). As shown in the diagrams, metformin and caffeine, both individually and in combination, inhibited cell proliferation in a dose- and time-dependent manner. This effect was particularly evident in cervical carcinoma cells, as well as in colorectal carcinoma and lung adenocarcinoma cells. As the initial analysis of HeLa cells inhibition of proliferation indicated a strong inhibitory impact of metformin in stated dosage (1 mM–50 mM), further tests were conducted with lower concentrations: 50 μM, 100 μM, 250 μM, 350 μM, 500 μM, 1 mM, 2 mM, 3 mM, 4 mM, 5 mM, and 10 mM. The same concentrations were applied to treat cell culture in adenoma lung cancer and colon carcinoma (A549 and HT29) (Figure 1).Mechanistic analyses were performed in HeLa cells, which showed the highest sensitivity to treatment.

3.1. Metformin

3.1.1. Cytotoxic Activity

The IC50 value determined after 24 h of metformin treatment in cervical carcinoma cell culture was 6.036 mM, in lung adenocarcinoma 14.79 mM, and in colorectal adenocarcinoma 26.53 mM. Since normal lung fibroblasts (MRC-5) were also tested under the same conditions, the IC50 value after 24 h for these cells was 33.46 mM, which is considerably higher than the values obtained for the tumor cell cultures. From the presented diagrams, HeLa cells exhibited the highest sensitivity to metformin treatment. When examining the effects of metformin exposure for 48 h, all cell lines demonstrated a marked reduction in the half-maximal inhibitory concentration (IC50), with values reduced to approximately 50% of those recorded at 24 h. Metformin reduced cell viability in a dose- and time-dependent manner across all cell lines. HeLa cells were the most sensitive, with an IC₅₀ of 2.28 mM at 48 h, followed by A549 (3.30 mM) and HT29 cells (10.54 mM). In contrast, normal MRC-5 fibroblasts showed significantly higher IC₅₀ values (33.46 mM), indicating selective cytotoxicity toward tumor cells

3.1.2. Flow Cytometry Analysis

Apoptosis of the cells was determined by flow cytometry, and representative histograms with their corresponding readings are shown (Figure 2). Flow cytometry analysis confirmed that metformin treatment increased apoptotic cell populations in HeLa cells in a time-dependent manner. The proportion of early and late apoptotic cells increased after 48 h compared to 24 h, indicating enhanced induction of apoptosis.

3.1.3. Apoptosis and Necrosis Detection by Immunofluorescence Microscopy

To evaluate early and late apoptosis, as well as necrosis, an Annexin V assay was employed, and fluorescence signals were analysed using an immunofluorescence microscope. Figure 4 A. illustrates early apoptosis, where a substantial proportion of viable cervical carcinoma cells, stained in red, are still present. The initiation of apoptosis is indicated by Annexin V binding to exposed phosphatidylserine residues, visualised in green.For the detection of early apoptosis, late apoptosis, and necrosis, the Annexin V assay was used, and the results were read using an immunofluorescence microscope. In Figure 4 B, early apoptosis is shown, where a large number of viable cervical cancer cells can still be observed, stained red, while some cells show the beginning of apoptosis through the binding of Annexin to its receptors, which is indicated by green fluorescence.

3.1.4. Modulation of Tumor Suppressor p53 Expression Following Metformin and Combined Metformin–Caffeine Treatment in Cervical Cancer Cells (HeLa Cells)

The concentration of p53 protein was determined in cervical adenocarcinoma cell lines and normal lung fibroblasts using the ELISA method performed according to the manufacturer’s protocol provided by Abcam (Cambridge, UK).
The expression of the tumor suppressor protein p53 was analyzed in cervical carcinoma cell lines following treatment with metformin, as well as after combined treatment with metformin and caffeine. Normal lung fibroblasts (MRC-5) were used as the control group.
The following section presents the data obtained for the standard calibration curve (Table S1-Suplementary), the absorbance readings measured at 450 nm (Table 1), and the representative calibration curve generated from the ELISA assay. Metformin treatment resulted in increased p53 expression in HeLa cells, which was further enhanced following combined treatment with caffeine.This may indicate activation of tumor suppressor pathways; however, further studies are required to confirm the functional role of p53 in mediating the observed effects.

3.2. Caffeine

Caffeine exhibited moderate antiproliferative activity in all tested cell lines. The strongest effects were observed in HeLa and HT29 cells after 48 h, with IC₅₀ values of 2.03 mM and 2.01 mM, respectively, as shown in the Figure 7.

3.3. Combination of metformin and Caffeine

To investigate the cytotoxic effects of the combined treatment with metformin and caffeine, treatment concentrations were selected based on the results obtained from their individual applications. Accordingly, cell cultures of cervical cancer, lung adenocarcinoma, and colon cancer were exposed to metformin at concentrations of 0.05 mM, 0.1 mM, 0.25 mM, 0.5 mM, and 1 mM, in combination with caffeine at a concentration of 1 mM, in order to evaluate their potential synergistic effects on cancer cell viability.
The strongest cytotoxic impact following 24 hrs of incubation, caffeine was expressed on HeLa cell structure, where IC50 2.44 mM was determined, while a slightly weaker impact was expressed on HT29 where IC50 HT29 was determined on cell structure.
Since the cytotoxic impact testing on the cell culture of cervical adeno carcinoma and lung adeno carcinoma determined that the impact of 0,5 mM caffeine dosage has no impact whatsoever, in the subsequent experiment, the only applicable dosage was: 1 mM, 2 mM and 4mM (Table 3). IC50 after 24 hrs was determined for each cell culture, and IC50 after joint incubation of 48 hrs treatment(Table 4).Combined treatment with metformin and caffeine showed variable effects compared to individual treatments. CI analysis revealed limited synergism only in HeLa cells after 24 h, whereas antagonistic interactions predominated in most other conditions.

3.4. Figures, Tables and Schemes

Figure 1. Cytotoxic activity of Metformin against human cancer cell lines and MRC5.
Preprints 205236 g001
Figure 2. Flow cytometry dot plot analysis and population statistics, on HeLa cell line. (a) without adjuvant, after 24 h. (b) with metformin after 24 h of treatment. (c) with metformin after 48 h of treatment,Viable cells→ FITC Annexin V and PI negative (Annexin V – / PI –); Cells in early apoptosis→ FITC Annexin V positive and PI negative (Annexin V + / PI –); Cells in late apoptosis or already dead→FITC Annexin V and PI positive (Annexin V + / PI +).
Preprints 205236 g002
Figure 3. Flow cytometry dot plot analysis and population statistics, on MRC5 cell line (a) The impact of metformin after 24 h (b) The impact of metformin after 48 h.
Preprints 205236 g003
Figure 4. Apoptosis on cancer cell line: (a) Immunofluorescence micrograph of early apoptosis, affected by metformin on cervical adenocarcinoma HeLa cells (1000x ; (b) Immunofluorescence micrograph of late apoptosis, affected by metformin on cervical adenocarcinoma HeLa cells (400x).
Preprints 205236 g004
Figure 5. Immunofluorescence micrographof early apoptosis on cervical adenocarcinoma cells (HeLa) affected by metformin(1.000x).1. 1Footer. Figure 5 presents a huge number of cervical adenocarcinoma cells that were already bound to Annexin-V and stained in green. Late apoptosis was shown. The moment of bonding Annexin-V to the receptors is visualised in green colour.
Preprints 205236 g005
Figure 6. Quantitative Measurements p53 in HeLa cells after 24 h and 48 h of Incubation.
Preprints 205236 g006
Figure 7. Cytotoxic activity of caffeine against all tested human cancer cell lines and MRC5.
Preprints 205236 g007
Figure 8. Cytotoxic activity of Metformin and caffeine on HeLa and A549 cell lines.
Preprints 205236 g008
Figure 8. Isobologram analysis of metformin and caffeine interaction in HeLa cells (48 h).
Preprints 205236 g009
Figure 9. Dose-dependent CI analysis of metformin and caffeine across cell lines.
Preprints 205236 g010
Table 1. Comparative Measurements in HeLa and MRC-5 Cells Following 24 h and 48 h of Incubation.
24h
Recorded (450nm)
Concentration
(U/mL) p53
48h
Recorded (450nm)
Concentration
(U/mL) p53
MRC 5 0.412 23.04 0.511 28.58
MRC 5 + Met1 0.385 21.53 0.415 23.21
MRC 5 + Caff1 0.365 20.41 0.395 22.09
HeLa 1.371 76.67 0.518 28.57
HeLa + Met 0.755 42.23 0.583 32.60
HeLa + Caff 0.572 31.99 0.464 25.95
Standard (S) 0.3 5.51 0.504 28.19
Control (C) 1.344 75.16 0.623 34.84
Footer1: Met – metformin, Caff - caffeine.
Table 2. The IC50 value (mM) determined after 24 and 48h of metformin treatment in HeLa (cervical carcinoma), A549 (lung adenocarcinoma), and HT29 (colorectal carcinoma).
Cell line Metformin 24h Metformin 48h
HeLa 6.04 2.28
A549 14.79 3.30
HT 29 26.53 10.54
MRC 5 33.461 33.461
1Footer.normal lung fibroblasts (MRC-5) - control cell line.
Table 3. The IC50 value mMdetermined after 24 and 48h of caffeine treatment in HeLa (cervical carcinoma), A549 (lung adenocarcinoma), and HT29 (colorectal carcinoma).
Cell line Caffeine24h Caffeine48h
HeLa 2.44 2.03
A549 3.38 2.44
HT 29 3.41 2.01
MRC 5 3.55 1 2.621
1Footer.normal lung fibroblasts (MRC-5) - control cell line.
Table 4. The IC50 value determined after 24 and 48h of (Met + Caff) treatment in HeLa (cervical carcinoma), A549 (lung adenocarcinoma), and HT29 (colorectal carcinoma).
Cell line Met + Caff 2 (24 h) Met + Caff 2 (48h)
HeLa 2.23 2.4
A 549 12.39 6.36
HT 29 18.71 13.46
MRC 51 22.60 38.301
1Footer. normal lung fibroblasts (MRC-5) - control cell line, 2 Met + Caff - metformin and caffeine.
Table 5. Evaluation of drug interaction between metformin and caffeine based on IC₅₀-derived combination index (CI) values in HeLa, A549, HT29, and MRC-5 cells after 24 h and 48 h.
24h
CI1
     48h
     CI1
MRC 5      0.96       1.53
HeLa      0.78       1.55
A549      1.13       2.34
HT 29      0.99      1.78
1Footer: CI < 1 indicates synergism, CI = 1 additive effect, and CI > 1 antagonism.
The second and fourth columns represent the raw measured values, whereas the third and fifth columns correspond to concentrations calculated from the standard values and the calibration curve. O.D. denotes the optical density measured at 450 nm, and C represents the concentration expressed in international units per millilitre (U/mL).
Isobologram analysis of metformin and caffeine interaction in HeLa cells after 48 h of treatment. The straight line represents the theoretical additive effect (CI = 1). Data points located below the line indicate a synergistic interaction.

3.5. Drug Interaction Analysis by the Chou–Talalay Method

Drug interaction analysis performed at the IC₅₀ level revealed that the effect of metformin combined with caffeine was both cell line- and time-dependent. In HeLa cells, the combination showed a synergistic interaction after 24 h of treatment (CI = 0.779), whereas an antagonistic effect was observed after 48 h (CI = 1.545). In A549 cells, antagonism was detected at both time points, with CI values of 1.134 at 24 h and 2.337 at 48 h. In HT29 cells, the interaction was nearly additive after 24 h (CI = 0.998) but shifted toward antagonism after 48 h (CI = 1.775). In normal MRC-5 fibroblasts, the combination showed slight synergy or a nearly additive effect at 24 h (CI = 0.957), while antagonism was observed after 48 h (CI = 1.526). Overall, these findings indicate that the interaction between metformin and caffeine was not uniformly synergistic and depended strongly on both treatment duration and cellular background.Combination Index (CI) values were calculated using the Chou–Talalay method implemented in CompuSyn software based on IC₅₀-derived dose equivalence.

Isobologram Analysis and Theoretical Model

Isoblogram of metformin and caffeine interaction in HeLa cells after 48 h of treatment. The straight line represents the theoretical additive effect (CI = 1). Data points located below the line indicate a synergistic interaction.
The CI values were consistent with the IC₅₀ results, confirming that the combination effect varied depending on the cell line and treatment duration, with improved efficacy observed only in HeLa cells at 24 h and predominantly reduced efficacy in other conditions.

4. Discussion

The present study investigated the cytotoxic and antiproliferative effects of metformin and caffeine, administered individually and in combination, in several human cancer cell lines including cervical carcinoma (HeLa), lung adenocarcinoma (A549), and colorectal carcinoma (HT29). Our results demonstrate that metformin significantly reduces tumor cell viability in a dose- and time-dependent manner, while caffeine alone exhibits moderate antiproliferative activity. The combination of metformin and caffeine demonstrated differential effects across the tested models, with synergism observed only under specific conditions, while antagonistic interactions predominated overall.
Metformin has attracted considerable attention as a potential candidate for drug repurposing in oncology due to its favorable safety profile and widespread clinical use in the treatment of type 2 diabetes mellitus. Epidemiological studies have suggested that diabetic patients receiving metformin therapy may exhibit a reduced risk of cancer development and improved survival outcomes compared with patients treated with other antidiabetic drugs [12,16]. These observations have stimulated extensive investigation into the anticancer mechanisms of metformin.
One of the most widely described mechanisms of metformin action involves activation of AMP-activated protein kinase (AMPK), a key regulator of cellular energy homeostasis. Activation of AMPK results in inhibition of the mammalian target of rapamycin (mTOR) signaling pathway, which plays a crucial role in cell growth, protein synthesis, and tumor cell proliferation [17,18,29]. Inhibition of mTOR signaling reduces tumor cell growth and promotes metabolic stress that may ultimately lead to apoptosis [22]. In addition to this mechanism, metformin has also been reported to inhibit mitochondrial respiratory chain complex I, resulting in decreased ATP production and activation of metabolic stress responses in cancer cells [29,30].The concentrations of metformin used in this study exceed physiological plasma levels; however, such ranges are commonly applied in in vitro models to overcome limited cellular uptake and to approximate intracellular accumulation required to elicit measurable anticancer effects.
The predominance of antagonism represents a particularly important finding. One possible explanation is that caffeine-mediated inhibition of checkpoint signaling may interfere with the cellular stress response required for full activation of metformin-induced cytotoxicity. Specifically, while metformin is knowm to induces metabolic stress and activates AMPK–p53 signaling, caffeine may attenuate stress signaling pathways or alter cell cycle dynamics in a way that reduces apoptotic susceptibility. Alternatively, caffeine-induced increases in intracellular cAMP levels may activate pro-survival pathways under certain conditions, thereby counteracting the effects of metabolic inhibition.
Another plausible explanation lies in the temporal dynamics of stress responses. The observed synergism at 24 h followed by antagonism at 48 h suggests that early co-treatment may transiently overwhelm cellular adaptive mechanisms, while prolonged exposure allows cancer cells to activate compensatory survival pathways. This highlights the importance of treatment scheduling and duration when evaluating drug combinations targeting cancer metabolism.
The antiproliferative effects observed in our study are consistent with previous findings demonstrating that metformin can inhibit the growth of multiple cancer types, including breast, pancreatic, lung, and colorectal cancers [31,32,33]. In the present study, metformin significantly reduced the viability of all investigated cancer cell lines. However, differences in sensitivity were observed among the cell lines. HeLa cells showed the highest responsiveness to metformin treatment, whereas HT29 cells exhibited relatively greater resistance. Similar variability has been reported in previous studies and may be related to differences in metabolic characteristics, mitochondrial activity, and signaling pathways among different tumor types [34].Although the concentrations used exceed physiological plasma levels,which may limit direct clinical translation; however, such ranges are commonly applied in in vitro studies to overcome limited cellular uptake and to model intracellular accumulation
In addition to metformin, caffeine has also been investigated for its potential role in modulating tumor cell survival. Caffeine is known to interfere with the DNA damage response by inhibiting checkpoint kinases such as ATM and ATR, which regulate cell cycle progression and DNA repair mechanisms [19]. Inhibition of these kinases disrupts the ability of tumor cells to repair DNA damage and increases susceptibility to apoptosis under conditions of cellular stress. Previous studies have demonstrated that caffeine can enhance the cytotoxic effects of anticancer therapies by sensitizing tumor cells to metabolic or genotoxic stress [20].
Although the combination enhanced cytotoxicity under limited conditions, particularly at early time points, the overall interaction was predominantly antagonistic, suggesting that concurrent administration may not universally improve anticancer efficacy.This observation suggests that caffeine may interfere with metformin -induced metabolic stress under certain conditions, potentially reducing its cytotoxic efficiency. Under specific conditions, the interaction between metformin and caffeine may result from complementary mechanisms. The simultaneous disruption of these pathways may overwhelm tumor cell survival mechanisms and promote apoptotic cell death.
Another important finding of this study is the increased expression of the tumor suppressor protein p53 following treatment with metformin and the metformin–caffeine combination. The p53 protein is a key regulator of cell cycle arrest, DNA repair, and apoptosis in response to cellular stress [35]. Activation of p53 signaling pathways plays a crucial role in preventing malignant transformation and promoting programmed cell death. Previous studies have suggested that metabolic stress induced by metformin may stabilize p53 and enhance apoptotic signaling in cancer cells [36]. The increased expression of p53 observed in our experiments therefore supports the hypothesis that activation of tumor suppressor pathways contributes to the cytotoxic effects of metformin and caffeine.
An additional important observation of this study is the relatively low cytotoxic effect observed in normal lung fibroblasts (MRC-5). While metformin and caffeine significantly inhibited proliferation of cancer cell lines, their effects on normal cells were considerably less pronounced. This finding suggests a degree of selectivity toward malignant cells. Tumor cells often exhibit altered metabolic pathways and increased energy demands compared with normal cells, making them more susceptible to metabolic inhibitors such as metformin [32].Importantly, the observed shift from synergism at 24 h to antagonism at 48 h highlights the critical role of treatment timing in determining the outcome of metabolic drug combinations
Recent studies have further highlighted the potential of metformin as a metabolic modulator in cancer therapy. For example, Heckman-Stoddard et al. reported that metformin can influence tumor metabolism and inhibit cancer cell growth through both systemic metabolic effects and direct cellular mechanisms, supporting its role as a promising candidate for drug repurposing in oncology [29]. Similarly, Rena et al. provided an updated overview of the molecular mechanisms underlying metformin action and emphasized its ability to interfere with mitochondrial respiration and cellular energy balance, which may selectively affect tumor cells with high metabolic demands [32].
More recently, clinical and translational studies have continued to explore the anticancer potential of metformin in various malignancies. A comprehensive review by Marciniak et al. highlighted the growing evidence supporting the use of metformin as an adjuvant therapy in cancer treatment, particularly in tumors characterized by altered metabolic signaling pathways [38]. In addition, emerging studies suggest that metabolic modulators such as metformin may enhance the sensitivity of cancer cells to other stress-inducing agents, thereby improving therapeutic outcomes [25].
These findings support the hypothesis proposed in the present study that metabolic stress induced by metformin may increase tumor cell susceptibility to additional modulators such as caffeine. The combination of agents targeting different cellular pathways may result in complex and sometimes antagonistic interactions, underscoring the need for careful evaluation of combination strategies in cancer therapy.
Despite these promising findings, several limitations should be acknowledged. The experiments were conducted under in vitro conditions and therefore do not fully reproduce the complexity of tumor biology in vivo. In addition, although increased p53 expression suggests activation of tumor suppressor pathways, further molecular studies are required to clarify the precise signaling mechanisms responsible for the observed observedinteraction between metformin and caffeine.
Overall, the results of this study support the concept of drug repurposing in oncology[39]The results indicate that while metformin exhibits consistent antiproliferative effects, the addition of caffeine does not uniformly enhance its activity and may, under certain conditions, interfere with its efficacy. Further research is required to investigate the detailed molecular mechanisms involved and to evaluate the therapeutic potential of this combination in in vivo tumor models and clinical studies[34].
A major challenge lies in the lack of data on optimal dosages of metformin and caffeine, as well as their bioavailability in tumor tissues. Future research should focus on precisely defining dosage and evaluating the long-term effects of these agents. In addition, it is necessary to conduct studies that would examine potential adverse effects, particularly in combination with existing therapies.

5. Conclusions

This study demonstrates that metformin exerts significant antiproliferative and pro-apoptotic effects in human cancer cell lines (HeLa, A549, and HT29).The combination with caffeine showed variable effects depending on the cell type and treatment duration, with limited synergistic interaction observed only under specific conditions, while predominantly antagonistic effects were detected overall. Apoptosis induction and increased p53 expression indicate possible involvement of tumor-suppressive pathways, while limited toxicity toward normal fibroblasts highlights a degree of selectivity for malignant cells. These findings support the repurposing of metformin as a potential anticancer agent; however, the addition of caffeine does not consistently enhance its efficacy and may lead to antagonistic interactions depending on cellular context and treatment duration. Further in vivo studies and mechanistic investigations are warranted to confirm clinical relevance and fully elucidate underlying molecular mechanisms.

Supplementary Materials

The following supporting information can be downloaded at the website of this paper posted on Preprints.org, Figure S1: Calibration curve for p53 determination (https://www.abcam.com; Table S1: Standards for calibration curve for p53 (https://www.abcam.com).

Author Contributions

Conceptualization, V.Z. and M.K.; methodology, V.Z, M.B.; software, V.K., E.M; validation, M.D., E.M. and S.M.; formal analysis, V.Z., S.M. and M.D; investigation, V.Z. and V.K; resources, V.Z., M.K. and M.B.; data curation, V.Z., V.K. and M.K.; writing—original draft preparation, V.Z.; writing—review and editing, V.Z., V.K., M.K. and M.B; visualization, V.Z. and M.D; supervision, M.B. and E.M; project administration, V.Z , V.K. and M.D.; funding acquisition, S.M. and E.M. All authors have read and agreed to the published version of the manuscript.

Funding

This research received no external funding.

Institutional Review Board Statement

“Not applicable” for studies not involving humans or animals.

Data Availability Statement

The datasets generated during this study are not publicly available due to privacy restrictions but are available from the corresponding author on reasonable request.

Acknowledgments

During the preparation of this manuscript/study, the author(s) used ChatGPT (OpenAI, GPT-5 mini) for the purposes of designing graphical abstract. The authors have reviewed and edited the output and take full responsibility for the content of this publication.

Conflicts of Interest

Declare conflicts of interest or state “The authors declare no conflicts of interest.” Authors must identify and declare any personal circumstances or interest that may be perceived as inappropriately influencing the representation or interpretation of reported research results. Any role of the funders in the design of the study; in the collection, analyses or interpretation of data; in the writing of the manuscript; or in the decision to publish the results must be declared in this section. If there is no role, please state “The funders had no role in the design of the study; in the collection, analyses, or interpretation of data; in the writing of the manuscript; or in the decision to publish the results”.

References

  1. World Health Organization. World Health Statistics 2024: Monitoring Health for the SDGs; WHO Press: Geneva, Switzerland, 2024; Available online: https://www.who.int/data/gho/publications/world-health-statistics (accessed on 2 September 2024).
  2. Siegel, R.L.; Kratzer, T.B.; Giaquinto, A.N.; Sung, H.; Jemal, A. Cancer statistics, 2025. CA Cancer J. Clin. 2025, 75, 10–45. [Google Scholar] [CrossRef]
  3. Sung, H.; Ferlay, J.; Siegel, R.L.; Laversanne, M.; Soerjomataram, I.; Jemal, A.; Bray, F. Global cancer statistics 2020: GLOBOCAN estimates of incidence and mortality worldwide for 36 cancers in 185 countries. CA Cancer J. Clin. 2021, 71, 209–249. [Google Scholar] [CrossRef] [PubMed]
  4. Institute of Public Health of Serbia. Cancer Incidence and Mortality in Serbia 2023. Available online: https://www.batut.org.rs/download/publikacije/pub2023v1.pdf (accessed on 2 September 2024).
  5. Wagle, N.S.; Nogueira, L.; Devasia, T.P.; et al. Cancer treatment and survivorship statistics, 2025. CA Cancer J. Clin. 2025, 75, 308–340. [Google Scholar] [CrossRef]
  6. Mithoowani, H.; Febbraro, M. Non-small-cell lung cancer in 2022: A review for general practitioners in oncology. Curr. Oncol. 2022, 29, 1828–1839. [Google Scholar] [CrossRef]
  7. Han, X.; Robinson, L.A.; Jensen, R.E.; Smith, T.G.; Yabroff, K.R. Factors associated with health-related quality of life among cancer survivors in the United States. JNCI Cancer Spectr. 2021, 5, pkaa123. [Google Scholar] [CrossRef]
  8. Flory, J.; Lipska, K. Metformin in 2019. JAMA 2019, 321, 1926–1927. [Google Scholar] [CrossRef]
  9. Bailey, C.J. Metformin: Historical overview. Diabetologia 2017, 60, 1566–1576. [Google Scholar] [CrossRef]
  10. Scheen, A.J. Clinical pharmacokinetics of metformin. Clin. Pharmacokinet. 1996, 30, 359–371. [Google Scholar] [CrossRef]
  11. Evans, J.M.M.; Donnelly, L.A.; Emslie-Smith, A.M.; Alessi, D.R.; Morris, A.D. Metformin and reduced risk of cancer in diabetic patients. BMJ 2005, 330, 1304–1305. [Google Scholar] [CrossRef] [PubMed]
  12. Quinn, B.J.; Kitagawa, H.; Memmott, R.M.; Gills, J.J.; Dennis, P.A. Repositioning metformin for cancer prevention and treatment. Trends Endocrinol. Metab. 2013, 24, 469–480. [Google Scholar] [CrossRef] [PubMed]
  13. Vujovic, S.; Perovic, S.; Vlaovic, M.; Scepanovic, A.; Scepanovic, S. From metabolism to longevity: Molecular mechanisms underlying metformin’s anticancer and anti-aging effects. Curr. Issues Mol. Biol. 2026, 48, 286. [Google Scholar] [CrossRef]
  14. Saraei, P.; Asadi, I.; Kakar, M.A.; Moradi-Kor, N. The beneficial effects of metformin on cancer prevention and therapy: A comprehensive review of recent advances. Cancer Manag. Res. 2019, 11, 3295–3313. [Google Scholar] [CrossRef]
  15. Boroughs, L.K.; DeBerardinis, R.J. Metabolic pathways promoting cancer cell survival and growth. Nat. Cell Biol. 2015, 17, 351–359. [Google Scholar] [CrossRef]
  16. Morales, D.R.; Morris, A.D. Metformin in cancer treatment and prevention. Annu. Rev. Med. 2015, 66, 17–29. [Google Scholar] [CrossRef] [PubMed]
  17. Zakikhani, M.; Dowling, R.; Fantus, I.; Sonenberg, N.; Pollak, M. Metformin is an AMPK-dependent growth inhibitor for breast cancer cells. Cancer Res. 2006, 66, 10269–10273. [Google Scholar] [CrossRef]
  18. Dowling, R.J.O.; Zakikhani, M.; Fantus, I.G.; Pollak, M.; Sonenberg, N. Metformin inhibits mTOR signaling in cancer cells. Cancer Res. 2007, 67, 10804–10812. [Google Scholar] [CrossRef] [PubMed]
  19. Weber, A.M.; Ryan, A.J. ATM and ATR as therapeutic targets in cancer. Pharmacology & Therapeutics 2015. [Google Scholar]
  20. Dai, Q.; et al. Caffeine sensitizes cancer cells to anticancer therapy. Cancer Letters 2012. [Google Scholar]
  21. Bode, A.M.; Dong, Z. The enigmatic effects of caffeine in cell cycle and cancer. Cancer Lett. 2007, 247, 26–39. [Google Scholar] [CrossRef]
  22. Fagundes, T.R.; Madeira, T.B.; Melo, G.P.; et al. Caffeine improves the cytotoxic effect of dacarbazine on melanoma cells. Bioorg. Chem. 2022, 120, 105576. [Google Scholar] [CrossRef]
  23. Strober, W. Trypan blue exclusion test of cell viability. CurrProtoc Immunol. 2001, 21(1), A.3B.1–A.3B.2. [Google Scholar]
  24. Shekan, P.; Storeng, R.; Scudiero, D.; Monks, A.; McMahon, J.; Vistica, D.; et al. New colorimetric cytotoxicity assay for anticancer-drug screening. J Natl Cancer Inst. 1990, 82(13), 1107–12. [Google Scholar]
  25. Bogdanović, G.; Raletić-Savić, J.; Marković, N. In vitro assays for antitumor-drug screening on human tumor cell lines: dye exclusion test and colorimetric cytotoxicity assay. Arch Oncol. 1994, 2(4), 181–4. [Google Scholar]
  26. Higuchi, K.; Mitsuhashi, N.; Saitoh, J.; Maebayashi, K.; Sakurai, H.; Akimoto, T.; Niibe, H. Caffeine enhanced radiosensitivity of rat tumor cells with a mutant-type p53 by inducing apoptosis in a p53-independent manner. Cancer Lett. 2000, 152(2), 157–62. [Google Scholar] [CrossRef]
  27. Chou, TC.; Talalay, P. Quantitative analysis of dose–effect relationships: the combined effects of multiple drugs or enzyme inhibitors. Adv Enzyme Regul. 1984, 22, 27–55. [Google Scholar] [CrossRef]
  28. Chou, TC. Drug combination studies and their synergy quantification using the Chou–Talalay method. Cancer Res. 2010, 70(2), 440–446. [Google Scholar] [CrossRef]
  29. Hardie, D.G. AMPK: A key regulator of energy balance in cells and organisms. Nat. Rev. Mol. Cell Biol. 2012, 13, 251–262. [Google Scholar] [CrossRef] [PubMed]
  30. Wheaton, W.W.; Weinberg, S.E.; Hamanaka, R.B. Metformin inhibits mitochondrial complex I of cancer cells. eLife 2014, 3, e02242. [Google Scholar] [CrossRef] [PubMed]
  31. Heckman-Stoddard, B.; DeCensi, A.; Sahasrabuddhe, V.; Ford, L. Repurposing metformin for cancer prevention and treatment. Diabetologia 2017, 60, 1639–1647. [Google Scholar] [CrossRef] [PubMed]
  32. Pernicova, I.; Korbonits, M. Metformin—Mode of action and implications for cancer therapy. Endocr. Rev. 2014, 35, 688–719. [Google Scholar]
  33. Kasznicki, J.; Sliwinska, A.; Drzewoski, J. Metformin in cancer prevention and therapy. Ann. Transl. Med. 2018, 6, 1–11. [Google Scholar]
  34. Rena, G.; Hardie, D.G.; Pearson, E.R. The mechanisms of action of metformin. Diabetologia 2017, 60, 1577–1585. [Google Scholar] [CrossRef]
  35. Zhuang, Y; Chan, DK; Haugrud, AB; Miskimins, WK. Mechanisms by Which Low Glucose Enhances the Cytotoxicity of Metformin to Cancer Cells Both In Vitro and In Vivo. PLOS ONE 2014, 9, e108444. [Google Scholar] [CrossRef] [PubMed]
  36. Vousden, K.H.; Lane, D.P. p53 in health and disease. Nature Reviews Molecular Cell Biology 2007.Nat Rev Mol Cell Biol. 2007, 4, 275–83. [Google Scholar] [CrossRef] [PubMed]
  37. Kalender, A.; Selvaraj, A.; Kim, S.Y.; Gulati, P.; BrûléS; ViolletB; Kalender, A.; et al. Metformin inhibits mTOR signaling. Cell Metabolism 2010, 11(5), 390–401. [Google Scholar] [CrossRef] [PubMed]
  38. Vander Heiden, M.G.; Cantley, L.C.; Thompson, C.B. Understanding the Warburg effect: the metabolic requirements of cell proliferation. Science 2009, 324(5930), 1029–1033. [Google Scholar] [CrossRef]
  39. Marciniak, M.; Torbicki, A.; Korpalski, M.; Pawluczyk, M.; Pawlikowski, K.; Żygłowicz, M.; Augustyn, D.; Gaworek, P.; Trybuła, A. Metformin in Oncology- Its Effect on Cancer Development and Progression. Medical Science 2025, 29, e132ms3665. [Google Scholar] [CrossRef]
Disclaimer/Publisher’s Note: The statements, opinions and data contained in all publications are solely those of the individual author(s) and contributor(s) and not of MDPI and/or the editor(s). MDPI and/or the editor(s) disclaim responsibility for any injury to people or property resulting from any ideas, methods, instructions or products referred to in the content.
Copyright: This open access article is published under a Creative Commons CC BY 4.0 license, which permit the free download, distribution, and reuse, provided that the author and preprint are cited in any reuse.
Prerpints.org logo

Preprints.org is a free preprint server supported by MDPI in Basel, Switzerland.

Subscribe

Disclaimer

Terms of Use

Privacy Policy

Privacy Settings

© 2026 MDPI (Basel, Switzerland) unless otherwise stated