
Submitted:
25 March 2026
Posted:
27 March 2026
You are already at the latest version
Abstract
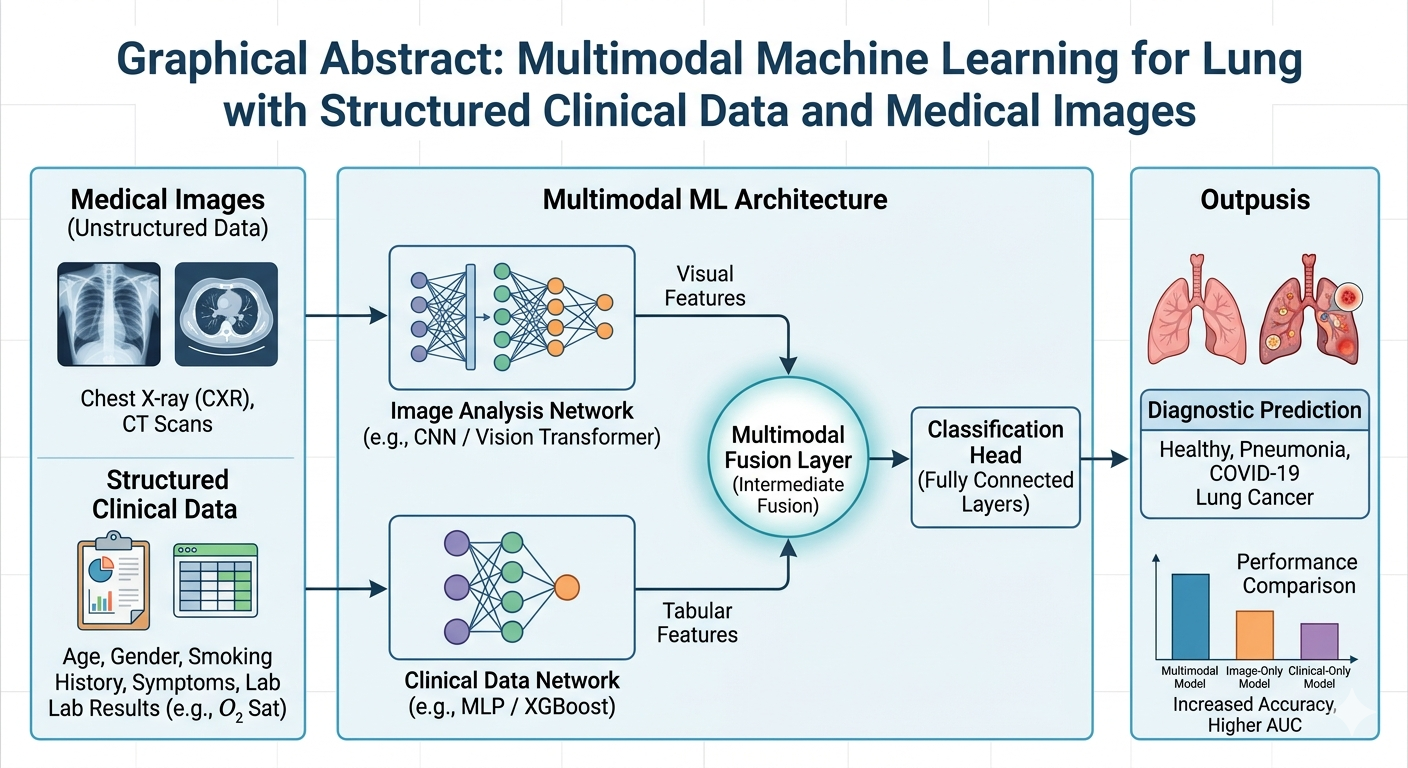
Lung disease is a major global health challenge causing millions of deaths annually. Early diagnosis and treatment of lung disease is crucial for effective treatment, preventing mortality and reducing long-term morbidity. While most existing diagnostic research primarily utilizes unimodal medical image data, this approach often provides limited information. To incorporate additional clinical information in the diagnosis, multimodal strategies are increasingly being explored. Medical image and clinical data are the key medical information utilized by physicians to diagnose lung disease in addition to physical examination. In this work, we propose a comprehensive multimodal machine learning framework for lung disease detection that integrates structured clinical data with medical imaging modalities specifically, chest X-rays and computed tomography scans. The methodology includes robust data preprocessing, feature extraction using VGG16 for images and multiple techniques (mutual information, principal component analysis, and random forest) for clinical data, followed by fusion and classification using both classical machine learning and deep learning models. We introduce and evaluate a newly collected lung disease dataset comprising over 27,635 records combining imaging and clinical data from Ethiopian hospitals. Experiments conducted show that unimodal chest X-Ray image based detection achieves 95.28% accuracy while multimodal chest X-ray and clinical data based detection achieves accuracy 98.88%. Similar results are obtained for computed tomography scan based experiments with 97.62% for unimodal and 98.91% for multimodal detection. This study demonstrated the critical importance of multimodal data fusion in developing more accurate and clinically viable diagnostic system for lung diseases.
Keywords:
lung disease detection
; multimodal learning
; medical imaging
; clinical data
; artificial intelligence
1. Introduction
Lung disease is one of the most prevalent and lethal diseases globally, and it is linked with severe morbidity and mortality [1]. This broad category encompasses infectious diseases (e.g., pneumonia, tuberculosis), chronic conditions (e.g., COPD, asthma), and malignancies (e.g., lung cancer). Early diagnosis of lung disease is crucial for timely medical management, preventing mortality and long-term morbidity [2]. Standard lung disease diagnostic techniques involve clinical assessments, laboratory investigations and, imaging modalities [3]. However, these methods heavily depend on experienced physicians, are prone to human error, and suffer from inter-observer variability [4]. In addition, the similar presentation of different lung diseases on lung image modalities poses a challenge for diagnosis. Furthermore, the increasing number of medical data presents a challenge for timely interpretation [5]. Artificial intelligence (AI) is a potential for automatic and accurate disease detection [6]. Recent advancements in deep learning, particularly Convolutional Neural Networks (CNNs), have yielded promising results in medical image analysis [7].
Multimodal learning, which combines information from various modalities such as imaging and clinical data, improves the predictive power of AI models by integrating complementary information [8]. Clinical data, which includes patient history, symptoms, and laboratory results, provides valuable information about the patient’s health. Medical images such as computed tomography (CT) scans and chest X-rays (CXR) offer a direct visual assessment of lung pathology. When used individually, each data type has limitations: clinical data alone may lack immediate visual confirmation of lung abnormalities, and imaging data without clinical context may lead to incomplete or ambiguous diagnoses. By combining these two modalities, multimodal learning captures a more comprehensive view of the patient’s condition, thus reducing the likelihood of misclassifications and improving overall diagnostic performance.This integrated approach has been shown in previous studies [24,25,26,27] to enhance the predictive power of models in various medical domains, making it particularly suitable for complex disease classification tasks such as detection of lung disease. Despite this, most existing models for lung disease detection are based mainly on imaging data, without incorporating the rich information available in clinical data.
A significant challenge in developing multimodal approaches that use medical image and clinical data is the scarcity of publicly available lung disease datasets that contain both clinical data and medical images. Currently, the most accessible datasets for lung diseases primarily consist of CT-scan or X-ray (CXR) images, lacking associated clinical patient information and laboratory investigations. To address the limitations of unimodal diagnostic approaches and the scarcity of integrated datasets, this study makes the following key contributions:
- 1.
- Multimodal dataset creation: We introduce a novel, ethically collected dataset comprising over 27,635 lung disease cases, including both CXR and CT scan images paired with structured clinical data for seven prevalent lung diseases".
- 2.
- End-to-end multimodal framework: comprehensive multimodal machine learning framework for lung disease detection that integrates structured clinical data with medical imaging modalities specifically, CXR and CT scans
- 3.
- Empirical validation: evaluation of structured clinical data feature extraction methods (mutual information, principal component analysis, and random forest) and most commonly used classifiers.
- 4.
- Clinical relevance: the integration of structured clinical data with medical image increases the relevance of computer assisted diagnosis.
This research attempts to bridge these gaps by collecting lung disease data and developing a machine learning framework that can seamlessly integrate structured clinical and image data to detect lung disease. First, we introduce a novel dataset of CT-scan and CXR lung image and associated clinical data for seven commonly encountered lung diseases (Asthma, COPD, COVID-19, Lung cancer, Pneumonia, Pneumothorax and Tuberculosis), adhering to all ethical guidelines, collected to train and evaluate our proposed models. Then, by investigating different multimodal data fusion techniques, the research strives to enhance diagnostic accuracy as well as usability to offer a more reliable tool in clinical decision-making.
2. Related Work
2.1. Lung Disease Detection Using Machine Learning
Machine learning methods have been widely studied for identification and classification of lung disease from imaging data as well as clinical data. CNNs have demonstrated outstanding performance in image diagnosis, particularly image classification in CXR and CT images. Rajpurkar, P [18] developed CheXNet, a deep neural network trained on the ChestX-ray14 dataset that outperformed expert performance in pneumonia identification. Kang G et al. [19] proposed a multi-view CNN for lung disease categorization in CT images that has a higher detection accuracy than traditional radiological exams. Similarly, Lakhani P and Sundaram B [20] showed that deep CNNs can identify tuberculosis with more than 96% accuracy. These findings highlight the potential of deep learning to supplement established diagnostic approaches in certain situations.
In addition to CNNs, other machine learning algorithms such as support vector machines (SVMs), random forests, and gradient boosting algorithms have been used for classifying lung disease. SVMs have been particularly effective in small and imbalanced datasets as they are able to handle large-dimensional feature spaces [21]. Random forests, owing to their robustness, have been used alongside manually crafted features to classify lung disease using CT scans [22].
2.2. Multimodal Learning for Lung Disease Detection
Unimodal models face various obstacles, including data sparsity, overfitting, and low generalizability. Models trained on specific datasets, such as ChestX-ray14, may not perform well on data from other hospitals or demographics [23]. Multimodal learning is gaining popularity to overcome the above limitations by combining clinical and imaging data for better diagnostic accuracy. Chen C et al. [24] designed a hybrid model that used patient demographic data along with imaging features to improve pneumonia detection.
R. Siddiqi et al. [25] utilized a multimodal deep learning model that combines CXR images with the electronic health records (EHRs) to increase the detection of pneumonia. Their result illustrated that a significant increase in detection accuracy as compared to the unimodal models.
Kumar S, et al. [26] proposed an approach that utilizes attention mechanisms to selectively weight the most important and informative aspects of each modality on medical images and clinical data features. Their approach attempts to mitigate the risk of over reliance on single data.
In addition, transformer-based architectures are also used in multimodal learning. Li J et al, [27] proposed Vision Transformers (ViTs) for medical imaging tasks and BERT-based models for clinical data . With this approach the researchers developed a hybrid model that can simultaneously analyze both image and clinical data to detect lung disease.
3. Materials and Methods
In this research, we propose a multimodal lung disease detection that utilizes structured clinical data and medical images. To thoroughly assess the impact of multimodal data, we investigate various feature extraction techniques from structured clinical data, different fusion strategies and multiple classifiers as shown in Figure 1. This approach is developed to enable us to pinpoint the relevance of incorporating multimodal data and understand how each step influences overall lung disease detection performance. The research follows the following steps that are discussed in the following subsections in detail.
- Data collection: collecting structured clinical data (i.e. lab results, patient symptoms, patient demographics) along with unstructured image data (i.e. CXR, CT) for seven of the most common lung diseases.
- Data preprocessing: cleaning, normalization, and data augmentation to prepare the data to a uniform format and improve model stability.
- Feature extraction: to reduce data complexity for the structured clinical data and medical images.
- Multimodal Data Fusion: This involves merging the imaging and clinical features in an early fusion strategy, where the extracted features for all modalities are combined before feeding them into the classifier.
- Model Development: Optimization and training of the different classical machine learning and deep learning models through training and evaluation.
3.1. Data Collection
3.1.1. Ethical Clearance
The ethical clearances approved by Addis Ababa University College of Health Sciences IRB with Ref No: 147/24 and Yekatit 12 Hospital Medical College IRB with Ref. No. RPO/643/24 were obtained to access anonymized patient records.
3.1.2. Data Selection
To obtain representative data for lung disease detection the most common lung diseases were first selected: Asthma, Chronic obstructive pulmonary disease (COPD), COVID-19, Lung Cancer, Pneumonia, Pneumothorax and Tuberclosis (TB). The patient records associated with these lung diseases with patient consent for research were then selected that have structured clinical data and medical image (CT-scan and/or CXR). The data set for this study consists of 27,635 records combining imaging and clinical data collected adhering to all ethical guidelines. It includes 15,880 CXR images paired with corresponding clinical data from Yekatit 12 Hospital, Addis Ababa, Ethiopia and 11,755 CT scans paired with corresponding clinical data from Tikur Anbessa Hospital, Addis Ababa, Ethiopia. This diverse data set provides a comprehensive foundation for lung disease detection and analysis. Table 1 shows the different lung diseases contained in the data.
The medical image and clinical data utilized by this research are complementary yet mutually exclusive.
3.1.3. Clinical Data
Clinical information holds patient-specific data that allow the contextualization of risk factors and underlying conditions. A total of 65 attributes of clinical data were collected which can be grouped into four categories, namely patient demography, medical history, laboratory results, and diagnosis reports. The attributes in each category are the following.
- Demography of the patient: Gender, Age, Marital Status, Address, Educational Status, Employment, Height, Weight, BMI.
- Medical history: Family History of Lung Disease, Air Pollution Exposure, Biomass Fuel Exposure, Alcohol Consumption, Smoking History, Comorbidity, Allergy, Duration of Illness.
- Laboratory result: Temprature, respiratory rate, SPO2, sputum test, RH factor test, Occult Blood, RBS profile, WBC, Neutrophil, RBC, Hemoglobin, Platelet, Lymphocyte, Monocyte, Eosinophil, Basophil, Hematocrit, MCV, MCH, MCHC, RDW-CV, MPV, PDW.
- Diagnosis reports: Clubbing of the Fingers, Throat Pain, Diarrhea, Sore Throat, Headache, Hoarseness of Voice, Loss of Appetite, Anxiety, Fatigue, Wheezing, Coughing, Shortness of Breath, Hemoptysis, Swallowing Difficulty, Night Sweats, Fever, Chest Pain, Radiologic Findings, Histopathology.
3.1.4. Medical Imaging Data
Medical imaging is a pictorial medical investigation of lung illnesses, enabling enhanced diagnostic accuracy. The medical image collected are the following.
- CXR: Widely used to detect abnormality such as pneumonia, tuberculosis, and lung cancer due to its being low-cost and easily accessible.
- CT Scans: Produces high-density 3D images of lung structure, which enables one to precisely detect nodules, tumors, and other lung illness.
3.2. Data Preprocessing
3.2.1. Clinical data preprocessing
Clinical data often contain missing values, inconsistencies, and redundant features requiring preprocessing steps to make them suitable for classification. Missing values arise due to incomplete reporting and variations in diagnostic tests. To address this, missing numerical features were replaced with a designated value "Unknown," and missing categorical features were assigned a specific category "Unknown." Rows with more than 30% of their main attributes missing were removed to maintain data integrity and avoid excessive imputation bias.
To handle varying scales and distributions of clinical data, normalization and standardization techniques were used. Numerical attributes such as age, blood pressure, and lung function test results were normalized using Min-Max Scaling, bringing their values within [0, 1] range. For features with a normal distribution, Z-score standardization was applied to achieve a mean of 0 and a standard deviation of 1.
Finally, categorical features were converted into numerical formats for compatibility with machine learning algorithms. One-Hot encoding was used for nominal variables which have no inherent order, while label encoding was applied to ordinal features where the category order carries meaning. Together, these preprocessing steps ensured a clean, consistent, and well-structured data set for effective model training and performance.
3.2.2. Medical Image Pre-Processing
Radiological images such as CT and CXR have brightness inconsistencies, contrast variations, and resolution differences which require preprocessing steps to ensure data uniformity and improve model robustness. Image resizing, normalization and one-shot encoding preprocessing steps were followed in this research.
- All images were resized to a standard resolution of 224×224 pixels while maintaining their aspect ratios. This resolution was specifically chosen for compatibility with widely used deep learning architectures such as VGG16 and ResNet, balancing computational efficiency and image quality.
- Normalization was then applied by scaling pixel intensity values to [0, 1] range through division by the maximum pixel value of 255 for 8-bit grayscale images. This step ensured consistent input scales during model training, leading to more stable gradient updates and faster convergence.
- Disease labels for the images were standardized and encoded using one-shot encoding, preparing them for multi-class classification tasks.
3.3. Feature Extraction
3.3.1. Clinical Data Feature Extraction
For clinical data, feature extraction is required to capture the salient information in the data for effective classifier learning. Three well-established techniques: Mutual Information (MI), Principal Component Analysis (PCA), and Random Forest (RF) were investigated. These methods were chosen to handle the diverse and high-dimensional nature of clinical information, including demographic data, medical histories, and laboratory results.
- PCA, a dimensionality reduction technique, transformed the original features into uncorrelated principal components, preserving maximum variance and eliminating redundancy while reducing the risk of overfitting.
- Mutual information was used to measure the dependency between each feature and the target variable, retaining only those features that provided the most informative value for disease classification.
- Random Forest ranked feature importance based on how much each feature decreased impurity across multiple decision trees, ensuring that only the most important features were retained.
By investigating these feature extraction methods for clinical data, the study aimed to maximize model performance and efficiency by selecting the most relevant and informative features from the clinical data set.
3.3.2. Medical Image Feature Extraction
For imaging data, feature extraction was performed using the VGG16 CNN [28], a deep learning model pre-trained on the ImageNet dataset. VGG16’s hierarchical structure and small 3×3 convolution filters make it effective at capturing both low-level features, such as edges and textures, and high-level anatomical structures essential for the detection of lung disease. In this study, instead of using the fully connected layers of the model, the feature maps from the final convolutional layers were extracted and flattened to serve as high-dimensional representations of lung state. This approach allowed the model to automatically detect subtle visual indicators of lung disease, such as nodules and opacities, that might be missed by traditional techniques. These extracted image features, combined with the structured clinical data, laid the foundation for the multimodal data fusion process, enhancing the diagnostic capability of the model.
3.4. Multimodal Data Fusion
For multimodal decision-making data level, feature level and decision level fusion approaches can be used. In the case of lung disease detection, the clinical data and medical image have different formats and therefore a feature-level fusion approach was followed. A horizontal stacking approach was adopted for feature fusion, aligning each patient’s clinical data feature with their corresponding medical image feature to create a unified feature set. Before fusion, both clinical and imaging features were normalized to ensure consistent scaling and prevent numerical bias. The aligned feature vectors were then concatenated into a single representation, capturing both the structured clinical attributes and the deep-learning-based imaging features. This fusion strategy allows the classification model to take advantage of the complementary strengths of both data types, leading to enhanced generalization and improved performance in disease prediction.
3.5. Classification
The choice of classification model plays a crucial role in determining the system’s accuracy and generalization. Given the multimodal nature of the data — structured clinical data and unstructured imaging data — both classical machine learning and deep learning models were explored. The following classifiers were investigated for the multimodal approach and unimodal approach.
- Unimodal medical image based classification: For the unimodal image based classification, the study investigated advanced CNNs to extract high-level hierarchical features from medical imaging data. ResNet50, a widely used deep CNN, addresses the vanishing gradient problem through residual learning, enabling the network to train effectively even with a large number of layers. EfficientNetB0 applies compound scaling to balance depth, width, and resolution, optimizing both performance and computational efficiency. Additionally, a fully connected dense layer CNN was implemented, serving as a more lightweight and adaptable approach for image classification. These deep learning models excel at capturing spatial and structural patterns in medical images, making them particularly effective for identifying lung disease from CXR and CT scans.
- Multimodal feature based classification: For classical machine learning models, this study investigated a diverse set of algorithms known for their effectiveness in handling structured data and their interpretability in medical diagnosis. Gradient Boosting, Random Forest, and XGBoost are ensemble methods that combine multiple decision trees to improve predictive accuracy and reduce overfitting, making them highly effective for tabular clinical data. LightGBM, a gradient boosting framework, is optimized for efficiency and scalability, especially with large datasets. CatBoost stands out for its ability to handle categorical features with minimal preprocessing. The study also utilized Multi-Layer Perceptron (MLP), a type of artificial neural network suited for capturing complex feature relationships. Support Vector Machine (SVM) was chosen for its strong performance in smaller datasets and its ability to manage high-dimensional feature spaces. Logistic Regression (LR), a simple yet powerful model, was used for binary and multiclass classification tasks, while K-Nearest Neighbors (KNN) served as a nonparametric approach relying on proximity-based decision-making. Together, these models provided a comprehensive approach to analyzing clinical data, balancing complexity and interpretability.
3.6. Evaluation Metrics
To evaluating the performance of the model this study used standard evaluation metrics of accuracy, recall, precision and F1-Score.
4. Results and Discussion
To have a clear view of the performance of multimodal lung disease detection as compared to unimodal approaches the following experiments were conducted.
4.1. Experiment setup
-
Hardware
- -
- Intel Xeon CPU E5-2698 v4
- -
- RAM: 512GB
- -
- GPU: 8xTesla V100-SXM2-16GB
-
Software
- -
- Ubuntu Server 20.04 LTS
- -
- Tensorflow 2.18.0
- -
- Keras 3.8.0
- -
- Python 3.8.10
-
Data split
- -
- Training data: 80%
- -
- Validation data: 10%
- -
- Testing data: 10%
4.2. Experiments Conducted
The following experiments were conducted to thoroughly investigate the proposed multimodal clinical data and image-based lung disease detection.
-
CT data
- -
- Unimodal lung disease detection using CT images
- -
-
Multimodal
- *
- PCA based clinical data feature extraction with VGG16 CT image features
- *
- Mutual information based clinical data feature extraction with VGG16 CT image features
- *
- Random forest based clinical data feature extraction with VGG16 CT image features
-
CXR data
- -
- Unimodal lung disease detection using CXR medical images
- -
-
Multimodal
- *
- PCA based clinical data feature extraction with VGG16 CXR image features
- *
- Mutual information based clinical data feature extraction with VGG16 CXR image features
- *
- Random forest based clinical data feature extraction with VGG16 CXR image features
4.3. Model Training
The selection of hyperparameters for these classifiers was a systematic process aimed at optimizing performance and preventing overfitting, guided primarily by cross-validation techniques. For tree-based ensembles like Random Forest, Gradient Boosting, XGBoost, LightGBM, and CatBoost, a combination of RandomizedSearchCV and GridSearchCV was used to explore a wide parameter space. Key parameters tuned included the number of estimators (N_Est), the learning rate, for boosting models, maximum tree depth (max_depth), and subsampling ratios for features and data points. For Support Vector Machines (SVM), a grid search was performed to find the optimal kernel, the regularization parameter, , and the kernel coefficient, which collectively define the decision boundary’s flexibility. Simpler models like Logistic Regression were tuned for their regularization type, while K-Nearest Neighbors (KNN) was optimized by testing a range of values for the number of neighbors to find the best bias-variance tradeoff. Finally, the Multi-Layer Perceptron (MLP) required tuning its architecture, such as the number of hidden layers and neurons, alongside hyperparameters like the activation function, optimizer (e.g., Adam), learning rate, and regularization techniques like dropout, often demanding more iterative experimentation due to its larger search space. Table 2 shows the different parameters used in this research.
4.4. CT Scan Dataset
4.4.1. Unimodal CT scan image based lung disease detection
In our evaluation of image-only data from CT scans, we assessed the performance of three neural network architectures: ResNet50, EfficientNetB0, and a Fully Connected Neural Network. The results on Table 3 show that the Fully Connected model achieved the highest accuracy at 97.62%, with corresponding precision, recall, and F1-scores of 97.62%, 97.61%, and 97.61%, respectively.
4.4.2. Multimodal CT and Clinical Data Based Lung Disease Detection
The multimodal CT and clinical fused data results are shown in Table 4, Table 5 and Table 6 demonstrate the improvements in diagnostic performance of multimodal approach. When mutual information (MI) is used as the feature extraction method, classifiers such as XGBoost and LightGBM achieved accuracies of approximately 98.90%–98.91%, with precision, recall, and F1-scores also nearing 98.90%. The effectiveness of MI for feature selection in high-dimensional data has been well-documented in the literature by Peng et al. [34], supporting our findings that MI-based fusion can yield exceptional diagnostic accuracy and efficiency.
When PCA is employed for feature extraction on the clinical data, the overall performance is slightly reduced compared to MI-based methods as shown in Table 5. Accuracies with PCA range from around 89.46% for XGBoost to 97.40% for LightGBM and Fully Connected models. Despite PCA’s advantage in reducing dimensionality and computational complexity, the process of transforming the original features into principal components may lead to a loss of critical discriminative information.
In contrast, the use of Random Forest (RF) for feature extraction of clinical data yields consistently high performance as seen in Table 6. Models such as Gradient Boosting, XGBoost, and LightGBM achieve accuracies approaching 98.88%, with all key performance metrics (precision, recall, and F1-score). The RF-based method appears to preserve the non-linear relationships inherent in the multimodal data, facilitating a more robust feature set for classification.
4.5. CXR Dataset Result
4.5.1. Unimodal CXR Image Based Lung Disease Detection
The evaluation result of using CXR image for lung disease detection using ResNet50, EfficientNetB0 and fully connected neural network is shown in Table 7. It is noted that the result is much lower than CT image based classification seen in Table 3. This is attributed to the higher quality of CT images as compared to CXR. The fully connected layer performed better with accuracy of 95.28%.
4.5.2. Multimodal CXR and clinical data based lung disease detection
The fused data results Table 9, Table 10 and Table 8 obtained by integrating clinical data with CXR images reveal a noticeable improvements in diagnostic performance.

Table 8.
Fused data using MI as feature extraction.
| Model | Accuracy | Precision | Recall | F1-score |
|---|---|---|---|---|
| GradientBoosting | 98.79% | 98.79% | 98.79% | 98.79% |
| RandomForest | 94.87% | 94.88% | 94.89% | 94.88% |
| XGBoost | 97.79% | 97.79% | 97.79% | 97.79% |
| LightGBM | 98.79% | 98.79% | 98.79% | 98.79% |
| CatBoost | 97.79% | 97.79% | 97.79% | 97.79% |
| MLP | 88.00% | 89.56% | 88.07% | 88.81% |
| SVM | 89.24% | 91.93% | 89.34% | 90.62% |
| LogisticRegression | 91.35% | 92.35% | 91.39% | 91.96% |
| KNN | 85.43% | 84.06% | 85.52% | 84.78% |
| Fully_Connected | 98.66% | 97.27% | 98.79% | 98.02% |
Table 9.
Fused Data Results Using PCA as Feature Extraction.
| PCA | Accuracy | Precision | Recall | F1-score |
|---|---|---|---|---|
| Gradient Boosting | 96.62% | 96.63% | 96.62% | 96.62% |
| Random Forest | 97.73% | 97.68% | 97.83% | 97.75% |
| XGBoost | 96.71% | 96.71% | 96.70% | 96.70% |
| LightGBM | 97.05% | 97.51% | 97.10% | 97.30% |
| CatBoost | 96.13% | 96.14% | 96.12% | 96.13% |
| MLP | 94.83% | 94.84% | 94.82% | 94.83% |
| SVM | 90.57% | 91.72% | 90.55% | 91.13% |
| Logistic Regression | 95.91% | 95.98% | 95.90% | 95.94% |
| KNN | 85.87% | 85.83% | 85.96% | 85.89% |
| Fully Connected | 96.85% | 96.86% | 96.84% | 96.85% |
Table 10.
Fused Data Results Using Random Forest (RF) as Feature Extraction.
| RF | Accuracy | Precision | Recall | F1-score |
|---|---|---|---|---|
| Gradient Boosting | 98.88% | 98.89% | 98.88% | 98.88% |
| Random Forest | 96.46% | 96.67% | 96.55% | 96.61% |
| XGBoost | 98.78% | 98.78% | 98.78% | 98.78% |
| LightGBM | 99.84% | 99.85% | 99.83% | 99.84% |
| CatBoost | 98.76% | 98.77% | 98.75% | 98.76% |
| MLP | 88.87% | 90.28% | 88.94% | 89.61% |
| SVM | 91.57% | 91.58% | 91.55% | 91.56% |
| Logistic Regression | 96.13% | 96.14% | 96.12% | 96.13% |
| KNN | 86.99% | 86.84% | 87.08% | 86.96% |
| Fully Connected | 95.28% | 95.31% | 95.38% | 94.34% |
Mutual information based clinical data feature extraction on the fused CXR dataset yields outstanding classification performance as seen in Table 8. Classifiers such as Gradient Boosting, XGBoost, and LightGBM all achieve accuracies of approximately 98.79%.
When applying principal component analysis (PCA) for feature extraction on the fused CXR dataset, the performance of the classifiers shows moderate to high improvement in accuracy as shown in Table 9. For instance, Gradient Boosting achieved an accuracy of 96.62%, though it required a lengthy training time of approximately 6986 seconds and a test inference time of 0.029 seconds. LightGBM, in contrast, attained an accuracy of 97.05% with a significantly lower training time of 61.09 seconds and an impressively fast inference time of 0.0072. This is a significantly higher accuracy than the unimodal CXR image based lung disease detection, 95.28%.
The use of Random Forest (RF) for feature extraction on the fused CXR data yields significant improvement in lung disease detection as shown in Table 10. Gradient Boosting and XGBoost both achieve accuracies around 98.88%, with LightGBM reaching 98.84% accuracy.
These significant improvement in lung disease detection (98.91% for multimodal CT and 98.88% multimodal CXR) by using multimodal data as compared to the (97.62% for CT image and 95.28% for CXR image) of unimodal data demonstrates the research hypothesis of using multimodal data for lung disease detection.
5. Conclusions and Future Work
Our research demonstrates that integrating clinical data with medical image significantly enhances lung disease detection accuracy. Multimodal fusion, particularly with mutual information and random forest-based feature extraction, consistently outperforms unimodal approaches. While both CT and CXR models benefit, the CXR images are seen to benefit more from multimodal approach as a higher improvement in lung disease detection was observed from 97.62% to 98.88%. Optimized feature extraction and tailored model architectures further improve diagnostic efficiency, reinforcing the value of multimodal systems in clinical decision-making.
Future research will explore advanced deep learning techniques for improved feature extraction and model interpretability. Expanding datasets from diverse medical institutions will enhance model generalization. Additionally, real-time deployment and integration into clinical workflows will be investigated to assess practical feasibility and impact on diagnostic efficiency.
Author Contributions
Conceptualization, M.A.-H., B.D.-D., H.Y.A.; methodology, M.A.-H., B.D.-D. and , H.Y.A.; software,M.A.-H., B.D.-D.; validation, H.Y.-A.; formal analysis, M.A.-H., B.D.-D. and , H.Y.A.; investigation, M.A.-H., B.D.-D. and , H.Y.A.; data curation, M.A.-H.; writing—original draft preparation, M.A.-H.; writing—review and editing, M.A.-H., B.D.-D. and , H.Y.A.; visualization, M.A.-H.; supervision, M.A.-H., B.D.-D. and , H.Y.A.; project administration, B.D.-D.; funding acquisition, B.D.-D. All authors have read and agreed to the published version of the manuscript.
Funding
This research received no external funding.
Institutional Review Board Statement
Ethical approval for this study was obtained from Tikur Anbesa Specialized Hospital and Yekatit 12 Hospital (Approval No. 423). The collection and use of clinical and medical imaging data were conducted in accordance with ethical standards. All patient identifiers were removed, and the dataset was fully anonymized to ensure confidentiality and privacy. Access to the data was restricted to authorized personnel and handled within secure hospital environments, with additional encryption applied to protect sensitive information.
Informed Consent Statement
Informed consent was obtained in accordance with Institutional Review Board requirements prior to the study procedures. All data were fully anonymized, and no personally identifiable information was included in this report.
Data Availability Statement
The data presented in this study are available on Kaggle at https://www.kaggle.com/datasets/masreshaasegide/Multimodal_lung_disease_dataset. The dataset comprises multimodal clinical and imaging data and has been fully anonymized to remove any personally identifiable information.Ethical approval was granted by the Institutional Review Board (IRB), which permits data sharing for research purposes under controlled access. The dataset is available upon reasonable request and must be used in accordance with institutional guidelines and with proper citation of this work.
Acknowledgments
During the preparation of this manuscript, ChatGPT (developed by OpenAI) was used solely for language editing, grammar correction, and stylistic improvements. The scientific content, interpretations, and conclusions presented in this work are entirely the responsibility of the authors.The authors would like to thank Bisrat and Dr. Hanan for their valuable technical support and contributions to this work.
Conflicts of Interest
The author declares no conflicts of interest.
Abbreviations
The following abbreviations are used in this manuscript:
| AI | Artificial Intelligence |
| CNN | Convolutional Neural Networks |
| COPD | Chronic Obstructive Pulmonary Disease |
| CPU | Central Processing Unit |
| CT | Computed Tomography |
| CXR | Chest X-Ray |
| GPU | Graphics Processing Unit |
| EHR | Electronic Health Records |
| KNN | K-Nearest Neighbors |
| LTS | Long Term Support |
| MI | Mutual Information |
| MLP | Multilayer Perceptron |
| MRI | Magnetic Resonance Imaging |
| NSCLC | Non-Small Cell Lung Cancer |
| PCA | Principal Component Analysis |
| PII | Personally Identifiable Information |
| RAM | Random Access Memory |
| RF | Random Forest |
| SCLC | Small Cell Lung Cancer |
| SVM | Support Vector Machine |
| ViT | Vision Transformers |
References
- World Health Organization. Leading causes of death. 2021. Available online: https://www.who.int/data/gho/data/themes/mortality-and-global-health-estimates/ghe-leading-causes-of-death (accessed on 2 August 2024).
- Agustí, A.; Vogelmeier, C.; Faner, R. COPD 2020: Changes and challenges. American Journal of Physiology-Lung Cellular and Molecular Physiology 2020, 319, L881–L888. [CrossRef]
- Mansoor, A.; Bagci, U.; Foster, B.; Xu, Z.; Mousa, A.; El-Baz, A.; Gurcan, M.; Molinari, F.; Udupa, J.K. Segmentation and image analysis of abnormal lungs at CT: Current approaches, challenges, and future trends. Radiographics 2015, 35, 1056–1076. [CrossRef]
- Litjens, G.; Kooi, T.; Bejnordi, B.E.; Setio, A.A.A.; Ciompi, F.; Ghafoorian, M.; van der Laak, J.A.W.M.; van Ginneken, B.; Sánchez, C.I. A survey on deep learning in medical image analysis. Medical Image Analysis 2017, 42, 60–88. [CrossRef]
- Esteva, A.; Robicquet, A.; Ramsundar, B.; Kuleshov, V.; DePristo, M.; Chou, K.; Cui, C.; Corrado, G.; Thrun, S.; Dean, J. A guide to deep learning in healthcare. Nature Medicine 2019, 25, 24–29. [CrossRef]
- Lundervold, A.S.; Lundervold, A. An overview of deep learning in medical imaging focusing on MRI. Zeitschrift für Medizinische Physik 2019, 29, 102–127. [CrossRef]
- Ronneberger, O.; Fischer, P.; Brox, T. U-Net: Convolutional Networks for Biomedical Image Segmentation. In Proceedings of MICCAI 2015; Springer: Cham, Switzerland, 2015; pp. 234–241.
- Baltrušaitis, T.; Ahuja, C.; Morency, L.-P. Multimodal Machine Learning: A Survey and Taxonomy. IEEE TPAMI 2019, 41, 423–443. [CrossRef]
- Musher, D.M.; Thorner, A.R. Community-Acquired Pneumonia. New England Journal of Medicine 2014, 371, 1619–1628. [CrossRef]
- Mandell, L.A.; Wunderink, R.G.; et al. IDSA/ATS guidelines for community-acquired pneumonia. Clinical Infectious Diseases 2007. [CrossRef]
- World Health Organization. Tuberculosis. 2024. Available online: https://www.who.int/news-room/fact-sheets/detail/tuberculosis (accessed on 2 August 2024).
- Pai, M.; Behr, M.A.; Dowdy, D.; et al. Tuberculosis. Nature Reviews Disease Primers 2016, 2, 16076. [CrossRef]
- Vogelmeier, C.F.; Criner, G.J.; Martinez, F.J.; et al. Global strategy for COPD. American Journal of Respiratory and Critical Care Medicine 2017, 195, 557–582. [CrossRef]
- Siegel, R.L.; Miller, K.D.; Fuchs, H.E.; Jemal, A. Cancer statistics, 2022. CA Cancer J Clin 2022, 72, 7–33. [CrossRef]
- Light, R.W. Pleural Diseases; Wolters Kluwer Health: Philadelphia, PA, USA, 2013.
- Wiersinga, W.J.; Rhodes, A.; Cheng, A.C.; et al. COVID-19: A review. JAMA 2020, 324, 782–793. [CrossRef]
- Global Initiative for Asthma. Global Initiative for Asthma. Available online: https://ginasthma.org/ (accessed on 2 August 2024).
- Rajpurkar, P.; Irvin, J.; Zhu, K.; et al. CheXNet. arXiv 2017. https://arxiv.org/abs/1711.05225.
- Kang, G.; Liu, K.; Hou, B.; Zhang, N. 3D multi-view CNNs for lung nodules. PLoS ONE 2017, 12, e0188290. [CrossRef]
- Lakhani, P.; Sundaram, B. Pneumonia detection using CNN. Radiology 2017, 284, 574–582. [CrossRef]
- Kumar, D.; Wong, A.; Clausi, D. Lung Nodule Classification Using Deep Features in CT Images. In Proceedings of the 12th Conference on Computer and Robot Vision (CRV), 2015; pp. 133–138. [CrossRef]
- Aerts, H.J.W.L.; Velazquez, E.R.; Leijenaar, R.T.H.; et al. Decoding tumour phenotype by noninvasive imaging using a quantitative radiomics approach. Nature Communications 2014, 5, 4006. [CrossRef]
- Zech, J.R.; Badgeley, M.A.; Liu, M.; et al. Variable generalization performance of a deep learning model to detect pneumonia in chest radiographs. PLoS Medicine 2018, 15, e1002683. [CrossRef]
- Chen, C.; Qin, C.; Qiu, H.; et al. Deep learning for cardiac image segmentation: A review. Frontiers in Cardiovascular Medicine 2020, 7, 25.
- Siddiqi, R.; Javaid, S. Deep Learning for Pneumonia Detection in Chest X-ray Images: A Comprehensive Survey. Journal of Imaging 2024, 10, 176. [CrossRef]
- Kumar, S.; Rani, S.; Sharma, S.; Min, H. Multimodality Fusion Aspects of Medical Diagnosis: A Comprehensive Review. Bioengineering 2024, 11, 1233. [CrossRef]
- Li, J.; Chen, J.; Tang, Y.; Wang, C.; Landman, B.A.; Zhou, S.K. Transforming medical imaging with Transformers? Medical Image Analysis 2023, 85, 102762. [CrossRef]
- Jiang, Z.-P.; Liu, Y.-Y.; Shao, Z.-E.; Huang, K.-W. An improved VGG16 model for pneumonia image classification. Applied Sciences 2021, 11, 11185. [CrossRef]
- Shrivastava, S.; Rathore, S.; Gedam, R. Deep feature extraction and classification using CNN architectures. In Proceedings of ICRIEMSD 2024; Atlantis Press, 2024; pp. 80–94. [CrossRef]
- Kode, H.; Barkana, B.D. Deep learning-based feature extraction in breast histopathology images. Cancers 2023, 15, 3075. [CrossRef]
- Rafidison, M.A.; Rakotomalala, A.N.; et al. Image classification based on lightweight CNN. Computational Intelligence and Neuroscience 2023, 7371907.
- Mahbod, A.; Saeidi, N.; Hatamikia, S.; Woitek, R. Evaluating pre-trained CNNs as feature extractors. arXiv 2024.
- Tajbakhsh, N.; Shin, J.Y.; Gurudu, S.R.; et al. CNNs for medical image analysis. IEEE Transactions on Medical Imaging 2016, 35, 1299–1312. [CrossRef]
- Peng, H.; Long, F.; Ding, C. Feature selection using mutual information. IEEE TPAMI 2005, 27, 1226–1238. [CrossRef]
- Jolliffe, I.T. Principal Component Analysis; Springer: New York, NY, USA, 2002.
- Breiman, L. Random forests. Machine Learning 2001, 45, 5–32. [CrossRef]
- Zou, Q.; Qu, K.; Luo, Y.; et al. Predicting diabetes mellitus using ML techniques. Frontiers in Genetics 2018, 9, 515. [CrossRef]
- Bustamante, M.; Gupta, V.; et al. Multi-atlas segmentation of cardiac MRI. Medical Image Analysis 2018, 49, 128–140. [CrossRef]
- Jolliffe, I.T. Principal Component Analysis for Special Types of Data; Springer, 2006.
- Ma, Y.; Ren, H.; Li, C.; et al. Clinical and imaging data fusion for CTA. Journal of X-ray Science and Technology 2024, 32, 953–971. [CrossRef]
- Liu, Z.; Zhang, J.; Hou, Y.; et al. Machine learning for multimodal EHR. In Communications in Computer and Information Science; Springer, 2023; pp. 135–155. [CrossRef]
- Cui, C.; Liu, Y.; Liu, H.; et al. Deep multimodal fusion review. Progress in Biomedical Engineering 2023, 5, 033001. [CrossRef]
- He, K.; Zhang, X.; Ren, S.; Sun, J. Deep residual learning. In Proceedings of CVPR 2016; IEEE, 2016; pp. 770–778. [CrossRef]
- Shen, D.; Wu, G.; Suk, H.-I. Deep learning in medical image analysis. Annual Review of Biomedical Engineering 2017, 19, 221–248.
- Wang, C.; Wang, Y.; Xu, C.; et al. Deep learning for respiratory disease diagnosis. NPJ Digital Medicine 2022, 5, 202. [CrossRef]
- Borakati, A.; Perera, A.; Johnson, J.; Sood, T. X-ray vs CT in COVID-19 diagnosis. BMJ Open 2020, 10, e042946. [CrossRef]
Figure 1.
Overview of the proposed methodology.
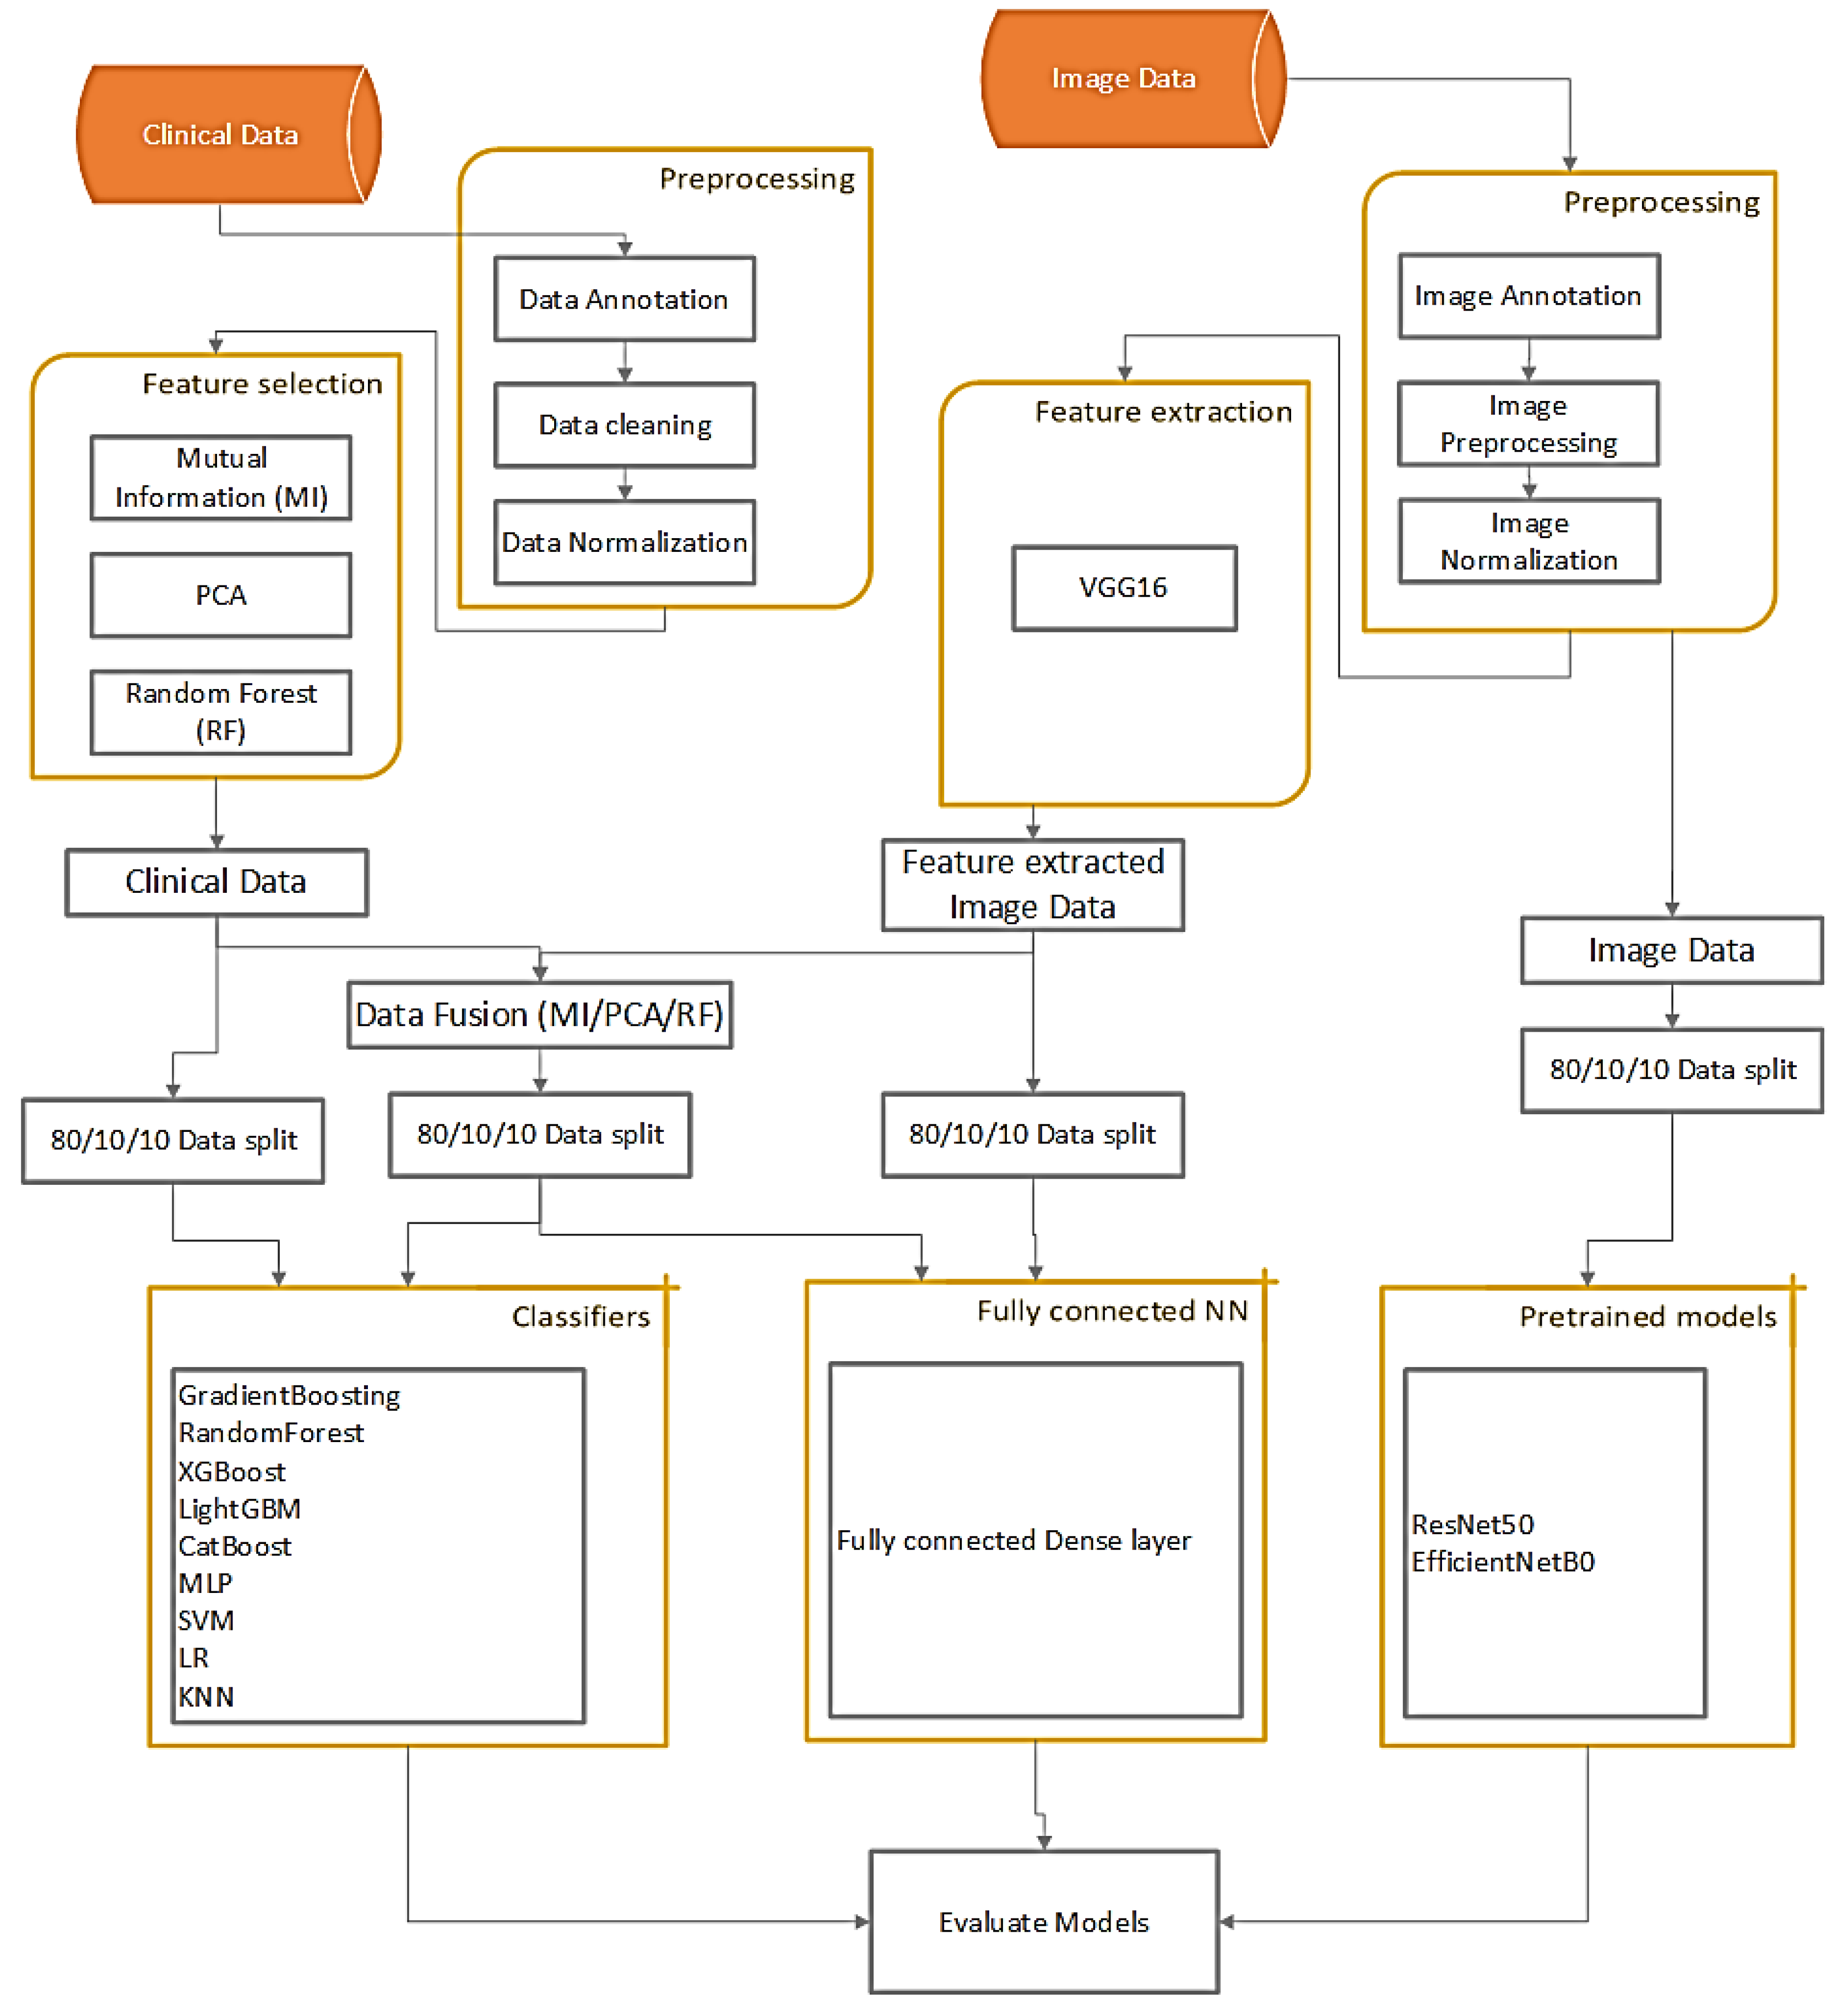
Table 1.
Distribution of CT and CXR images by lung condition with modality proportions.
| Condition | CT | CXR | Total | CT (%) | CXR (%) |
|---|---|---|---|---|---|
| Asthma | 1181 | 2290 | 3471 | 34.03 | 65.97 |
| COPD | 1126 | 2133 | 3259 | 34.55 | 65.45 |
| COVID-19 | 2777 | 2013 | 4790 | 57.97 | 42.03 |
| Lung Cancer | 1362 | 2108 | 3470 | 39.25 | 60.75 |
| Pneumonia | 1816 | 2767 | 4583 | 39.63 | 60.37 |
| Pneumothorax | 2039 | 2735 | 4774 | 42.71 | 57.29 |
| TB | 1128 | 1277 | 2405 | 46.90 | 53.10 |
| Normal | 326 | 557 | 883 | 36.92 | 63.08 |
| Total | 11755 | 15880 | 27635 | 42.54 | 57.46 |
Table 2.
Hyperparameters of the machine learning models used in this study.
| Model | n_estimators / iterations | Learning rate () | Depth / max_iter | Other parameters |
|---|---|---|---|---|
| Gradient Boosting | 100 | 0.1 | 3 | random_state = 42 |
| Random Forest | 100 | - | - | random_state = 42 |
| XGBoost | 100 | 0.1 | 3 | random_state = 42 |
| LightGBM | 100 | 0.1 | 3 | random_state = 42 |
| CatBoost | 100 | 0.1 | 3 | random_state = 42 |
| MLP | 100 | - | 500 | random_state = 42 |
| SVM | - | - | - | kernel = ’rbf’, C = 1, = ’scale’, probability = True |
| Logistic Regression | - | - | 500 | random_state = 42 |
| KNN | 5 | - | - | - |
Table 3.
CT Scan Results (Unimodal).
| Model | Accuracy | Recall | Precision | F1-score |
|---|---|---|---|---|
| RESNET50 | 93.99% | 94.36% | 93.90% | 93.63% |
| EfficientNetB0 | 91.48% | 91.02% | 94.38% | 92.19% |
| Fully connected NN | 97.62% | 97.62% | 97.61% | 97.61% |
Table 4.
Fused data result using MI as feature extraction.
| MI | Accuracy | Precision | Recall | F1-score |
|---|---|---|---|---|
| GradientBoosting | 98.87% | 98.87% | 98.86% | 98.86% |
| RandomForest | 98.52% | 98.52% | 98.51% | 98.51% |
| XGBoost | 98.90% | 98.90% | 98.89% | 98.89% |
| LightGBM | 98.91% | 99.91% | 98.90% | 98.90% |
| CatBoost | 98.52% | 98.52% | 98.51% | 98.51% |
| MLP | 97.52% | 97.52% | 97.51% | 97.51% |
| SVM | 96.13% | 96.13% | 96.13% | 96.13% |
| LogisticRegression | 97.72% | 97.72% | 97.71% | 97.71% |
| KNN | 96.89% | 97.29% | 96.81% | 97.05% |
| Fully_Connected | 97.23% | 97.23% | 97.21% | 97.22% |
Table 5.
Fused Data Results Using PCA as Feature Extraction.
| PCA | Accuracy | Precision | Recall | F1-score |
|---|---|---|---|---|
| GradientBoosting | 97.40% | 97.40% | 97.39% | 97.39% |
| RandomForest | 97.01% | 97.04% | 97.01% | 97.02% |
| XGBoost | 97.21% | 97.21% | 97.20% | 97.20% |
| LightGBM | 97.40% | 97.40% | 97.39% | 97.39% |
| CatBoost | 95.48% | 95.48% | 95.47% | 95.47% |
| MLP | 97.32% | 97.32% | 97.31% | 97.31% |
| SVM | 94.71% | 94.71% | 94.71% | 94.71% |
| LogisticRegression | 97.40% | 97.40% | 97.39% | 97.39% |
| KNN | 96.63% | 96.59% | 96.55% | 96.57% |
| Fully_Connected | 97.40% | 97.40% | 97.39% | 97.39% |
Table 6.
Fused Data Results Using Random Forest (RF) as Feature Extraction.
| RF | Accuracy | Precision | Recall | F1-score |
|---|---|---|---|---|
| GradientBoosting | 98.88% | 98.88% | 98.87% | 98.87% |
| RandomForest | 98.50% | 98.53% | 98.50% | 98.51% |
| XGBoost | 98.88% | 98.88% | 98.87% | 98.87% |
| LightGBM | 98.77% | 98.77% | 98.76% | 98.76% |
| CatBoost | 98.50% | 98.50% | 98.49% | 98.49% |
| MLP | 98.50% | 98.50% | 98.49% | 98.49% |
| SVM | 98.11% | 98.11% | 98.10% | 98.10% |
| LogisticRegression | 98.50% | 98.50% | 98.49% | 98.49% |
| KNN | 94.67% | 95.07% | 94.59% | 94.83% |
| Fully_Connected | 97.23% | 97.24% | 97.31% | 97.27% |
Table 7.
CXR Image data using Deep Learning methods.
| Model | Accuracy | Precision | Recall | F1-score |
|---|---|---|---|---|
| RESNET50 | 91.99% | 93.36% | 93.90% | 93.63% |
| EFFICIENTNETB0 | 90.48% | 91.02% | 93.38% | 92.19% |
| FULLY_CONNECTED | 95.28% | 95.44% | 96.40% | 95.92% |
Disclaimer/Publisher’s Note: The statements, opinions and data contained in all publications are solely those of the individual author(s) and contributor(s) and not of MDPI and/or the editor(s). MDPI and/or the editor(s) disclaim responsibility for any injury to people or property resulting from any ideas, methods, instructions or products referred to in the content. |
© 2026 by the authors. Licensee MDPI, Basel, Switzerland. This article is an open access article distributed under the terms and conditions of the Creative Commons Attribution (CC BY) license (http://creativecommons.org/licenses/by/4.0/).
Copyright: This open access article is published under a Creative Commons CC BY 4.0 license, which permit the free download, distribution, and reuse, provided that the author and preprint are cited in any reuse.