

Submitted:
23 March 2026
Posted:
24 March 2026
You are already at the latest version
Abstract
The land territory of Pakistan extends from the coastal area towards the Karakoram, rising vertically by more than 8,600 metres within a distance of 1,600 kilometres. The net primary productivity (NPP) has been affected by climate change, but the regional differentiation of climatic impacts on vegetation productivity and the trends of these impacts over the last two decades remain unclear. Using the ERA5-Land climate dataset and the MODIS NPP dataset via partial regression and moving correlation analyses, we identified the main climatic driver of the NPP and assessed the potential climatic forces faced by local vegetation in the future. Our results were as follows: (1) The NPP showed an overall increasing tendency across Pakistan from 2001 to 2022. (2) The areas where the changes in NPP were driven mainly by temperature and NPP benefitted from the temperature change were located in the northern mountainous regions approximately north of 35°N and east of 72°E, and the northern Upper Indus Plain. With temperatures changing over time, the increase in NPP intensified in the northern mountainous regions above approximately 3,500 m a.s.l., whereas the increase in NPP diminished below this zone and in the northern Upper Indus Plain. (3) The areas where the changes in NPP were driven mainly by precipitation and NPP benefitted from the precipitation change were located in the Gandhara Plain, the northern Potwar Plateau and in the middle to southern parts of Pakistan south of approximately 32°N. With precipitation changing over time, the increase in NPP intensified in the region between approximately 26°N and 32°N, whereas the increase in NPP diminished in the Gandhara Plain, the northern Potwar Plateau and south of approximately 26°N. Our findings indicated spatial differentiation in the responses of NPP to climate change. If climate change continues at its current pace, vegetation in the northern mountainous regions below 3,500 m a.s.l., the Gandhara Plain, the northern Potwar Plateau, the northern Upper Indus Plain and regions south of approximately 26°N may undergo risks of degradation.
Keywords:
net primary productivity
; long term change
; climate driver
; special differentiation
; Pakistan
1. Introduction
Global terrestrial vegetation has exhibited a pronounced greening tendency in a rapidly changing climate, characterized by an overall increase in net primary productivity (NPP) [1]. However, this tendency displays strong spatial heterogeneity, with some regions experiencing declines in vegetation productivity [2]. Consequently, identifying the regional disparities in the responses of vegetation to climate change requires further in-depth investigation. Pakistan stands out as one of the few regions globally that possesses an enormous elevational gradient within a relatively compact geographic area [3]. From the southern coastal zone to K2 (Mount Godwin-Austen), the world’s second-highest peak on the China–Pakistan border, the elevation increases sharply from sea level to 8,611 m. This extensive vertical gradient causes the development of distinct climatic zones [4,5,6], serving as an ideal “natural laboratory” for investigating the effects of climate change on vegetation. Elucidating the spatial heterogeneity of the relationship between climate change and vegetation productivity is pivotal for formulating targeted strategies for vegetation conservation and sustainable management [7,8].
Previous studies have explored the relationships between climate and vegetation in Pakistan, yet the findings remain inconsistent. At the national scale, Chen et al. [9] reported that the NPP in Pakistan was mainly negatively correlated with temperature and precipitation. In contrast, Ahmad et al. [10] reported that the normalized difference vegetation index (NDVI) was mainly positively correlated with both factors and was strongly associated with precipitation. Additionally, Zheng et al. [11] and Anees et al. [12] reported that the NDVI generally exhibited a negative correlation with temperature but a positive correlation with precipitation across the country. Given such the dramatic elevational gradient within a compact geographic area, identical climatic changes can trigger markedly different ecological responses across regions, suggesting that the impacts of climate change on vegetation cannot be generalized nationwide. To address this, several studies have examined climate‒vegetation relationships within specific geomorphological zones or have conducted comparative analyses across subregions [13,14,15,16]. For instance, Mehmood et al. [17] reported that in the northern mountainous region, the NDVI was negatively correlated with precipitation and positively correlated with temperature, whereas the opposite relationships, exhibiting positive correlations with precipitation and negative correlations with temperature, were observed elsewhere. However, correlation analyses reveal only statistical associations rather than causality. While they identify which climatic factors are related to vegetation dynamics, they fail to quantify the magnitude or actual direction of climatic forcing on the NPP. Crucially, a positive correlation does not guarantee a greater NPP if the driving climatic factor itself is declining. Consequently, correlation-based analyses alone are insufficient to clarify the actual contributions of climate change to vegetation dynamics, and whether its overall impact on vegetation is beneficial or detrimental remains to be determined.
Moreover, vegetation growth is an ever-changing dynamic process [18,19], the impacts of climate change on vegetation are not static but are dynamically evolving [20,21,22,23]. Existing global-scale studies examining the effects of single environmental factors have shown that the correlation between solar-induced chlorophyll fluorescence (SIF) and precipitation has generally strengthened, with substantial regional heterogeneity in Pakistan [24]; moreover, the NDVI in dryland ecosystems has been shown to increase with precipitation [25], and the positive correlation between gross primary productivity (GPP) and summer temperature in the Northern Hemisphere may undergo a future reversal [26]. However, current research on the changing relationships between climate and vegetation generally focuses on single climatic variables and typically covers broad spatial scales, overlooking the complex regional variations within Pakistan. Consequently, the dynamic responses of Pakistan’s vegetation to the combined impacts of temperature and precipitation have yet to be fully explored.
In this study, the spatiotemporal changes in climate and vegetation, their relationships, and the evolving dynamics of these relationships were investigated. Specifically, we aim to address the following core questions: Across Pakistan’s pronounced elevational gradient, in which regions does climate change enhance vegetation productivity, and where does it inhibit it? How are these impacts expected to evolve in the future? By answering these questions, this study provides theoretical support for predicting future vegetation dynamics and mitigating climate-related risks, offering a scientific foundation for the development of region-specific vegetation management strategies.
2. Materials and Methods
2.1. Study Area
Pakistan is located in the northwestern part of the South Asian subcontinent (23.5°N–37°N, 61°E–78°E) (Figure 1). In the southern coastal regions, the mean annual temperature reaches approximately 30°C, whereas the temperatures decrease progressively with increasing elevation and decrease to below 0°C in the northern mountainous areas. The central and southern parts of the country are mainly arid, with mean annual precipitation amounts of less than 500 mm [27]. In contrast, owing to the abrupt topographic relief, the Indian Ocean monsoon brings abundant rainfall to the northern region. The annual precipitation in these areas exceeds 1,000 mm and can locally surpass 2,000 mm.
2.2. Data Acquisition and Processing
2.2.1. Datasets
Monthly mean temperature and monthly total precipitation data from 2001 to 2022 were obtained from the ERA5-Land climate reanalysis dataset provided by the European Centre for Medium-Range Weather Forecasts (ECMWF) [28] at a spatial resolution of 0.1° (approximately 9 km). The NPP data were derived from NASA’s MODIS MOD17A3HGF (Version 6.1) annual net primary productivity product for the period 2001–2022 [29,30], with a spatial resolution of 500 m. Land cover information was obtained from the MODIS MCD12Q1 (Version 6.1) annual land cover product [31,32], with a temporal coverage of 2001–2022 and a spatial resolution of 500 m.
2.2.2. Data Processing
To ensure spatial consistency, the NPP and land cover datasets were resampled to 0.1°. To minimize the confounding effects of anthropogenic activities on climate‒vegetation relationships, pixels that experienced land cover transitions between 2001 and 2022, as well as those classified as urban or built-up lands [33], were excluded from the analysis of the relationships between climate and NPP.
2.3. Statistical Analysis
2.3.1. Analysis of Temporal Trends and Dynamic Relationships
Pixel-based linear regression was applied to estimate the temporal trends in mean annual temperature, total annual precipitation, and NPP. A partial correlation analysis was conducted for each grid cell to quantify the partial correlation between the NPP and each climatic driver (mean annual temperature and total annual precipitation). To capture the temporal evolution of these climate‒vegetation relationships, a moving partial correlation analysis was performed using a 5-year moving window [34].
2.3.2. Classification of Climatic Impacts on Vegetation
Multiple linear regression was used to assess the contributions of temperature (temp) and precipitation (prec) to NPP variability. The decomposition of NPP changes is expressed as follows:
∆NPPtotal represents the total linear trend of the actual NPP during the study period; ∆NPPtemp and ∆NPPprec denote the individual contributions of temperature and precipitation variations, respectively, to NPP dynamics; and ∆NPPres refers to the residual contribution. We identified the main climatic driver of NPP variability by comparing the absolute magnitudes of NPP changes that were attributable to temperature (temp) and precipitation (prec). On the basis of the temporal trends of the main climatic driver in conjunction with its moving partial correlation with the NPP (Table 1), we classified the specific modes of climatic impacts on vegetation productivity.
3. Results
3.1. Regional Differentiation of Temperature and Precipitation Variations from 2001 to 2022
In Pakistan, 42.57% of the land area exhibited a continuous increase in mean annual temperature, with an average warming rate of 0.120°C per decade. These areas were located mainly across the northern mountainous regions approximately north of 35°N and east of 72°E, the western parts of the Gandhara Plain and the Potwar Plateau, and regions south of 26°N. Areas with rapid warming were concentrated in the mountainous areas north of 35°N, the southwestern part of the Potwar Plateau, and the western parts of the Makran Cosat Range, where the maximum warming rate reached 0.505°C per decade. Conversely, 57.43% of the land area showed a continuous decrease in mean annual temperature, with an average cooling rate of 0.117°C per decade. These areas were located mainly in the regions between approximately 26°N and 32°N. Rapid cooling occurred east of the Sulaiman Mountains and west of the Indus River, where the maximum cooling rate was 0.450°C per decade (Figure 2).
In parallel, 76.20% of the land area exhibited a continuous increase in total annual precipitation, with an average rate of increase of 36.82 mm per decade. These areas were distributed mainly south of 32°N. Areas with rapid precipitation increases were concentrated northeast of Lahore, east of the Sulaiman Mountains, west of the Indus River, southeast of the Central Brahui Range, and in the Indus River Delta, where the maximum rate of increase reached 140.08 mm per decade. Conversely, 23.80% of the land area showed a continuous decrease in total annual precipitation, with an average rate of decrease of 25.74 mm per decade. These areas were located mainly in the Hindu Kush Mountains, the Gandhara Plain, the western part of the Potwar Plateau, and south of the Chagai Desert and Chagai Hills. Rapid decreases occurred in the Hindu Kush Mountains, the Gandhara Plain and the western Potwar Plateau, where the maximum rate of decrease was 129.35 mm per decade (Figure 3).
3.2. Regional Differentiation of NPP Variations from 2001 to 2022
From 2001 to 2022, the spatial distribution of the NPP variations in Pakistan exhibited considerable heterogeneity. Specifically, 62.61% of the land area exhibited a continuous increase in NPP, with an average increase of 20.28 gCm-2 per decade. These areas were located mainly in the northern mountainous regions, the Gandhara Plain, the Potwar Plateau, most parts of the Indus Plain, the Sulaiman Mountains, the Central Brahui Range, and the Kirthar Mountains. The areas where the NPP increased rapidly were concentrated in the regions between 33°N and 35°N, where the maximum rate of increase reached 261.78 gCm-2 per decade. In contrast, 2.39% of the land area showed a continuous decrease in NPP, with an average decrease of 4.37 gCm-2 per decade. These areas were distributed sporadically across the northern mountainous regions, the section of the Indus Plain between 31°N and 32°N, south of the Kirthar Mountains, the Indus River Delta, and the southern part of the Thar Desert, where the maximum rate of decrease reached 55.67 gCm-2 per decade. Areas with persistently near-zero NPP accounted for 35.14% of the land area and were located mainly in the Karakoram Mountains, west of the Kirthar Mountains, and the north part of the Thar Desert (Figure 4).
3.3. Partial Correlations and Their Temporal Trends Between Climatic Drivers and NPP from 2001 to 2022
A positive partial correlation between mean annual temperature and NPP was observed in 16.43% of the land area (Figure 5a). Specifically, 11.99% of the land area exhibited an increasing trend in this positive partial correlation (Figure 5b), which is distributed primarily in the mountainous regions north of 35°N, west of the Sulaiman Mountains, and the Indus Plain between 26°N and 31°N. Conversely, 4.44% of the land area showed a decreasing trend in this positive partial correlation (Figure 5c), which is distributed mainly in the mountainous regions between 34°N and 36°N. In contrast, a negative partial correlation between mean annual temperature and NPP was observed in 21.25% of the land area (Figure 5a). Specifically, 6.83% of the land area exhibited an increasing trend for this negative partial correlation (Figure 5d), which is distributed primarily on the Gandhara Plain, the northern Potwar Plateau, the northeastern Upper Indus Plain, and the western flank of the Kirthar Mountains. Conversely, 14.42% of the land area showed a decreasing trend for this negative partial correlation (Figure 5e), which is distributed mainly in the Upper Indus Plain between 30°N and 33°N, the Central Brahui Range, the Kirthar Mountains, the Indus Basin and the southern part of the Thar Desert.
A positive partial correlation between total annual precipitation and NPP was observed in 27.39% of the land area (Figure 6a). Specifically, 16.66% of the land area exhibited a strengthening trend in this positive partial correlation (Figure 6b), which is distributed primarily in the Sulaiman Mountains, the Central Brahui Range, the northern Kirthar Mountains, and the Indus Plain between 25°N and 31°N. Conversely, 10.73% of the land area showed a weakening trend in this positive partial correlation (Figure 6c), which is located mainly in the Gandhara Plain and the northern Potwar Plateau, the southern Kirthar Mountains, the Indus Plain in southern Sindh, and the southern part of the Thar Desert. In contrast, a negative partial correlation between total annual precipitation and NPP was detected in 10.29% of the land area (Figure 6a). Specifically, 4.71% of the land area exhibited a strengthening trend in this negative partial correlation (Figure 6d), which is distributed primarily in the northern mountainous regions and the northeastern Upper Indus Plain. Conversely, 5.58% of the land area showed a weakening trend in this negative partial correlation (Figure 6e), which is distributed mainly in the northern mountainous regions and the southern part of the Upper Indus Plain.
3.4. Regional Differentiation of the Responses of Vegetation Productivity to Temperature and Precipitation from 2001 to 2022
As shown in Table 1, temperature and precipitation affected the vegetation productivity in 16 distinct ways, six of which exhibited relatively clustered distributions, with each covering more than 1% of the land area. The regions in which the mean annual temperature was the main driver accounted for 12.22% of the land area. The areas in which warming enhanced the vegetation productivity, with this positive impact intensifying, accounted for 2.70% of the land area; these areas were distributed mainly in the northern mountainous regions (elevation > 3,500 m a.s.l.). The areas in which warming enhanced the vegetation productivity, with this positive impact diminishing, accounted for 1.92% of the land area; these areas were distributed mainly in the northern mountainous regions (elevation < 3,500 m a.s.l.). The areas in which cooling enhanced the vegetation productivity, with this positive impact diminishing, accounted for 4.38% of the land area; these areas were distributed mainly in the northern Upper Indus Plain (Figure 7).
Regions where the total annual precipitation was the main driver accounted for 25.46% of the land area. The areas in which decreasing total annual precipitation amounts enhanced the vegetation productivity, with this positive impact diminishing, accounted for 1.88% of the land area; these areas were distributed mainly in the Gandhara Plain and the northern Potwar Plateau. The areas in which increasing total annual precipitation amounts enhanced the vegetation productivity, with this positive impact intensifying, accounted for 13.92% of the land area; these areas were distributed mainly in the Sulaiman Mountains, the Central Brahui Range, the northern Kirthar Mountains, and the Indus Plain between 26°N and 31°N. The areas in which increasing total annual precipitation amounts enhanced the vegetation productivity, with this positive impact diminishing, accounted for 8.35% of the land area; these areas were distributed mainly in the southern Kirthar Mountains, the Indus River Delta, and southeastern Sindh Province (Figure 7).
4. Discussion
Owing to the pronounced elevational gradient in Pakistan, the ecological impacts of climate change on vegetation vary spatially, even when the magnitude of climate change is the same. In the northern mountains, the altitudinal belt at approximately 3,500 m a.s.l. acts as a transitional zone for vegetation responses to temperature. Above this zone, warming enhances the vegetation productivity, with this positive impact intensifying. If climate change continues at its current pace, it is unlikely to limit the vegetation productivity. These regions sustain several IUCN-listed threatened species, including the snow leopard (Panthera uncia) [35] and the Kashmir musk deer (Moschus cupreus) [36]. Enhanced NPP likely improves forage availability and habitat quality for these species, facilitating their survival and reproduction. Notably, the population of Pakistan’s national animal, the markhor (Capra falconeri), has steadily recovered. As a result, the markhor was downlisted to "Near Threatened" on the IUCN Red List in 2014 [37]. In contrast, below that zone, warming enhances the vegetation productivity, but this positive impact is diminishing, coinciding with an observed decline in total annual precipitation. Zheng et al. [38] and He et al. [39] reported that in regions with limited water availability, warming-induced drought can lead to a decline in tree productivity. Thus, precipitation may become the limiting driver for the vegetation productivity in this region, where vegetation may undergo risks of degradation. This region remains a vital forestry base [40], hosting abundant resources and plant species of significant medicinal and economic value, such as the Himalayan yew (Taxus wallichiana) and Himalayan Mayapple (Podophyllum hexandrum) [41], both of which are protected under Pakistan’s National Biodiversity Strategy and Action Plan. Therefore, the implementation of adaptive vegetation management strategies is urgently needed to address these climatic shifts.
Eastern Pakistan is an important agricultural region, particularly within the Indus River Basin. In regions such as Potwar, croplands are entirely rainfed and lack irrigation infrastructure, rendering crop production systems highly sensitive to climate change, as even slight climatic variations can lead to severe crop losses [42]. In this region, the positive impact of total annual precipitation on the vegetation productivity is weakening, while the region is experiencing a warming trend. Continued warming coupled with limited water availability may lead to drought, thereby imposing additional effects on vegetation productivity. In the northern Upper Indus Plain, cooling enhances the vegetation productivity; however, this promoting impact is weakening. Sustained cooling can rapidly alter or even reverse the relationship between temperature and vegetation productivity when temperatures deviate from the optimal growth window of crops [43]. Therefore, if climate change continues at its current pace, it may limit the vegetation productivity in this region. Conversely, on the Indus Plain between 26°N and 31°N, increasing total annual precipitation amounts enhance the vegetation productivity, and this beneficial impact is intensifying. If climate change continues at its current pace, it is unlikely to limit the vegetation productivity.
5. Conclusions
The NPP in Pakistan exhibited an overall increasing trend from 2001 to 2022. The spatial extent in which NPP is primarily affected by precipitation is approximately twice as large as the area primarily affected by temperature. The impacts of climate change on vegetation are mainly positive. If climate change continues at its current pace, the vegetation distributed in the northern mountainous regions below 3,500 m a.s.l., the Gandhara Plain, the northern Potwar Plateau, the northern Upper Indus Plain and regions south of approximately 26°N may undergo risks of degradation. Our study provides empirical evidence highlighting the importance of spatial differentiation when assessing the impacts of climate change on vegetation productivity. Furthermore, even if the current climate has a positive impact on vegetation growth, monitoring the temporal dynamics of the impact is essential to accurately predict whether vegetation might face the risk of degradation in the future.
Author Contributions
Conceptualization, Y.J. and Z.W.; methodology, Z.W.; validation, Y.J.; formal analysis, Z.W.; investigation, Y.W. and P.C.; data curation, Z.W., Y.W. and P.C.; writing—original draft preparation, Z.W.; writing—review and editing, Y.J., X.X., Y.W., P.C., M.G. and M.K.; visualization, Z.W.; supervision, Y.J.; project administration, Y.J.; funding acquisition, Y.J. All authors have read and agreed to the published version of the manuscript.
Funding
This work was supported by Area Studies: Pakistan (Grant Number 046GJHZ2023071MI).
Data Availability Statement
The datasets supporting the conclusions of this article are available in the ECMWF repository, https://www.ecmwf.int/, and in the MODIS repository, https://search.earthdata.nasa.gov/search.
Conflicts of Interest
The authors declare no conflicts of interest.
Abbreviations
The following abbreviations are used in this manuscript:
| ECMWF | European centre for medium-range weather forecasts |
| GPP | Gross primary productivity |
| IGBP | International geosphere-biosphere programme |
| MODIS | Moderate resolution imaging spectroradiometer |
| NASA | National aeronautics and space administration |
| NDVI | Normalized difference vegetation index |
| NPP | Net primary productivity |
| Prec | Precipitation |
| Temp | Temperature |
| SIF | Solar-induced chlorophyll fluorescence |
References
- Chen, C.; Park, T.; Wang, X.; Piao, S.; Xu, B.; Chaturvedi, R.K.; Fuchs, R.; Brovkin, V.; Ciais, P.; Fensholt, R.; et al. China and India lead in greening of the world through land-use management. Nat. Sustain. 2019, 2, 122–129. [Google Scholar] [CrossRef]
- Zhao, M.; Running, S.W. Drought-induced reduction in global terrestrial net primary production from 2000 through 2009. Science 2010, 329, 940–943. [Google Scholar] [CrossRef] [PubMed]
- Hanif, M.; Khan, A.H.; Adnan, S. Latitudinal precipitation characteristics and trends in Pakistan. J. Hydrol. 2013, 492, 266–272. [Google Scholar] [CrossRef]
- Hashim, M.; Bushra, E.; Dasti, A.A.; Abbasi, A.; Ali, H.M.; Maqsood, S.; Farooq, T.H.; Aslam, A.; Abbas, Z.; Khan, M.T. Exploration of species diversity and vegetation pattern in temperate conifer forests along altitudinal gradients in the western Himalayas. Front. For. Glob. Change 2023, 6, 1195491. [Google Scholar] [CrossRef]
- Muhammad, B.; Hayat, U.; Gopakumar, L.; Xiong, S.; Ali, J.; Badshah, M.T.; Ullah, S.; Rehman, A.U.; Yin, Q.; Jia, Z. Altitudinal variations in coniferous vegetation and soil carbon storage in Kalam temperate forest, Pakistan. Plants 2025, 14, 1534. [Google Scholar] [CrossRef]
- Shah, M.; Sher, H.; Ali, H.; Ullah, R.; Law, D.; Elsadek, M.F.; Al-Numair, K.S.; Tan, D.K.Y.; Yasin, M. Altitudinal gradient and its correlation with plant diversity in Daral Valley, Swat in Pakistan using multivariate analysis. BMC Ecol. Evo. 2025, 25, 103. [Google Scholar] [CrossRef]
- Cramer, W.; Kicklighter, D.W.; Bondeau, A.; Moore, B., III; Churkina, G.; Nemry, B.; Ruimy, A.; Schloss, A.L. Comparing global models of terrestrial net primary productivity (NPP): Overview and key results. Glob. Chang. Biol. 1999, 5, 1–15. [Google Scholar] [CrossRef]
- Ma, Y.; Zhao, M.; Lu, L.; Ji, Y.; Li, Q.; Meng, J.; Liu, X. Spatiotemporal dynamics of vegetation net primary productivity and its drivers in China’s three eco-zones and four shelterbelts region. Land Degrad. Dev. 2025, 36, 4194–4207. [Google Scholar] [CrossRef]
- Chen, A.; Zhong, X.; Wang, J.; Li, J. Spatiotemporal patterns and driving forces of net primary productivity in South and Southeast Asia based on Google Earth Engine and MODIS data. Catena 2025, 249, 108689. [Google Scholar] [CrossRef]
- Ahmad, A.; Zhang, J.; Bashir, B.; Mahmood, K.; Mumtaz, F. Exploring vegetation trends and restoration possibilities in Pakistan by using Hurst exponent. Environ. Sci. Pollut. Res. 2023, 30, 91915–91928. [Google Scholar] [CrossRef]
- Zheng, C.; Liang, J.; Wang, J. The impact of climate and land use on the spatio-temporal changes of NDVI of China-Pakistan Economic Corridor. J. Ecol. Rural Environ. 2022, 38, 1147–1156. [Google Scholar]
- Anees, S.A.; Mehmood, K.; Rehman, A.; Rehman, N.U.; Muhammad, S.; Shahzad, F.; Hussain, K.; Luo, M.; Alarfaj, A.A.; Alharbi, S.A.; et al. Unveiling fractional vegetation cover dynamics: A spatiotemporal analysis using MODIS NDVI and machine learning. Environ. Sustain. Indic. 2024, 24, 100485. [Google Scholar] [CrossRef]
- Bashir, B.; Cao, C.; Naeem, S.; Zamani Joharestani, M.; Bo, X.; Afzal, H.; Jamal, K.; Mumtaz, F. Spatio-temporal vegetation dynamic and persistence under climatic and anthropogenic factors. Remote Sens. 2020, 12, 2612. [Google Scholar] [CrossRef]
- Mehmood, K.; Anees, S.A.; Rehman, A.; Pan, S.; Tariq, A.; Zubair, M.; Liu, Q.; Rabbi, F.; Khan, K.A.; Luo, M. Exploring spatiotemporal dynamics of NDVI and climate-driven responses in ecosystems: Insights for sustainable management and climate resilience. Ecol. Inform. 2024, 80, 102532. [Google Scholar] [CrossRef]
- Mehmood, K.; Anees, S.A.; Rehman, A.; Rehman, N.U.; Muhammad, S.; Shahzad, F.; Liu, Q.; Alharbi, S.A.; Alfarraj, S.; Ansari, M.J.; et al. Assessment of climatic influences on net primary productivity along elevation gradients in temperate ecoregions. Trees For. People 2024, 18, 100657. [Google Scholar] [CrossRef]
- Shah, I.A.; Khan, H.; Muhammad, Z.; Ullah, R.; Iqbal, S.; Nafidi, H.A.; Bourhia, M.; Salamatullah, A.M. Evaluation of climate change impact on plants and hydrology. Front. Environ. Sci. 2024, 12, 1328808. [Google Scholar] [CrossRef]
- Mehmood, K.; Anees, S.A.; Muhammad, S.; Hussain, K.; Shahzad, F.; Liu, Q.; Ansari, M.J.; Alharbi, S.A.; Khan, W.R. Analyzing vegetation health dynamics across seasons and regions through NDVI and climatic variables. Sci. Rep. 2024, 14, 11775. [Google Scholar] [CrossRef]
- Zhang, D.; Geng, X.; Chen, W.; Fang, L.; Yao, R.; Wang, X.; Zhou, X. Inconsistency of global vegetation dynamics driven by climate change: Evidences from spatial regression. Remote Sens. 2021, 13, 3442. [Google Scholar] [CrossRef]
- Shi, S.; Zhu, L.; Luo, Z.; Qiu, H. Quantitative analysis of the contributions of climatic and anthropogenic factors to the variation in net primary productivity, China. Remote Sens. 2023, 15, 789. [Google Scholar] [CrossRef]
- Astigarraga, J.; Andivia, E.; Zavala, M.A.; Gazol, A.; Cruz-Alonso, V.; Vicente-Serrano, S.M.; Ruiz-Benito, P. Evidence of non-stationary relationships between climate and forest responses: Increased sensitivity to climate change in Iberian forests. Glob. Chang. Biol. 2020, 26, 5063–5076. [Google Scholar] [CrossRef]
- Ren, J.; Guo, X.; Tong, S.; Bao, Y.; Bao, G.; Huang, X. Risk posed to vegetation net primary productivity by drought on the Mongolian Plateau. J. Geogr. Sci. 2023, 33, 2175–2192. [Google Scholar] [CrossRef]
- Wang, Y.; Sarmah, S.; Singha, M.; Chen, W.; Ge, Y.; Liang, L.L.; Goswami, S.; Niu, S. Increasing optimum temperature of vegetation activity over the past four decades. Earth's Future 2024, 12, e2024EF004489. [Google Scholar] [CrossRef]
- Shi, S.; Yang, P.; Vrieling, A.; Van Der Tol, C. Opposite effects of temperature and precipitation on vegetation growth onset in Africa. Agric. For. Meteorol. 2025, 371, 110604. [Google Scholar] [CrossRef]
- Zhang, W.; Fan, Z.; Jin, C.; Jiao, Y.; Di, K.; Feng, M.; Lu, Y.; Zhao, K.; Zhao, H.; Hao, S.; et al. Reversal of the sensitivity of vegetation productivity to precipitation in global terrestrial biomes over the recent decade. Agric. For. Meteorol. 2025, 370, 110598. [Google Scholar] [CrossRef]
- Zhang, Y.; Gentine, P.; Luo, X.; Lian, X.; Liu, Y.; Zhou, S.; Michalak, A.M.; Sun, W.; Fisher, J.B.; Piao, S.; et al. Increasing sensitivity of dryland vegetation greenness to precipitation due to rising atmospheric CO2. Nat. Commun. 2022, 13, 4875. [Google Scholar] [CrossRef]
- Zhang, Y.; Piao, S.; Sun, Y.; Rogers, B.M.; Li, X.; Lian, X.; Liu, Z.; Chen, A.; Peñuelas, J. Future reversal of warming-enhanced vegetation productivity in the Northern Hemisphere. Nat. Clim. Chang. 2022, 12, 581–586. [Google Scholar] [CrossRef]
- Ahmed, K.; Sachindra, D.A.; Shahid, S.; Demirel, M.C.; Chung, E.S. Selection of multi-model ensemble of general circulation models for the simulation of precipitation and maximum and minimum temperature based on spatial assessment metrics. Hydrol. Earth Syst. Sci. 2019, 23, 4803–4824. [Google Scholar] [CrossRef]
- Muñoz-Sabater, J.; Dutra, E.; Agustí-Panareda, A.; Albergel, C.; Arduini, G.; Balsamo, G.; Boussetta, S.; Choulga, M.; Harrigan, S.; Hersbach, H.; et al. ERA5-Land: A state-of-the-art global reanalysis dataset for land applications. Earth Syst. Sci. Data 2021, 13, 4349–4383. [Google Scholar] [CrossRef]
- Running, S.W.; Nemani, R.R.; Heinsch, F.A.; Zhao, M.; Reeves, M.; Hashimoto, H. A continuous satellite-derived measure of global terrestrial primary production. BioScience 2004, 54, 547. [Google Scholar] [CrossRef]
- Running, S.; Zhao, M. MODIS/Terra Net Primary Production Gap-Filled Yearly L4 Global 500m SIN Grid V061. Available online. (accessed on 25 July 2025). [CrossRef]
- Sulla-Menashe, D.; Gray, J.M.; Abercrombie, S.P.; Friedl, M.A. Hierarchical mapping of annual global land cover 2001 to present: The MODIS collection 6 land cover product. Remote Sens. Environ. 2019, 222, 183–194. [Google Scholar] [CrossRef]
- Friedl, M.; Sulla-Menashe, D. MODIS/Terra+Aqua Land Cover Type Yearly L3 Global 500m SIN Grid V061. Available online. (accessed on 29 September 2025). [CrossRef]
- Loveland, T.R.; Reed, B.C.; Brown, J.F.; Ohlen, D.O.; Zhu, Z.; Yang, L.; Merchant, J.W. Development of a global land cover characteristics database and IGBP DISCover from 1 km AVHRR data. Int. J. Remote Sens. 2000, 21, 1303–1330. [Google Scholar] [CrossRef]
- Wu, K.; Hu, Z.; Wang, X.; Chen, J.; Yang, H.; Yuan, W. Widespread increase in sensitivity of vegetation growth to climate variability on the Tibetan Plateau. Agric. For. Meteorol. 2024, 358, 110260. [Google Scholar] [CrossRef]
- Bhatti, U.A.; Nizamani, M.M.; Huang, M. Climate change threatens Pakistan’s snow leopards. Science 2022, 377, 585–586. [Google Scholar] [CrossRef] [PubMed]
- Ali, M. Systematic review and analysis of the taxonomy of musk deer in Kashmir. Eur. J. Environ. Sci. 2023, 13, 39–46. [Google Scholar] [CrossRef]
- Shah, S.A.; Karim, S.; Bhatti, A.L.; Kumar, R. Protecting endangered species: The role of international environmental law in Pakistan. JRSR 2024, 3, 87–102. [Google Scholar] [CrossRef]
- Zheng, P.; Wang, D.; Jia, G.; Yu, X.; Liu, Z.; Wang, Y.; Zhang, Y. Variation in water supply leads to different responses of tree growth to warming. For. Ecosyst. 2022, 9, 100003. [Google Scholar] [CrossRef]
- He, J.; Shen, Z.; Ning, C.; Zhang, W.; Halik, Ü. Elevational effects of climate warming on tree growth in a Picea schrenkiana forest in the eastern Tianshan Mountains. Forests 2024, 15, 2052. [Google Scholar] [CrossRef]
- Dar, A.A.; Parthasarathy, N. Patterns and drivers of tree carbon stocks in Kashmir Himalayan forests: Implications for climate change mitigation. Ecol. Process. 2022, 11, 58. [Google Scholar] [CrossRef]
- Sher, H.; Al_yemeni, M. Economically and ecologically important plant communities in high altitude coniferous forest of Malam Jabba, Swat, Pakistan. Saudi, J. Biol. Sci. 2011, 18, 53–61. [Google Scholar] [CrossRef]
- Miandad, M.; Ansar, A.; Rahman, G.; Munawar, S.; Dawood, M. Spatio-temporal impact of climate variability on crop production of Potohar region, Pakistan (1990-2017). EQ 2025, 36, 1–25. [Google Scholar] [CrossRef]
- Schlenker, W.; Roberts, M.J. Nonlinear temperature effects indicate severe damages to U.S. crop yields under climate change. Proc. Natl. Acad. Sci. U.S.A. 2009, 106, 15594–15598. [Google Scholar] [CrossRef]
Figure 1.
Natural Characteristics of Pakistan.
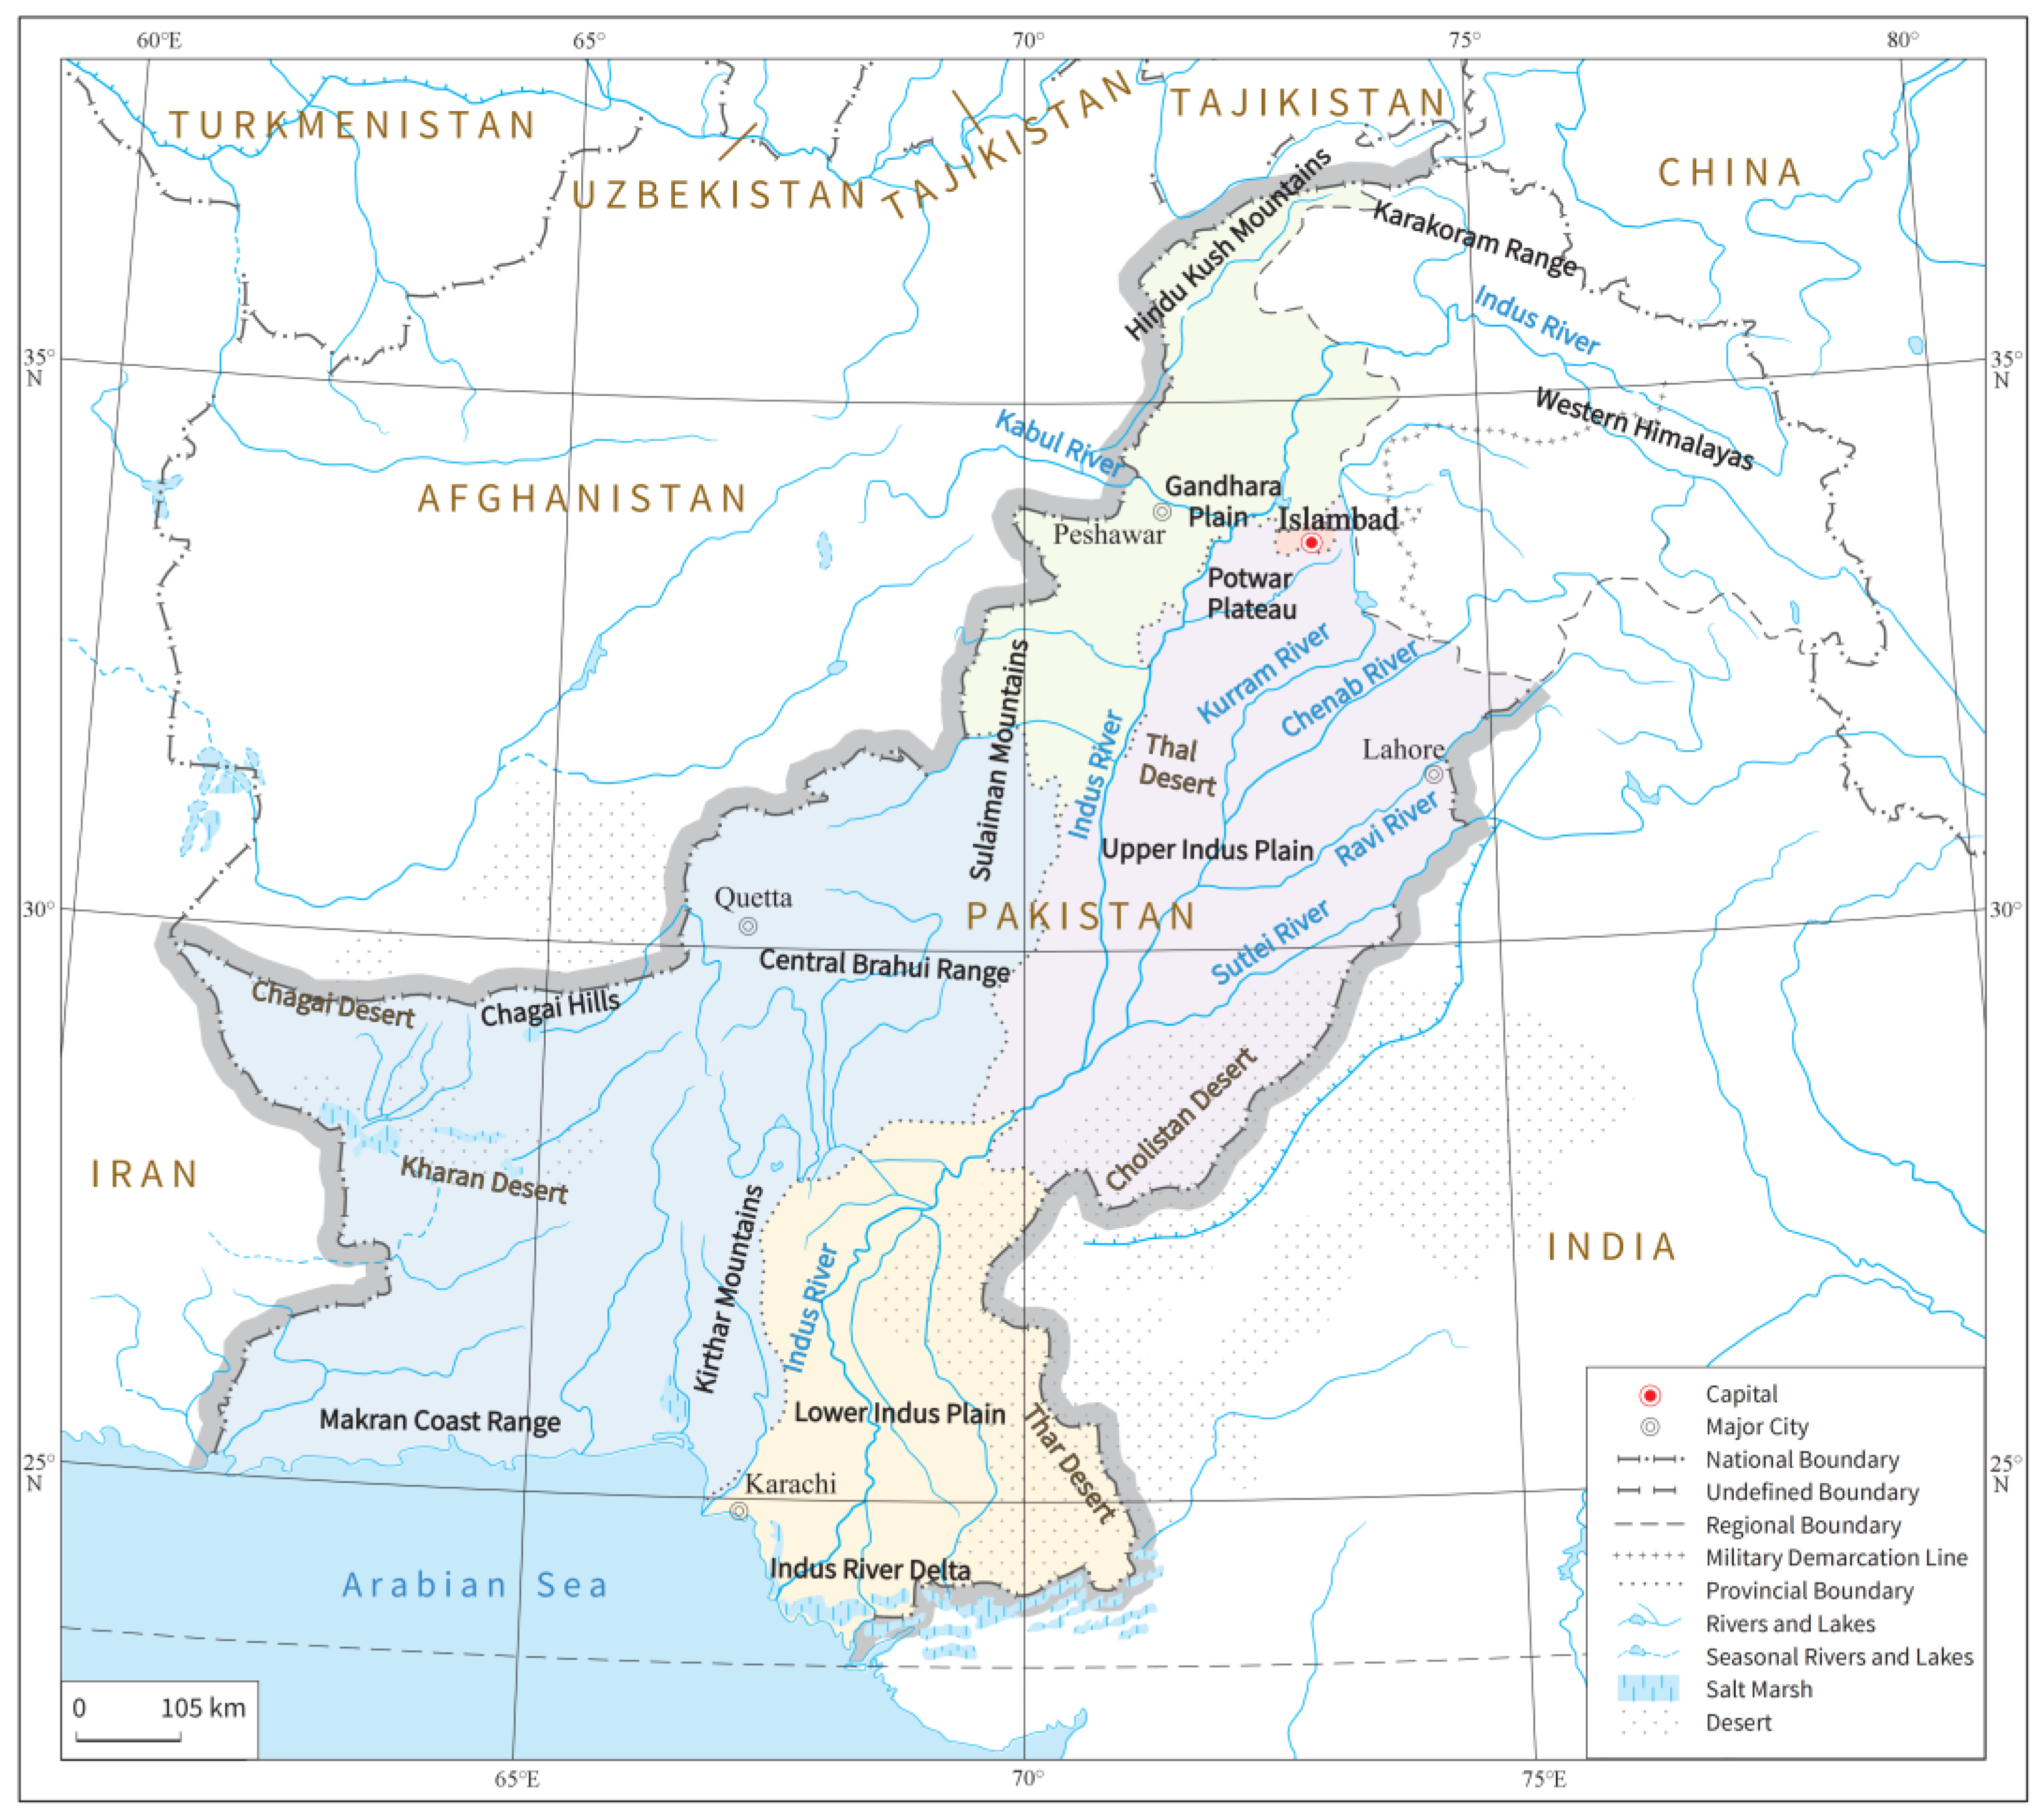
Figure 2.
Mean annual temperature trends in Pakistan from 2001 to 2022.
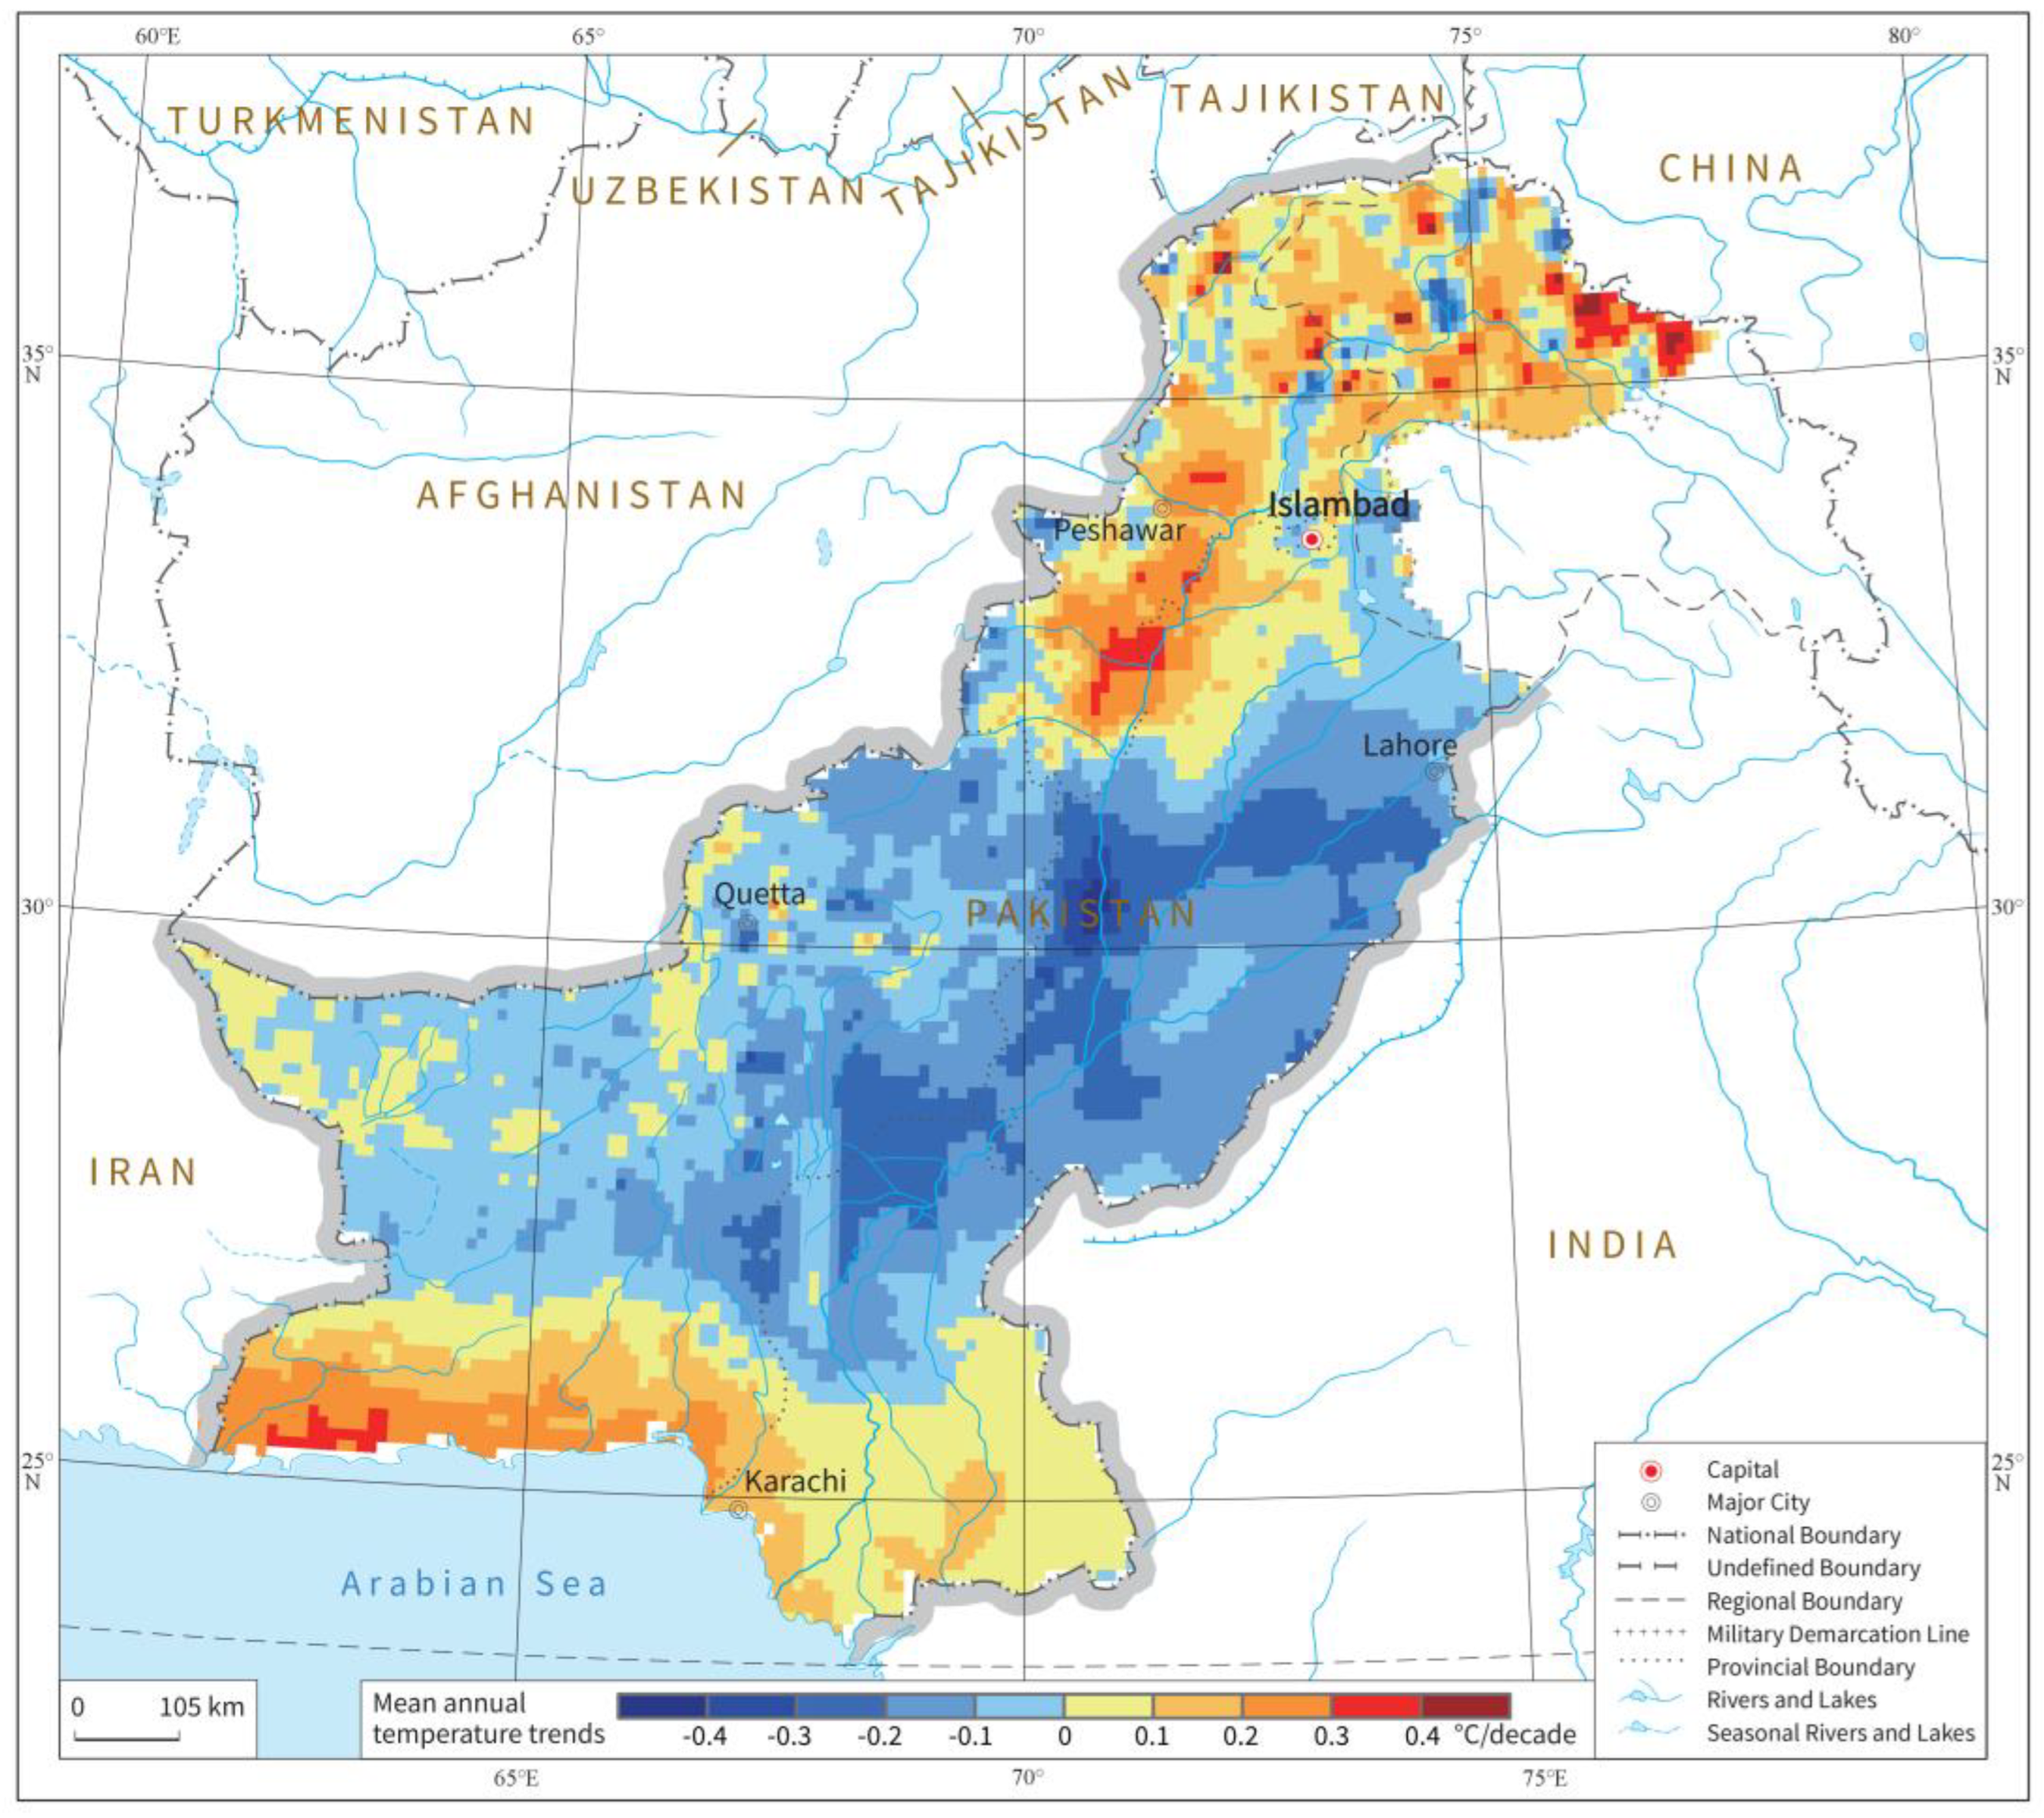
Figure 3.
Total annual precipitation trends in Pakistan from 2001 to 2022.
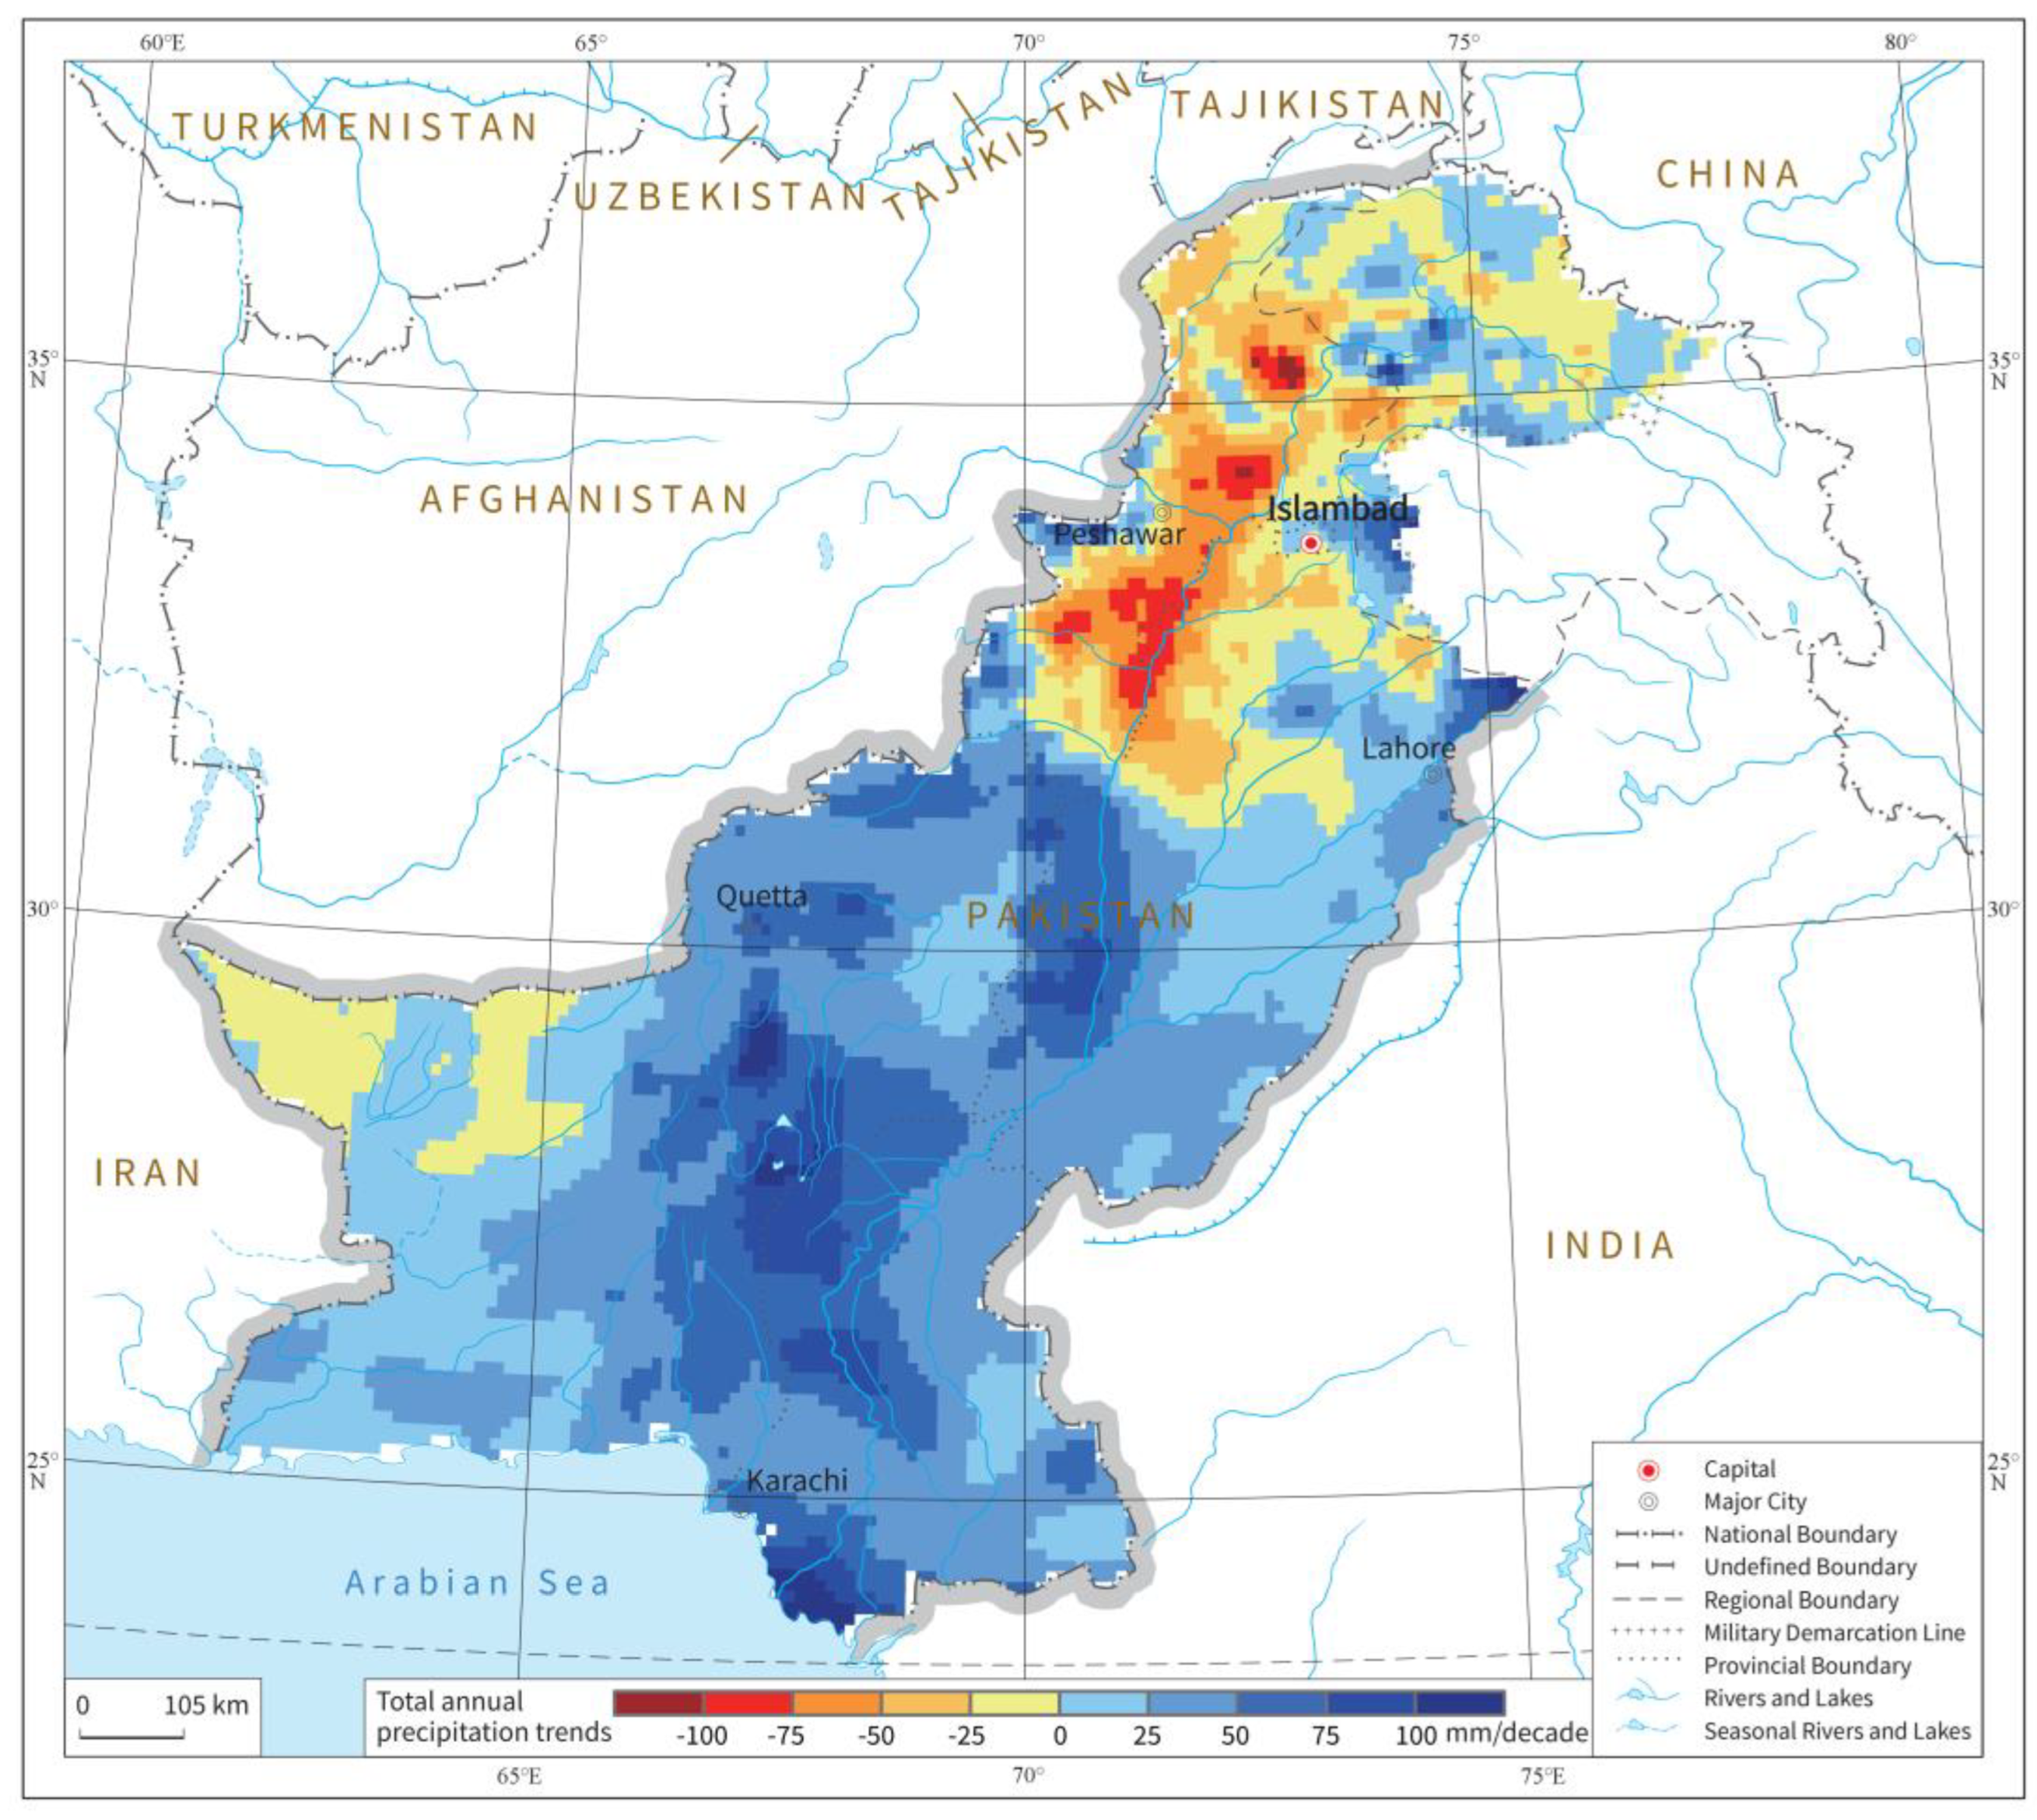
Figure 4.
NPP trends in Pakistan from 2001 to 2022.
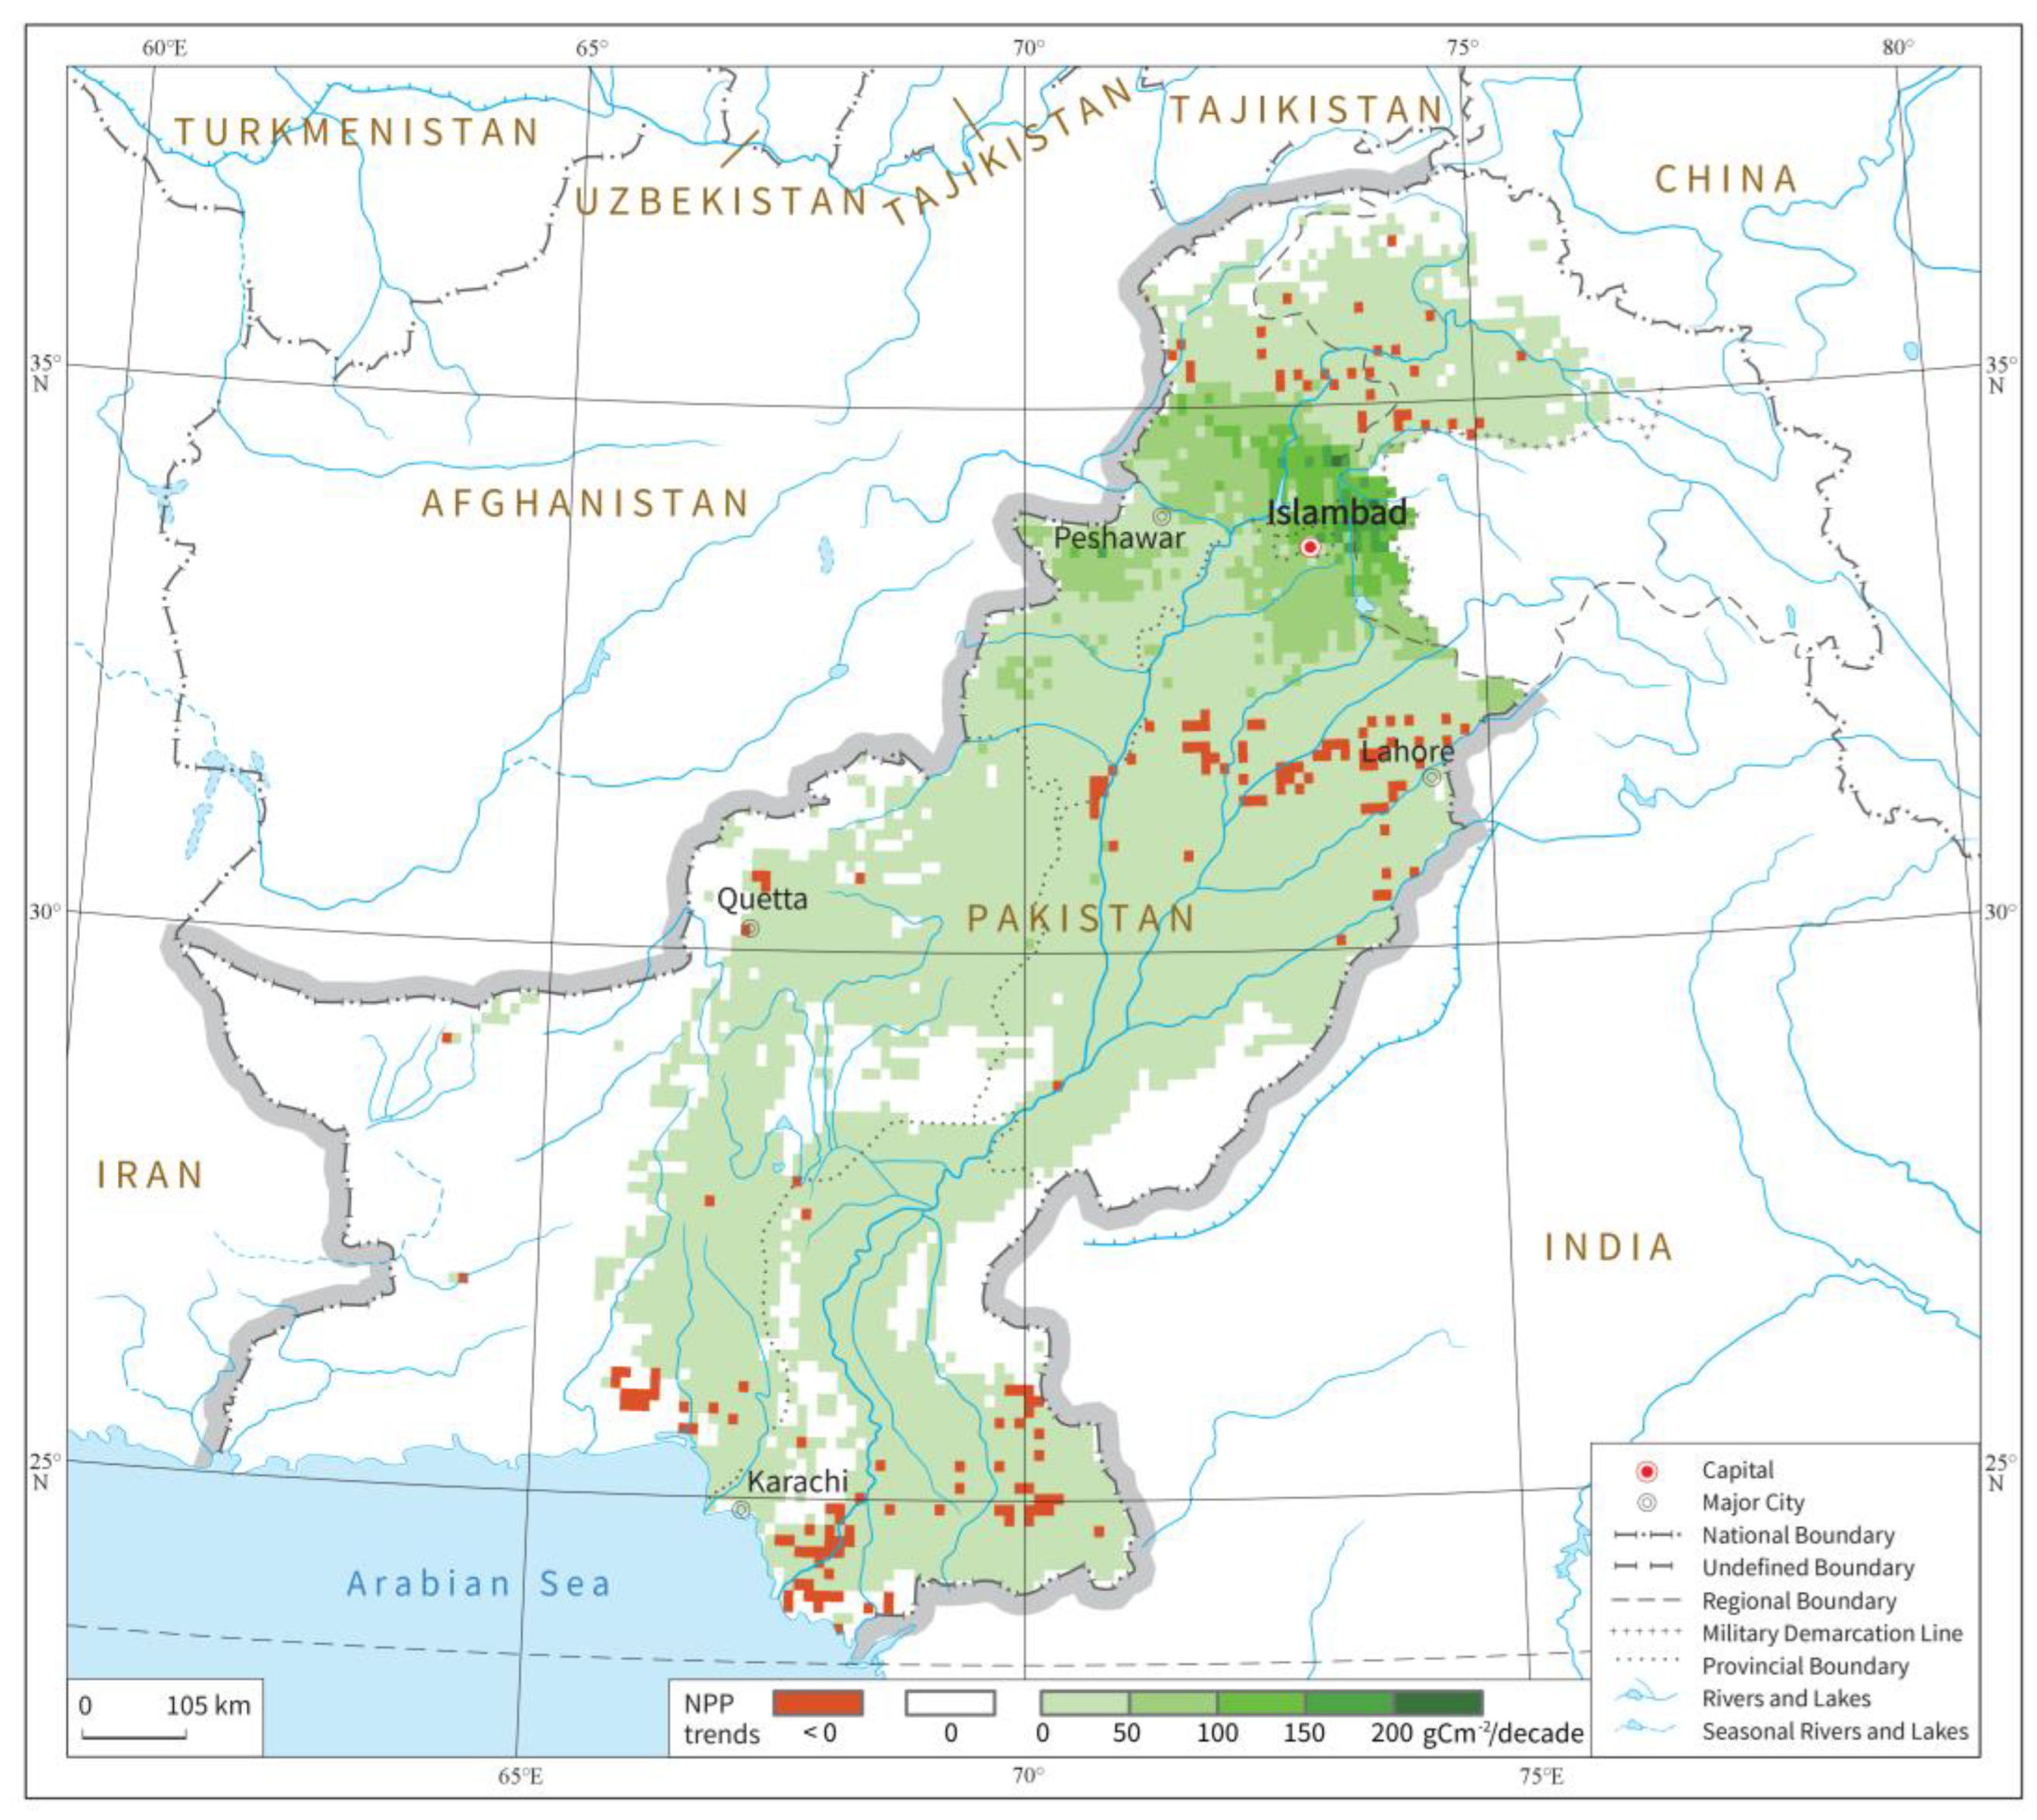
Figure 5.
Partial correlations and their temporal trends between temperature and NPP from 2001 to 2022.
Figure 5.
Partial correlations and their temporal trends between temperature and NPP from 2001 to 2022.
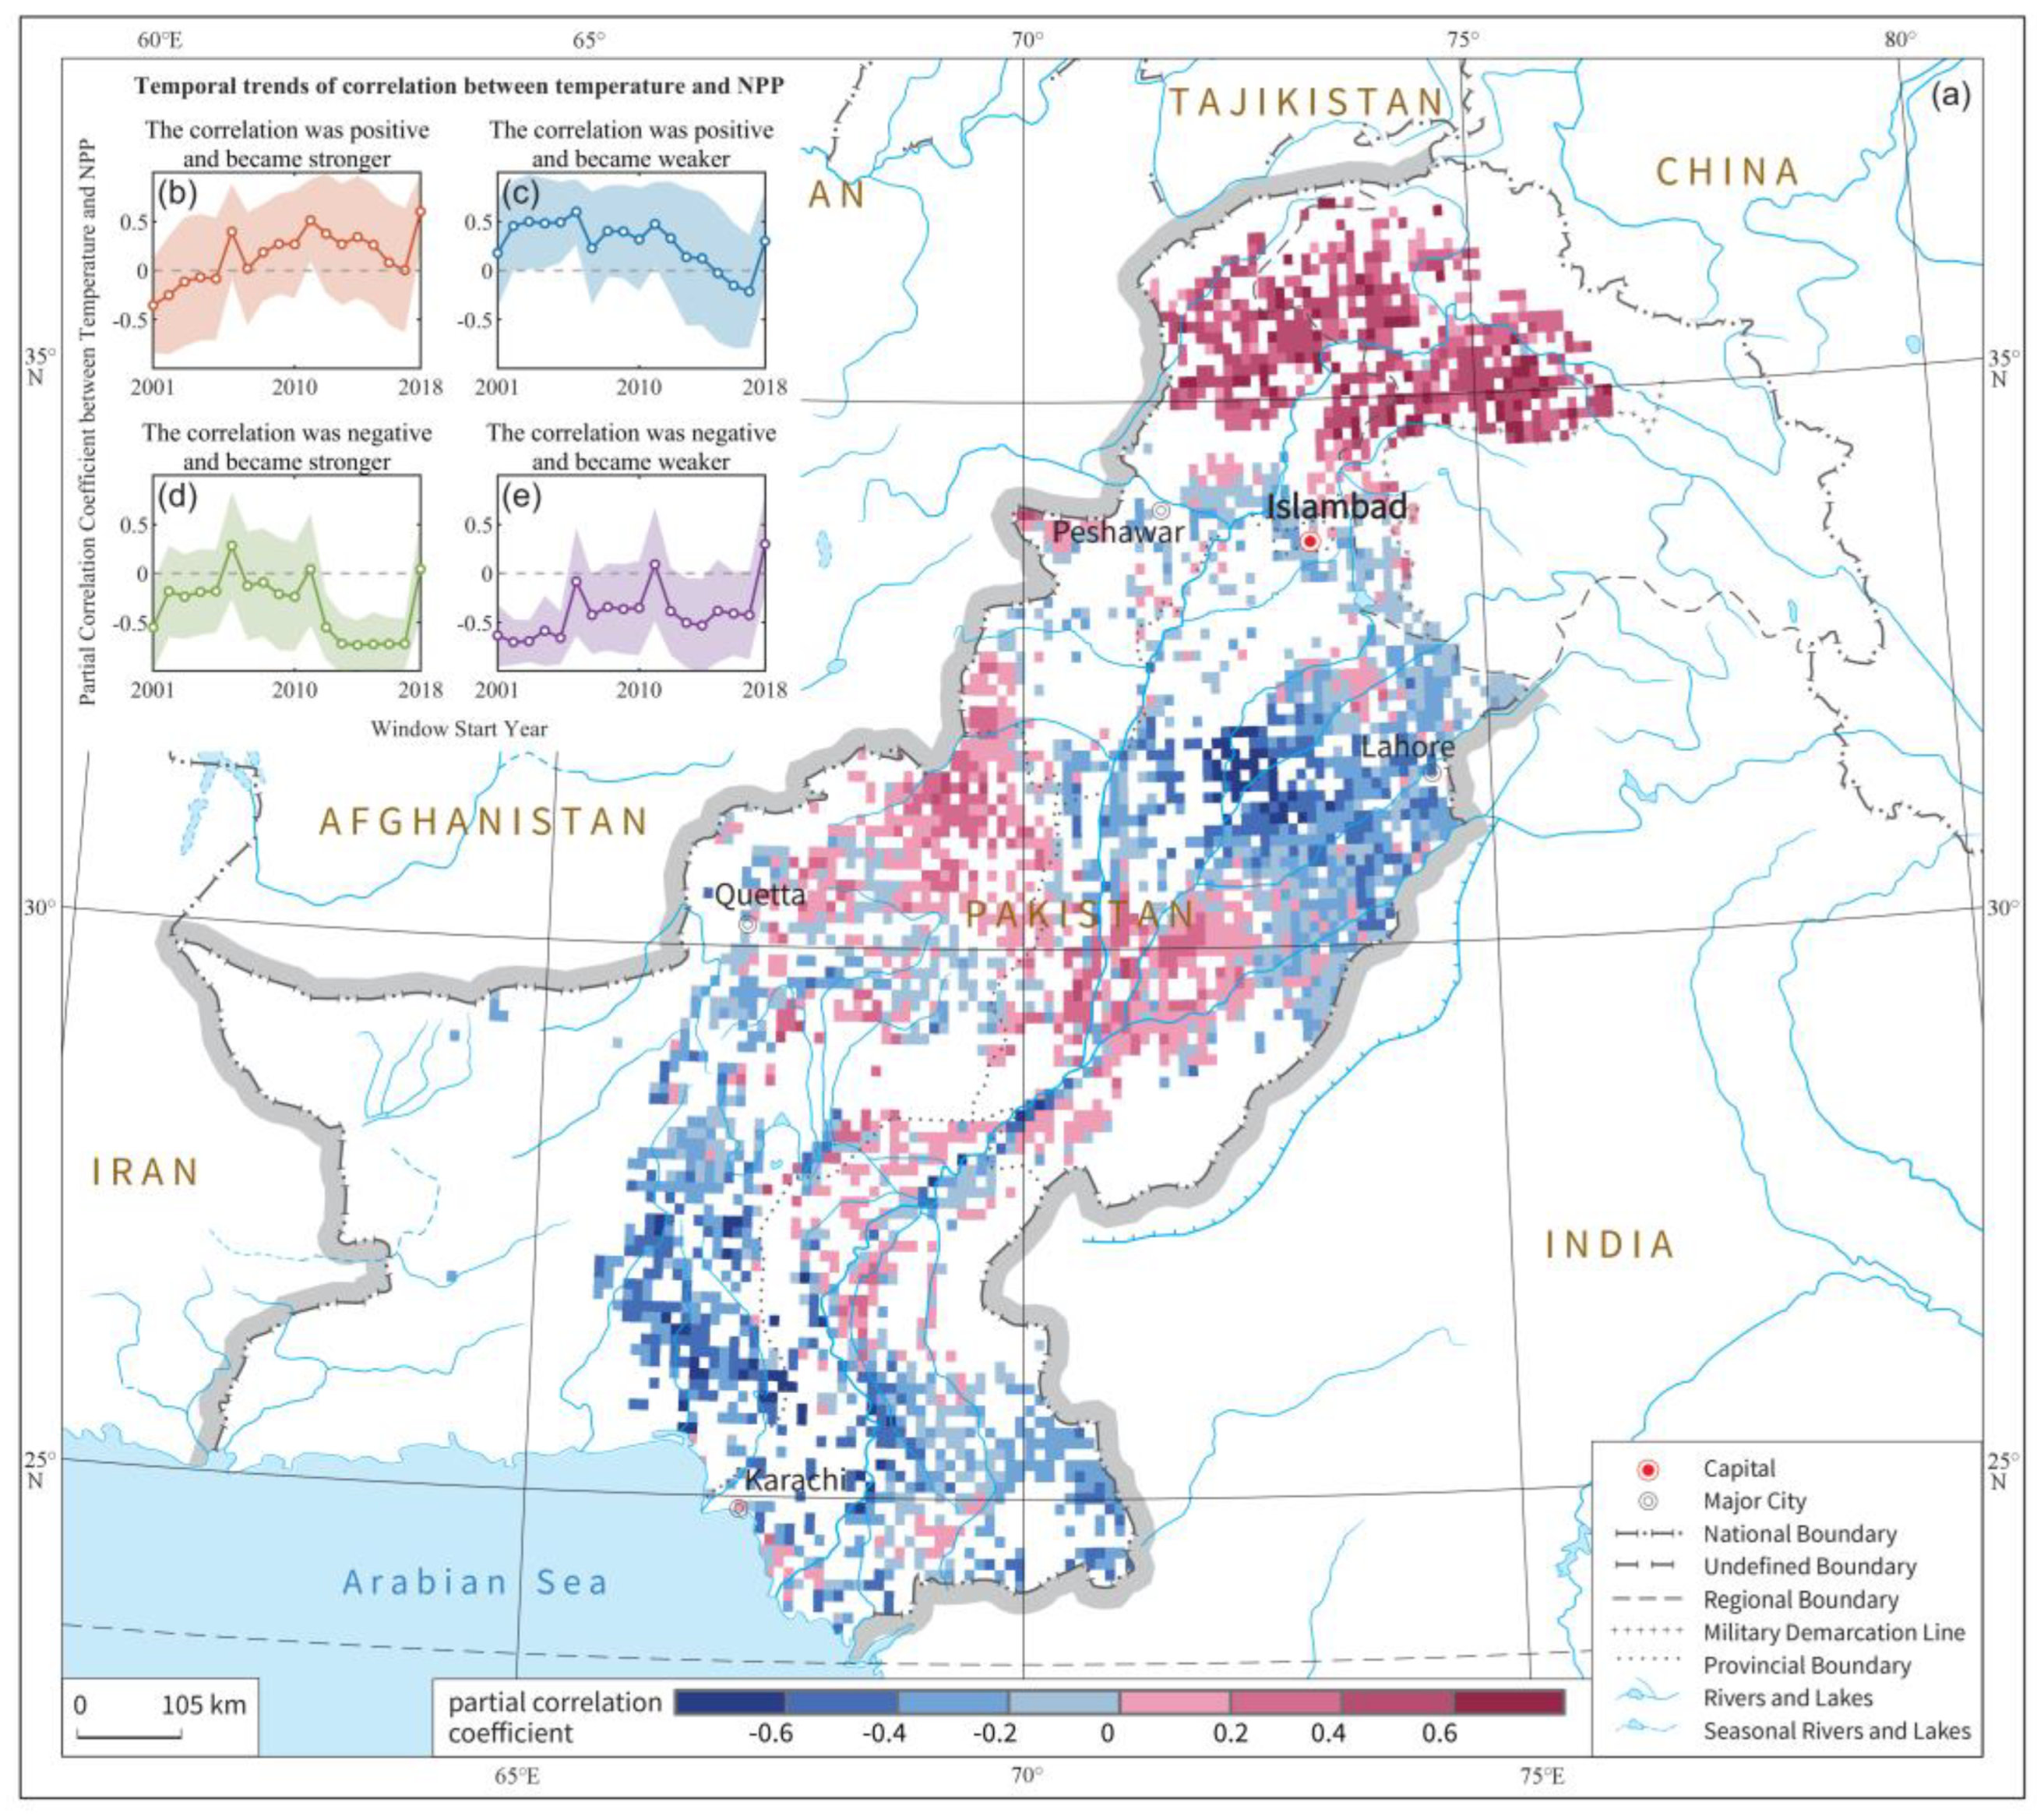
Figure 6.
Partial correlations and their temporal trends between precipitation and NPP from 2001 to 2022.
Figure 6.
Partial correlations and their temporal trends between precipitation and NPP from 2001 to 2022.
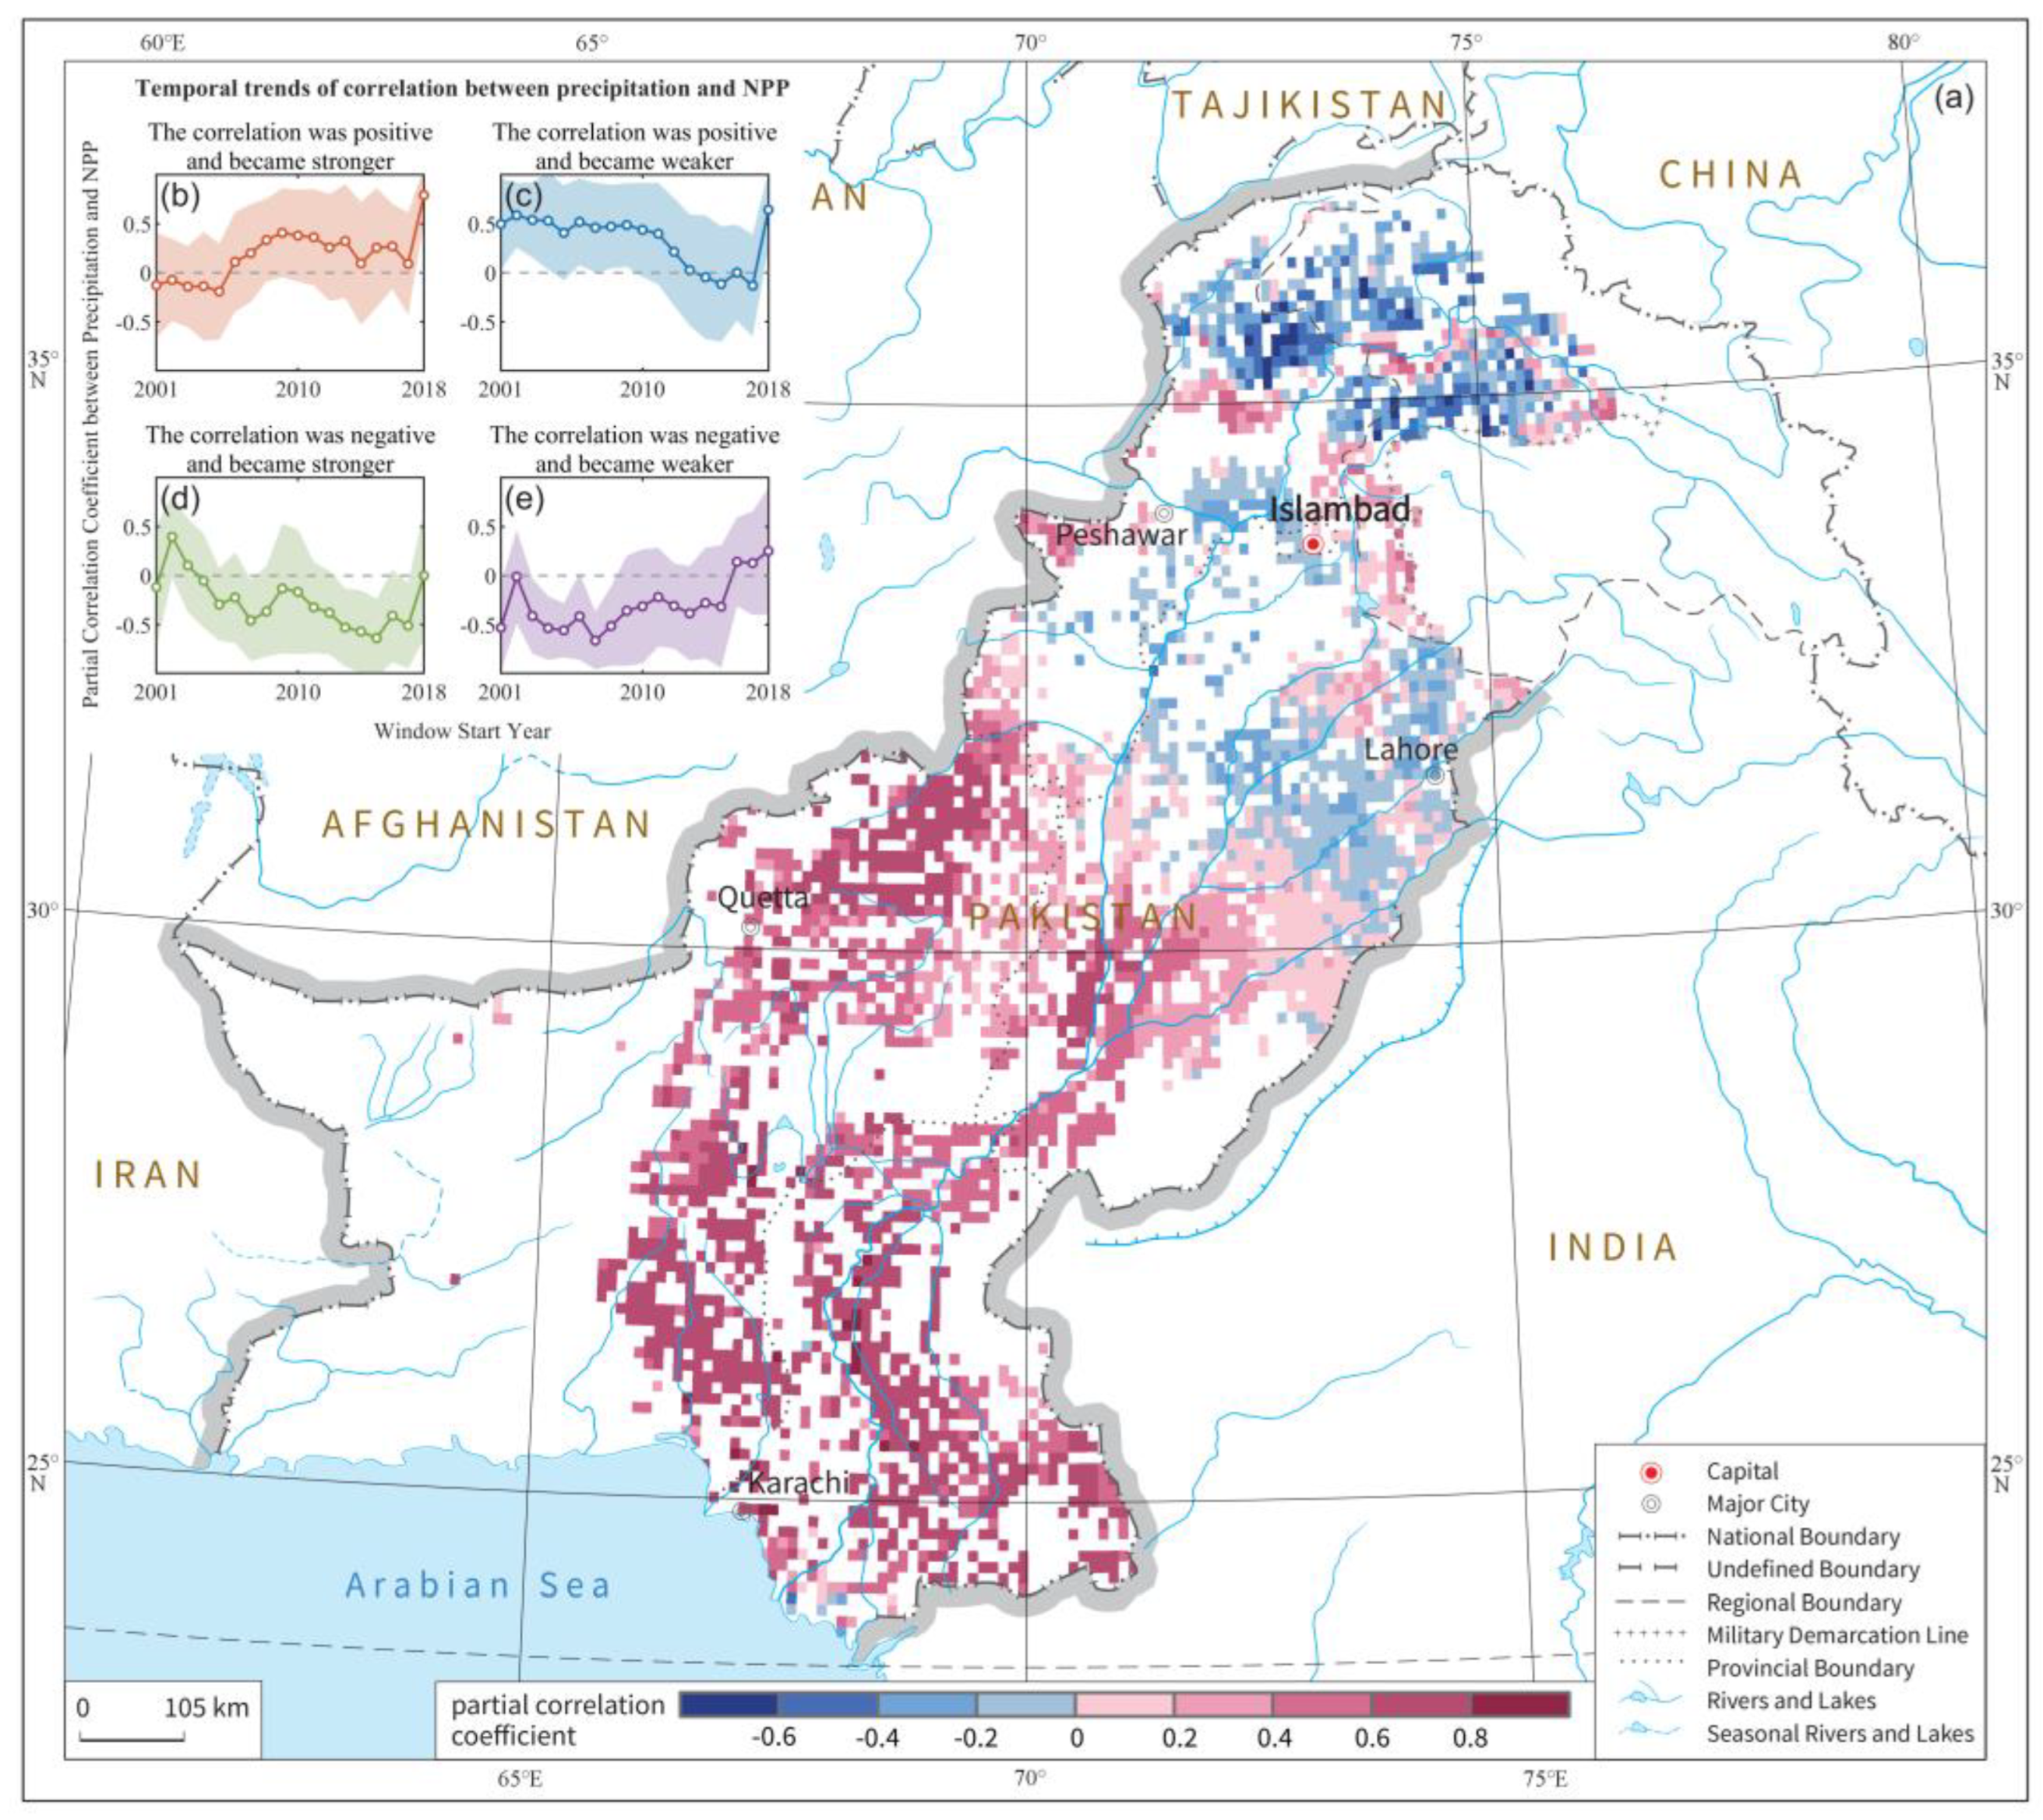
Figure 7.
Regional differentiation of the responses of vegetation productivity to temperature and precipitation from 2001 to 2022.
Figure 7.
Regional differentiation of the responses of vegetation productivity to temperature and precipitation from 2001 to 2022.
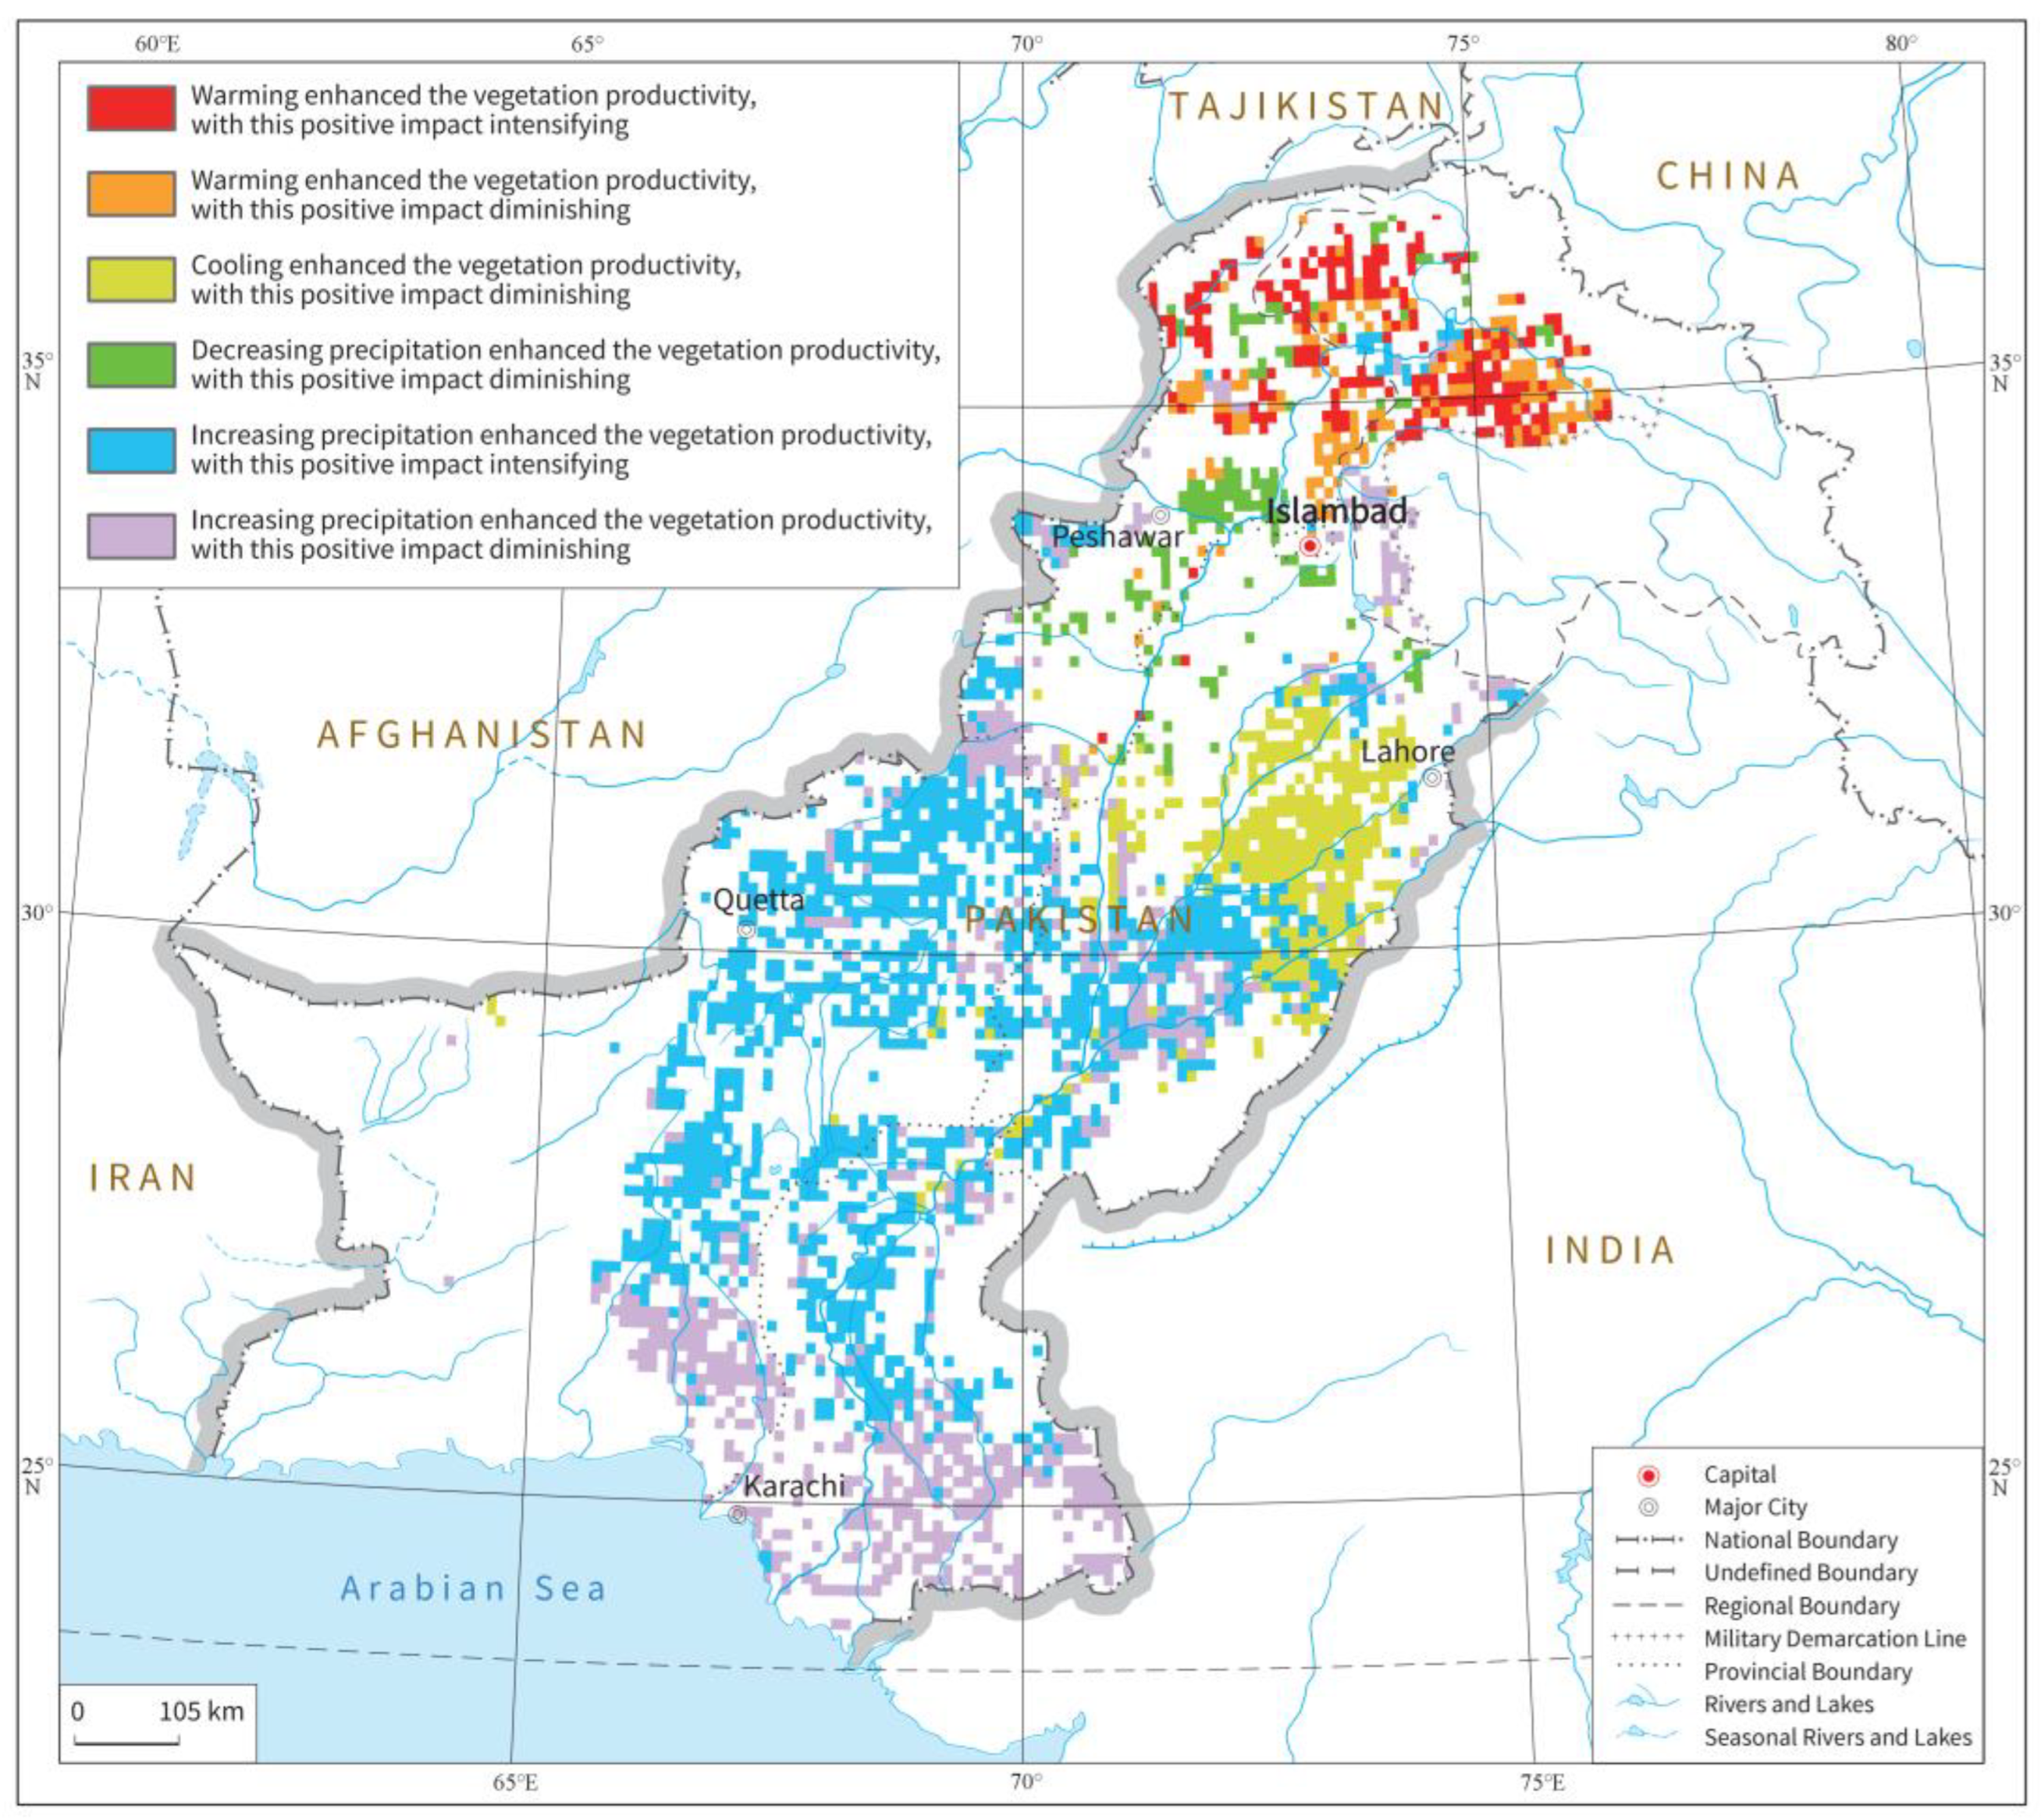

Table 1.
Method for classifying the impacts of climate change on vegetation productivity.
| Main Climatic driver | Classification criteria | Impact category | ||
|---|---|---|---|---|
| Climatic Trend | Correlation | Trend of Correlation | ||
| Temp | > 0 | > 0 | > 0 | Warming enhanced NPP, with this positive impact intensifying |
| < 0 | Warming enhanced NPP, with this positive impact diminishing | |||
| < 0 | > 0 | Warming inhibited NPP, with this negative impact intensifying | ||
| < 0 | Warming inhibited NPP, with this negative impact diminishing | |||
| < 0 | > 0 | > 0 | Cooling inhibited NPP, with this negative impact intensifying | |
| < 0 | Cooling inhibited NPP, with this negative impact diminishing | |||
| < 0 | > 0 | Cooling enhanced NPP, with this positive impact intensifying | ||
| < 0 | Cooling enhanced NPP, with this positive impact diminishing | |||
| Prec | > 0 | > 0 | > 0 | Increasing precipitation enhanced NPP, with this positive impact intensifying |
| < 0 | Increasing precipitation enhanced NPP, with this positive impact diminishing | |||
| < 0 | > 0 | Increasing precipitation inhibited NPP, with this negative impact intensifying | ||
| < 0 | Increasing precipitation inhibited NPP, with this negative impact diminishing | |||
| < 0 | > 0 | > 0 | Decreasing precipitation inhibited NPP, with this negative impact intensifying | |
| < 0 | Decreasing precipitation inhibited NPP, with this negative impact diminishing | |||
| < 0 | > 0 | Decreasing precipitation enhanced NPP, with this positive impact intensifying | ||
| < 0 | Decreasing precipitation enhanced NPP, with this positive impact diminishing | |||
Disclaimer/Publisher’s Note: The statements, opinions and data contained in all publications are solely those of the individual author(s) and contributor(s) and not of MDPI and/or the editor(s). MDPI and/or the editor(s) disclaim responsibility for any injury to people or property resulting from any ideas, methods, instructions or products referred to in the content. |
© 2026 by the authors. Licensee MDPI, Basel, Switzerland. This article is an open access article distributed under the terms and conditions of the Creative Commons Attribution (CC BY) license (http://creativecommons.org/licenses/by/4.0/).
Copyright: This open access article is published under a Creative Commons CC BY 4.0 license, which permit the free download, distribution, and reuse, provided that the author and preprint are cited in any reuse.


