

Submitted:
22 March 2026
Posted:
24 March 2026
You are already at the latest version
Abstract
For ages, archaeologists had used shovel test grids and excavation to determine the most likely places to dig, this procedure requires a lot of work and time. In seismic hazard assessment studies, it is important to identify subsurface faults and to constrain seismic deformation parameters near surface. Ground penetrating radar (GPR) method is a nondestructive, noninvasive high-resolution geophysical mapping method favorable to picture the buried archaeological remains and delineation subsurface possible shallow walls effected by tectonic process like faults within altered environments. Processed two-dimensional radargrams were used to identify the location of some anomalies related to ancient walls. The three-dimensional model shows that the GPR anomalies are typically simpler to spot and isolate in order to make the depth and position more clear and delineate the extension of buried archaeological walls at both surveyed sites. The GPR method was able trace a possible 0.5 m deep left lateral strike slip fault affected ancient buried wall at site 2 which was impossible to mapped by 2D profiles. The inferred faultʹs direction and displacement match an exposed fault that has been mapped in the northwest corner of the western wall of the Nabataean-Roman age reservoir.
Keywords:
ground penetrating radar
; three-dimensional model
; ancient walls
; left-lateral strike fault
; Qasr el Tila
1. Introduction
In archaeological inspections, it is important to pinpoint the extent, shape, depth, and position of subsurface targets and associated stratigraphy without destructively intervening with the buried materials, with the development of technology and the need for the protection of subsurface culture heritage [9].
In addition to being exhausting and time-consuming, especially during excessively hot or cold temperatures, drilling and coring to assess wall thickness can permanently ruin older buildings [36]. Ground Penetrating Radar (GPR) is an indirect, safe, non-destructive, economical and environmentally friendly geophysical technique that offer accurate measurements for shallow subsurface site description without causing structural damage [6,24,32].
The technique provides comprehensive information on inner structures, fissures, voids, and deterioration and can locate old buried archeological sites remotely without physical disturbance [11,12,20].
The most straightforward way to unravel subsurface difficulties in the field of archaeology is by categorizing and correlating significant reflections within 2D profile (B-scans), between a few tens of centimeters and five meters below the surface [10].
Moreover, a series of 2D profiles can make up of a 3D volume (C-scans), and the data can be analyzed and visualized in time slice, in which radar reflections are mapped horizontally for archaeological applications [17,37].
The primary goal of this research is to map the locations and depth of ancient residual walls and other archaeological features. In additional GPR, survey could help to assess any evidence of buried tectonic structures like active faults have impacted the buried ancient ruins of Qasr el Tila.
1.1. Study Area
Qasrel Tila is situated about 30 km south of the Dead Sea between longitude of 35° 24’ 36” to 35° 24’ 45” east, and latitude of 30° 49’ 44” to 30° 49’ 50” west, in northern Wadi Arabah valley about 8 km south of the escarpment to Dead Sea Ghawr [3,31] (Figure 1a). Qasr el Tilah archaeological site is constructed across the seismically active Wadi Araba fault on mid-Holocene alluvial fans sediments that were deposited from Wadi el Tila approximately 6500 years ago, paleoseismological studies confirmed the existence of an active fault [15,19,31].
The location has a water reservoir with aqueducts connecting it to the nearby Wadi el Tilah and the Birkah reservoir, as well as the remnants of a fort (Caravanserai) [31] (Figure 1a).
The age of the ruins at Qasr el Tila was estimated to be predominantly Nabataean-Roman, with minor Late Byzantine occupation [22,26].
After the Roman-Byzantine era, the reservoir was no longer in use, most likely as a result of faulting brought on by a strong earthquake which may be responsible for the wide destruction in the region and in the nearby city Petra [15,35] in the year 363 AD (M>6.5, the epicenter situated in central-northern Wadi Araba [2].
Historic structures that were constructed directly on top of faults are seldom offset by one or more previous earthquakes [13,23,27,29,30]. The historical records proposed that there may have been more than one earthquake during 659/660 [18,19,35].
A significant fracture with a 1.5–2 m left-lateral offset in the northwest corner of the reservoir (Birkah) western wall is indicative of faulting after seismic rupture. [15,16,19,23,31] (Figure 1a).
In the study area because of the dry climate and slow rates of sedimentation, archaeological features are exceptionally well-maintained and near the surface, making it possible to map those using GPR and get subsurface archaeological and paleoseismic data.
Due to the presence of some Bedouin residents, land cultivation, vandalism, weathering, and earthquakes activity many of subsurface archaeological features like walls, aqueducts were severely damaged, and their locations are now unclear.
1.2. Methodology
Ground penetrating radar (GPR) is a sensing equipment that creates high-resolution pictures of an object's inside and subsurface using low-power electromagnetic waves. [5,7,10]. In order to locate the reflected waves, a GPR usually sends brief electromagnetic (EM) energy pulses in the frequency range of 100 MHz to 4 GHz into the structure being tested.
The distinguishing qualities of amplitude, continuity, configuration, and reflection patterns are essential for identifying archeological features. All of these consequences should be incorporated into the geometrical faces generated from different buried targets along the profiles being studied [11].
To display travel time against EM wave amplitude. A GPR system's receiving antenna captured the reflected energy. as an A-scan, which is a vertical 1D amplitude trace. (Figure 2a) [5,8]. Contiguous 1D amplitude traces are stitched together to provide a 2D vertical profile identified as a (B-scan) (Figure 2b), and assembling 2D profiles at a specific two-way travel time generates a 2D horizontal time-slice map identified as a C-scan (Figure 2c).
When using the GPR frequency range, the resolution and penetration depth are mostly controlled by the underlying water and clay presence, and the technique works best in regions with minimal electrical loss material [21,25].
The parameters of the soil are the dielectric constant εr and the electrical conductivity σ, the larger the dielectric contrast between the object and the host material, the higher GPR energy that reflects and therefore the easier the object is to sense [25]. Objects that have similar dielectric properties to the soil are more difficult to be distinguished.
The amount of energy is reflected at the interface between two materials with different dielectric characteristics is known as the reflection coefficient [7,34].
Equation 1 is usually used to calculate the reflected energy, also known as the Reflection Coefficient (R), which is considered as a "loss. (1) [34]
Where εr1 and εr2 the dielectric value of material 1 and material 2 respectively.
1.3. GPR Instrumentations and Data Acquisition
The GPR survey was carried out with the GSSI SIR-20 equipped with bow-tie shielded 900 and 400 MHz monostatic antennas (Geophysical Survey Systems Inc., GSSI, Nashua, NH, USA) were applied to data acquisition in the two field sites. To precisely measure distance along survey profiles, a survey wheel is attached to the 400 MHz and 900 MHz antennas [4]. Most data were recorded at a transmit rate of 50 scan/s, 512 samples/s with a 16 A/D conversion.
The investigation area is located on the outer archaeological remains of the Birkah and fort wall remains, where the ground is flat and there are no evidences for any archaeological features on the surface (Figure 1a).
A reconnaissance GPR The survey was conducted using both 900 and 400 MHz antenna to calibrate the survey wheel within the study area.
A total of eleven GPR survey lines with a total length of 175 m were set up in two sites at the study area. Both 900 and 400 MHz antennae were used at the first survey site which is located to the west of the reservoir (Birkah) where parallel unidirectional northeast-southwest profiles were collected at 2m intervals (Figure 1b). Bushes and plowing an agricultural field control the location and position of the profiles at this site.
The second site situated to the south of the Roman fort, six unidirectional east-west profiles with a total length of 30 m were collected at 1m intervals using 900MHz antenna (Figure 1c).
1.4. Data Processing
The RADAN 7 software was utilized to enhance the quality of the initial data and enable more accurate interpretation. The following is a summary of the primary processing steps: automatic gain control (AGC) is used to offset the decrease in power of the electromagnetic waves as they penetrate to depth, time-zero correction, background removal to eliminate direct air and vertical high-pass filter, low-pass filter and background removal filter.
Figure 3 a shows unfiltered radargram along profile Fort 9004 with 900 MHz. antenna. Figure 3 b depicted a recorded GPR profiles after the primary processing. The profile shows one coherent shallow reflections.


Using RADAN 7 software tools, 2D processed radargrams, depth slices (c-scans), and 3D cubes were produced for further field data evaluation and analysis. These methods create a three-dimensional cube of the surveyed area by joining all of the unique data lines that were gathered using the given coordinates [14].
By splitting certain depths, horizontal slices may reveal the soil layers, identify feature structures, and look into lateral connections.
The top of the extracted pipe close to the research region was used to calibrate the velocity according to the known depth. The calculated average near-surface velocity was 0.12 mns-1 [1].
2. Results
Firstly, an experimental 24 m length north-south GPR profile TALA14002 carried out at site 1 situated about 120 m to the west of reservoir (Birkah) and about 35 m northwest the fort (caravanserai) using 900MHz and a 400MHz antennae’s (Figure 1b).
Seven additional unidirectional 2m spaced with different lengths profiles were conducted at site 1 using both 400 and 900 MHz antennas (Figure 1c).
The 2D profile TALA14002 show a relatively uniform data at three discontinuous linear anomaly at distances 2-6, 13-18 and 20-21 with an approximate depth 0.5 m. These anomalies' depths and expansions most likely suggest a possibility of buried ancient structures.
The two hyperbolic shape shallow anomalies, the first one at distance 8 which shows high reflection may represents recent metallic object (pipe), and the second one at a distance 22.5 m which may cause by a boulder (Figure 4).
Six parallel unidirectional radar profiles using 900 MHz antenna conducted at site 2 which are located about 2 m south of the fort (caravanserai) (Figure 1c).
The main anomaly located between horizontal distance 2 and 4.5 m with approximate depth 0.45 m along Fort 9004 (Figure 5). This anomaly may represent the ancient buried city wall.
Same anomalies at the similar depth but different extensions and shifts were identified in Fort9002, Fort9003, Fort 9004 and Fort9005 profiles at site 2 (Figure 1c).
2.1. Three Dimension GPR
In order to map the scope and the general distribution of the GPR anomalies a multiple of 2D profiles can create a 3D volume (C-scans) of radar data, which can be analyzed and visualized in depth slice, in which radar reflections are mapped horizontally for archaeological applications [17,37] (Figure 6).
Horizontal depth slices with 13 cm thickness were extracted from both C-Scans, equivalent to different depths achieved via RADAN 7 [33].
Figure 7 depict depth slices at depth 0, 0.5, 0.75, and 1m at site 2, displaying both vertical and lateral variations of possible linear feature with high amplitude may characterize possible remains of buried walls signatures.
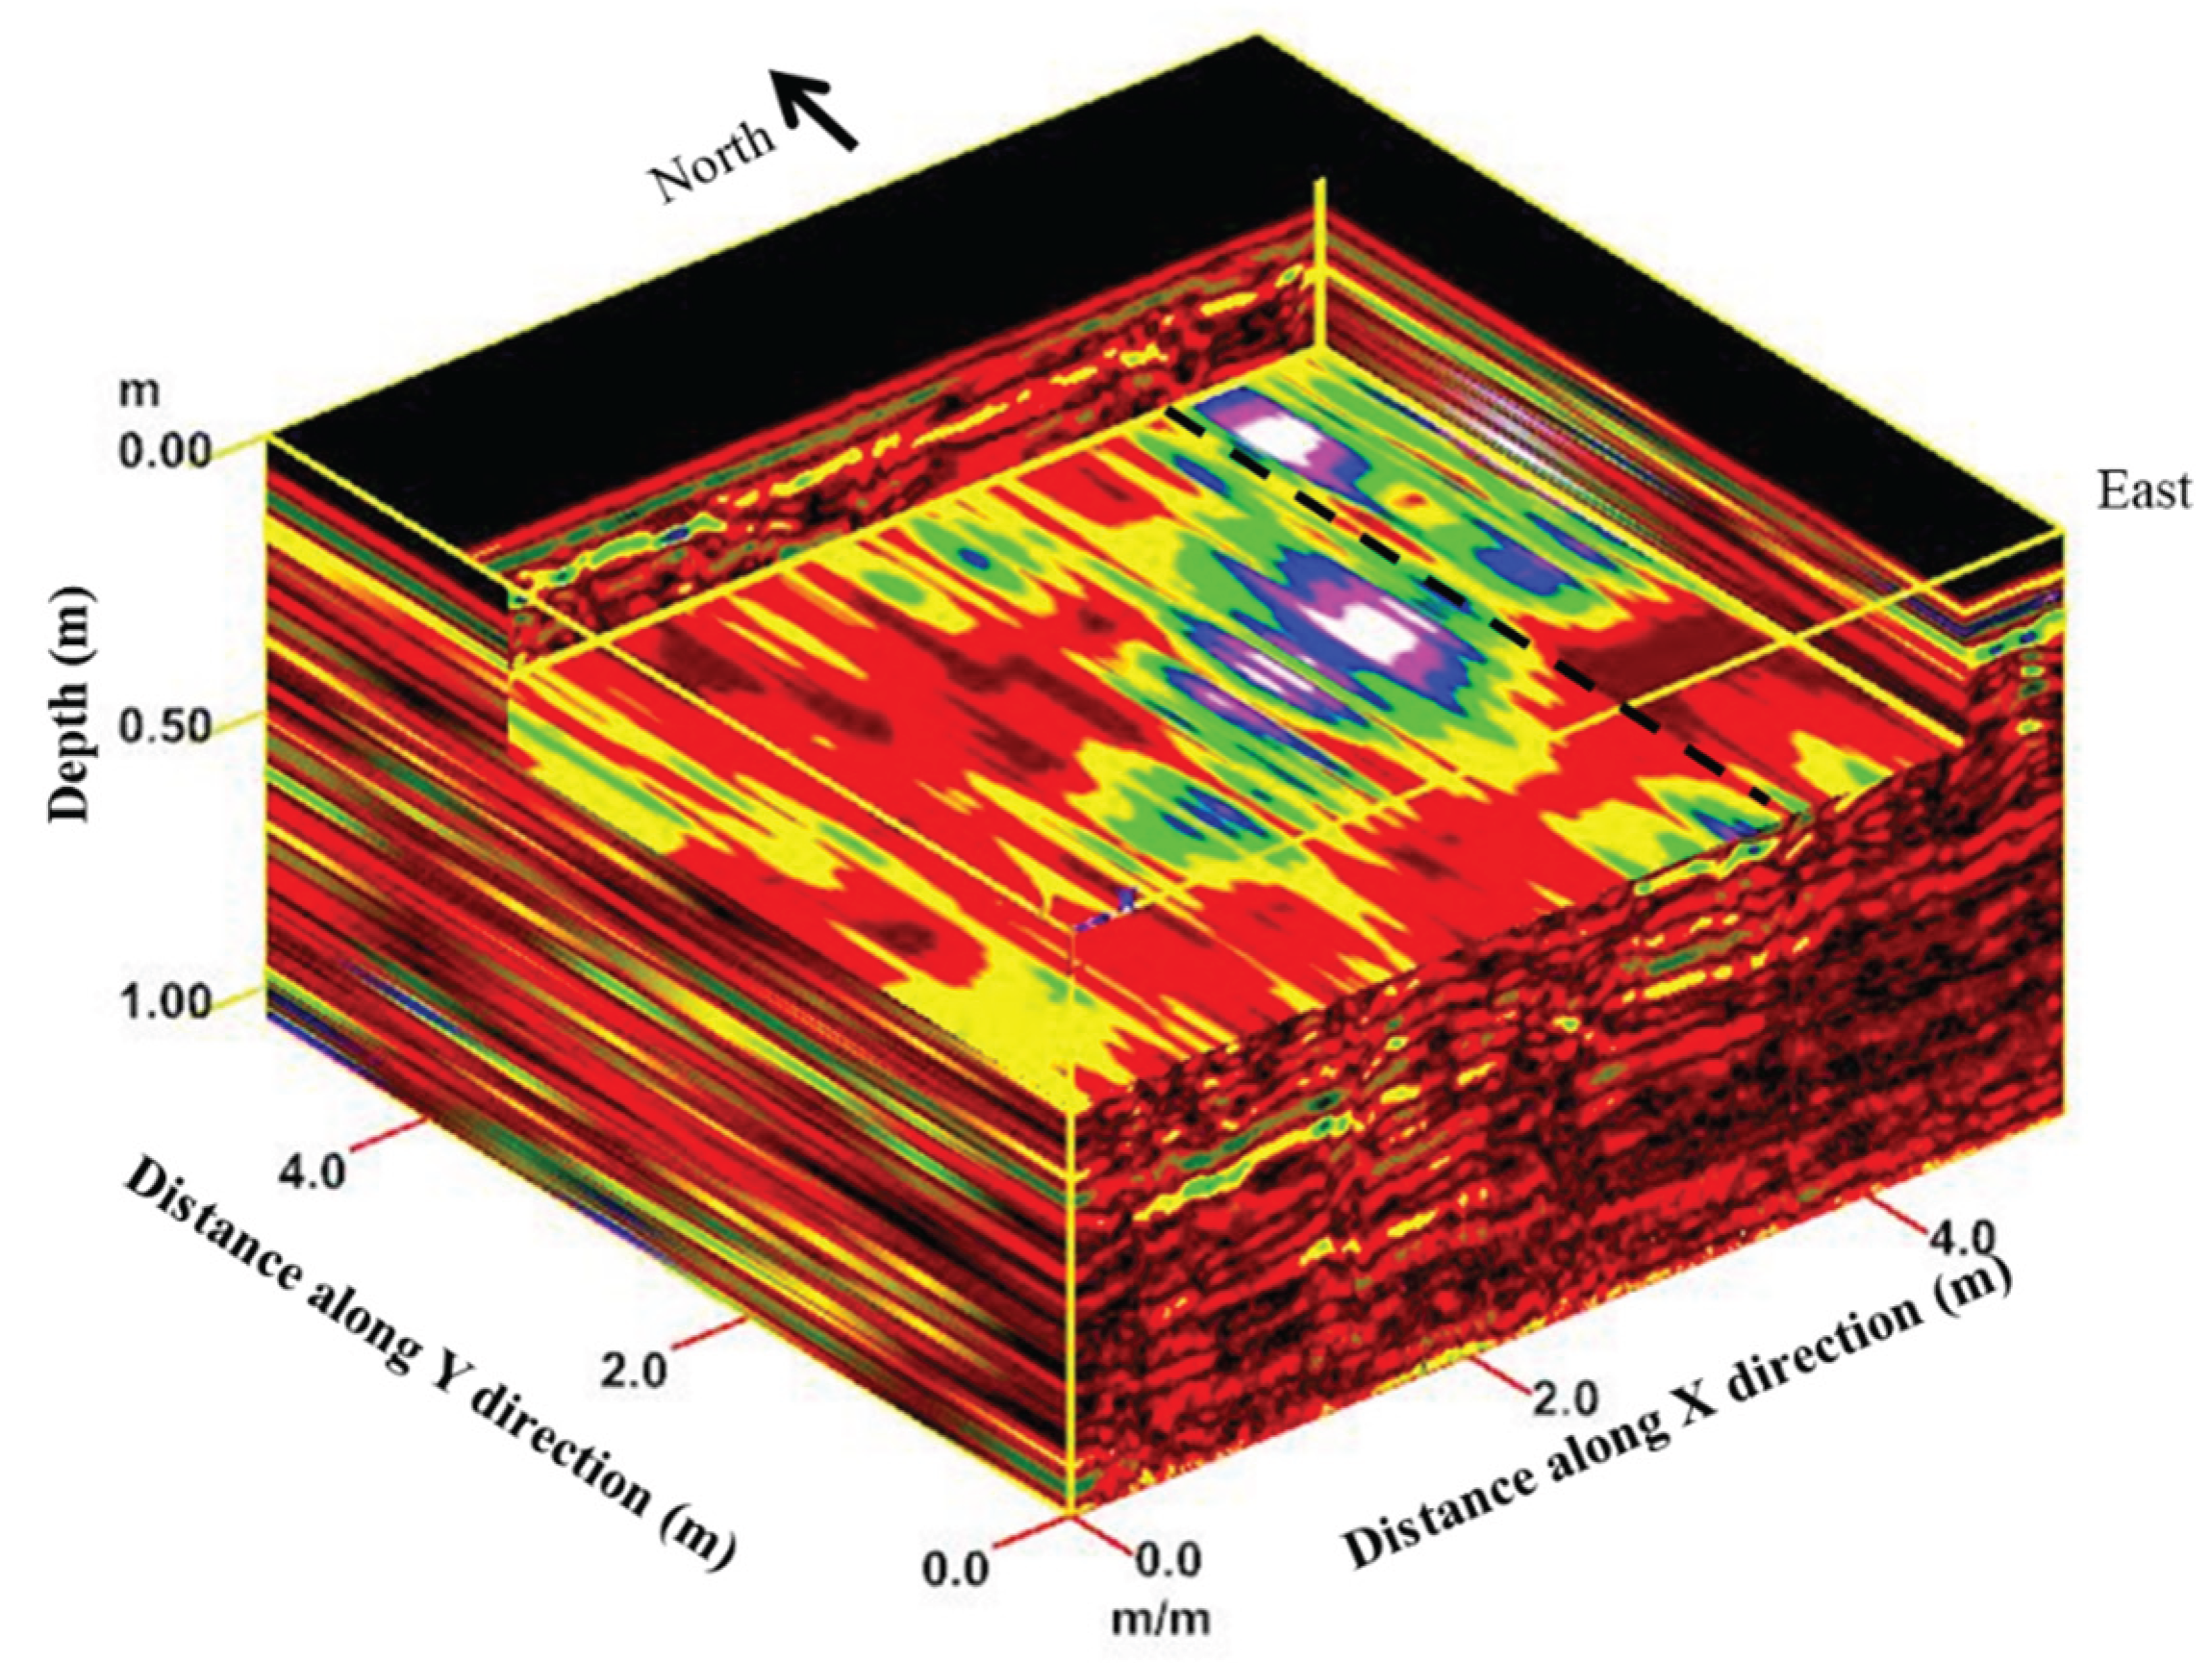
The inspection of the depth slices at depth 0, 0.4, 0.7, and 1m at site 2 revealed the presence of possible discrete ancient wall at a depth of 0.45 m, maybe there is subsurface signatures of strike slip left later fault affects the wall (Figure 8).
Figure 9 shows the 3D section (cutout cube) using distance (x) 4.5, distance (y) 0.4.0, and distance (z) 0.5 m shows clearly the extension and depth of the possible wall, the black dashed line may present left lateral fault.
The energy attribute depicted on the 0.5 m slice exposes certain possible lateral discontinuous structures that are not easily visible in the vertical section amplitude data analysis. There are significant lateral and vertical fluctuations visible in the 3D GPR sub-volume.
3. Discussion
The flat terrain of the study area with the lack of clay deposits within the dry unconsolidated eolian sand sediments allowed us to image the archaeological features at a high resolution, so both antennas give good results, but the 400MHz antenna provide less resolution and more penetration compared with 900 MHz antenna.
The 900 MHz antenna data used the mainstream of the majority of the interpretation results. Nonetheless, the 400 MHz data were very suitable to check the presence of anomalies in the study area up to 3 m of depth [33].
At both site, all of the data was obtained in unidirectional way along the northeast-southwest and west-east directions, respectively, at a distance of two meters. Archeological features must be identified using the distinctive qualities of reflection patterns, amplitude, continuity and configuration. The geometrical aspects created from numerous buried material throughout the profiles under examination should be combined in light of all these implications [12].
Several 0.5 meter deep GPR anomalies like possible buried ancient walls expected archaeological sources and manmade recent objects like pipe were mapped at site 1 located north-west the Roman fort. Other isolated hyperbolas along some profiles at site 1 may be stones from the destruction of the ancient walls.
According to the GPR data, the tectonic activity and the presence of several Bedouin groups that plow and farm this land throughout specific seasons of the year are the reasons why the wall remains are not well-preserved.
4. Conclusion
Among all the modern geophysical techniques, ground-penetrating radar (GPR) is particularly helpful for remotely and non-destructively assessing archaeological sites.
The presence of sand and the good electrical property differences between stone walls and host material helps to detect anomalous zones.
Under challenging subsurface environments, GPR processing can improve the imaging and characterization of archeological structures. Archeological features must be mapped using the distinctive qualities of reflection and diffractions patterns, continuity, amplitude and configuration
GPR gives detailed information about diffraction patterns in the shallow stratigraphy with a high resolution. The results of geophysical surveys of archaeological sites are generally present graphically. Hyperbolic with irregular in site 1 may be from scattered stones while the hyperbolic with regular high reflections may be due to the manmade metal pipe.
The results provided an image of the subsurface structure with precise location and depth of targets like metallic pipe, boulders and buried walls.
A strike slip fault signature could be difficult to be interpreted in B-scan (2D) GPR profiles, the C-scan (3D) 3D profiles produced from two dimensions provide more ample view of the deformation zones and better images of possible shallow lift lateral strike subsurface fault mainly trend in the south west-north east direction hit existing wall at site 2.
Horizontal depth slices are able to separate specific depths to depict the soil layers and examine the real feature forms and lateral connections.
Acknowledgments
We would like to express our thanks to Professor Mohammed Rasoul Al-Haddidi Dean of Faculty of Engineering and Dr. Ahmad Al-Khodour chair of Civil Engineering Department for their support. We are also grateful to the crews of the Al-Balqa Applied University Eng. Hisham Awamleh, Yousef Al-Faory for their assistance throughout radar data acquisition and processing. We are grateful to the editor and the anonymous reviewers for their helpful comments and recommendations on this work.
References
- Abueladas, A.A. Use of GPR for Imaging Subsurface Archaeological Remains in the Islamic City of Ayla, Aqaba, Jordan. JJEES 2020, 12, 12–17. [Google Scholar]
- Abou Karaki, N.M. Synthèse et carte sismotechonique des pays de la bordure orientale de la Méditerranée: sismicité du système de failles du Jourdain–Mer Morte. PhD dissertation, University of Strasbourg, 1987; p. 417. [Google Scholar]
- Allison, A. Paleoseismology and Archaeoseismology along the Southern Dead Sea Transform in Wadi 'Arabah Near the municipality of Aqaba, Jordan. UMKC Dissertation, 2013. [Google Scholar]
- Al-Ruzouq, R.; Abu Dabous, S.; Abueladas, A.; Hosny, F.; Ibrahim, F. Integrated Archaeological Modeling Based on Geomatics Techniques and Ground-Penetrating Radar. Remote Sensing 2022, 14, 1–23. [Google Scholar] [CrossRef]
- Annan, A. P. Electromagnetic Principles of Ground Penetrating Radar. In Ground penetrating radar: Theory and applications; Jol, H. M., Ed.; Elsevier, 2009; pp. 3–40. [Google Scholar] [CrossRef]
- Cariou, E.; Baltzer, A.; Leparoux, D.; Ledoyen, J.; Debaine, F. Ground penetrating radar in the medieval oyster shell middens of Saint-Michel-en-l'Herm (Vendée, France). Journal of Archaeological Science 2018, 18, 186–196. [Google Scholar] [CrossRef]
- Conyers, L.B. Analysis and interpretation of GPR datasets for integrated archaeological mapping. Near Surf. Geophysics. 2015, 13, 645–651. [Google Scholar] [CrossRef]
- Conyers, L.B. Ground-Penetrating Radar for Archaeology; AltaMira Press: Walnut Creek, CA, USA, 2004. [Google Scholar]
- Conyers, L.B. Ground Penetrating radar; Willey Online Library, 2002. [Google Scholar] [CrossRef]
- Davis, J.L.; Annan, A.P. Ground-penetrating radar for high resolution mapping of soil and rock stratigraphy. Geophys. Prospect. 1989, 37, 531–551. [Google Scholar] [CrossRef]
- Ebraheem, O.; Ibrahim, H.; Zalat, M.M. Revealing the past of Ginah archaeological site by enhancing GPR images to understand ancient periods at Kharga Oasis, Egypt. Scientific Reports 2025, 2025, 1526478. [Google Scholar] [CrossRef]
- Ebraheem, M.O.; Ibrahim, H.A. Contributions of ground-penetrating radar in research of some predynastic and dynastic archaeological sites at the eastern and western banks of the River Nile, Assiut, Egypt. Archaeol. Prospect 2021, 28, 1–13. [Google Scholar] [CrossRef]
- Ellenblum, R.; Marco, S.; Agnon, A.; Rockwell, T.; Boas, A. Crusader castle torn apart by earthquake at dawn, 20 May 1202. Geology 1998, 26, 303–306. [Google Scholar] [CrossRef]
- Frid, M.; Frid, V. Vital Views into Drone-Based GPR Application: Precise Mapping of Soil-to-Rock Boundaries and Ground Water Level for Foundation Engineering and Site-Specific Response. Appl. Sci. 2024, 14, 3–16. [Google Scholar] [CrossRef]
- Galli, P.A.; Galadini, F. Surface faulting of archaeological relics. A review of case histories from the Dead Sea to the Alps. Tectonophysics 2001, 335, 291–312. [Google Scholar] [CrossRef]
- Galli, P.A. Archaeoseismological evidence of historical activity of the Wadi Araba–Jordan valley transform fault. II Quaternario, Italian Journal of Quaternary Sciences 1997, 10, 401–406. [Google Scholar]
- Goodman, D.; Nishimura, Y.; Rogers, J.D. GPR time-slices in archaeological prospection. Archaeological Prospection 1995, 2, 85–89. [Google Scholar] [CrossRef]
- Guidoboni, E.; Comastri, A. Catalogue of earthquakes and tsunamis in the Mediterranean area from the 11th to the 15th century; Istituto Nazionale di Geofisica e Vulcanologia: Rome, Italy, 2005; p. 1036. [Google Scholar]
- Haynes, J.; Niemi, T.; Atallah, M. Evidence for ground-rupturing earthquakes on the Northern Wadi Araba fault at the archaeological site of Qasr Tilah, Dead Sea Transform fault system, Jordan. J Seismol 2006, 10, 415–430. [Google Scholar] [CrossRef]
- Ibrahim, H.A.; Ebraheem, M.O. Ground Penetrating Radar (GPR) Reflections and their Archaeological Significances on two Ancient Necropolis Tombs, Kharga Oasis, Egypt. Eur. Assoc. Geosci. Eng. Near Surf. Geophys 2020, 18, 713–728. [Google Scholar] [CrossRef]
- Jol, H.M. Ground Penetrating Radar: Theory and Applications, 1st ed.; Elsevier Science: Amsterdam, the Netherlands, 2008. [Google Scholar]
- Khouri, R. The antiquities of the Jordan Rift Valley; Al Kutba, Amman, 1988. [Google Scholar]
- Klinger, Y; Avouac, J.P.; Dorbath, L.; Abou Karaki, N.M. Seismic behaviour of the Dead Sea fault along Araba Valley, Jordan. Geophys J Int 2000, 142769–782. [Google Scholar] [CrossRef]
- Lanzarone, P.; Seidel, M.; Brandt, S.; Garrison, E.; Fisher, E.C. Ground-penetrating radar and electrical resistivity tomography reveal a deep stratigraphic sequence at Mochena Borago Rockshelter, southwestern Ethiopia. Journal of Archaeological Science: Reports 2019, 26, 101915. [Google Scholar] [CrossRef]
- Linck, R.; Kale, M.; Stele, A. Testing the Applicability of Drone-Based Ground-Penetrating Radar for Archaeological Prospection. Remote sensing 2025, 17, 1498. [Google Scholar] [CrossRef]
- MacDonald, B. The southern Ghors and northeast ‘Arabah archaeological survey. In Sheffield Archaeological Monographs no. 5, Sheffield, UK; J.R. Collis, University of Sheffield, 1992; p. 290. [Google Scholar]
- Marco, S.; Agnon, A.; Ellenblum, R.; Eidelman, A.; Basson, U.; Boas, A. 817-year-old walls offset sinistrally 2.1 m by the Dead Sea Transform, Israel. J Geodyn 1997, 24, 11–20. [Google Scholar] [CrossRef]
- Martin, J.; Everett, M. A methodology for the self-training and self-assessing of new GPR practitioners: Measuring diagnostic proficiency illustrated by a case study of a historic African-American cemetery for unmarked graves. Archaeological Prospection 2023, 30, 311–325. [Google Scholar] [CrossRef]
- Meghraoui, M.; Gomez, F.; Sbeinati, R.; Van der Woerd, J.; Mouty, M.; Darkal, A.N.; Radwan, Y.; Layyous, I.; Al Najjar, H.; Darawcheh, R.; Hijazi, F.; Al-Ghazzi, R.; Barazangi, M. Evidence for 830 years of seismic quiescence from, and historical seismicity along the Dead Sea fault in Syria. Earth Planet Sci Lett 2003, 210, 35–52. [Google Scholar] [CrossRef]
- Niemi, T.M.; Atallah, M. Offset of the Early Islamic ruins of Qasr Tilah along the Wadi Araba fault, Dead Sea Transform, Jordan (abst.): Annual Meeting, GSA. Abstr. Programs . 2000; 32, pp. A–443. [Google Scholar]
- Niemi, T.M.; Rucker, J.D. Evidence of Nabataean Occupation at Qaser At-Tilah in the Northern ‘Arabah Valley from Exposures in Wadi At-Tilah. In Annual of the Department of Antiquities of Jordan; 2009; p. V. 53. [Google Scholar]
- Ramkumar, M.; Kumaraswamy, K.; Balasubramani, K.; Abdul Rahaman, S.; Jegankumar, R.; Kumara Ganesh, U.; Sivakumar, P. Discovery of buried historical structures in the Kaveri–Kollidam interfluve, southern India. Archaeological Prospection 2019, 26, 73–88. [Google Scholar] [CrossRef]
- Ristić, A.; Govedarica, M.; Pajewski, L.; Vrtunski, M.; Bugarinović, Z. Using Ground Penetrating Radar to Reveal Hidden Archaeology: The Case Study of the Württemberg-Stambol Gate in Belgrade (Serbia). Sensors 2020, 20, 1–20. [Google Scholar] [CrossRef] [PubMed]
- Reynolds, J.M. An Introduction to Applied and Environmental Geophysics, 1st ed.; John Wiley & Sons Ltd.: Chichester, UK, 1997; p. pp. 150. [Google Scholar]
- Russell, K.W. The earthquake chronology of Palestine and Northwest Arabia from the 2nd through the mid-8th century A.D. Bull Am Sch Orient Res 1985, 260, 37–59. [Google Scholar] [CrossRef]
- Parnow, S.; Ciampoli, L.; Uzor1, S; Cox, P.; Loreti, E.; Ten, A.; Benedetto, A.; Tosti1, F. Roman stone masonry walls: The application of Ground Penetrating Radar to ancient structures. 2024 11th International Conference on Civil and Urban Engineering (ICCUE 2024) E3S Web of Conferences 2024, 579, 01003. [Google Scholar] [CrossRef]
- Zhao, W.; Tian, G.; Wang, B.; Forte, E.; Pipan, M.; Lin, J.; Shi, Z.; Li, X. 2D and 3D imaging of a buried prehistoric canoe using GPR attributes: a case study. Near Surface Geophysics. V. 2013, 457–464. [Google Scholar] [CrossRef]
Figure 1.
a) Location map of the study area include site plan map of some structures at of Qasr et Tila site (reservoir (Birkah), Roman fort and Wadi Araba Fault [31]. b) Location of GPR profiles at site 1. c) Location of GPR profiles at site 2.
Figure 1.
a) Location map of the study area include site plan map of some structures at of Qasr et Tila site (reservoir (Birkah), Roman fort and Wadi Araba Fault [31]. b) Location of GPR profiles at site 1. c) Location of GPR profiles at site 2.
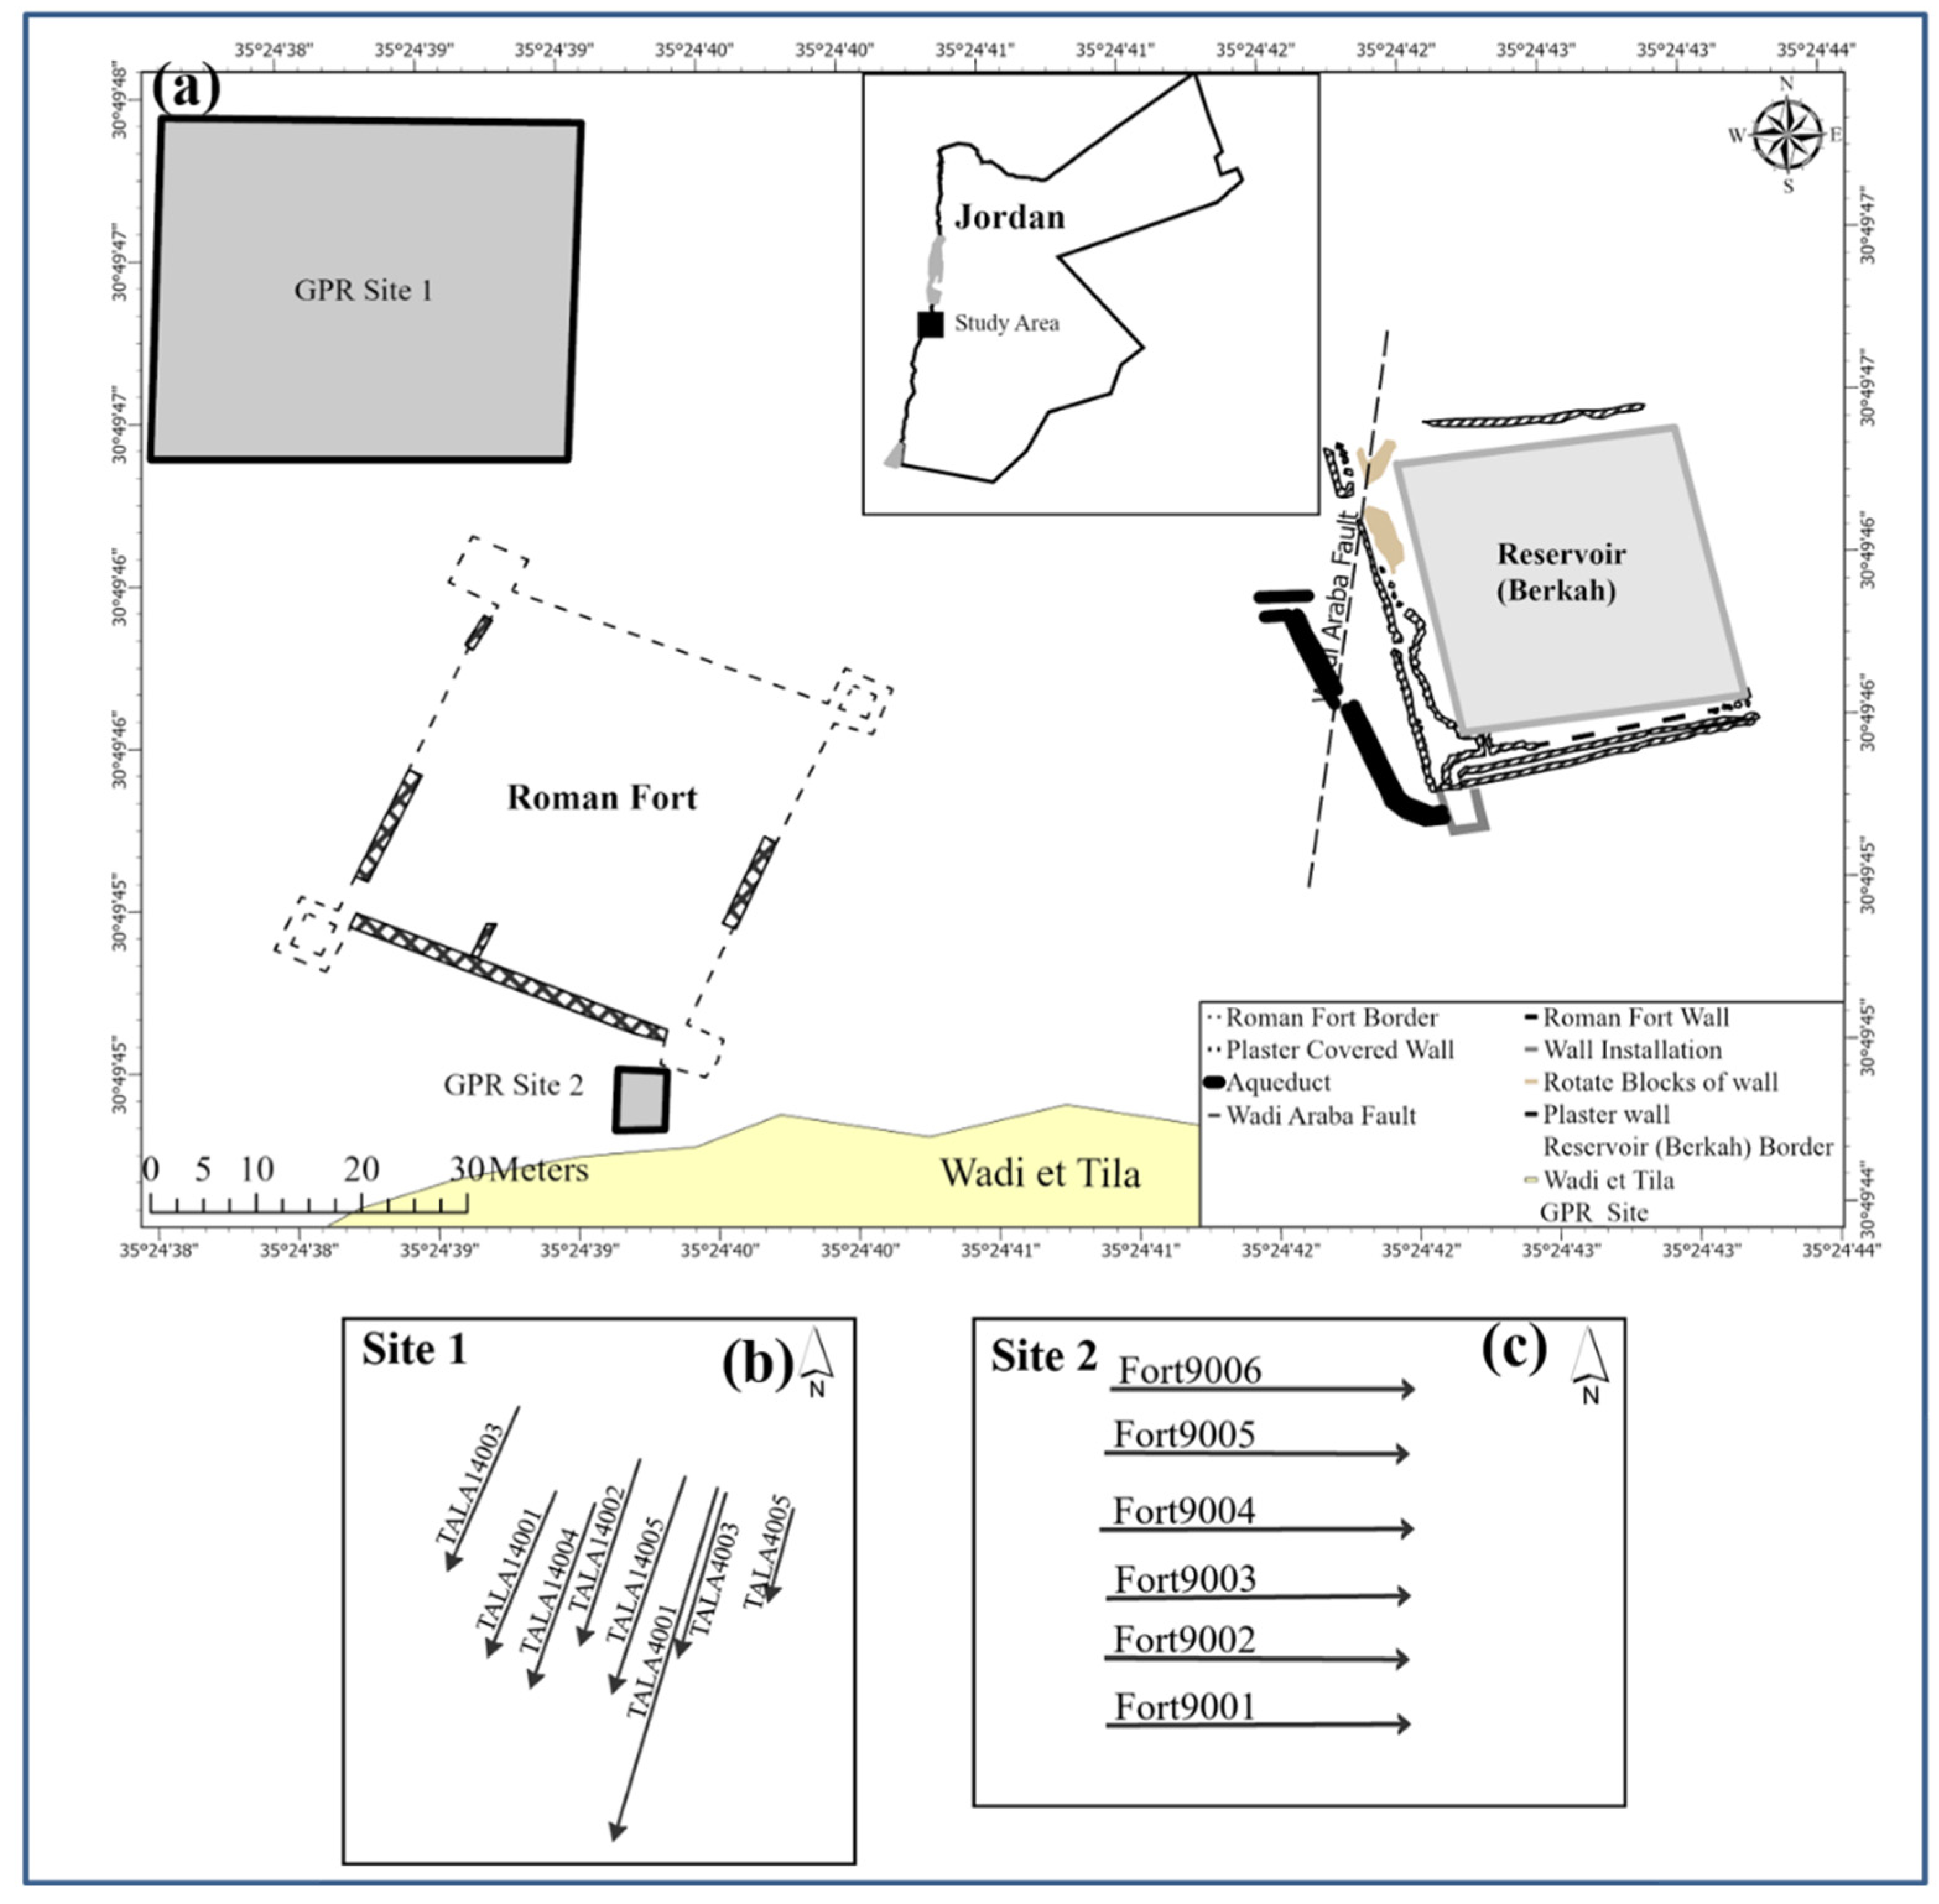
Figure 2.
Principles of ground penetrating radar (GPR). (a) A-scans displayed varying amplitude with depth (vertical) or time. (b) B-scan, commonly referred to as "transects" or "plan view," represents a vertical 2D cross-section of stitched together A-scans [28]. (c) scan, often referred to as "depth slices" or "time slices," is a horizontal 2D cross-section of interpolated B-scans, which is subtracted from a 3D section [28].
Figure 2.
Principles of ground penetrating radar (GPR). (a) A-scans displayed varying amplitude with depth (vertical) or time. (b) B-scan, commonly referred to as "transects" or "plan view," represents a vertical 2D cross-section of stitched together A-scans [28]. (c) scan, often referred to as "depth slices" or "time slices," is a horizontal 2D cross-section of interpolated B-scans, which is subtracted from a 3D section [28].
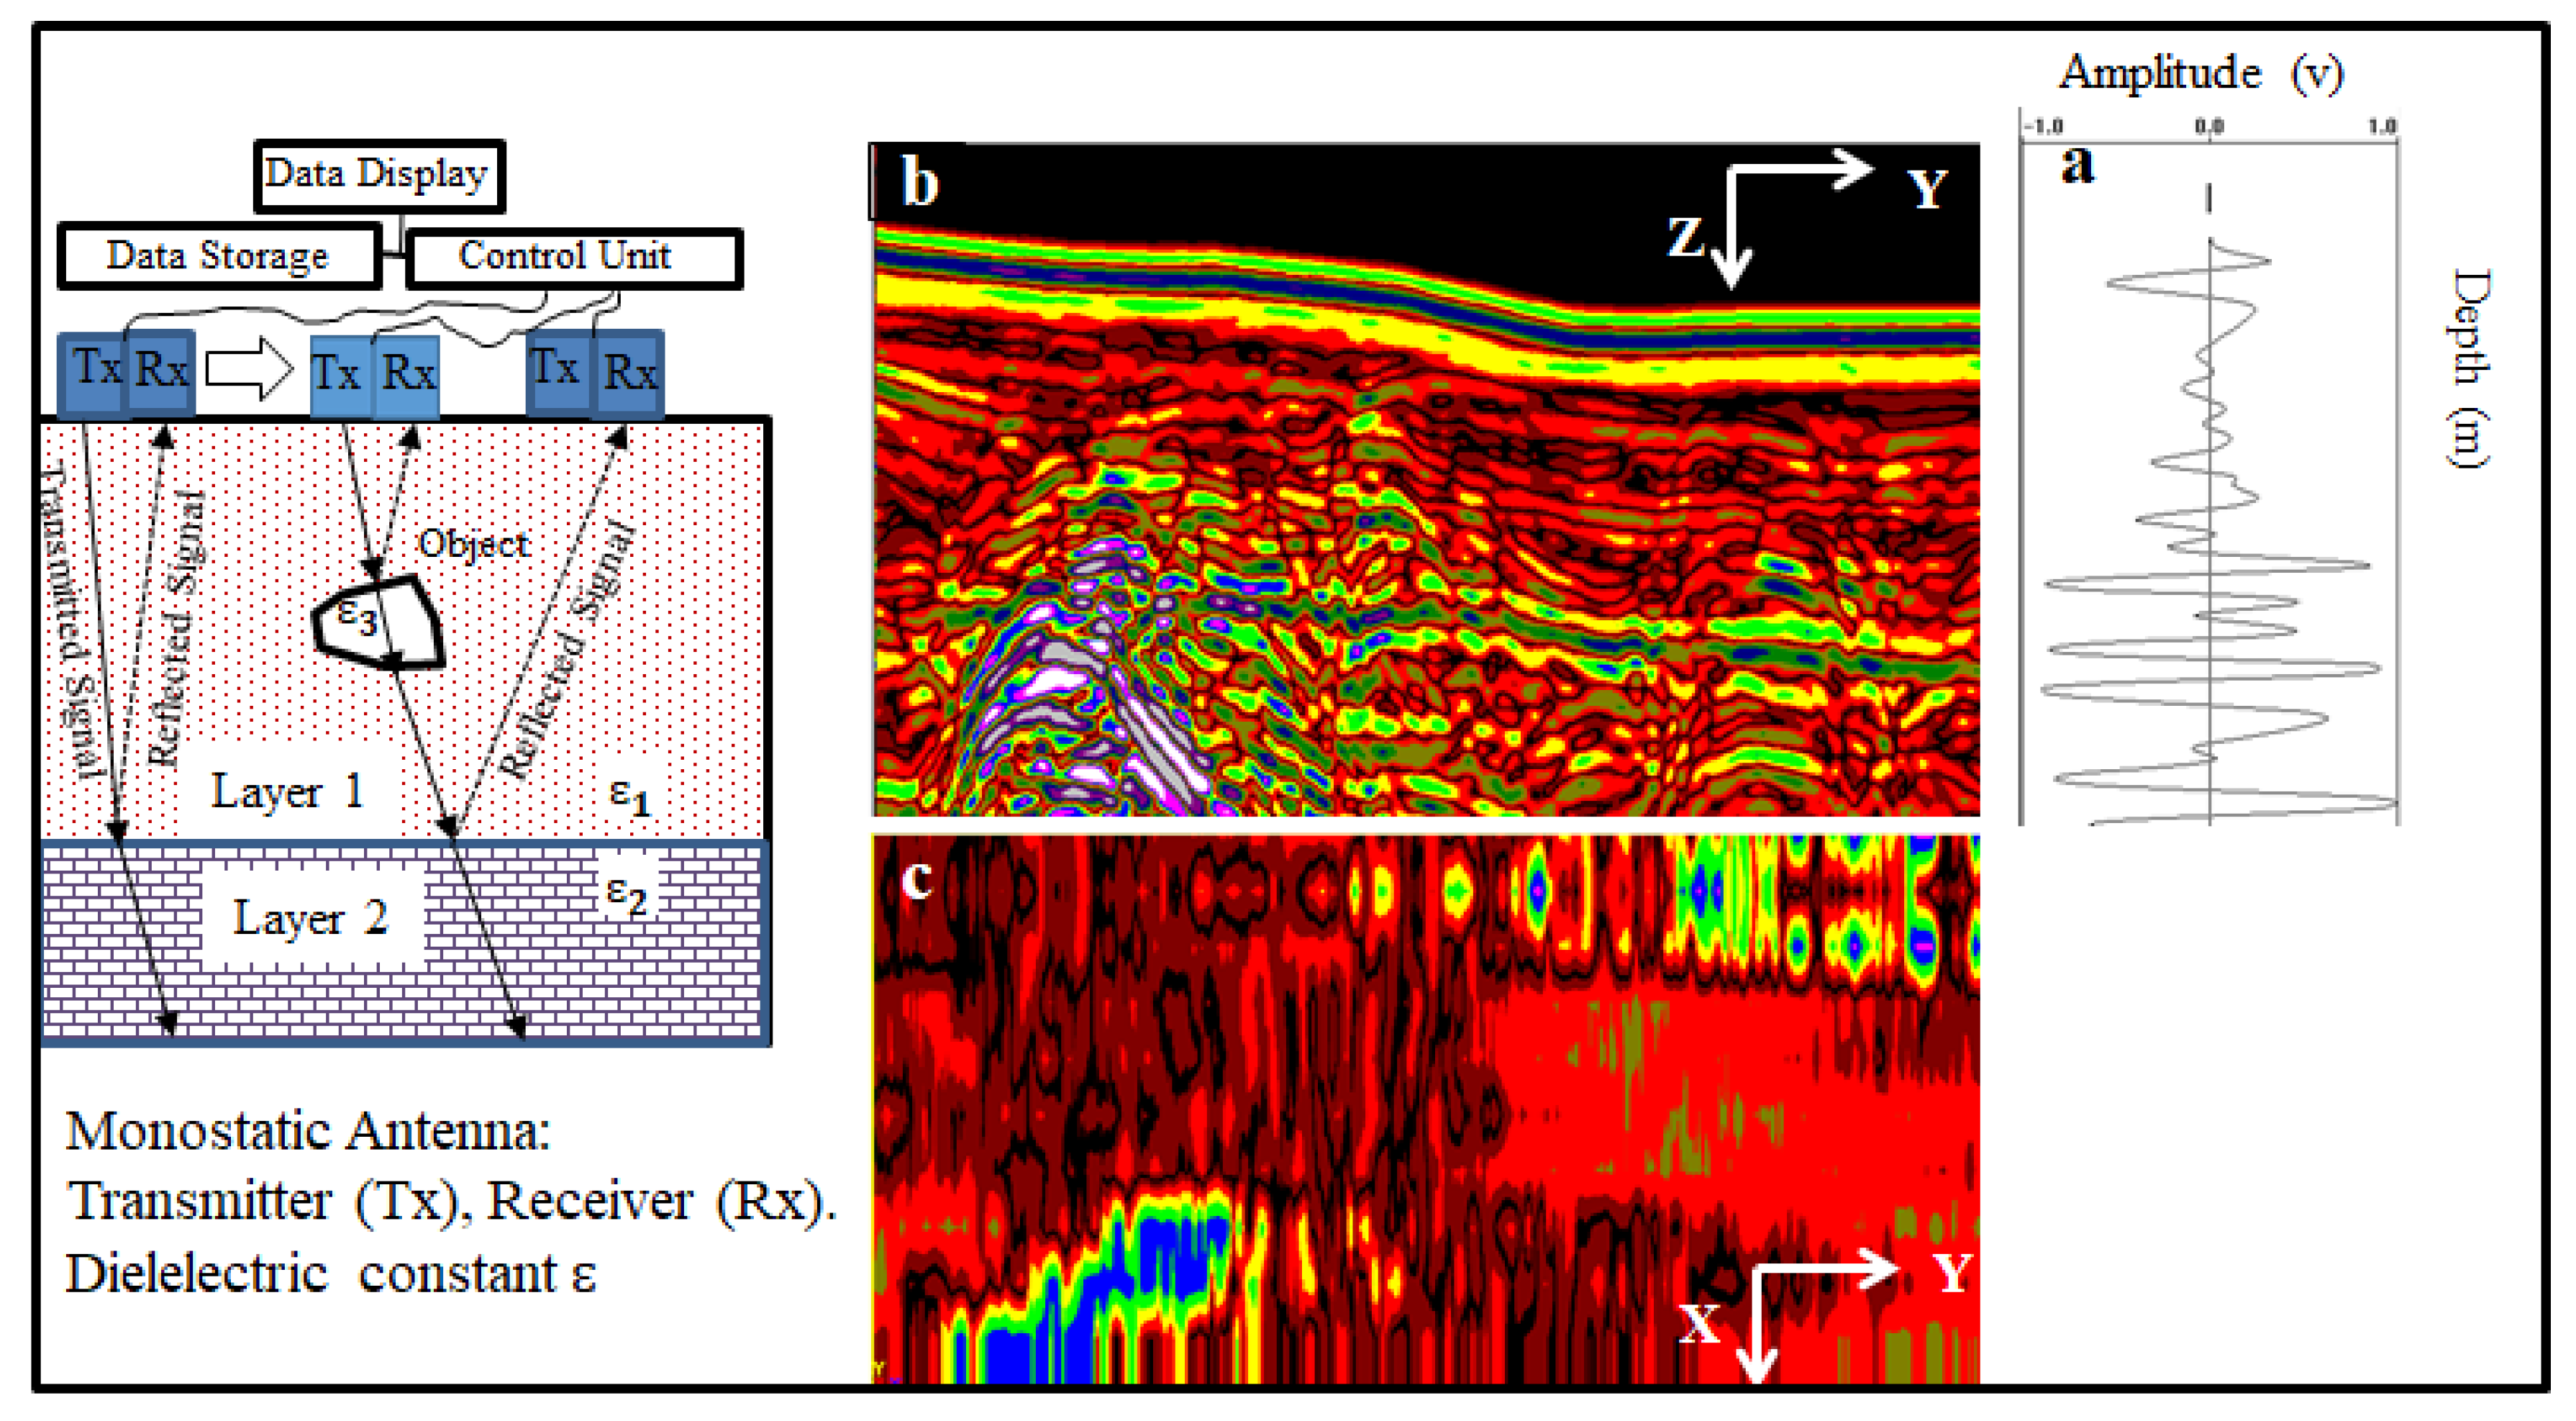
Figure 3.
a) A 900MHz antenna unfiltered radargram along profile Fort 9004. b) The processed GPR profile Fort 9004 radargram after applying vertical high-pass filter, low-pass filter and background removal filters. The strong amplitude change between 2m and 4.5m, depth 0.45 m can be identified as the buried ancient wall.
Figure 3.
a) A 900MHz antenna unfiltered radargram along profile Fort 9004. b) The processed GPR profile Fort 9004 radargram after applying vertical high-pass filter, low-pass filter and background removal filters. The strong amplitude change between 2m and 4.5m, depth 0.45 m can be identified as the buried ancient wall.
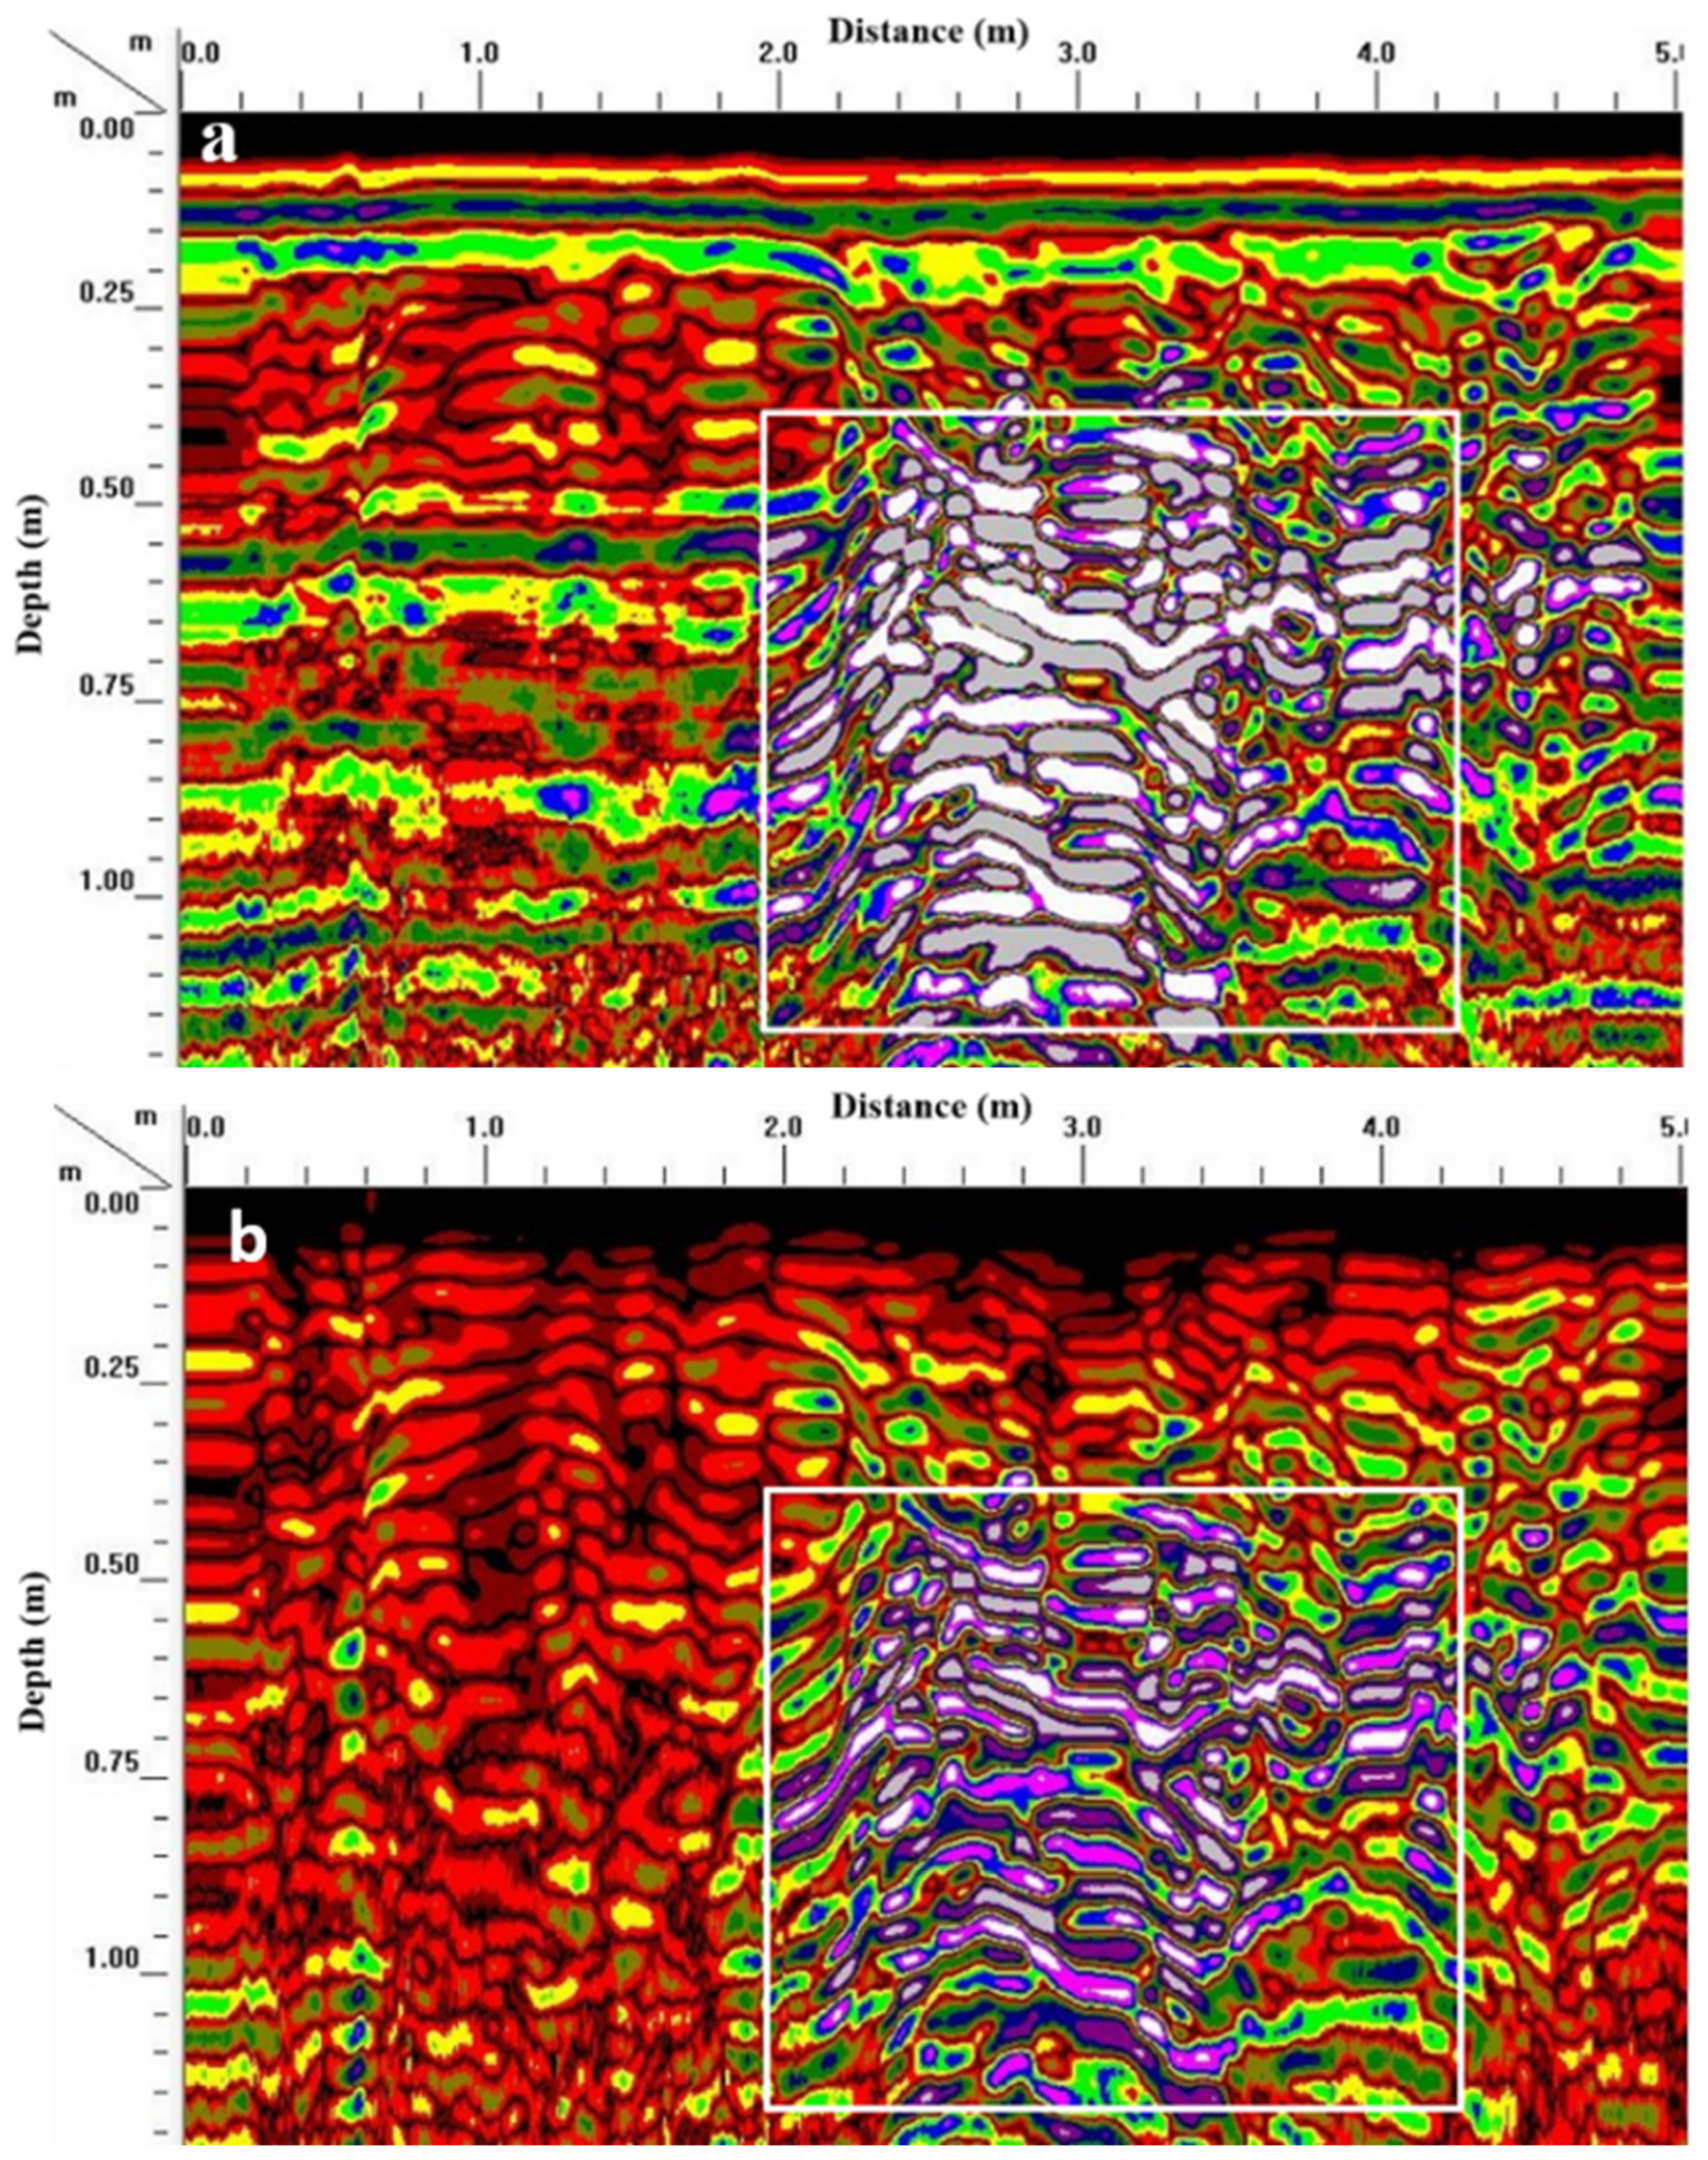
Figure 4.
A 400MHz antenna along profile TALA14002. The profile shows three discontinuous linear anomaly at distances 2-6, 13-18 and 20-21 at an estimated depth of 0.5 m that are may be buried ancient wall (white rectangles). The diffraction hyperbolic-shaped anomalies at distance 8 and 22.5 m may be produced by shallow metallic objectives and a boulder respectively (white rectangles).
Figure 4.
A 400MHz antenna along profile TALA14002. The profile shows three discontinuous linear anomaly at distances 2-6, 13-18 and 20-21 at an estimated depth of 0.5 m that are may be buried ancient wall (white rectangles). The diffraction hyperbolic-shaped anomalies at distance 8 and 22.5 m may be produced by shallow metallic objectives and a boulder respectively (white rectangles).
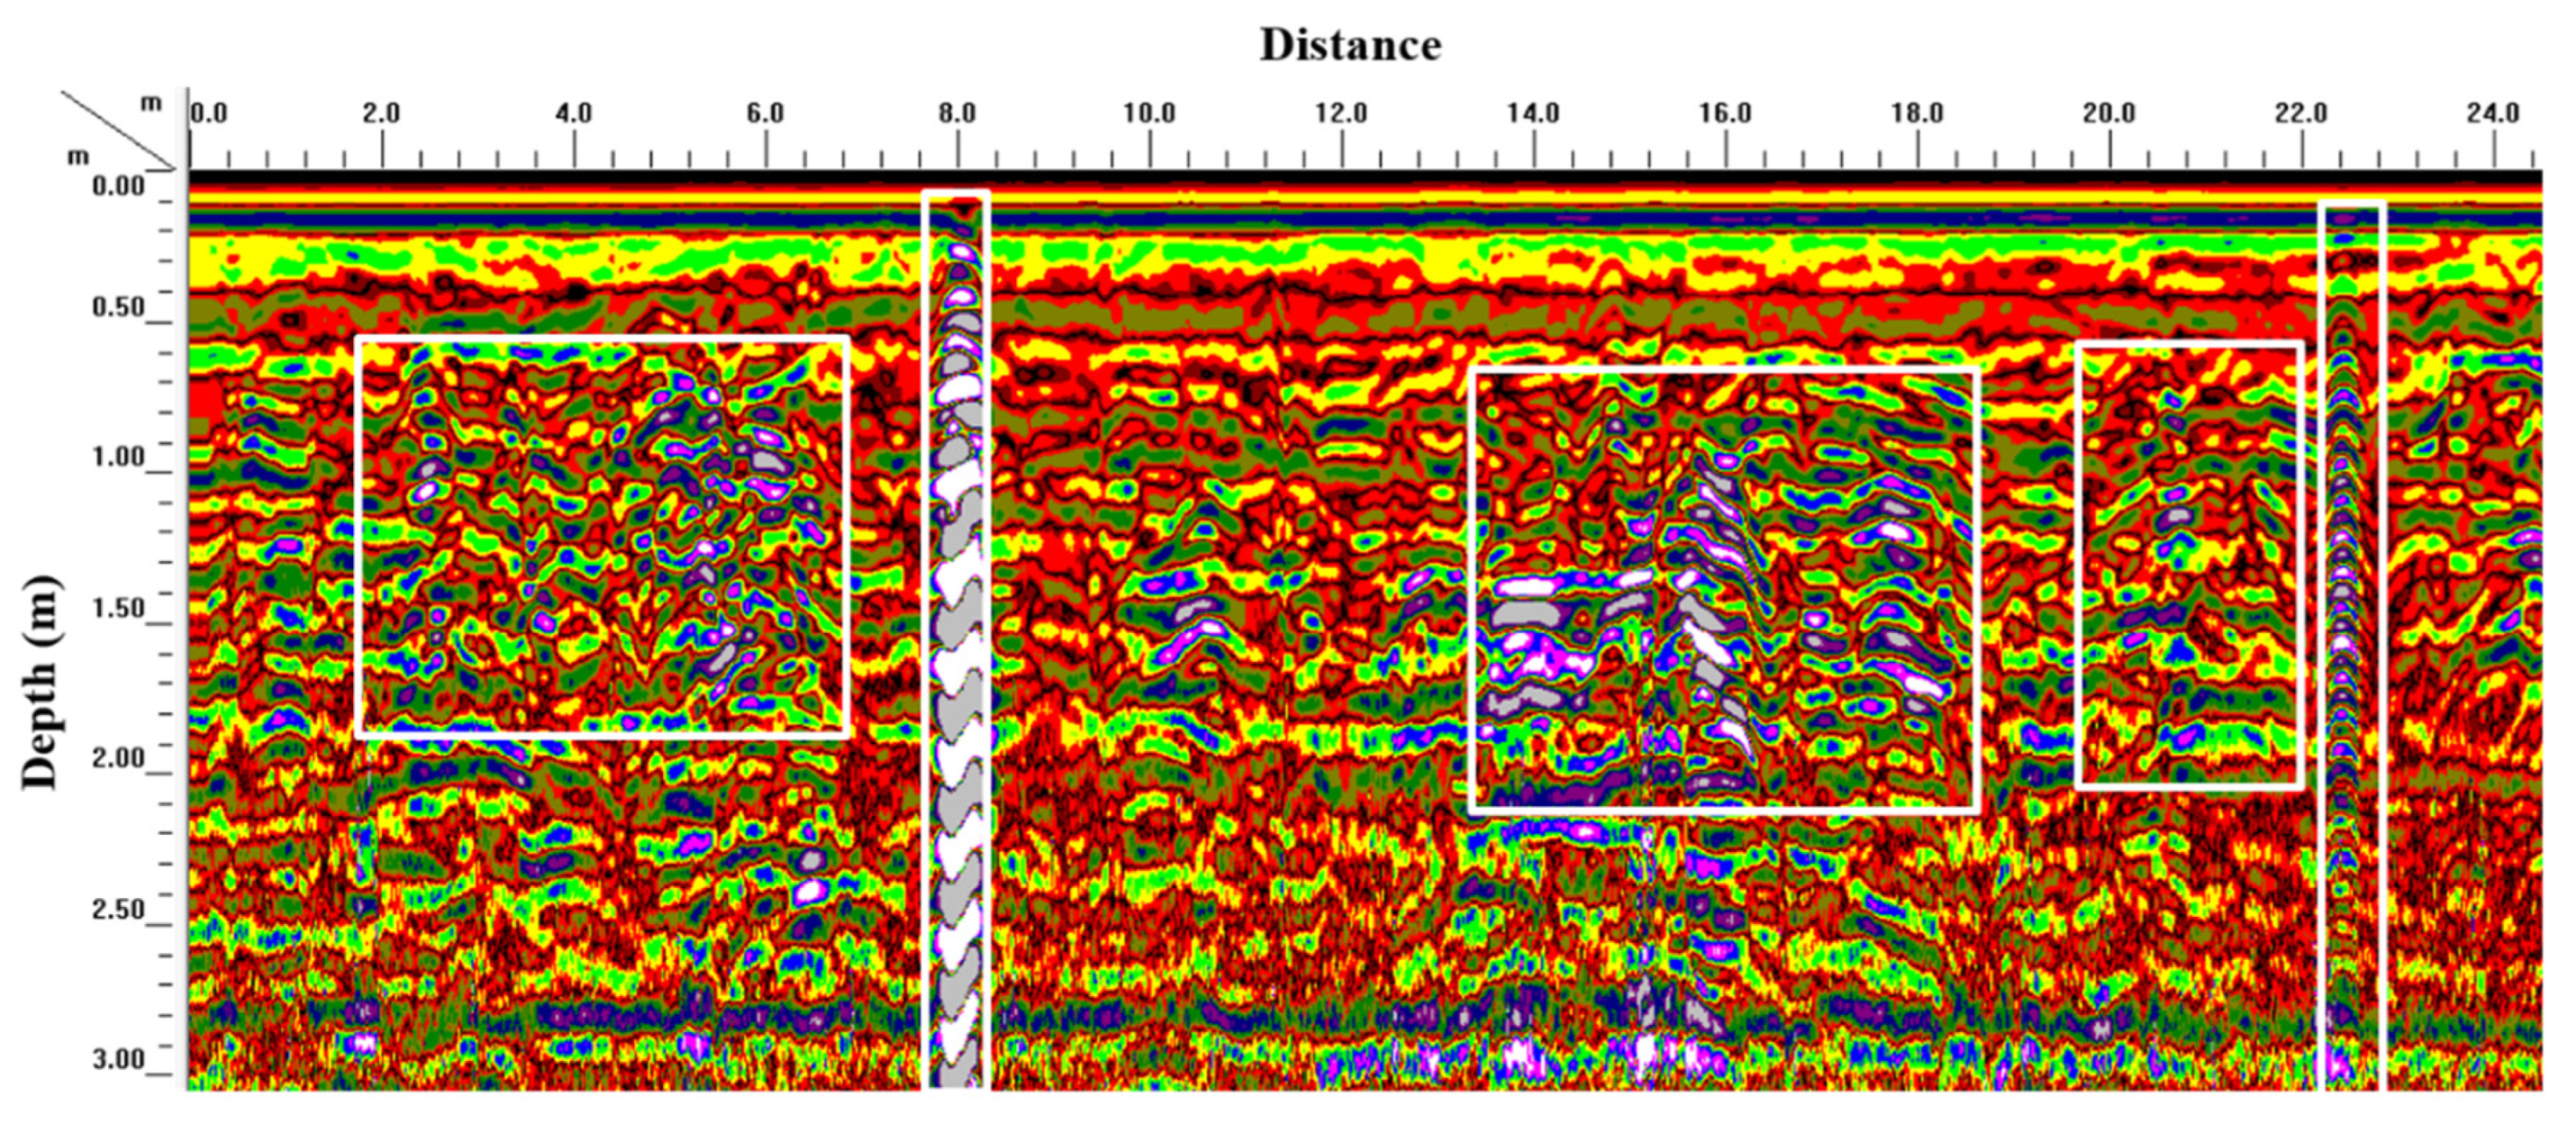
Figure 5.
Radar profile (900 MHz antenna) along Fort9004. An ancient wall may be the source for the main high reflection, which is denoted by the white rectangle and is located between horizontal distances of 2 and 4.5 m with a depth of around 0.45 m.
Figure 5.
Radar profile (900 MHz antenna) along Fort9004. An ancient wall may be the source for the main high reflection, which is denoted by the white rectangle and is located between horizontal distances of 2 and 4.5 m with a depth of around 0.45 m.
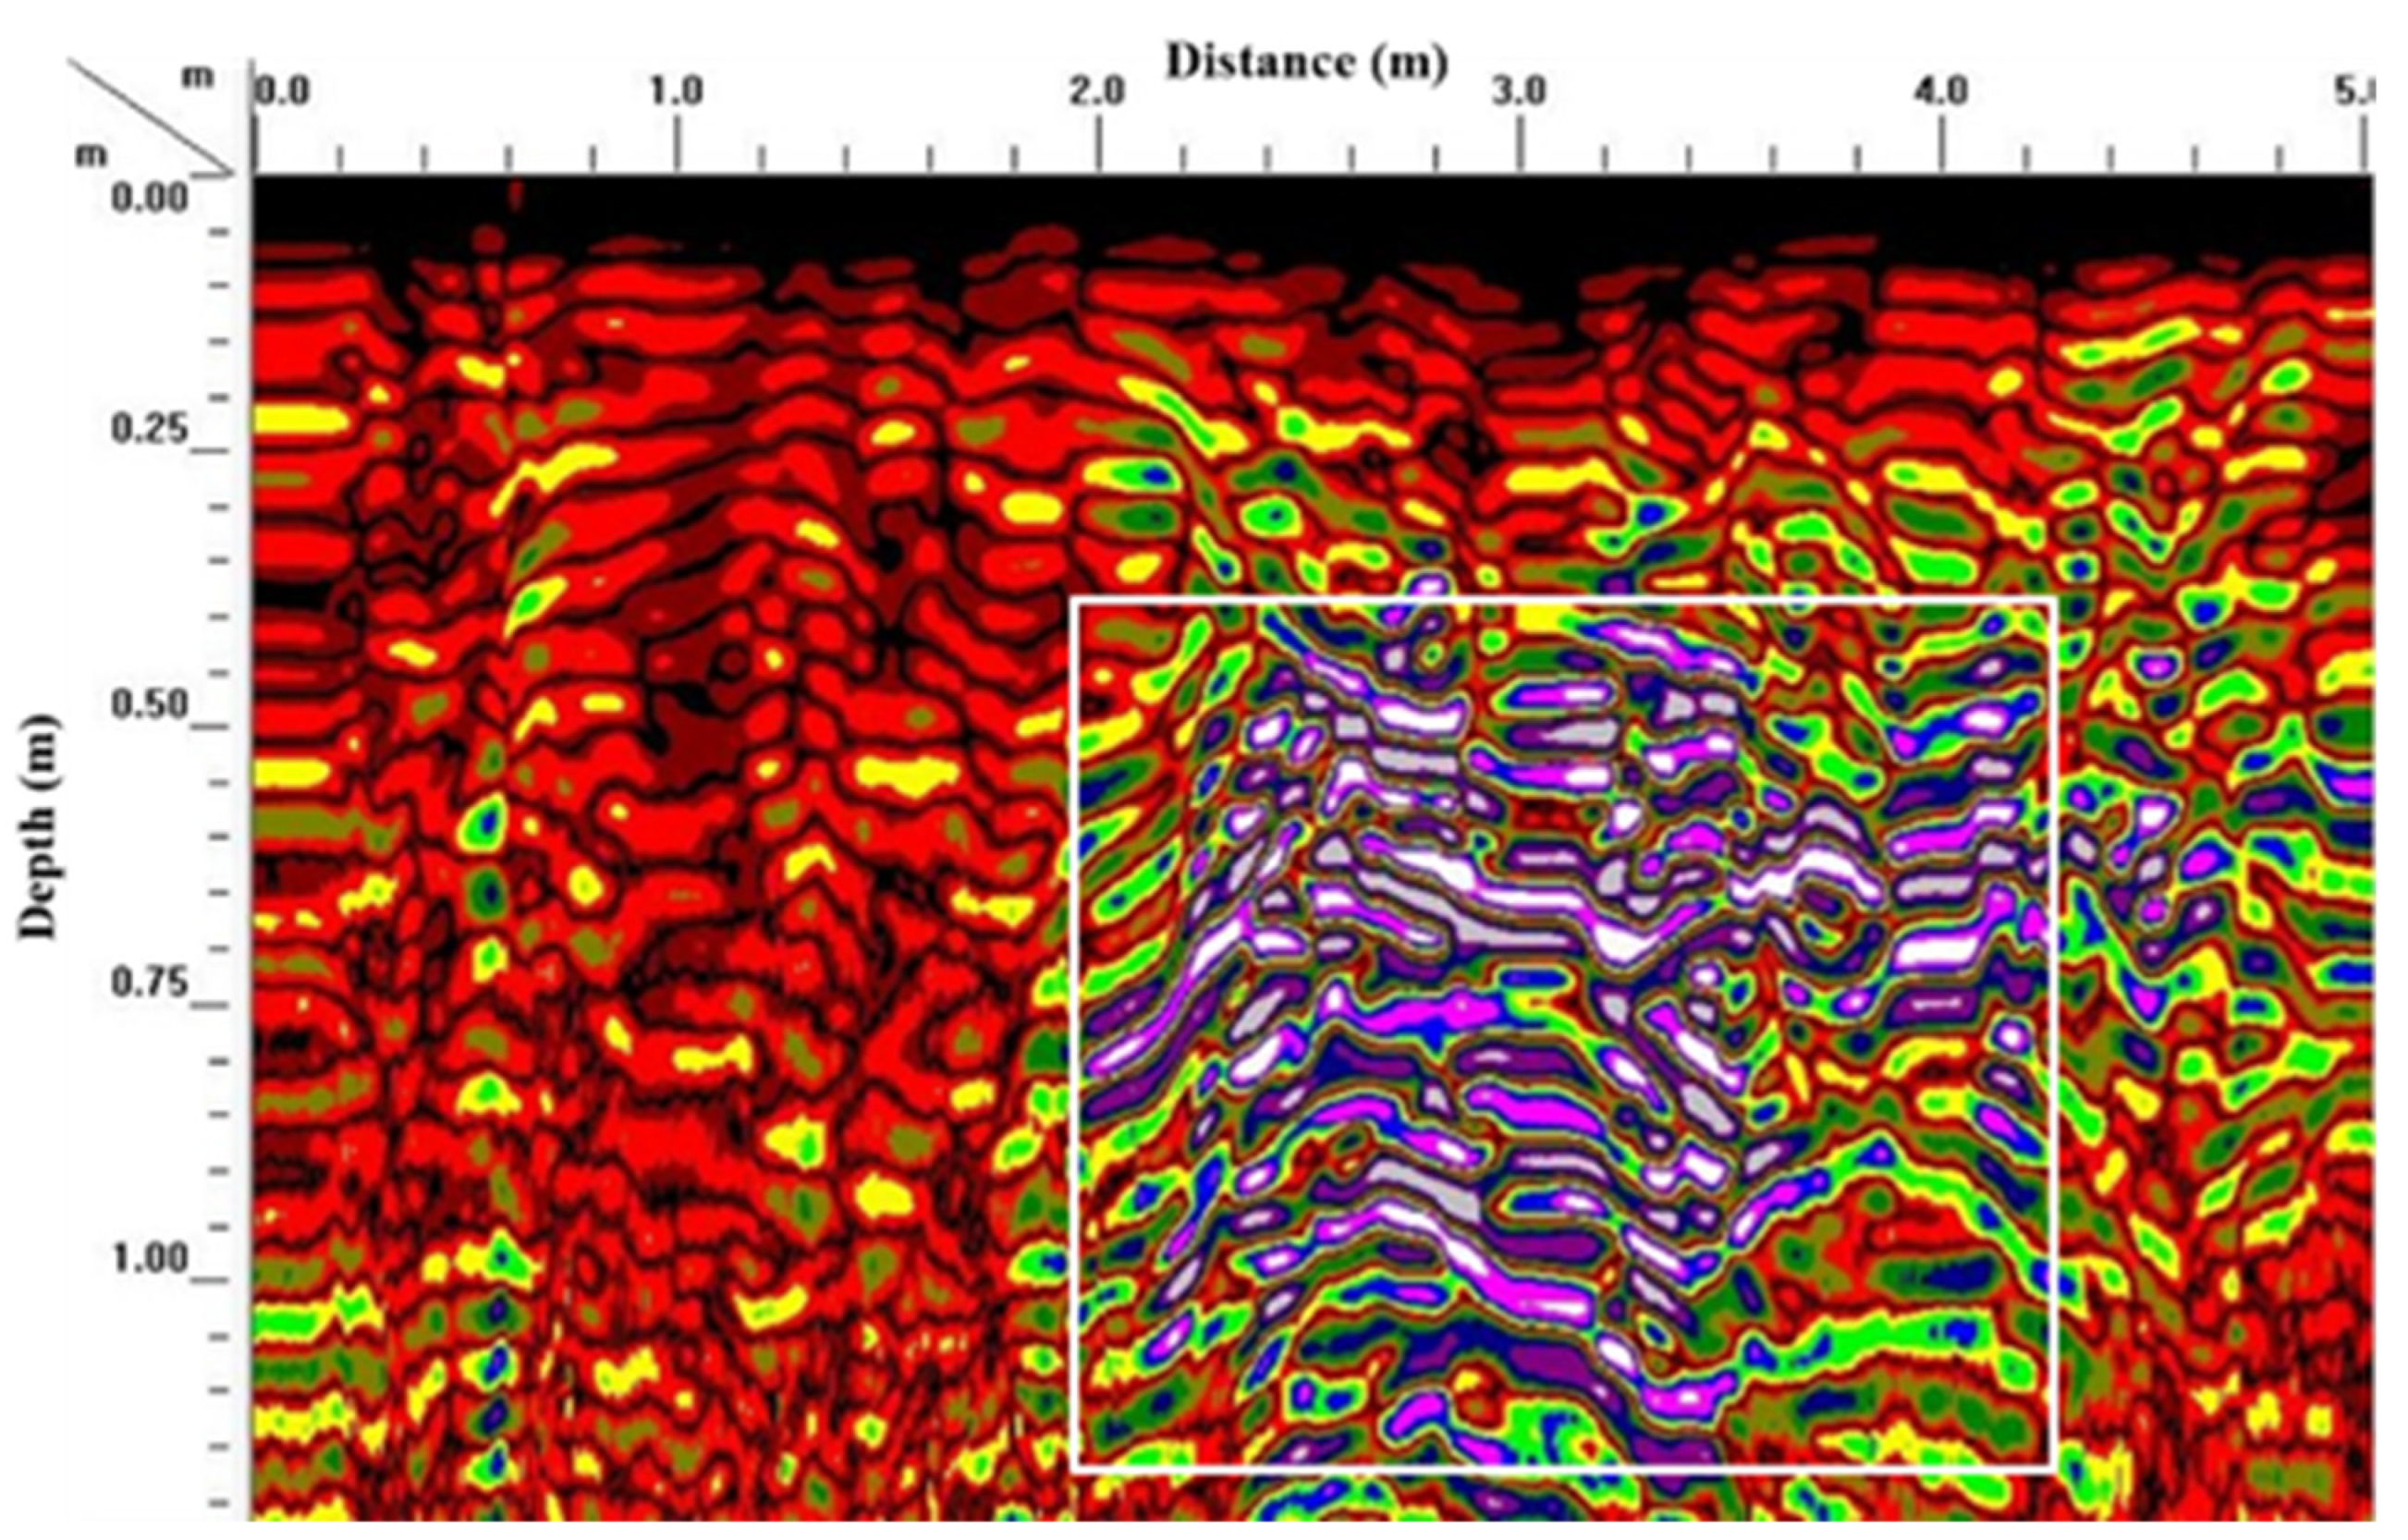
Figure 6.
3D Radar model with C-Scans molded from radargrams conducted with 900-MHz at site 2.
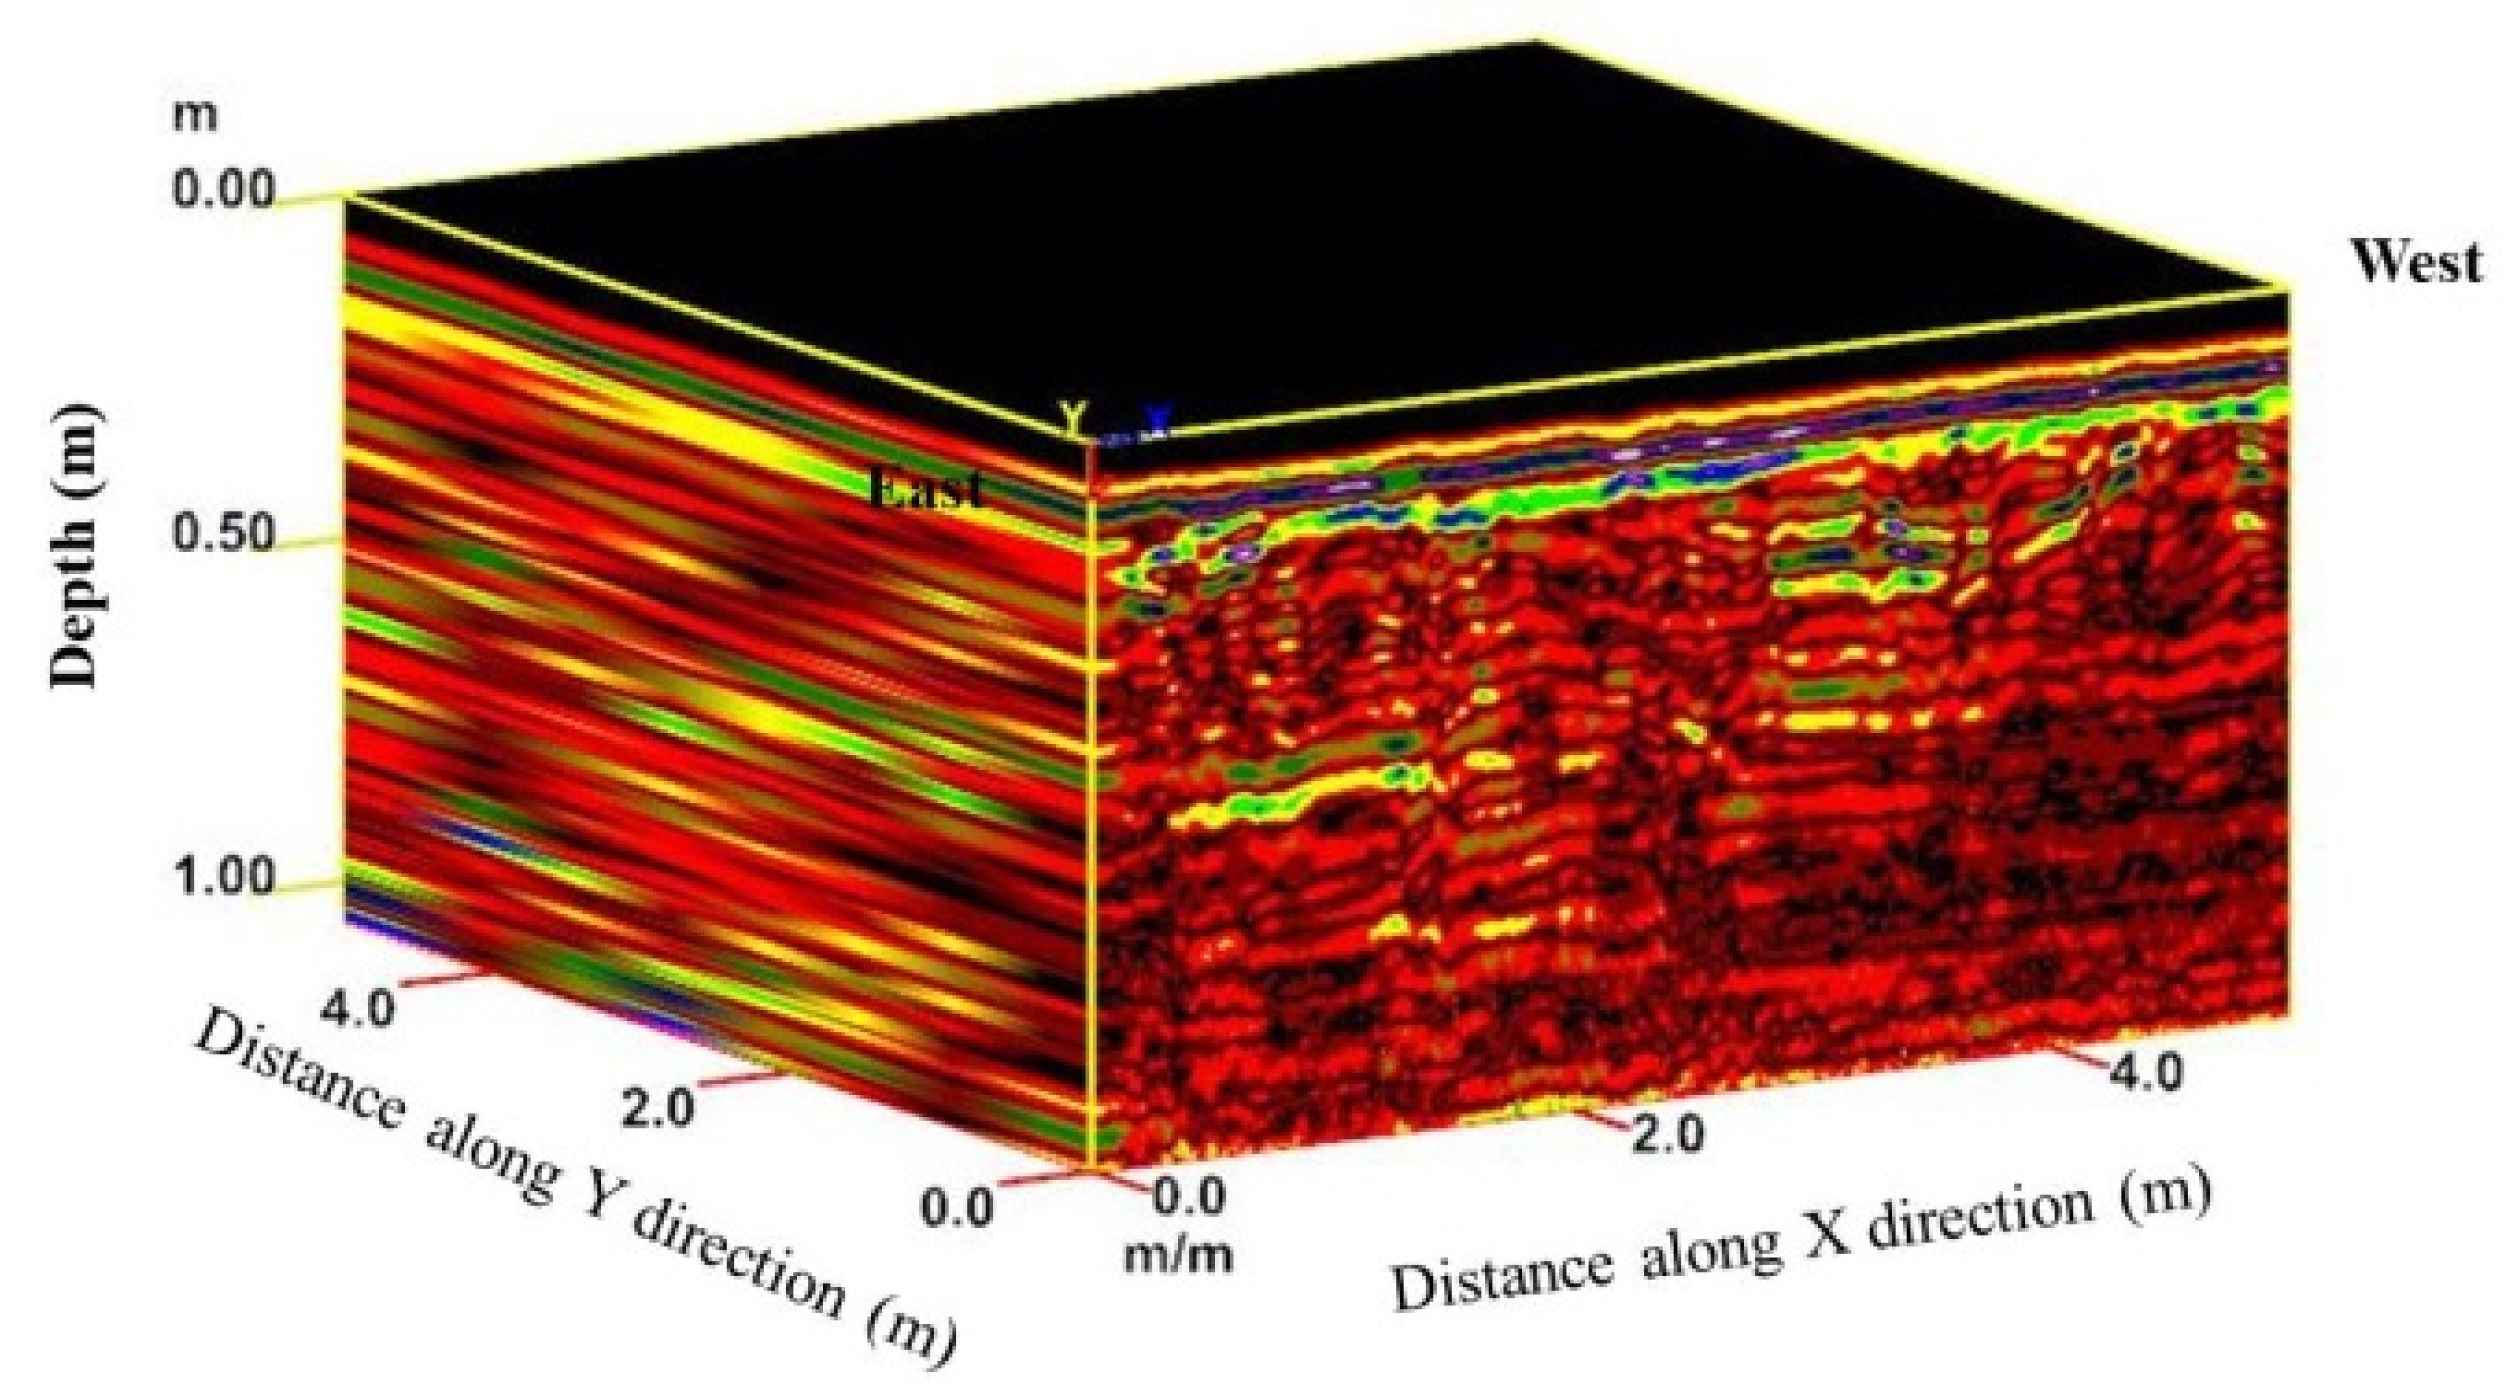
Figure 7.
Depth slices created from multiple 2D reflection profiles of site 1 at depths 0.5, 0.75 and 1m.
Figure 7.
Depth slices created from multiple 2D reflection profiles of site 1 at depths 0.5, 0.75 and 1m.
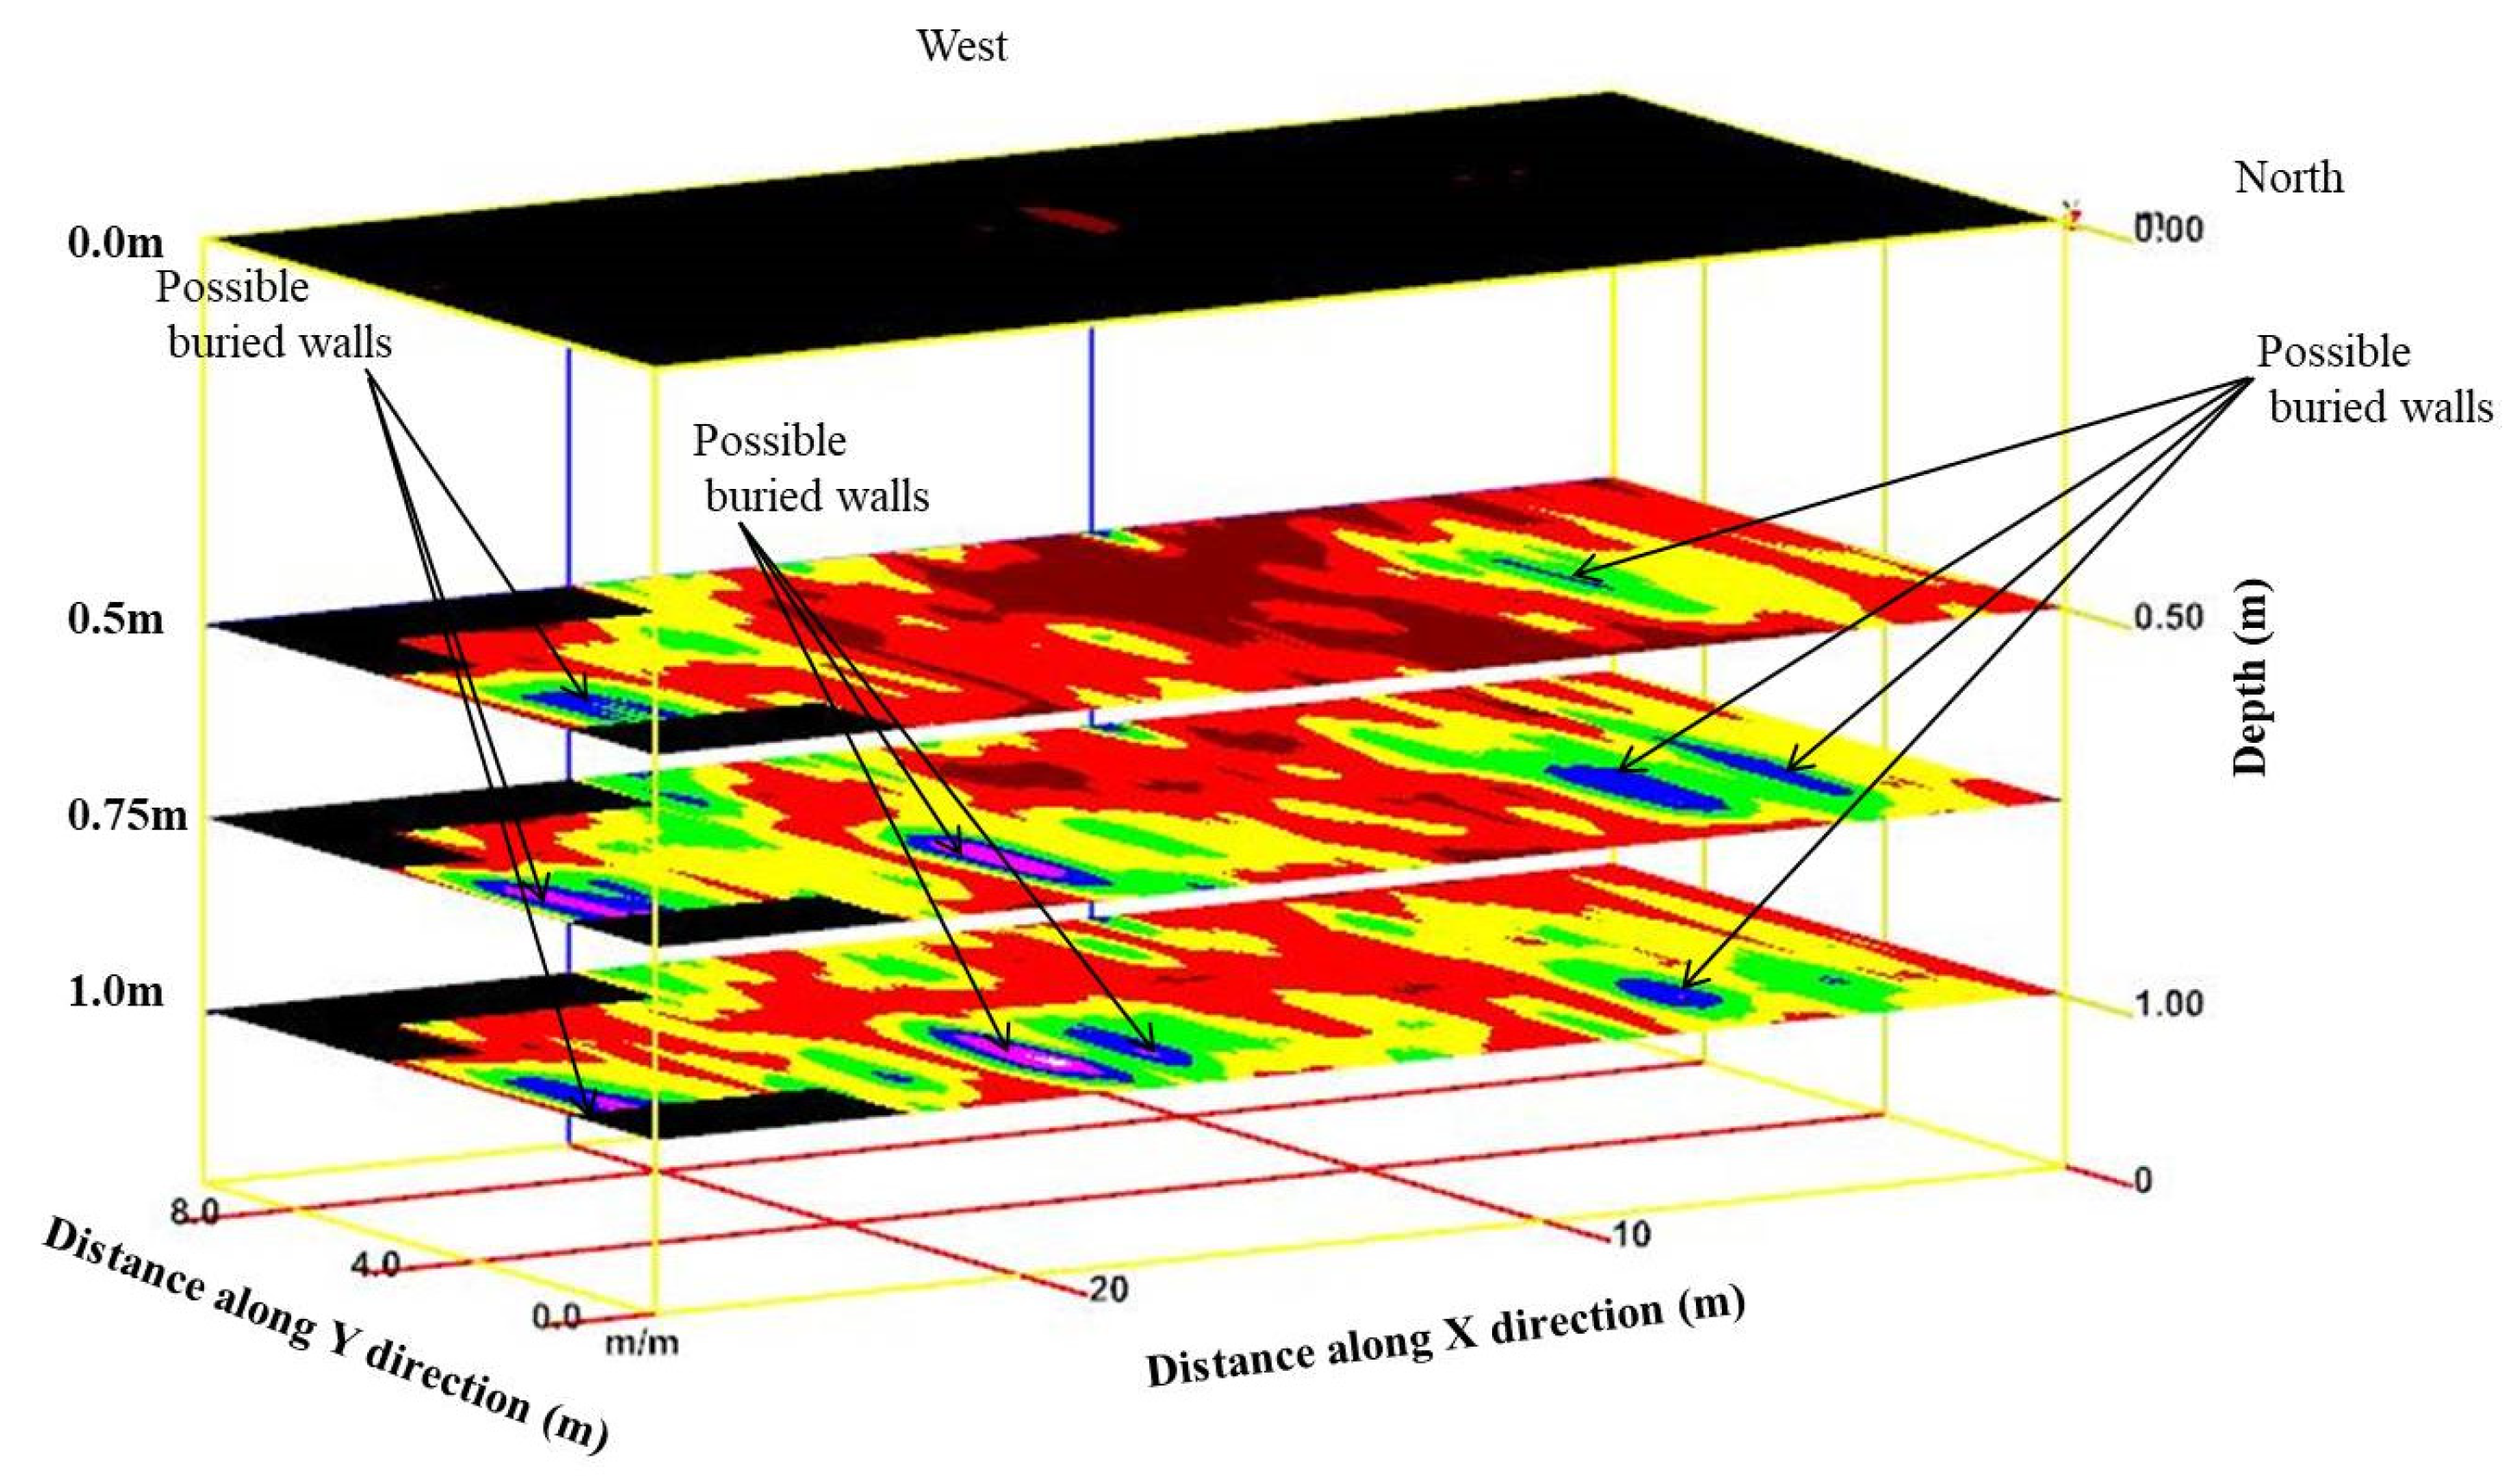
Figure 8.
Depth slices from multiple 2D reflection profiles of site 1 at depths 0, 0.4, 0.7 and 1m.
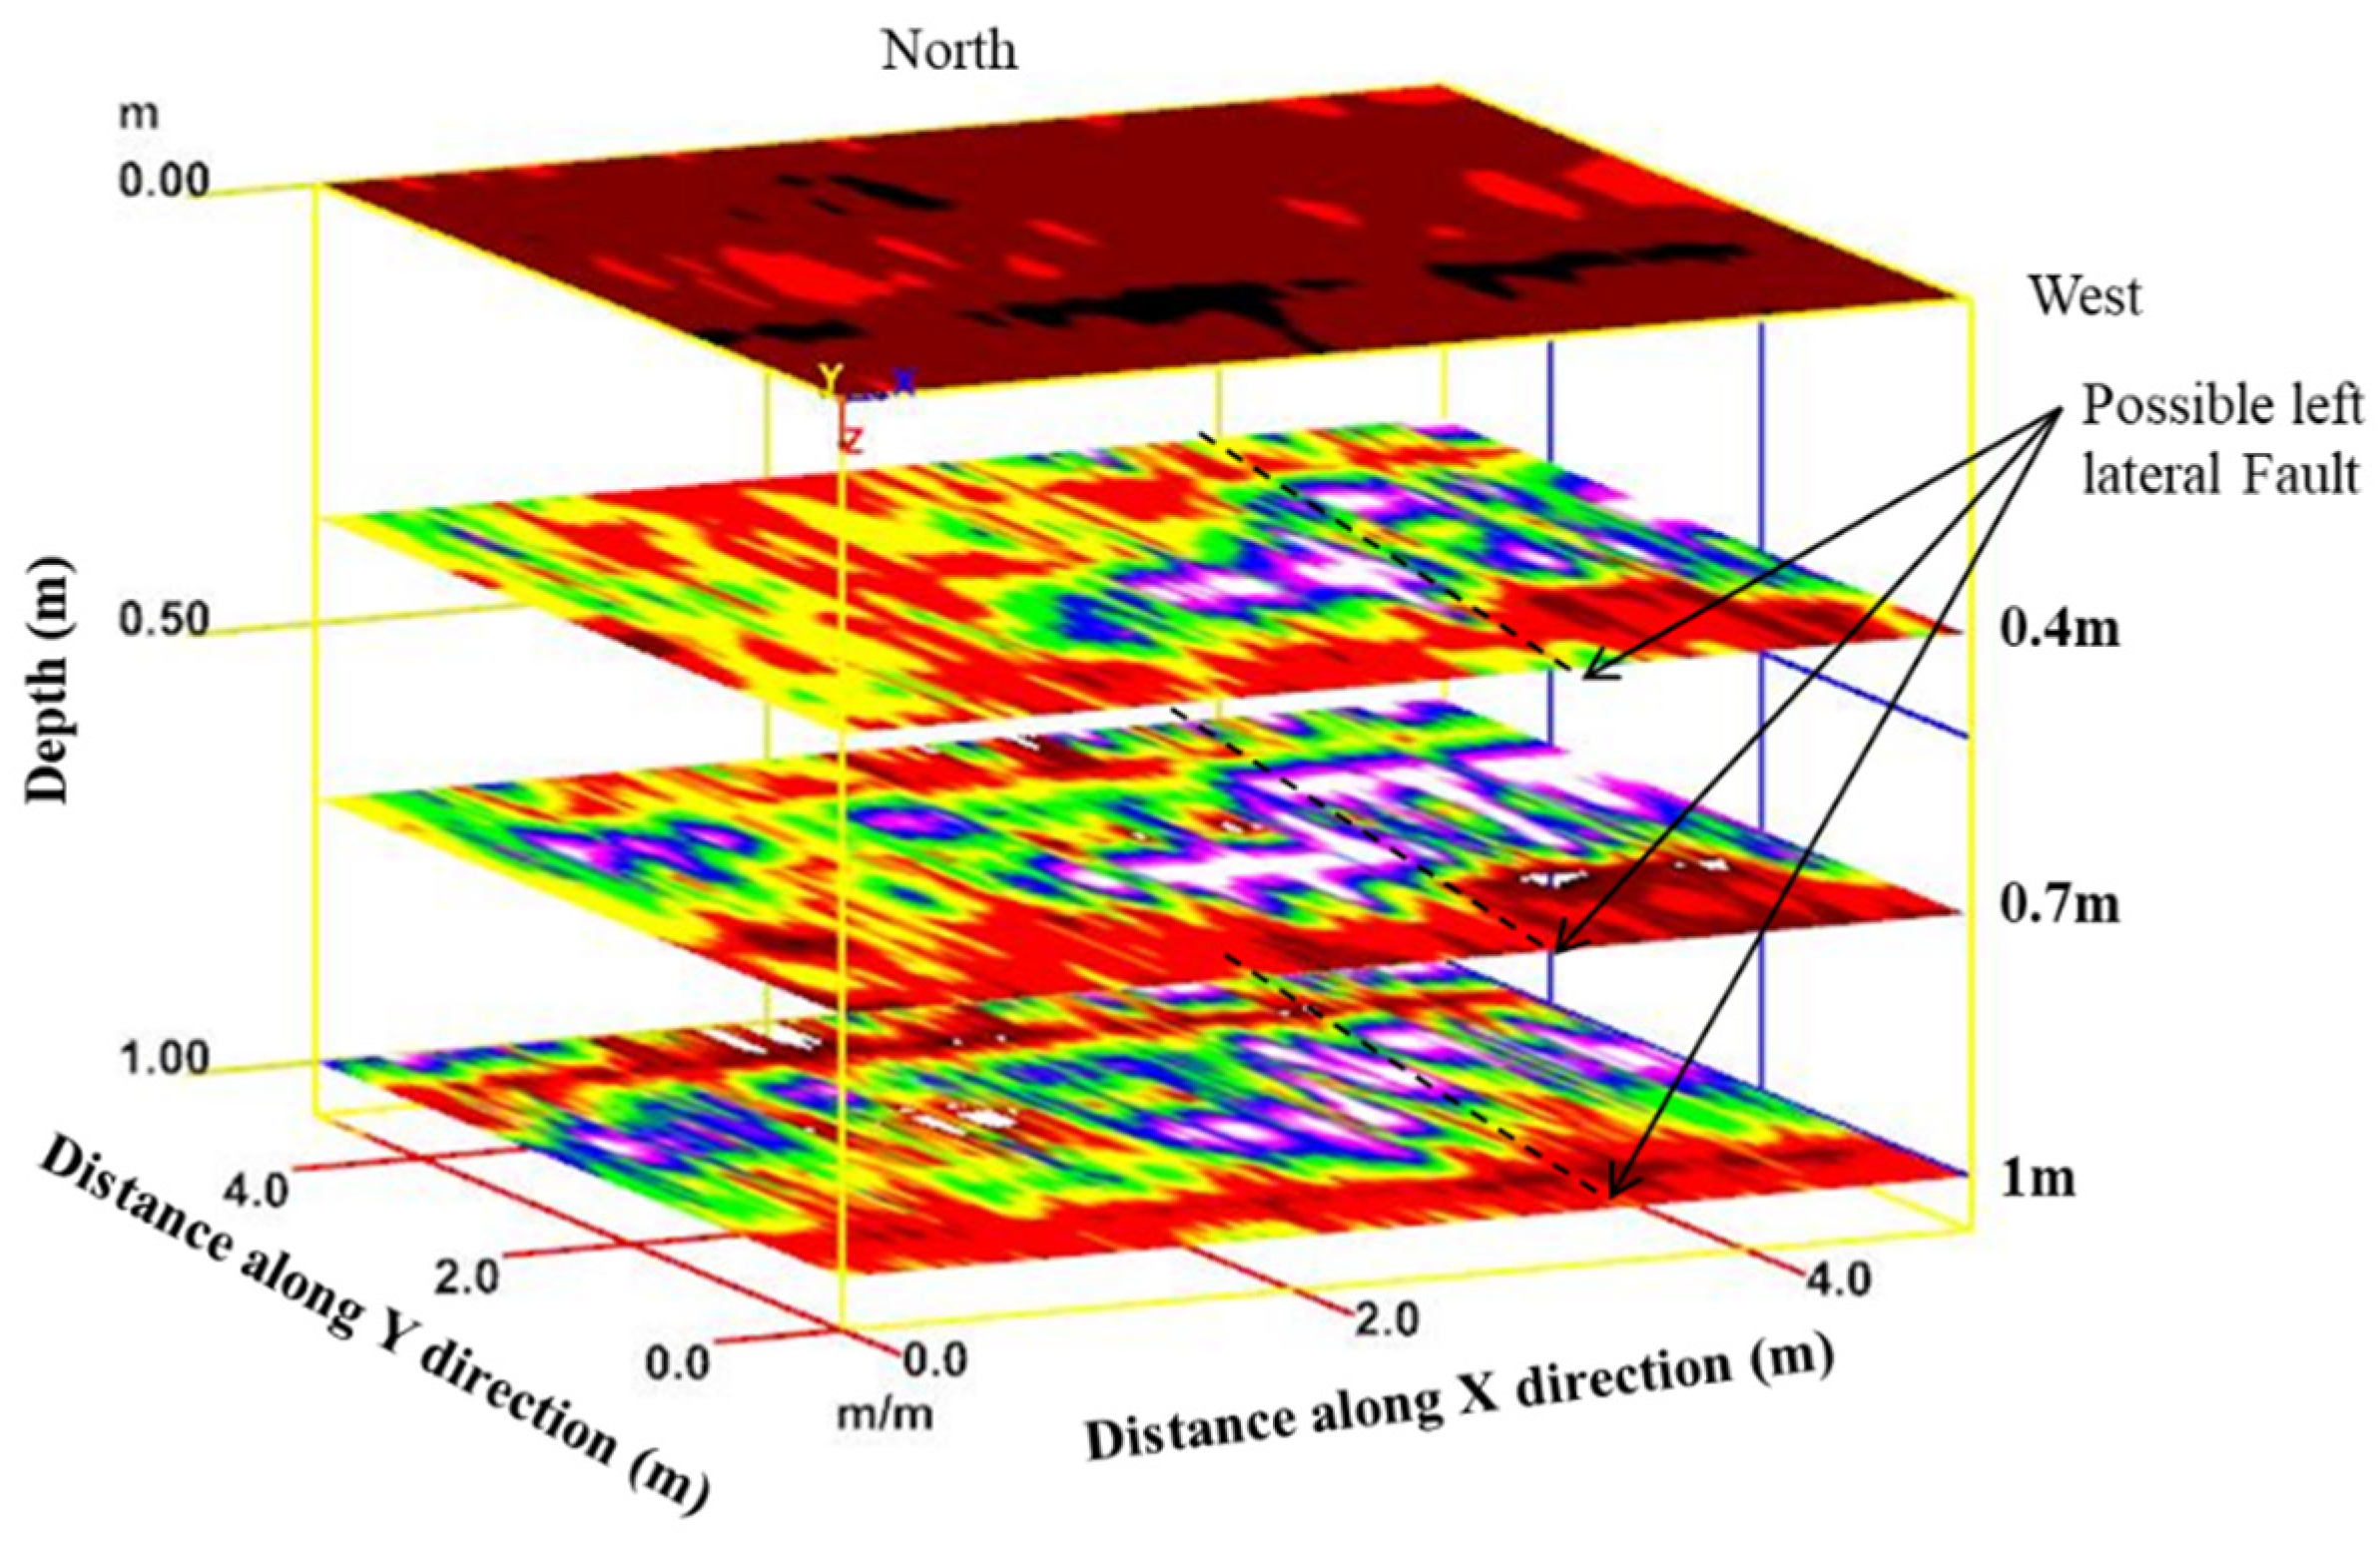
Figure 9.
3D section (cutout cube) using distance (x) 4.5, distance (y) 0.4.0, and distance (z) 0.5 m shows the depth and extension of the possible wall, the black dashed line may present lift lateral fault.
Figure 9.
3D section (cutout cube) using distance (x) 4.5, distance (y) 0.4.0, and distance (z) 0.5 m shows the depth and extension of the possible wall, the black dashed line may present lift lateral fault.
Disclaimer/Publisher’s Note: The statements, opinions and data contained in all publications are solely those of the individual author(s) and contributor(s) and not of MDPI and/or the editor(s). MDPI and/or the editor(s) disclaim responsibility for any injury to people or property resulting from any ideas, methods, instructions or products referred to in the content. |
© 2026 by the authors. Licensee MDPI, Basel, Switzerland. This article is an open access article distributed under the terms and conditions of the Creative Commons Attribution (CC BY) license (http://creativecommons.org/licenses/by/4.0/).
Copyright: This open access article is published under a Creative Commons CC BY 4.0 license, which permit the free download, distribution, and reuse, provided that the author and preprint are cited in any reuse.


