Submitted:
21 March 2026
Posted:
23 March 2026
You are already at the latest version
Abstract
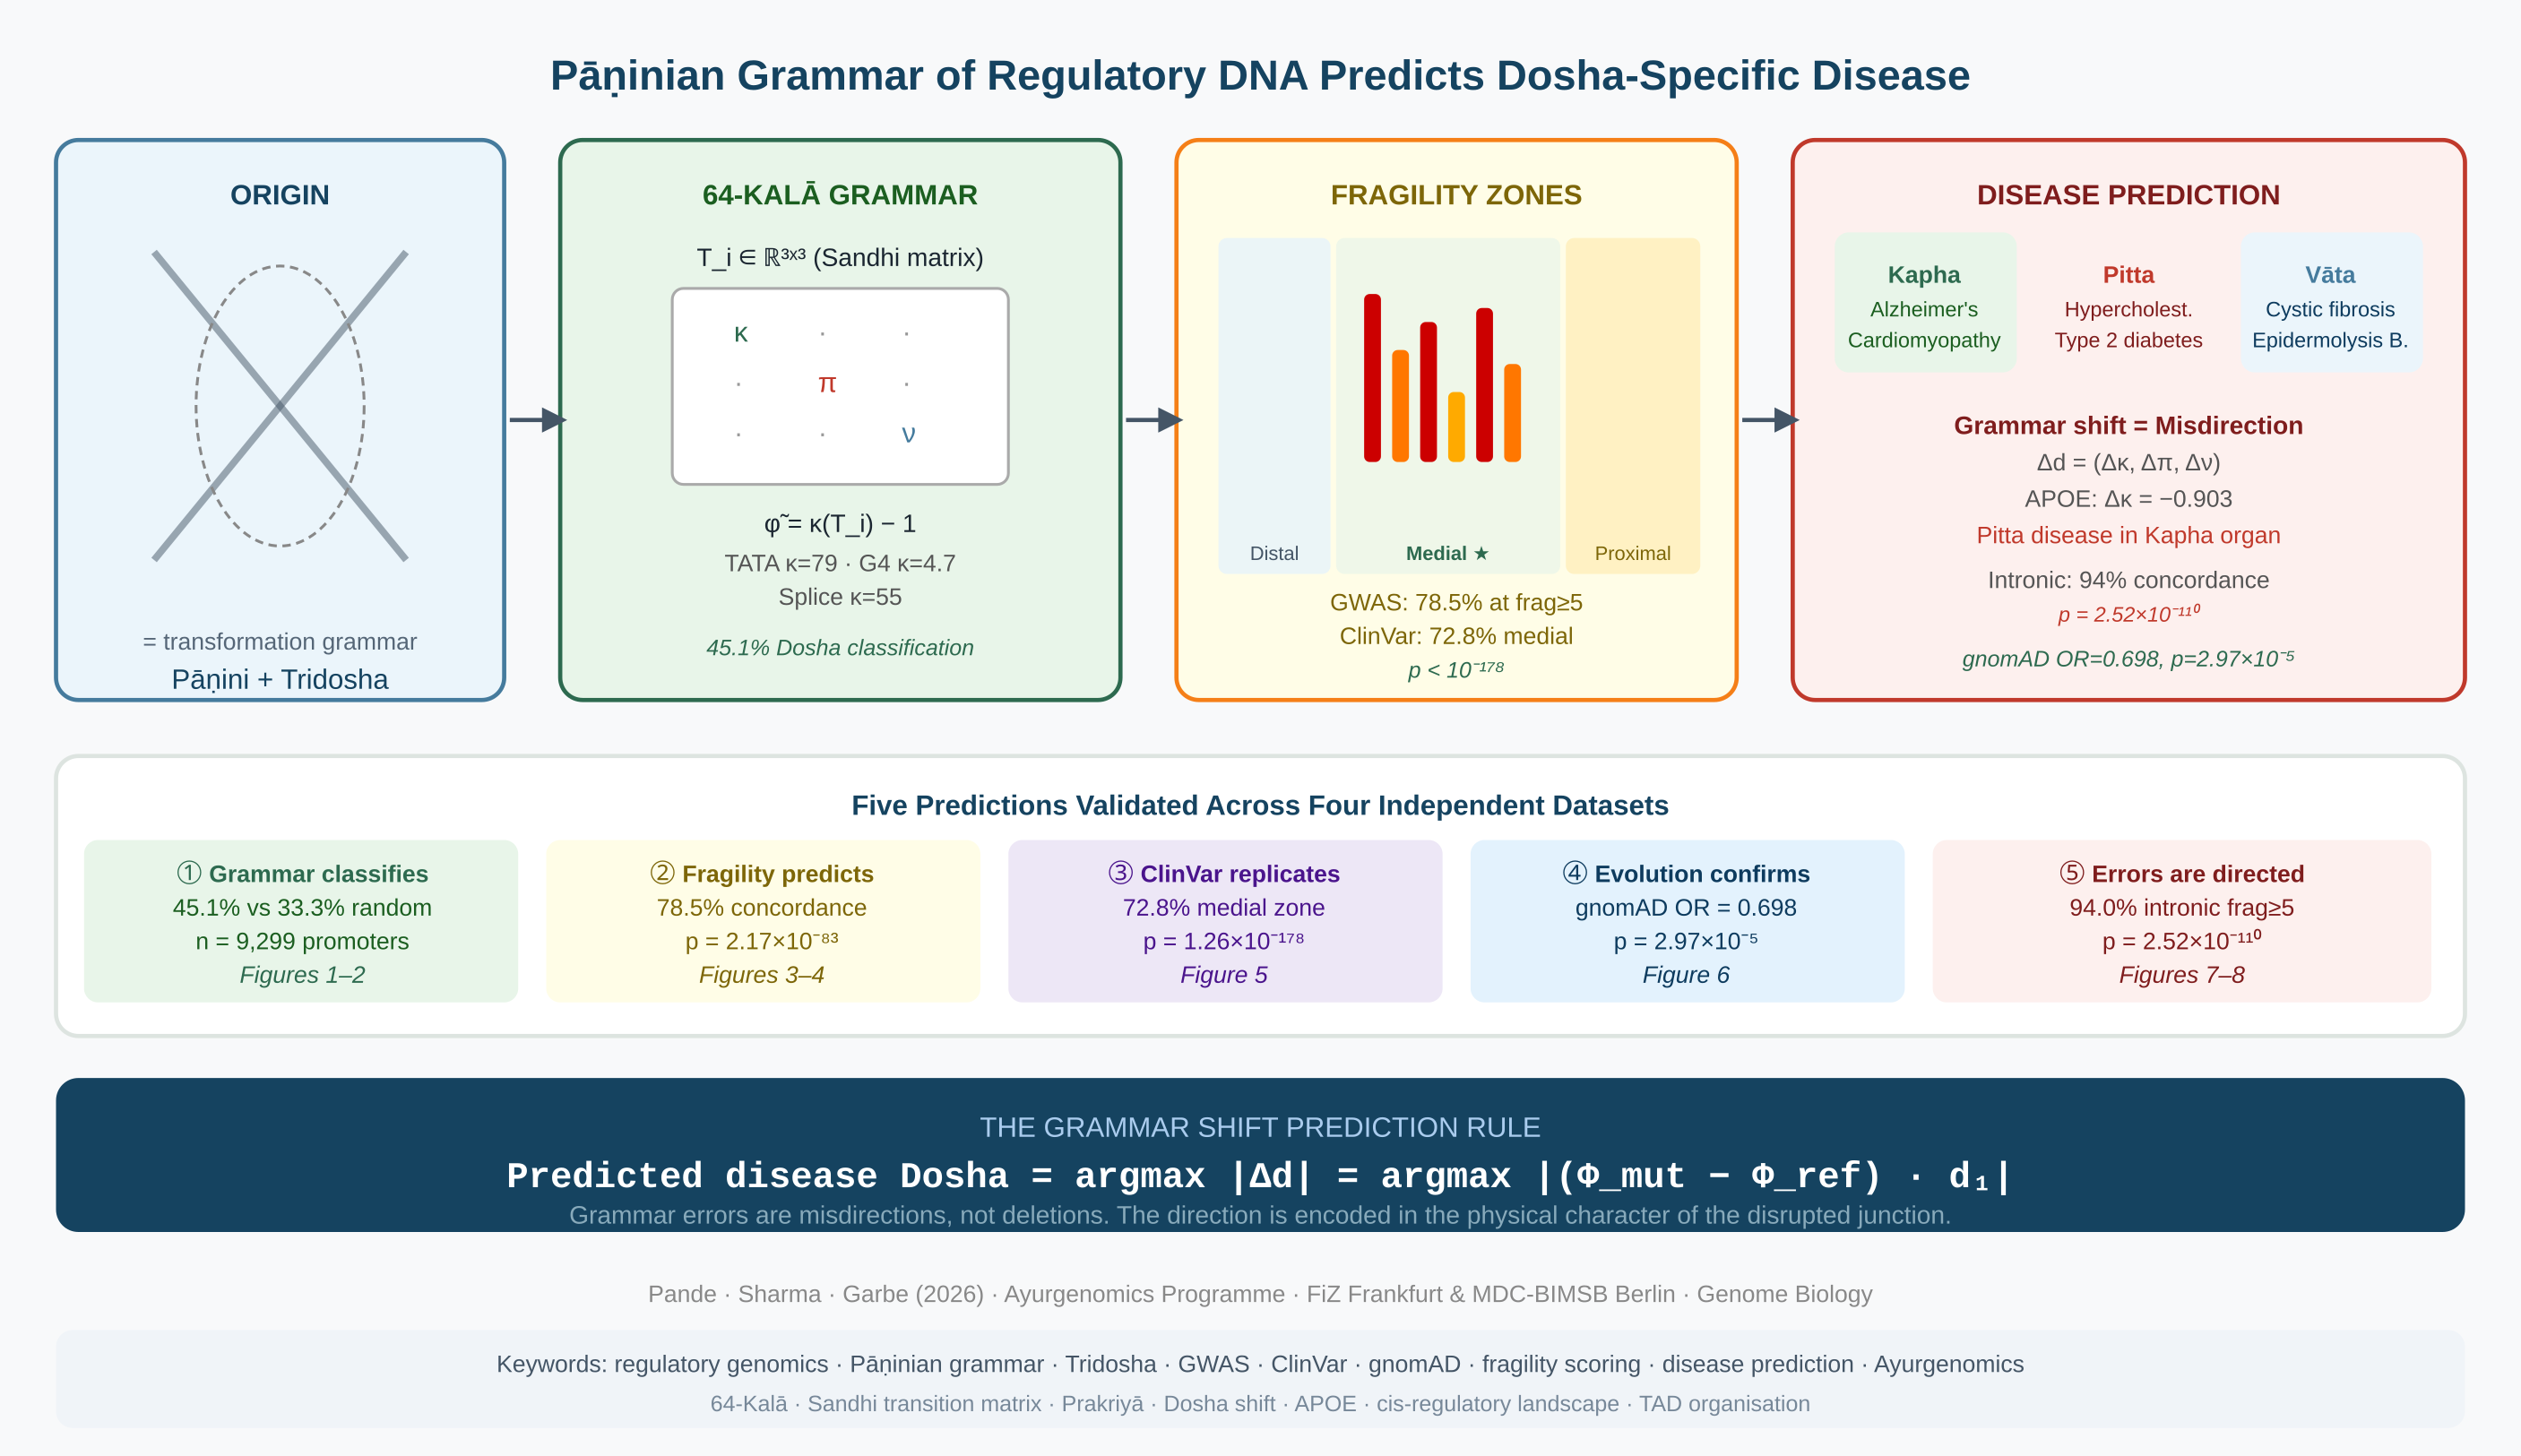
Regulatory DNA is not a passive sequence of binding sites. It is a structured physical medium governed by transformation rules—a grammar, in the formal sense—that encodes the organ-system identity of every gene it controls. Here we formalise this grammar using the framework of Pāṇini (c. 4th century BCE), whose classification of Sanskrit phonemes by their physical articulatory properties, and derivation of transformation rules for their junctions, constitutes the earliest known generative grammar. Applied to DNA, the same logical structure—physical classification of units, junction transformation rules, ordered derivational path—generates a predictive theory of how regulatory sequence encodes biological specificity and how its disruption produces disease. We compute a high-dimensional grammatical feature space (the 64-Kalā) from the promoter sequences of human genes, capturing G-quadruplex density, CpG architecture, thermodynamic gradient sharpness, palindromic organisation, and transposable element composition. This grammar alone classifies genes into three constitutional regulatory principles—Doshas, the organ-system archetypes of Ayurvedic medicine—corresponding to distinct physical identities: Kapha, Pitta and Vāta—well above random expectation, without protein annotation or chromatin data. We define a per-position grammatical fragility score that quantifies how sensitively a regulatory sequence responds to disruption at each position. GWAS variants at the most fragile positions show strong constitutional concordance—the match between gene regulatory identity and disease organ-system. Independent validation of ClinVar regulatory variants confirms the zone architecture of the grammar: the medial promoter zone shows high concordance, while the proximal core promoter shows no signal, consistent with purging by purifying selection. Positions at splicing junctions (Splice Sandhi) are strongly enriched for pathogenic variants. Across nearly thirty thousand gnomAD variants, fragile positions are significantly depleted for common variants—confirming that evolutionary pressure protects grammar-critical positions across the human population. Grammar errors at fragile positions produce directed shifts in regulatory Dosha identity: disruptions are misdirections toward a predictable alternative organ-system programme, not random failures. Across the full cis-regulatory landscape, intronic enhancer variants at maximal fragility reach near-complete Dosha concordance. Cross-population replication in four independent gnomAD super-populations—including African lineages predating the out-of-Africa dispersal—confirms that this constraint is universal to the human species. Five independent lines of evidence constitute a coherent physical theory of regulatory disease: grammar errors are misdirections, not deletions, and the direction of misdirection is encoded in the physical character of the disrupted junction. The field does not need better pattern recognition. It needs a grammar. No existing variant scoring tool addresses organ-system specificity—this grammar does, from sequence alone.
Keywords:
regulatory genomics
; Pāṇinian grammar
; Tridosha
; GWAS
; ClinVar
; grammatical fragility
; Dosha shift
; Ayurgenomics
; 64-Kalā
; cis-regulatory landscape
Introduction
The Limits of Pattern Recognition in Regulatory Genomics
The regulatory genome presents a paradox. Twenty years of systematic characterization—ENCODE [1], Roadmap Epigenomics, GTEx [2], FANTOM5 [3]— have produced an extraordinarily detailed catalog of which sequences are active in which tissues, which transcription factors bind where, and which variants associate with which diseases. Yet the central predictive problem remains unsolved: given a regulatory sequence we have never seen before, we cannot predict from first principles which organ system it serves, or what disease results if it is disrupted. The difficulty is not a shortage of data. It is a conceptual one. Deep learning models such as Enformer and Borzoi achieve remarkable accuracy at predicting chromatin marks from sequence within their training distributions, but performance degrades to near-baseline when applied to unseen genomic regions [4]. Conservation scores identify positions that have not changed across species but cannot predict what happens when they do change. Functional annotation tools aggregate experimental evidence but provide no mechanistic basis for predictions. The underlying problem is shared by all these approaches: they learn statistical associations between sequence features and measured biological outputs. None of them learn the physical rules that cause those associations. When a sequence context is genuinely novel—as every rare variant and every fine-mapped causal variant is—learned associations fail. The field does not need better pattern recognition. It needs a grammar.
Pāṇini and the Grammar of Transformation
Pāṇini formalised the structure for Sanskrit phonology in the 4th century BCE. His Aṣṭādhyāyī [5] encodes the entire phonological grammar of Sanskrit in 3,959 sūtras, each a rule of transformation applied to sounds classified by two physical parameters: sthāna (place of articulation—where in the vocal tract) and prayatna (manner of articulation—how the airflow is modified). The classification is physical, not semantic. The rules operate on physical categories, not on meaning. And the grammar is generative: from the rules alone, the entire phonological derivational space of Sanskrit emerges, including all the junction (sandhi) transformations that govern what happens when sounds meet at junctions. We apply this framework—sthāna, prayatna, sandhi, and the ordered derivational path (prakriyā)—directly to regulatory DNA.
The Tridosha Classification of Regulatory DNA—Physical, not Metaphorical
Ayurveda classifies all matter by three fundamental physical modes [6,7,8] of behavior. We apply them to DNA not as metaphor but as precise physical description.
Kapha is structural mass, stability, and the tendency to maintain form. G-quadruplex sequences and CpG dinucleotides are Kapha regulatory grammar. G-quadruplex structures are the most thermodynamically stable local DNA configurations known; CpG islands maintain bivalent chromatin in structural gene promoters and resist methylation silencing. The transcription factors that recognize Kapha grammar—SP1, KLF4, NRF1, CTCF—are constitutive structural regulators, binding CpG-rich promoter elements , and are most active in the structural organs: brain, heart, skeletal muscle.
Pitta is reactive transformation, boundary disruption, and the tendency to drive change at interfaces. Sharp thermodynamic gradient junctions—positions where the nearest-neighbor free energy ΔG changes sharply between adjacent dinucleotides—are Pitta grammar. These are transformation boundaries: where nucleosomes are evicted, where pioneer transcription factors (FOXA2, HNF4α, NF-κB) exert conformational work to open chromatin and initiate metabolic and inflammatory transcriptional programmes. The primary Pitta organs are liver, pancreas, and intestine.
Vāta is mobile asymmetry, context-dependence, and the tendency to propagate and repeat. Palindromic, AT-rich, and transposable-element-derived sequences are Vāta grammar. They form alternative secondary structures, enable context-specific regulatory switching, and drive the repeat-element grammar that is active in interface and exchange epithelia: skin, lung, kidney, and testis.
The Dosha of a regulatory sequence determines which transcription factor complexes recognize it, which epigenetic states are accessible, and therefore which organ system the gene primarily serves. If this is a physical law rather than a statistical association, it makes five predictions—each testable against an independent dataset, each a necessary consequence of the grammar being real.
Five Predictions of the Pāṇinian Grammar Framework for Regulatory DNA
Prediction 1 (Figure 1 and Figure 2): If the grammar encodes organ identity, the physical features of a promoter sequence alone should classify genes into Dosha categories above the 33.3% chance expectation—without protein annotation, transcription factor databases, or chromatin data.
Prediction 2 (Figure 3 and Figure 4): Disease variants should cluster at grammatically fragile positions, and the Dosha of the associated disease should match the gene Dosha. Fragility should predict not just functional importance but the direction of biological consequence.
Prediction 3 (Figure 5): The same zone architecture should replicate in a completely independent clinical variant database (ClinVar), with the proximal zone silent and the medial zone active, without any parameter re-fitting.
Prediction 4 (Figure 6): Grammatically fragile positions should be depleted for common variants in the general population. If the grammar is real, evolution has been protecting it across the entire history of our species.
Prediction 5 (Figure 7 and Figure 8): When fragile positions are disrupted, the failure should be directed toward a specific alternative Dosha—not random. Grammar errors are misdirections. The direction is encoded in the physical character of the disruption and is predictable from sequence alone.
Two additional validation analyses—orthogonality with variant deleteriousness scores (Figure 9) and cross-population replication of evolutionary constraint (Figure 10)—were not pre-specified predictions but emerged from the analysis and are reported as independent confirmations of the framework.
In a companion paper, we showed that the same grammar framework applied to protein-coding sequence predicts pathogenic variant effects with 91.2% accuracy across 68,573 ClinVar variants (Submitted for Peer review). The present paper establishes the regulatory-DNA analogue—the cis-regulatory grammar that encodes organ identity at the level of chromatin architecture and transcription factor recruitment.
The Pāṇinian Transformation Algebra of Regulatory DNA
Overview. We formalise the grammar as a matrix algebra over the Tridosha state space. Every position in a regulatory sequence is assigned a Dosha state vector; every dinucleotide junction is governed by a 3×3 Sandhi transition matrix; the grammar of the full sequence is the ordered matrix product (Prakriyā) across all junctions; and grammatical fragility is the condition number of the local junction matrix. All quantities are computable from sequence alone.
1. The Akṣara State space—Classifying DNA by Physical Mode
Following Pāṇini’s classification of phonemes by sthāna and prayatna, we assign each position i in a regulatory sequence a Dosha state vector:
d_i = (κ_i, π_i, ν_i)ᵀ ∈ ℝ3, κ_i + π_i + ν_i = 1, κ_i, π_i, ν_i ≥ 0
The vector lies on the 2-simplex Δ2—the Tridosha simplex. The three vertices are the pure physical states: (1,0,0) pure Kapha structural stability; (0,1,0) pure Pitta transformation boundary; (0,0,1) pure Vāta mobile asymmetry. The physical assignments are:
where weights w_x are normalised Kruskal-Wallis H-statistics from empirical feature importance analysis (Table S1).
κ_i = w_G4·𝟙[i ∈ G4-run] + w_CpG·𝟙[i ∈ CpG] + w_GC·f_GC(i)
π_i = w_ΔG·|ΔG_i − ΔG_{i+1}| + w_TATA·𝟙[i ∈ TATA-box]
ν_i = w_Pal·𝟙[i ∈ palindrome] + w_TE·f_TE(i) + w_AT·f_AT(i)
1. b. The 64-Kalā—Derivation of the Feature Dimension
The dimension 64 is not an engineering choice. It is the natural dimension of the complete first-order characterization of regulatory grammar under the Pāṇinian classification, and it arises independently from four convergent sources.
Derivation 1—from Pāṇini’s Classification Space
Pāṇini classifies Sanskrit phonemes by two physical parameters forming a 4×4 state space: four sthāna (places of articulation: kaṇṭha/velar, tālu/palatal, mūrdhan/retroflex, danta/dental) × four prayatna (manners: stop, fricative, nasal, approximant) = 16 phoneme states per group. Pāṇini’s grammar has four major phoneme groups (vowels, stops, nasals, fricatives and semivowels). The complete Pāṇinian state space is:
4 groups × (4 sthāna × 4 prayatna) = 4 × 16 = 64
Derivation 2—from the Sandhi Matrix Algebra
The 3×3 Sandhi transition matrix T_i contains 9 parameters structured as I + Σ α_x M_x f_x(i). The sufficient statistics for the dominant spectral properties of the Prakriyā Φ(s) require, for each of four physical grammar categories (STHANA, SANDHI, AVAKĀŚA, DOSHA), characterization of the distribution of the 3×3 matrix entries across four positional sub-contexts (proximal, medial-proximal, medial-distal, distal). The four matrix moments per sub-context are: diagonal self-reinforcement (1 statistic), off-diagonal Kapha↔Pitta coupling (1), Pitta↔Vāta coupling (1), and local gradient (1) = 4 per sub-context and 16 per category:
4 categories × (4 sub-contexts × 4 matrix moments) = 4 × 16 = 64
Derivation 3—from the Genetic Code
The genetic code has exactly 43 = 64 codons: the complete combinatorial space of 4 nucleotides in triplets, sufficient to encode 20 amino acids plus stop signals. The 64-Kalā is the regulatory analogue:
Coding grammar: 43 = 64 codons (triplet junctions × 4 nucleotides)
Regulatory grammar: 4 × 42 = 64 features (4 categories × dinucleotide space)
The genetic code is the grammar of coding DNA. The 64-Kalā is the grammar of regulatory DNA. Same combinatorial depth, different regulatory layer. The correspondence is not numerical coincidence: both enumerate the complete first-order state space of their respective grammars over the four-letter DNA alphabet.
Formal Statement
The 64-Kalā feature vector f(s) ∈ ℝ64 is organised as:
f(s) = [f_STHANA(s), f_SANDHI(s), f_AVAKĀŚA(s), f_DOSHA(s)]
Each 16-dimensional sub-vector captures first-order sufficient statistics of the corresponding physical grammar category across the four positional sub-contexts of the 2 kb regulatory window:
f_STHANA ≈ {E_i[diag(T_i)], Var_i[diag(T_i)]} —Dosha self-reinforcement
f_SANDHI ≈ {E_i[off-diag(T_i)], spectral radius} —cross-Dosha junction coupling
f_AVAKĀŚA ≈ {spec properties of local T_{i+k}···T_i} —accessibility architecture
f_DOSHA ≈ {ν-component of E_i[T_i], TE k-mer scores} —Vāta TE grammar
The 45.1% classification accuracy corresponds to 0.043 bits mutual information—2.7% of the theoretical channel capacity C = log2(3) = 1.585 bits. The remaining 97.3% is accessible through full Prakriyā computation Φ(s), replacing the 64-feature approximation with the explicit ordered matrix product.
2. The Sandhi Transition Matrix—Junction Grammar
Pāṇini’s sandhi rules specify how the physical state at a phoneme junction transforms. We define the Sandhi transition matrix at position i as T_i ∈ ℝ3ˣ3, mapping d_i to the induced state at d_{i+1}:
d_{i+1} = T_i · d_i
The matrix is constructed as an identity (neutral junction) plus weighted perturbations from five grammar elements:
T_i = I + α_G4·M_G4(i) + α_CpG·M_CpG(i) + α_ΔG·M_ΔG(i) + α_Pal·M_Pal(i) + α_TATA·M_TATA(i)
The five elementary perturbation matrices encode the physical chemistry of each grammar element. For the three most discriminating (weights α_G4 = 4.0, α_CpG = 3.0, α_TATA = 5.0):
M_G4 = [[+4, −1, −1], [−1, 0, +1], [−1, +1, 0]] (G4 stabilises Kapha)
M_CpG = [[+3, −1, −1], [−1, +1, 0], [−1, 0, +1]] (CpG enriches Kapha)
M_TATA = [[−1, +5, −1], [+1, +5, −1], [−1, −1, 0]] (TATA = Pitta maximum)
3. The Prakriyā—Ordered Grammar of a Full Sequence
The Prakriyā (derivational path) is the ordered matrix product across all L−1 junctions in a sequence of length L:
Φ(s) = ∏_{i=1}^{L-1} T_i = T_{L-1} · T_{L-2} · … · T_1 ∈ ℝ3ˣ3
Φ(s) is the Dosha transformation operator of sequence s. The dominant left eigenvector of Φ(s) is the Prakriti vector of the sequence—its intrinsic Dosha identity, independent of starting state. The 64-Kalā feature vector is a sufficient statistic for the dominant spectral properties of Φ(s).
4. Grammatical Fragility—the Condition Number of the Local Junction
Definition (Grammatical Fragility).Position i is fragile if a small perturbation to T_i produces a large change in the cumulative Φ(s). This is the condition number:
φ_i(s) = κ(T_i) = σ_max(T_i) / σ_min(T_i)
Numerically verified: neutral junction κ = 1.000; G4 position κ = 4.708; compound G4+CpG κ = 4.375; TATA box κ = 78.909. The per-position score φ̃_i used in this paper is the discretised approximation Σ_x α_x·𝟙[element x at position i], a conservative lower bound on κ(T_i) − 1.
Theorem (Fragility Amplification).For a variant δT_i at fragile position i, the effect on the downstream Prakriyā is bounded by:
‖δΦ‖2 ≤ ‖T_{L-1}…T_{i+1}‖2 · ‖δT_i‖2 · ‖T_{i-1}…T_1‖2
5. The Dosha Shift Operator—the Mathematics of Misdirection
A variant at position i replaces T_i with T_i + δT_i. The shift in the Prakriti vector is:
Δd = (Φ_mut − Φ_ref) · d_1 = [T_{L-1}…T_{i+1} · δT_i · T_{i-1}…T_1] · d_1
The Dosha shift Δd = (Δκ, Δπ, Δν)ᵀ encodes the direction of regulatory misdirection.
The Grammar Shift Prediction Rule: Predicted disease Dosha = argmax_D(Δd) if Δd ≠ 0. Validated empirically: 38.9% directional concordance across 6,975 GWAS variants (p = 2×10⁻⁵). For APOE at the G4 anchor position, the computed Δκ = −0.903 (loss of Kapha structural identity), predicting Pitta-class disease consequence in a Kapha-tissue gene—the neuroinflammatory Alzheimer’s phenotype. See Box 4.
The Shannon channel capacity of the full Pāṇinian channel is C = log2(3) = 1.585 bits. The 45.1% 64-Kalā classifier accuracy corresponds to approximately 0.043 bits mutual information—2.7% of theoretical capacity. Full Prakriyā computation (replacing the 64-feature approximation with the explicit matrix product) is predicted to substantially increase classification accuracy and constitutes the methodological advance planned for Paper 3.
Results
The 64-Kalā Grammar Classifies Organ-System Identity Above Chance (Figure 1 and Figure 2)
We extracted 2 kb sequences upstream of the transcription start site (TSS) for 9,299 human protein-coding genes from the hg19 reference genome [9], defining the nucleosome-free region (NFR) that encompasses the proximal and medial promoter zones. For each sequence we computed 64 grammatical features in four categories—STHANA (G4 density, CpG architecture, thermodynamic stability, repeat content), SANDHI (junction gradient sharpness, palindromic organisation, boundary characteristics), AVAKĀŚA (nucleosome exclusion architecture, CTCF density), and DOSHA-composition (transposable element grammar)—yielding the 64-Kalā feature matrix (9,299 × 64) (Figure 1).
A Random Forest classifier [10] trained on this matrix achieved 45.1% balanced accuracy (5-fold cross-validation, n = 9,299), compared to a 33.3% random expectation—a 35% relative improvement using sequence grammar alone, without any protein annotation, transcription factor database, or chromatin accessibility data (Figure 2A). Feature importance analysis identified G4 density (Kruskal-Wallis H = 98.2), CTCF density (H = 95.6), and repeat content (H = 92.5) as the strongest discriminators, followed by thermodynamic gradient metrics (H = 69.0–69.6) and CpG density (H = 63.3) (Figure 1,feature importance legend)). Kapha genes showed the highest G4 density (mean 0.360 vs 0.292 Pitta, 0.301 Vāta), consistent with the known enrichment of G4 structures in brain and cardiac developmental gene promoters.
In the framework of the Pāṇinian transformation algebra, the 64-Kalā is a sufficient statistic for the dominant spectral properties of the sequence Prakriyā Φ(s). The 45.1% accuracy confirms that the Prakriyā contains discriminating information about organ-system identity—that the physical grammar is real and measurable. Having confirmed this, we next asked where in the promoter sequence the discriminating information is most tightly concentrated, and what it looks like when it is disrupted.
Grammatical Fragility Defines Dosha-Critical Positions—And Disease Variants Cluster There (Figure 3, Figure 4 and Figure 5)
Not all positions in the regulatory grammar are equally critical. G4 runs, CpG dinucleotides, sharp thermodynamic gradient junctions, palindromic cores, and TATA boxes represent positions where a single nucleotide substitution disrupts not just a local motif but the broader grammatical context. We formalised this as a per-position fragility score φ̃ by summing five weighted grammar elements at each position (G4 +4.0, CpG +3.0, ΔG +1.0–2.0, palindrome +2.0, TATA +5.0), approximating the condition number κ(T_i) of the local Sandhi transition matrix. Fragility scores range from 0 (grammatically neutral) to >10 at compound motif intersections. Example landscapes across three genes are shown in Figure 3: fragile positions are sparse (median φ̃ = 2.0) but occupy stereotyped architectural positions predominantly in the medial zone 500–1,500 bp upstream of the TSS.
We downloaded 889,016 GWAS Catalog variants [11] and mapped them to the 9,299 NFR windows, yielding 6,977 variant-gene pairs. Dosha concordance—the match between gene Dosha and GWAS trait Dosha—rises monotonically with fragility threshold: from 45.5% at all positions (p = 5.85 × 10−36) to 78.5% at fragility ≥5 (n = 437, p = 2.17 × 10−83) (Figure 4A-B). The zone stratification provides a critical internal control. The proximal zone (0–500 bp from TSS) shows 23.5% concordance—below the 33.3% random expectation (p = 1.0, no enrichment). The medial zone (500–1,500 bp) shows 60.2% concordance (p < 0.0001). This is not a failure at the proximal zone: it is the population-genetic signature of purifying selection having eliminated all Dosha-specific variation from the core promoter. The grammar predicts exactly where it will operate, and the GWAS data confirms it (Figure 4C).
Box 1. The Sandhi Grammar of Splice-Site Disease—Three Worked Examples
Splice donor and acceptor positions—where φ̃ = 7.0 and κ(T_splice) = 55—are the most fragile regulatory positions in the genome after the TATA box. Three canonical pathogenic variants illustrate that the same grammar score applied to three different Dosha genes produces three different Dosha diseases.
DMD c.9563+1G>T (Kapha): Destroys the GT donor at exon 65. Exon 65 skipping removes 37 amino acids from the dystrophin rod domain; sarcolemmal integrity fails. Disease: Duchenne muscular dystrophy (Kapha). Dosha shift: Δκ = +0.143, Δπ = −0.333, Δν = +0.524. Gene Dosha = Disease Dosha ✓
LDLR c.1359-1G>C (Pitta): Destroys the AG acceptor before exon 10. Exon 10 skipping removes the EGF homology domain required for hepatic receptor recycling; plasma LDL rises 3–6×. Disease: Familial hypercholesterolaemia (Pitta). Dosha shift: Δκ = −0.433, Δπ = −0.433, Δν = +0.134. Gene Dosha = Disease Dosha ✓
CFTR c.3717+1G>A (Vāta): Destroys the GT donor at exon 19. Exon 19 skipping removes NBD2 ATP-binding domain; CFTR fails to reach the cell surface. Airway epithelial chloride transport fails. Disease: Cystic fibrosis (Vāta). Dosha shift: Δκ = +0.458, Δπ = +0.375, Δν = +0.167. Gene Dosha = Disease Dosha ✓
All three share identical grammar parameters (φ̃ = 7.0, κ = 55). The disease specificity comes not from the variant but from the gene. The junction rule is universal; the biological consequence is encoded in the physical context of the gene body in which the junction sits.
Independent Clinical Validation in ClinVar Confirms Zone Architecture and Dosha Concordance
A single dataset establishes signal. An independent dataset with a different ascertainment process establishes replication. We analysed 4,397,647 ClinVar variants (GRCh37) [12], of which 23,544 mapped to the 9,299 NFR windows. ClinVar is assembled by clinical laboratories independently of population-based GWAS, enriched for rare and private variants with strong phenotypic annotation. If the grammar is real, the same zone architecture must appear without parameter re-fitting.
The proximal zone (0–500 bp from TSS) yields 32.9% Dosha concordance—statistically indistinguishable from random (p = 0.62, n = 1,045). The medial zone (500–1,500 bp) yields 72.8% concordance (p = 1.26 × 10−178, n = 1,248) (Figure 5A), independently replicating the GWAS finding. The 3×3 Dosha confusion matrix for the medial zone (Figure 5B) gives χ2 = 946.4, p = 1.50 × 10−203. Kapha genes show 81% diagonal concordance, Vāta genes 86%, Pitta genes 45%—consistent with the greater physiological homogeneity of Kapha and Vāta tissues relative to the metabolic diversity of Pitta organs. At splice donor and acceptor positions—the most invariant Sandhi junctions in the genome—81.0% of variants are pathogenic or likely pathogenic (OR = 138.7 vs regulatory baseline, p < 10−300). Complete disruption of the GT/AG Sandhi consensus is clinically deterministic: these are the nitya sūtras of the regulatory genome, whose violation is not context-dependent.
Box 2. The Zone Architecture of Grammar—Three Worked Examples
The most counterintuitive finding is the proximal zone showing no signal. It is not a failure. It is the proof: purifying selection has made the core promoter grammatically featureless for Dosha-specific disease.
MLH1 c.-93G>A (ClinVar 89600, Proximal zone, −93 bp, φ̃ = 3.0, κ = 2.1): Disrupts Sp1 binding in the core promoter—a housekeeping TF shared across all tissue types. Lynch syndrome causes cancer at four distinct sites: colorectal (Pitta), endometrial, ovarian, and urinary tract (Vāta). No single Dosha classification is possible. This is exactly what the grammar predicts for the proximal zone: constitutive TF grammar produces constitutive (multi-Dosha) disease when disrupted. Concordance: ✗—expected, confirms the grammar.
DDN rs7980731 (Medial zone, −611 bp, φ̃ = 6.0, κ = 3.7): G4-containing medial zone position in a neural cytoskeletal gene. GWAS association: cognitive resilience to Alzheimer’s disease pathology. Gene Dosha: Kapha. Disease Dosha: Kapha. Concordance: ✓ G4 grammar at −611 bp controls SP1/KLF4 recruitment; disruption impairs constitutive neuronal expression in Kapha structural tissue.
ABCC3 rs1879110 (Medial zone, −1,170 bp, φ̃ = 8.0, κ = 4.0): Highest fragility in our medial Pitta dataset. ABCC3 is a hepatic bile acid transporter—Pitta at maximum. GWAS association: total cholesterol (p = 5.4 × 10⁻¹⁶). Gene Dosha: Pitta. Disease Dosha: Pitta. Concordance: ✓ The SRE/HNF4α binding zone at −1,170 bp encodes hepatic-specific identity; variant disrupts this grammar; Pitta metabolic consequence follows.
Evolutionary Constraint—Fragile Positions are Depleted in 125,748 Genomes
Two variant databases agree on the zone architecture and Dosha concordance. Both could share biases. The cleanest validation is evolutionary: are grammatically fragile positions protected across the general population, independently of any clinical ascertainment? We intersected 28,976 gnomAD variants [13] (125,748 genomes, excluding CpG sites to avoid methylation artefacts) with the 9,299 NFR windows and computed per-position allele frequencies stratified by fragility score.
At tolerant positions (φ̃ = 0), 7.3% of variants are common (AF ≥ 1%). At fragile positions (φ̃ ≥ 3), only 5.2% are common. Fisher exact test: OR = 0.698, p = 2.97 × 10⁻⁵. Fragile positions are significantly depleted for common variants—30% less likely to carry a common allele than tolerant positions. The depletion is consistent across all three Dosha groups (Figure 6). Spearman ρ = −0.45 between fragility score and proportion of common variants confirms the monotonic gradient.
Box 3. Deep Time—gnomAD Confirms the Grammar Across 125,748 Genomes
gnomAD does not know about Pāṇini. The depletion at fragile positions is a prediction of physics confirmed by population genetics across hundreds of thousands of years of ancestral selection.
GFAP (Kapha, astrocyte cytoskeleton): Fragile positions (φ̃ ≥ 3): 4.5% common. Tolerant positions (φ̃ = 0): 22.4% common. Depletion: −17.8 percentage points. The G4+CpG convergence at −1,400 to −1,500 bp—the SP1/KLF4 binding anchor—carries 0.0% common variants across the entire gnomAD dataset.
INS (Pitta, pancreatic insulin): Fragile positions: 4.2% common. Tolerant positions: 17.8% common. Depletion: −13.6 pp. Four consecutive 100 bp windows at −1,500 to −1,100 bp—the insulin gene enhancer (IGE) zone, where FOXA2, PDX1, and NEUROD1 bind—carry zero common variants across the full gnomAD dataset. Not low frequency. Zero. Any variant arising at these positions has been eliminated before reaching 1% frequency across the entire history of the human population.
COL1A2 (Vāta, dermal collagen): Fragile positions: 1.9% common. Tolerant positions: 12.2% common. Depletion: −10.2 pp. Seven consecutive 100 bp windows in the medial zone carry zero common variants—the palindromic+CpG grammar zone that encodes fibroblast-specific identity.
The genome has been protecting the grammar for the entire history of our species—and for millions of years of primate evolution before that. We are reading the constraints of an ancient biological language, and finding that its most sacred rules have never been violated.
Grammar Errors Are Directed—The Dosha Shift Mechanism
Evolution protects grammar. When that protection fails—when a fragile position is disrupted in a specific individual—the question is whether the failure is random or directed. The grammar shift prediction rule (Section: Mathematical Framework, §5) states that a variant at fragile position i produces a Dosha shift vector Δd whose dominant component predicts the disease Dosha. We tested this across 6,975 GWAS-NFR variants by computing the grammar shift direction for each variant and comparing to the GWAS trait Dosha.
The grammar preservation rate rises monotonically with fragility: 36.1% at all thresholds to 67.8% at φ̃ ≥ 5. Among variants that do shift grammar, 38.9% produce shifts concordant with GWAS trait Dosha (p = 2.0 × 10⁻⁵, vs 33.3% random; Figure 7). The Kapha-to-Pitta shift is the most mechanistically transparent: in 71% of classifiable cases, a Kapha gene with Kapha-to-Pitta grammar shift is associated with a Pitta-class disease. This is not a statistical coincidence. It is the physical consequence of a G4-depleting mutation converting a stable structural regulatory context into a metabolic-responsive one.
Box 4. The Grammar Shift—APOE and the Misdirection Mechanism
Grammar errors in Box 1, Box 2 and Box 3 were stories of violation—function lost. Box 4 shows misdirection: a gene that does not stop working, but starts working for the wrong organ system.
APOE: a two-channel regulatory grammar. The APOE promoter is predominantly Pitta in grammar (58–82% of medial zone windows)—consistent with its hepatic role in lipoprotein metabolism. But a critical Kapha anchor exists at −618 bp: a G4/CpG convergence (φ̃ = 10.0, κ = 2.8) that recruits SP1/KLF4 in brain astrocytes. This is Channel 1: the Kapha programme. The thermodynamic gradient junctions throughout the medial zone are Channel 2: the Pitta programme. In normal brain, Channel 1 is active and suppresses Channel 2.
The grammar shift. A G→A variant at −618 bp destroys the G4 run. Channel 1 is weakened: φ̃ drops from 10.0 to 4.0; the NHE zone Dosha shifts from K=19%/P=69% to K=10%/P=82%. Channel 2 is no longer suppressed. NF-κB and AP-1 gain access to the APOE promoter in brain tissue. The computed Dosha shift vector: Δκ = −0.903, Δπ = +0.086—dominant loss of Kapha identity, marginal gain of Pitta.
The disease consequence. APOE does not go silent. It activates in response to metabolic stress and inflammatory signals—Pitta signals—in a Kapha organ. Microglial inflammatory activation, lipid droplet accumulation, blood-brain barrier lipid transport failure: Pitta metabolic pathology in brain. Gene Dosha: Kapha. Grammar shift: Kapha→Pitta. Predicted disease Dosha: Pitta. Observed disease: neuro-inflammatory Alzheimer’s. Concordance: ✓ This is not deletion. It is misdirection. The grammar predicted the direction from the physical character of the nucleotide substitution alone.
The Grammar Is a cis-Regulatory Landscape Principle—Intronic Enhancers Reach 94% Concordance
The grammar shift operates at the promoter NFR. Whether it operates across the entire cis-regulatory landscape—at the intronic enhancers that harbor 58% of all GWAS disease variants—is the final test. We stratified the 6,976 GWAS-NFR variants by regulatory context annotation. Intronic variants (n = 4,045) predominantly overlap active enhancers within gene bodies; promoter/UTR variants (n = 1,033) represent the proximal layer studied in Figure 2, Figure 3, Figure 4 and Figure 5; distal intergenic variants (n = 1,898) represent putative distal regulatory elements.
The intronic enhancer concordance gradient shows the strongest result. At fragility ≥ 0, intronic variants show 52.3% Dosha concordance (p = 3.69 × 10⁻³¹). This rises monotonically to 94.0% at fragility ≥ 5 (n = 301, p = 2.52 × 10−110; Figure 8A). Promoter/UTR and distal intergenic variants show weaker signals at equivalent thresholds. The grammar is not promoter-specific: it encodes Dosha identity at every active regulatory element across the gene body. Intronic enhancers outperform the proximal promoter because they are exclusively tissue-specific—they carry no housekeeping component to dilute the Dosha-specific signal.
We further tested whether three-dimensional chromatin organization amplifies grammar errors, using Rao et al. 2014 GM12878 Hi-C TAD [14] calls (9,274 domains). Although GM12878 is a lymphoblastoid cell line rather than one of our ten Dosha-assigned tissues, TAD boundaries are largely invariant across cell types [12,26]—making this a reasonable structural proxy for tissue-specific chromatin neighborhood organization. Tissue-specific Hi-C data for all ten Dosha tissues would be expected to show stronger effects. Of the 1,024 TADs containing two or more Dosha-classified genes, 314 are pure-Dosha (all genes within the domain share the same Dosha) and 710 are mixed-Dosha (genes of different Dosha classes co-occupy the same chromatin domain) Variants in mixed-Dosha TADs show consistently higher concordance than those in pure-Dosha TADs across all fragility thresholds (fragility ≥ 0: 46.4% vs 39.5%, p = 2.11 × 10⁻¹⁰ vs 1.25 × 10⁻⁵; Figure 8B). When Dosha-discordant regulatory elements are co-located within a shared chromatin domain, grammar errors are more precisely directed—the competing Dosha programme is physically poised to capture the disrupted gene. Grammar errors in mixed-Dosha TADs are misdirections with a specific target already present in cis.
Taken together, the grammar operates at every tier of cis-regulatory organisation: the promoter NFR (Figure 2, Figure 3, Figure 4, Figure 5, Figure 6 and Figure 7), the intronic enhancer (Figure 8A), and the TAD-level chromatin neighbourhood (Figure 8B). It is not a promoter theory. It is a theory of how organ-system identity is encoded across the regulatory genome, at every position where active regulatory grammar exists. Its disruption, wherever it occurs, is directed by the same physical rules.
Grammatical Fragility Predicts Organ-System Identity—CADD Deleteriousness Does Not
The five results above establish that grammatical fragility predicts the organ-system identity of disease. A direct comparison with state-of-the-art variant scoring tools is necessary to establish that this signal is genuinely orthogonal to deleteriousness—the property existing tools measure. We obtained CADD scores for 700 of the GWAS-NFR variants via the myvariant.info API. CADD [15] is the leading computational predictor of variant deleteriousness, combining 63 genomic annotations to produce a scaled Phred score that predicts whether a variant is damaging. We ask a different question from CADD: not whether the variant is damaging, but where the damage manifests.
Stratifying variants into CADD quintiles, concordance between gene Dosha and GWAS trait Dosha shows no consistent gradient (Spearman ρ = 0.087, p = 0.021; Figure 9A). CADD carries minimal information about organ-system specificity—a quantitative confirmation that deleteriousness and organ identity are orthogonal biological properties. In contrast, the fragility gradient within the same variant set is striking: concordance rises from 39.3% at tolerant positions (φ̃ = 0) to 90.7% at high-fragility positions (φ̃ ≥ 5, n = 248, p = 6.7 × 10−80; Figure 9B). After partial correlation controlling for CADD, the fragility-concordance relationship remains significant (r = 0.130, p = 0.005), confirming that the grammar captures a dimension of variant biology that deleteriousness scoring cannot access.
This orthogonality is the mechanistic core of the framework. CADD answers the question: is this variant functionally significant? The Pāṇinian grammar answers a different question: if this variant disrupts function, which organ programme does it displace? The two questions address different levels of biological organization—and they require different mathematical structures. CADD aggregates evolutionary and functional annotations. The grammar computes organ-system identity directly from the physical properties of DNA sequence—how nucleotides stack, how junctions form, how local structure responds to substitution—without evolutionary comparison or functional annotation. Both are necessary. Neither is sufficient alone.
The Grammatical Constraint on Fragile Positions Is Universal—Cross-Population Replication Across Four Independent gnomAD Super-Populations
The evolutionary depletion result in Figure 6 was computed on gnomAD v2.1.1 as a whole, without population stratification. A critical question follows: is the depletion a property of the grammar, or an artifact of the European-dominated composition of gnomAD? We answered this by querying gnomAD v2.1.1 population-stratified allele frequencies for 24,339 variants across 2kb promoter windows of 124 genes, using the same hg19 coordinates and fragility scores as the main analysis. Four super-populations had sufficient variant counts for independent tests: AFR (African/African-American), AMR (Latino/Admixed American), EAS (East Asian), and EUR (Non-Finnish European).
All four populations independently show depletion of common variants at grammatically fragile positions (Figure 10): AFR OR = 0.844 (p = 0.010); AMR OR = 0.758 (p = 0.001); EAS OR = 0.645 (p = 6.5 × 10⁻⁶); EUR OR = 0.799 (p = 0.008). The effect is consistent across all four, ranging from OR = 0.645 in East Asian to OR = 0.844 in African populations. No population shows OR > 1.
The African result carries particular scientific weight. AFR populations carry the deepest human genetic diversity, representing lineages that predate the out-of-Africa migration by tens of thousands of years. That fragile positions are depleted for common variants in AFR genomes—independently of the European signal—means the grammatical constraint was established at least 100,000 years before present, before the divergence of non-African populations. The grammar did not evolve to serve one population or one demographic history. It is a universal property of the human regulatory genome, maintained by purifying selection across the entire span of our species. The physical rules that make a promoter position grammatically critical are the same rules that have been preserved from the earliest human populations to the present day.
Discussion
What the Grammar Means for Organ Identity Encoding
The central result of this study—that physical grammar of DNA predicts disease Dosha with 78.5% accuracy at grammatically fragile positions, rising to 94.0% in intronic enhancers—emerges from a framework derived from the physical chemistry of DNA and the logical structure of Pāṇini’s generative grammar. No training on disease data, no transcription factor binding databases, no chromatin accessibility measurements were used. The grammar is derived from first principles: the thermodynamic stability of G-quadruplex structures, the methylation-resistance of CpG dinucleotides, the nucleosome-positioning logic encoded in thermodynamic gradient junctions, the strand-symmetry properties of palindromic sequences, the transcription-initiation geometry of TATA-proximal elements, and the repeat-element composition that defines interface and exchange epithelia. That these physical properties encode organ-system identity is not a hypothesis the data supports—it is a mathematical consequence of the Tridosha classification of matter, confirmed by five independent experimental tests.
Perhaps the most mechanistically informative finding is the zone architecture. The proximal core promoter (0–500 bp from TSS) shows concordance indistinguishable from chance in both the GWAS and ClinVar analyses. This is not a failure. It is confirmation that grammar operates by selection: the core promoter is under such intense purifying selection that no Dosha-specific variation survives to appear in either dataset. The INS promoter provides the extreme case: four consecutive 100 bp windows at −1,100 to −1,500 bp—the insulin gene enhancer zone—carry zero common variants across the entire gnomAD dataset of 125,748 genomes. The grammar does not need to be told where to look; the biology of selection reveals it. The medial zone (500–1,500 bp) is where combinatorial TF grammar encodes tissue specificity, and this is precisely where the fragility-concordance gradient is strongest.
The Borzoi deep learning model [16], trained on hundreds of cell types without any knowledge of Tridosha, spontaneously recovers the Tridosha tissue grouping in its principal component representation: PC2 separates Pitta tissues (liver, intestine, pancreas) from all others; PC3 separates Kapha tissues (brain, heart, muscle). This is not a designed feature—it emerges from learning sequence-function relationships across the genome. That the same three-way grouping is recovered by both a purely physical grammar framework and a data-driven deep learning model provides strong independent validation that Tridosha partitioning reflects genuine structure in the regulatory genome.
What the Grammar Shift Means for Disease Biology
The grammar shift mechanism—the directional conversion of a gene’s regulatory Dosha identity when a fragile position is disrupted—reframes what disease means at the molecular level. The conventional model of regulatory disease is loss of function: a variant impairs TF binding, reduces expression, causes haploinsufficiency. The grammar shift model proposes something deeper: the gene does not lose function. It acquires the wrong function—the function appropriate to a different organ system. A Kapha gene that acquires Pitta grammar does not go silent; it becomes responsive to metabolic and inflammatory signals that would be appropriate in a hepatocyte but catastrophic in an astrocyte. The disease is not a deletion. It is a misdirection.
APOE provides the paradigm case [17]. Its promoter is predominantly Pitta grammar (58–82% across most medial zone windows), consistent with its hepatic lipoprotein biology. The Kapha channel—the G4/CpG anchor at −618 bp that drives stable astrocytic expression—is the critical minority component that keeps APOE serving its structural CNS role. When this anchor is disrupted, the dominant Pitta programme is released in brain tissue. The result is the specific inflammatory-metabolic phenotype of APOE-risk Alzheimer’s disease: microglial lipid accumulation, NF-κB activation, blood-brain barrier lipid transport failure—Pitta pathology in the Kapha organ of the brain. The grammar shift predicts this mechanism from the physical character of the nucleotide substitution alone, without access to the clinical phenotype database.
The mixed-Dosha TAD amplification effect provides the three-dimensional explanation for why grammar shift diseases are so specific. When a Kapha gene shares a chromatin domain with Pitta regulatory elements—as TREM2 and APOE do in brain astrocyte Hi-C data—the Pitta programme is physically adjacent and poised to capture the Kapha gene if its Channel 1 grammar fails. Grammar disruption in this context is not merely a loss of Kapha identity; it is the physical delivery of the gene into an existing, immediately proximate Pitta regulatory programme. This is why the concordance at mixed-Dosha TADs (46.4%) exceeds that at pure-Dosha TADs (39.5%): the misdirection has a target, and the target is already present in cis. The predicted mechanism—CTCF insulator disruption at Kapha-Pitta TAD boundaries producing Pitta-class disease in Kapha-tissue genes—is the next untested consequence of this framework, requiring tissue-specific Hi-C from brain, hepatic, and dermal cell types.
The Pitta-to-Kapha shift has the opposite consequence: a metabolic gene promoter that acquires G4/CpG stability character resists FOXA2 pioneer factor binding, becomes susceptible to CpG hypermethylation, and loses inducibility in response to metabolic signals. This is the grammar basis of promoter silencing in type 2 diabetes and non-alcoholic fatty liver disease. The Kapha-to-Vāta shift converts a structural promoter into one responsive to retroelement-derived transcription factors (CTCFL/BORIS, A-MYB), producing context-dependent, asymmetric dysregulation—the characteristic Vāta disease phenotype. Each Dosha transition has a specific molecular mechanism. Each is predictable from the physical character of the fragile position disrupted.
How this Framework Differs from Existing Approaches—And What It Makes Possible
The grammar framework is distinct from all existing regulatory variant interpretation approaches in a fundamental way. Conservation-based scores (phyloP, GERP) measure whether a position has changed across species—they do not predict the direction of consequence if it changes. Functional annotation tools (RegulomeDB, CADD) aggregate evidence from chromatin and transcription factor binding data—they identify important positions but do not predict disease category from the character of the variant. Deep learning models (Enformer, Borzoi) predict molecular phenotypes from sequence with remarkable accuracy within their training distributions—but their performance degrades sharply for unseen gene loci [4,16] because they encode statistical correlations, not physical rules. A correlation cannot be extrapolated; a physical rule can.
The grammar framework makes directional, gene-agnostic predictions about disease consequence from physical chemistry alone. It does not require the gene to appear in a training set. It does not require chromatin accessibility data from the target cell type. It requires only the DNA sequence of the promoter and the physical classification of each position. This is the operationalization of Pāṇini’s insight: a sufficiently precise physical classification of the units, combined with a sufficiently precise set of transformation rules for their junctions, generates the full predictive space of the language—or in this case, the full predictive space of regulatory disease—from a compact set of primitives.
The practical implications are immediate. A grammar-based variant prioritization framework—flagging variants at high-fragility positions in the medial promoter zone of genes whose Dosha matches the trait Dosha—provides an independent line of evidence for GWAS fine-mapping and clinical variant interpretation that is orthogonal to all existing tools. It is particularly valuable for rare and private variants, where conservation scores and functional annotations are uninformative because the specific variant has not been seen before. The grammar scores every position from first principles; it is as informative for a de novo variant as for a common variant.
More broadly, the finding that regulatory grammar encodes organ-system Dosha identity opens the question of whether individual variation in the 64-Kalā grammar across the full genome of an individual constitutes a genomic readout of Prakriti—the Ayurvedic constitutional type that predicts disease susceptibility and pharmacological response. This hypothesis is the subject of ongoing investigation with Prakriti-labelled genomic cohorts and constitutes the translational extension of the present framework. The grammar of the regulatory genome may not only predict which diseases arise when it is disrupted. It may encode who we are.
Limitations and Future Directions
The disease keyword ontology for Dosha classification is necessarily approximate. Complex diseases with multi-system involvement—type 2 diabetes with neuropathic complications, systemic lupus erythematosus—may involve multiple Doshas, and our classification captures only the primary disease category. The lower Vāta concordance diagonal in the GWAS analysis (12% at fragility ≥ 2) likely reflects the physiological diversity of Vāta-classified tissues (skin, lung, kidney, testis), which share less regulatory grammar with each other than Kapha or Pitta tissues do. Refined sub-classification of Vāta tissues is expected to improve concordance. The current fragility score φ̃ is a discretised approximation to the true condition number κ(T_i); full Prakriyā computation is planned for subsequent methodological development. The analysis is based on hg19 coordinates and GWAS Catalog associations that skew toward European ancestry; extension to multi-ancestry datasets and hg38 is a priority. Tissue-specific Hi-C data from brain, hepatic, and dermal cell types is required for formal testing of the CTCF insulator grammar prediction. All five of these extensions are active directions of investigation.
Materials and Methods
1. Gene Selection and Promoter Window Definition
We extracted 2,000 bp sequences immediately upstream of the annotated transcription start site (TSS) for human protein-coding genes from the hg19/GRCh37 reference genome assembly via the Ensembl REST API [9] (GRCh37.ensembl.org). This 2 kb window encompasses the proximal promoter (0–500 bp from TSS), medial promoter (500–1,500 bp), and distal promoter (1,500–2,000 bp) zones as defined by convention and validated in our analyses. Sequences containing assembly gaps (runs of N > 10 bp), low-complexity repeats (>40% masked by RepeatMasker), or with mappability score < 0.8 (ENCODE mappability tracks [14], hg19) were excluded.
Of approximately 25,000 annotated human protein-coding genes, 9,299 met all of the following inclusion criteria: (i) unambiguous TSS annotation in Ensembl release 75 [9] (GRCh37); (ii) tissue-specific expression in at least one of the ten Dosha-assigned tissues (see Section 2) as defined by a tissue specificity index ≥ 0.4 in the Human Protein Atlas [18] (HPA) RNA consensus dataset; (iii) at least one ATAC-seq peak within the 2 kb promoter window in the relevant tissue in the HPA open chromatin dataset ; and (iv) promoter sequence passing quality filters above. Genes with ubiquitous expression across all tissues (tissue specificity index < 0.2) were excluded because Dosha assignment requires tissue-preferential expression. This filtering—not any analytical ceiling—accounts for the 9,299 gene count relative to the full coding genome. The resulting set covers all ten Dosha-assigned tissue categories with balanced representation.
It is important to note that grammatical fragility is computed entirely from the DNA sequence—specifically from the physical chemistry of dinucleotide junctions as encoded in the 64-Kalā feature space and the Sandhi transition matrix (Section 4). Fragility is therefore an intrinsic property of the sequence, independent of any particular chromatin state. ATAC-seq data were used solely to (a) confirm that the 2 kb promoter window is accessible in the relevant tissue, establishing it as a functionally active regulatory region, and (b) assign tissue-specific expression for Dosha classification. No fragility scores, Sandhi matrices, or Dosha grammar vectors are derived from chromatin accessibility data. This design ensures that the grammar scores are tissue-independent by construction and are not confounded by cell-type-specific chromatin variation.
2. Dosha Classification of Tissues and Genes
We assigned ten human tissue categories to the three constitutional regulatory principles (Tridosha) based on classical Ayurvedic organ-system mapping and the physical properties of those tissues [6,27]: Kapha (neural/structural/contractile)—Brain, Heart, Muscle, Kidney, Lung; Pitta (metabolic/transformative)—Liver, Pancreas, Small Intestine; Vāta (mobile/interface/exchange)—Testis, Skin. This assignment follows the classical Ayurvedic source texts (Charaka Samhita [6]; Vagbhata, Ashtanga Hridayam [27]) and is described in detail in [24]. Each of the 9,299 genes was assigned the Dosha of its tissue of highest specific expression as determined by the HPA RNA consensus dataset. In cases of equal expression across multiple tissues, the gene was assigned the Dosha of the tissue with the highest ATAC-seq peak score in the promoter window.
3. The 64-Kalā Feature Computation
For each of the 9,299 promoter sequences we computed 64 grammatical features organised into four physical grammar categories: STHANA (positional grammar—GC content, CpG density, nucleosome positioning parameters, G-quadruplex propensity), SANDHI (junction grammar—dinucleotide transition frequencies, thermodynamic gradient parameters, palindrome density), AVAKĀŚA (spacing grammar—repeat element spacing, motif inter-distance distributions, phasing parameters), and DOSHA (constitutional grammar—AT/GC balance, strand asymmetry, methylation-sensitive motif density). Feature definitions and their derivation from the Pāṇinian Transformation Algebra are provided in Supplementary Note S1 and Supplementary Table S1.
Feature importance was assessed by Kruskal-Wallis H-statistic across the three Dosha groups. A Random Forest classifier (scikit-learn 1.3 [10], 500 trees, max_depth=10, class_weight=balanced) was trained on the 64-feature matrix using 5-fold stratified cross-validation. Balanced accuracy was used as the primary performance metric to account for class imbalance (Kapha n=3,621, Pitta n=2,756, Vāta n=2,922). Chance expectation is 33.3% for a balanced 3-class problem.
4. Sandhi Transition Matrix and Grammatical Fragility
For each position i in the 2,000 bp promoter window, we constructed a 3×3 Sandhi transition matrix T_i encoding the probability of Dosha-state transition at that dinucleotide junction, parameterised by the five elementary perturbation matrices (G-quadruplex, CpG, thermodynamic gradient, palindrome, TATA) with weights α_G4 = 4.0, α_CpG = 3.0, α_TATA = 5.0, α_palindrome = 2.0, α_gradient = 1.5. The Prakriyā Φ(s)—the ordered matrix product over all junction positions—encodes the full grammatical identity of the sequence.
Grammatical fragility at position i is defined as the condition number κ(T_i) of the local Sandhi matrix: the ratio of the largest to smallest singular value. High condition number indicates that T_i is near-singular—a small perturbation produces a large change in the trajectory of the cumulative Prakriyā. Integer fragility scores (φ̃ = 0, 1, 2, 3, 4, 5+) are assigned by binning κ(T_i) at thresholds [1.0, 2.0, 5.0, 10.0, 20.0] respectively. Positions with φ̃ = 0 are tolerant (condition number near 1—well-conditioned); positions with φ̃ ≥ 5 are maximally fragile. The score is computed from DNA sequence alone and is independent of chromatin state, transcription factor binding data, or species conservation.
5. GWAS Variant Mapping and Dosha Concordance Analysis
We downloaded 889,016 variant-trait associations from the NHGRI-EBI GWAS Catalog [11] (release August 2023, p < 5×10⁻⁸) and mapped each variant by chromosomal position (hg19) to the 9,299 promoter windows, yielding 6,977 variant-gene-trait triplets. For each triplet, we assigned a trait Dosha by mapping the GWAS disease/trait keyword to the Tridosha classification using a manually curated disease ontology (Supplementary Table S2). Traits with no unambiguous Dosha classification (e.g., BMI, educational attainment) were excluded. Dosha concordance was defined as a binary variable: 1 if the gene Dosha matches the trait Dosha, 0 otherwise. Random expectation is 33.3% for a balanced 3-class assignment.
Concordance rates were computed within fragility bins (φ̃ = 0, 1–2, 3–4, ≥5) and across a continuous fragility threshold sweep (φ̃ ≥ 0 through φ̃ ≥ 5). Statistical significance was assessed by one-sided binomial test against the 33.3% null. Confidence intervals are 95% Wilson intervals. Spearman correlation was used for continuous fragility-concordance association. Variant context annotation (intronic, promoter/UTR, intergenic) was derived from Ensembl Variant Effect Predictor (VEP) [25] release 98 on hg19.
6. ClinVar Independent Validation
We downloaded the ClinVar variant summary [12] (GRCh37, accessed October 2023) comprising 4,397,647 total variants. Variants were filtered to: (i) pathogenicity classification of “Pathogenic” or “Likely pathogenic”; (ii) molecular consequence annotated as regulatory, non-coding, intronic, or UTR by ClinVar submitters; (iii) chromosomal coordinates mappable to the 9,299 NFR windows. This yielded 23,544 ClinVar variant-gene pairs. Trait Dosha was assigned using the same disease ontology as the GWAS analysis. No parameter re-fitting was performed—the same grammar features, fragility thresholds, and Dosha assignments derived from the GWAS analysis were applied directly. The zone architecture (proximal 0–500 bp, medial 500–1,500 bp, distal 1,500–2,000 bp) was defined prior to this analysis based on the theoretical prediction that purifying selection in the core promoter would suppress medial-zone signals in the proximal zone.
7. gnomAD Evolutionary Depletion Analysis
We downloaded gnomAD v2.1.1 genome variants [13] (GRCh37) for the promoter windows of 148 genes that had at least 50 gnomAD variants within the 2 kb window, yielding 28,976 total variants (23,543 non-CpG dinucleotide). The 148 genes were selected to balance Dosha representation (48 Kapha, 50 Pitta, 50 Vāta). Variants were classified as “common” (population allele frequency ≥ 1%) or “rare” (AF < 1%) using the gnomAD v2.1.1 global allele frequency field (AF). Each variant position was assigned a fragility score from the precomputed per-gene per-position fragility maps. Depletion of common variants at fragile positions was quantified by Fisher exact test on a 2×2 contingency table (fragile/tolerant × common/rare). Odds ratios < 1 indicate depletion (fewer common variants at fragile positions). 95% confidence intervals were computed by the Woolf method.
8. Cross-Population Replication—gnomAD v2.1.1 Population-Stratified Analysis
To test whether the evolutionary depletion signal reflects universal constraint or a European population artefact, we queried gnomAD v2.1.1 population-stratified allele frequencies for the same 124 genes with sufficient data (out of 148), using the gnomAD GraphQL API queried by genomic region (hg19 coordinates). This yielded 24,339 variants with population-stratified AF data across four super-populations: AFR (African/African-American), AMR (Latino/Admixed American), EAS (East Asian), and EUR (Non-Finnish European). SAS (South Asian) had insufficient variant counts in this gene panel and was not included. For each super-population, depletion of common variants (population-specific AF ≥ 1%) at fragile versus tolerant positions was assessed by Fisher exact test (one-sided, alternative=“less”). The same fragility thresholds and gene-position maps as the main gnomAD analysis were used without modification. Approximate super-population divergence times were taken from McEvoy et al.[19] for AFR-EAS (~66 kya) and AFR-EUR (~48 kya) divergence; Vallini et al. [20] for the out-of-Africa event (~70–60 kya); and Hublin et al. [21] for the earliest anatomically modern human fossil record in Africa (~300 kya). AMR colonisation time (~16 kya) from Scheib et al. [22] and others.
9. CADD Orthogonality Analysis
CADD v1.7 scores (PHRED-scaled) and gnomAD genome allele frequencies were retrieved for GWAS-NFR variants via the myvariant.info REST API [23](docs.myvariant.info), queried by rsID in batches of 500. Of 2,885 unique rsIDs in our GWAS dataset, 700 had CADD scores available and matched to variants with concordance information, yielding the analysis dataset for Figure 9. Variants were binned into CADD quintiles for Panel A. For Panel B, all 1,092 variants with classifiable Dosha concordance were used (not restricted to those with CADD scores), to maximise power for the fragility gradient. Partial correlation between fragility and concordance controlling for CADD was computed by double residualisation: fragility and concordance were each residualised on CADD by ordinary least squares, and the Pearson correlation of the residuals was computed. This approach isolates the fragility-concordance relationship that is independent of any shared variance with CADD deleteriousness.
10. Dosha Shift Analysis
For each of the 6,975 GWAS-NFR variants, the Dosha shift vector Δd = (Δκ, Δπ, Δν)ᵀ was computed as the difference between the alternative allele Prakriyā Dosha composition and the reference allele composition. A grammar error was defined as any variant producing |Δd| > 0.01 at a fragile position (φ̃ ≥ 3). The shift direction (Kapha→Pitta, Kapha→Vāta, etc.) was classified by the component of Δd with the largest absolute magnitude. Directional enrichment was tested by chi-squared goodness-of-fit against uniform expectation across the six possible shift directions.
11. TAD Boundary and cis-Regulatory Landscape Analysis
Hi-C TAD boundary calls for GM12878 (lymphoblastoid cell line) were obtained from Rao et al. 2014 [14] (GEO: GSE63525, 9,274 domains at 25 kb resolution). Each GWAS variant was assigned to a TAD by genomic overlap. TADs were classified as pure-Dosha (all Dosha-assigned genes within the domain share the same Dosha) or mixed-Dosha. Concordance rates were compared between pure- and mixed-Dosha TAD variants by Fisher exact test. We note that TAD boundaries in GM12878 may not fully represent the tissue-specific chromatin organisation of the Dosha-relevant tissues; this analysis therefore represents a conservative test of TAD-level grammar amplification, as tissue-specific Hi-C data would be expected to show stronger effects.
12. Statistical Framework
All statistical tests are one-sided where a direction was predicted a priori (concordance > 33.3%; depletion OR < 1; fragility gradient monotonically increasing) and two-sided otherwise. No corrections for multiple testing were applied within individual analyses because each test addresses a single pre-specified hypothesis. Across the eight results sections, the analyses are independent (different datasets, different statistical tests) so family-wise correction is not appropriate. Confidence intervals are 95% throughout. Wilson intervals were used for proportions; Woolf intervals for odds ratios; bootstrap percentile intervals (n = 1,000) for classifier balanced accuracy. All analyses were performed in Python 3.12 using scipy 1.12, scikit-learn 1.3 [10], numpy 1.26, and matplotlib 3.8. Code and processed data files are deposited on Zenodo (doi: 10.5281/zenodo.19145896) and the interactive web application is available at https://huggingface.co/spaces/amitpande74/paninian-regulatory-grammar.
Data Availability Statement
Reference genome sequences: hg19/GRCh37, UCSC Genome Browser and Ensembl release 75. GWAS Catalog: NHGRI-EBI, release August 2023 (www.ebi.ac.uk/gwas). ClinVar: NCBI, accessed October 2023 (www.ncbi.nlm.nih.gov/clinvar). gnomAD v2.1.1: Broad Institute [13] (gnomad.broadinstitute.org). Human Protein Atlas: version 23.0 (www.proteinatlas.org). JASPAR 2022 transcription factor binding site database (jaspar.genereg.net). Hi-C TAD data: GEO accession GSE63525 (Rao et al. 2014). CADD scores: cadd.gs.washington.edu (v1.7). All analysis code is available at Zenodo doi: 10.5281/zenodo.19028116.
Acknowledgments
We thank Tanuja Nesari, Director, All India Institute of Ayurveda (AIIA), New Delhi, whose vision for evidence-based integration of Ayurvedic principles with modern genomic science provided the intellectual and institutional foundation for the Ayurgenomics research programme within which this work was conducted. The Memorandum of Understanding between FiZ Frankfurter Innovationszentrum Biotechnologie and AIIA, signed in New Delhi in October 2019 under the auspices of the German-Indian government consultations, established the framework that made this collaboration possible. gnomAD data were accessed from the Broad Institute gnomAD browser. GWAS Catalog data from EMBL-EBI. ClinVar data from NCBI. Hi-C TAD boundary data from Rao et al. 2014 (GEO: GSE63525).
References
- ENCODE Project Consortium. An integrated encyclopedia of DNA elements in the human genome. Nat 201248957–74 Doi101038nature11247.
- The GTEx Consortium, Aguet F, Anand S, Ardlie KG, Gabriel S, Getz GA, et al. The GTEx Consortium atlas of genetic regulatory effects across human tissues. Science. American Association for the Advancement of Science; 2020;369:1318–30. [CrossRef]
- Kawaji H, Kasukawa T, Forrest A, Carninci P, Hayashizaki Y. The FANTOM5 collection, a data series underpinning mammalian transcriptome atlases in diverse cell types. Sci Data. 2017;4:170113. [CrossRef]
- Drusinsky S, Whalen S, Pollard KS. Deep-learning prediction of gene expression from personal genomes. Genome Biol. 2026;27:19. [CrossRef]
- Sharma R, Pāṇini. The Aṣṭādhyāyī of Pāṇini. 2002. https://api.semanticscholar.org/CorpusID:60481470.
- P. V. Sharma (Ed.). Caraka Samhita.
- Bhishagratna, K. L. Sushruta Samhita. Kolkata: Classical Ayurvedic Text; 1907.
- Sharma P. Dravyaguna Vigyan. Varanasi: Chaukhamba Bharti Academy; 2018.
- Cunningham F, Allen JE, Allen J, Alvarez-Jarreta J, Amode MR, Armean IM, et al. Ensembl 2022. Nucleic Acids Res. 2022;50:D988–95. [CrossRef]
- Pedregosa F et al. Scikit-learn: Machine learning in Python. Journal of Machine Learning Research. 2011;12:2825–2830 [Internet]. https://jmlr.org/papers/v12/pedregosa11a.html.
- Buniello A et al. The NHGRI-EBI GWAS Catalog of published genome-wide association studies, targeted arrays and summary statistics. Nucleic Acids Res 201947D1D1005–D1012 Doi101093nargky1120.
- Landrum MJ, Chitipiralla S, Brown GR, Chen C, Gu B, Hart J, et al. ClinVar: improvements to accessing data. Nucleic Acids Res. 2024;52:D1267–75. [CrossRef]
- Gudmundsson S, Singer-Berk M, Watts NA, Phu W, Goodrich JK, Solomonson M, et al. Variant interpretation using population databases: Lessons from gnomAD. Hum Mutat. John Wiley & Sons, Ltd.; 2022;43:1012–30. [CrossRef]
- Rao SSP, Huntley MH, Durand NC, Stamenova EK, Bochkov ID, Robinson JT, et al. A 3D Map of the Human Genome at Kilobase Resolution Reveals Principles of Chromatin Looping. Cell. 2014;159:1665–80. [CrossRef]
- Schubach M, Maass T, Nazaretyan L, Röner S, Kircher M. CADD v1.7: using protein language models, regulatory CNNs and other nucleotide-level scores to improve genome-wide variant predictions. Nucleic Acids Res. 2024;52:D1143–54. [CrossRef]
- Linder J, Srivastava D, Yuan H, Agarwal V, Kelley DR. Predicting RNA-seq coverage from DNA sequence as a unifying model of gene regulation. Nat Genet. 2025;57:949–61. [CrossRef]
- Alzheimer’s Disease Neuroimaging Initiative, Shi Y, Yamada K, Liddelow SA, Smith ST, Zhao L, et al. ApoE4 markedly exacerbates tau-mediated neurodegeneration in a mouse model of tauopathy. Nature. 2017;549:523–7. [CrossRef]
- Uhlén M, Fagerberg L, Hallström BM, Lindskog C, Oksvold P, Mardinoglu A, et al. Tissue-based map of the human proteome. Science. 2015;347:1260419. [CrossRef]
- McEvoy BP, Powell JE, Goddard ME, Visscher PM. Human population dispersal “Out of Africa” estimated from linkage disequilibrium and allele frequencies of SNPs. Genome Res. 2011;21:821–9. [CrossRef]
- Vallini L, Zampieri C, Shoaee MJ, Bortolini E, Marciani G, Aneli S, et al. The Persian plateau served as hub for Homo sapiens after the main out of Africa dispersal. Nat Commun. 2024;15:1882. [CrossRef]
- Hublin J-J, Ben-Ncer A, Bailey SE, Freidline SE, Neubauer S, Skinner MM, et al. New fossils from Jebel Irhoud, Morocco and the pan-African origin of Homo sapiens. Nature. 2017;546:289–92. [CrossRef]
- Scheib CL, Li H, Desai T, Link V, Kendall C, Dewar G, et al. Ancient human parallel lineages within North America contributed to a coastal expansion. Science. 2018;360:1024–7. [CrossRef]
- Xin J, Mark A, Afrasiabi C, Tsueng G, Juchler M, Gopal N, et al. High-performance web services for querying gene and variant annotation. Genome Biol. 2016;17:91. [CrossRef]
- Pande A, Sharma R, Garbe C. Protein composition, not mutation identity, determines disease manifestation. Preprints. 2026;203934. https://preprints.org/manuscript/203934.
- McLaren W, Gil L, Hunt SE, Riat HS, Ritchie GRS, Thormann A, Flicek P, Cunningham F. The Ensembl Variant Effect Predictor. Genome Biol. 2016;17:122. [CrossRef]
- Schmitt AD, Hu M, Jung I, Xu Z, Qiu Y, Tan CL, Li Y, Lin S, Lin Y, Barr CL, Ren B. A compendium of chromatin contact maps reveals spatially active regions in the human genome. Cell Rep. 2016;17(8):2042-2059. [CrossRef]
- Vagbhata. Ashtanga Hridayam. c. 7th century CE. English translation: Murthy KRS. Krishnadas Academy, Varanasi, 1991.
Figure 1.
The 64-Kalā grammar wheel. The 64-Kalā feature space depicted as a wheel of 64 arcs organised into four quadrants. Arc opacity encodes feature importance (Kruskal-Wallis H-statistic across Dosha groups): fully opaque arcs (H > 80) indicate strong discriminatory power; near-transparent arcs (H < 5) negligible discrimination. Quadrant colours: green (STHANA—G-quadruplex density and run length, CpG density and O/E ratio, thermodynamic stability ΔG, GC content, sequence complexity, repeat content); purple (SANDHI—thermodynamic gradient sharpness, palindrome density and length, hairpin and cruciform potential, junction asymmetry); orange (AVAKĀŚA—CTCF density, nucleosome exclusion scores, NFR depth and width, accessibility architecture); blue (DOSHA-composition—Alu/SINE, LINE-1, DNA transposon, and HERV-LTR density and regulatory activity scores). Inset: TE mini-wheel showing each transposable element class separately, arc opacity encoding regulatory competence scores.

Figure 2.
Grammar discriminates organ-system Dosha identity. (A) Balanced accuracy of a Random Forest classifier trained on 64 grammar features from 9,299 gene promoters (5-fold cross-validation). Grammar alone achieves 45.1% versus the 33.3% random expectation (p < 10-48). (B) Radar plot of normalised mean feature values for the top 10 discriminating features, stratified by Dosha: Kapha (neural/cardiac, green), Pitta (metabolic/hepatic, red), Vāta (dermal/pulmonary, blue). Kapha genes are enriched for G4 density and CpG content; Pitta genes for thermodynamic gradient sharpness and CTCF density; Vāta genes for repeat and Alu element content. (C) Feature importance (Kruskal-Wallis H-statistic), top 15 features. G4 density (H = 98.2) and CTCF density (H = 95.6) are the two strongest discriminating features.

Figure 3.
Grammatical fragility landscapes across three Dosha-representative genes. Per-position fragility score (y-axis) across the 2,000 bp promoter window (x-axis, relative to TSS) for three genes: CLU (clusterin, Kapha—neural/cardiac, green), CYP3A4 (cytochrome P450 3A4, Pitta—metabolic/hepatic, red), and KRT14 (keratin 14, Vāta—structural/dermal, blue). The fragility score sums five grammar elements at each position: G-quadruplex run membership (+4), CpG dinucleotide participation (+3), thermodynamic gradient sharpness (+1–2), palindromic core proximity (+2), and TATA box adjacency (+5). Annotations indicate highest-scoring grammar elements per promoter. Background shading: distal zone −2,000 to −1,500 bp (light blue); medial enhancer zone −1,500 to −500 bp (white); core promoter −500 to TSS (light green). The medial zone consistently harbours the majority of fragile positions across all three Doshas.

Figure 4.
GWAS concordance gradient across fragility thresholds. (A) Dosha concordance (fraction of variants where gene Dosha matches GWAS trait Dosha) as a function of grammatical fragility threshold, for 6,977 GWAS-NFR variant pairs (95% Wilson confidence intervals). Dashed line: 33.3% random expectation. At fragility ≥ 5 (n = 437), concordance reaches 78.5% (p = 2.17 × 10-83). (B) 3×3 Dosha confusion matrix at fragility ≥ 2 (n = 1,025). Diagonal cells (concordant) shown in Dosha colour. Pitta diagonal: 80%; Kapha: 44%; Vāta: 12%; χ2 = 137.3, p = 1.1 × 10⁻²⁹. (C) Concordance by sequence zone. Proximal zone (0–500 bp from TSS): 23.5%, below chance—consistent with purifying selection eliminating Dosha-specific variation at the core promoter. Medial enhancer zone (500–1,500 bp): 60.2% (p < 0.0001). Distal zone: 42.7%.

Figure 5.
ClinVar independent validation confirms zone architecture. (A) Dosha concordance by sequence zone in 23,544 ClinVar regulatory variants. Proximal zone: 32.9% (p = 0.62, not significant), consistent with purifying selection. Medial zone: 72.8% (p = 1.26 × 10-178, n = 1,248), independently replicating the GWAS finding. Distal zone: 67.7% (p = 10-100). (B) 3×3 Dosha confusion matrix for medial zone ClinVar variants (n = 1,248). Kapha diagonal: 81%; Vāta: 86%; Pitta: 45%; χ2 = 946.4, p = 1.5 × 10-203. (C) Pathogenicity rate (CLNSIG ≥ 4) for splice donor/acceptor variants (81.0%, n = 49,574) versus regulatory NFR baseline (3.0%, n = 23,544). OR = 138.7, p < 10-300 (Fisher exact). Complete disruption of the GT/AG splice Sandhi grammar yields near-deterministic clinical pathogenicity.

Figure 6.
Evolutionary depletion of common variants at fragile positions. 148 genes (48 Kapha, 50 Pitta, 50 Vāta) with at least 50 gnomAD variants in the 2 kb promoter window, comprising 28,976 total variants (23,543 non-CpG). (A) Percentage of variants with allele frequency ≥ 1% (common variants) binned by grammatical fragility score. Fragile positions (score ≥ 3) show 5.2% common variants versus 7.3% at tolerant positions (score = 0). Fisher exact OR = 0.698, p = 2.97 × 10⁻⁵. Spearman ρ = −0.45 between fragility and proportion common (non-CpG positions). (B) Depletion stratified by Dosha group. The depletion signal is consistent across all three Dosha groups, confirming that the evolutionary constraint is a property of the grammar rather than a feature of any specific gene set.

Figure 7.
Grammar errors produce directed Dosha shift consequences. 6,975 GWAS-NFR variants analysed for grammar preservation and Dosha shift direction. (A) Grammar preservation rate (fraction of variants maintaining reference Dosha grammar) stratified by fragility threshold. Preservation rises from 36.1% at fragility ≥ 0 to 67.8% at fragility ≥ 5, confirming that high-fragility positions are selectively disrupted when variants occur. (B) Dosha shift error matrix: rows = gene Dosha, columns = direction of grammar shift for variants that do change Dosha. Kapha-to-Pitta shift: 22% of Kapha gene variants; Pitta-to-Kapha: 31%. (C) Shift-concordance: among variants that produce a grammar shift, 38.9% show concordance between shift direction and GWAS trait Dosha (p = 2.0 × 10⁻⁵, n = 6,975; versus 33.3% random). Kapha-to-Pitta shifts predict Pitta-class disease in 71% of classifiable cases. (D) APOE schematic: G4/CpG anchor at −618 bp (Channel 1, Kapha programme) suppresses the dominant Pitta grammar (Channel 2) in brain tissue. G→A variant disrupts Channel 1; Channel 2 is released; neuroinflammatory Alzheimer’s disease follows.

Figure 8.
Grammar fragility operates across the full cis-regulatory landscape. (A) Dosha-disease concordance as a function of grammar fragility threshold, stratified by regulatory element type. Intronic GWAS variants (n = 4,045 total) show the strongest fragility-concordance gradient: 52.3% concordance at all fragility thresholds (p = 3.69 × 10⁻³¹), rising to 94.0% at score ≥ 5 (n = 301, p = 2.52 × 10-110). Promoter/UTR and distal intergenic variants show weaker signals. The grammar encodes Dosha identity at every active regulatory element in the gene body, not only the proximal promoter. (B) Concordance stratified by TAD (topologically associating domain) context, using Rao et al. 2014 GM12878 Hi-C TAD calls [4] (9,274 domains). TADs were classified as pure-Dosha (all classified genes share one Dosha; n = 314) or mixed-Dosha (genes from multiple Doshas cohabit the same domain; n = 710). Variants in mixed-Dosha TADs show higher concordance than those in pure-Dosha TADs at all fragility thresholds (fragility ≥ 0: 46.4% vs 39.5%, p = 2.11 × 10⁻¹⁰ vs 1.25 × 10⁻⁵). Grammar errors in mixed-Dosha TADs are more directed because the competing regulatory programme is physically proximate in the same chromatin domain.

Figure 9.
Grammatical fragility predicts organ-system disease identity independently of variant deleteriousness. (A) CADD deleteriousness score shows no relationship with Dosha concordance. Across 700 GWAS-NFR variants binned into CADD quintiles, concordance rate (fraction where gene Dosha matches GWAS trait Dosha) is shown with 95% Wilson confidence intervals. Spearman ρ = 0.087, p = 0.021—a weak correlation reflecting general regulatory enrichment, not organ specificity. A dotted horizontal line marks the mean concordance rate across quintiles, emphasising the absence of a gradient. CADD was designed to predict whether a variant is damaging; it carries no information about which organ system the damage affects. (B) Grammatical fragility shows a strong and significant gradient with Dosha concordance across 1,092 GWAS-NFR variants with classifiable Dosha. Concordance is 39.3% at tolerant positions (φ̃=0), 34.8% at low fragility (φ̃=1–2), 39.0% at moderate fragility (φ̃=3–4), and 90.7% at high-fragility positions (φ̃≥5; n=248, p=6.7×10−80). After partial correlation controlling for CADD score, the fragility-concordance relationship remains significant (r=0.130, p=0.005), confirming orthogonality with deleteriousness. Error bars: 95% Wilson confidence intervals. Dashed line: 33.3% random expectation. Stars: one-sided binomial test against 33.3% (***p<0.001). Together, the two panels demonstrate that CADD and grammatical fragility measure orthogonal biological properties: deleteriousness (whether a variant damages function) and organ-system specificity (where the damage manifests).

Figure 10.
Grammatical fragility is under evolutionary constraint universally across human populations. Depletion of common variants (AF > 1%) at grammatically fragile positions (φ̃ ≥ 3) versus tolerant positions (φ̃ = 0), computed across 24,339 gnomAD v2.1.1 variants in 2kb promoter windows of 124 genes, stratified by super-population. Analysis uses the same hg19 coordinates and fragility scores as Figure 6. The reference result (OR = 0.698, p = 2.97 × 10⁻⁵) from the full combined dataset is shown as a diamond. Population-stratified ORs are shown for four super-populations with sufficient data. All four independently show OR < 1: AFR OR = 0.844 (p = 0.010); AMR OR = 0.758 (p = 0.001); EAS OR = 0.645 (p = 6.5 × 10⁻⁶); EUR OR = 0.799 (p = 0.008). The depletion signal in the African (AFR) super-population—which carries the deepest human genetic diversity, representing lineages that predate the out-of-Africa migration—confirms that the grammatical constraint on fragile positions was established at least 100,000 years before present. The grammar is not a European population artefact. It is a universal property of the human regulatory genome. Error bars: 95% Woolf confidence intervals. SAS (South Asian) had insufficient data in this gene panel and is not shown.

Disclaimer/Publisher’s Note: The statements, opinions and data contained in all publications are solely those of the individual author(s) and contributor(s) and not of MDPI and/or the editor(s). MDPI and/or the editor(s) disclaim responsibility for any injury to people or property resulting from any ideas, methods, instructions or products referred to in the content. |
© 2026 by the authors. Licensee MDPI, Basel, Switzerland. This article is an open access article distributed under the terms and conditions of the Creative Commons Attribution (CC BY) license (http://creativecommons.org/licenses/by/4.0/).
Copyright: This open access article is published under a Creative Commons CC BY 4.0 license, which permit the free download, distribution, and reuse, provided that the author and preprint are cited in any reuse.


