Submitted:
19 March 2026
Posted:
23 March 2026
You are already at the latest version
Abstract
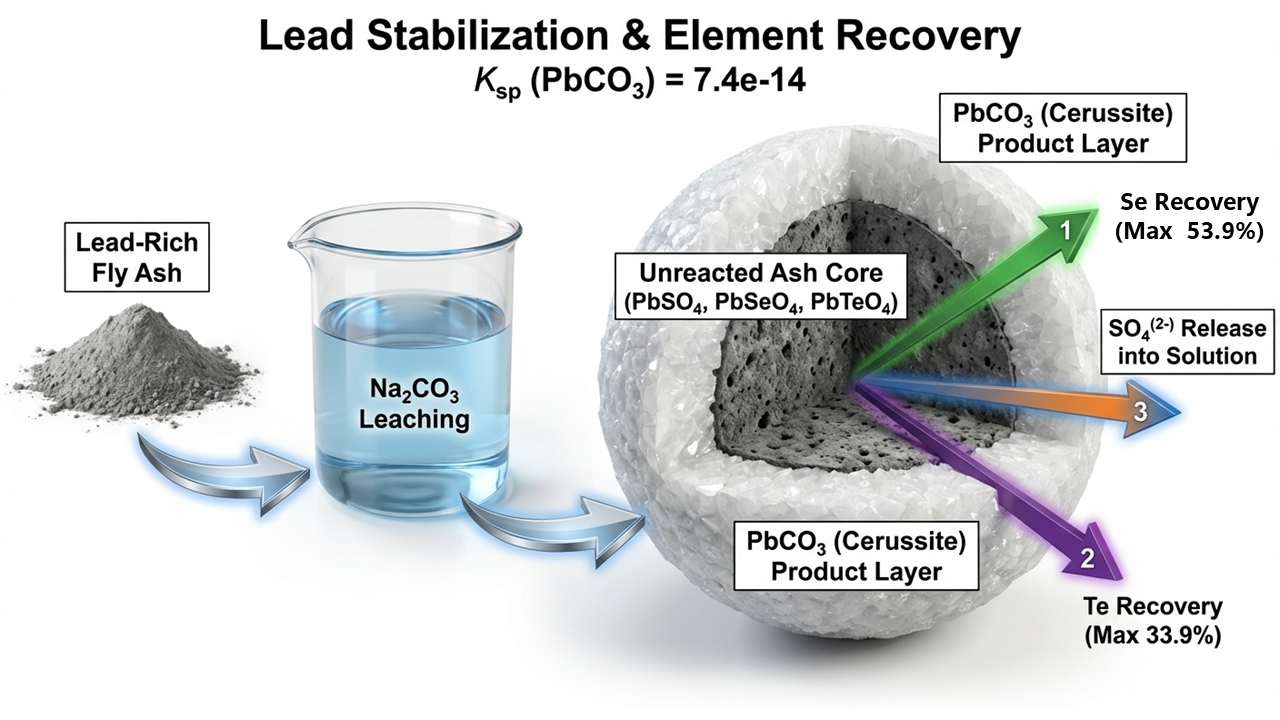
Copper anodic slime is a valuable secondary resource for precious and critical elements such as gold, silver, selenium, and tellurium. In certain industrial flowsheets, copper anodic slime is smelted together with lead to facilitate silver and gold recovery, generating a fine lead‑rich fly ash as a secondary residue. This dust contains considerable amounts of selenium and tellurium and poses significant environmental and occupational health risks due to its high lead content and sub‑micron particle size. The present study investigates sodium carbonate (Na₂CO₃) leaching as an environmentally benign pre‑treatment approach aimed at partial removal of selenium and tellurium while simultaneously stabilizing lead through carbonate formation. Rather than targeting maximum metal recovery, the process is evaluated from a detoxification‑oriented perspective suitable for safer disposal or downstream recycling of hazardous metallurgical dusts. The effects of sodium carbonate concentration, temperature, solid‑to‑liquid ratio, and leaching time on selenium and tellurium recovery were investigated using a central composite design (CCD) implemented in Design‑Expert software. Under the investigated conditions, selenium recovery reached a maximum of 53.9%, while tellurium recovery remained generally below 15%, with a maximum observed value of approximately 33.9% in a specific experimental run. Scanning electron microscopy revealed that the dust consists primarily of semi‑spherical and elongated particles, with lead carbonate precipitation occurring preferentially on particle surfaces during leaching. Energy‑dispersive spectroscopy confirmed the conversion of lead sulfate phases to lead carbonate, which progressively limited further selenium and tellurium dissolution. A brief kinetic analysis indicated that selenium dissolution follows a mixed control regime involving surface chemical reaction and diffusion through product layers, whereas tellurium leaching did not exhibit consistent kinetic behavior across the studied conditions. The results demonstrate that sodium carbonate leaching can effectively reduce the mobility of selenium and tellurium while stabilizing lead, supporting its application as a detoxification‑oriented pre‑treatment for lead‑rich metallurgical dusts rather than a conventional high‑recovery extraction process. Furthermore, thermodynamic analysis confirmed the environmental detoxification of the residue through the stable immobilization of lead as cerussite (PbCO3). The macroscopic dissolution behavior was successfully described using an apparent Shrinking Core Model (SCM), revealing the interactive effects of leaching parameters on the kinetic bottlenecks.
Keywords:
selenium
; tellurium
; lead‑rich fly ash
; carbonate leaching
; product‑layer diffusion
; copper anode slime residue
; detoxification
1. Introduction
Selenium and tellurium are semimetals belonging to group 16 of the periodic table, commonly referred to as chalcogens, which also includes oxygen and sulfur. Due to their position in this group, selenium, tellurium, and sulfur exhibit similar chemical properties and often demonstrate comparable reaction pathways in metallurgical systems [1]. In recent decades, selenium and tellurium have gained increasing attention because of their strategic importance in advanced technologies, particularly in photovoltaic applications. Tellurium availability has been identified as a potential limiting factor for the large-scale production of cadmium telluride thin-film photovoltaic cells (CdTe PV). At present, the photovoltaic sector accounts for approximately 26% of global tellurium consumption [2], and it has been predicted that by the end of the 21st century, up to 90% of tellurium production may be directed toward CdTe-based photovoltaic technologies [3]. Selenium is also utilized in photovoltaic devices and continues to be widely used as a pigment in plastics and ceramics, as well as in glass decolorization and metallurgical applications [4].
Because primary ores of selenium and tellurium are scarce, the majority of global production of these elements is derived from secondary sources, most notably copper anodic slime generated during electrolytic copper refining [1,5]. The concentrations of selenium and tellurium in copper anodic slime depend strongly on the mineralogical composition of the processed copper ore; selenium contents as high as 46 wt.% and tellurium contents up to 4 wt.% have been reported [6]. Mineralogical investigations have shown that copper selenides and tellurides may react during silver dissolution and subsequently precipitate as ringed or semi-ringed structures, encapsulating valuable phases and significantly hindering further recovery processes [7]. Studies on the stability of selenium and tellurium phases under varying pH conditions indicate that both elements are soluble in alkaline media, while tellurium can be selectively precipitated by decreasing the pH to approximately 5, enabling potential separation from selenium [8].
A wide range of pyrometallurgical and hydrometallurgical processes has been proposed for selenium and tellurium extraction from copper anodic slime. These methods include soda roasting, pressure leaching, acidic leaching with oxidizing agents, sulfation roasting, and chlorination routes, each presenting specific advantages and limitations [4]. Soda roasting using sodium carbonate followed by sulfuric acid leaching has been reported to recover up to 90% of tellurium from copper telluride slags [9]. Alkaline roasting of copper anodic slime with sodium carbonate, followed by autoclave leaching in NaOH solution, has also resulted in tellurium recoveries close to 90%, with high-purity tellurium obtained by electrowinning [10]. Pressure leaching of copper anodic slime using sulfuric acid in the presence of oxidants such as hydrogen peroxide or oxygen has likewise demonstrated high recoveries of selenium and tellurium [11,12].
Acidic leaching systems employing sulfuric acid combined with oxidizing agents have been extensively investigated. Selenium distillation residues leached using oxygen injection and hydrogen peroxide have yielded selenium and tellurium recoveries exceeding 85% [13]. High tellurium recoveries have also been reported for Te–Bi ores leached in acidic media using ferric ions as oxidants [14]. Synergistic systems combining sulfuric acid and hydrogen peroxide have enabled selenium recoveries of up to 93.6% from copper anodic slime [15], while similar approaches have resulted in tellurium recoveries of approximately 97% alongside copper dissolution [16].
Several studies have also explored alkaline leaching routes for selenium and tellurium recovery. Selenium dissolution of up to 86% from copper anodic slime has been achieved in NaOH solution using oxygen gas and potassium permanganate as oxidants [17]. Sodium cyanide in alkaline media has been used to dissolve tellurium from synthesized tellurium and tellurium dioxide samples, yielding low recovery from elemental tellurium but significantly higher recovery from TeO₂ [18]. Sodium sulfide solutions have been shown to effectively dissolve tellurium from high-tellurium-bearing materials [19]. Other studies reported tellurium recoveries of approximately 85% using NaOH solution following sulfation roasting of copper anodic slime [8], while alkaline systems combining NaOH and hydrogen peroxide have enabled tellurium recoveries exceeding 90% from copper telluride precipitates [20].
Beyond recovery efficiency, several investigations have focused on the kinetics of selenium and tellurium leaching. Selenium dissolution from copper anodic slime using nitric and sulfuric acids has been reported to proceed through two kinetic regimes, with chemical reaction control at early stages and mixed diffusion–reaction control at later stages [21]. Pan et al. demonstrated that selenium leaching from acid sludge in NaOH–H₂O₂ systems follows a homogeneous reaction kinetic model [22]. Kinetic studies on tellurium-bearing materials using Na₂S–NaOH solutions have shown that tellurium dissolution can be described by the Avrami equation, indicating mixed diffusion and chemical reaction control [23]. Similar conclusions were drawn for tellurium leaching from copper anodic slime in sulfuric acid systems using graphite and permanganate as additives, while selenium dissolution in the same system was predominantly controlled by chemical reaction [24]. Selective tellurium leaching from copper anodic slime using Na₂S media has also been reported to follow an Avrami-type kinetic model with product-layer diffusion as the rate-limiting step [25].
Despite the extensive body of work on copper anodic slime, relatively little attention has been paid to secondary residues generated during downstream processing of these materials. In several industrial flowsheets, including those reported by Moosavi et al. [26], copper anodic slime is smelted together with lead to facilitate the recovery of silver and gold. This practice results in the formation of a fine, lead-rich fly ash containing significant amounts of selenium, tellurium, and antimony. Such residues consist of sub-micron particles and pose serious environmental and occupational health risks if not properly treated. Industrial examples of this processing route can be found in copper-refining operations in Iran, where the generated fly ash requires stabilization prior to disposal or recycling. Exposure to high levels of lead is known to cause severe neurological damage, particularly in children [27], while occupational exposure to selenium-bearing dusts may result in respiratory irritation and bronchial effects [28]. Exposure to tellurium has also been associated with gastrointestinal symptoms and characteristic garlic-like breath [29].
In contrast to conventional studies that primarily emphasize maximum selenium and tellurium recovery from copper anodic slime, the present work adopts a fundamentally different perspective by focusing on a detoxification-oriented pre-treatment strategy for hazardous lead-rich metallurgical dusts. The material investigated in this study is a previously unexplored secondary residue: sub-micron fly ash generated during high-temperature lead smelting of copper anodic slime for precious-metal recovery. Such dusts pose significant environmental and occupational health risks due to their high lead content and the presence of volatile or toxic chalcogen species.
Rather than pursuing aggressive extraction conditions aimed at complete metal recovery, sodium carbonate leaching is employed to achieve a dual objective: stabilization of lead through carbonate formation and partial mobilization of selenium and tellurium into a controllable aqueous phase. In this framework, detoxification, residue stability, and downstream recyclability are treated as primary performance criteria. Complementary microscopic characterization and kinetic analysis are used to elucidate phase transformations, particle-scale dissolution behavior, and rate-controlling mechanisms during leaching. By linking leaching kinetics to detoxification performance rather than recovery yield alone, this study provides a physically-constrained and process-oriented basis for defining practical operating windows for the safer handling, recycling, or disposal of lead-rich metallurgical dusts.
2. Materials and Methods
A lead-rich fly ash containing selenium and tellurium was obtained from a small-scale metallurgical processing plant located near Tehran, Iran. This material represents a secondary hazardous residue generated during high-temperature lead smelting of copper anodic slime for precious-metal recovery. Prior to this study, the fly ash had been subjected to sulfuric acid leaching at the plant with the aim of maximizing selenium and tellurium recovery; however, a considerable fraction of these elements remained in the solid residue.
Upon receipt, the samples were dried at 100 °C to remove residual moisture, followed by grinding and sieving to break agglomerates and ensure homogeneity. The chemical composition of the pre-leached sample was determined by ICP-OES (VISTA-PRO, VARIAN), and the results are presented in Table 1.
Phase identification was carried out using X ray diffraction (XRD, PHILIPS PW1730). The XRD pattern (Figure 1) indicates that selenium and tellurium are predominantly present in oxidized forms associated with lead phases. This observation implies that disruption of Pb–Se and Pb–Te associations is a prerequisite for selenium and tellurium mobilization. Both selenium and tellurium were identified mainly in hexavalent states.
All leaching experiments were conducted using aqueous sodium carbonate (Na₂CO₃) solutions prepared from analytical-grade reagent and deionized water. The selection of Na₂CO₃ was motivated by its ability to stabilize lead as insoluble carbonate over a wide pH range, as reported by Arai et al [30]. In carbonate media, lead sulfate and lead selenate phases are expected to transform into lead carbonate while selenium and tellurium are transferred into soluble sodium salts, thereby enabling selective detoxification of the residue.
The following reactions are considered thermodynamically favorable in Na₂CO₃ solution:
PbSO4+Na2CO3→PbCO3+Na2SO4
PbSeO4+Na2CO3→PbCO3+Na2SeO4
PbTeO4+Na2CO3→PbCO3+Na2TeO4
According to HSC Chemistry, the standard Gibbs free energies at room temperature are −34.4 kJ mol⁻¹ and −20.2 kJ mol⁻¹ for the first and second reactions, respectively, indicating high thermodynamic feasibility. Although thermodynamic data for the tellurate reaction are not available, similar behavior is expected due to the chemical analogy between selenium and tellurium. The precipitated lead carbonate can be readily recycled to metallic lead using established metallurgical routes [31].
2.1. Experimental Procedure
Leaching experiments were carried out in a 1 L glass reactor operated in batch mode, with a constant working volume of 500 mL. Agitation was provided by a mechanical stirrer at 200 rpm to ensure homogeneous suspension of solids. Temperature was controlled using a thermostated water bath, and a condenser was employed to prevent solution loss at elevated temperatures. A schematic of the experimental setup is shown in Figure 2.
All solid materials were weighed using an analytical balance with a precision of 0.001 g, and solutions were prepared using volumetric flasks to minimize experimental error. Preliminary experiments indicated that increasing Na₂CO₃ concentration up to 1 mol L⁻¹ enhanced selenium and tellurium dissolution, while higher concentrations resulted in no significant additional benefit. Importantly, lead remained insoluble under all tested conditions, consistent with literature reports [30]. Solid-to-liquid ratios and leaching times were selected based on process practicality and the results of preliminary tests, with emphasis on defining a feasible detoxification-oriented operational window rather than maximizing extraction.
2.2. Experimental Design and Kinetic Sampling
The experimental matrix was designed using Design Expert® software (version 12), applying a central composite design (CCD) to evaluate the effects of four variables: sodium carbonate concentration, temperature, solid to liquid ratio, and leaching time. Similar statistical approaches have been successfully applied in hydrometallurgical studies to analyze multivariable systems [32,33]. The design consisted of 24 factorial points and 6 center points, resulting in a total of 30 experimental conditions. The variable ranges and levels are summarized in Table 2.
Based on this design, 20 leaching experiments were performed. During each experiment, solution samples were withdrawn at 15-minute intervals (five samples per run) to capture both the initial rapid dissolution stage and the subsequent slower regime. Sampling was conducted using 5 mL syringes, and the solutions were filtered through syringe filters to remove suspended solids. The samples were diluted 100-fold and analyzed by ICP OES.
The resulting concentration–time data were used for kinetic evaluation and to assess selenium and tellurium mobilization efficiency. Both recovery and final solution concentration were considered as response variables. The experimental conditions corresponding to the conducted runs are listed in Table 3.
3. Results and Discussion
3.1. Characterization of Lead-Rich Fly Ash and Initial Microstructural Evolution
Scanning electron microscopy (SEM) was employed to characterize the pristine lead-rich fly ash and to investigate the initial microstructural changes induced by sodium carbonate leaching. Representative SEM micrographs of the untreated material and selected leached residues are presented in Figure 3
The pre-leached fly ash consists predominantly of fine particles exhibiting semi-spherical and elongated morphologies (Figure 3a). Quantitative particle size analysis, performed on more than 30 representative particles using image analysis software (ImageJ, National Institutes of Health (NIH)), indicates average diameters of approximately 300 nm for semi-spherical particles and about 800 nm for elongated particles. Such fine particle sizes and irregular morphologies are characteristic of secondary particulates generated during high-temperature copper smelting and anodic slime processing, and are known to contribute to the high reactivity and environmental risk associated with these residues. To qualitatively evaluate the morphological evolution, image analysis was conducted on selected representative particles (over 30 particles) using ImageJ software. While this does not represent a statistically absolute particle size distribution, this estimative approach evidently highlights the morphological shift from pseudo-spherical to elongated shapes during the leaching process.
Following sodium carbonate leaching, pronounced microstructural changes are observed (Figure 3b–c). A progressive reduction in the size of semi-spherical particles is evident, whereas elongated particles persist and, in some cases, exhibit an apparent increase in relative size. This non-uniform morphological evolution suggests that leaching proceeds via preferential surface reactions affecting specific particle populations rather than through homogeneous dissolution of the entire solid matrix.
Energy-dispersive X-ray spectroscopy (EDS) analyses (Z2e, AMETEC) of the untreated fly ash and leached residues, summarized quantitatively in Table 4 and illustrated by the corresponding SEM images and EDS spectra in Figure 4, confirm a lead-rich composition, with selenium and tellurium present as minor constituents associated with Pb-bearing phases. After leaching, relative lead enrichment accompanied by changes in oxygen and sulfur signals indicates the initiation of secondary phase formation on particle surfaces, consistent with the precipitation of lead carbonate species as also supported by XRD results.
Overall, the observed early-stage microstructural and compositional evolution indicates the onset of a surface-controlled process. The formation of Pb-rich surface layers is expected to influence subsequent leaching behavior by altering mass-transfer pathways and restricting further dissolution of associated chalcogen elements. This characterization therefore establishes the structural foundation for interpreting the detoxification-oriented leaching behavior discussed in the following section.
3.2. Detoxification-Oriented Leaching Behavior of Selenium and Tellurium
Selenium and tellurium dissolution behaviors during sodium carbonate leaching were systematically evaluated to assess the effectiveness of the process from a detoxification perspective rather than conventional metal recovery. The quantitative leaching results obtained under different experimental conditions are summarized in Table 5 and Table 6, while the corresponding microstructural and compositional evidence supporting the observed trends is provided by Figure 5 and Table 7.
In Table 6, “nd” (or “Nd”) denotes concentrations below the analytical limit of detection (LOD). Accordingly, the apparent non-monotonic variations in Te concentration after the initial period should be interpreted within analytical uncertainty rather than as a kinetically meaningful trend. Overall, Te dissolution appears to terminate early under the studied carbonate conditions, likely due to rapid surface passivation/product-layer formation, and therefore Te time-profiles are discussed qualitatively.
As shown in Table 5 and Table 6, selenium exhibits limited solubility under most investigated conditions, with dissolution efficiencies generally remaining below 15%. However, under specific combinations of temperature and reagent concentration, selenium dissolution increases significantly, reaching a maximum value of approximately 33.9%. This behavior indicates that selenium release is not governed by simple diffusion-controlled dissolution but is strongly influenced by surface reactions and phase transformations occurring during leaching. In contrast, tellurium consistently shows lower dissolution efficiencies, remaining below 15% across all tested conditions, suggesting a higher degree of stabilization within the solid matrix.
The contrasting leaching responses of selenium and tellurium can be rationalized by considering their distinct chemical associations with lead bearing phases. Figure 5 illustrates the evolution of particle surface morphology after leaching, revealing the formation of compact surface layers that partially encapsulate residual particles. Quantitative EDS results presented in Table 7 demonstrate an enrichment of lead and oxygen on particle surfaces following leaching, consistent with the precipitation of lead carbonate species. Such surface layers act as diffusion barriers, preferentially inhibiting the release of strongly associated chalcogen elements, particularly tellurium.
From a detoxification standpoint, this behavior is highly significant. The suppression of tellurium dissolution and the generally limited release of selenium imply that sodium carbonate leaching promotes immobilization rather than mobilization of hazardous chalcogen species. The occasional increase in selenium dissolution under specific conditions reflects localized disruption of surface layers rather than a fundamental change in leaching mechanism. Therefore, the process should be viewed as a controlled surface mediated detoxification step rather than an aggressive extraction route.
Overall, the results presented in this section demonstrate that sodium carbonate leaching induces selective surface reactions leading to the formation of Pb rich carbonate layers that regulate chalcogen release. This physically-grounded understanding provides a coherent explanation for the quantitative trends observed in Table 5 and Table 6 and establishes a direct link between microstructural evolution and detoxification performance.
3.3. Kinetic Interpretation and Rate-Controlling Step Analysis
To elucidate the rate-controlling mechanisms governing selenium leaching and tellurium immobilization during detoxification-oriented pre-treatment, kinetics analyses were carried out using both diffusion-based and nucleation-growth models. This comprehensive evaluation aimed to correlate the microstructural evolution of the lead-rich fly ash with its leaching behavior.
3.3.1. Comparative Model Fitting and Rate-Controlling Step Identification
To transition logically from observation to physically-constrained conclusion, the fractional conversion data (X) were fitted to the principal kinetic models. The quality of fit, as quantified by the correlation coefficient (R2) and standard deviation, is summarized in Table 8.
Figure 6 and Figure 7 present the graphical manifestation of these fits. It is evident from Figure 7 that the SCM diffusion model is statistically superior (R2>0.97) to the other models. This superior fit is consistent with product-layer diffusion playing the dominant role in controlling the overall leaching rate under the studied conditions.
3.3.2. Microstructural Validation and Mechanism Consolidation
The kinetic exponent (n) derived from the Avrami fit (using Figure 8) in the initial phase (n≈1.1-1.3) is consistent with a heterogeneous, two-dimensional growth mechanism for this layer, which subsequently transitions into a pure diffusion-controlled regime as the shell thickens and dominates the mass transport path. The kinetic evidence is strongly corroborated by the microstructural analysis presented in Figure 9 and the elemental mapping in Table 9. The formation of a dense, crystalline PbCO₃ phase—the primary component of the passivation layer—creates a physical barrier whose resistance is governed by the tortuosity and thickness of this layer, rather than the chemical reaction rate itself.
Considering the inherent multi-phase and porous nature of the fly ash, the particles in this study are mathematically treated as pseudo-spherical entities. Consequently, the classical Shrinking Core Model (SCM) applied herein serves as an apparent kinetic model to macroscopically elucidate the rate-controlling steps of Se and Te dissolution. These microstructural and compositional observations provide direct physical validation for the diffusion controlled SCM behavior identified earlier, and simultaneously explain the observed kinetic selectivity between selenium and tellurium through preferential blockage of Te bearing phases by the PbCO₃ product layer.
3.3.3. Physically-Constrained Linkage Between Kinetic Parameters and RSM Optimization
The identification of diffusion-controlled kinetics through the shrinking core model (Section 3.3.1), together with its direct microstructural validation via PbCO₃ product layer formation (Section 3.3.2), provides a robust physically-constrained basis for subsequent parametric optimization.
In this context, the apparent diffusion rate constant k_p (min⁻¹)., extracted under different operating conditions, represents a physically meaningful response variable that inherently reflects the combined effects of temperature, solid to liquid ratio, and leaching time.
Rather than relying solely on empirical recovery values, the response surface methodology (RSM) employed in Section 3.4 utilizes these kinetically grounded parameters to map the multidimensional process space. This approach ensures that the statistically optimized conditions remain consistent with the established rate controlling mechanism, thereby preventing nonphysical optimization outcomes that contradict diffusion limitations imposed by the PbCO₃ layer.
3.4. Parametric Study and Statistical Optimization (RSM)
3.4.1. Experimental Design and Definition of the Kinetic Response
In order to quantitatively optimize the detoxification-oriented leaching process while remaining consistent with the established diffusion-controlled mechanism, a response surface methodology (RSM) was employed. The experimental matrix was constructed using the same operational domain investigated in the kinetic analysis, ensuring direct compatibility between physically-constrained interpretation and statistical modeling.
Temperature, solid to liquid ratio, and leaching time were selected as independent variables based on their demonstrated influence on product layer development and diffusion resistance. Importantly, the apparent diffusion rate constant k_p, extracted from the shrinking core model analysis (Section 3.3), was defined as the primary response variable. This choice avoids purely empirical optimization based on extraction yield and instead anchors the statistical analysis to a physically meaningful kinetic descriptor of the process.
The experimental runs generated a sufficient data set to capture both linear and interaction effects among the operating variables within the diffusion-controlled regime.
3.4.2. Model Fitting and Statistical Validation
The experimental responses were fitted using a second order polynomial model, and the adequacy of the proposed regression was evaluated through standard statistical indicators. The resulting model coefficients and goodness of fit parameters are summarized in Table 10 and Table 11, demonstrating satisfactory agreement between predicted and experimental values of k_p (min⁻¹).
The CCD–RSM analysis is used here as a statistical screening framework to rank the relative influence of operating parameters and their interactions on the responses, while acknowledging that precipitation/passivation phenomena may limit strict first-principles interpretation of the fitted terms.
Analysis of variance (ANOVA), presented in Table 12 and Table 13, confirms the statistical significance of the regression model, with temperature emerging as the dominant factor influencing the diffusion rate constant. This observation is fully consistent with the physically-constrained framework established earlier, where increased temperature enhances ionic mobility through the PbCO₃ product layer while preserving the diffusion controlled nature of the process. Interaction terms between temperature and solid to liquid ratio further indicate that mass transfer resistance within the product layer is sensitive to both thermal activation and solution availability.
From a metallurgical perspective, the significant interactive effects observed between temperature and lixiviant concentration (T × C) statistically validate the proposed apparent kinetic model. As the temperature increases, the kinetic bottleneck transitions, amplifying the role of reagent diffusion through the porous solid product layer, which inherently depends on the bulk concentration of the carbonate ions.
The normal probability distribution of residuals and parity plots shown in Figure 10 further validate the robustness of the fitted model, confirming that no systematic deviation from the assumed kinetic behavior is introduced by the statistical treatment.
3.4.3. Response Surfaces and Optimization Under Kinetic Constraints
Three-dimensional response surface plots derived from the validated model illustrate the combined effects of operating variables on the apparent diffusion rate constant. The optimized region corresponds to conditions that maximize k_p without inducing a transition away from the diffusion-controlled regime identified in Section 3.3.
Notably, the statistical optimum does not coincide with extreme parameter values but rather reflects a balance between enhanced diffusion kinetics and stabilization of the PbCO₃ product layer. Furthermore, the formation of this stable PbCO₃ (cerussite) layer is the core mechanism ensuring the environmental detoxification of the leaching residue. Although standard leaching toxicity tests (e.g., TCLP) were not within the scope of this study, the detoxification is thermodynamically guaranteed. Given the extremely low solubility product of cerussite ($K_{sp} \approx 7.4 \times 10^{-14}$), the thermodynamic potential for secondary lead leaching into the environment is significantly minimized, thereby successfully fulfilling the detoxification objective of the proposed process. This outcome highlights the advantage of using a kinetically constrained response variable, as it prevents nonphysical optimization scenarios that could arise from purely empirical yield-based criteria.
It should be emphasized that the CCD model was primarily used as a screening and trend-analysis tool, rather than for precise optimization, due to the inherent limitations imposed by PbCO₃ precipitation and the early termination of tellurium dissolution. Overall, the RSM analysis confirms that the statistically optimized conditions are fully compatible with the established leaching mechanism, thereby reinforcing the validity of the detoxification-oriented process design.
5. Conclusions
This study systematically elucidated the detoxification-oriented leaching behavior of selenium and tellurium from lead rich fly ash through an integrated microstructural–kinetic–statistical framework.
Initial characterization revealed a heterogeneous distribution of Pb bearing matrices and chalcogenide rich phases, with particle size statistics quantitatively assessed using ImageJ based image analysis. Leaching experiments demonstrated a pronounced selectivity toward selenium dissolution, whereas tellurium extraction remained strongly constrained, indicating fundamentally different transport behaviors within the evolving solid matrix.
Kinetic analysis showed that the leaching process proceeds through an initial nucleation-controlled stage, followed by a dominant diffusion-controlled regime consistent with the shrinking core model. The formation of a compact PbCO₃ product layer was directly confirmed by SEM–EDS observations and identified as the primary rate controlling barrier. This layer imposes a significant diffusion resistance, particularly limiting tellurium transport and thereby governing the observed selectivity.
By establishing a direct physically-constrained linkage between operating variables and the apparent diffusion rate constant k_p, statistical optimization was conducted using response surface methodology within a physically constrained framework. Defining k_p as the response variable ensured that the optimization remained consistent with the diffusion-controlled mechanism, avoiding nonrealistic statistical maxima commonly associated with yield-based optimization. The resulting optimal conditions correspond to operating windows that enhance diffusion kinetics while preserving the integrity of the controlling product layer.
Overall, this work demonstrates that meaningful statistical optimization of detoxification processes must be grounded in kinetic interpretation and microstructural validation. The proposed framework provides a rational basis for the design and optimization of leaching strategies for complex secondary resources, where detoxification efficiency is governed not only by extraction extent but by transport limitations imposed by evolving solid phases.
From an environmental and kinetic perspective, the alkaline carbonate medium not only facilitated the selective recovery of Se and Te but also inherently detoxified the final residue. The formation of a highly insoluble PbCO3 product layer (K_sp≈7.4×〖10〗^(-14)) thermodynamically effectively immobilized secondary lead emissions, while concurrently acting as a diffusion barrier modeled through an apparent pseudo-spherical SCM approach.
Author Contributions
Majid Ramezanpour Aghdami: software, validation, formal analysis ,Investigation, data curation, writing—original draft preparation, writing—review and editing, visualization; Ashkan Mohammad Beygian: Conceptualization, Methodology, validation, writing—original draft preparation, writing—review and editing, supervision; Eskandar Keshavarz Alamdari: Conceptualization, methodology, validation, resources, writing—review and editing, supervision, project administration, funding acquisition. All authors have read and agreed to the published version of the manuscript.
Data Availability Statement
Data could be available upon appropriate and proportional request.
Conflicts of Interest
The authors declare no conflicts of interest.
References
- Mahmoudi, S. Shakibania, M. Mokmeli, and F. Rashchi, “Tellurium, from Copper Anode Slime to High Purity Product: A Review Paper,” Metall. Mater. Trans. B Process Metall. Mater. Process. Sci., vol. 51, no. 6, pp. 2555–2575, 2020. [CrossRef]
- V. Fthenakis, C. Athias, A. Blumenthal, A. Kulur, J. Magliozzo, and D. Ng, “Sustainability evaluation of CdTe PV: An update,” Renew. Sustain. Energy Rev., vol. 123, no. February, p. 109776, 2020. [CrossRef]
- Z. Li, F. Qiu, Q. Tian, X. Yue, and T. Zhang, “Production and recovery of tellurium from metallurgical intermediates and electronic waste-A comprehensive review,” J. Clean. Prod., vol. 366, no. June, p. 132796, 2022. [CrossRef]
- J. E. Hoffmann, “Recovering selenium and tellurium from copper refinery slimes,” Jom, vol. 41, no. 7, pp. 33–38, 1989. [CrossRef]
- D. C. Adriano, Trace elements in the terrestrial environment. 1986.
- J. Hait, R. K. Jana, and S. K. Sanyal, “Processing of copper electrorefining anode slime: a review,” Miner. Process. Extr. Metall., vol. 118, no. 4, pp. 240–252, 2009. [CrossRef]
- T. T. Chen and J. E. Dutrizac, “MIneralogical characterization of anode slimes-II. Raw anode slimes from inco’s copper cliff copper refinery,” Can. Metall. Q., vol. 27, no. 2, pp. 97–105, 1988. [CrossRef]
- Y. Fan, Y. Yang, Y. Xiao, Z. Zhao, and Y. Lei, “Recovery of tellurium from high tellurium-bearing materials by alkaline pressure leaching process: Thermodynamic evaluation and experimental study,” Hydrometallurgy, vol. 139, pp. 95–99, 2013. [CrossRef]
- Z. Li, D. Liu, G. Zha, W. Jiang, D. Huang, and B. Xu, “Efficient Separation and Recovery of Tellurium and Copper from High - Value - Added Industrial Copper Telluride Slag by a Sustainable Process,” J. Sustain. Metall., vol. 9, no. 2, pp. 738–752, 2023. [CrossRef]
- K. Sarangi et al., “Recovery of Tellurium from Waste Anode Slime Containing High Copper and High Tellurium of Copper Refineries,” Sustain., vol. 15, no. 15, pp. 1–10, 2023. [CrossRef]
- Mahmoudi, S. Shakibania, M. Mokmeli, F. Rashchi, and H. Y. Karimi, “Selective Separation and Recovery of Tellurium from Copper Anode Slime Using Acidic Leaching and Precipitation with Cuprous Ion,” J. Sustain. Metall., vol. 7, no. 4, pp. 1886–1898, 2021. [CrossRef]
- S. Rao et al., “Pressure leaching of selenium and tellurium from scrap copper anode slimes in sulfuric acid-oxygen media,” J. Clean. Prod., vol. 278, p. 123989, 2021. [CrossRef]
- T. T. Zhen et al., “Selective Recovery of Valuable Metals (Se, Te, Cu) from the Selenium Distillation Residue by Sulfuric Acid Oxidative Leaching,” J. Sustain. Metall., vol. 8, no. 3, pp. 1191–1203, 2022. [CrossRef]
- L. Shao et al., “Dissolution Behaviors of Minerals in Tellurium – Bismuth Ore During Oxidic – Acidic Leaching,” J. Sustain. Metall., vol. 7, no. 4, pp. 1790–1804, 2021. [CrossRef]
- Z. Dong et al., Comprehensive recoveries of selenium, copper, gold, silver and lead from a copper anode slime with a clean and economical hydrometallurgical process. Elsevier B.V., 2020.
- H. Zeng, F. Liu, S. Zhou, C. Liao, F. Chen, and Y. Zeng, “Leaching Behavior of the Main Metals from Copper Anode Slime during the Pretreatment Stage of the Kaldor Furnace Smelting Process,” Processes, vol. 10, no. 12, 2022. [CrossRef]
- Y. Kilic, G. Kartal, and S. Timur, “An investigation of copper and selenium recovery from copper anode slimes,” Int. J. Miner. Process., vol. 124, pp. 75–82, 2013. [CrossRef]
- A. González-Ibarra, F. Nava-Alonso, G. I. Dávila-Pulido, F. R. Carrillo-Pedroza, and A. M. Rodríguez-Flores, “Dissolution behavior of elemental tellurium and tellurium dioxide in alkaline cyanide solutions,” Hydrometallurgy, vol. 203, no. May, p. 105702, 2021. [CrossRef]
- X. Guo, Z. Xu, D. Li, Q. Tian, R. Xu, and Z. Zhang, “Recovery of tellurium from high tellurium-bearing materials by alkaline sulfide leaching followed by sodium sulfite precipitation,” Hydrometallurgy, vol. 171, pp. 355–361, 2017. [CrossRef]
- L. Xu et al., “An environmental-friendly process for recovery of tellurium and copper from copper telluride,” J. Clean. Prod., vol. 272, p. 122723, 2020. [CrossRef]
- H. ying YANG, X. jiao LI, L. lin TONG, Z. nan JIN, L. YIN, and G. bao CHEN, “Leaching kinetics of selenium from copper anode slimes by nitric acid-sulfuric acid mixture,” Trans. Nonferrous Met. Soc. China (English Ed., vol. 28, no. 1, pp. 186–192, 2018. [CrossRef]
- X. Pan, Y. Hong, T. Hu, L. Zhang, and K. Yang, “Kinetic mechanism of selenium leaching from selenium-rich acid sludge in NaOH solution,” Can. Metall. Q., pp. 1–13, 2023. [CrossRef]
- Z. Xu, X. Guo, D. Li, and Q. Tian, “Leaching kinetics of tellurium-bearing materials in alkaline sulfide solutions,” Miner. Process. Extr. Metall. Rev., vol. 41, no. 1, pp. 1–10, 2020. [CrossRef]
- K. Kurniawan, J. Lee, J. Kim, R. Kim, and S. Kim, “Leaching Kinetics of Selenium , Tellurium and Silver from Copper Anode Slime by Sulfuric Acid Leaching in the Presence of Manganese ( IV ) Oxide and Graphite †,” no. Iv, pp. 3–10, 2021.
- J. Chen, Z. Liu, Q. Wang, S. Wang, and X. Guo, “Kinetics of tellurium recovery by sodium sulfide leaching from copper anode slime,” vol. 380, no. July 2025, 2026.
- E. Moosavi-Khoonsari and N. Tripathi, “Copper Anode Slime Processing with a Focus on Gold Recovery: A Review of Traditional and Recent Technologies,” Processes, vol. 12, no. 12, 2024. [CrossRef]
- World Health Organization, “Lead poisoning,” 2024. https://www.who.int/news-room/fact-sheets/detail/lead-poisoning-and-health?utm_source=chatgpt.com (accessed Nov. 13, 2025).
- Agency for Toxic Substances and Disease Registry, “Toxicological Profile for Selenium: Relevance to Public Health,” National Center for Biotechnology Information (NCBI), 2003. https://www.ncbi.nlm.nih.gov/books/NBK600362/?utm_source=chatgpt.com (accessed Nov. 13, 2025).
- Lenntech B.V., “Tellurium (Te) – Chemical properties, health and environmental effects.” https://www.lenntech.com/periodic/elements/te.htm?utm_source=chatgpt.com (accessed Nov. 13, 2025).
- K. Arai and J. M. Toguri, “Leaching of lead sulphate in sodium carbonate solution,” Hydrometallurgy, vol. 12, no. 1, pp. 49–59, 1984.
- S. A. P. Bjorn K.V. Lindquist, “Method for producing metallic lead by direct lead-smelting,” 1986.
- H. Movahhedi, A. M. Beygian, and E. Keshavarz, “Developing of a Counter-Current Copper Leaching Process Using Response Surface Methodology Developing of a Counter-Current Copper Leaching Process Using Response Surface,” Miner. Process. Extr. Metall. Rev., vol. 00, no. 00, pp. 1–11, 2023. [CrossRef]
- O. Hesar, A. M. Beygian, E. Keshavarz, J. Allahyari, and A. Moradi, “Investigation of Aldoxime-Ketoxime Solvent Mixtures for Selective Copper Extraction : In-Depth Performance Evaluation Through RSM , Slope Method Mechanism Determination , Ex (%) -pH and McCabe-Thiele Diagrams Investigation of Aldoxime-Ketoxime Solvent Mixt,” Solvent Extr. Ion Exch., vol. 00, no. 00, pp. 1–27, 2025. [CrossRef]
- Levenspiel, Chemical reaction engineering. John wiley & sons, 1998.
- Y. J. Zheng and K. K. Chen, “Leaching kinetics of selenium from selenium–tellurium-rich materials in sodium sulfite solutions,” Trans. Nonferrous Met. Soc. China, vol. 24, no. 2, pp. 536–543, Feb. 2014. [CrossRef]
- J. Kabai, “Determination of specific activation energies of metal oxides and metal oxide hydrates by measurement of the rate of dissolution,” Acta Chim. Acad. Sci. Hungaricae, vol. 78, no. 1, pp. 57–73, 1973.
Figure 1.
XRD Analysis of pre leached sample.

Figure 2.
Equipment used for conducting tests, condenser (1), thermometer (2), flask (3), stirrer (4), and water bath with controlled temperature (5) can be seen.
Figure 2.
Equipment used for conducting tests, condenser (1), thermometer (2), flask (3), stirrer (4), and water bath with controlled temperature (5) can be seen.

Figure 3.
Suggested three stages of leaching based on samples: pre-leach sample (A), test number 10 residue (B), and test number 17 residue (C). Magnification for these images was set at 30000x.
Figure 3.
Suggested three stages of leaching based on samples: pre-leach sample (A), test number 10 residue (B), and test number 17 residue (C). Magnification for these images was set at 30000x.

Figure 4.
SEM imaging (A) and peaks diagram (B) for pre-leached samples.

Figure 5.
SEM imaging for Spherical (A) and elongated (C) particles and respected peak diagrams (B and D) for sample number 10.
Figure 5.
SEM imaging for Spherical (A) and elongated (C) particles and respected peak diagrams (B and D) for sample number 10.

Figure 6.
Se charts for the shrinking core model of elongated particles. Recovered Se vs time (A), F(X) vs time as for ash diffusion(B), G(X) vs time as for chemical reaction(C), and Arrhenius plot of both vs t-1(D).
Figure 6.
Se charts for the shrinking core model of elongated particles. Recovered Se vs time (A), F(X) vs time as for ash diffusion(B), G(X) vs time as for chemical reaction(C), and Arrhenius plot of both vs t-1(D).

Figure 7.
Se charts for the shrinking particle model of spherical particles. Recovered Se vs time (A), H(X) vs time as for film diffusion(B), I(X) vs time as for chemical reaction(C), and Arrhenius plot of both vs t-1(D).
Figure 7.
Se charts for the shrinking particle model of spherical particles. Recovered Se vs time (A), H(X) vs time as for film diffusion(B), I(X) vs time as for chemical reaction(C), and Arrhenius plot of both vs t-1(D).

Figure 8.
Se charts for Avrami model. Recovered Se vs time (A), J(X) vs time (B).

Figure 9.
SEM imaging (A) and peaks diagram (B) for sample number 17.

Figure 10.
Response surface plot and contour plot of factor interactions of temperature relative to solid to liquid ratio for Se concentration. Both Na2CO3 concentration and time has been fixed to the central value.
Figure 10.
Response surface plot and contour plot of factor interactions of temperature relative to solid to liquid ratio for Se concentration. Both Na2CO3 concentration and time has been fixed to the central value.


Table 1.
ICP analysis of pre leached sample.
| Components | Pb | S | Se | Sb | Te |
| Weight % | 63.2 | 28.5 | 2.7 | 1.3 | 1.1 |
Table 2.
Variable values for Central composition design.
| Range and level | ||||||
| Variables | symbols | -2 | -1 | 0 | 1 | 2 |
| Sodium carbonate concentration (mol/Lit) | [Na2CO3] | 0.1 | 0.3 | 0.5 | 0.7 | 0.9 |
| Temperature (°C) | T | 20 | 40 | 60 | 80 | 100 |
| Solid to liquid ratio (gr/mlit) | s/l | 0.025 | 0.05 | 0.075 | 0.1 | 0.125 |
| Time (min) | t | 15 | 30 | 45 | 60 | 75 |
Table 3.
Conducted tests parameters.
| Run | S/L | Concentration | Temperature |
| (%(102×(g/ml)) | (mol/l) | (°C) | |
| 1 | 7.5 | 0.5 | 20 |
| 2 | 5 | 0.7 | 80 |
| 3 | 7.5 | 0.5 | 100 |
| 4 | 10 | 0.3 | 80 |
| 5 | 7.5 | 0.5 | 60 |
| 6 | 5 | 0.3 | 80 |
| 7 | 12.5 | 0.5 | 60 |
| 8 | 2.5 | 0.5 | 60 |
| 9 | 7.5 | 0.5 | 60 |
| 10 | 10 | 0.3 | 40 |
| 11 | 7.5 | 0.5 | 60 |
| 12 | 7.5 | 0.1 | 60 |
| 13 | 7.5 | 0.5 | 60 |
| 14 | 7.5 | 0.9 | 60 |
| 15 | 5 | 0.3 | 40 |
| 16 | 10 | 0.7 | 80 |
| 17 | 7.5 | 0.5 | 60 |
| 18 | 7.5 | 0.5 | 60 |
| 19 | 10 | 0.7 | 40 |
| 20 | 5 | 0.7 | 40 |
Table 4.
EDS analysis of pre-leached samples.
| Element | Pb | O | S | Se | Te | Sb |
| Wt(%) | 76.5 | 7.98 | 7.8 | 5.71 | 1.03 | 0.95 |
Table 5.
Full Se concentration and recovery data relative to time.
| Se concentration | Se recovery | |||||||||||||
| Run | Time (min) | Time (min) | ||||||||||||
| 15 | 30 | 45 | 60 | 75 | 15 | 30 | 45 | 60 | 75 | |||||
| 1 | 330.8 | 286.5 | 301.8 | 292.0 | 346.0 | 21.3 | 21.8 | 22.5 | 24.6 | 25.8 | ||||
| 2 | 355.5 | 383.8 | 391.8 | 457.5 | 477.5 | 39.7 | 42.9 | 43.8 | 51.1 | 53.4 | ||||
| 3 | 502.3 | 604.5 | 654.5 | 690.5 | 723.0 | 37.4 | 45.0 | 48.8 | 51.4 | 53.9 | ||||
| 4 | 434.0 | 501.8 | 397.5 | 524.5 | 512.5 | 24.2 | 28.0 | 22.2 | 29.3 | 28.6 | ||||
| 5 | 375.8 | 424.5 | 444.8 | 456.3 | 475.8 | 28.0 | 31.6 | 33.1 | 34.0 | 35.4 | ||||
| 6 | 309.5 | 330.8 | 348.0 | 379.0 | 406.0 | 34.6 | 37.0 | 38.9 | 42.3 | 45.4 | ||||
| 7 | 644.3 | 746.0 | 775.5 | 846.0 | 964.0 | 28.8 | 33.3 | 34.7 | 37.8 | 43.1 | ||||
| 8 | 174.8 | 196.8 | 214.8 | 214.0 | 240.8 | 39.1 | 44.0 | 48.0 | 47.8 | 53.8 | ||||
| 9 | 466.3 | 583.8 | 615.0 | 641.3 | 659.3 | 34.7 | 43.5 | 45.8 | 47.8 | 49.1 | ||||
| 10 | 304.3 | 361.8 | 394.5 | 418.0 | 431.8 | 17.0 | 20.2 | 22.0 | 23.4 | 24.1 | ||||
| 11 | 442.0 | 480.8 | 520.8 | 555.0 | 619.5 | 32.9 | 35.8 | 38.8 | 41.3 | 46.1 | ||||
| 12 | 147.0 | 172.5 | 240.3 | 160.3 | 167.0 | 10.9 | 12.8 | 17.9 | 11.9 | 12.4 | ||||
| 13 | 381.8 | 416.3 | 481.5 | 540.0 | 542.0 | 28.4 | 31.0 | 35.9 | 40.2 | 40.4 | ||||
| 14 | 427.8 | 482.8 | 523.0 | 526.5 | 583.3 | 31.9 | 36.0 | 39.0 | 39.2 | 43.4 | ||||
| 15 | 162.3 | 185.5 | 209.0 | 207.5 | 242.0 | 18.1 | 20.7 | 23.4 | 23.2 | 27.0 | ||||
| 16 | 688.5 | 763.8 | 824.5 | 892.3 | 870.3 | 38.5 | 42.7 | 46.1 | 49.8 | 48.6 | ||||
| 17 | 404.3 | 476.0 | 511.0 | 519.3 | 566.3 | 30.1 | 35.5 | 38.1 | 38.7 | 42.2 | ||||
| 18 | 392.3 | 479.8 | 481.3 | 561.8 | 580.0 | 29.2 | 35.7 | 35.8 | 41.8 | 43.2 | ||||
| 19 | 366.5 | 416.0 | 480.8 | 513.0 | 540.0 | 20.5 | 23.2 | 26.9 | 28.7 | 30.2 | ||||
| 20 | 207.5 | 310.0 | 336.5 | 357.0 | 368.0 | 23.2 | 34.6 | 37.6 | 39.9 | 41.1 | ||||
Table 6.
Full Te concentration and recovery data relative to time.
| Te concentration (ppm) | Te recovery (%) | ||||||||||
| Run | Time (min) | Time (min) | |||||||||
| 15 | 30 | 45 | 60 | 75 | 15 | 30 | 45 | 60 | 75 | ||
| 1 | 7.3 | 5.5 | 4.8 | Nd | 6.5 | 1.1 | 0.8 | 0.7 | Nd | 1.0 | |
| 2 | 101.5 | 104.0 | 111.8 | 150.8 | 151.5 | 22.7 | 23.2 | 25.0 | 33.7 | 33.9 | |
| 3 | 100.0 | 113.5 | 89.3 | 145.5 | 161.5 | 14.9 | 16.9 | 13.3 | 21.7 | 24.1 | |
| 4 | 3.3 | 24.0 | 11.8 | 16.0 | 9.8 | 0.4 | 2.7 | 1.3 | 1.8 | 1.1 | |
| 5 | 61.3 | 78.5 | 85.3 | 54.8 | 97.8 | 9.1 | 11.7 | 12.7 | 8.2 | 14.6 | |
| 6 | 36.5 | 68.0 | 54.3 | 78.8 | 57.8 | 8.2 | 15.2 | 12.1 | 17.6 | 12.9 | |
| 7 | 34.3 | 37.8 | 34.3 | 29.3 | 29.0 | 3.1 | 3.4 | 3.1 | 2.6 | 2.6 | |
| 8 | 51.5 | 60.5 | 81.3 | 71.8 | 71.5 | 23.0 | 27.0 | 36.3 | 32.1 | 32.0 | |
| 9 | 71.3 | 110.0 | 125.5 | 92.5 | 93.5 | 10.6 | 16.4 | 18.7 | 13.8 | 13.9 | |
| 10 | nd | nd | nd | Nd | Nd | nd | nd | nd | Nd | Nd | |
| 11 | 65.5 | 80.8 | 91.3 | 90.3 | 150.3 | 9.8 | 12.0 | 13.6 | 13.4 | 22.4 | |
| 12 | nd | nd | 6.3 | Nd | 8.8 | nd | nd | 0.9 | Nd | 1.3 | |
| 13 | 37.3 | 48.0 | 71.3 | 76.0 | 75.3 | 5.5 | 7.2 | 10.6 | 11.3 | 11.2 | |
| 14 | 102.3 | 80.3 | 107.3 | 119.3 | 130.8 | 15.2 | 12.0 | 16.0 | 17.8 | 19.5 | |
| 15 | 10.5 | 18.0 | 12.3 | 16.0 | 18.3 | 2.3 | 4.0 | 2.7 | 3.6 | 4.1 | |
| 16 | 128.5 | 145.3 | 179.5 | 174.5 | 159.5 | 14.4 | 16.2 | 20.1 | 19.5 | 17.8 | |
| 17 | 62.8 | 70.8 | 66.8 | 68.3 | 76.0 | 9.3 | 10.5 | 9.9 | 10.2 | 11.3 | |
| 18 | 44.8 | 44.5 | 57.5 | 57.5 | 75.0 | 6.7 | 6.6 | 8.6 | 8.6 | 11.2 | |
| 19 | 43.5 | 45.5 | 60.3 | 54.8 | 65.3 | 4.9 | 5.1 | 6.7 | 6.1 | 7.3 | |
| 20 | 73.0 | 60.8 | 71.5 | 78.8 | 77.0 | 16.3 | 13.6 | 16.0 | 17.6 | 17.2 | |
Table 7.
EDS analysis of Spherical and elongated particles of sample number 10.
| Element | Pb | O | S | Se | Te | Sb | |
| Wt(%) | Spherical | 78.68 | 5.59 | 11.11 | 3.49 | 0.6 | 0.54 |
| Elongated | 91.49 | 1.82 | 3.34 | 2.03 | 1.06 | 0.27 | |
Table 8.
Suggested models for prediction of kinetics control mechanism.
| Model | Rate Equation | Kinetic Stage Implied | Evidential Support | |
| Surface Reaction Control | 0.85 – 0.92 | Initial rapid stage | Early time points (Figure 8) | |
| Product-Layer Diffusion (SCM) | 0.97 – 0.99 | Dominant long-term stage | Figure 6 & 7 (Linearity at high X) | |
| Avrami Growth | 0.93 – 0.96 | Nucleation/early growth | Early to intermediate conversion (Figure 8) |
Table 9.
EDS analysis of sample number 17.
| Element | Pb | O | S | Se | Te | Sb |
| Wt(%) | 82.96 | 6.27 | 4.56 | 5.39 | 0.35 | 0.47 |
Table 10.
Full data set for Design Expert 12.
| Na2CO3 conc | Temperature | Solid to liquid ratio | Time | Se Extraction | Te Extraction | Se Concentration | Te Concentration | |
| Run | (mol/l) | (°C) | (gr/mL) | (minute) | (%) | (%) | (ppm) | (ppm) |
| 1 | 0.3 | 80 | 0.1 | 30 | 28.03 | 2.68 | 501.75 | 24.00 |
| 2 | 0.5 | 60 | 0.075 | 45 | 33.13 | 12.70 | 444.75 | 85.25 |
| 3 | 0.7 | 40 | 0.05 | 45 | 34.64 | 13.58 | 310.00 | 60.75 |
| 4 | 0.7 | 40 | 0.1 | 60 | 28.66 | 6.12 | 513.00 | 54.75 |
| 5 | 0.7 | 40 | 0.05 | 60 | 39.89 | 17.60 | 357.00 | 78.75 |
| 6 | 0.3 | 80 | 0.1 | 60 | 29.30 | 1.79 | 524.50 | 16.00 |
| 7 | 0.3 | 40 | 0.1 | 30 | 20.21 | 0.00 | 361.75 | 0.00 |
| 8 | 0.5 | 20 | 0.075 | 45 | 22.48 | 0.71 | 301.75 | 4.75 |
| 9 | 0.5 | 60 | 0.125 | 45 | 34.66 | 3.06 | 775.50 | 34.25 |
| 10 | 0.1 | 60 | 0.075 | 45 | 17.90 | 0.93 | 240.25 | 6.25 |
| 11 | 0.7 | 80 | 0.05 | 30 | 42.88 | 23.24 | 383.75 | 104.00 |
| 12 | 0.9 | 60 | 0.075 | 45 | 38.96 | 15.98 | 523.00 | 107.25 |
| 13 | 0.3 | 40 | 0.05 | 60 | 23.18 | 3.58 | 207.60 | 16.00 |
| 14 | 0.5 | 60 | 0.075 | 15 | 30.11 | 9.35 | 404.25 | 62.75 |
| 15 | 0.5 | 60 | 0.075 | 45 | 45.81 | 18.70 | 615.00 | 125.50 |
| 16 | 0.5 | 60 | 0.025 | 45 | 47.99 | 36.31 | 214.75 | 81.25 |
| 17 | 0.7 | 80 | 0.1 | 60 | 49.85 | 19.50 | 892.25 | 174.50 |
| 18 | 0.7 | 80 | 0.05 | 60 | 51.12 | 33.69 | 457.50 | 150.75 |
| 19 | 0.5 | 100 | 0.075 | 45 | 48.75 | 13.30 | 654.50 | 89.25 |
| 20 | 0.7 | 80 | 0.1 | 30 | 42.67 | 16.23 | 763.75 | 145.25 |
| 21 | 0.5 | 60 | 0.075 | 75 | 42.18 | 11.32 | 566.25 | 76.00 |
| 22 | 0.5 | 60 | 0.075 | 45 | 38.79 | 13.59 | 520.75 | 91.25 |
| 23 | 0.7 | 40 | 0.1 | 30 | 23.24 | 5.08 | 416.00 | 45.50 |
| 24 | 0.5 | 60 | 0.075 | 45 | 35.87 | 10.61 | 481.50 | 71.25 |
| 25 | 0.3 | 80 | 0.05 | 60 | 42.35 | 17.60 | 379.00 | 78.75 |
| 26 | 0.3 | 40 | 0.05 | 30 | 20.73 | 4.02 | 185.50 | 18.00 |
| 27 | 0.5 | 60 | 0.075 | 45 | 38.06 | 9.94 | 511.00 | 66.75 |
| 28 | 0.3 | 80 | 0.05 | 30 | 36.96 | 15.20 | 330.75 | 68.00 |
| 29 | 0.5 | 60 | 0.075 | 45 | 35.85 | 8.57 | 481.25 | 57.50 |
| 30 | 0.3 | 40 | 0.1 | 60 | 23.35 | 0.00 | 418.00 | 0.00 |
Table 11.
Full ANOVA table for all 4 responses.
| Model | Se | Te | ||||||||||
| Recovery | Concentration | Recovery | Concentration | |||||||||
| Sum of squares | F-value | p-value | Sum of squares | F-value | p-value | Sum of squares | F-value | p-value | Sum of squares | F-value | p-value | |
| Linear | ||||||||||||
| Time(t) | 162.7 | 10.4 | 0.006 | 27989.3 | 8.3 | 0.011 | 23.5 | 1.7 | 0.208 | 709.6 | 1.6 | 0.227 |
| Temperature(T) | 1090.8 | 69.8 | < 0.0001 | 1.96E+05 | 58.5 | < 0.0001 | 460.4 | 33.8 | < 0.0001 | 17958.0 | 40.1 | < 0.0001 |
| [Na2CO3] (C) | 714.4 | 45.7 | < 0.0001 | 1.28E+05 | 38.0 | < 0.0001 | 602.6 | 44.3 | < 0.0001 | 26367.5 | 58.9 | < 0.0001 |
| S/L | 222.6 | 14.2 | 0.0018 | 3.51E+05 | 104.6 | < 0.0001 | 859.3 | 63.1 | < 0.0001 | 1820.0 | 4.0 | 0.062 |
| Quadratic | ||||||||||||
| t2 | 15.2 | 0.975 | 0.339 | 2570.8 | 0.766 | 0.395 | 7.6 | 0.557 | 0.467 | 135.7 | 0.303 | 0.590 |
| T2 | 21.1 | 1.4 | 0.263 | 3603.8 | 1.1 | 0.316 | 50.6 | 3.7 | 0.073 | 1676.3 | 3.7 | 0.072 |
| C2 | 196.2 | 12.6 | 0.003 | 34737.5 | 10.4 | 0.006 | 27.2 | 2 | 0.178 | 794.0 | 1.8 | 0.203 |
| S/L2 | 8.3 | 0.529 | 0.48 | 1426.8 | 0.425 | 0.524 | 90.1 | 6.6 | 0.021 | 721.9 | 1.6 | 0.224 |
| Interactive | ||||||||||||
| t×T | 2.1 | 0.135 | 0.719 | 161.9 | 0.048 | 0.829 | 7.0 | 0.517 | 0.483 | 178.9 | 0.399 | 0.537 |
| t×C | 12.0 | 0.765 | 0.396 | 2423.1 | 0.722 | 0.409 | 19.6 | 1.4 | 0.249 | 656.6 | 1.5 | 0.245 |
| t×S/L | 1.2 | 0.075 | 0.788 | 803.7 | 0.24 | 0.632 | 10.6 | 0.778 | 0.392 | 115.6 | 0.26 | 0.619 |
| T×C | 7.5 | 0.477 | 0.501 | 7144.5 | 2.1 | 0.165 | 26.6 | 1.95 | 0.183 | 2070.2 | 4.62 | 0.048 |
| T×S/L | 0.0144 | 0.0009 | 0.9762 | 14556.42 | 4.3 | 0.0548 | 30.1 | 2.2 | 0.1573 | 62.0 | 0.138 | 0.71 |
| C×S/L | 0.199 | 0.013 | 0.912 | 8723.6 | 2.6 | 0.128 | 1.7 | 0.126 | 0.727 | 1732.6 | 3.9 | 0.07 |
Table 12.
R-squered values for all responses.
| Response | R2 | Adjusted R2 | Predicted R2 |
| Se recovery | 0.88 | 0.86 | 0.82 |
| Te recovery | 0.85 | 0.81 | 0.71 |
| Se concentration | 0.90 | 0.88 | 0.84 |
| Te concentration | 0.72 | 0.70 | 0.66 |
Table 13.
Coded coefficient of parameters for all 4 equations.
| Factors | time | Temperature | [Na2CO3] | s/l | [Na2CO3]2 | (s/l)×Temperature | (s/l)2 | intercept | |
| Coifficents | Se Recovery | 2.6 | 6.74 | 5.46 | -3.05 | -2.56 | - | - | 36.96 |
| [Se] | 34.15 | 90.41 | 72.91 | 120.89 | 32.44 | 30.16 | - | 483.84 | |
| Te Recovery | - | 4.38 | 5.01 | -5.98 | - | - | 2.13 | 9.79 | |
| [Te] | - | 27.35 | 33.15 | - | - | - | - | 66.48 |
Disclaimer/Publisher’s Note: The statements, opinions and data contained in all publications are solely those of the individual author(s) and contributor(s) and not of MDPI and/or the editor(s). MDPI and/or the editor(s) disclaim responsibility for any injury to people or property resulting from any ideas, methods, instructions or products referred to in the content. |
© 2026 by the authors. Licensee MDPI, Basel, Switzerland. This article is an open access article distributed under the terms and conditions of the Creative Commons Attribution (CC BY) license (http://creativecommons.org/licenses/by/4.0/).
Copyright: This open access article is published under a Creative Commons CC BY 4.0 license, which permit the free download, distribution, and reuse, provided that the author and preprint are cited in any reuse.


