

Submitted:
17 March 2026
Posted:
19 March 2026
You are already at the latest version
Abstract
In the underground operation scenario, with the development of intelligence, the underground electronic monitoring and control systems have gradually become an important tool for mining practitioners to obtain operational information. In view of the existence of low-light environment under the mine and the obvious difference from the above-ground natural light, screen-related factors have a significant impact on the visual search task, so it is critical to study the impact of interface layout in the low-light environment under the mine on the visual search efficiency. In this study, the application scenario of the electronic monitoring and control system under the mine is simulated. The information layout of the current electronic monitoring and control system in the mine and different lighting environments are set as experimental variables. The effects of interface layout design features on user search performance, visual behavior and usability satisfaction are discussed. The experimental results show that interface layout and illumination change have significant main effects on task completion time, fixation times, saccade ratio and subjective usability score. Among them, Three-Column layout mode has outstanding performance in the aspects of task completion time, fixation number and subjective usability score, and the search efficiency is higher in 50lx illumination environment.
Keywords:
underground monitoring interface
; interface layout
; visual search
; eye-tracking
; usability
1. Introduction
China is the world’s largest producer and consumer of coal [1], and safe coal mining is critical to energy security and economic stability [2]. Mine production can be a complex process [3]. In order to better monitor the mine for safety purposes, the monitored area is usually equipped with a large amount of monitoring equipment, so a large amount of information is displayed during the supervision of mining production. Therefore, in the process of search tasks, users usually need to search or monitor multiple targets at the same time, rather than being limited to a single target [4,5]. Compared with a single target visual search, multiple target visual search will increase the user’s cognitive load and reduce the search efficiency during the search task [6,7].
Today, despite the use of full-day artificial lighting in mines, there is a marked difference from the natural light above ground. It is particularly dark in areas that are obscured by equipment. Screen brightness, contrast, layout and other factors can seriously affect feature extraction and analysis in visual information search tasks. According to previous studies, in low-brightness environment, screen brightness, text and other interface information are affected by the change of brightness ratio, which can reduce the fatigue of reading behavior through adjustment [8].
1.1. Influence of Interface Layout Differences on Visual Search Efficiency
Man-machine interface, also known as user interface, is the medium and window for users and machines to transmit information, feedback and operation, and it is the main platform for users and instruments to exchange information and related operations. The layout of the interface directly affects the efficiency of the user’s receiving and feedback information. Many scholars have done a lot of research on this. Si-jun He [9] studied the influence of design features of the layout of the train electronic guidance interface on visual search, behavior and usability, and conducted simulation scenarios and eye tracking experiments, in which the combination of split-screen display mode and interlaced layout could improve search performance and subjective satisfaction. Jussi P.P. Jokinen [10]. proposed a visual search computing model based on adaptive feature guidance to simulate the visual search and learning of graphic layout. This model can predict the user’s visual search time, learning time and the impact of layout changes under different layouts, and its effectiveness has been verified through experiments. Jutao Li [11] etc. studied the influence of different layout interaction modes (scrolling and page turning) in mobile phone reading on reading fatigue and reading effect, analyzed the aspects of memory level, visual fatigue, reading speed and task load through experiments, and summarized the characteristics of the two different layout interaction modes. Fu Guo [12] etc., taking mobile news applications as an example, studied the impact of visual complexity of interface layout on users’ search behavior and satisfaction through eye tracking experiments, divided visual complexity into quantitative complexity and layout complexity, and discussed their relationship with users’ search behavior and satisfaction. Tim Halverson [13] etc. studied eye movements under different density layouts through visual search experiments, and built a model using EPIC cognitive architecture, gradually improving the basic model of random search to the model of waiting for text and the model of reducing text availability to interpret eye movement data. Xiao- Teng Tang [14] mainly studied the influence of text features of interface layout of vital signs monitor on target search, and analyzed the influence of feature variables such as font size, background and text color, spacing and parametric information layout on visual search efficiency through experiments. Chih-Yu Hsiao etc. [15] studied the effects of layout differences of different elements, such as Chinese character size, number of characters per line and number of menu items, on visual search task performance of different age groups on tablet computers. Wen-Chin Li [16] mainly studied the visual parameters of pilots when they were laid out with different designs of crew alarm systems. Through eye tracking technology, he found that integrated design had advantages in providing accurate instructions and improving pilots’ situational awareness, but it would increase cognitive load, and pointed out that a holistic approach should be adopted in flight deck design.
1.2. Reading Behavior in the Dark Environment
In recent years, it is the main research direction of researchers to improve the efficiency of visual search information in low-light environment, reduce cognitive load and improve work efficiency through reasonable design. Jun Yao etc. [17] mainly studied the visual recognition efficiency of handheld infrared thermometer interface information in low light environment, and analyzed the effects of the tilt Angle of seven-paragraph display characters, screen brightness and ambient light on reaction speed through target search experiments simulating the interface and use scenes. Xiao jiao Xie etc. [18] studied the influence of screen color mode and color temperature on visual fatigue under different ambient lighting conditions. Through experiments, they found that under normal office lighting (450 lx), dark mode and color temperature of 4500K and 6500K can reduce visual fatigue, while under dark environment at night (3 lx), visual fatigue can be reduced. Dark mode and 4500K color temperature have lower visual fatigue, and there is no significant interaction between color mode and color temperature on visual fatigue. Po-Chun Chang [19] studied the effects of ambient illumination and light source on participants’ reading performance and visual fatigue when e-paper displays were used for long-term reading tasks under different lighting conditions, and drew some conclusions through the two experiments, including the similarities and differences between different e-paper displays in terms of visual performance and visual fatigue. As well as appropriate light source and environmental illumination, etc. Nooree N [20] etc. proposed a model of adaptive brightness difference between text and background on smartphone display, and verified the effect of this model in terms of reading speed, preference and brain wave analysis, and the results showed that this model could improve physical comfort and psychological satisfaction during reading. tian [21] studied the effects of normal color and screen brightness on visual fatigue in low light environment at night based on eye tracker and EEG acquisition equipment. Through experiments on 15 subjects, he collected subjective usability scores and objective signals of eye movement and EEG, and analyzed and concluded that low screen brightness could reduce visual fatigue and subjects’ preference for blue.
To sum up, there have been some studies on the impact of interface layout difference on visual search efficiency and reading behavior in dark environment. However, there have been few studies on the interface layout search efficiency in low-light environment under mines. In order to reduce the cognitive load of mining practitioners operating machine interfaces and enhance visual comfort, Tian [21]. In this study, the mine monitoring system interface was taken as the target area to evaluate the impact of different layout and display modes on users’ visual search tasks, as well as the subjective usability of the interface.
2. Materials and Methods
2.1. Participants
Twenty-five mining and safety engineering students from China University of Mining and Technology were recruited to complete the visual search task of the guided interface as well as the evaluation after the task. All of the subjects had some expertise in mine safety. Because 1 of the subjects had difficulty calibrating the eye tracker during the visual search, only 24 subjects (14 men and 10 women), aged between 22 to 26 years (M=23.2, SD=1.26 ), met the requirements for this study. All participants had normal visual acuity or corrected vision. Participants volunteered for the experiment and signed an informed consent form.
In the first step, the subjects were trained before the experiment on the basic information of interface layout. In the second step, the participants were asked to complete the same search task on an out-of-order interface. The third step was to fill out the questionnaire after the task was completed. Subjective rating questions use the Likert Scale, and according to Finstad [22], seven-level ratings produce more accurate results than five-level ratings. Therefore, the seven-level Likert scale was adopted in this experiment. From left to right, the scores indicate opinions ranging from strong disagreement to strong agreement. the questions in the Questionnaire are taken from the Post- Study System Usability Questionnaire (PSSUQ) (which is open and free to use). The original questionnaire contains 16 items, divided into three dimensions: system quality, information quality and interface quality. The author of the original questionnaire encourages the deletion of items that have little significance to the context of the study. Therefore, we retained the four sections of the questions SysQual, InfoQual, InfoQual and IntQual, as all subjects were native speakers of Chinese, so the questionnaire and interface design were in Chinese.
In this study, task completion time and recall accuracy were used to measure the search performance of the interface. The number of fixations and saccade ratio (the ratio of long to small saccades) were used to analyze visual behavior. As defined by Tatler [23] etc., and Poletti [24] etc., the magnitude of minor saccades is within 8°. Finally, the average usability score for each sample is calculated.
2.2. Experiment Material
According to the investigation, As shown in Figure 1, the page of coal mine control and monitoring system is divided into 5 categories. In this experiment, the five types of pages are simplified, and only the basic characteristics of the layout are retained to reduce the influence of other factors such as color and icon on the experimental data. The overall display resolution is 1920xp 1080xp. According to Nooree Na [20], in a dark environment (50lxand below), the page with 85% background brightness (white) and 15% text brightness (black) has the reading efficiency and reading comfort. All layouts have three levels of directory level. In order to prevent the alphabetical order from affecting the accuracy of the experiment, the alphabetical order of the headings at each level was scrambled in the experiment. As shown in Figure 2, It is divided into One-Column layout (OCL), Tow-Column layout (TCL), Three-Column layout (THCL), Drop-down layout (DDL), and Double horizontal layout (DHL) Five layout modes.
2.3. Experimental Equipment and Procedures
2.3.1. Experimental Equipment and Procedures
We used the Tobii Pro X3-120 eye tracking device and recorded it with the ErgoLAB program (human-machine environment synchronization cloud platform). The stimuli were displayed on a 23-inch display with a resolution of 1920 × 1080 pixels. The viewing distance is set and maintained at 55cm. Before taking the measurements, each participant acclimated to the lighting conditions of the room for 5 minutes, followed by screen calibration. In order to simulate the lighting conditions of underground work, the experiment was carried out in the darkroom of the laboratory after 8 PM. According to the Chinese standard GB50215-2015 Coal Industrial mine design Code, the lighting standard for underground work needs to be between 10lx and 100lx, which is classified as follows for different work and operation areas:
The passing road and operating area under the mine: the illumination should be no less than 50lx to ensure that the staff can clearly see the surrounding environment and avoid accidents. Loading and unloading areas under the mine: the illumination should not be less than 100Ix to ensure that loading and unloading operations are carried out safely. Safety passageways and emergency exits under the mine: the illumination should not be less than 20lx to ensure that personnel can be quickly and safely evacuated in an emergency. Therefore, three environmental illuminance levels of 20lx, 50lx and 100lx were used in the simulation experiment of dark environment under the mine. According to the safety technical requirements of GB 7957-2023 coal mine lamp, LED light source should be used for mine lamp. The light source related color temperature should be greater than 5000K.
In order to simulate the working conditions under the mine, the experiment was carried out in the darkroom of the laboratory after 8 PM. JINBEI EF Panel 12 intelligent LED table lamp was used to control the ambient illumination, and the color temperature was kept at 5000K. According to the measurement method of environment and surface brightness proposed by National Ergonomics Standardization Technical Committee in 2009 [21], measure the ambient illuminance in the darkroom. Measure the horizontal illuminance of the desktop level according to the quadrilateral coordinates to obtain the average illuminance Measure the brightness of the display at five positions, that is, measure four points in the 4cm×4cm area around the display, and then measure one point on the display, and then convert to the average value. In the experiment, SNAKOL SK-8200 illuminance color temperature measuring instrument was used to measure the ambient illuminance and color temperature.
2.3.2. Experimental Process
Before starting the experiment, the subjects read the experiment instructions and then familiarize themselves with the procedure through exercises. Afterwards, the subjects were asked to remember the search task. Then, they pressed any key to start the experiment. First, the fixation point “+” was displayed in the center of the screen for 1 second to calibrate the subjects’ initial visual point. Then, the subjects completed the corresponding search task, the search time was unlimited, and after the task was completed, the time for completing the task was recorded. The flowchart of the experiment is shown in Figure 3. After the end of the eye movement experiment, a usability evaluation questionnaire was subsequently completed.
2.4. Data Processing and Analysis
The eye movement experimental data were processed using the Tobii Pro Lab eye movement analysis software. Since the sample interface for performing the visual search task was presented, the area of interest (AOI) was set to the area of the LCD display with the full size of 1920×1080 pixels.
For each participant and each interface, the following eye movement metrics were recorded: first gaze time (time to first look at the AOI), first entry time (time to first enter the AOI), number of looks, duration of gaze, number of saccades, and duration of saccades. Task completion time was defined as the time from the appearance of a page containing directory information to the time the subject used the mouse to click on the screen and complete the task, which is a measure of the total time from the start of the search to the finding of the target, reflecting the efficiency of the search. After processing, the data was exported. TSV format and imported into IBM SPSS Statistics 27.0 software for statistical analysis. The variables of the experiment were 5 layouts and 3 lighting with different brightness. The dependent variables included task completion time, gaze count, saccade ratio, and usability score. Analysis of variance was used to verify the influence of these two factors on the four dependent variables.
3. Results
Analysis of Variance (ANOVA) of lighting and layout patterns in the experiment on all dependent variables (task completion time, recall accuracy, gaze count, saccade ratio, and usability score) is shown in Table 1 and Table 2. Among them, the difference of task accuracy in layout and attention intensity was not statistically significant. Finally, Least Significant Difference(LSD) was used to test the differences of different layouts on the five dependent variables, as shown in Table 3 and Table 4, 5 and 6. As a result, the differences in task accuracy were not statistically significant. Therefore, the difference between different layouts is compared using the average correct rate under the three light intensifies, as shown in Figure 4.
3.1. Task Completion Time
The main effect of interface layout on task completion time is significant [F=16.054,p<0.0001]. The main effect of illumination change on task completion time is significant [F=16.349,p<0.0001]. Among them, the triplet mode has the shortest time among all the layout times [all p<0.0001]. Pull-down mode has the longest time of all layouts. (All p<0.04). There are no apparent significant differences between the other layout patterns. Finally, use LSD (Least Significant Difference) post hoc multiple comparison method to arrange the meantime of each layout mode: Time (DDL) > Time (OCL) > Time (DHL) > Time (TCL) > Time (THCL).
The main effect of illumination change on task completion time was significant [F=16.34, p<0.0001]. In the three light environments, the task completion time in the 50lx light environment was less than that in the other two light environments. (p<0.0018).
3.2. Accuracy Rate
According to the data in Figure 5, the correct rates of all kinds of layout patterns calculated were as follows: one-link pattern (99.6%), two-link pattern (98.7%), three-link pattern (97.3%), drop-down pattern (94.6%) and double-horizontal pattern (93.3%).
3.3. Fixation Count
The main effect of interface layout on fixation count was significant [F= 32.887, p<0.0001]. Among them, the pull-down mode had the highest number of fixations (all p<0.0001), the triplet mode had the lowest number of fixations (all p<0.0001), and the differences among other layout modes were less significant (p>0.351). Finally, the LSD post hoc multiple comparison method was used to rank the mean number of fixations of each layout mode: Fixation count (DDL) > Fixation count (OCL) > Fixation count (DHL) > Fixation count (TCL) > Fixation count (THCL).
The main effect of illuminance change on fixation count was significant [F=62.504, p<0.0001]. In the three illumination environments, the fixation times of 100lx illumination environment were higher than those of the other two illumination environments (p<0.0001). There was no significant difference in gaze count between 50lx and 20lx illumination environments (p=0.717).
Figure 6.
Fixation count for different illumination intensities and layout patterns.
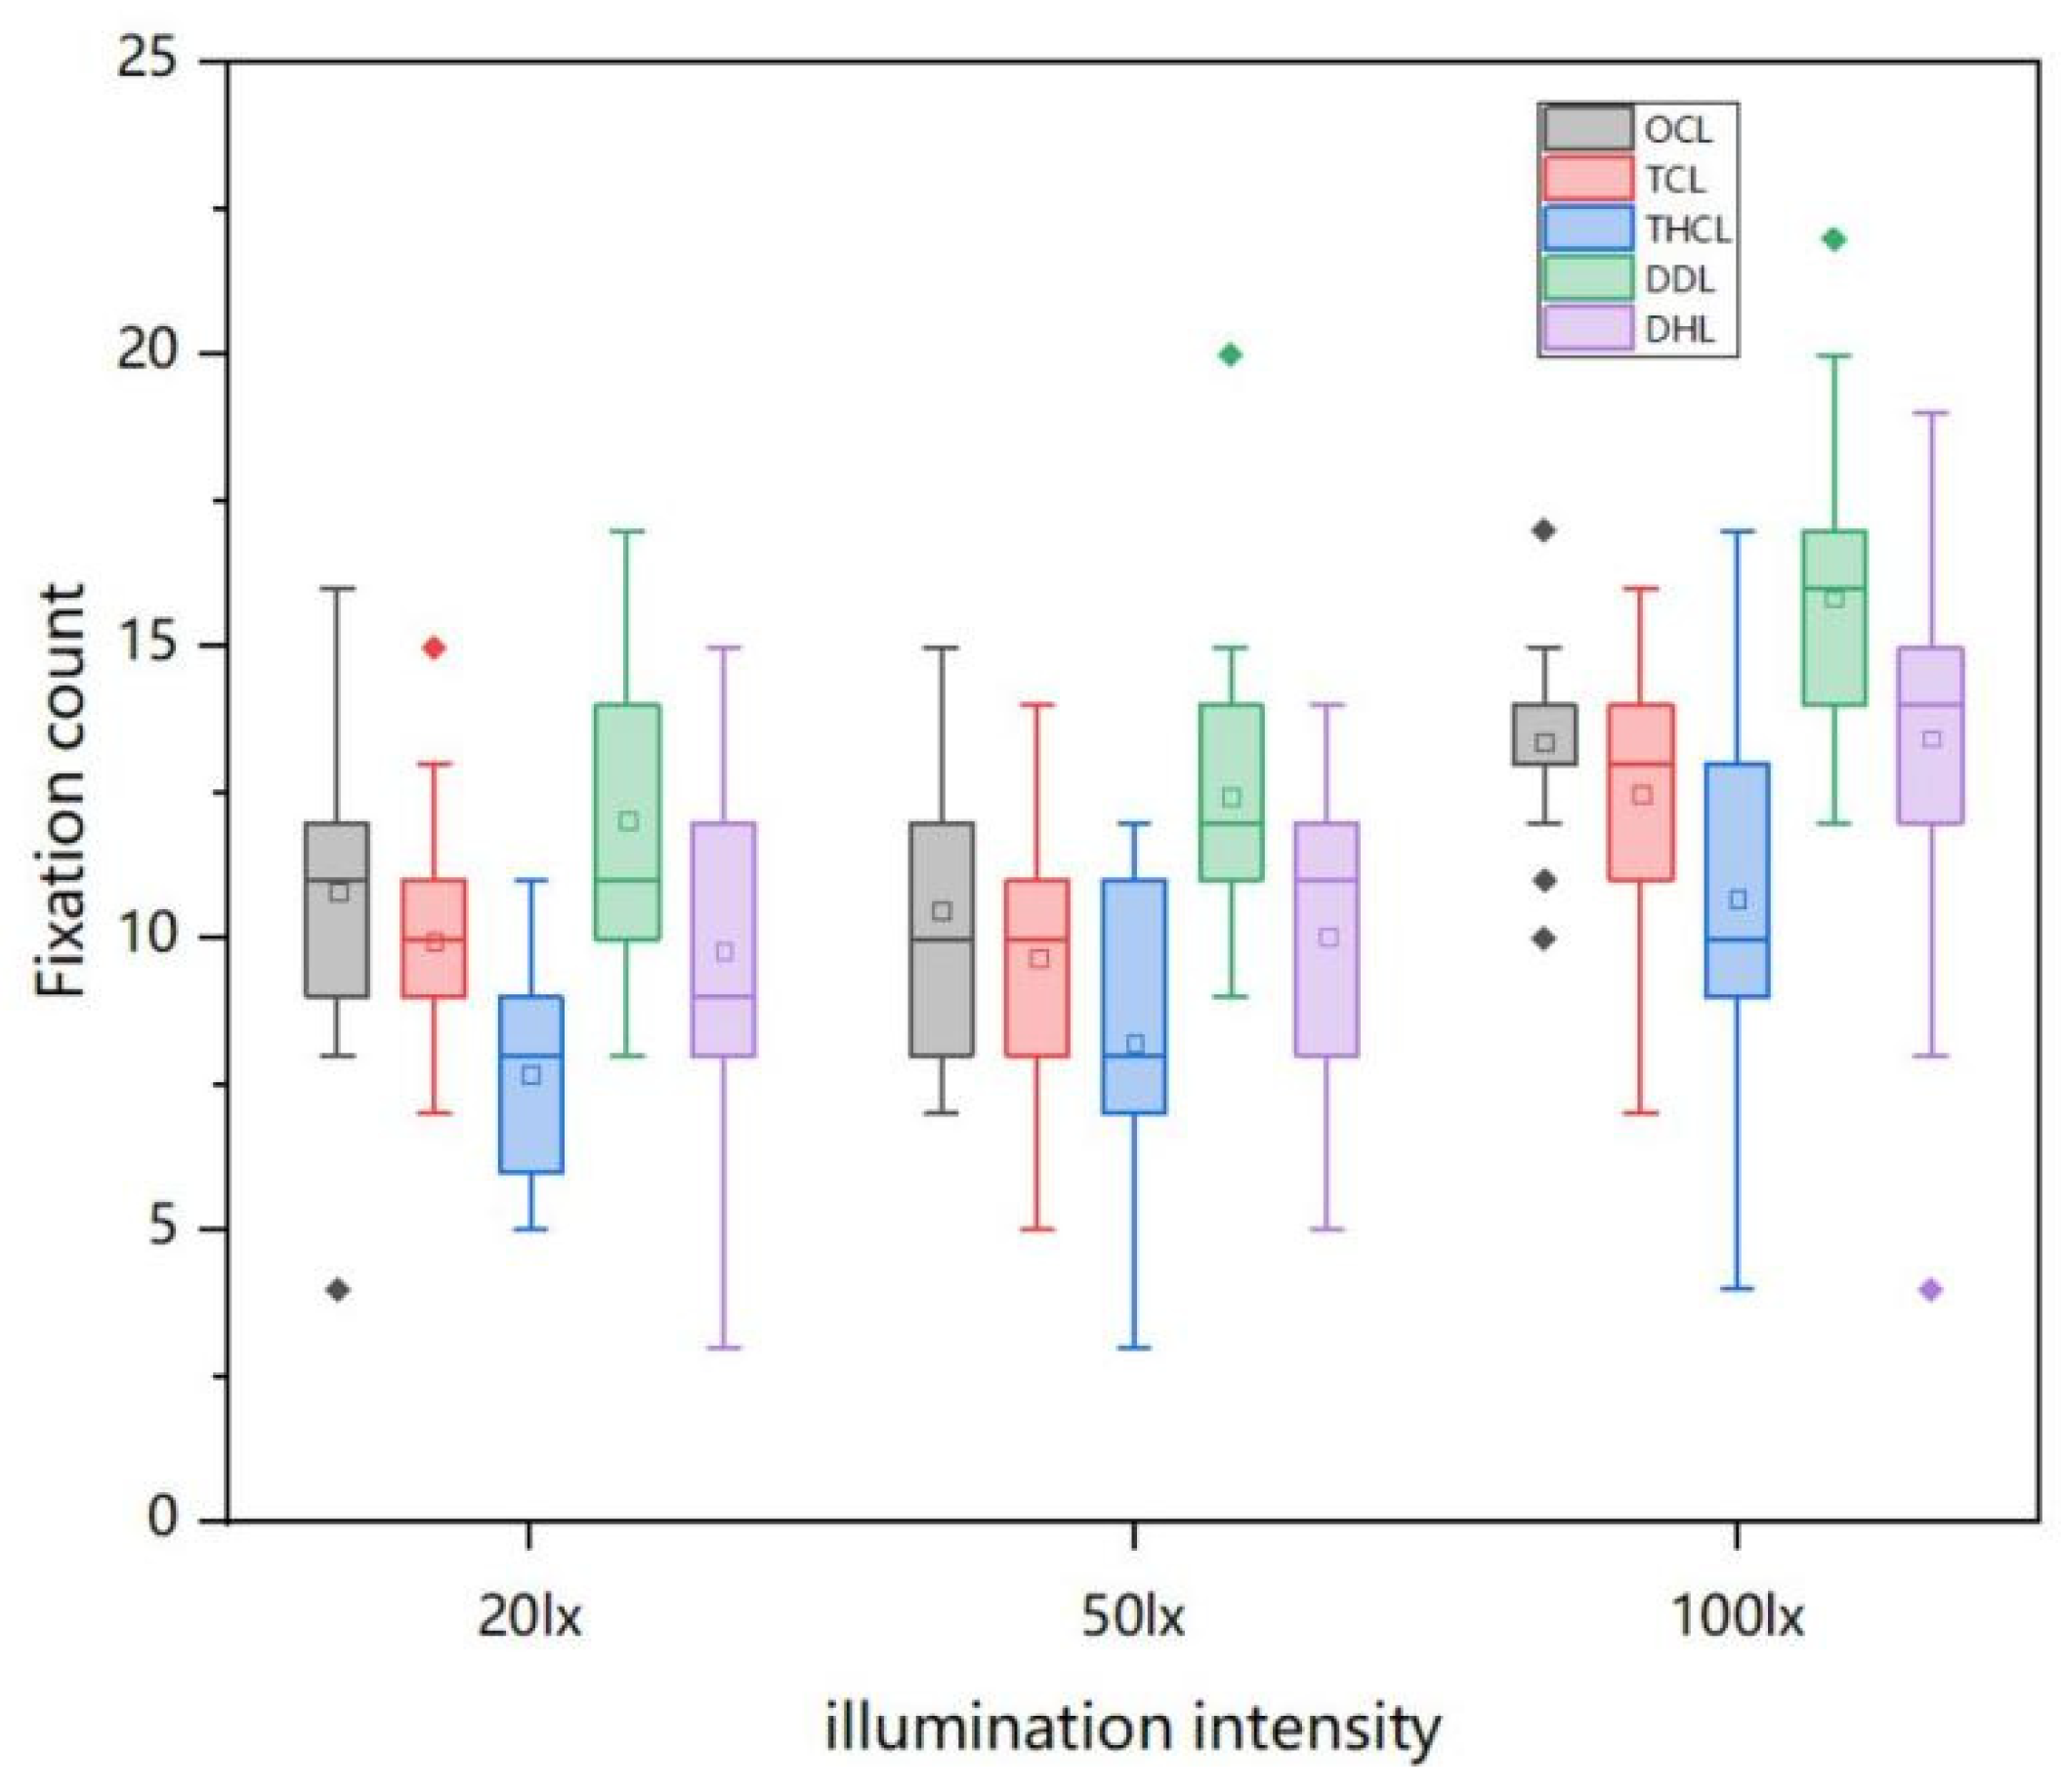

Table 4.
LSD test at Fixation count for Five interface layout modes.
| Layout Patterns A | Layout Pattern B | Mean difference (A-B) |
Standard Error | P |
|---|---|---|---|---|
| OCL | TCL | 0.84 | 0.428 | 0.052 |
| THCL | 2.693 | 0.44 | <0.0001 | |
| DDL | -1.893 | 0.456 | 0.001 | |
| DHL | 0.453 | 0.485 | 0.351 | |
| TCL | OCL | -0.84 | 0.428 | 0.052 |
| THCL | 1.853 | 0.438 | <0.0001 | |
| DDL | -2.733 | 0.454 | <0.0001 | |
| DHL | -0.387 | 0.483 | 0.425 | |
| THCL | OCL | -1.853 | 0.438 | <0.000 |
| TCL | -1.853 | 0.438 | 0.001 | |
| DDL | -4.587 | 0.466 | <0.0001 | |
| DHL | -2.24 | 0.494 | <0.0001 | |
| DDL | OCL | 1.893 | 0.456 | <0.0001 |
| TCL | 2.733 | 0.454 | <0.0001 | |
| DDL | 4.587 | 0.466 | <0.0001 | |
| DHL | 2.347 | 0.508 | <0.0001 | |
| DHL | OCL | -0.453 | 0.485 | 0.351 |
| TCL | 0.387 | 0.483 | 0.425 | |
| THCL | 2.24 | 0.494 | <0.0001 | |
| DDL | -2.347 | 0.508 | <0.0001 |
3.4. Saccade Ratio
The main effect of interface layout on saccade ratio is significant [F= 42.244,p<0.0001]. Among them, the triple mode had the highest slitter rate (all p<0.006), the pull-down mode had the lowest slitter rate (p <0.0001), and the difference in slitter rate between the double mode and the double horizontal mode was small (p>0.607). Finally, the LSD post hoc multiple comparison method was used to rank the average saccade time per second for each layout mode: Saccade ratio (THCL) > Saccade ratio (DHL) > Saccade ratio (TCL) > Saccade ratio (OCL) > Saccade ratio (DDL).
The main effect of illuminance change on saccade ratio was significant [F=7.405,p<0.001]. In the three light environments, the 100lx light environment had less saccade rate than the other two light environments (p<0.031). There was no significant difference in the number of gaze between 50lx and 20lx (p=0.110).
Figure 7.
Saccade ratio for different illumination intensities and layout patterns.
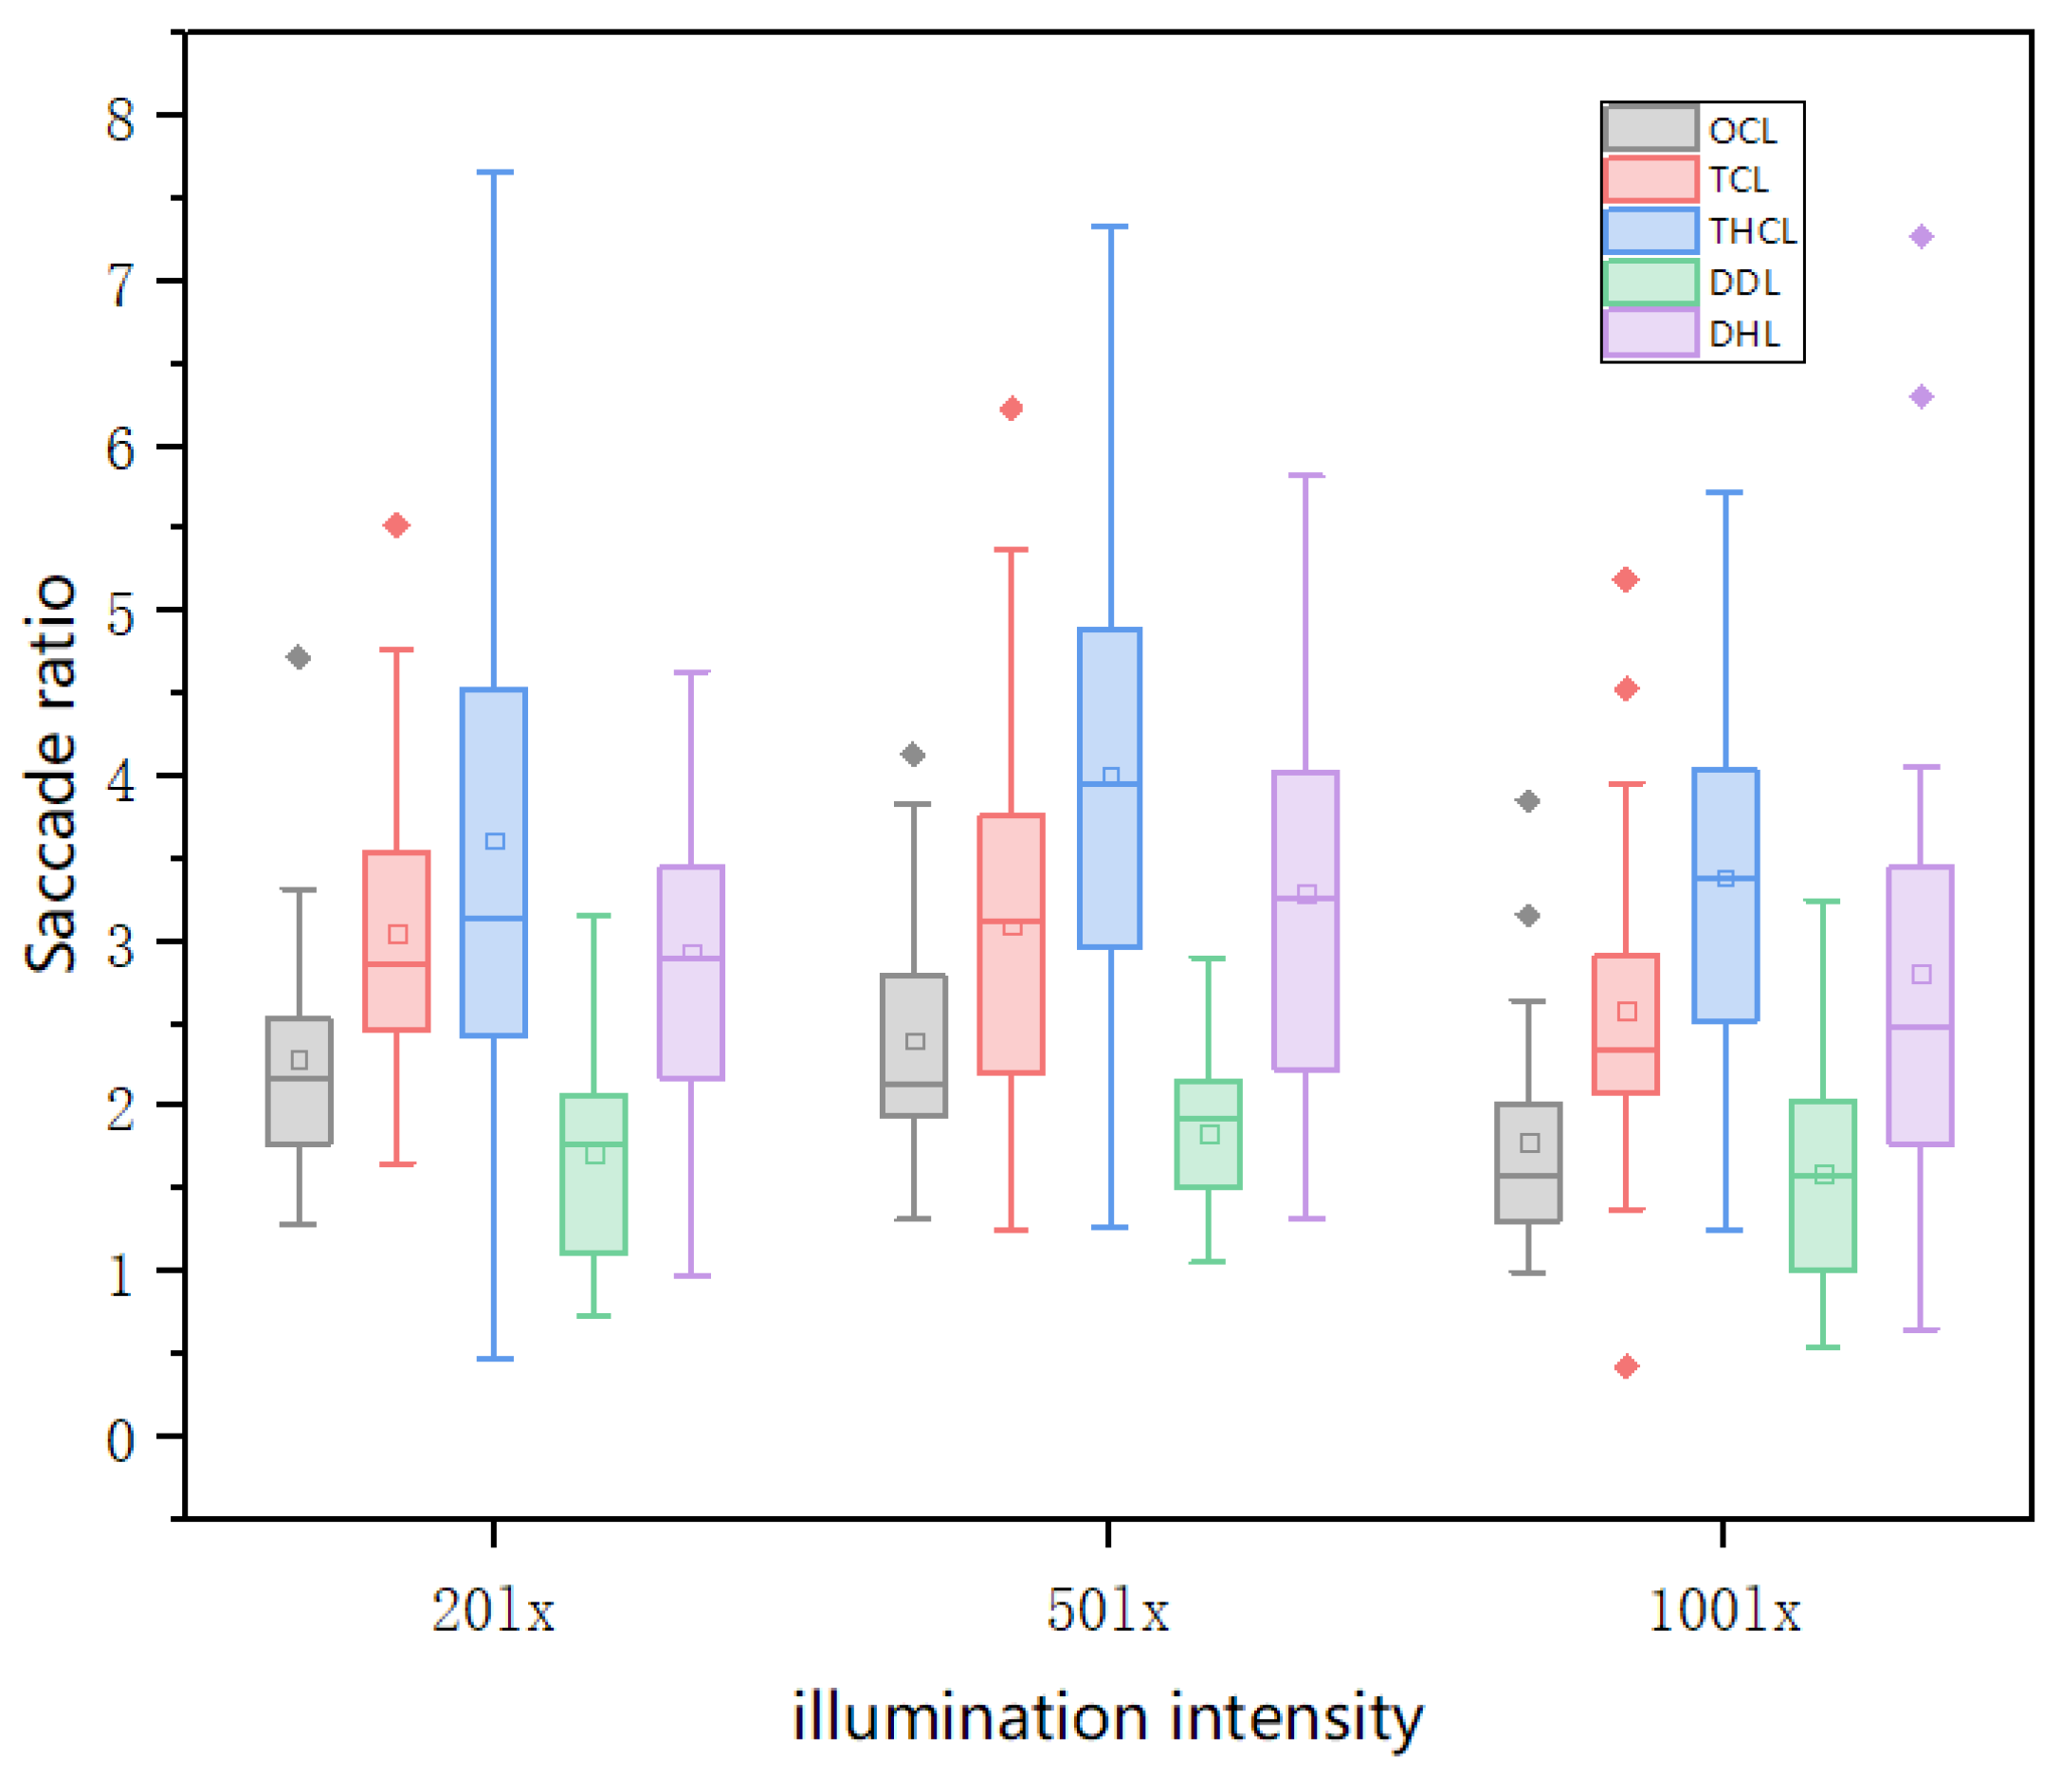
Table 5.
LSD test at Saccade ratio for Five interface layout modes.
| Layout Patterns A | Layout Pattern B | Mean difference (A-B) |
Standard Error | P |
|---|---|---|---|---|
| OCL | TCL | -0.757 | 0.154 | <0.0001 |
| THCL | -1.514 | 0.199 | <0.0001 | |
| DDL | 0.44 | 0.116 | <0.0001 | |
| DHL | -0.856 | 0.169 | <0.0001 | |
| TCL | OCL | 0.757 | 0.154 | <0.0001 |
| THCL | -0.757 | 0.219 | 0.001 | |
| DDL | 1.196 | 0.148 | <0.0001 | |
| DHL | -0.099 | 0.193 | 0.607 | |
| THCL | OCL | 1.514 | 0.199 | <0.0001 |
| TCL | 0.757 | 0.219 | 0.001 | |
| DDL | 1.953 | 0.194 | <0.0001 | |
| DHL | 0.658 | 0.23 | 0.005 | |
| DDL | OCL | -0.44 | 0.116 | <0.0001 |
| TCL | -1.196 | 0.148 | <0.0001 | |
| DDL | -1.953 | 0.194 | <0.0001 | |
| DHL | -1.296 | 0.164 | <0.0001 | |
| DHL | OCL | 0.856 | 0.169 | <0.0001 |
| TCL | 0.099 | 0.193 | 0.607 | |
| THCL | -0.658 | 0.23 | 0.005 | |
| DDL | 1.296 | 0.164 | <0.0001 |
3.5. Usability Score
The main effect of interface layout on subjective usability score is significant [F= 37.574, p<0.0001]. Among them, the triple layout mode had the highest score (p<0.02), the single layout mode had the lowest score (p<0.005), and the difference between the double layout mode and the double horizontal layout mode was small (p =0.250). Finally, LSD post hoc multiple comparison method was used to arrange the mean subjective usability scores of each layout mode: Triple Usability Score (THCL)> Usability Score (TCL) > Usability Score (DHL) > Usability Score (DDL) > Usability Score (OCL).
The main effect of illuminance change on subjective usability score was significant [F=18.034, p<0.0001]. In the three light environments, the 50lx light environment had a higher subjective availability score than the other two light environments (p<0.0001). There was no significant difference between the subjective availability scores of the other two light environments. (p=0.632).
Figure 8.
Usability score for different illumination intensities and layout patterns.
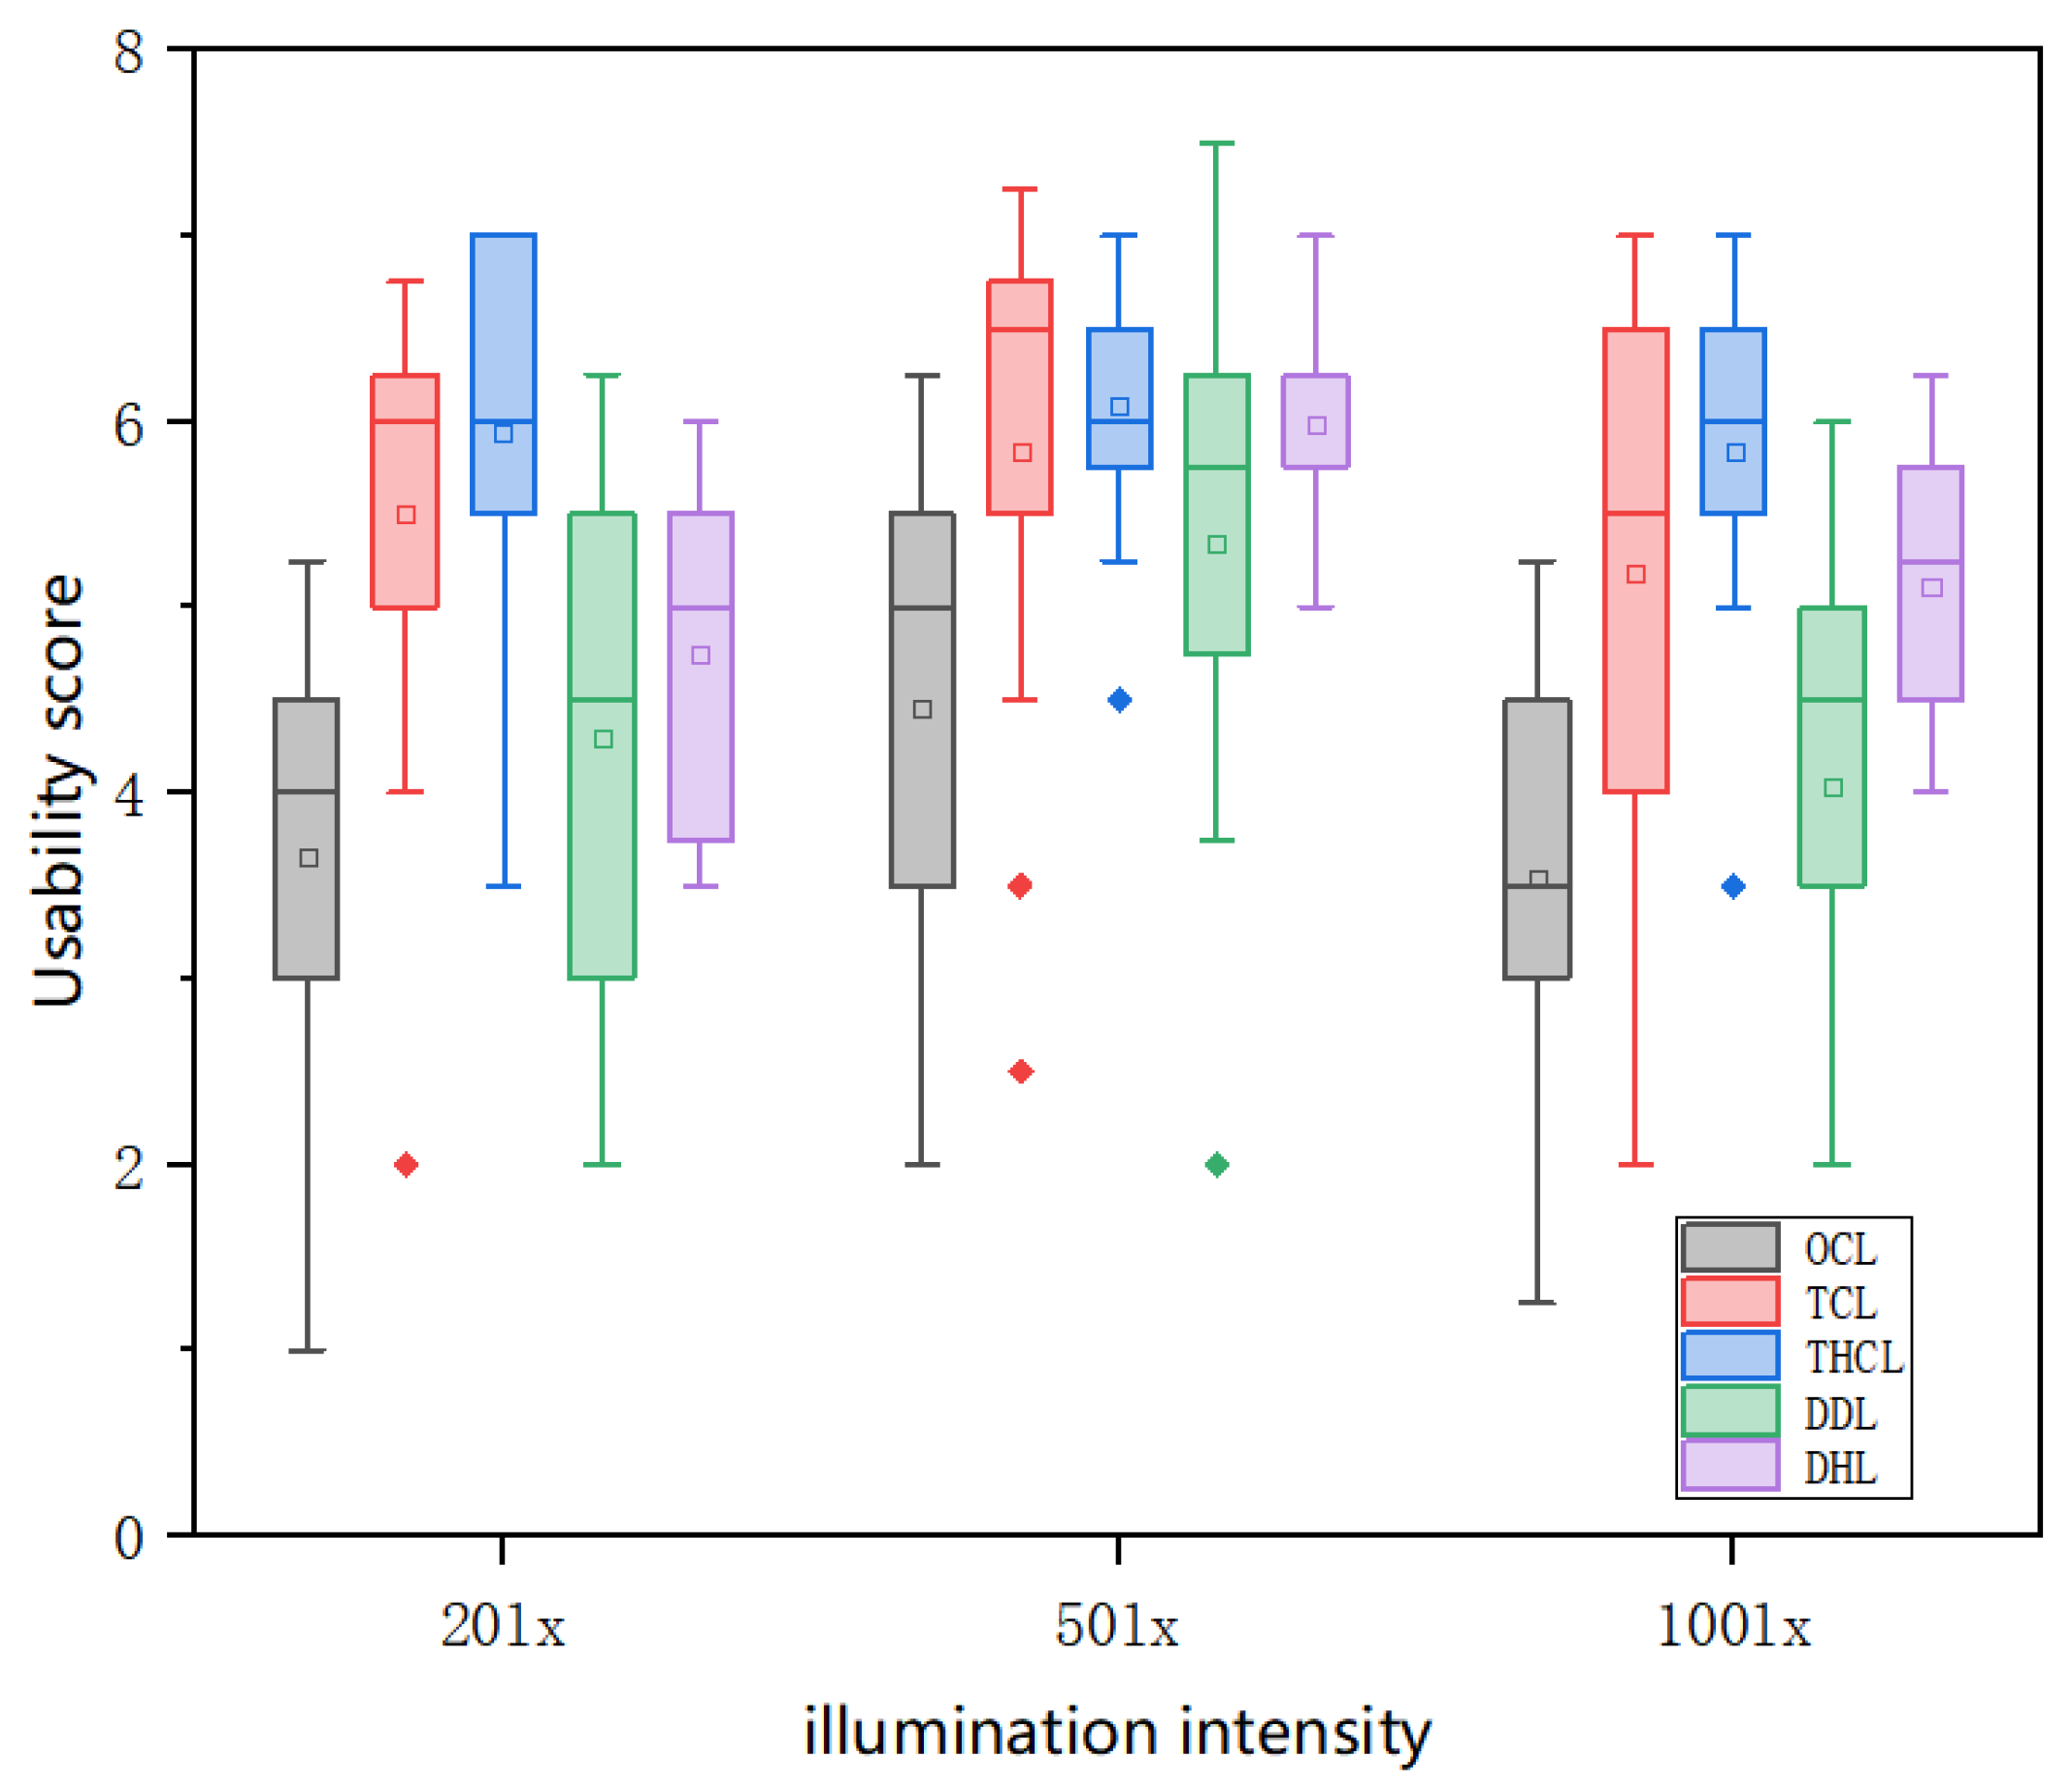
Table 6.
LSD test at Usability score for Five interface layout modes.
| Layout Patterns A | Layout Pattern B | Mean difference (A-B) |
Standard Error | P |
|---|---|---|---|---|
| OCL | TCL | -1.623 | 0.228 | <0.0001 |
| THCL | -2.073 | 0.187 | <0.0001 | |
| DDL | -0.673 | 0.234 | 0.005 | |
| DHL | -1.397 | 0.187 | <0.0001 | |
| TCL | OCL | 1.623 | 0.228 | <0.0001 |
| THCL | -0.45 | 0.196 | 0.023 | |
| DDL | 0.95 | 0.242 | <0.0001 | |
| DHL | 0.227 | 0.196 | 0.250 | |
| THCL | OCL | 2.073 | 0.187 | <0.0001 |
| TCL | 0.45 | 0.196 | 0.023 | |
| DDL | 1.4 | 0.204 | <0.0001 | |
| DHL | 0.677 | 0.147 | <0.0001 | |
| DDL | OCL | 0.673 | 0.234 | 0.005 |
| TCL | -0.95 | 0.242 | <0.0001 | |
| DDL | -1.4 | 0.204 | <0.0001 | |
| DHL | -0.723 | 0.203 | 0.001 | |
| DHL | OCL | 1.397 | 0.187 | <0.0001 |
| TCL | -0.227 | 0.196 | 0.250 | |
| THCL | -0.677 | 0.147 | <0.0001 | |
| DDL | 0.723 | 0.203 | 0.001 |
3.6. Correlation Between Variables
Table 7 shows the relationship between interactive usability indicators (task completion time and recall accuracy) variables and visual behavior (gaze count and saccade rate) and subjective usability.
Table 7.
The relationship of five dependent variables.
| Variate | 1 | 2 | 3 | 4 | 5 |
|---|---|---|---|---|---|
| 1 Accuracy rate | - | - | - | - | - |
| 2 Completion Time | .026 | - | - | - | - |
| 3 Fixation Count | -.045 | .400** | - | - | - |
| 4 Saccade Ratio | .120 | -.409** | -.427** | - | - |
| 5 Usability Score | .112 | -.267** | -.420** | .385** | - |
The results show that there is no significant correlation between the accuracy rate and other variables, and the number of fixations is strongly positively correlated with the task completion time, that is, the more fixations, the longer the task completion time. Saccade ratio was negatively correlated with task completion time, and the lower the saccade ratio, the longer the task completion time. At the same time, task completion time was negatively correlated with subjective rating, and the longer the task was completed, the lower the subjective rating. The subjective usability score was negatively correlated with the number of fixations and positively correlated with saccade ratio. The higher the number of looks, the smaller the saccade ratio.
4. Discussion
The widespread use of digital interfaces in underground inspection equipment has changed the working experience of mining practitioners. However, it is not clear whether these different forms of digital information layout can be experienced differently in low-light environments. In this study, we conducted a simulation study using eye tracking technology to evaluate the performance of different layouts of digital interfaces of mine inspection equipment in low-light environments in terms of search performance, visual behavior, and differences in usability satisfaction.
4.1. Performance on Search Tasks
To evaluate the impact of different layouts on search performance, we used two indicators: task completion time and task accuracy rate. The results show that the page layout has a significant impact on the task completion time and task accuracy of the subjects on the guided interface. The THCL mode took the least time. According to the research of Hosam [25], the layout of the number of reading information columns plays an important role in user information search and processing. For repetitive reading behavior, three-column layout has certain advantages over one-column layout and two-column layout in reading speed. Meanwhile, according to the research conclusion of J. Ryan Baker [26], two-column layout has the highest reading efficiency for speed reading behavior, which is superior to single-column and three-column information. When users use monitoring software to search for functions, most of them have repeated and fast reading behaviors. Therefore, in the experiment, the search efficiency of the THCL mode and the TCL mode is better.
In addition, in the study of Hui Ren etc. [27], in the layout with multiple information arrangements, the reading search accuracy of unidirectional horizontal arrangement (horizontal and vertical) is superior to that of text arrangement with multiple directions. This is consistent with the result that the task accuracy of OCL mode is the highest in the experiment.
4.2. Differences in Visual Behavior
Eye movement indicators can reflect the visual behavior performance of users and the distribution of attention during the search task. In this study, the number of gaze and task completion time showed a strong positive correlation. In other words, the less the number of fixations, the higher the search efficiency of users, which is consistent with the research of Jakub etc. [28]. A higher number of fixations often predicts the complexity of information processing, which makes the subjects have to devote more time to complete the information processing. According to the studies of Si-jun He [9] and Rolfs [29], saccades ratio is a more scientific indicator than saccades amplitude. If the interface layout is not reasonable, more small saccades will be generated when users look for the corresponding task labels. A larger saccade ratio indicates that the interface layout has a reasonable saccade distance and better reading usability. At the same time, the saccade ratio is proportional to the number of fixations and the task time, and the longer the task time, the higher the task difficulty, which proves that the subjects need to interact with the layout information during the task, resulting in more small saccades and fixations.
Among all the interface layout patterns, the Fixation count of the OCL mode was higher. When reading repetitive content, the information layout with a dense layout pattern will cause users to spend more time looking for the beginning and end of the information, resulting in excessive fixation times [25], therefore, the task completion time is too long. The lowest Fixation count is the THCL mode, followed by the TCL mode. Since the different levels of layout information are distributed in different areas, the information can be processed faster during the reading process, reducing the number of fixations on each fixation point and reducing the occurrence of retrospective behavior.
The layout of long scanning is reflected in the correspondence of information at a greater distance [30], and the corresponding information layout is carried out according to different information levels. Therefore, when performing search tasks, users can show a more obvious search purpose. A clear information layout helps increase the number of scans. The Saccade ratio of the THCL mode and the TCL mode is larger. Interfaces using these two layouts mode can complete search tasks more quickly. Therefore, we observe that the increase in the Saccade ratio corresponds to the improvement in search efficiency.
4.3. Assess Subjective Usability
In information search tasks, subjective usability score is strongly negatively correlated with task completion time and positively correlated with task accuracy. The subjective usability score was negatively correlated with the fixations Count and positively correlated with the saccade ratio. This suggests that the fewer looks, the less mental effort users put into performing the search task. Meanwhile, a higher saccade ratio means the task is easier. This is the same as Chevalier [31]’s findings that the slower the search time during the search task, the greater the psychological effort the user expends, thus affecting their subjective usability score in the search task. An interface with good search performance may also have a higher subjective score, with higher usability scores for both TCL node and THCL modes, especially THCL modes. OCL mode and DDL modes will have lower usability ratings. Overall, the information classification layout structure provides good ratings in terms of browsing efficiency and overall satisfaction.
4.4. Light Environment
As far as ambient light source is concerned, experimental data show that 50lx illumination environment has the lowest task completion time, the highest saccade rate and the lowest gaze times. According to the contents discussed in 5.2, it is proved that the user has the highest search efficiency in the 50lx lighting environment. At the same time, there are little differences in subjective scores and eye movement data between 20lx and 50lx environments. This indicates that the search efficiency is about the same in the two light environments. This is also the same as Ying hou [31]’s experimental results that users have better visual comfort when the ambient illumination is 13.08-62.16lx when using LCD screen in dark environment. In a 100lx illumination environment, glare may be generated when the light source directly illuminates the screen, which affects the efficiency and comfort of users’ visual search. In general, in too low light environments (below 100lx), lower ambient illumination will not reduce visual performance, so lower ambient illumination is acceptable and can even provide more efficient visual performance.
4.5. Limitations and Future Research Directions
This paper does have some limitations in the research process. First, judging from the difference between the experimental environment and the actual working environment, this study belongs to the static experiment carried out in the laboratory environment. While underground mining is a long-term and complex work scene, in contrast, this experiment only involves short- term visual search tasks, and does not deeply explore the visual search efficiency of users under high cognitive load after long-term underground mining work.
Secondly, in terms of noise factor, previous studies have shown that noise is one of the key factors affecting the visual search efficiency of the subjects [32]. However, this experiment was conducted in a relatively quiet environment, which has a big deviation from the actual situation of underground operation. In the process of working in the mine, the operation of mechanical equipment, the mining and transportation of ore will produce a lot of noise, which will not only interfere with the hearing of workers, but also may distract their attention, and then have a negative impact on the efficiency of visual search. However, because this experiment did not consider the actual situation, there are certain limitations in the promotion and application of the research results, which cannot accurately reflect the real impact of noise on the visual search efficiency in the mine work.
5. Conclusions
In the process of intelligent mining, with the gradual increase in the use of electronic screens in the mine, this study focuses on the digital interface of the mine detection equipment, and delves into the impact of different interface layout and lighting environments on user search performance, visual behavior, and subjective usability.
It is found that the interface layout has a crucial impact on the search efficiency. Among various layout modes, the task completion time of THCL mode is significantly shorter than that of other layout modes, and the task completion time of DDL mode is the longest, indicating that the difference of layout directly affects the search efficiency. In terms of visual behavior, also significantly affected by the interface layout, the DDL mode has the most fixation counts, while the THCL mode has the least, and the Saccade ratio shows an opposite trend to the fixation counts, with the THCL mode having the highest and the DDL mode having the lowest, which means that reasonable layout can optimize visual behavior and reduce the complexity of information processing. Further analysis shows that subjective usability score is strongly negatively correlated with task completion time, negatively correlated with gaze count, and positively correlated with saccade ratio, which fully reflects the key role of interface layout on user subjective experience. Among them, the subjective usability score of THCL mode is the highest, and that of OCL mode is the lowest.
In terms of lighting environment factors, 50lx lighting environment has the lowest task completion time, the highest Saccade rate and the lowest number of fixation times, which proves that the user search efficiency is the highest under this lighting condition, while the subjective score and eye movement data are less different between 20lx and 50lx environments. It indicates that the visual performance can be maintained at a good level in a certain low illumination range (below 100lx), and the low illumination environment is acceptable and can even improve the efficiency.
This study provides an important reference for the digital interface design of mine detection equipment, which is helpful to optimize the interface layout and lighting condition setting, and improve the operation efficiency and visual comfort of mining employees.
6. Patents
Author Contributions
W.Z.: funding acquisition, supervision, project administration. J.Q.H.: conceptualization, methodology, writing – original draft. R.C.: writing-review and editing, visualization. All authors have read and agreed to the published version of the manuscript.
Funding
This work was supported by Jiangsu Province Graduate Research and Practice Innovation Program [grant number: SJCX25-1429]; The 2023 Postgraduate Teaching Reform Demonstration Project of China University of Mining and Technology [grant number: 2023KCS761].
Institutional Review Board Statement
This study is a non-clinical behavioral experiment on visual search efficiency, which does not involve invasive operations or potential harm to participants. The ethical review was exempted by the Ethical Review Committee of the School of Architecture and Design, China University of Mining and Technology, and all experimental operations complied with the relevant ethical norms of human subject research in China.
Informed Consent Statement
All participants were informed of the purpose, procedures, and potential risks of the study prior to the experiment, and all of them provided written informed consent voluntarily. The consent form included the right of participants to withdraw from the study at any time without any adverse consequences. All experimental procedures were conducted in accordance with the ethical principles for human research.
Data Availability Statement
The raw eye-tracking data (including fixation count, saccade ratio, task completion time) and subjective usability questionnaire data generated during the current study are available from the corresponding author (Wei Zong, zongwei@cumt.edu.cn) upon reasonable request. The interface layout materials used in the experiment are not publicly available due to the research design of mine supervision system, but can be provided by the authors for research purposes.
Conflicts of Interest
The authors declare no conflict of interest.
References
- Niu, Senying. Coal mine safety production situation and management strategy. Management & Engineering 2014, 14, 78.
- Solarz, Jarosław, et al. Trends in energy security education with a focus on renewable and nonrenewable sources. Energies 2022, 15.4, 1351.
- Singo, Josephine, et al. Accidents, injuries, and safety among artisanal and small-scale gold miners in Zimbabwe. International journal of environmental research and public health 2022, 19.14, 8663.
- Friedrich, Max, and Mark Vollrath. Urgency-Based color coding to support visual search in displays for supervisory control of multiple unmanned aircraft systems. Displays 2022, 74, 102185. [CrossRef]
- Friedrich, Max, and Joonas Lieb. A novel human machine interface to support supervision and guidance of multiple highly automated unmanned aircraft. 2019 IEEE/AIAA 38th Digital Avionics Systems Conference (DASC); IEEE, 2019.
- Nobre, Kia, and Sabine Kastner, eds. The Oxford handbook of attention; Oxford University Press: USA, 2014. [Google Scholar]
- Cain, Matthew S., and Stephen R. Mitroff. Memory for found targets interferes with subsequent performance in multiple-target visual search. Journal of Experimental Psychology: Human Perception and Performance 2013, 39.5, 1398.
- Yu, Hanui, and Takeshi Akita. Influence of ambient-tablet PC luminance ratio on legibility and visual fatigue during long-term reading in low lighting environment. Displays 2020, 62, 101943. [CrossRef]
- He, Si-jun, et al. Effects of design features of train electronic guidance interface on visual search, behavior, and usability. International Journal of Industrial Ergonomics 2023, 93, 103387. [CrossRef]
- Jokinen, Jussi PP, et al. Adaptive feature guidance: Modelling visual search with graphical layouts. International Journal of Human-Computer Studies 2020, 136, 102376. [CrossRef]
- Li, Jutao, et al. Effects of different interaction modes on fatigue and reading effectiveness with mobile phones. International Journal of Industrial Ergonomics 2021, 85, 103189. [CrossRef]
- Guo, Fu, et al. Effects of visual complexity on user search behavior and satisfaction: an eye-tracking study of mobile news apps. Universal Access in the Information Society 2022, 21.4, 795–808.
- Halverson, Tim, and Anthony J. Hornof. Explaining eye movements in the visual search of varying density layouts. In Sixth International Conference on Cognitive Modeling; Psychology Press, 2004.
- Tang, **ao-Teng, Jun Yao, and He-Fan Hu. Visual search experiment on text characteristics of vital signs monitor interface. Displays 2020, 62, 101944. [CrossRef]
- Hsiao, Chih-Yu, et al. Effects of Chinese character size, number of characters per line, and number of menu items on visual search task on tablet computer displays for different age groups. International Journal of Industrial Ergonomics 2019, 72, 61–70. [CrossRef]
- Li, Wen-Chin, et al. Visual scan patterns reflect to human-computer interactions on processing different types of messages in the flight deck. International Journal of Industrial Ergonomics 2019, 72, 54–60. [CrossRef]
- Yao, Jun, et al. Visual recognition efficiency of handheld infrared thermometer interface information under low ambient illuminance. International Journal of Industrial Ergonomics 2021, 83, 103143. [CrossRef]
- Yao, Jun, et al. Visual recognition efficiency of handheld infrared thermometer interface information under low ambient illuminance. International Journal of Industrial Ergonomics 2021, 83, 103143. [CrossRef]
- Chang, Po-Chun, Shuo-Yan Chou, and Kong-King Shieh. Reading performance and visual fatigue when using electronic paper displays in long-duration reading tasks under various lighting conditions. Displays 2013, 34.3, 208–214.
- Na, Nooree, Kyungah Choi, and Hyeon-Jeong Suk. Adaptive luminance difference between text and background for comfortable reading on a smartphone. International Journal of Industrial Ergonomics 2016, 51, 68–72. [CrossRef]
- Tian, Peiyuan, et al. Effects of paradigm color and screen brightness on visual fatigue in light environment of night based on eye tracker and EEG acquisition equipment. Sensors 2022, 22.11, 4082.
- Finstad, Kraig. Response interpolation and scale sensitivity: Evidence against 5-point scales. Journal of usability studies 2010, 5.3, 104–110.
- Tatler, Benjamin W., Roland J. Baddeley, and Benjamin T. Vincent. The long and the short of it: Spatial statistics at fixation vary with saccade amplitude and task. Vision research 2006, 46.12, 1857–1862.
- Poletti, Martina, Janis Intoy, and Michele Rucci. Accuracy and precision of small saccades. Scientific Reports 2020, 10.1, 16097.
- Al-Samarraie, Hosam, Samer Muthana Sarsam, and Irfan Naufal Umar. Visual perception of multi-column-layout text: insight from repeated and non-repeated reading. Behaviour & Information Technology 2017, 36.1, 75–84.
- Baker, J. Ryan. Is multiple-column online text better? it depends. Usability News 2005, 7.2, 1–8.
- Ren, Hui, et al. The impact of multidirectional text typography on text readability in word clouds. Displays 2024, 83, 102724. [CrossRef]
- Novák, Jakub Štěpán, et al. Eye tracking, usability, and user experience: A systematic review. International Journal of Human–Computer Interaction 2024, 40.17, 4484–4500.
- Rolfs, Martin. Microsaccades: small steps on a long way. Vision research 2009, 49.20, 2415–2441.
- Andrienko, Gennady, et al. Visual analytics methodology for eye movement studies. IEEE transactions on Visualization and Computer Graphics 2012, 18.12, 2889–2898.
- Chevalier, Aline, Anne-Claire Maury, and Nicolas Fouquereau. The influence of the search complexity and the familiarity with the website on the subjective appraisal of aesthetics, mental effort and usability. Behaviour & Information Technology 2014, 33.2, 117–132.
- Zhou, Ying, et al. Investigation of the optimum display luminance of an LCD screen under different ambient illuminances in the evening. Applied Sciences 2021, 11.9, 4108.
- Liu, Tao, et al. Effects of noise type, noise intensity, and illumination intensity on reading performance. Applied Acoustics 2017, 120, 70–74. [CrossRef]
Figure 1.
Interface classification diagram of mine supervision system under mine.
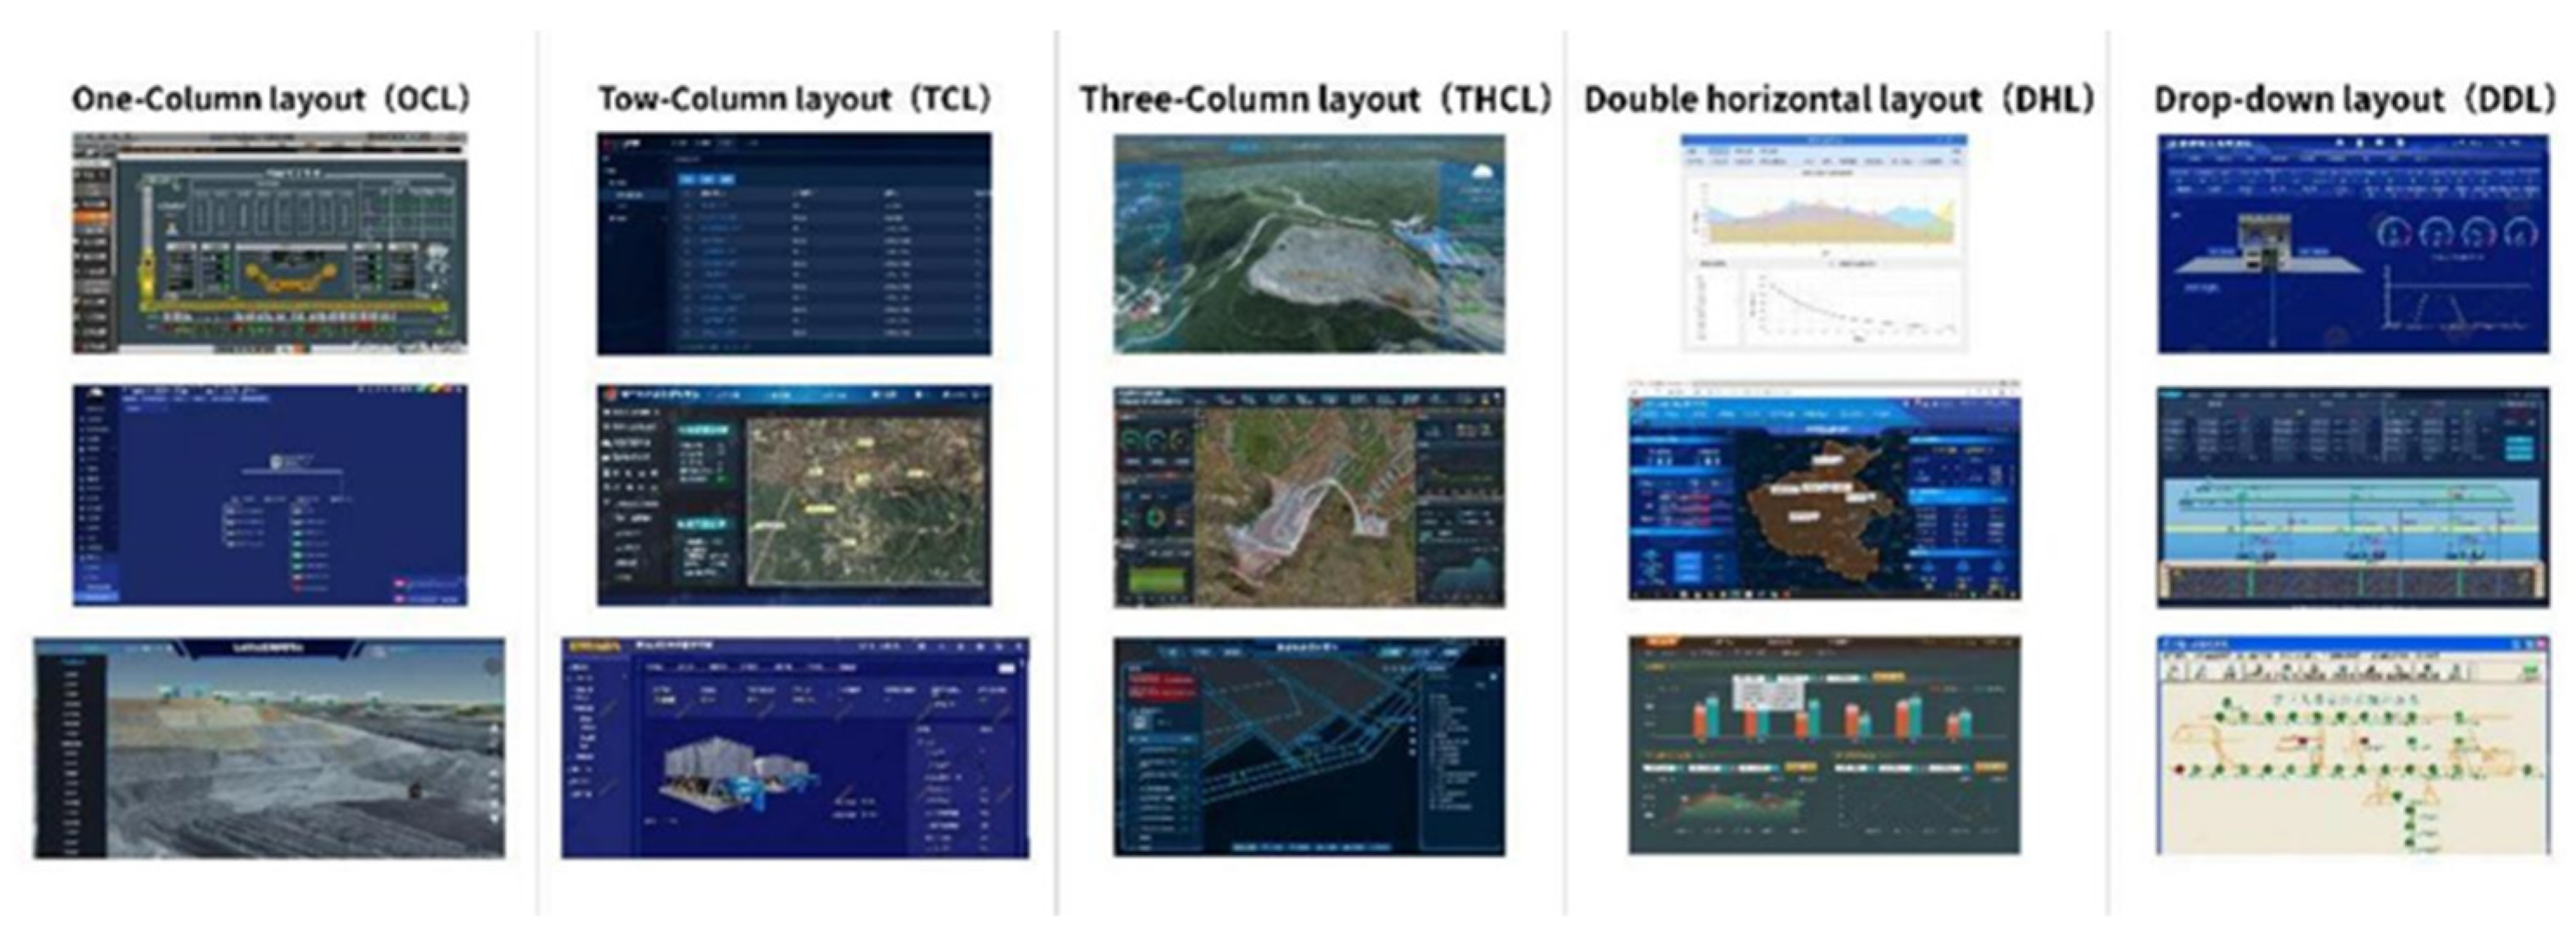
Figure 2.
Experimental diagram of the interface of mine supervision system under mine.

Figure 3.
Experimental process.
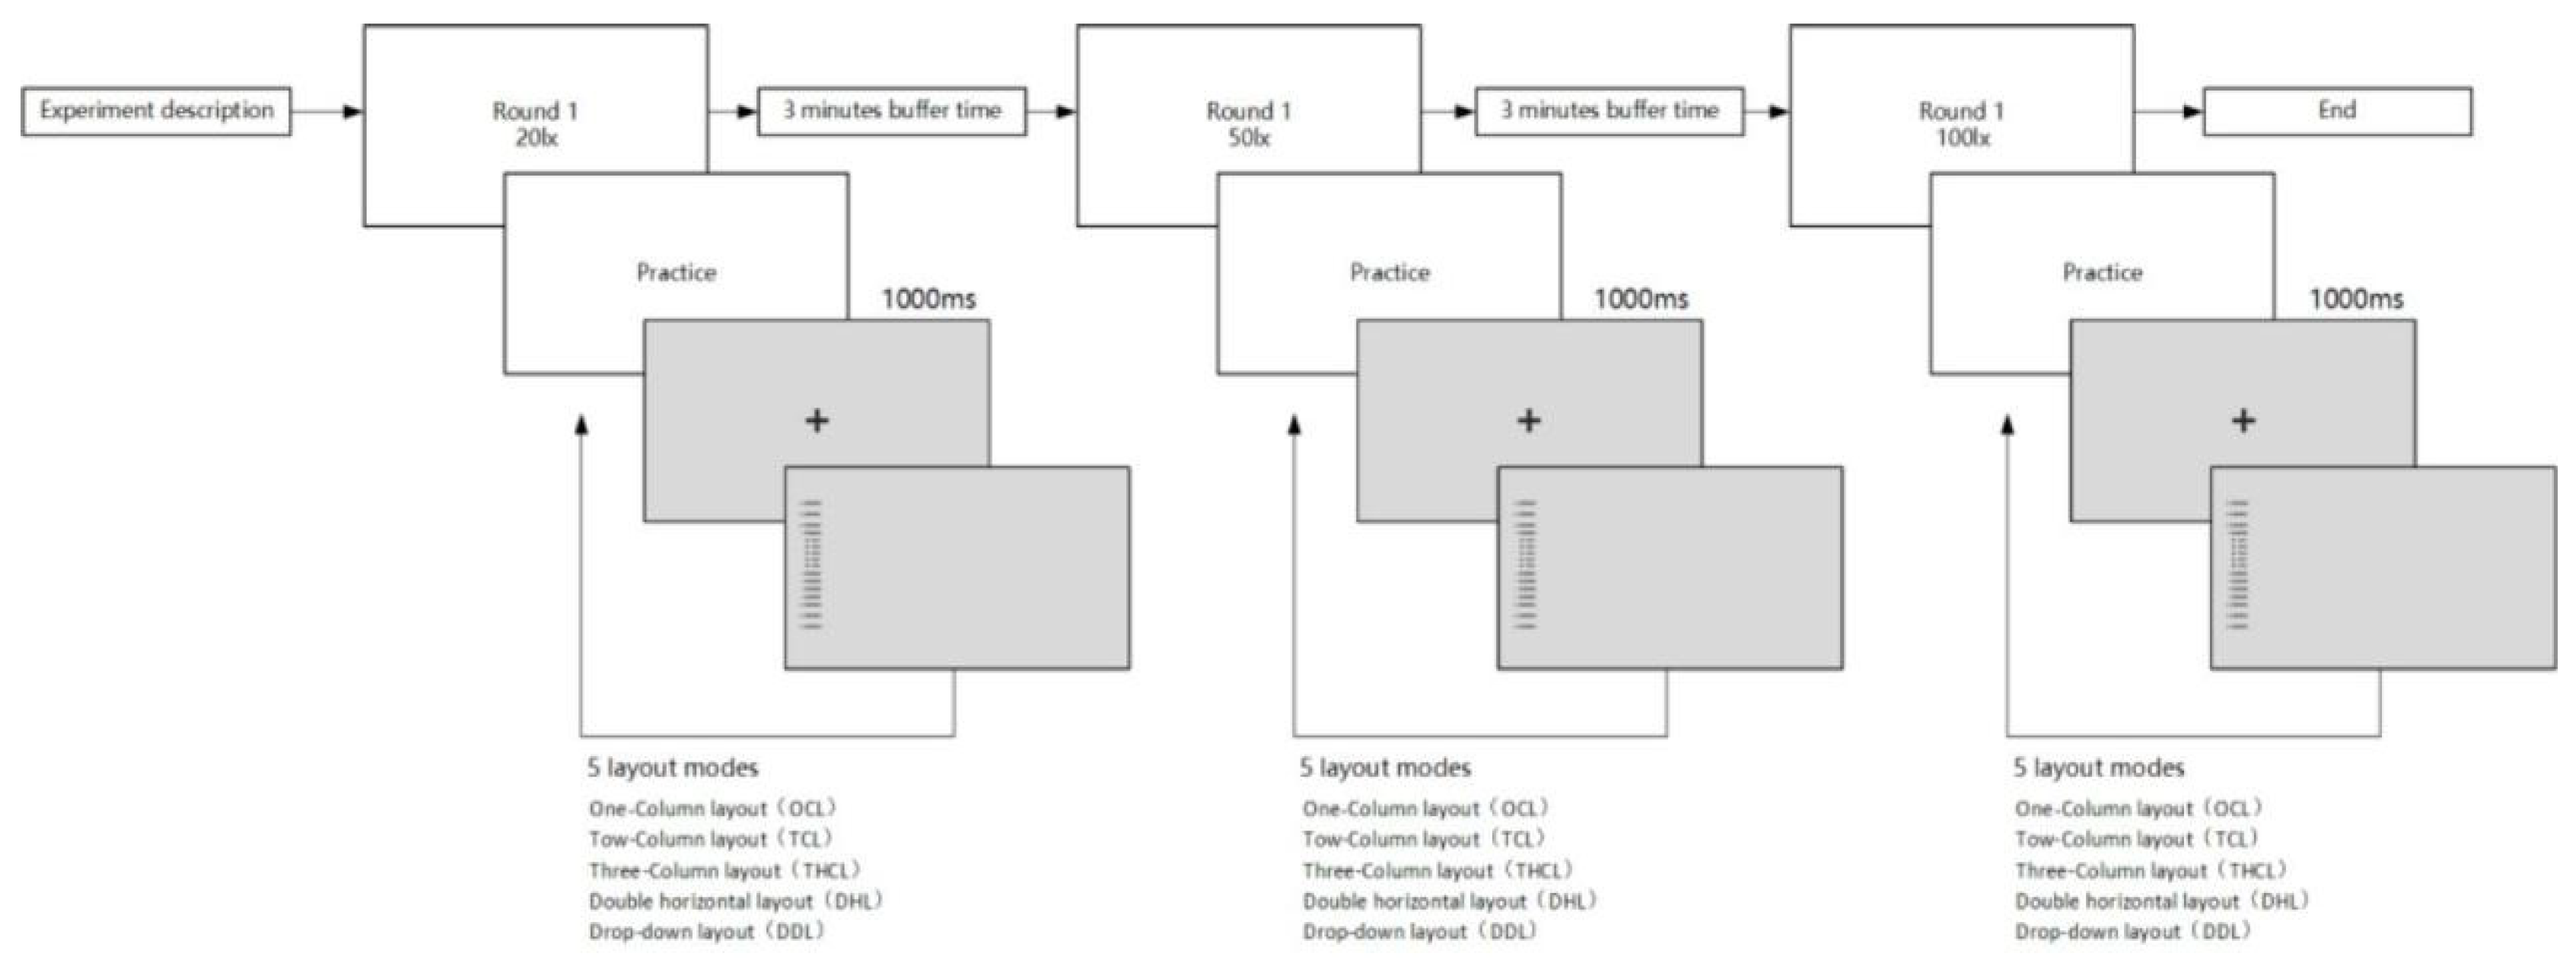
Figure 4.
Task completion time for different illumination intensities and layout patterns.
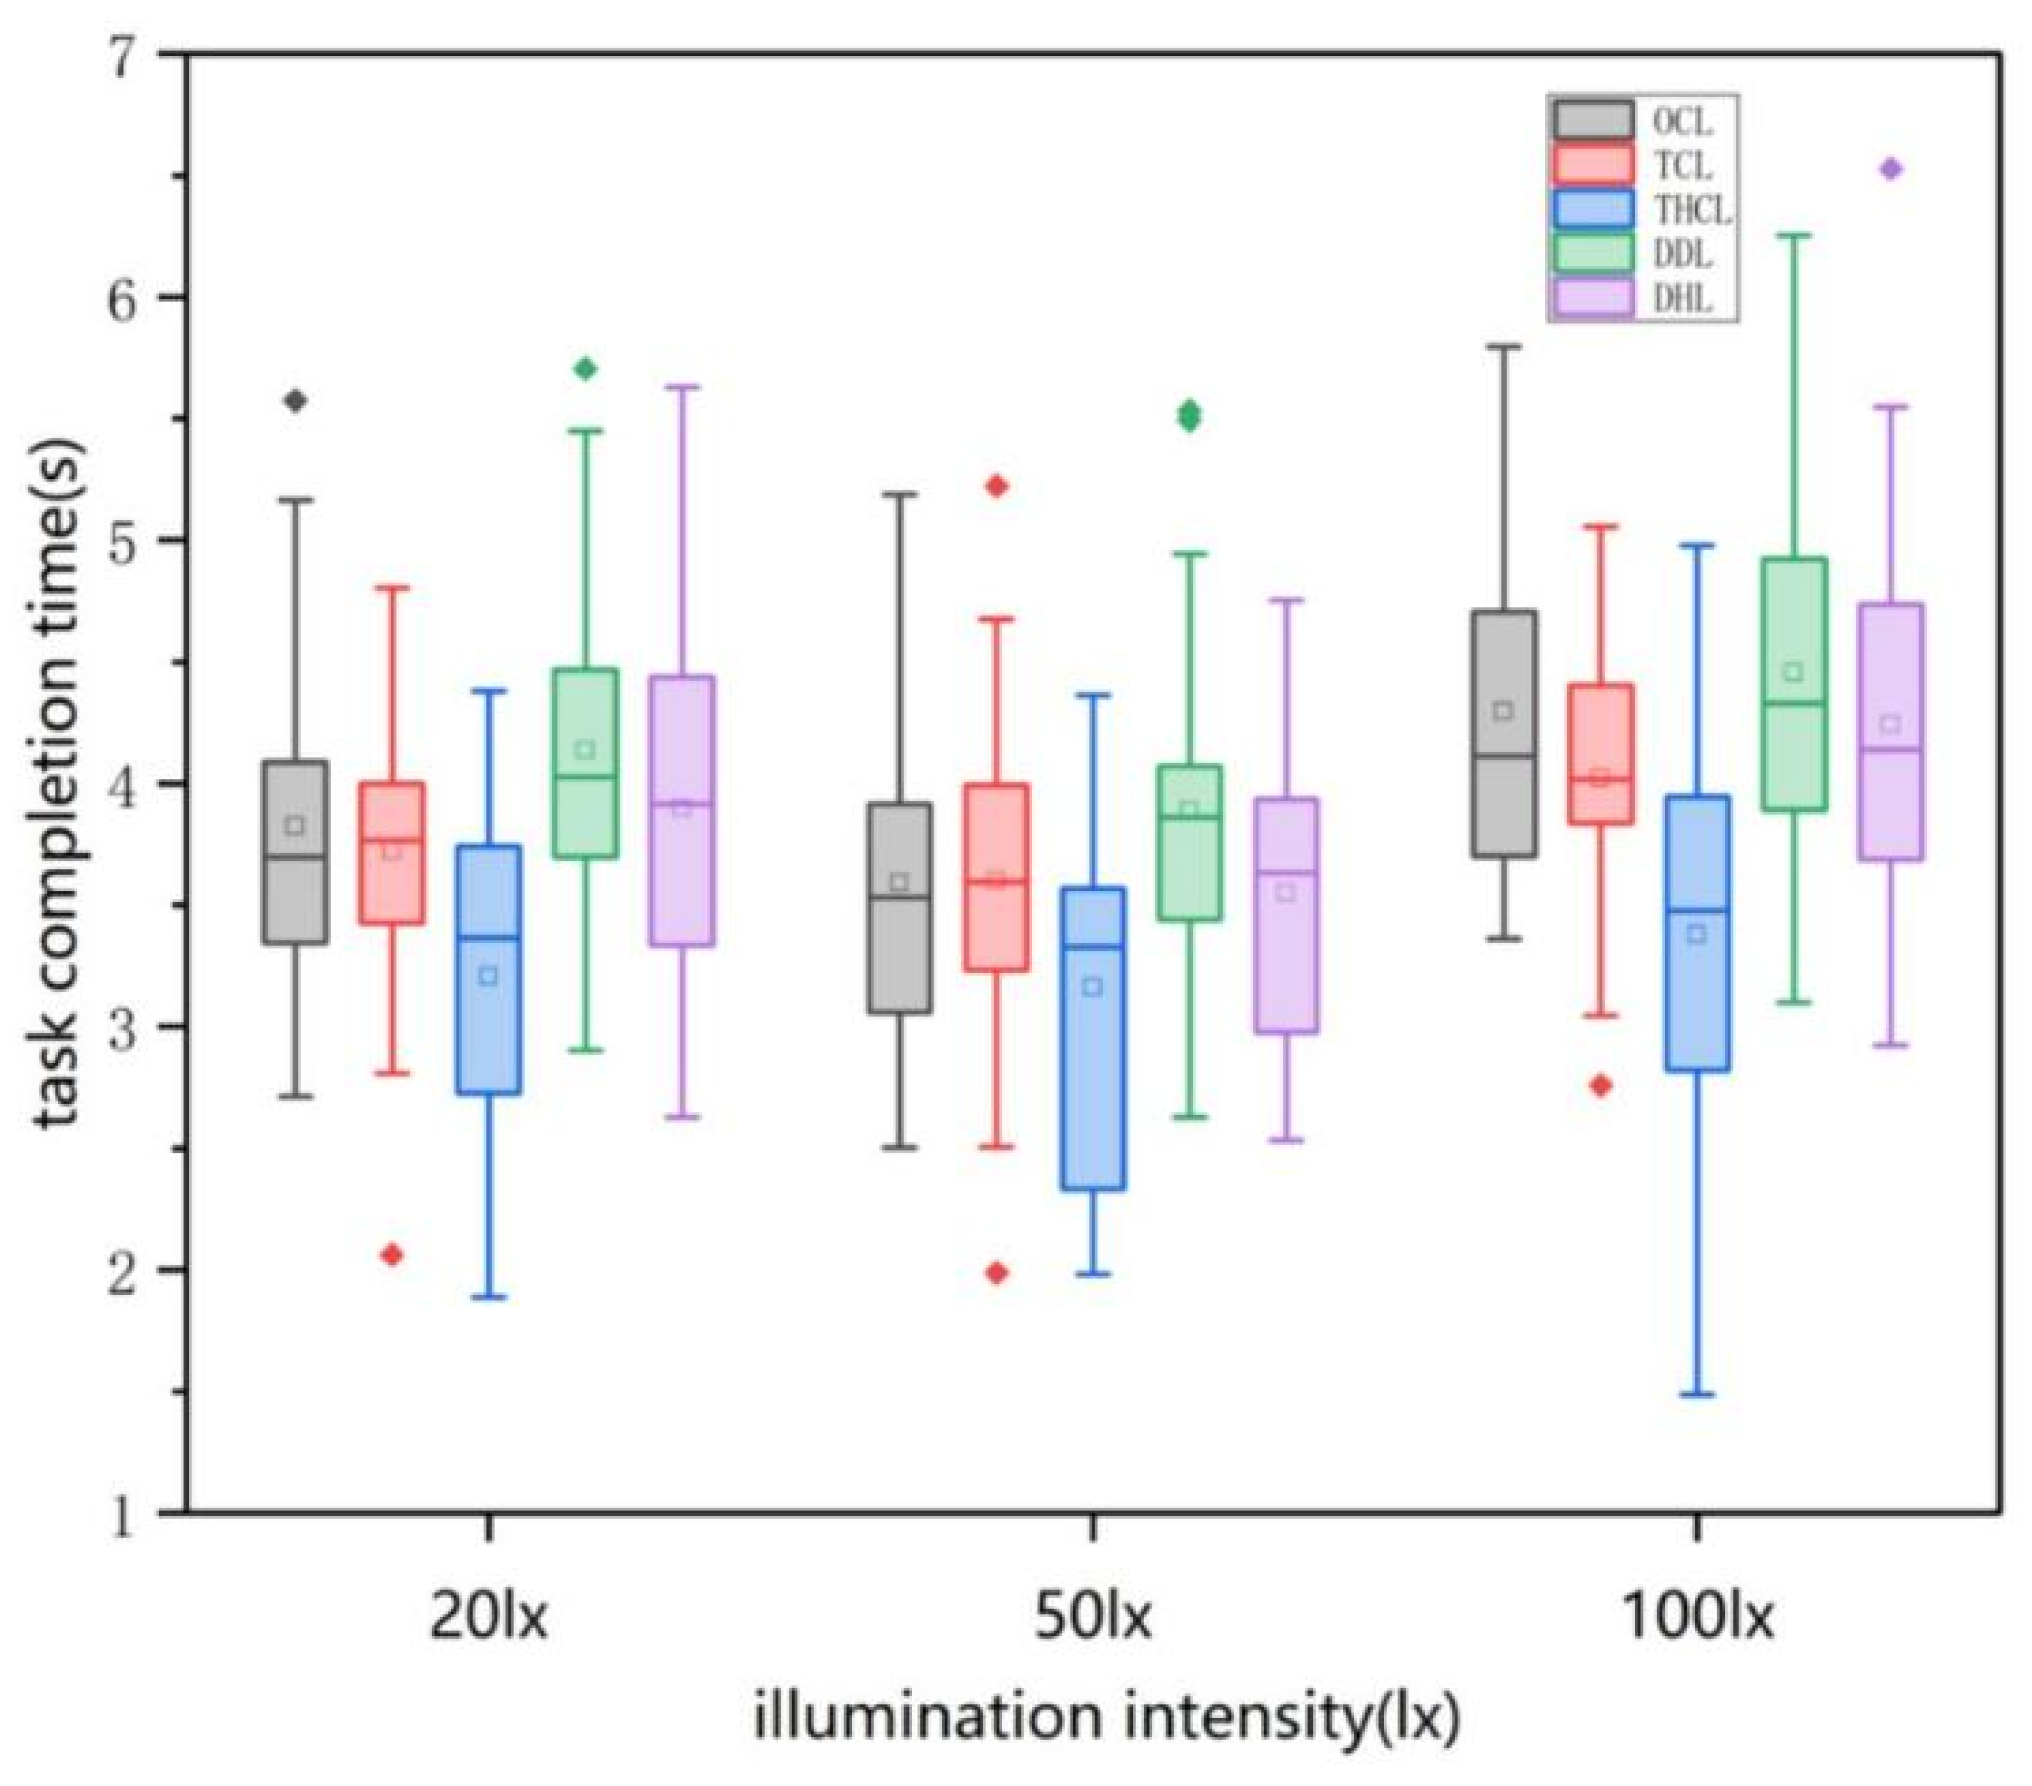
Figure 5.
Fixation count for different layout patterns.
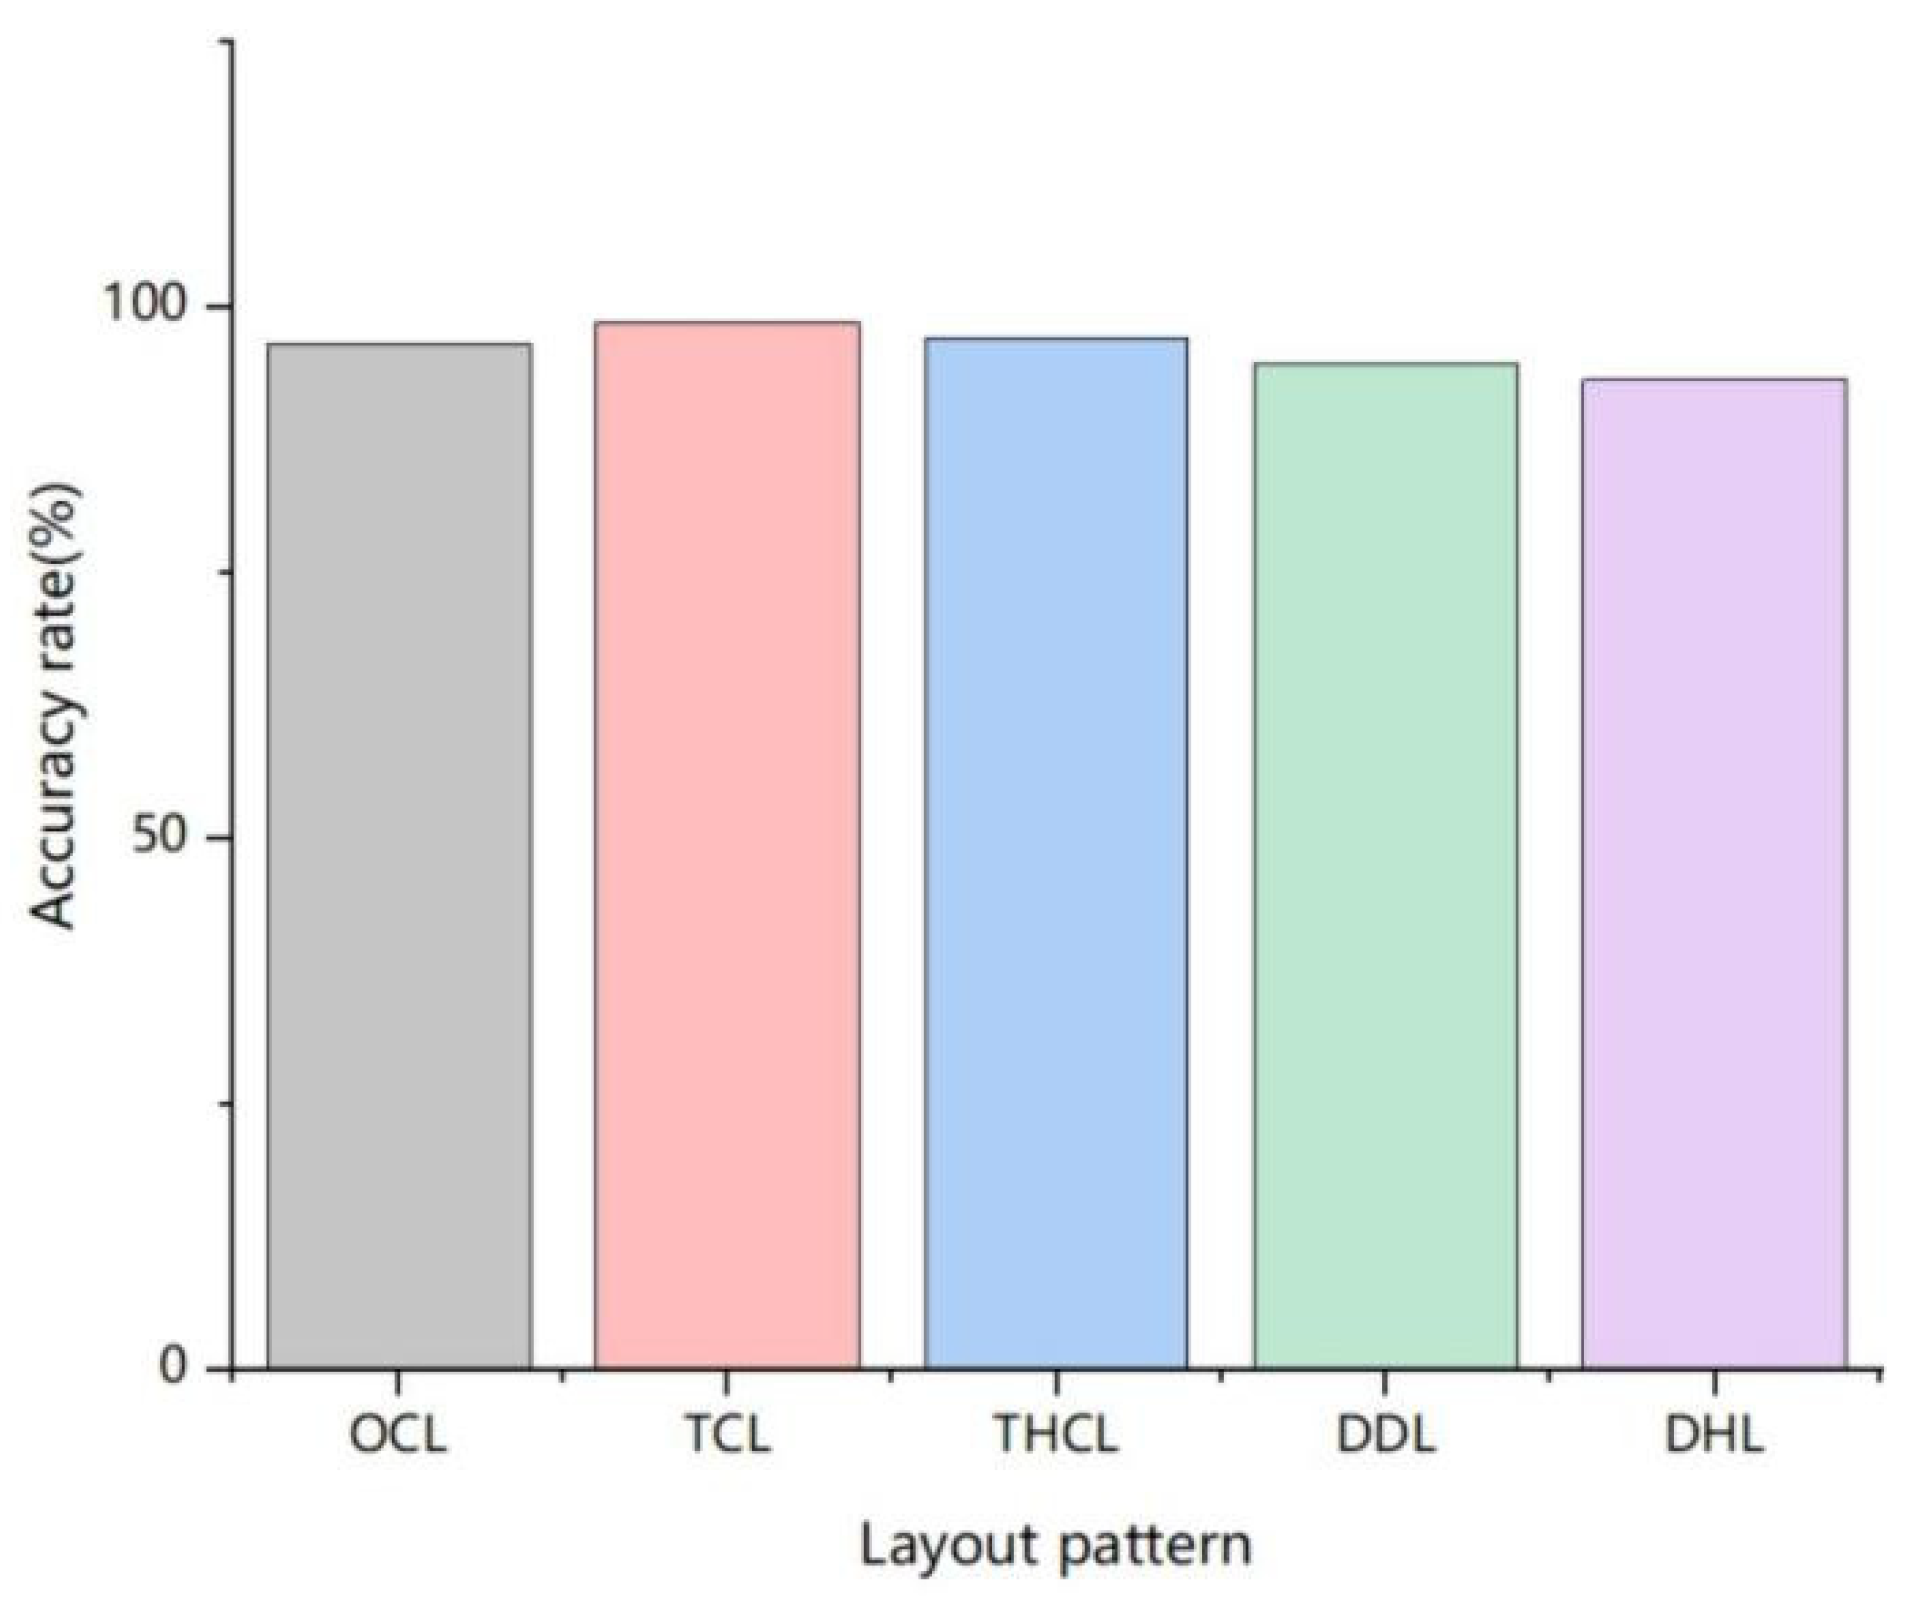
Table 1.
Results of ANOVA for five layout patterns.
| Dependent variable | illumination intensity | Class III square sum |
Freedom | Mean square | F | Significant |
|---|---|---|---|---|---|---|
| Fixation Count | 20lx | 255.248 | 4 | 63.812 | 10.734 | <0.0001 |
| 50lx | 234.672 | 4 | 58.668 | 9.822 | <0.0001 | |
| 100lx | 347.840 | 4 | 86.960 | 13.294 | <0.0001 | |
| Saccade Ratio | 20lx | 53.715 | 4 | 13.429 | 11.061 | <0.0001 |
| 50lx | 69.772 | 4 | 17.443 | 13.873 | <0.0001 | |
| 100lx | 55.146 | 4 | 13.786 | 11.582 | <0.0001 | |
| Completion Time | 20lx | 11.822 | 4 | 2.955 | 6.150 | <0.0001 |
| 50lx | 6.751 | 4 | 1.688 | 3.396 | <0.0111 | |
| 100lx | 17.730 | 4 | 4.432 | 6.428 | <0.0001 | |
| Usability Score | 20lx | 83.697 | 4 | 20.924 | 14.049 | <0.0001 |
| 50lx | 45.257 | 4 | 11.314 | 8.332 | <0.0001 | |
| 100lx | 87.115 | 4 | 21.779 | 15.123 | <0.0001 | |
| Accuracy rate | 20lx | 0.048 | 4 | 0.012 | 0.194 | 0.941 |
| 50lx | 0.208 | 4 | 0.052 | 0.975 | 0.424 | |
| 100lx | 0.112 | 4 | 0.028 | 0.894 | 0.470 |
Table 2.
Results of ANOVA for the effect of different illumination intensity.
| Layout pattern | Dependent variable | Class III square sum | Freedom | Mean square | F | Significant |
|---|---|---|---|---|---|---|
| OCL | Fixation Count | 124.58 | 2 | 62.29 | 11.560 | <0.0001 |
| Saccade Ratio | 5.323 | 2 | 2.66 | 5.163 | 0.008 | |
| Completion Time | 6.473 | 2 | 3.24 | 6.079 | 0.004 | |
| Usability Score | 12.222 | 2 | 6.11 | 3.623 | 0.032 | |
| Accuracy rate | 0.027 | 2 | 0.01 | 0.152 | 0.859 | |
| TCL | Fixation Count | 118.90 | 2 | 59.45 | 11.129 | <0.0001 |
| Saccade Ratio | 3.958 | 2 | 1.98 | 1.661 | 0.197 | |
| Completion Time | 2.377 | 2 | 1.19 | 2.911 | 0.061 | |
| Usability Score | 5.447 | 2 | 2.72 | 1.321 | 0.273 | |
| Accuracy rate | 0.027 | 2 | 0.01 | 1.000 | 0.373 | |
| THCL | Fixation Count | 128.50 | 2 | 64.25 | 10.638 | <0.0001 |
| Saccade Ratio | 4.978 | 2 | 2.49 | 1.044 | 0.357 | |
| Completion Time | 0.671 | 2 | 0.34 | 0.477 | 0.623 | |
| Usability Score | 5.447 | 2 | 2.72 | 1.321 | 0.273 | |
| Accuracy rate | 0.027 | 2 | 0.01 | 0.5 | 0.609 | |
| DDL | Fixation Count | 218.00 | 2 | 109 | 18.49 | 0.000 |
| Saccade Ratio | 0.776 | 2 | 0.39 | 0.89 | 0.417 | |
| Completion Time | 4.074 | 2 | 2.04 | 3.63 | 0.031 | |
| Usability Score | 24.447 | 2 | 12.22 | 6.054 | 0.004 | |
| Accuracy rate | 0.027 | 2 | 0.013 | 0.255 | 0.775 | |
| DHL | Fixation Count | 207.22 | 2 | 103.61 | 12.8 | <0.0001 |
| Saccade Ratio | 3.055 | 2 | 1.52 | .970 | 0.384 | |
| Completion Time | 6.000 | 2 | 3 | 5.230 | 0.008 | |
| Usability Score | 19.995 | 2 | 1 | 18.052 | <0.0001 | |
| Accuracy rate | 0.027 | 2 | 0.01 | 0.207 | 0.814 |
Table 3.
LSD test at task completion time for Five interface layout modes.
| Layout Patterns A | Layout Pattern B | Mean difference (A-B) |
Standard Error | P |
|---|---|---|---|---|
| OCL | TCL | 0.123 | 0.117 | 0.297 |
| THCL | 0.655 | 0.132 | <0.0001 | |
| DDL | -0.256 | 0.127 | 0.045 | |
| DHL | 0.008 | 0.129 | 0.951 | |
| TCL | OCL | -0.123 | 0.117 | 0.297 |
| THCL | 0.532 | 0.122 | <0.0001 | |
| DDL | -0.379 | 0.117 | 0.002 | |
| DHL | -0.115 | 0.119 | 0.337 | |
| THCL | OCL | -0.655 | 0.132 | <0.0001 |
| TCL | -0.532 | 0.122 | <0.0001 | |
| DDL | -0.911 | 0.131 | <0.0001 | |
| DHL | -0.647 | 0.133 | <0.0001 | |
| DDL | OCL | 0.256 | 0.127 | 0.045 |
| TCL | 0.379 | 0.117 | 0.002 | |
| DDL | 0.911 | 0.131 | <0.0001 | |
| DHL | 0.264 | 0.129 | 0.042 | |
| DHL | OCL | -0.008 | 0.129 | 0.951 |
| TCL | 0.115 | 0.119 | 0.337 | |
| THCL | 0.647 | 0.133 | <0.0001 | |
| DDL | -0.264 | 0.129 | 0.042 |
Disclaimer/Publisher’s Note: The statements, opinions and data contained in all publications are solely those of the individual author(s) and contributor(s) and not of MDPI and/or the editor(s). MDPI and/or the editor(s) disclaim responsibility for any injury to people or property resulting from any ideas, methods, instructions or products referred to in the content. |
© 2026 by the authors. Licensee MDPI, Basel, Switzerland. This article is an open access article distributed under the terms and conditions of the Creative Commons Attribution (CC BY) license.
Copyright: This open access article is published under a Creative Commons CC BY 4.0 license, which permit the free download, distribution, and reuse, provided that the author and preprint are cited in any reuse.