

Submitted:
17 March 2026
Posted:
18 March 2026
You are already at the latest version
Abstract
Enterovirus alphacoxsackie (EV-A) is a highly diverse viral species containing at least 25 serotypes of viruses which show distinct infectivity and pathogenicity. Increasing studies show that EV-A protease 2A plays critical roles in virus-host interactions. Although 2A is usually considered as a non-structural protein highly conserved among different EV-A serotypes, its orthologs of different EV-A serotypes harbor abundant single amino acid polymorphisms (SAPs), probably contributing to the variance of infectivity and patho-genicity of EV-As. However, the SAP profile of EV-A 2A and its functional impacts have been poorly understood, mainly due to the unequal contribution to protein function of dif-ferent SAP sites. Herein, we developed Single Amino Acid Polymorphism Statistics (SAAPS), an information-entropy-based algorithmic pipeline, to identify key SAP sites (kSAPs) related to functional variance of EV-A 2A. As the result, we identified 56 kSAPs from 2A of 25 EV-A serotypes. Based on the kSAPs, the 2As can be clustered into three major groups with a few outliers, which was distinct from the clustering generated by phylogenetic analysis using the whole amino acid sequences. Functional verification with transcriptomic profiles of HEK-293T cells expressing different 2A variants revealed better phenotypic matching of kSAP-based clustering than that of phylogenetic clustering. No-tably, EV-A89, an outlier identified by kSAP clustering but not phylogenetic clustering, showed unique expressing and self-cleavage patterns which were not observed in other 2As. These findings demonstrated the good performance of SAAPS and functional SAP profile of EVA 2As, contributing to the understanding of the variance of EV-A infectivity and pathogenicity.
Keywords:
enterovirus A
; 2A protease
; single amino acid polymorphism
; information entropy
; serotype diversity
1. Introduction
Enteroviruses (EVs), members of the Enterovirus genus within the Picornaviridae family, are small, non-enveloped, positive-sense, single-stranded RNA viruses capable of infecting humans and other mammals. Among these, Enterovirus alphacoxsackie (EV-A) has been recognized as a major pathogen, particularly in pediatric populations. EV-A can cause diseases ranging from asymptomatic infections to severe neurological disorders such as aseptic meningitis and encephalitis [1,2], as well as mucocutaneous diseases like hand, foot, and mouth disease (HFMD) [3,4,5]. In recent decades, large-scale EV-A outbreaks have frequently been reported, particularly in East and Southeast Asia [6,7,8,9], resulting in substantial public health burden.
The EV-A genome is approximately 7.4–7.5 kb in length, containing a 5′ untranslated region (UTR), a single open reading frame (ORF), and a 3′ UTR. The ORF encodes a polyprotein precursor that is processed by viral proteases into three segments (P1–P3). The P1 segment encodes four structural proteins (VP1–VP4), whereas the P2 (2A–2C) and P3 (3A–3D) segments encode non-structural proteins [10,11,12]. Based on sequence similarity in the P1 segment and non-structural 2C/3CD regions, the International Committee on Taxonomy of Viruses (ICTV) has classified EV-A into 25 distinct serotypes, including Coxsackievirus A (CVA) and other Enterovirus A serotypes [13]. Although these serotypes share conserved genomic features, they exhibit distinct epidemiological and clinical characteristics.
EV-A infection is associated with a broad spectrum of diseases, with pathogenicity influenced by multiple factors including viral serotype, biological characteristics, and host immune status. Notable differences exist in the pathogenic profiles among distinct serotypes. Besides causing typical HFMD, EV-A71, the most extensively studied serotype, frequently leads to severe neurological complications such as brainstem encephalitis, aseptic meningitis, and neurogenic pulmonary edema [14]. In contrast, CVA16, although a major causative agent of HFMD [3], is typically associated with mild clinical manifestations characterized by faint rash and short-term fever, and severe complications are rarely observed [15]. These divergent pathogenic phenotypes likely reflect serotype-specific differences in viral replication kinetics, polyprotein processing efficiency, and capacity for host immune modulation.
Among the non-structural proteins, the 2A protease plays a critical role in regulating these processes. As a cysteine protease, it cleaves the viral polyprotein to ensure proper assembly of viral particles. Inter-serotype variations in cleavage efficiency potentially contribute to differences in viral replication rates. Moreover, 2A protease modulates host cellular processes by targeting key factors such as the eukaryotic initiation factor eIF4G [16], thereby inhibiting host protein synthesis in favor of viral translation. Additionally, 2A protease interferes with innate immune pathways, notably the RIG-I/MAVS signaling axis [17], and alters cytoskeletal components [18] to facilitate viral release. Given these pleiotropic roles, 2A protease is regarded as an essential determinant of viral fitness and a promising target for antiviral strategies. Notably, inter-serotype variations in 2A protease sequence, catalytic activity, and substrate specificity have been implicated in the observed differences in replication rates, tissue tropism, and capacity for immune evasion. These molecular differences likely govern disease severity and clinical outcomes among EV-A serotypes.
In recent years, other serotypes like CVA6 and CVA10 have emerged as significant causative agents of HFMD [4], exhibiting clinical features distinct from those of EV-A71 and CVA16. CVA6 infection often results in atypical HFMD, characterized by a more extensive rash distribution, complex lesion morphology, and frequently accompanied by onychomadesis and mucosal erosion, suggesting enhanced tropism for skin and mucosal tissues [19]. Besides HFMD, herpangina is also observed in CVA10 infection, characterized by prolonged fever duration in certain cases and clinical manifestations that may mimic herpesvirus infections [20], requiring differential diagnosis. The emergence of these serotypes with diverse clinical presentations highlights the importance of serotype-specific factors. Combined with the multifunctional nature of 2A protease, this underscores the critical role of 2A polymorphisms in governing EV-A pathogenic diversity.
As with many RNA viruses, EV-A exhibits a high mutation rate, driven by the lack of proofreading activity in its RNA-dependent RNA polymerase [21,22]. Genetic variability arises predominantly through point mutations and frequent recombination events, contributing to antigenic drift, immune escape, and enhanced adaptability [23,24,25]. However, traditional sequence analyses often treat all observed mutations equally, without distinguishing between neutral, functionally irrelevant polymorphisms and mutations that may impact viral phenotype. This limitation highlights the need for refined analytical strategies capable of identifying functionally relevant variations. One such approach, the study of single amino acid polymorphisms (SAPs) [26,27] facilitates the identification of non-synonymous mutations at the protein level that may impact serotype-specific disease phenotypes. SAPs have been employed in various viral systems to elucidate determinants of virulence, receptor usage, and immune evasion [28,29,30]. However, in the context of EV-A, existing methods typically include all polymorphic sites in clustering analyses, with results in classifications that lack clear correlations with phenotypic variations. To address this limitation, information entropy-based strategies have been proposed to filter out stochastic background mutations and highlight polymorphic sites under selective pressure.
In this study, we developed a Single Acid Amino Polymorphism Statistics (SAAPS) analysis pipeline incorporating information entropy metrics to systematically identify key SAP sites (kSAPs) within the EV-A 2A protease. To evaluate whether clustering based on these selected sites better aligns with serotype-specific pathogenic characteristics than traditional phylogenetic methods, we applied SAAPS to 25 EV-A serotypes, aiming to provide a refined framework for understanding the molecular basis of EV-A pathogenic diversity. Our findings highlight the critical role of 2A protease polymorphisms in shaping viral pathogenicity.
2. Materials and Methods
2.1. Data Collection and Sequence Processing
This study utilized publicly available EV-A 2A protease sequences obtained from the Picornaviridae database (https://picornaviridae.com/) and the National Center for Biotechnology Information (NCBI) (https://www.ncbi.nlm.nih.gov/). A total of 25 EV-A serotypes were selected for analysis to ensure comprehensive representation of genetic diversity. Sequences containing ambiguous characters, low-quality regions, or incomplete coding regions were filtered out to maintain high data integrity. Any sequence with unidentified codons or incorrect formatting was replaced with higher-quality alternatives from the database. All the viral sequences used in this study are listed in Supplementary Table S1.
2.2. Sequence Analysis and Phylogenetic Classification
To investigate the evolutionary relationships among EV-A serotypes, multiple sequence alignment was performed using MAFFT [31], followed by sequence identity analysis using BioAider [32]. The phylogenetic trees were constructed using Maximum Likelihood (ML) and Neighbor-Joining (NJ) methods. Evolutionary distances were estimated using substitution models selected via model-fitting analyses performed with ProtTest [33] and MEGA 7 [34] (The model results predicted can be found in Supplementary Tables S2 and S3). The robustness of tree topologies was assessed using bootstrap resampling to ensure reliable clustering of viral strains. Comparative analysis between traditional phylogenetic approaches and SAP-based classification was conducted to evaluate the efficacy of SAP clustering in delineating viral subgroups.
2.3. SAAPS Pipeline
To support ongoing research and investigations into related topics or research objects, we developed a novel bioinformatics analysis tool: Single Amino Acid Polymorphism Statistics (SAAPS). This software is a character-based interface program developed with Python3 and R, and it deployed on multiple systems such as Windows and MacOS. The software is mainly used for the rapid calculation of SAPs in multiple sequences, the calculation of information entropy at each site of the sequences, and the dimensionality reduction and clustering analysis of sequences. A detailed description of the software’s parameters and functions is beyond the scope of this article. Detailed documentation is available at: https://github.com/xiaosheep01/SAAPS.
2.4. Identification and Selection of Key Polymorphic SAP Sites (kSAPs) in EV-A 2A Protease
In this study, the identification of kSAPs in the EV-A 2A protease was performed using Shannon information entropy and SAAPS. Shannon entropy, a concept originating from information theory, quantifies the uncertainty or diversity within a system. In this study, we employed “Information Content” (IC) as a metric to assess the level of polymorphism at each site. The IC value is derived from Shannon entropy and is computed as follows:
where H(S) represents the Shannon entropy at a given site (measured in bits), S denotes the number of possible amino acids at that site, pi is the frequency of the i-th amino acid variant (0 ≤ pi ≤ 1), and n is the total number of different amino acid variants at that position.
To ensure that only significant polymorphic sites were retained while excluding non-polymorphic sites and highly variable sites that may introduce noise, we tested various threshold ranges. The final selection criteria for kSAPs were determined as follows: first, the total number of amino acid types observed at each site was calculated, and sites were arranged in ascending order based on these counts. Then, the mean IC value for each distinct amino acid type count was computed. Finally, the selection thresholds were defined using the following formula:
where IC represents the information content in bits, n is the number of distinct amino acid variants at a given site, and N is the total number of sites with a specific amino acid variant count.
2.5. Clustering Analysis of kSAPs in EV-A 2A Protease
After identifying polymorphic sites, amino acid residues were encoded using the Amino Acid Index (AAindex) [35]. Features were selected from the AAindex1 database, which which contains descriptors of amino acid physicochemical properties. Based on these selected features, each residue was mapped to a numerical vector according to the corresponding predefined values. For a given amino acid residue A with a feature set F, the numerical representation was defined as:
After the amino acid residues at each site are transformed using the features from AAindex, a multi—dimensional numerical vector is formed, which further constitutes a high-dimensional array as the mathematical representation of this site. The specific effect is as follows:
Here, the set of virus strains is represented by ; the set of polymorphic sites is represented by . Each cell is a vector containing elements, which are the values of multiple features of the virus strain at the polymorphic site .
To facilitate subsequent analysis, each element is expanded into a one—dimensional array, and then the entire matrix is represented as a standard two-dimensional matrix. That is, all n-dimensional vectors are expanded into n columns, and the dimensions of the matrix are adjusted to , where represents the number of virus strains, represents the number of polymorphic sites, and represents the number of features. In this way, the original matrix will be transformed into the following form:
To reduce computational complexity, Principal Component Analysis (PCA) was applied, retaining two principal components for visualization. For clustering, we used OPTICS (Ordering Points to Identify the Clustering Structure), a density-based method similar to DBSCAN but adaptable to varying cluster densities. The built-in OPTICS module in SAAPS was employed with a Euclidean distance metric and DBSCAN-based reachability plot extraction. The clustering results were visualized using R programming.
2.6. Transcriptomic Correlation Analysis
To validate the clustering results of polymorphic sites and assess their association with viral phenotypes, Bulk RNA-Seq analysis was performed on samples expressing the 2A proteases from 25 EV-A serotypes. Virus samples were categorized into distinct clusters based on the outcomes of OPTICS clustering. The human reference genome GRCh38_release110 was used for alignment, and differentially expressed genes (DEGs) were identified using the thresholds of |logFC| > 1 and p-value < 0.05. Gene Ontology (GO) functional enrichment and Kyoto Encyclopedia of Genes and Genomes (KEGG) pathway enrichment analyses were conducted utilizing the R package clusterProfiler [36,37]. Subsequently, for each identified cluster, intersection analyses of KEGG pathways and DEGs were carried out to determine key pathways or genes commonly shared among different clusters.
2.7. Cell Culture
HEK-293T (National Collection of Authenticated Cell Cultures, China) cells were cultured in Dulbecco’s modified Eagle’s medium (DMEM; C11995500BT, Gibco, USA), supplemented with 10% fetal bovine serum (A5256701, Gibco, USA) and 1% penicillin-streptomycin (SL6040, Coolaber, China). All cells were cultured at 37 °C in a humidified incubator with 5% CO2.
2.8. Plasmids and Transfection
All plasmids used in this study were commercially synthesized by Tsingke Biotechnology Co., Ltd. (Beijing, China), and verified by Sanger sequencing. For plasmid transfection, HEK-293T cells were seeded in 12-well plates (70% confluence) one day before transfection. On the day of transfection, cell culture medium was changed and cells were transfected with the indicated plasmids (1000 ng/well) using Lipofectamine LTX & PLUS Transfection Reagent (Invitrogen, USA) according to the manufacturer’s instructions.
2.9. Western Blotting
At 24 h post-transfection, cells were washed with PBS (phosphate-buffered saline) and lysed with RIPA buffer (Abiowell, # AWB0138a, China) supplemented with 1% protease inhibitor cocktail and phosphatase inhibitor cocktail (Thermo, # 78441, USA). The lysates were incubated on ice for 30 min and centrifuged at 12,000× g for 15 min at 4 °C. Supernatants were boiled with 6× loading buffer at 98 °C for 10 min. Proteins were resolved on SDS-PAGE gels and transferred to polyvinylidene difluoride (PVDF) membranes (Millipore, # IPVH00011, USA). The PVDF membranes were then blocked with 5% skim milk, sequentially incubated with primary and secondary antibodies. The membranes were then washed three times with 1X TBST (Servicebio, # G0004-1L, China), and proteins were visualized using an ECL substrate (APEBIO, # K1232, USA) and a chemiluminescence imaging system (Bio-OI, # OI 600MF, China).
3. Results
This section may be divided by subheadings. It should provide a concise and precise description of the experimental results, their interpretation, as well as the experimental conclusions that can be drawn.
3.1. Evolutionary Relationships and Clusters of EV-A 2A Proteases
Figure 1A presents the sequence conservation heatmap of 25 EV-A strains, which was generated using BioAider and visualized in R. CVA2, CVA3, CVA4, CVA5, CVA6, CVA7, CVA8, CVA10, CVA12, CVA14, CVA16, EV-A71, EV-A114, and EV-A120 exhibit high sequence identity (>96.23%) and form a distinct cluster. Other EV-A strains display weaker clustering, though EV-A76, EV-A91, and EV-A121 (90% identity), and EV-A92, EV-A122, and EV-A123 (87.56% identity) show closer relationships. EV-A124 and EV-A125 are more divergent, with EV-A125 exhibiting the lowest average sequence identity (64.57%).
Phylogenetic trees of EV-A 2A protease, constructed via NJ and ML (Figure 1B,C), display similar topologies, consistent with the sequence conservation heatmap. The CVA2~CVA16 and EV-A71~EV-A120 group forms a distinct clade, while most remaining EV-A strains lack clear clustering. Notable subclusters include EV-A76, EV-A91, and EV-A121; EV-A90 and EV-A119; and EV-A92, EV-A122, and EV-A123. EV-A89, EV-A124, and EV-A125 exhibit the greatest evolutionary divergence from other EV-A strains.
3.2. SAAPS
SAAPS is an analytical pipeline built with Python 3 and R, integrating multiple functional modules. The overall workflow is illustrated in Figure 2 and comprises the following key steps:
- Data Preprocessing: This initial step involves input validation, sequence type identification and conversion, and quality control. If preprocessed data or intermediate results are provided, this step can be skipped.
- Amino Acid Polymorphism Calculation: A site is defined as polymorphic if at least two amino acid variants are present. Parameters can be adjusted to generate polymorphism distribution plots.
- Information Content Computation: Based on Shannon entropy, the information content of each site is calculated, and a corresponding distribution plot is generated.
- Key Polymorphic Site Selection: The default threshold is determined by the minimum and maximum values computed from the input sequences, though users can customize this range. If no threshold is set, all sites are included.
- Feature Encoding: SAAPS supports one-hot encoding and AAindex transformation, converting amino acid residues into numerical representations for statistical analysis.
- Dimensionality Reduction and Clustering: Given the high-dimensional nature of polymorphic site encoding, dimensionality reduction is applied to simplify data complexity while preserving key features. Subsequently, clustering algorithms are used to classify the reduced dataset.
SAAPS is designed for multi-sequence analysis and is not limited to enteroviruses, making it applicable to a wide range of sequence data.
3.3. Identification and Selection of Polymorphic Sites in EV-A 2A Protease
Polymorphism analysis of the 2A protease in 25 EV-A strains was conducted using SAAPS, and the identified polymorphic sites are shown in Figure 3. A total of 88 sites exhibited polymorphism, accounting for 58.67% (n = 88/150) of all sites (Figure 4A), while non-polymorphic sites constituted 41.33% (n = 62/150). Among these, position 102 displayed the highest variability, with nine amino acid variants. The majority of polymorphic sites were relatively stable, with 47 sites containing only two amino acid variants.
A comparison with the secondary structure (Figure 4B) revealed that sites with higher amino acid variability (6–8 variants) were primarily located within α-helices, comprising 22.11% of all α-helical positions. In contrast, less variable sites (2–4 variants) were predominantly distributed in both α-helices (44.45%) and β-strands (58.11%).
Shannon entropy was used to calculate the Information Content (IC) for each site (Figure 4C). The IC values ranged from 1.677–4.322. To ensure comprehensive inclusion of polymorphic sites while excluding highly variable sites or non-polymorphic positions, a threshold range of 2.735–4.022 was established. In total, 56 polymorphic sites fell within this range and were classified as potential key SAP sites (kSAPs) (see Supplementary Table S4 for details). Among these 56 kSAPs (Figure 4D), 5.36% were located within α-helices, while 57.14% were found in β-strands, suggesting structural relevance in their functional variability.
3.4. Dimensionality Reduction and Clustering Analysis of kSAPs
PCA was applied to the selected polymorphic sites, revealing three major clusters (Figure 5). The leftmost cluster, containing CVA2, CVA3, CVA4, CVA5, CVA6, CVA7, CVA8, CVA10, CVA12, CVA14, CVA16, EVA71, EVA114, and EVA120, aligned with the phylogenetic tree. However, the upper-right cluster (EV-A90, EV-A92, EV-A119, EV-A122, EV-A123, EV-A124, EV-A125) and the lower-right cluster (EV-A76, EV-A91, EV-A121) showed discrepancies. Notably, within the lower-right cluster, EV-A76 was more distant from EV-A91 and EV-A121, indicating greater divergence.
OPTICS clustering (Figure 5, Supplementary Table S5) confirmed the PCA results, identifying EV-A89 as a noise point, consistent with its phylogenetic position. Unlike the phylogenetic tree, EV-A90, EV-A92, EV-A119, EV-A122, EV-A123, EV-A124, and EV-A125 formed a distinct group, suggesting shared characteristics.
3.5. Transcriptomic Phenotypic Analysis of EV-A 2A Protease
To assess whether 2A protease phenotypic characteristics align more closely with information entropy-based classification or phylogenetic clustering, we expressed 2A proteases from all EV-A serotypes in HEK293T cells and performed transcriptome sequencing analysis. Western blot confirmed successful expression of 2A proteins (Figure 6A).
Phylogenetic analysis (Figure 1C) showed that CVA3 and CVA10, as well as CVA14 and EV-A71, were respectively clustered into single clades, whereas our clustering analysis (Figure 6B) revealed closer topological relationships between CVA3 and CVA5, and between CVA14 and CVA4. Transcriptome data further supported this finding: the number of shared differentially expressed genes between CVA3 and CVA5, and between CVA14 and CVA4 (Supplementary Table S6), was significantly higher than that of their corresponding phylogenetic counterparts. Notably, the two methods remained highly consistent in the classification of most serotypes (the clustering of CVA2 and CVA12), indicating that information entropy-based clustering does not negate phylogenetic relationships but rather serves as a complementary approach capable of capturing functional associations unidentified by conventional evolutionary analysis, thereby providing cross-omics evidence for elucidating the phenotypic diversity of 2A protease. Furthermore, EV-A76’s divergence from EV-A91 and EV-A121 may be attributed to functional pathway differences. As illustrated in the Venn diagram (Figure 6C), EV-A121 shares KEGG pathways with EV-A91, whereas EV-A76 and EV-A121 have only one common pathway, supporting their greater evolutionary distance.
3.6. EV-A89 as an Outlier: Unique Self-Cleavage Activity of 2A Protease
Based on the previous PCA results, EV-A89 was identified as an outlier. To elucidate this observation, we investigated the uniqueness of its 2A protease. Initially, we believed that the 2A band of EV-A89 2A was simply weaker than the other EV-A 2A. However, during individual expression studies, we often failed to detect a band near 30 kDa. This led us to hypothesize that EV-A89 2A protease might undergo self-cleavage, resulting in removal of the N-terminal 6x-Myc tag and consequent loss of detection. Therefore, we repositioned the 6x-Myc tag from the N-terminus to C-terminus, which revealed a target band (25 kDa) smaller than expected (30 kDa), consistent with the self-cleavage hypothesis (Figure 7A).
We selected EV-A71 2A protease for partial fusion with EV-A89 2A protease to identify the segment responsible for the self-cleavage activity. Thus, two 2A fusion constructs were created: N-71-89-C (N-terminal domain of EV-A71 fused to C-terminal domain of EV-A89) and N-89-71-C (N-terminal domain of EV-A89 fused to C-terminal domain of EV-A71). WB result revealed that the primary self-cleavage activity of EV-A89 2A resides within its C-terminal segment (Figure 7B). When the C-terminus of EV-A71 2A was replaced with EV-A89 2A (N-71-89-C), the 2A band shifted from 30 kDa to 25 kDa, consistent with the EV-A89-2A-Myc control group. Interestingly, while the N-terminal segment of EV-A89 2A fused to the C-terminus of EV-A71 2A (N-89-71-C), the band exhibited an intermediate size-larger than 25 kDa and slightly smaller than 30 kDa, suggesting that additional self-cleavage sites may also exist in the N-terminal region of EV-A89 2A. Further investigation is required to fully elucidate the underlying mechanisms.
KEGG and GO pathway enrichment analyses revealed that EV-A89 uniquely possessed the KEGG pathway “Pathways in cancer” (hsa05200) and GO term “Ossification” (GO:0001503). Notably, PTGS2, an inflammation-related gene, was identified within this pathway, potentially explaining EV-A89’s classification as an outlier.
3.7. IC Threshold Selection and Clustering Performance in EV-A 2A Protease
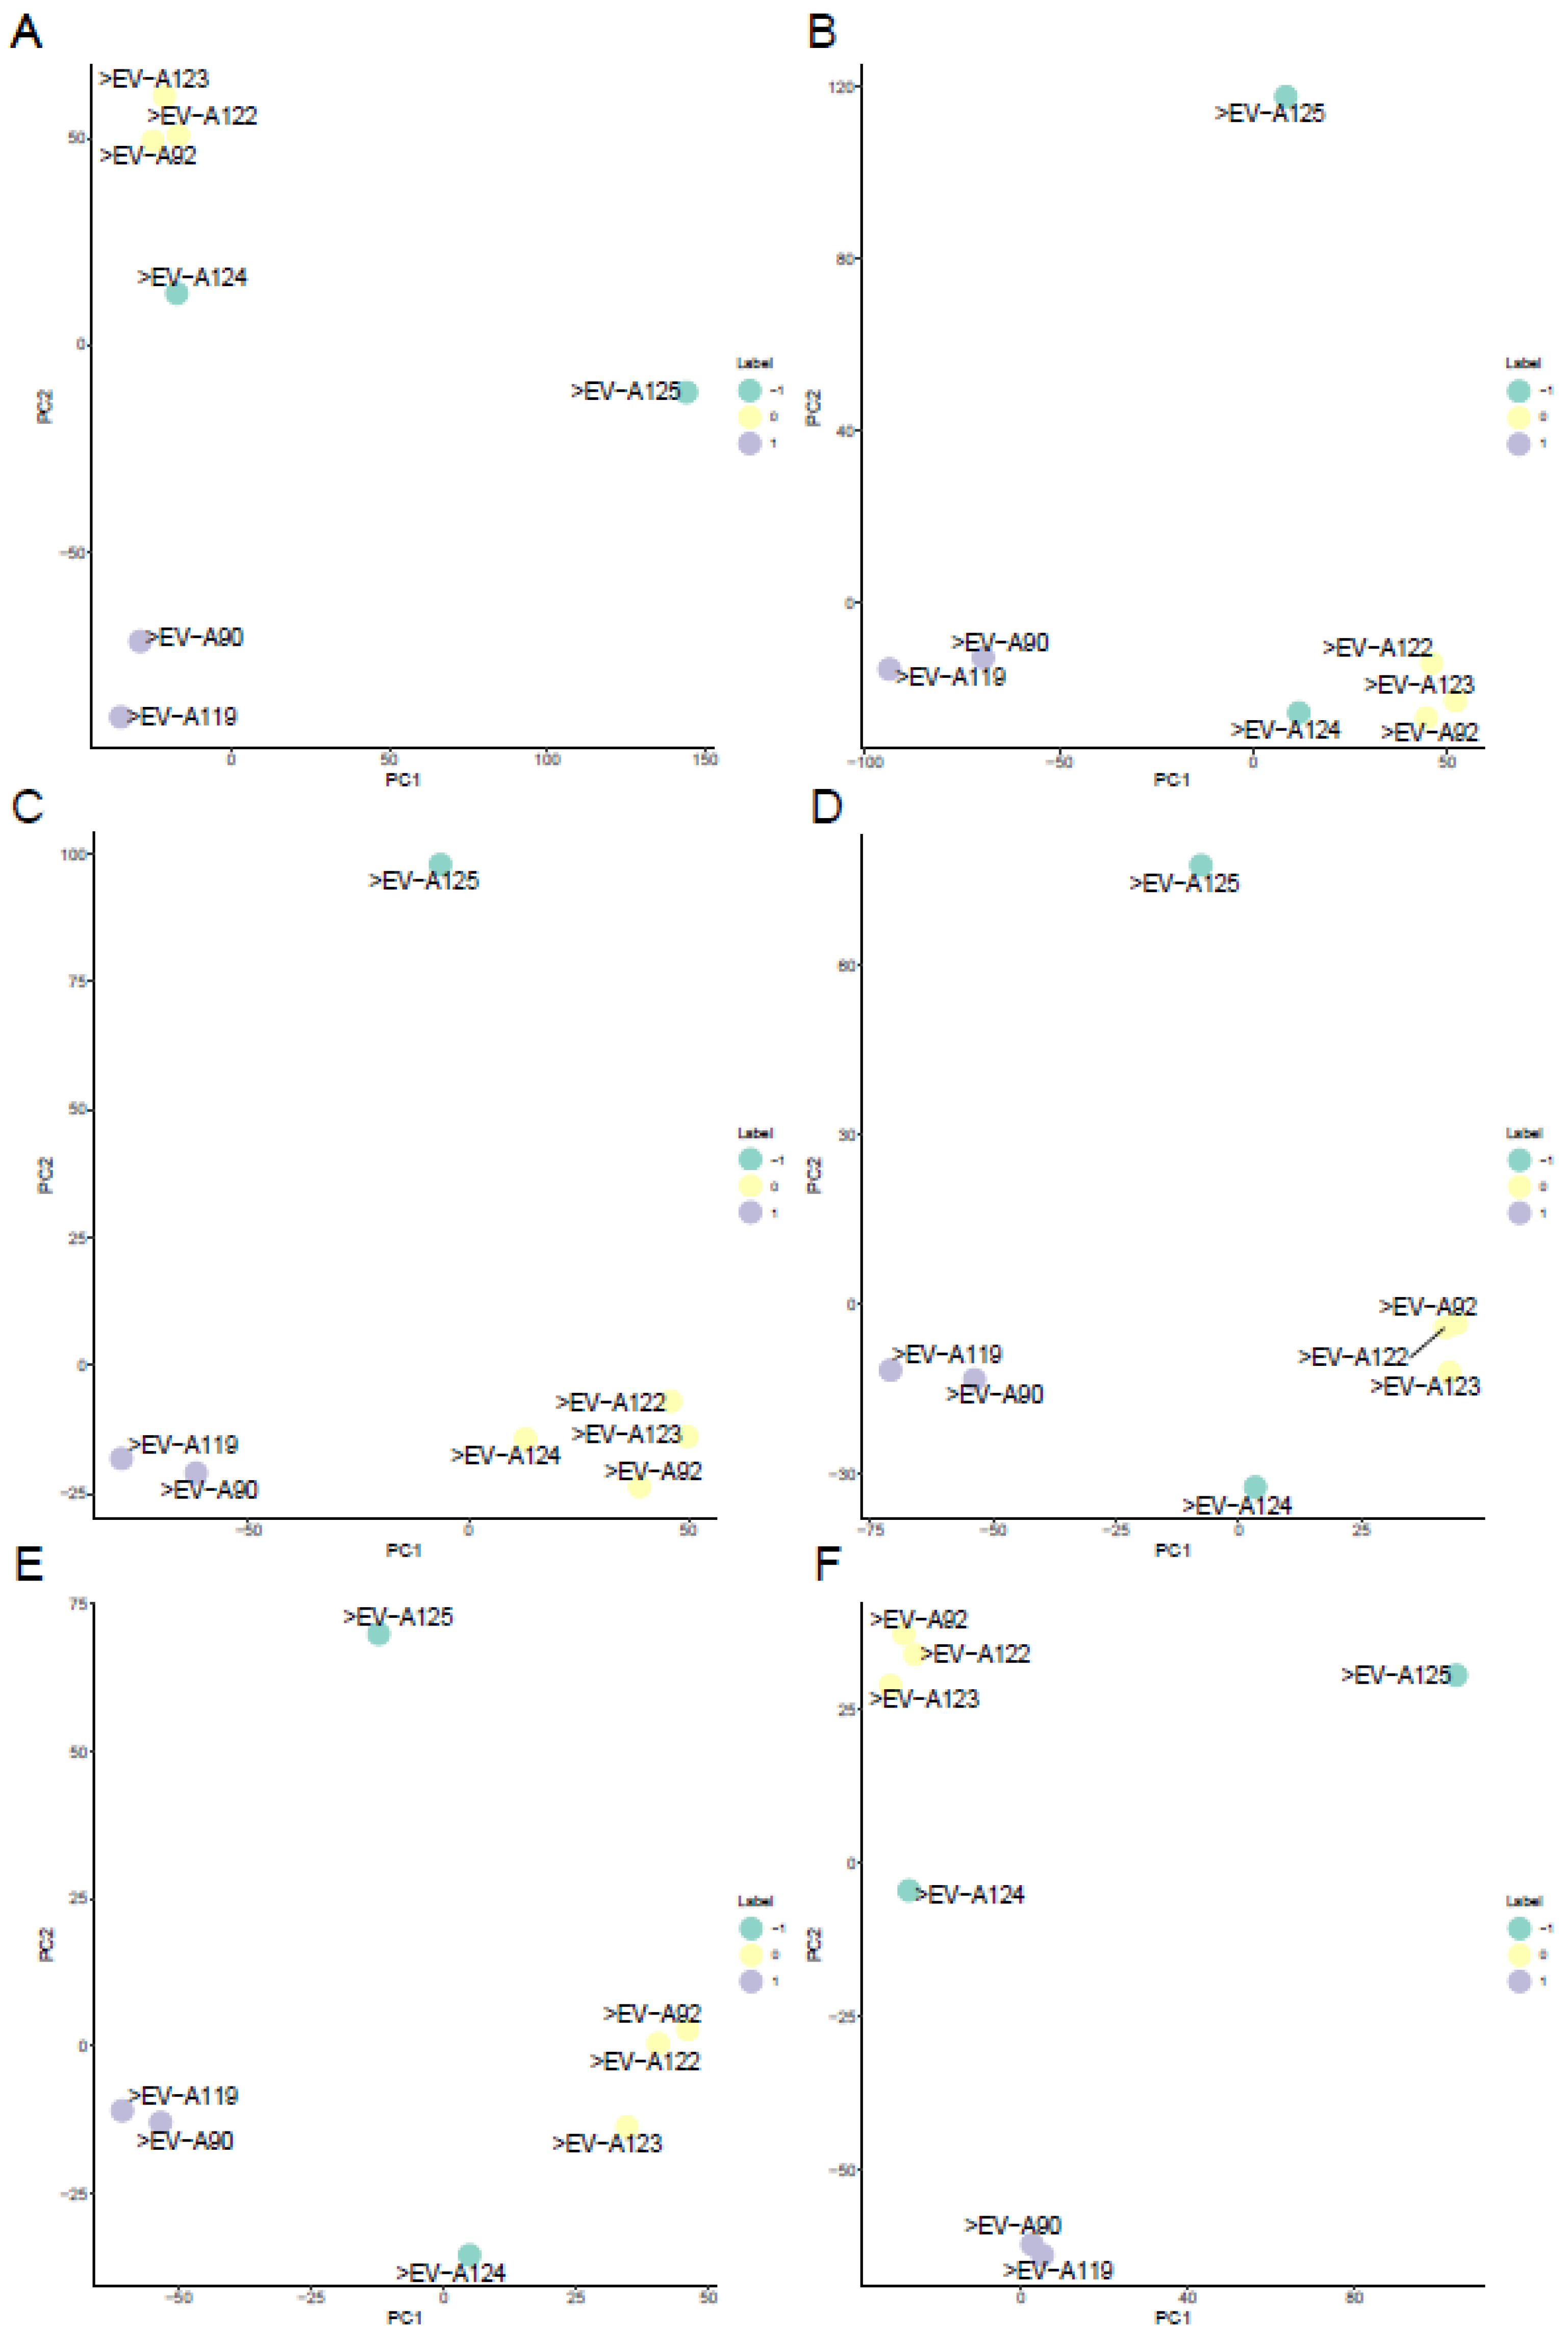
The impact of IC threshold selection on clustering topology was evaluated by applying multiple IC ranges, including 1.677~4.322, 1.761~4.022, 2.735~4.022, 3.022~4.022, 3.274~4.022, and 3.274~4.322 (Figure 8A–F, respectively). Clustering patterns varied across different thresholds. Specifically, only within the range of 2.735~4.022, EV-A124 consistently clustered with EV-A92, EV-A122, and EV-A123, while EV-A125 remained an outlier. In other tested ranges, both EV-A124 and EV-A125 appeared as outliers, indicating that IC threshold selection influences the classification of specific serotypes.
To further examine whether the observed shift in clustering under the 2.735~4.022 threshold reflected underlying biological similarity, common DEGs were analyzed for EV-A124 in comparison with EV-A92, EV-A122, and EV-A123 (Supplementary Table S7). When EV-A124 was classified as an outlier under broader IC ranges, a total of 30 DEGs were found to be shared among the four viruses. However, within the 2.735~4.022 threshold where EV-A124 clustered with Group 2 viruses, 28 common DEGs remained. The high degree of overlap suggests that EV-A124 exhibits transcriptomic characteristics similar to other Group 2 serotypes, supporting its inclusion within the cluster under this threshold.
4. Discussion
The pathogenic diversity observed among EV-A serotypes has long posed a classification challenge, particularly given the high sequence conservation shared across serotypes. Traditional phylogenetic analyses, typically based on whole-genome or conserved region similarity, have proven insufficient to explain the distinct clinical outcomes associated with different serotypes. This study demonstrates that information entropy-based filtering of protein polymorphisms—exemplified here through analysis of the 2A protease—enables a more biologically meaningful classification than conventional phylogenetic methods, offering refined insights into the molecular basis of serotype-specific pathogenicity.
Entropy-based filtering distinguishes functional polymorphisms from background noise. Of the 88 polymorphic sites identified in EV-A 2A protease, 56 (63.6%) met our IC threshold criteria (2.735–4.022). This filtering strategy is grounded in evolutionary theory: sites with IC < 2.735 (low entropy, near-complete conservation) likely represent structurally or catalytically essential residues where variation is strongly deleterious, consistent with the invariant catalytic triad (His-Asp-Cys) in picornaviral 2A proteases [38,39,40]. Conversely, sites with IC > 4.022 (high entropy, hypervariable) may reflect neutral drift or lineage-specific adaptations without functional consequences. The intermediate IC range thus captures sites under diversifying selection, precisely the variants most likely to contribute to phenotypic diversity. The threshold boundaries were empirically derived from the dataset distribution, balancing the risk of splitting biological groups against merging distinct lineages. The lower bound (IC = 2.735) corresponds to sites with exactly two amino acid variants at near-equal frequencies (p ≈ 0.5), representing the simplest case of functional polymorphism. The upper bound (IC = 4.022) approximates the entropy of four equally likely variants, beyond which additional diversity provides diminishing functional information. Notably, only the 2.735–4.022 range consistently classified EV-A124 with Group 2 viruses while maintaining EV-A125 as an outlier, thereby preserving congruence with both transcriptomic profiles and established evolutionary relationships.
Using SAAPS for systematic identification, 88 polymorphic sites were detected within the 2A protease, of which 56 were classified as key SAP sites (kSAPs) based on information entropy metrics. These critical polymorphic residues exhibited a non-random distribution. Among the 56 key sites, only 5.36% resided in α-helices, whereas 57.14% were located in β-strands. This pronounced bias suggests that β-sheet structures accommodate functional variation more readily than α-helices in the 2A protease, potentially reflecting the catalytic architecture where strand flexibility modulates substrate access without compromising core stability [41,42]. As the 2A protease is known to orchestrate viral polyprotein processing, suppress host translation, and modulate innate immunity, mutations at these positions are likely to influence viral replication efficiency, immune evasion, and overall virulence.
Classification of EV-A strains based on these filtered polymorphic sites revealed distinct groupings not captured by conventional phylogenetic trees. Strains such as EV-A90, EV-A92, EV-A119, and EV-A122 to EV-A125, which exhibited ambiguous relationships in genome-wide analyses, clustered coherently. Similarly, EV-A124 was reclassified into Group 2 (EV-A92, EV-A122, EV-A123), supported by 28 shared DEGs. Notably, CVA3 and CVA5 share 223 common DEGs—substantially higher than the 46 shared between phylogenetically closer CVA3/CVA10. Likewise, CVA14/CVA4 clustering is supported by 55 common DEGs, compared to only 21 between CVA14 and EV-A71 as predicted by traditional methods.
The outlier status of EV-A89 is particularly significant: although it belongs to the SCARB2-dependent receptor group containing neurovirulent EV-A71 and CVA7 [43,44], transcriptomic data indicate that it uniquely activates PTGS2-mediated inflammatory pathways, potentially explaining sporadic severe neurological manifestations associated with this serotype [45]. Furthermore, we found that EV-A89 2A undergoes self-cleavage primarily within its C-terminal segment, with a band size of 25 kDa compared to the expected 30 kDa observed for other EV-A 2As. Notably, the replacement of the C-terminal domain of EV-A71 2A with EV-A89 2A shifted the cleavage product to the 25 kDa form. While the exchange of N-terminal domain created an intermediate band size between 25 and 30 kDa. These results indicate that while the primary self-cleavage activity exists at C-terminus, auxiliary cleavage sites reside also exist in the N-terminal region. Interestingly, the prevalence of β-strands in the C-terminus of EV-A89 2A aligns with the SAAPS analysis results.
These findings underscore the distinctive capability of SAAPS in resolving functional relevance: by selectively analyzing information entropy-filtered polymorphisms, SAAPS captures phenotypic associations undetectable by whole-genome phylogenetics. Hence, SAAPS provides a refined analytical framework for molecular epidemiology and outbreak risk assessment. These observations challenge the reliance on genome-wide sequence similarity alone for viral classification, highlighting the necessity of integrating evolutionary selection signals and protein functional domain information into taxonomic frameworks. The clustering results demonstrate that subtle, functionally relevant polymorphisms—rather than overall genetic identity—better reflect viral phenotypes, including tissue tropism, immune modulation, and pathogenic potential.
Moreover, while structural proteins have historically dominated enterovirus phylogenetic and antigenic studies [42,46,47], the centrality of non-structural proteins, particularly proteases like 2A, is increasingly apparent. The functional impact of polymorphisms within non-structural regions, especially those involved in host interaction and immune suppression, warrants closer attention in understanding viral adaptability and virulence. Importantly, the entropy-based selection of polymorphic sites demonstrated here refines clustering stability and biological relevance, correcting misclassifications introduced by indiscriminately incorporating all sequence variations. This approach not only enhances viral classification accuracy but also offers practical avenues for further research. Identifying serotype-specific or group-specific polymorphisms within functionally critical regions such as 2A may inform the design of broad-spectrum antiviral agents targeting conserved functional sites. Additionally, integrating polymorphism-based clustering with transcriptomic profiling provides a basis for phenotype-driven viral surveillance, offering the potential to predict outbreak severity or emergent virulence traits more precisely.
Taken together, these findings provide new insights into the molecular determinants of EV-A pathogenic diversity. By selectively analyzing evolutionary-relevant polymorphisms in the 2A protease, this study establishes a more biologically coherent classification framework and highlights the need to reassess traditional sequence-based methods when addressing functional and clinical diversity within closely related viral species.
5. Conclusions
This study reveals that EV-A serotype pathogenicity cannot be adequately explained by conventional sequence-based methods. By selectively analyzing key polymorphisms in the 2A protease, a clearer classification aligned with phenotypic differences was achieved. These findings underscore the importance of functionally relevant mutations in understanding viral diversity and pathogenicity.
Supplementary Materials
The following supporting information can be downloaded at the website of this paper posted on Preprints.org, Table S1: All Virus Sequences Used in the Study; Table S2: Results of EV-A 2A Protease Protest Detection; Table S3: Results of EV-A 2A Protease MEGA Detection; Table S4: Results of IC values for all sites of 2A protease; Table S5: Results of OPTICS Clustering; Table S6: The Number of Common DEGs in Each Group; Table S7: Changes in common DEGs among EV-A124, EV-A122, EV-A123 and EV-A124.
Author Contributions
Conceptualization, Y.Q. and Y.X.; methodology, X.Z., Z.G., Y.Q. and Y.X.; software, Y.X.; validation, X.Z., G.Z and Y.X.; formal analysis, X.Z., Z.G., Y.Q. and Y.X.; investigation, X.Z., Z.G., Y.Q. and Y.X.; resources, X.-Y.G. and Y.Q.; data curation, X.Z., Z.G., Y.Q. and Y.X.; writing—original draft preparation, Y.X., X.Z. and Z.G.; writing—review and editing, X.Z., Z.G., Y.Q. and Y.X.; supervision, X.-Y.G. and Y.Q.; project administration, Y.Q.; funding acquisition, X.-Y.G. and Y.Q. All authors have read and agreed to the published version of the manuscript.
Funding
This research was funded by National Natural Science Foundation of China (grant number 32270170 and 81902070), Provincial Natural Science Foundation of Hunan Province (grant number 2024JJ5071), and Science and Technology Innovation Program of Hunan Province (grant number 2024RC1028).
Conflicts of Interest
The authors declare no conflicts of interest.
Abbreviations
The following abbreviations are used in this manuscript:
| EV-A | Enterovirus alphacoxsackie |
| CVA | Coxsackievirus A |
| SAPs | single amino acid polymorphisms |
| SAAPS | Single Amino Acid Polymorphism Statistics |
| kSAPs | key SAP sites |
| HFMD | hand, foot, and mouth disease |
| ORF | open reading frame |
| ML | Maximum Likelihood |
| NJ | Neighbor-Joining |
| PCA | Principal Component Analysis |
| IC | Information Content |
| OPTICS | Ordering Points to Identify the Clustering Structure |
| DEGs | differentially expressed genes |
| KEGG | Kyoto Encyclopedia of Genes and Genomes |
| GO | Gene Ontology |
| ICTV | the International Committee on Taxonomy of Viruses |
| NCBI | the National Center for Biotechnology Information |
References
- Wei, Y.; Liu, H.; Hu, D.; He, Q.; Yao, C.; Li, H.; Hu, K.; Wang, J. Recent Advances in Enterovirus A71 Infection and Antiviral Agents. Lab. Investig. 2024, 104, 100298. [Google Scholar] [CrossRef] [PubMed]
- Cox, J.A.; Hiscox, J.A.; Solomon, T.; Ooi, M.H.; Ng, L.F.P. Immunopathogenesis and Virus-Host Interactions of Enterovirus 71 in Patients with Hand, Foot and Mouth Disease. Front. Microbiol. 2017, 8, 2249. [Google Scholar] [CrossRef]
- Singh, S.; Poh, C.L.; Chow, V.T. Complete sequence analyses of enterovirus 71 strains from fatal and non-fatal cases of the hand, foot and mouth disease outbreak in Singapore (2000). Microbiol. Immunol. 2002, 46, 801–808. [Google Scholar] [CrossRef]
- Lu, Q.B.; Zhang, X.A.; Wo, Y.; Xu, H.M.; Li, X.J.; Wang, X.J.; Ding, S.J.; Chen, X.D.; He, C.; Liu, L.J.; et al. Circulation of Coxsackievirus A10 and A6 in hand-foot-mouth disease in China, 2009-2011. PLoS ONE 2012, 7, e52073. [Google Scholar] [CrossRef]
- Solomon, T.; Lewthwaite, P.; Perera, D.; Cardosa, M.J.; McMinn, P.; Ooi, M.H. Virology, epidemiology, pathogenesis, and control of enterovirus 71. Lancet Infect Dis. 2010, 10, 778–790. [Google Scholar] [CrossRef]
- Chen, S.P.; Huang, Y.C.; Li, W.C.; Chiu, C.H.; Huang, C.G.; Tsao, K.C.; Lin, T.Y. Comparison of clinical features between coxsackievirus A2 and enterovirus 71 during the enterovirus outbreak in Taiwan, 2008: A children’s hospital experience. J. Microbiol. Immunol. Infect 2010, 43, 99–104. [Google Scholar] [CrossRef]
- Ma, E.; Lam, T.; Chan, K.C.; Wong, C.; Chuang, S.K. Changing epidemiology of hand, foot, and mouth disease in Hong Kong, 2001-2009. Jpn. J. Infect Dis. 2010, 63, 422–426. [Google Scholar] [CrossRef]
- Lee, T.C.; Guo, H.R.; Su, H.J.; Yang, Y.C.; Chang, H.L.; Chen, K.T. Diseases caused by enterovirus 71 infection. Pediatr. Infect Dis. J. 2009, 28, 904–910. [Google Scholar] [CrossRef]
- Samphutthanon, R.; Tripathi, N.K.; Ninsawat, S.; Duboz, R. Spatio-temporal distribution and hotspots of Hand, Foot and Mouth Disease (HFMD) in northern Thailand. Int. J. Environ. Res. Public Health 2013, 11, 312–336. [Google Scholar] [CrossRef] [PubMed]
- Tapparel, C.; Siegrist, F.; Petty, T.J.; Kaiser, L. Picornavirus and enterovirus diversity with associated human diseases. Infect Genet Evol. 2013, 14, 282–293. [Google Scholar] [CrossRef] [PubMed]
- Ding, N.Z.; Wang, X.M.; Sun, S.W.; Song, Q.; Li, S.N.; He, C.Q. Appearance of mosaic enterovirus 71 in the 2008 outbreak of China. Virus Res. 2009, 145, 157–161. [Google Scholar] [CrossRef] [PubMed]
- Baboonian, C.; Treasure, T. Meta-analysis of the association of enteroviruses with human heart disease. Heart 1997, 78, 539–543. [Google Scholar] [CrossRef]
- Zell, R.; Delwart, E.; Gorbalenya, A.E.; Hovi, T.; King, A.M.Q.; Knowles, N.J.; Lindberg, A.M.; Pallansch, M.A.; Palmenberg, A.C.; Reuter, G.; et al. ICTV Virus Taxonomy Profile: Picornaviridae. J. Gen. Virol. 2017, 98, 2421–2422. [Google Scholar] [CrossRef] [PubMed]
- Chang, L.Y.; Lin, H.Y.; Gau, S.S.; Lu, C.Y.; Hsia, S.H.; Huang, Y.C.; Huang, L.M.; Lin, T.Y. Enterovirus A71 neurologic complications and long-term sequelae. J. Biomed. Sci. 2019, 26, 57. [Google Scholar] [CrossRef]
- Lott, J.P.; Liu, K.; Landry, M.L.; Nix, W.A.; Oberste, M.S.; Bolognia, J.; King, B. Atypical hand-foot-and-mouth disease associated with coxsackievirus A6 infection. J. Am. Acad. Dermatol. 2013, 69, 736–741. [Google Scholar] [CrossRef]
- Lamphear, B.J.; Yan, R.; Yang, F.; Waters, D.; Liebig, H.D.; Klump, H.; Kuechler, E.; Skern, T.; Rhoads, R.E. Mapping the cleavage site in protein synthesis initiation factor eIF-4 gamma of the 2A proteases from human Coxsackievirus and rhinovirus. J. Biol. Chem. 1993, 268, 19200–19203. [Google Scholar] [CrossRef]
- Wang, B.; Xi, X.; Lei, X.; Zhang, X.; Cui, S.; Wang, J.; Jin, Q.; Zhao, Z. Enterovirus 71 protease 2Apro targets MAVS to inhibit anti-viral type I interferon responses. PLoS Pathog. 2013, 9, e1003231. [Google Scholar] [CrossRef]
- Badorff, C.; Lee, G.H.; Lamphear, B.J.; Martone, M.E.; Campbell, K.P.; Rhoads, R.E.; Knowlton, K.U. Enteroviral protease 2A cleaves dystrophin: Evidence of cytoskeletal disruption in an acquired cardiomyopathy. Nat. Med. 1999, 5, 320–326. [Google Scholar] [CrossRef]
- Stewart, C.L.; Chu, E.Y.; Introcaso, C.E.; Schaffer, A.; James, W.D. Coxsackievirus A6-induced hand-foot-mouth disease. JAMA Dermatol. 2013, 149, 1419–1421. [Google Scholar] [CrossRef]
- Mirand, A.; Henquell, C.; Archimbaud, C.; Ughetto, S.; Antona, D.; Bailly, J.L.; Peigue-Lafeuille, H. Outbreak of hand, foot and mouth disease/herpangina associated with coxsackievirus A6 and A10 infections in 2010, France: A large citywide, prospective observational study. Clin. Microbiol. Infect 2012, 18, E110–E118. [Google Scholar] [CrossRef] [PubMed]
- Challberg, M.D.; Kelly, T.J. Animal virus DNA replication. Annu. Rev. Biochem. 1989, 58, 671–717. [Google Scholar] [CrossRef] [PubMed]
- Peersen, O.B. Picornaviral polymerase structure, function, and fidelity modulation. Virus Res. 2017, 234, 4–20. [Google Scholar] [CrossRef]
- Huang, Y.P.; Lin, T.L.; Lin, T.H.; Wu, H.S. Antigenic and genetic diversity of human enterovirus 71 from 2009 to 2012, Taiwan. PLoS ONE 2013, 8, e80942. [Google Scholar] [CrossRef]
- Mandary, M.B.; Poh, C.L. Changes in the EV-A71 Genome through Recombination and Spontaneous Mutations: Impact on Virulence. Viruses 2018, 10, 320. [Google Scholar] [CrossRef]
- Lukashev, A.N. Role of recombination in evolution of enteroviruses. Rev. Med. Virol. 2005, 15, 157–167. [Google Scholar] [CrossRef] [PubMed]
- Bahn, J.H.; Lee, J.H.; Li, G.; Greer, C.; Peng, G.; Xiao, X. Accurate identification of A-to-I RNA editing in human by transcriptome sequencing. Genome Res. 2012, 22, 142–150. [Google Scholar] [CrossRef]
- Wu, J.R.; Zeng, R. Molecular basis for population variation: From SNPs to SAPs. FEBS Lett. 2012, 586, 2841–2845. [Google Scholar] [CrossRef]
- Bentham, A.R.; Petit-Houdenot, Y.; Win, J.; Chuma, I.; Terauchi, R.; Banfield, M.J.; Kamoun, S.; Langner, T. A single amino acid polymorphism in a conserved effector of the multihost blast fungus pathogen expands host-target binding spectrum. PLoS Pathog. 2021, 17, e1009957. [Google Scholar] [CrossRef] [PubMed]
- Bunn, H.F. Pathogenesis and treatment of sickle cell disease. N. Engl. J. Med. 1997, 337, 762–769. [Google Scholar] [CrossRef]
- Hiratsuka, M. Genetic Polymorphisms and in Vitro Functional Characterization of CYP2C8, CYP2C9, and CYP2C19 Allelic Variants. Biol. Pharm. Bull. 2016, 39, 1748–1759. [Google Scholar] [CrossRef]
- Katoh, K.; Standley, D.M. MAFFT multiple sequence alignment software version 7: Improvements in performance and usability. Mol. Biol. Evol. 2013, 30, 772–780. [Google Scholar] [CrossRef]
- Zhou, Z.J.; Qiu, Y.; Pu, Y.; Huang, X.; Ge, X.Y. BioAider: An efficient tool for viral genome analysis and its application in tracing SARS-CoV-2 transmission. Sustain. Cities Soc. 2020, 63, 102466. [Google Scholar] [CrossRef]
- Darriba, D.; Taboada, G.L.; Doallo, R.; Posada, D. ProtTest 3: Fast selection of best-fit models of protein evolution. Bioinformatics 2011, 27, 1164–1165. [Google Scholar] [CrossRef]
- Kumar, S.; Stecher, G.; Tamura, K. MEGA7: Molecular Evolutionary Genetics Analysis Version 7.0 for Bigger Datasets. Mol. Biol. Evol. 2016, 33, 1870–1874. [Google Scholar] [CrossRef]
- Kawashima, S.; Kanehisa, M. AAindex: Amino acid index database. Nucleic Acids Res. 2000, 28, 374. [Google Scholar] [CrossRef]
- Xu, S.; Hu, E.; Cai, Y.; Xie, Z.; Luo, X.; Zhan, L.; Tang, W.; Wang, Q.; Liu, B.; Wang, R.; et al. Using clusterProfiler to characterize multiomics data. Nat. Protoc. 2024, 19, 3292–3320. [Google Scholar] [CrossRef]
- Wu, T.; Hu, E.; Xu, S.; Chen, M.; Guo, P.; Dai, Z.; Feng, T.; Zhou, L.; Tang, W.; Zhan, L.; et al. clusterProfiler 4.0: A universal enrichment tool for interpreting omics data. Innovation 2021, 2, 100141. [Google Scholar] [CrossRef] [PubMed]
- Wang, Y.; Zou, W.; Niu, Y.; Wang, S.; Chen, B.; Xiong, R.; Zhang, P.; Luo, Z.; Wu, Y.; Fan, C.; et al. Phosphorylation of enteroviral 2A(pro) at Ser/Thr125 benefits its proteolytic activity and viral pathogenesis. J. Med. Virol. 2023, 95, e28400. [Google Scholar] [CrossRef]
- Yu, S.F.; Lloyd, R.E. Identification of essential amino acid residues in the functional activity of poliovirus 2A protease. Virology 1991, 182, 615–625. [Google Scholar] [CrossRef] [PubMed]
- Yang, X.; Cheng, A.; Wang, M.; Jia, R.; Sun, K.; Pan, K.; Yang, Q.; Wu, Y.; Zhu, D.; Chen, S.; et al. Structures and Corresponding Functions of Five Types of Picornaviral 2A Proteins. Front. Microbiol. 2017, 8, 1373. [Google Scholar] [CrossRef] [PubMed]
- Petersen, J.F.; Cherney, M.M.; Liebig, H.D.; Skern, T.; Kuechler, E.; James, M.N. The structure of the 2A proteinase from a common cold virus: A proteinase responsible for the shut-off of host-cell protein synthesis. Embo J. 1999, 18, 5463–5475. [Google Scholar] [CrossRef]
- Liu, Y.; Li, J.; Zhang, Y. Update on enteroviral protease 2A: Structure, function, and host factor interaction. Biosaf. Health 2023, 5, 331–338. [Google Scholar] [CrossRef]
- Yamayoshi, S.; Fujii, K.; Koike, S. Receptors for enterovirus 71. Emerg. Microbes Infect 2014, 3, e53. [Google Scholar] [CrossRef]
- Yamayoshi, S.; Iizuka, S.; Yamashita, T.; Minagawa, H.; Mizuta, K.; Okamoto, M.; Nishimura, H.; Sanjoh, K.; Katsushima, N.; Itagaki, T.; et al. Human SCARB2-dependent infection by coxsackievirus A7, A14, and A16 and enterovirus 71. J. Virol. 2012, 86, 5686–5696. [Google Scholar] [CrossRef] [PubMed]
- Fan, Q.; Zhang, Y.; Hu, L.; Sun, Q.; Cui, H.; Yan, D.; Sikandaner, H.; Tang, H.; Wang, D.; Zhu, Z.; et al. A Novel Recombinant Enterovirus Type EV-A89 with Low Epidemic Strength in Xinjiang, China. Sci. Rep. 2015, 5, 18558. [Google Scholar] [CrossRef]
- Zhang, D.; Lu, J.; Lu, J. Enterovirus 71 vaccine: Close but still far. Int. J. Infect Dis. 2010, 14, e739–e743. [Google Scholar] [CrossRef] [PubMed]
- Li, M.L.; Shih, S.R.; Tolbert, B.S.; Brewer, G. Enterovirus A71 Vaccines. Vaccines 2021, 9, 199. [Google Scholar] [CrossRef] [PubMed]
Figure 1.
Evolutionary relationships and clusters of EV-A 2A proteases. (A) Sequence identity heatmap of the 2A protease among 25 EV-A serotypes. Pairwise sequence identities were calculated using BioAider and visualized using the R package ggplot2. The color gradient ranges from blue (low similarity) to red (high similarity). Hierarchical clustering dendrograms are displayed above and to the left of the matrix. (B) Neighbor-Joining (NJ) phylogenetic tree of the 25 EV-A serotypes based on 2A protease amino acid sequences. The tree was constructed using the Poisson model with bootstrap values (500 replicates) shown at the nodes. The scale bar represents 0.10 substitutions per site. (C) Maximum Likelihood (ML) phylogenetic tree of the 25 EV-A serotypes based on 2A protease amino acid sequences. The tree was constructed using the LG+G substitution model (selected by ProtTest and MEGA) with bootstrap values shown at the nodes. The scale bar represents the number of substitutions per site.
Figure 1.
Evolutionary relationships and clusters of EV-A 2A proteases. (A) Sequence identity heatmap of the 2A protease among 25 EV-A serotypes. Pairwise sequence identities were calculated using BioAider and visualized using the R package ggplot2. The color gradient ranges from blue (low similarity) to red (high similarity). Hierarchical clustering dendrograms are displayed above and to the left of the matrix. (B) Neighbor-Joining (NJ) phylogenetic tree of the 25 EV-A serotypes based on 2A protease amino acid sequences. The tree was constructed using the Poisson model with bootstrap values (500 replicates) shown at the nodes. The scale bar represents 0.10 substitutions per site. (C) Maximum Likelihood (ML) phylogenetic tree of the 25 EV-A serotypes based on 2A protease amino acid sequences. The tree was constructed using the LG+G substitution model (selected by ProtTest and MEGA) with bootstrap values shown at the nodes. The scale bar represents the number of substitutions per site.
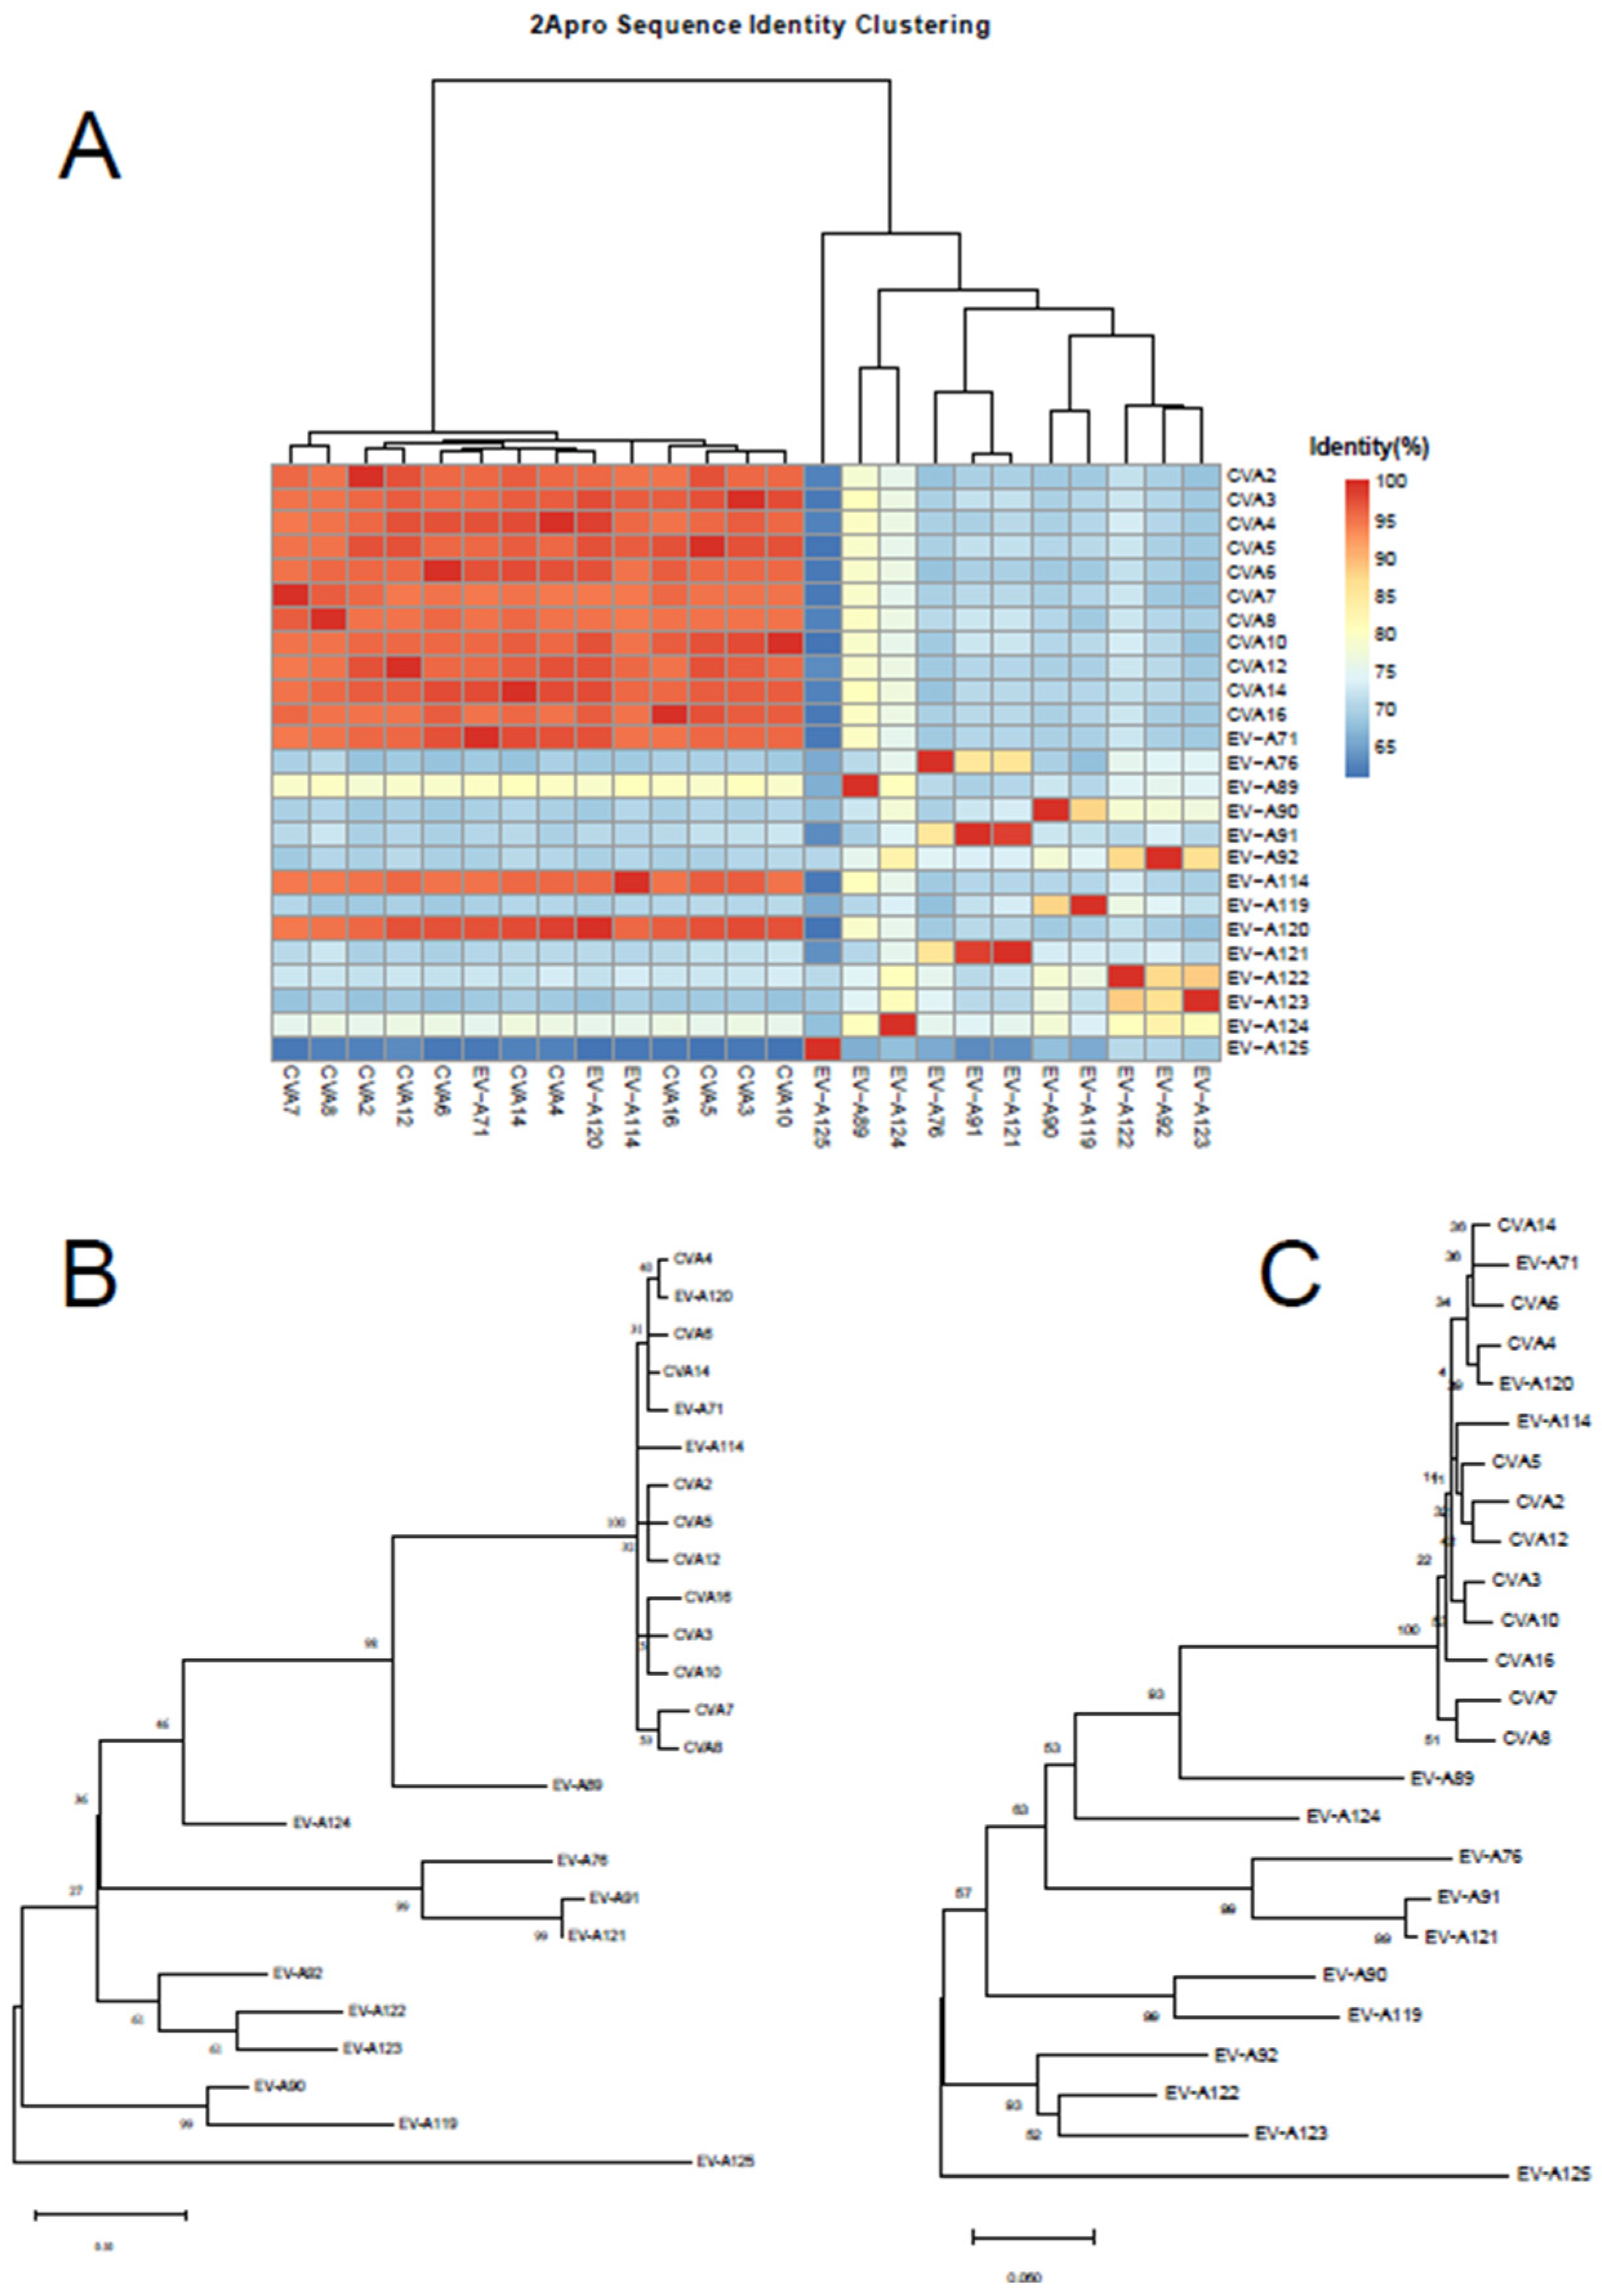
Figure 2.
Overview of the SAAPS analysis pipeline. The SAAPS (Single Amino Acid Polymorphism Statistics) pipeline is built with Python 3 and R, integrating multiple functional modules for the analysis of amino acid sequences. The workflow consists of six main modules: (1) Data Preprocessing; (2) Amino Acid Polymorphism Calculation; (3) Information Content Computation; (4) Key Polymorphic Site Selection; (5) Feature Encoding; (6) Dimensionality Reduction and Clustering.
Figure 2.
Overview of the SAAPS analysis pipeline. The SAAPS (Single Amino Acid Polymorphism Statistics) pipeline is built with Python 3 and R, integrating multiple functional modules for the analysis of amino acid sequences. The workflow consists of six main modules: (1) Data Preprocessing; (2) Amino Acid Polymorphism Calculation; (3) Information Content Computation; (4) Key Polymorphic Site Selection; (5) Feature Encoding; (6) Dimensionality Reduction and Clustering.
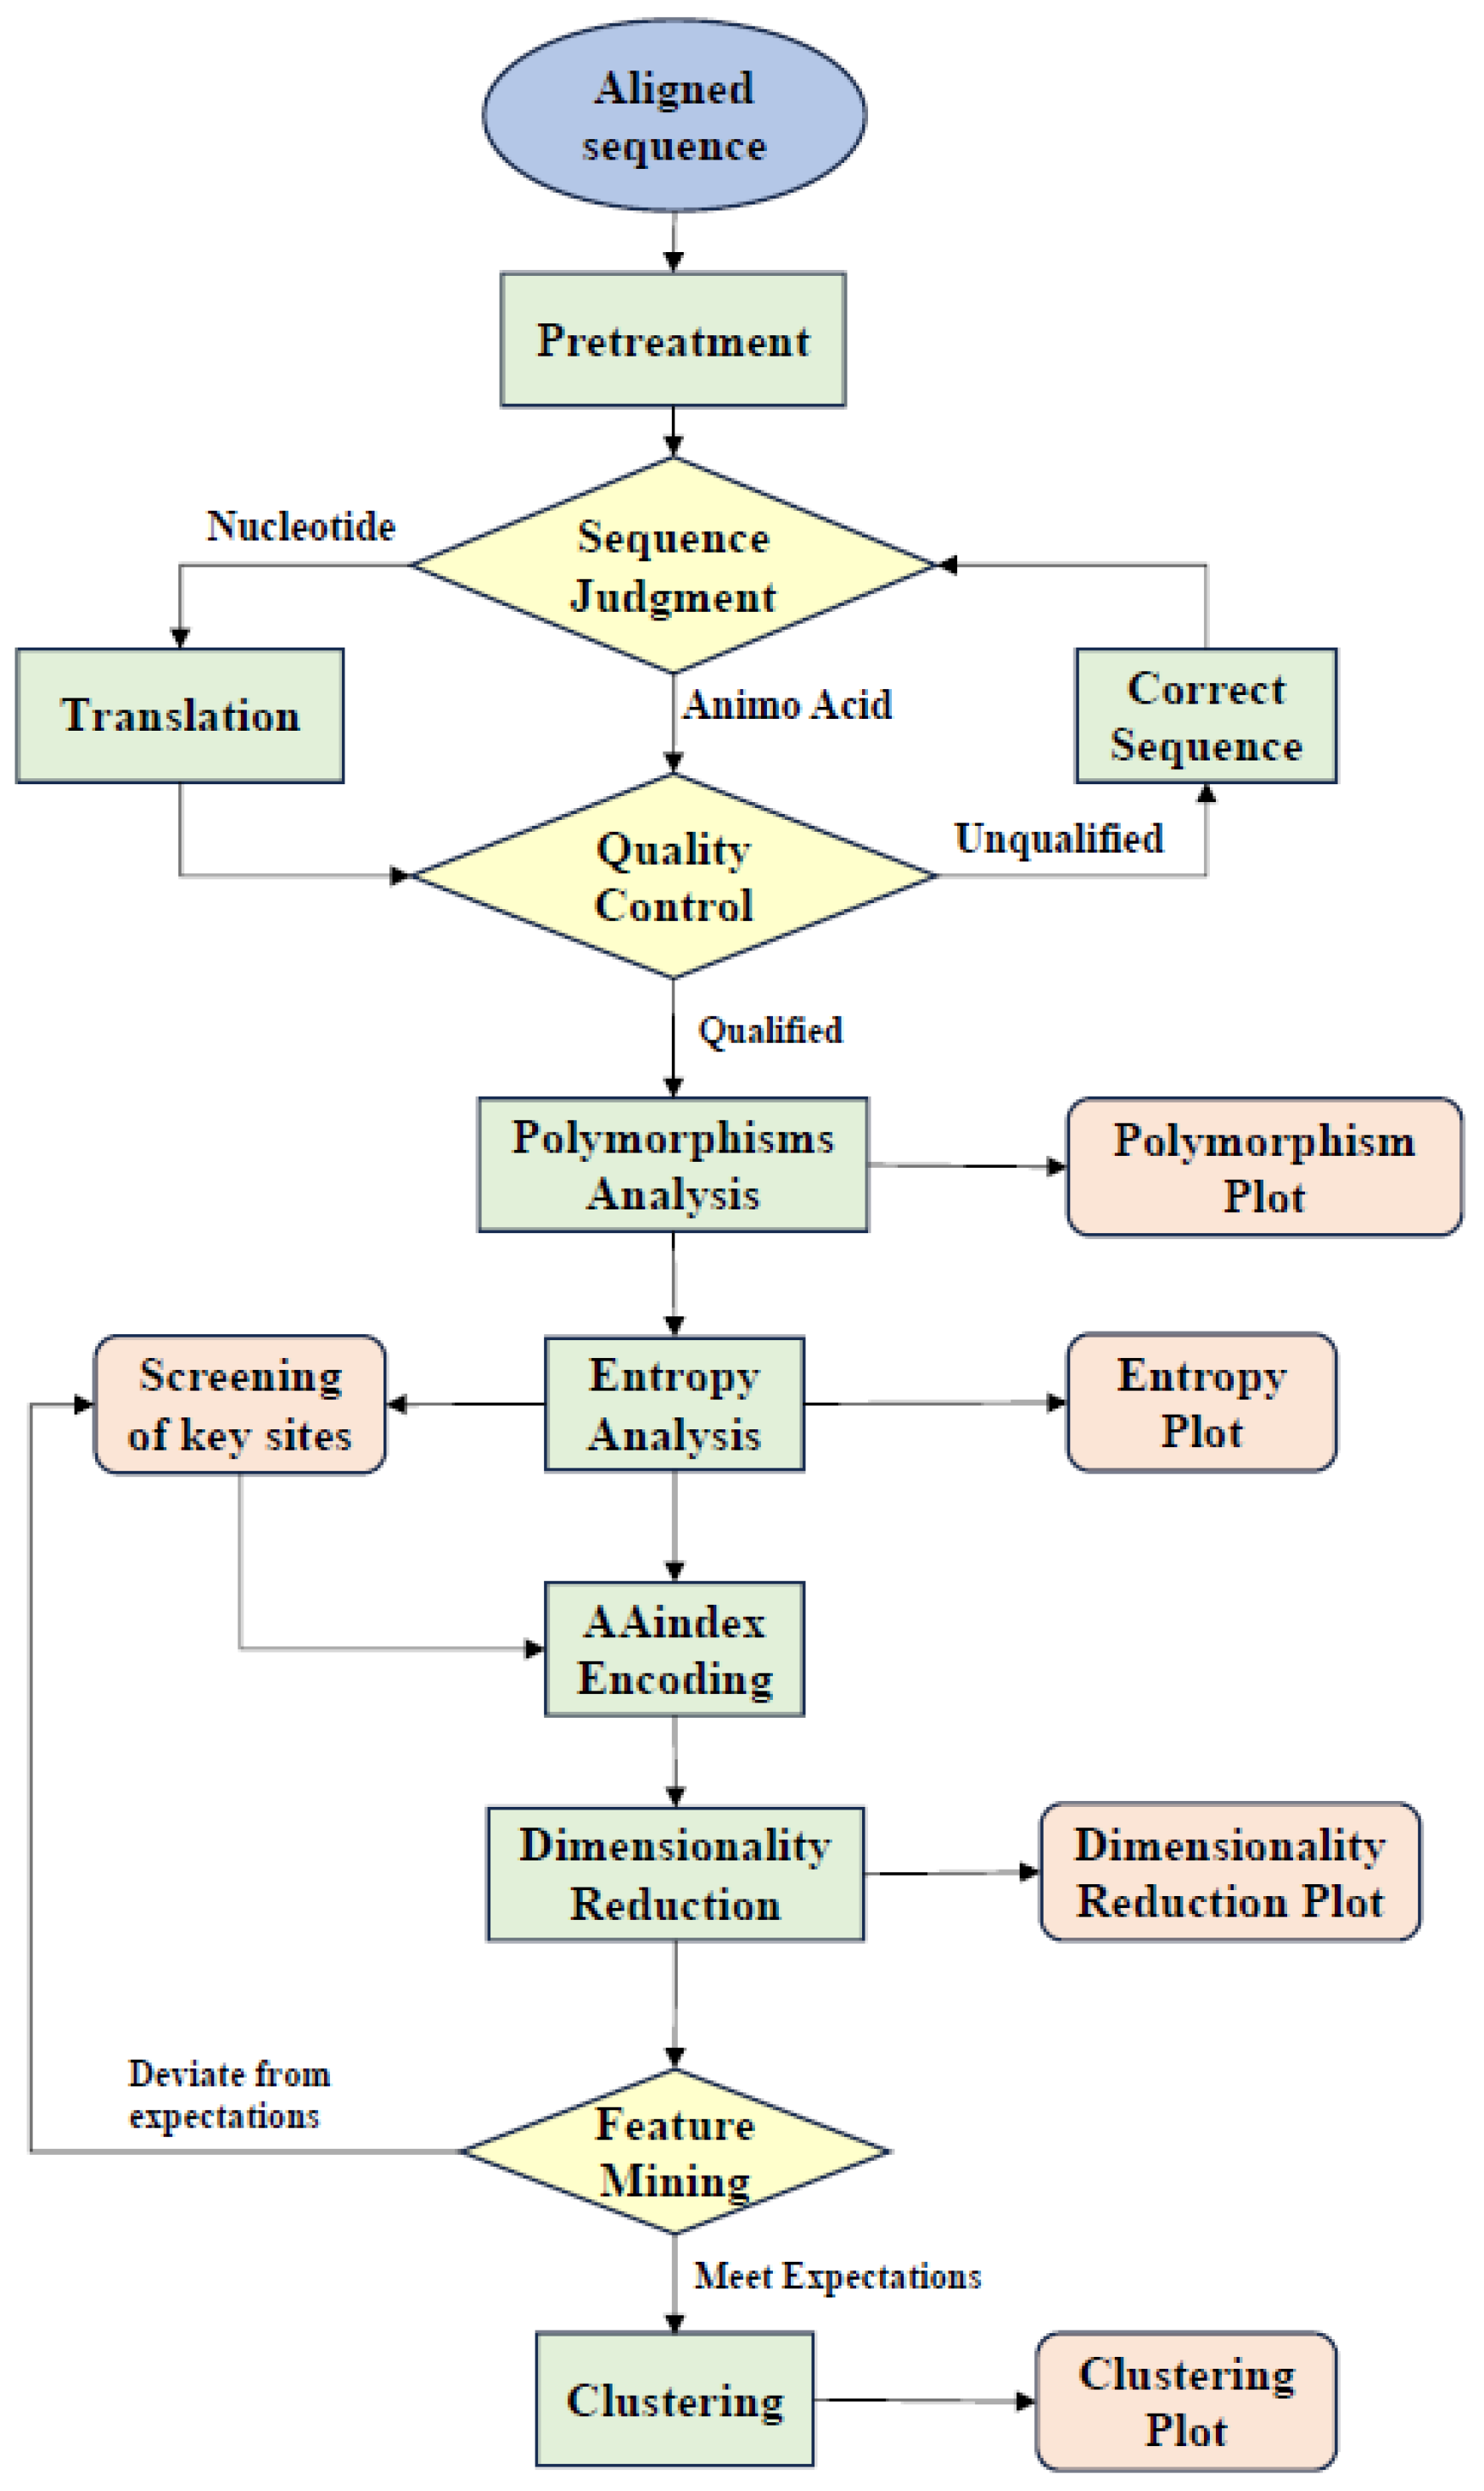
Figure 3.
Distribution of polymorphic sites in the 2A protease. Distribution of polymorphic sites across the 2A protease sequence. A total of 88 polymorphic sites were identified; amino acid types are distinguished by unique colors. Secondary structure elements are annotated above the sequence, with α-helices highlighted in red and β-strands highlighted in yellow.
Figure 3.
Distribution of polymorphic sites in the 2A protease. Distribution of polymorphic sites across the 2A protease sequence. A total of 88 polymorphic sites were identified; amino acid types are distinguished by unique colors. Secondary structure elements are annotated above the sequence, with α-helices highlighted in red and β-strands highlighted in yellow.
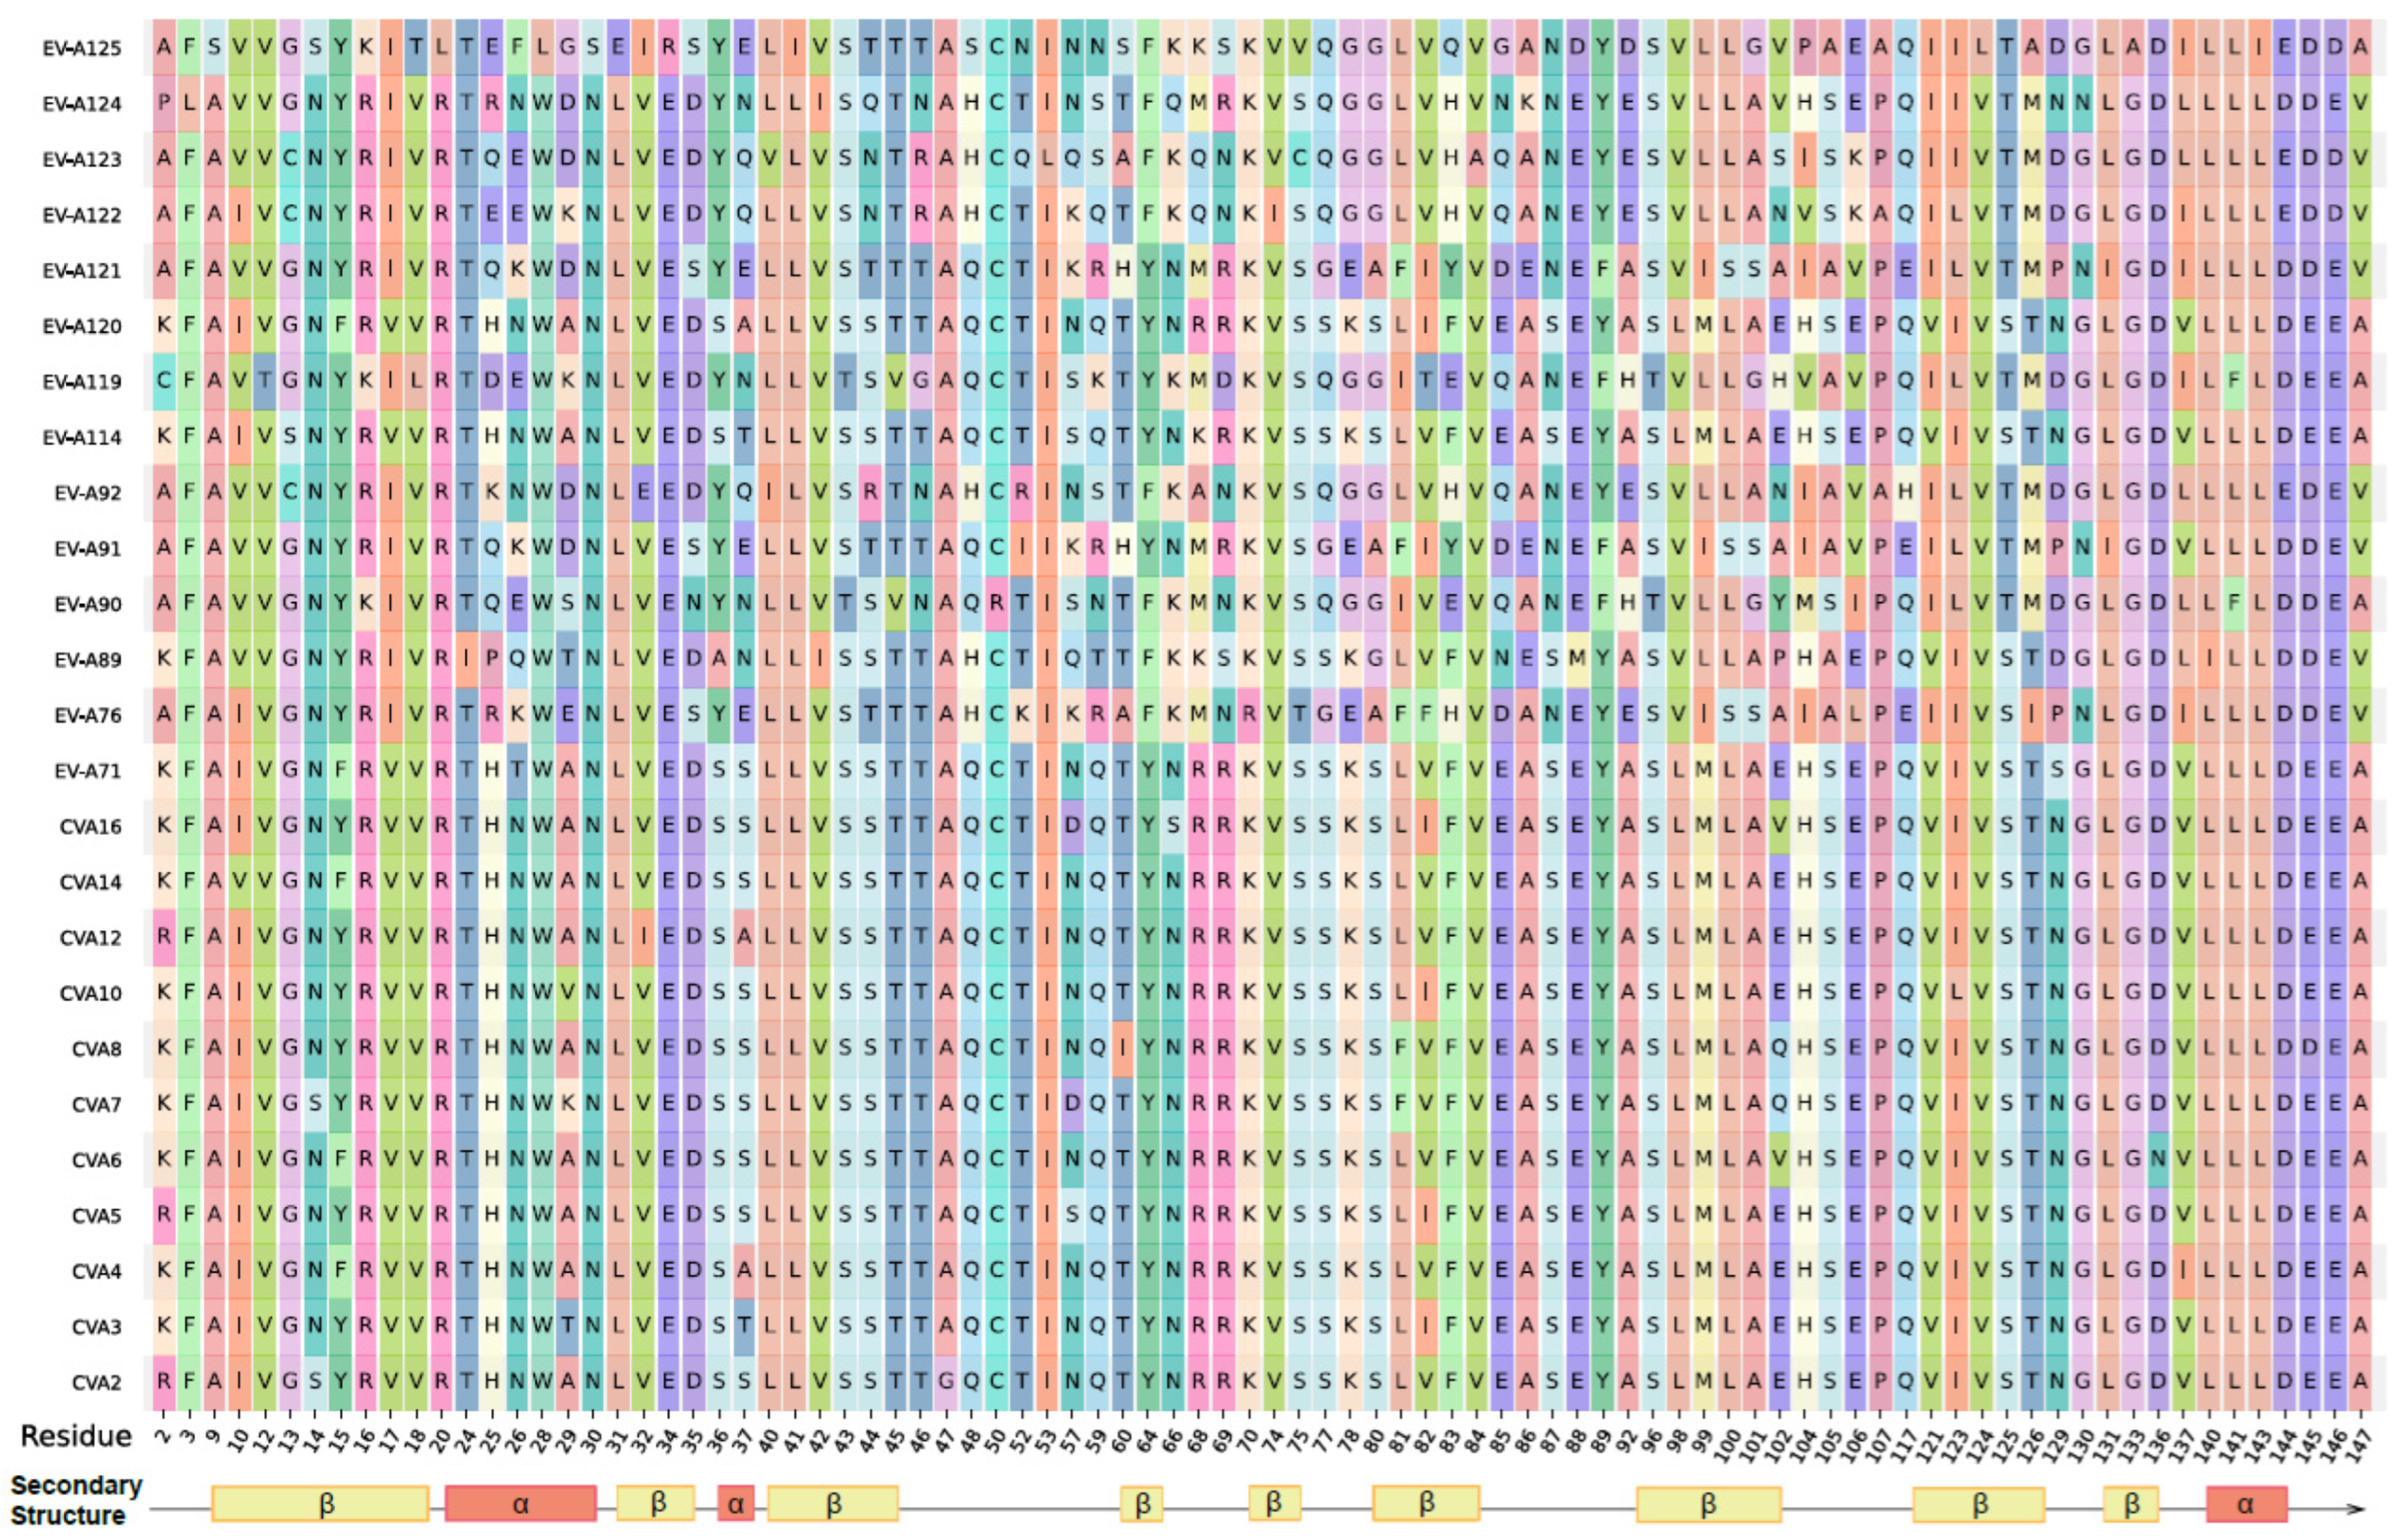
Figure 4.
Polymorphism and information content analysis of the EV-A 2A protease. (A) Distribution of polymorphic sites by variant number. Among 150 total positions, 88 were polymorphic (≥2 variants). (B) Secondary structure distribution of polymorphic sites. Sites with higher amino acid variability (6–8 variants) were primarily located within α-helices (22.11% of α-helical positions). In contrast, less variable sites (2–4 variants) were predominantly distributed in both α-helices (44.45%) and β-strands (58.11%). (C) Shannon entropy-based information content (IC) distribution. IC values ranged from 1.677 to 4.322. The threshold range of 2.735–4.022 (indicated by dashed lines) was established to select kSAPs. (D) Secondary structure distribution of the 56 kSAPs filtered by the IC threshold. Among these sites, 5.36% were located within α-helices, 57.14% in β-strands, and 37.5% in random coils, suggesting structural relevance in their functional variability.
Figure 4.
Polymorphism and information content analysis of the EV-A 2A protease. (A) Distribution of polymorphic sites by variant number. Among 150 total positions, 88 were polymorphic (≥2 variants). (B) Secondary structure distribution of polymorphic sites. Sites with higher amino acid variability (6–8 variants) were primarily located within α-helices (22.11% of α-helical positions). In contrast, less variable sites (2–4 variants) were predominantly distributed in both α-helices (44.45%) and β-strands (58.11%). (C) Shannon entropy-based information content (IC) distribution. IC values ranged from 1.677 to 4.322. The threshold range of 2.735–4.022 (indicated by dashed lines) was established to select kSAPs. (D) Secondary structure distribution of the 56 kSAPs filtered by the IC threshold. Among these sites, 5.36% were located within α-helices, 57.14% in β-strands, and 37.5% in random coils, suggesting structural relevance in their functional variability.
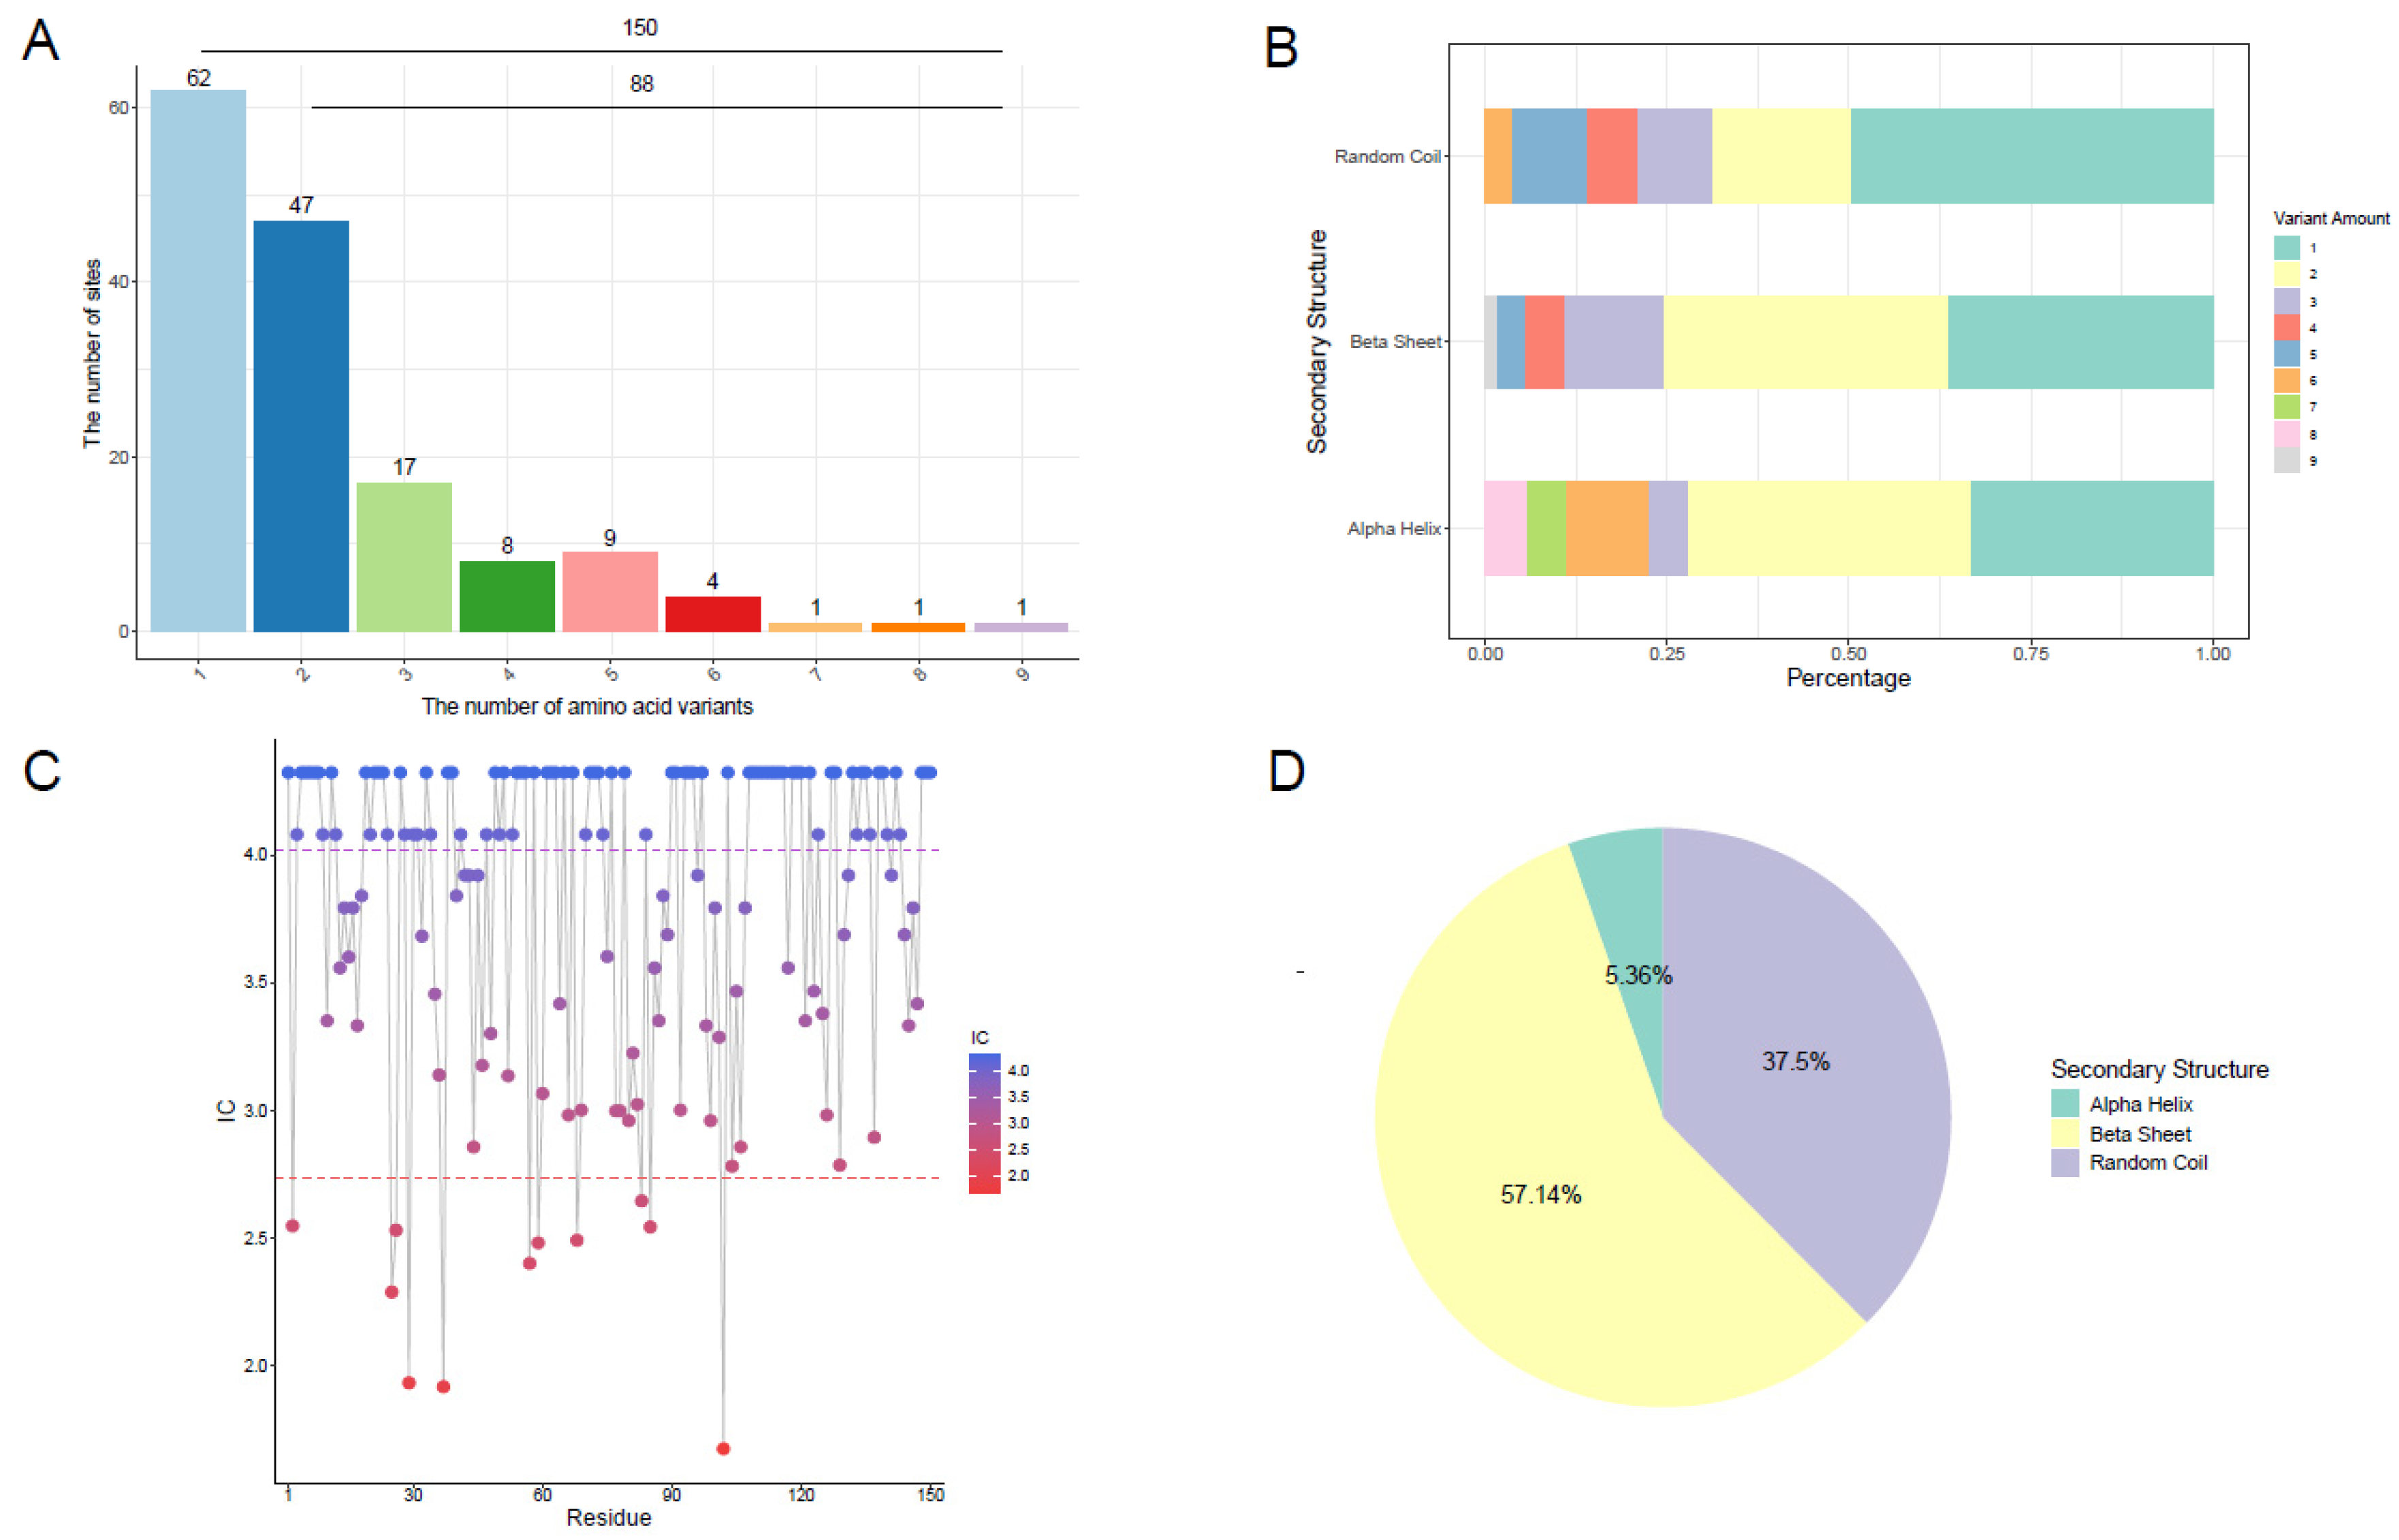
Figure 5.
Dimensionality reduction and clustering analysis of kSAPs. Principal Component Analysis (PCA) of the selected polymorphic sites revealed three major clusters. OPTICS clustering identified EV-A89 as a noise point, aligning with its phylogenetic position. In the OPTICTS clustering color legend, “−1”,”0”, “1” and “2” represent noise point, group 1, group 2, and group 3, respectively.
Figure 5.
Dimensionality reduction and clustering analysis of kSAPs. Principal Component Analysis (PCA) of the selected polymorphic sites revealed three major clusters. OPTICS clustering identified EV-A89 as a noise point, aligning with its phylogenetic position. In the OPTICTS clustering color legend, “−1”,”0”, “1” and “2” represent noise point, group 1, group 2, and group 3, respectively.
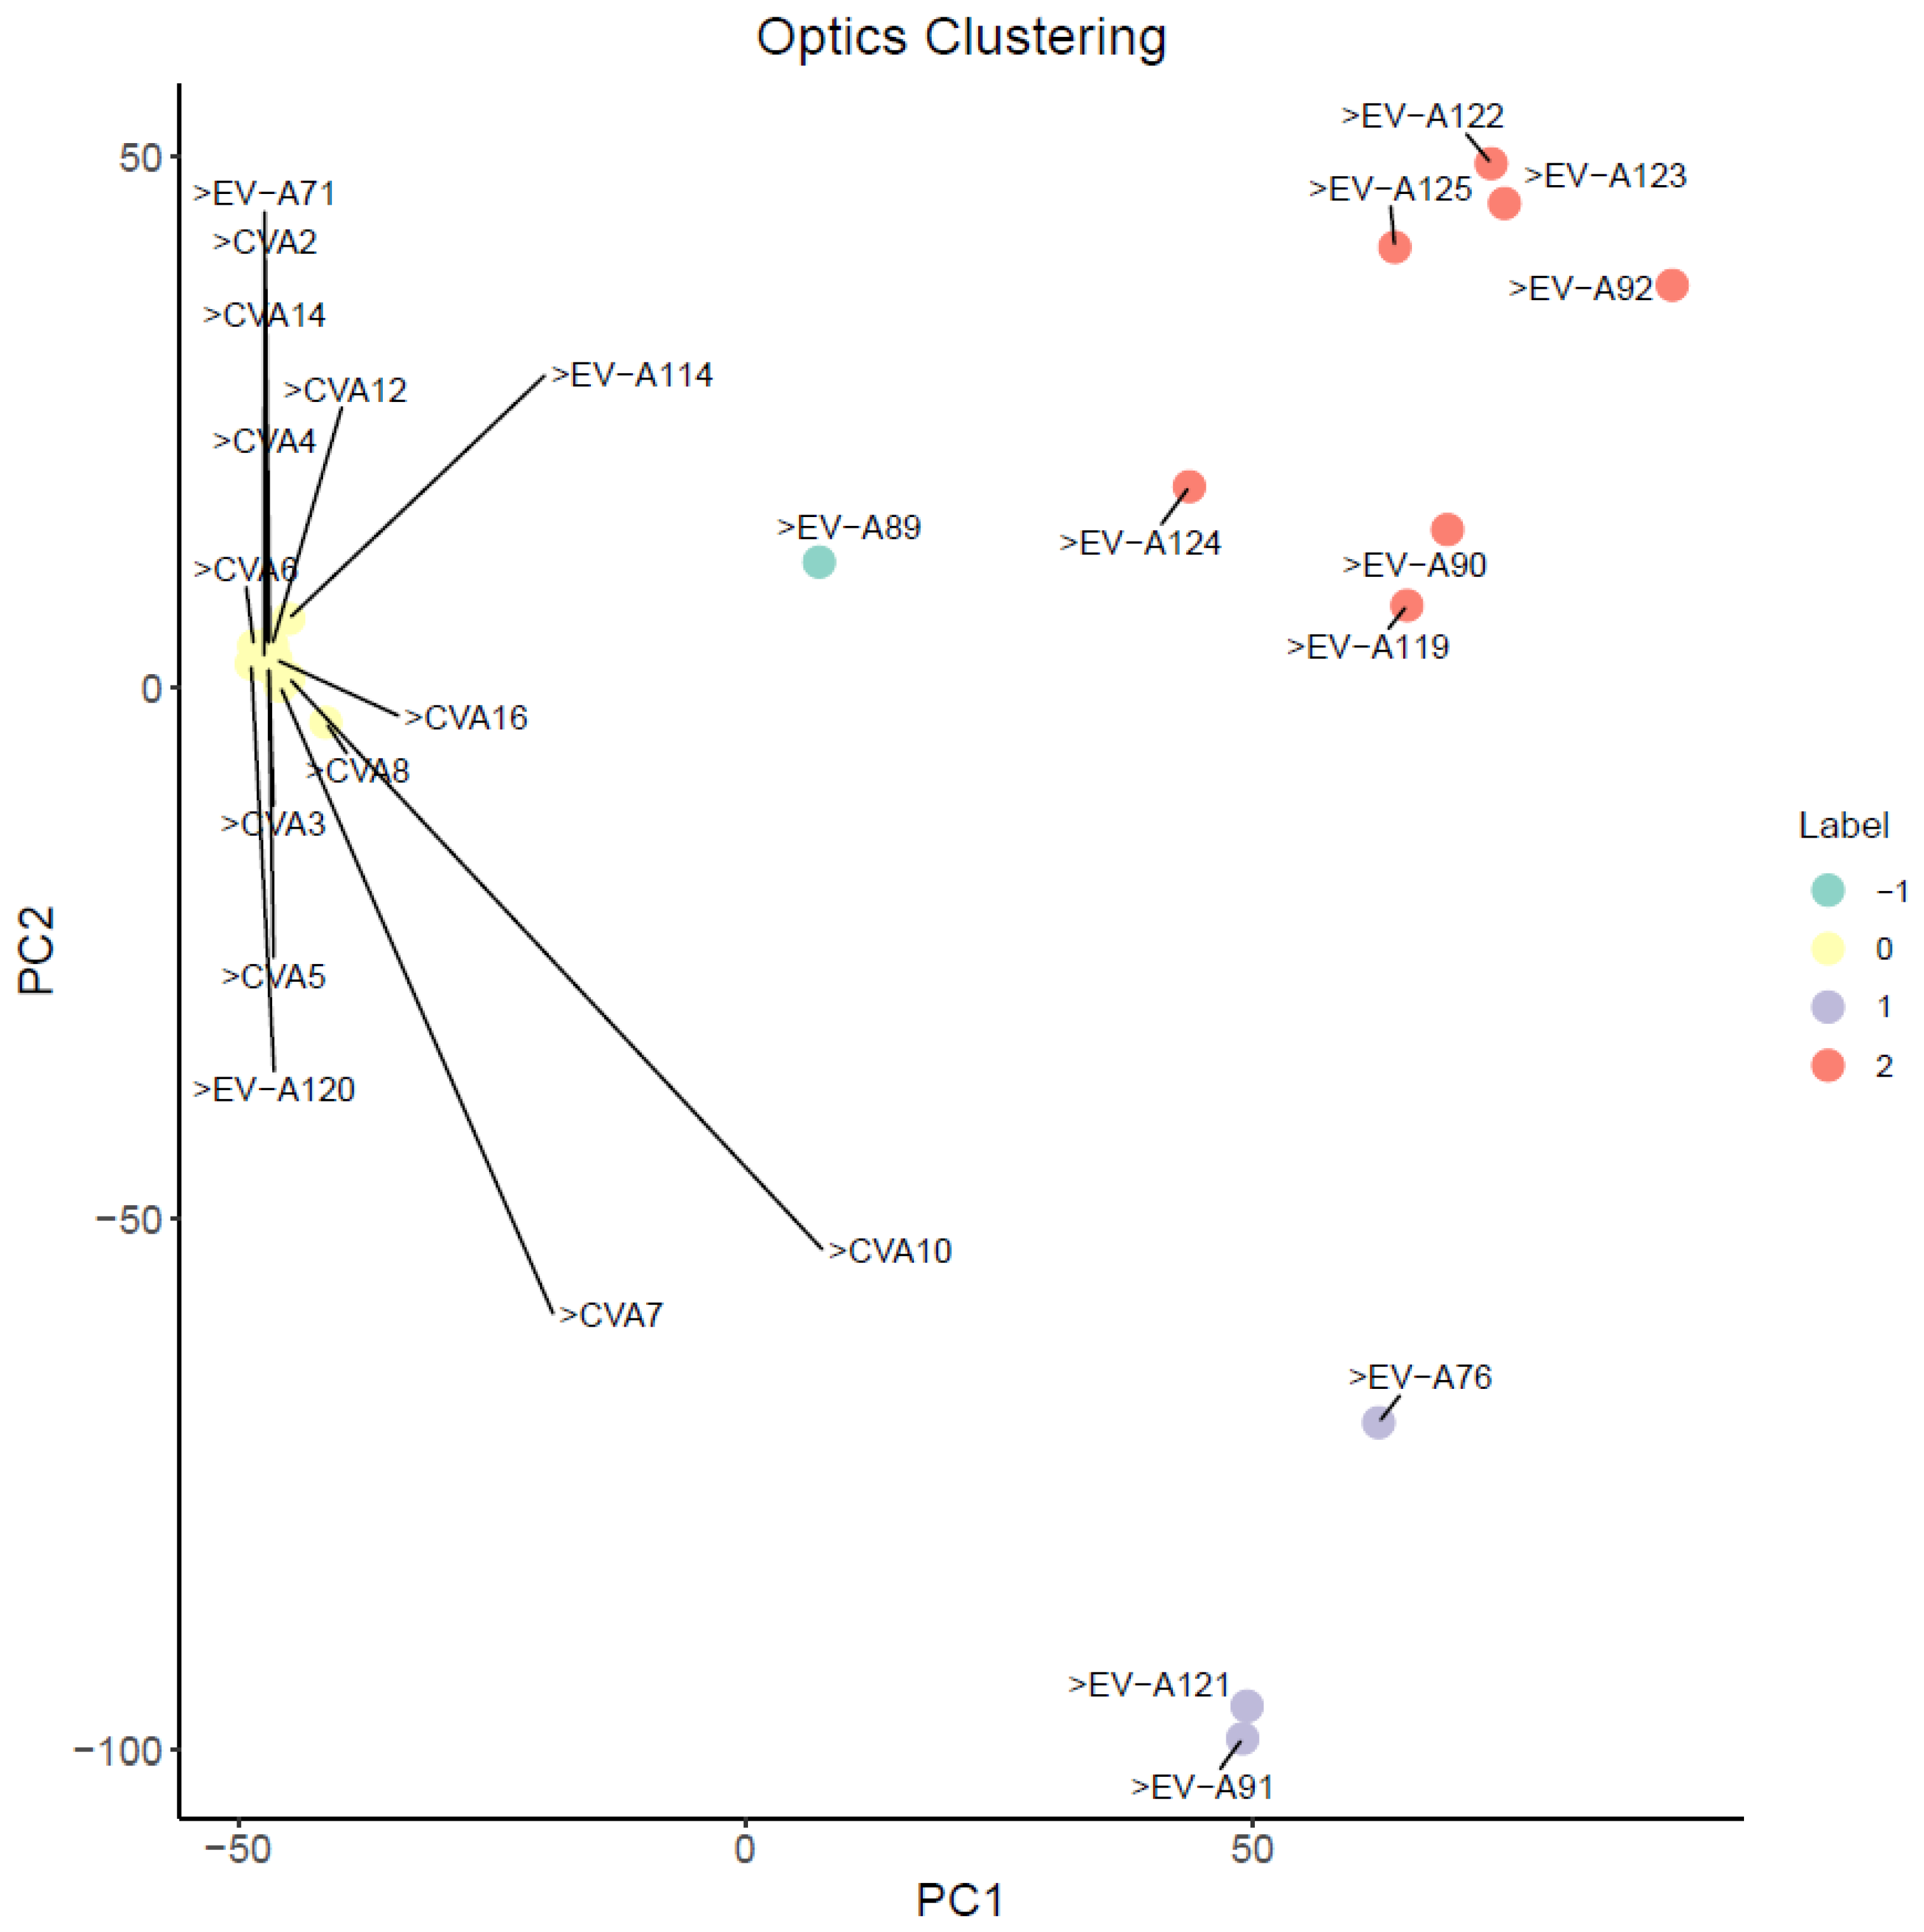
Figure 6.
Transcriptomic phenotypic analysis of the EV-A 2A protease. (A) Western blot analysis confirming successful expression of 2A protease proteins from all 25 EV-A serotypes in HEK293T cells. Empty vector was used as a negative control. (B) Re-clustering analysis of polymorphic sites from Group 1 serotypes. To further validate the clustering topology within the major clade, polymorphic sites from Group 1 serotypes (CVA2–CVA8, CVA10, CVA12, CVA14, CVA16, and EV-A71) were extracted and subjected to independent clustering analysis. (C) KEGG pathway Venn diagram comparing EV-A76, EV-A90, and EV-A121.
Figure 6.
Transcriptomic phenotypic analysis of the EV-A 2A protease. (A) Western blot analysis confirming successful expression of 2A protease proteins from all 25 EV-A serotypes in HEK293T cells. Empty vector was used as a negative control. (B) Re-clustering analysis of polymorphic sites from Group 1 serotypes. To further validate the clustering topology within the major clade, polymorphic sites from Group 1 serotypes (CVA2–CVA8, CVA10, CVA12, CVA14, CVA16, and EV-A71) were extracted and subjected to independent clustering analysis. (C) KEGG pathway Venn diagram comparing EV-A76, EV-A90, and EV-A121.
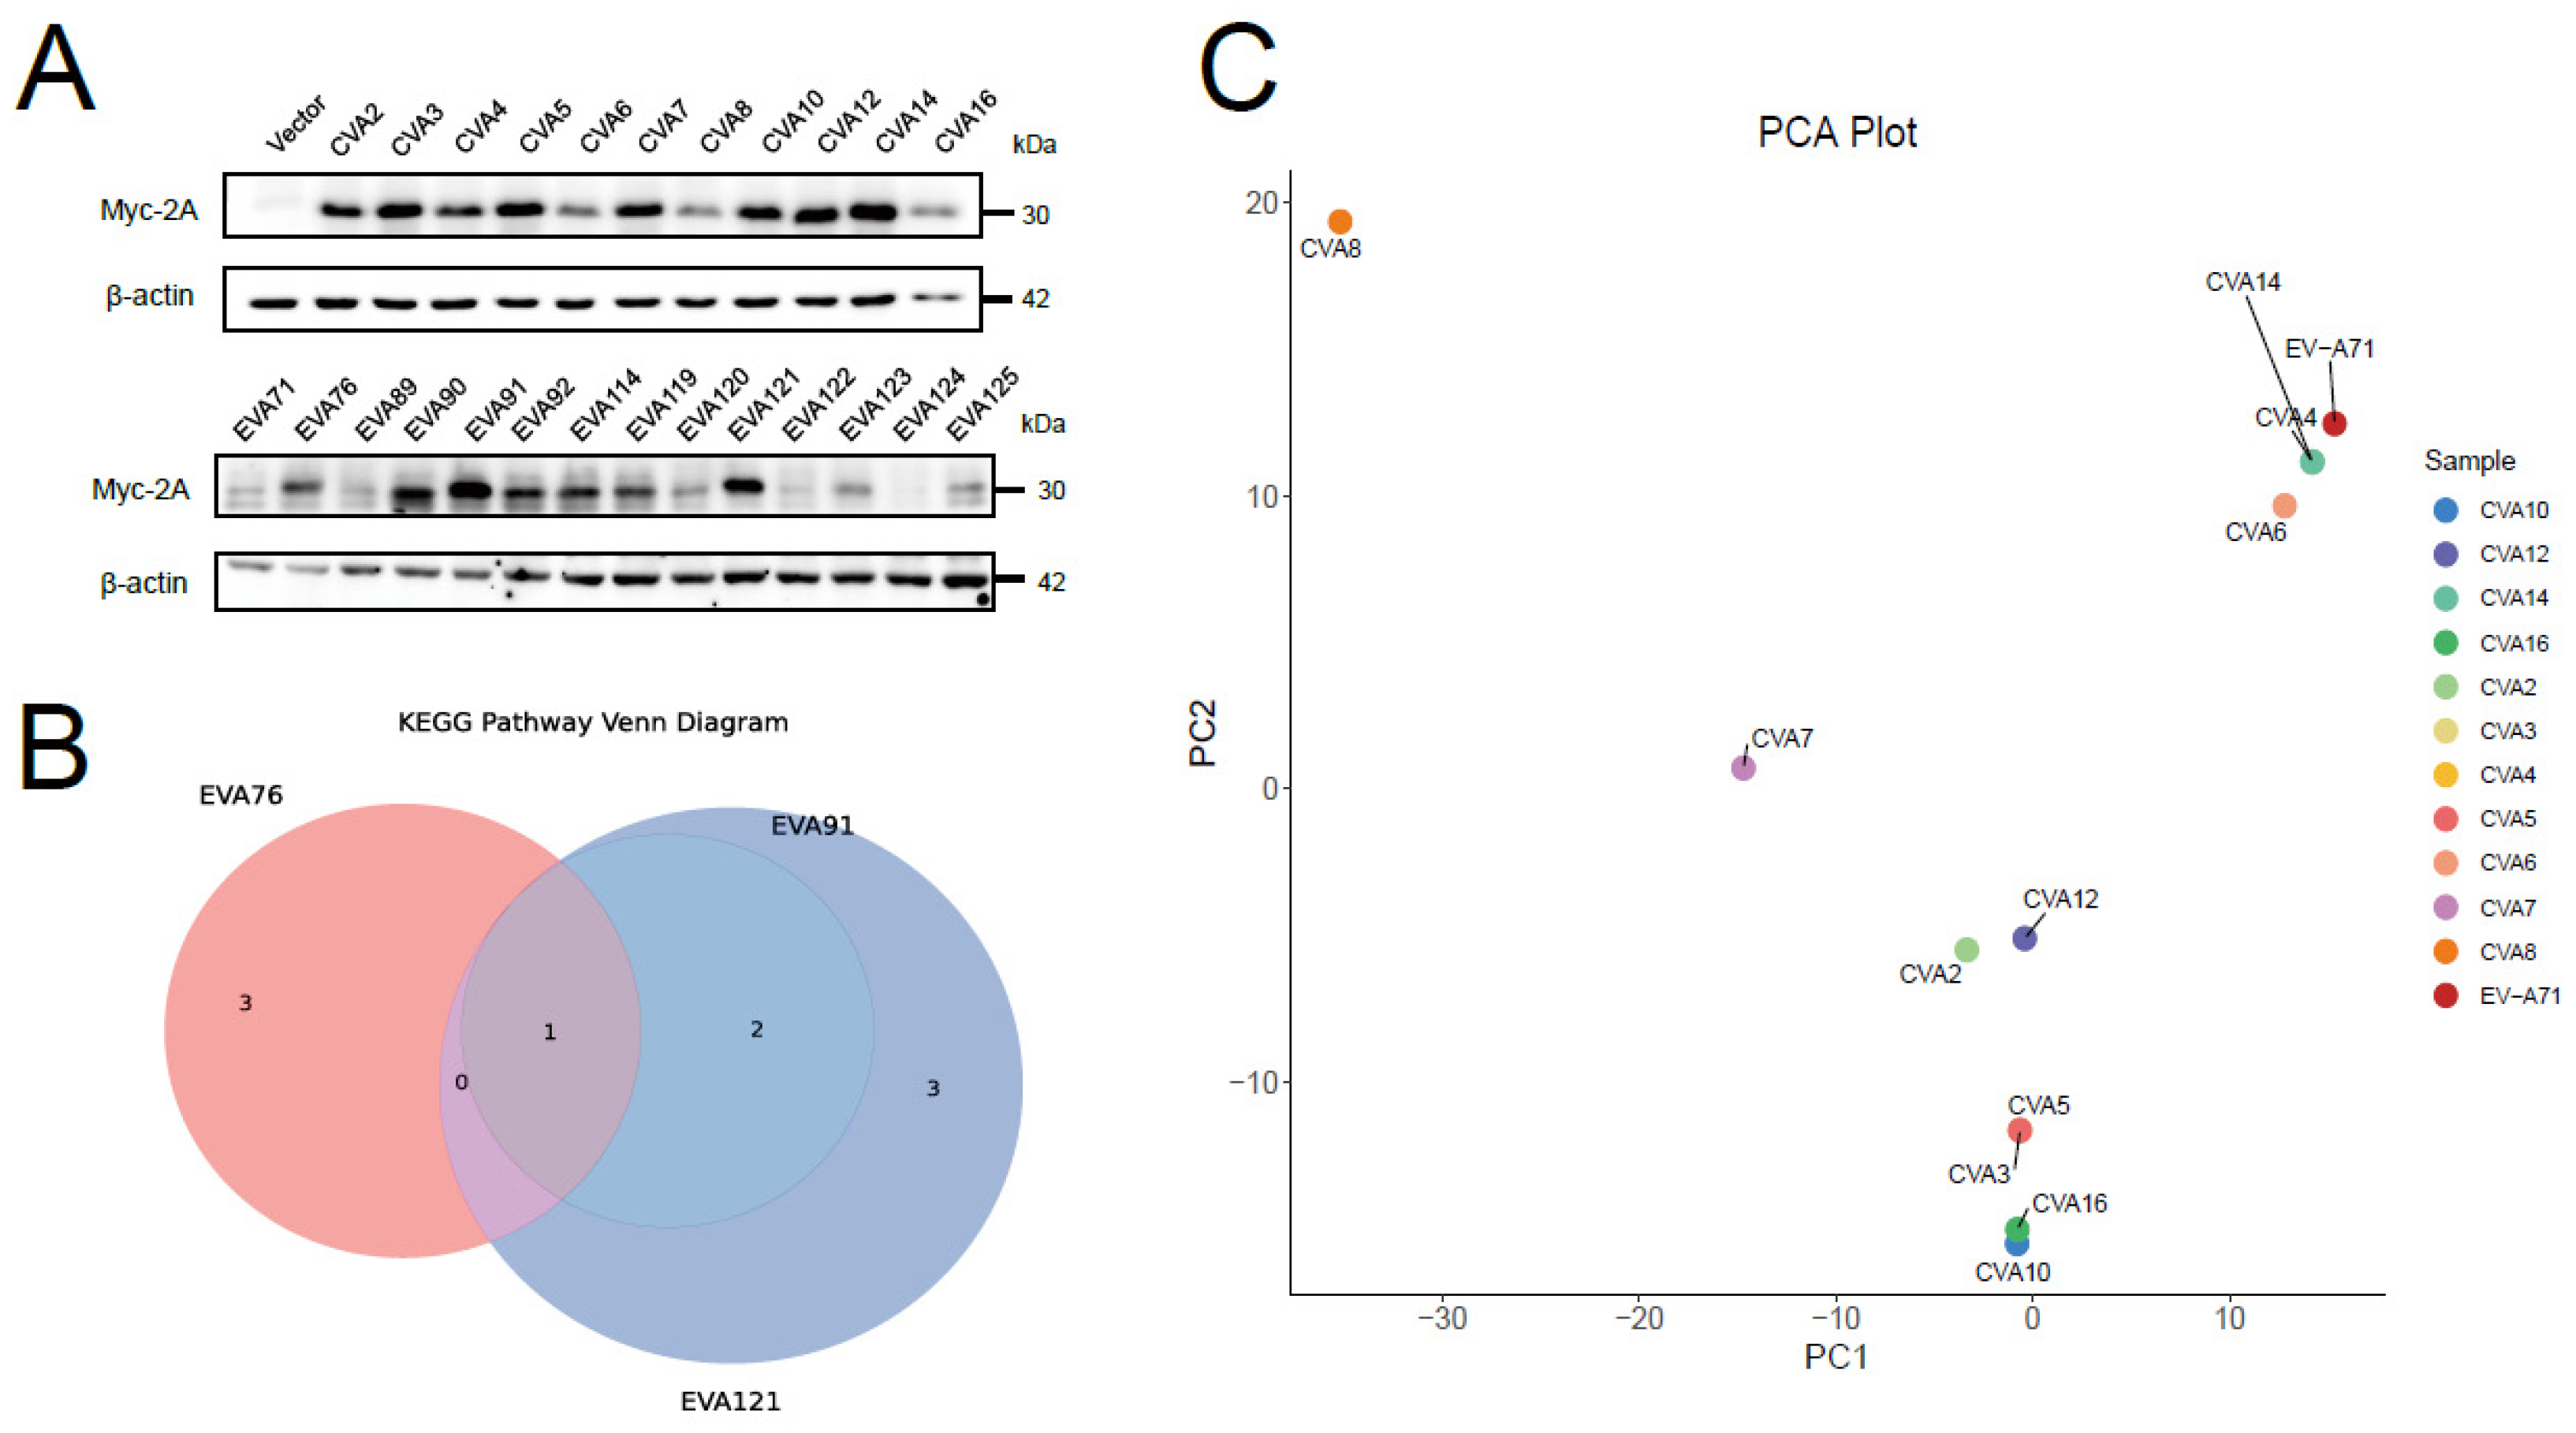
Figure 7.
Unique self-cleavage activity of the EV-A89 2A protease. (A) Detection of EV-A89 2A with differentially positioned Myc tags. Western blot analysis of HEK-293T cells transfected with empty vector (Vector), N-terminal Myc-tagged EV-A89 2A (Myc-89-2A), or C-terminal Myc-tagged EV-A89 2A (89-2A-Myc). β-actin served as a loading control. (B) Identification of the self-cleavage active domain. Western blot showing Myc-tagged EV-A71 2A (Myc-71-2A), the N-terminal domain of EV-A71 fused to the C-terminus of EV-A89 (N-71-89-C), or the reciprocal fusion (N-89-71-C), alongside vector control (Vector) and EV-A89 2A controls (89-2A-Myc and Myc-89-2A).
Figure 7.
Unique self-cleavage activity of the EV-A89 2A protease. (A) Detection of EV-A89 2A with differentially positioned Myc tags. Western blot analysis of HEK-293T cells transfected with empty vector (Vector), N-terminal Myc-tagged EV-A89 2A (Myc-89-2A), or C-terminal Myc-tagged EV-A89 2A (89-2A-Myc). β-actin served as a loading control. (B) Identification of the self-cleavage active domain. Western blot showing Myc-tagged EV-A71 2A (Myc-71-2A), the N-terminal domain of EV-A71 fused to the C-terminus of EV-A89 (N-71-89-C), or the reciprocal fusion (N-89-71-C), alongside vector control (Vector) and EV-A89 2A controls (89-2A-Myc and Myc-89-2A).
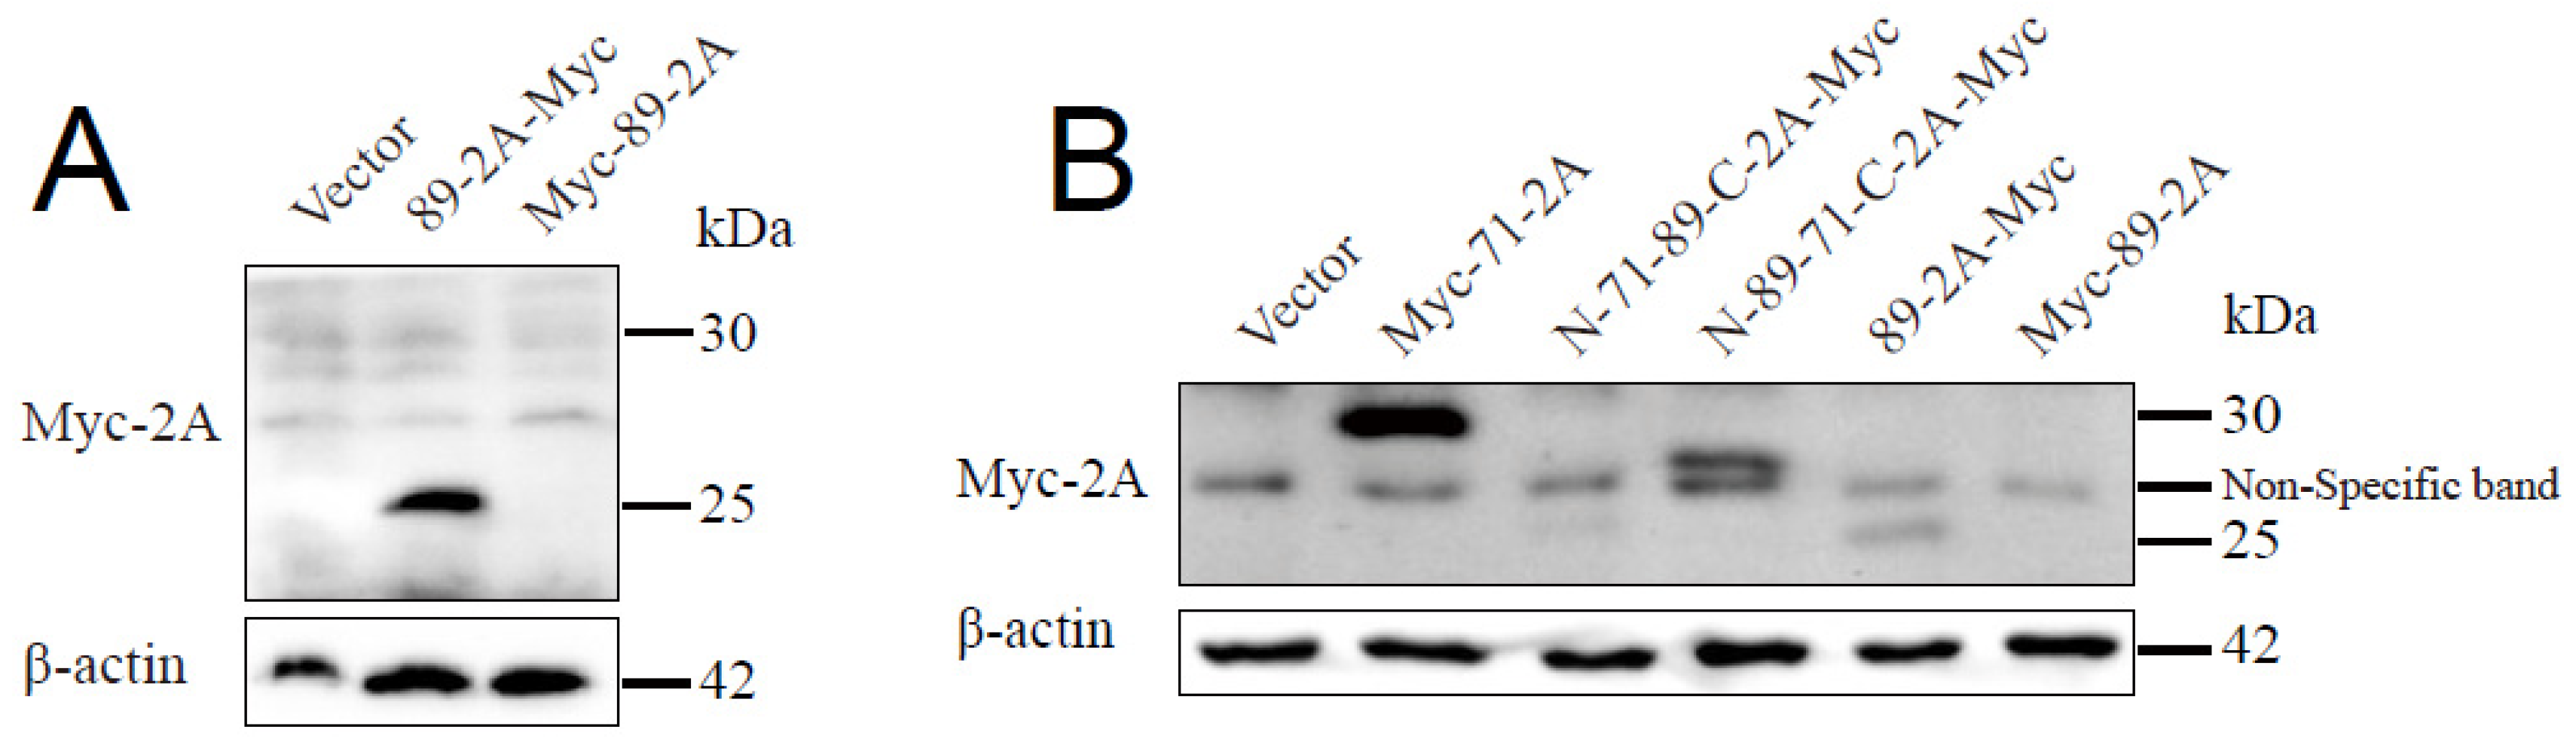
Figure 8.
Effect of IC threshold selection on clustering of kSAPs. PCA clustering results of kSAPs under six different IC thresholds: (A) 1.677–4.322, (B) 1.761–4.022, (C) 2.735–4.022, (D) 3.022–4.022, (E) 3.274–4.022, and (F) 3.274–4.322. Clustering patterns varied across different thresholds, indicating that IC threshold selection influences the classification of specific serotypes.
Figure 8.
Effect of IC threshold selection on clustering of kSAPs. PCA clustering results of kSAPs under six different IC thresholds: (A) 1.677–4.322, (B) 1.761–4.022, (C) 2.735–4.022, (D) 3.022–4.022, (E) 3.274–4.022, and (F) 3.274–4.322. Clustering patterns varied across different thresholds, indicating that IC threshold selection influences the classification of specific serotypes.
Disclaimer/Publisher’s Note: The statements, opinions and data contained in all publications are solely those of the individual author(s) and contributor(s) and not of MDPI and/or the editor(s). MDPI and/or the editor(s) disclaim responsibility for any injury to people or property resulting from any ideas, methods, instructions or products referred to in the content. |
© 2026 by the authors. Licensee MDPI, Basel, Switzerland. This article is an open access article distributed under the terms and conditions of the Creative Commons Attribution (CC BY) license (http://creativecommons.org/licenses/by/4.0/).
Copyright: This open access article is published under a Creative Commons CC BY 4.0 license, which permit the free download, distribution, and reuse, provided that the author and preprint are cited in any reuse.