

Submitted:
09 March 2026
Posted:
13 March 2026
You are already at the latest version
Abstract
The study aimed to identify employee profiles reflecting combinations of quiet quitting, passive quitting, and work engagement. Using a person-centred approach and unsupervised learning, survey data from 1,040 employees were analysed. Clustering relied on composite indices derived from abbreviated quiet and passive quitting scales and the Utrecht Work Engagement Scale-9 (UWES-9). Multiple algorithms (k-means, hierarchical clustering, spectral clustering, Gaussian mixture models) were compared, and the optimal solution was selected using separation metrics (Silhouette coefficient, Davies–Bouldin index, Calinski–Harabasz index), information criteria (Bayesian Information Criterion [BIC], Akaike Information Criterion [AIC]), and bootstrap stability (Adjusted Rand Index [ARI]). Four distinct employee profiles emerged, differing in boundaries, exhaustion, and energy. Findings suggest quiet quitting and passive quitting are related but distinct withdrawal mechanisms. The study advances profile-based research on employee withdrawal and highlights implications for targeted human resources (HR) interventions.
Keywords:
quiet quitting
; passive quitting
; work engagement
; unsupervised machine learning
; HR analytics
1. Introduction
In recent years, a clear shift has been observed in the employee–organisation relationship, involving the renegotiation of expectations towards work, boundaries of availability, and the meaning of invested effort. One of the most widely discussed manifestations of these changes is quiet quitting – understood not as a formal resignation from employment, but as limiting one’s contribution to the minimum required by the job description and the psychological contract. The phenomenon has rapidly transitioned from popular discourse into the management literature, resulting both in a growing number of publications and in a visible dispersion of definitions and operationalisations [1].
Parallel to quiet quitting, organisational practice indicates a second, qualitatively distinct mechanism of declining engagement: not so much the “conscious” setting of boundaries, but rather an apathetic withdrawal associated with exhaustion, loss of meaning, and reduced energy. However, the literature has lacked a coherent and conceptually differentiated account of these two pathways of declining engagement. This gap is directly addressed by the concept of passive quitting (PQ), introduced as a distinct construct describing unintentional withdrawal from work [2].
The importance of examining quiet quitting and passive quitting stems from the fact that declining engagement remains one of the key challenges in human resource management: it affects productivity, quality of work, organisational climate, and retention costs. Consequently, there is a growing need for diagnostic solutions that go beyond averaged variable-level effects and instead identify real, heterogeneous configurations of attitudes occurring within the employee population [3].
The concept of work engagement originates from classical psychological and organisational approaches, including the framework in which engagement denotes the harnessing of the employee’s “self” to the work role in physical, cognitive, and emotional dimensions [4]. Within the positive psychology of work tradition, engagement is most often conceptualised as a positive state characterised by three components: vigour, dedication, and absorption, and is widely measured using the UWES scale, including its short version, UWES-9 [5].
Engagement is also conceptually and empirically related to burnout; however, this relationship does not necessarily constitute a simple “oppositional axis.” In the classical conceptualisation, burnout consists, among other components, of emotional exhaustion and cynicism/depersonalisation, with its measurement and research development largely grounded in the tradition initiated by Maslach and Jackson [6]. In the Job Demands–Resources (JD–R) model, a key distinction is drawn between job demands and job resources, where demands are primarily associated with exhaustion, and lack of resources with withdrawal and decreased motivation [7].
From a human resource management perspective, it is important to note that declining engagement may take various forms of withdrawal – from “psychological” restriction of effort to behaviours associated with organisational withdrawal. Classical models of organisational withdrawal suggest that attitudes toward work as well as individual health and personal resources may lead to different types of withdrawal (work withdrawal vs. job withdrawal), thus providing a theoretical background for contemporary concepts of quiet quitting and passive quitting [8].
The development of research on quiet quitting has revealed a significant problem: the lack of a unified definition and the overlap of quiet quitting with related constructs such as declining engagement, cynicism, counterproductive behaviours, or reduced organisational citizenship behaviour. In response, clarifying and integrative works have emerged (including specialised reviews), indicating that quiet quitting should be understood as a consciously calibrated stance of limiting contribution to the minimum, often referring to the reduction of “extra-role” activities [5]. From the perspective of organisational behaviour theory, quiet quitting may be linked to the domain of organisational citizenship behaviour (OCB), that is, discretionary behaviours extending beyond formal duties and supporting organisational effectiveness. OCB provides an important interpretative background: if quiet quitting entails the abandonment of “extra effort,” its consequence may be a decline in citizenship behaviours and, consequently, in team and organisational functioning [9].
The growing body of research has also led to the development of measurement tools. For example, Galanis and colleagues proposed the Quiet Quitting Scale (QQS) with verified psychometric properties, emphasising the need for reliable measurement of the phenomenon as distinct from burnout or satisfaction [1]. More recent approaches have developed multidimensional instruments (e.g., Multidimensional Quiet Quitting Scale [MQQS]), while underscoring the necessity of clearly distinguishing quiet quitting from engagement and other constructs within the “nomological network” [10]. The literature also addresses contextual factors (including review and conceptual works), indicating that quiet quitting may represent a response to overload, unmet expectations, and tensions surrounding remote/hybrid work and performance management. However, due to variability in definitions, measurement packages, and populations, interpretations of these relationships remain inconsistent [11].
The introduction of PQ into research constitutes an important extension of the ongoing debate, as it enables differentiation between two qualitatively distinct sources of declining engagement: (1) intentional withdrawal (quiet quitting) and (2) unintentional withdrawal associated with exhaustion and loss of work meaning (passive quitting). Conceptually, Nowak proposes that PQ has a more “state-like” character (energetic and affective), whereas QQ is closer to mechanisms of boundary-setting and regulatory decisions [12]. The contribution of these works concerns not only conceptualisation but also operationalisation of PQ. The author developed original scales for measuring QQ and PQ, followed by psychometric evaluation and validation, including studies combining traditional measurement approaches with data science tools [13]. Particularly noteworthy is the subsequent shortening of the QQ and PQ scales using a hybrid procedure integrating Structural Equation Modelling (SEM) for measurement model quality and machine learning (ML) for predictive utility of items. As a result, a shorter instrument was obtained while preserving diagnostic functionality [13].
The development of HR analytics fosters a shift from intuitive diagnoses toward data-driven diagnostics and employee segmentation for the design of targeted interventions (e.g., wellbeing, retention, development). Literature reviews emphasise that the value of HR analytics increases when data, quantitative methods, and managerial decisions are integrated into a coherent process [3]. At the same time, within HR applications of machine learning, the predictive (supervised learning) stream still predominates, whereas unsupervised methods aimed at building typologies and profiles are relatively less emphasised – thus creating space for a person-centred approach in the analysis of employee withdrawal [14].
The person-centred approach assumes modelling population heterogeneity through the identification of groups with coherent configurations of characteristics (profiles), enabling a more “diagnostic” interpretation of mechanisms than classical variable-centred approaches based solely on mean effects [15]. In profile research within organisational sciences, various segmentation techniques are employed: from classical centroid-based and hierarchical methods, through graph-based methods, to probabilistic approaches (mixture models) [16]. The present study compared competing unsupervised learning algorithms to empirically select a solution ensuring the best separation, parsimony, and stability of profiles in the data. In this context, Gaussian Mixture Models (GMM) are particularly useful as a class of mixture models estimated via the Expectation-Maximisation (EM) algorithm, allowing flexible modelling of cluster shapes in feature space (including heterogeneous covariance matrices) [17]. The selection of the number of profiles may be based on information criteria, particularly AIC and BIC, which formalise the trade-off between fit and complexity [18].
Synthesising the existing findings, four interrelated gaps may be identified. First, despite the growing number of publications, definitional ambiguity of quiet quitting and its differentiation from related constructs persist [5]. Second, the literature rarely distinguishes qualitatively different mechanisms of declining engagement, limiting diagnostic precision and intervention design; the QQ–PQ distinction proposed by Nowak constitutes an important step toward clarifying this conceptual space [12]. Third, scale development requires reducing respondent burden without compromising measurement quality-an issue addressed through the SEM–ML hybrid procedure. Fourth, the need for profiling tools in HR analytics indicates the relevance of applying unsupervised methods and a person-centred approach in diagnosing employee withdrawal [19].
Consequently, the aim of the present article is to provide an in-depth identification and interpretation of employee profiles differing in the configuration of quiet quitting, passive quitting, and engagement (UWES-9) using unsupervised learning, based on shortened measurement instruments and comparison of alternative modelling solutions. In the subsequent sections, the Methods section presents the measurement model (shortened QQ and PQ scales and UWES-9), construction of profiling indicators, and the unsupervised learning procedure along with criteria for selecting the number of profiles and stability validation. The Results section reports the comparison of clustering models in 3D and 5D feature spaces, the selection of the final solution, stability assessment (ARI), and the characteristics and interpretation of four profiles. The Discussion and Findings sections address the theoretical and practical significance of the identified profiles for HR analytics and outline the study’s limitations and directions for further research.
2. Methods
The study employs a person-centred (profile-based) approach to identify coherent subgroups of employees differing in the configuration of intensity across three attitudes: quiet quitting (QQ), passive quitting (PQ), and work engagement (WE). The methodological core consists of unsupervised learning (clustering) with algorithmic model selection and multi-criteria validation of the solution. The developed model may be presented as an eight-step procedure.
Step 1. Preparation of the measurement model
For the purposes of the profile analysis, shortened versions of the quiet quitting (QQ) and passive quitting (PQ) scales were adopted, developed on the basis of prior validation studies combining structural equation modelling and machine learning. Work engagement was measured using the UWES-9 scale, enabling assessment of three components: vigour (VIG), dedication (DED), and absorption (ABS). The prepared measurement model ensures a balance between psychometric reliability and instrument parsimony, which is crucial in profile analyses.
Step 2. Construction of profiling variables
Clustering is not performed on individual items, but on composite indicators representing the intensity of each construct. For respondent i, the feature vector is defined as:
or, in an extended version (depending on the adopted scope of work engagement measurement):
The profiling indicators (QQ, PQ) were calculated as arithmetic means of responses to items belonging to a given scale, yielding a synthetic measure of construct intensity while preserving its multi-item character. Such aggregation reduces the impact of measurement error at the single-item level and provides a more stable representation of the employee’s attitude. In the case of UWES, means were calculated both for the overall scale and for the three subscales (VIG, DED, ABS), enabling analysis of more fine-grained configurations of engagement.
Step 3. Standardisation of Variables
Since the variables have different ranges (Likert 1–5 vs. UWES 0–6), standardisation is applied:
where:
- profile variable,
- mean,
- standard deviation.
This ensures an equal contribution of variables within the clustering space.
Step 4. Formal Clustering Model
The problem of identifying employee profiles was formulated as a clustering task in the space of profile variables, assuming the existence of unobserved populations (profiles) generating the data. The objective is to partition observations into groups that maximise within-cluster homogeneity and between-cluster separation. The analysis did not assume a single a priori model structure; instead, several classes of algorithms were compared, representing different geometric and statistical assumptions regarding clusters:
- −
- centroid-based methods (k-means), assuming clusters with approximately spherical geometry,
- −
- hierarchical methods (Ward), modelling nested structures and minimising within-cluster variance,
- −
- graph-based methods (spectral clustering), identifying clusters based on neighbourhood structure in the data,
- −
- probabilistic mixture models (Gaussian Mixture Models [GMM]), allowing for soft assignment of observations to profiles.
In mixture models, it is assumed that the distribution of observations can be expressed as:
where:
- −
- - number of profiles,
- −
- - - profile weight (∑πₖ = 1),
- −
- - component distribution,
- −
- - component parameters.
In the case of Gaussian mixture models:
The parameters are estimated via maximum likelihood using the EM algorithm:
E-step:
M-step:
Mixture models constitute a probabilistic representation of segmentation; however, in the present study they were treated as one of several competing classes of algorithms. The final identification of the profile structure is based on an empirical comparison of solutions obtained from different model families, allowing for an assessment of the stability of the number of profiles and their separation independently of the assumed geometric assumptions.
Step 5. Specification of the Profile Identification Procedure (Pipeline)
The profile identification procedure followed a multi-stage pipeline aimed at obtaining a stable and comparable segmentation across alternative feature spaces and different classes of clustering algorithms.
- Data preparation – In the first step, items belonging to the shortened versions of the QQ and PQ scales and the UWES-9 scale were selected. Composite indicators (means) were then computed for QQ and PQ and – depending on the analytical variant – either the overall mean for UWES-9 or the means for its three subscales (VIG, DED, ABS). Only observations complete with respect to all profile variables were included in clustering (listwise deletion for missing data in QQ/PQ/UWES).
-
Construction of the feature space – The pipeline was implemented in two variants of the feature space:
- a)
- 3D variant: (QQ, PQ, UWES),
- b)
- 5D variant: (QQ, PQ, VIG, DED, ABS).
This approach enabled an assessment of whether the profile structure remains stable after decomposing engagement into its constituent components.
- 3)
-
Estimation of clustering models across a grid of K – For each feature space, a set of algorithms representing distinct geometric and probabilistic assumptions was estimated:
- −
- k-means (clusters with approximately spherical geometry),
- −
- hierarchical clustering using Ward’s method (AgglomerativeClustering, linkage = ward),
- −
- graph-based spectral clustering (SpectralClustering; affinity = nearest_neighbors, assign_labels = kmeans; number of neighbors ,
- −
- Gaussian Mixture Models (GMM) with four covariance structure variants: full, diag, tied, and spherical (n_init = 5).
Models were estimated within an exploratory range of cluster numbers K ∈ {4, 5, 6, 7}. For methods involving random initialisation, a fixed random_state = 42 was adopted to ensure reproducibility of comparisons across algorithms.
- 4)
- Preparation for solution comparison – For each combination (algorithm × K × feature space), cluster labels were obtained (for GMM: maximum a posteriori assignment), along with a full set of segmentation quality metrics. These metrics constituted the basis for the multi-criteria selection of the final solution in Step 6 (separation measures and, for GMM, additionally AIC/BIC).
Step 6. Determination of the Number of Profiles
The selection of the number of clusters was based on a multi-criteria evaluation:
Separation criteria:
- −
- Silhouette index,
- −
- Davies–Bouldin index,
- −
- Calinski–Harabasz index.
Information criteria (for probabilistic models):
- −
- ,
- −
- .
In cases of discrepancies between metrics, priority was given to (1) separation quality (Silhouette, Davies–Bouldin), (2) bootstrap stability (ARI), and only subsequently to the information criteria reported for probabilistic models. The final solution was selected as a compromise maximising separation while preserving interpretability of the profiles.
Step 7. Stability Validation
The stability of the obtained profiles was assessed using a bootstrap procedure involving repeated resampling of subsamples from the data, re-estimation of the clustering model, and comparison of observation assignments across iterations. Quantitative assessment of segmentation agreement was conducted using the Adjusted Rand Index (ARI), which measures the similarity between clustering solutions while accounting for chance agreement.
Higher ARI values are interpreted as indicating greater stability and replicability of the profile structure. The ARI was computed for pairs of bootstrap replications on the intersection of observations present in both samples, ensuring comparability of labels under sampling with replacement.
Step 8. Profile Characterisation
Following model estimation:
- −
- mean values of the indicators are computed within clusters,
- −
-
profiles are interpreted as configurations of three mechanisms:
- ○
- boundaries (QQ),
- ○
- exhaustion (PQ),
- ○
- energy (UWES).
This approach enables the description of motivational trajectories rather than isolated predictive effects.
3. Results
Step 1. Preparation of the Measurement Model
The analysis was conducted on a dataset collected through a Computer-Assisted Web Interviewing survey administered between 23–29 May 2025 on a sample of 1,040 employees. To measure quiet quitting and passive quitting, proprietary scales were used, for which prior validation studies confirmed high psychometric quality: content validity (CVI = 0.929 for relevance and 0.914 for clarity), full item significance (CVR = 1.00), adequacy for factor analysis (KMO = 0.918; Bartlett’s test χ² = 9026.24, p < 0.001), and a two-factor structure consistent with theoretical assumptions, explaining over 66% of the variance. The scales demonstrated high reliability (α = 0.910 for QQ and α = 0.916 for PQ). In the present study, shortened versions were applied, preserving their diagnostic properties, while work engagement was measured using the UWES-9 scale.
Step 2. Construction of Profile Variables
Based on the retained items, synthetic profile indicators were computed:
- −
- QQᵢ – mean of items from the shortened quiet quitting scale,
- −
- PQᵢ – mean of items from the shortened passive quitting scale,
- −
- UWESᵢ – mean of UWES-9,
- −
- additionally, subscales were calculated: vigour, dedication, and absorption.
Two feature spaces were tested in the analysis:
- −
- 3-dimensional variant: (QQ, PQ, UWES),
- −
- extended 5-dimensional variant: (QQ, PQ, VIG, DED, ABS).
Step 3. Standardisation of Variables
All profile variables were standardised prior to clustering. This ensured comparability of the influence of QQ, PQ, and UWES indicators within the model space.
Step 4. Formal Clustering Model
In line with an unsupervised approach, it was assumed that the studied population is not homogeneous and may contain distinct configurations of attitudes (profiles). In practice, several classes of clustering algorithms (centroid-based, hierarchical, graph-based, and probabilistic) were estimated and compared, each implying different assumptions regarding cluster geometry and observation assignment. This enabled the selection of the most useful solution in terms of separation, parsimony, and stability.
Step 5. Profile Identification Procedure (Pipeline)
The profile identification procedure involved the estimation and comparison of clustering models in two variants of the feature space: the basic (3D: QQ, PQ, UWES) and the extended (5D: QQ, PQ, VIG, DED, ABS). For each space, different algorithms and a range of cluster numbers were tested, and evaluation was conducted based on separation and fit indices.
a) Estimation of models in the 3-dimensional space
In the 3-dimensional space (QQ, PQ, UWES), the best-performing solutions consistently indicated a four-profile structure. The highest separation values were achieved by Gaussian Mixture models for K = 4 (e.g., silhouette ≈ 0.34), with very similar results obtained for K-means (Table 1). Solutions with a greater number of clusters were characterised by a gradual decline in separation quality, indicating the presence of a stable four-profile structure. This implies that, across the compared set of algorithms, both mixture-based and centroid-based solutions converged on K = 4, with the highest silhouette value obtained for the GMM variant.
b) Estimation of Models in the Extended Space
In the 5-dimensional space, the highest separation quality was obtained for the four-cluster solution. The best result among models with K = 4 was achieved by the Gaussian Mixture Model with a tied covariance matrix (Silhouette coefficient = 0.285; BIC = 11196.55; AIC = 11008.56; Table 2). Although the information criteria within the GMM framework indicated further improvement in model fit with a greater number of components (e.g., for tied: BIC = 11160.26 for K = 5 and 11123.21 for K = 6), this was accompanied by a decline in separation quality (Silhouette coefficient = 0.283 for K = 5; 0.264 for K = 6) and reduced interpretability of the profiles. The remaining algorithms (spectral clustering, k-means) produced comparable separation indices for K = 4; however, mixture models offered an additional advantage in the form of probabilistic assignment of observations and the possibility of formal model comparison. Consequently, the K = 4 solution was considered the most useful compromise between cluster separation, parsimony, and clarity of segmentation.
Overall, the pipeline analysis indicated a stable and replicable four-profile structure observed in both the basic and extended feature spaces, which provided the basis for selecting the final solution in the subsequent step.
Step 6. Selection of the Solution (Algorithm and Number of Profiles)
The selection of the final solution was based on a multi-criteria evaluation within the grid (algorithm × K × feature space). Solutions were first compared using separation measures (Silhouette coefficient, Davies–Bouldin, Calinski–Harabasz), followed by considerations of parsimony and bootstrap stability (ARI). For probabilistic models, AIC/BIC were additionally reported as fit indices penalising model complexity.
Step 7. Stability Validation
The stability of the obtained segmentation was assessed using a bootstrap procedure involving repeated resampling of subsamples, re-estimation of the model, and comparison of observation assignments across iterations. The ARI was applied as a measure of agreement, allowing for the evaluation of the replicability of the cluster structure. The mean ARI value was approximately 0.59 (SD = 0.19), indicating moderate solution stability. This result is consistent with expectations for the segmentation of psychosocial constructs and suggests that the identified profile structure is relatively replicable while preserving the natural heterogeneity of the studied population.
Step 8. Profile Characterisation
The selected model identified four employee profiles differing in the configuration of quiet quitting (QQ), passive quitting (PQ), and work engagement (UWES). The distribution of frequencies indicates one dominant profile and three smaller, more specific configurations of attitudes (Table 3).
The analysis of mean values of the profile indicators confirmed clear differentiation in the configuration of QQ, PQ, and UWES across clusters, enabling their psychological interpretation and the assignment of diagnostic labels (Table 4). Although the final solution was estimated in the 5D space, for comparability of interpretation we also report the aggregate UWES mean (mean of UWES-9) alongside QQ and PQ.
The following profile labels were proposed:
- −
- Profile 0 – Boundary Setters – This profile is characterised by elevated quiet quitting combined with moderate passive quitting and moderate engagement. It reflects a strategic limitation of work input while maintaining relatively stable occupational functioning, where withdrawal primarily serves as a boundary-regulation mechanism.
- −
- Profile 1 – Active Enthusiasts – This profile comprises employees with the lowest levels of withdrawal and the highest engagement. Low QQ and PQ values combined with very high UWES indicate a reference configuration of high energy, dedication, and active organisational functioning.
- −
- Profile 2 – Disengaged Withdrawn – A profile of extreme withdrawal, characterised simultaneously by very high quiet quitting and passive quitting and very low engagement. This configuration indicates the concurrent operation of boundary-regulation and exhaustion mechanisms, constituting the most organisationally risky profile.
- −
- Profile 3 – Passive Exhausted – This profile is characterised by high passive quitting combined with relatively low quiet quitting and reduced engagement. Withdrawal in this case is primarily energy-related and associated with exhaustion rather than deliberate limitation of work input.
The obtained structure indicates three key mechanisms differentiating the profiles: (1) regulatory boundaries represented by quiet quitting, (2) energetic exhaustion represented by passive quitting, and (3) a motivational resource represented by work engagement. The profiling demonstrates that quiet quitting and passive quitting do not constitute a single continuum; rather, they form distinct configurations that relate in different ways to employees’ energy levels. Overall, the four-profile solution proved to be the most statistically coherent and interpretatively meaningful, highlighting the heterogeneous nature of work withdrawal and the existence of diverse motivational trajectories-from boundary regulation, through exhaustion, to configurations of dual withdrawal. The structure of the identified profiles was illustrated through a graphical representation in a reduced-dimensional space, enabling a visual assessment of cluster separation and their relative positions along the principal axes of differentiation.
Figure 1 confirms a clear separation of profiles and indicates that the primary axis of differentiation reflects the level of engagement, whereas the second axis is associated with the configuration of quiet quitting and passive quitting. The visible structure supports the interpretation of four distinct trajectories of employee withdrawal.
4. Discussion of Results
The aim of the study was to identify employee profiles differing in the configuration of quiet quitting, passive quitting, and work engagement. The results indicate the existence of four stable profiles reflecting distinct mechanisms of work withdrawal. A key conclusion is that quiet quitting and passive quitting do not constitute a single phenomenon, but rather two related yet distinct motivational mechanisms.
The “Boundary Setters” profile indicates that an elevated level of quiet quitting may coexist with moderate engagement and relatively low passive withdrawal. This suggests that quiet quitting can be interpreted as a strategy of effort regulation and boundary management rather than solely as an expression of demotivation. In this sense, it may signal a renegotiation of the psychological contract or a shift in work-related expectations.
The “Passive Exhausted” profile confirms that passive quitting is more strongly associated with reduced engagement than quiet quitting. Its primary source appears to be exhaustion, loss of work meaning, and diminished energy, situating this mechanism closer to burnout processes than to deliberate regulatory decisions by the employee.
The most organisationally risky configuration proved to be the “Disengaged Withdrawn” profile, characterised by simultaneously high quiet quitting and passive quitting alongside very low engagement. This profile may be interpreted as the endpoint of a withdrawal trajectory in which both boundary-regulation and exhaustion mechanisms operate concurrently, highlighting the multi-path nature of withdrawal processes. In contrast, the “Active Enthusiasts” profile serves as a reference configuration, representing high energy, dedication, and minimal withdrawal. While consistent with classical conceptualisations of engagement as the opposite of withdrawal, the findings suggest that the relationships among these constructs are configurational rather than strictly unidimensional.
The obtained results are consistent with the earlier segmentation [2], in which – using full versions of the QQS and PQS scales and selecting the number of components solely on the basis of information criteria (AIC/BIC) – a five-profile solution was identified. In the present study, the use of shortened scale versions and a multi-criteria model selection approach (separation indices, information criteria, and bootstrap stability) led to a more parsimonious four-profile solution. The difference in the number of profiles does not imply contradiction but reflects a different level of segmentation granularity: the five-profile typology represents a more fine-grained classification, whereas the four-profile solution aggregates the most similar configurations into larger, better-separated clusters while preserving the key interpretative mechanisms-boundaries, exhaustion, and energy.
5. Conclusion
The study makes three key theoretical contributions. First, it demonstrates that quiet quitting and passive quitting are constructively distinct and form different configurations of attitudes. In doing so, it extends the literature, which has often treated quiet quitting as synonymous with reduced engagement. Second, the findings support a person-centred approach to the study of employee withdrawal, showing that profiles provide a more nuanced perspective than variable-centred models. Third, the study suggests that work withdrawal is multi-mechanistic, encompassing a strategic component (boundaries), an energetic component (exhaustion), and a motivational component (engagement).
The results have direct implications for human resource management. Quiet quitting should not be automatically interpreted as a signal of turnover risk, but rather as an indicator of the need to renegotiate expectations, workload, or recognition. Passive quitting, by contrast, signals the need for interventions targeting work energy – such as reducing overload, strengthening managerial support, and restoring a sense of meaning. The dual-withdrawal profile requires the most intensive retention efforts, as it combines two risk mechanisms. The identified structure aligns with a growing body of research suggesting that withdrawal behaviours are heterogeneous and cannot be reduced to a single indicator.
The findings contribute to the literature on job embeddedness, burnout, and the psychological contract, indicating that decisions to limit effort and declines in energy constitute distinct processes. Future research should focus on longitudinal analyses enabling the tracking of transitions between profiles and testing the hypothesis of withdrawal trajectories. A promising direction also involves integrating profile analysis with predictive models and incorporating objective HR data.
Conflicts of Interest
The authors declare no conflicts of interest.
References
- Galanis, P. et al.: The quiet quitting scale: Development and initial validation. AIMS Public Health 10(4), 828 (2023). [CrossRef]
- Nowak, M.: Spadek zaangażowania organizacyjnego - ciche i bierne odchodzenie (Decline in organizational engagement - quiet and passive quitting). Polskie Towarzystwo Ekonomiczne, Poznań (2026).
- Marler, J.H., Boudreau, J.W.: An evidence-based review of HR Analytics. The International Journal of Human Resource Management 28(1), 3–26 (2017). [CrossRef]
- Kahn, W.A.: Psychological conditions of personal engagement and disengagement at work. Academy of Management Journal 33(4), 692–724 (1990). [CrossRef]
- Magrizos, S., Aydinliyim, L.E., Roumpi, D., Porter, C.M., Phillips, J.M., Delery, J.E.: The Disquiet of Quiet Quitting: Definitional Clarity, Theoretical Pathways, and Future Research. Human Resource Management (2026).
- Maslach, C., Jackson, S.E.: The measurement of experienced burnout. Journal of Organizational Behavior 2(2), 99–113 (1981). [CrossRef]
- Demerouti, E., Bakker, A.B., Nachreiner, F., Schaufeli, W.B.: The job demands-resources model of burnout. Journal of Applied Psychology 86(3), 499 (2001). [CrossRef]
- Hanisch, K.A., Hulin, C.L.: General attitudes and organizational withdrawal: An evaluation of a causal model. Journal of Vocational Behavior 39(1), 110–128 (1991). [CrossRef]
- Podsakoff, P.M., MacKenzie, S.B.: Impact of organizational citizenship behavior on organizational performance: A review and suggestions for future research. In: Organizational Citizenship Behavior and Contextual Performance, pp. 133–151 (2014). [CrossRef]
- Patel, P.C., Guedes, M.J., Bachrach, D.G., Cho, Y.: A multidimensional quiet quitting scale: Development and test of a measure of quiet quitting. PLoS One 20(4), e0317624 (2025).
- Drela, K.: The quiet quitting phenomenon from a human capital management perspective. Zeszyty Naukowe Politechniki Śląskiej. Organizacja i Zarządzanie (2024).
- Nowak, M., Więcek-Janka, E., Zajkowski, R.: The Impact of Quiet Quitting and Passive Quitting Phenomena on Occupational Burnout (2026).
- Nowak, M., Gigol, T.: Evaluation of the Psychometric Scale of Quiet and Passive Quitting Using an Integrated Approach Combining Structural Equation Modeling and Machine Learning (2026).
- Al Akasheh, M., Malik, E.F., Hujran, O., Zaki, N.: A decade of research on machine learning techniques for predicting employee turnover: A systematic literature review. Expert Systems with Applications 238, 121794 (2024). [CrossRef]
- Meyer, J.P., Stanley, L.J., Vandenberg, R.J.: A person-centered approach to the study of commitment. Human Resource Management Review 23(2), 190–202 (2013). [CrossRef]
- Fraley, C., Raftery, A.E.: Model-based clustering, discriminant analysis, and density estimation. Journal of the American Statistical Association 97(458), 611–631 (2002). [CrossRef]
- McLachlan, G.J., Peel, D.: Finite Mixture Models. John Wiley & Sons (2000).
- Akaike, H.: A new look at the statistical model identification. IEEE Transactions on Automatic Control 19(6), 716–723 (1974). [CrossRef]
Figure 1.
Visualisation of Four Quiet Quitting and Passive Quitting Profiles in Feature Space (PCA).
Figure 1.
Visualisation of Four Quiet Quitting and Passive Quitting Profiles in Feature Space (PCA).
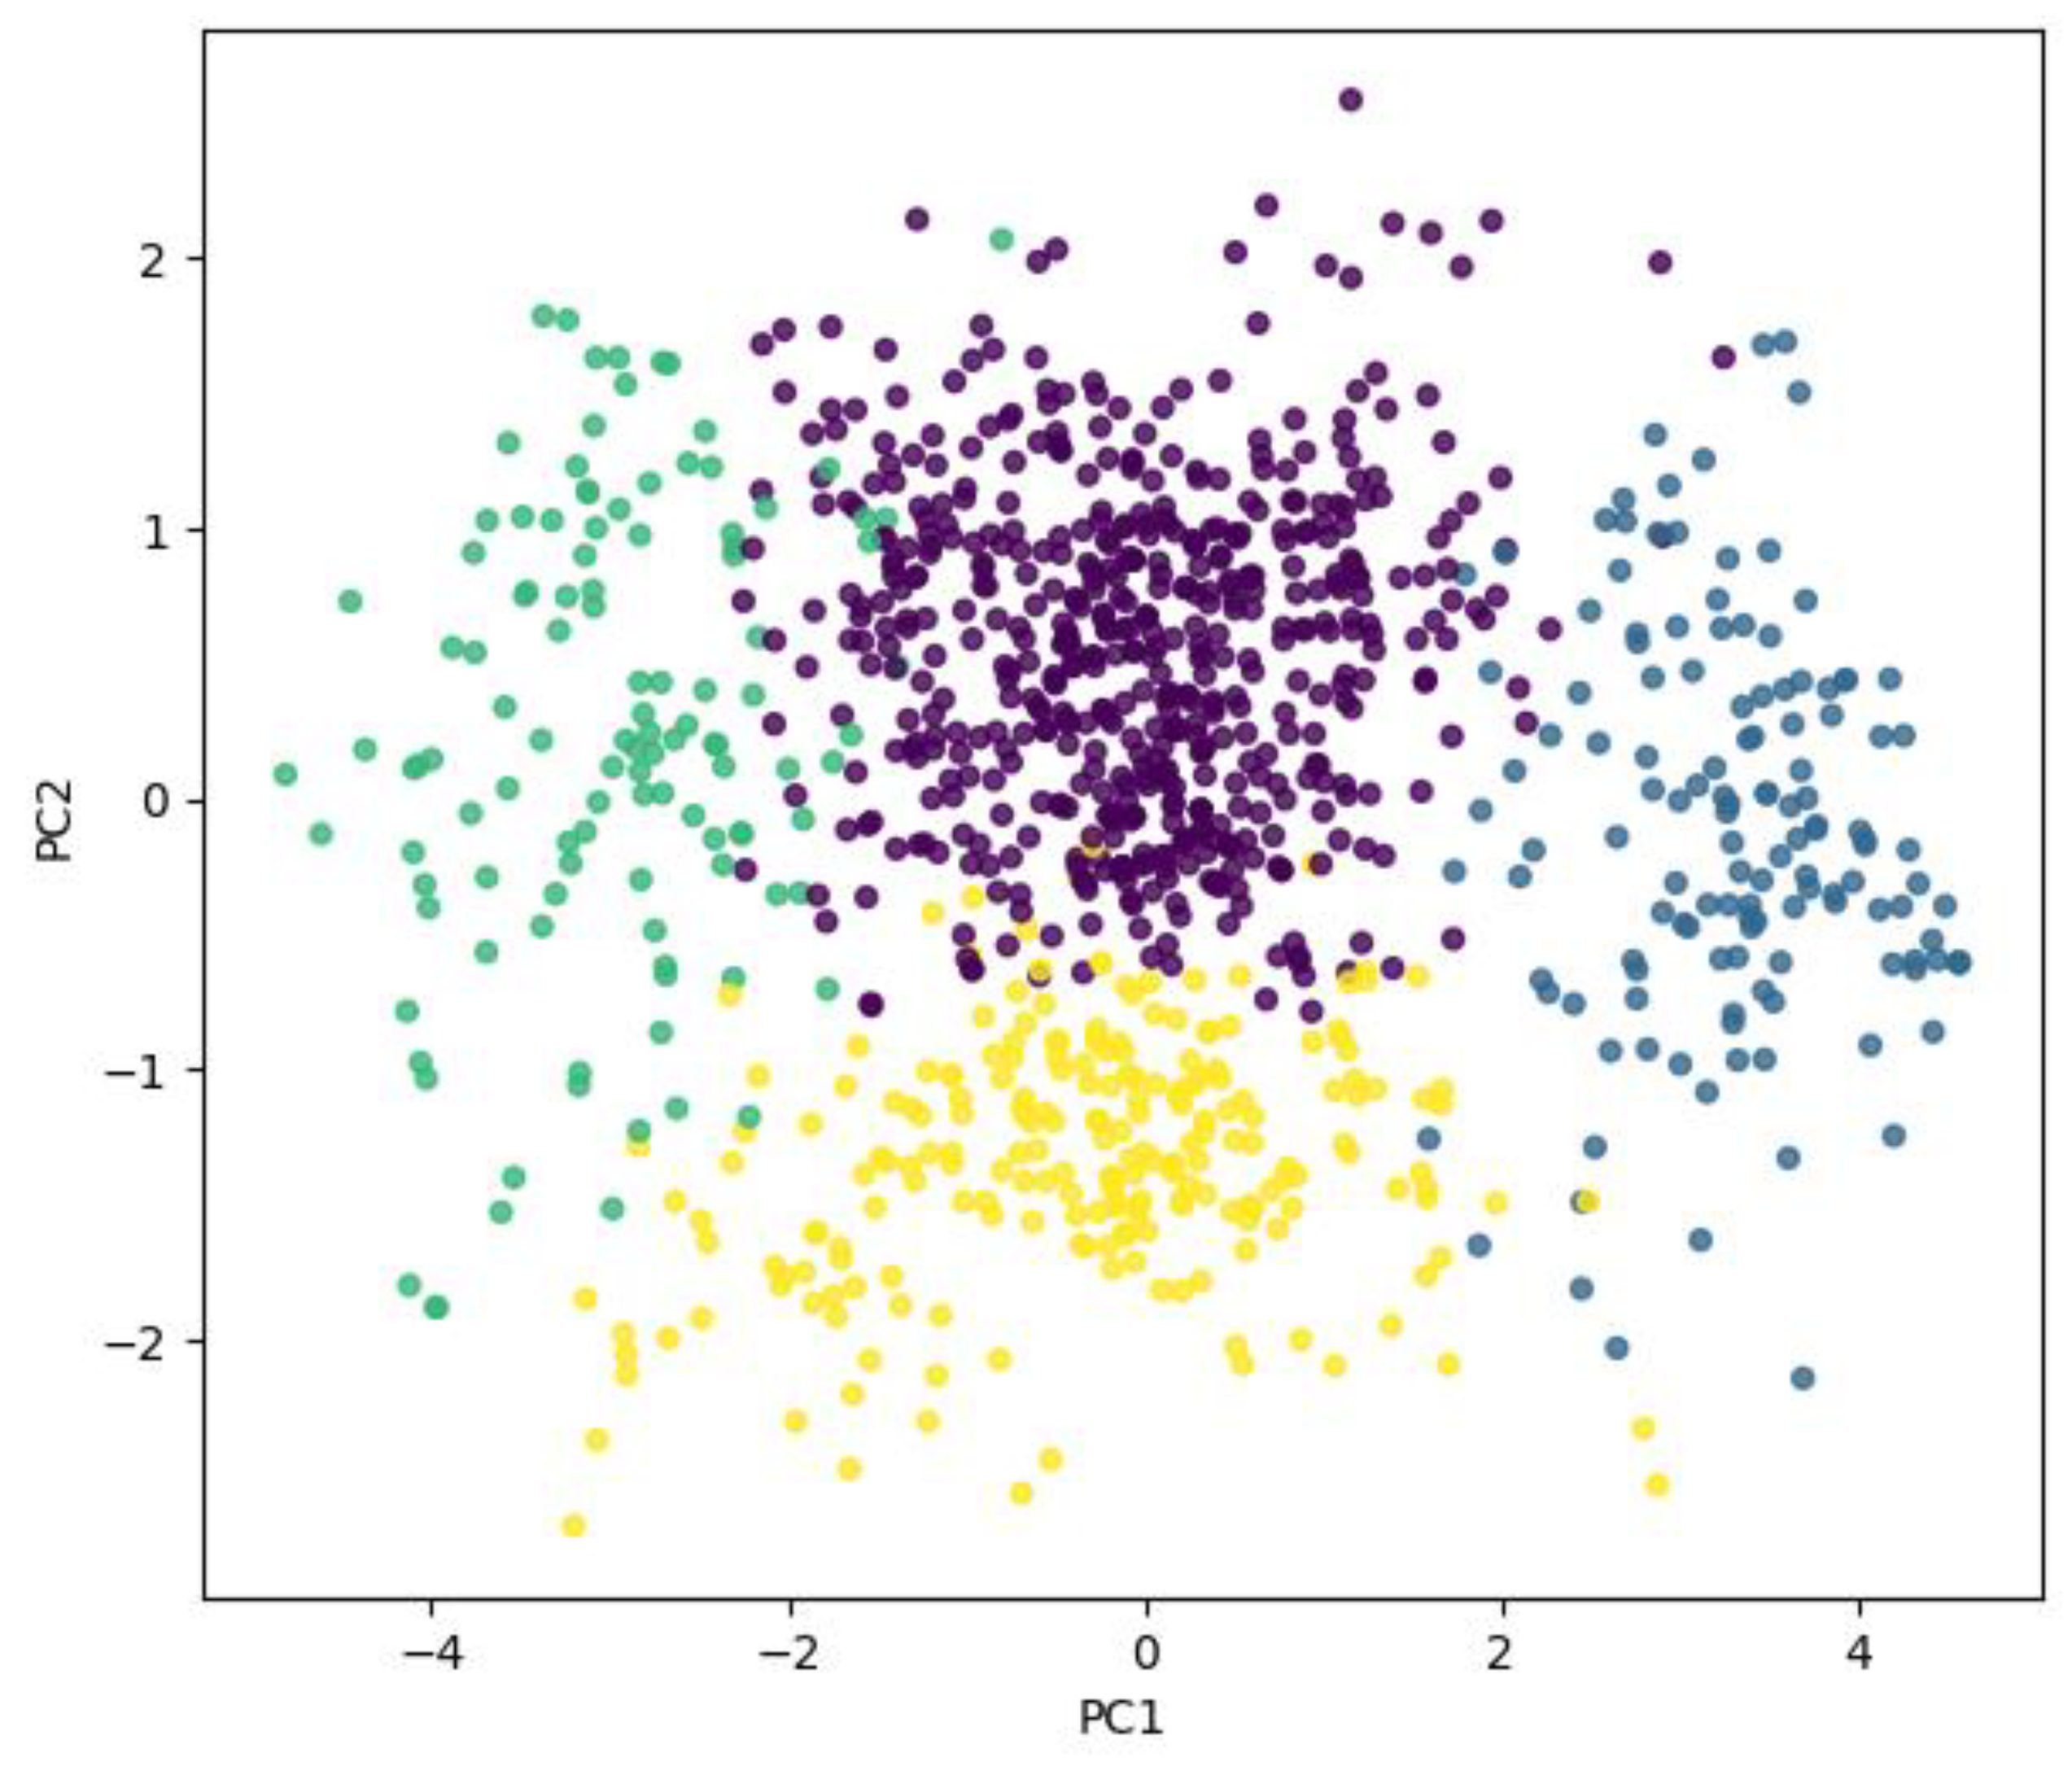

Table 1.
Model comparison – 3D space (TOP 12 models).
| Algorithm | K | Silhouette | Davies–Bouldin | Calinski–Harabasz | BIC | AIC |
|---|---|---|---|---|---|---|
| GMM (spherical) | 4 | 0.344 | 0.953 | 575.47 | 8171.84 | 8077.85 |
| GMM (tied) | 4 | 0.335 | 0.943 | 539.08 | 8149.44 | 8045.56 |
| KMeans | 4 | 0.333 | 0.960 | 593.67 | - | - |
| GMM (diag) | 4 | 0.328 | 0.985 | 535.91 | 8096.98 | 7963.41 |
| Spectral (NN) | 4 | 0.321 | 1.038 | 574.54 | - | - |
| GMM (spherical) | 5 | 0.314 | 0.954 | 508.86 | 8149.99 | 8031.27 |
| KMeans | 5 | 0.311 | 1.008 | 544.47 | - | - |
| GMM (diag) | 6 | 0.309 | 1.011 | 502.21 | 8086.92 | 7884.10 |
| GMM (spherical) | 7 | 0.308 | 1.000 | 517.89 | 8098.38 | 7930.18 |
| GMM (tied) | 6 | 0.305 | 0.938 | 464.28 | 8073.40 | 7929.94 |
| KMeans | 6 | 0.304 | 1.030 | 535.50 | - | - |
| GMM (spherical) | 6 | 0.304 | 0.977 | 501.23 | 8127.59 | 7984.13 |
Table 2.
Model comparison – 5D space (TOP 12 models).
| Algorithm | K | Silhouette | Davies–Bouldin | Calinski–Harabasz | BIC | AIC |
|---|---|---|---|---|---|---|
| GMM (tied) | 4 | 0.285 | 1.117 | 496.29 | 11196.55 | 11008.56 |
| Spectral (NN) | 4 | 0.283 | 1.142 | 556.48 | - | - |
| KMeans | 4 | 0.283 | 1.143 | 583.38 | - | - |
| GMM (tied) | 5 | 0.283 | 1.095 | 447.17 | 11160.26 | 10942.59 |
| GMM (spherical) | 4 | 0.276 | 1.138 | 562.39 | 12169.59 | 12036.02 |
| Agglomerative Ward | 4 | 0.272 | 1.136 | 491.80 | - | - |
| GMM (tied) | 6 | 0.264 | 1.141 | 408.26 | 11123.21 | 10875.86 |
| KMeans | 5 | 0.261 | 1.202 | 534.24 | - | - |
| KMeans | 6 | 0.259 | 1.198 | 496.89 | - | - |
| GMM (diag) | 4 | 0.257 | 1.222 | 546.65 | 11827.22 | 11614.50 |
| Spectral (NN) | 5 | 0.256 | 1.187 | 512.35 | - | - |
| Spectral (NN) | 6 | 0.256 | 1.198 | 479.49 | - | - |
Table 3.
Distribution of profile frequencies.
| Profile | n | % |
|---|---|---|
| Profile 0 | 567 | 54.5 |
| Profile 1 | 134 | 12.9 |
| Profile 2 | 115 | 11.1 |
| Profile 3 | 224 | 21.5 |
Table 4.
Structure of Profile Indicators.
| Profile | PQ | UWES | |
|---|---|---|---|
| Profile 0 | 3.67 | 2.68 | 3.15 |
| Profile 1 | 2.08 | 1.65 | 5.36 |
| Profile 2 | 4.23 | 3.82 | 1.06 |
| Profile 3 | 2.30 | 3.74 | 2.87 |
Disclaimer/Publisher’s Note: The statements, opinions and data contained in all publications are solely those of the individual author(s) and contributor(s) and not of MDPI and/or the editor(s). MDPI and/or the editor(s) disclaim responsibility for any injury to people or property resulting from any ideas, methods, instructions or products referred to in the content. |
© 2026 by the authors. Licensee MDPI, Basel, Switzerland. This article is an open access article distributed under the terms and conditions of the Creative Commons Attribution (CC BY) license (http://creativecommons.org/licenses/by/4.0/).
Copyright: This open access article is published under a Creative Commons CC BY 4.0 license, which permit the free download, distribution, and reuse, provided that the author and preprint are cited in any reuse.


