Submitted:
06 March 2026
Posted:
09 March 2026
You are already at the latest version
Abstract
Precise quantitative determination of Vascular Endothelial Growth Factor (VEGF) in human plasma is critical for pharmacodynamic (PD) evaluation of anti-VEGF therapeutics. In this study, we developed and optimized two immunoassay platforms, including the enzyme-linked immunosorbent assay (ELISA) and the Meso Scale Discovery (MSD), for estimating VEGF. A direct sandwich ELISA was validated to quantify pharmacodynamic biomarker VEGF in human plasma using the Human VEGF Quantikine Kit, demonstrating a quantification range of 62.5–2000.0 pg/mL and a sensitivity of 47.5 pg/mL. In parallel, a sandwich electrochemiluminescence (ECL) assay was developed using the V-PLEX Plus Human VEGF Kit on the MSD platform, achieving a lower quantification range of 7.7–562.0 pg/mL. Comparative analysis revealed that MSD ECL detection with Sulfo Tag labeling outperformed traditional colorimetric ELISA in terms of signal amplification and dynamic range, making it a valuable tool for PD biomarker analysis. Findings underscore the importance of early platform selection to ensure robust, fit-for-purpose biomarker quantification for clinical pharmacology studies and regulatory submissions.
Keywords:
pharmacodynamic
; biomarker
; VEGF
; ELISA
; ECL
1. Introduction
Biomarkers play a vital role in drug development, guiding decisions on disease progression, treatment efficacy, and safety. Their precise quantitative analysis enables informed choices across all stages of development [1]. Suitable pharmacodynamic (PD) biomarkers are utilized in a biosimilar development program to demonstrate that there are no clinically meaningful differences from the reference product, potentially replacing traditional comparative efficacy studies [2].
Vascular Endothelial Growth Factor (VEGF) belongs to a gene family comprising six structurally related proteins that regulate the growth and differentiation of blood and lymphatic vessels. Among these, VEGF-A is the most extensively studied and exists as a homodimeric glycoprotein composed of two 23 kilodalton subunits. The human VEGF-A gene consists of eight exons and undergoes alternative splicing to produce four major isoforms: VEGF121, VEGF165, VEGF189, and VEGF206. These isoforms differ in their heparin-binding properties and extracellular matrix localization, with VEGF165 being the predominant and most biologically active form, which exerts its effects by binding to VEGFR1 and VEGFR2 receptors on vascular endothelial cells. VEGF plays a crucial role in vasculogenesis during embryogenesis and contributes to pathological processes, including tumor angiogenesis, vascular permeability, and autoimmune disease progression, making it a key target for therapeutic intervention [3]. PD assays for the potential biomarker VEGF demonstrate comparable efficacy among anti-VEGF agents, such as Bevacizumab, Ranibizumab, and Aflibercept, during dose optimization and biosimilar development.
Several analytical techniques have been developed for the quantifying VEGF in biological matrices [4,5,6,7,8,9,10]. Immunoassay-based platforms remain the cornerstone for VEGF measurement in clinical and preclinical studies. Among these, enzyme-linked immunosorbent assay (ELISA) is widely employed due to its simplicity and accessibility. Nevertheless, matrix effect can compromise ELISA performance, restrict dynamic range, and interfere with anti-VEGF drugs, leading to underestimation of VEGF concentrations in treated patients [5,6,8]. While ultrasensitive immunoassays and aptamer-based biosensors have been explored [1,4,7], these approaches often lack standardization, involve complex workflows, and are not routinely validated for use in regulated environments. Similarly, pharmacokinetic modeling studies [9,10] provide insights into VEGF-drug interactions but do not address the need for robust, fit-for-purpose PD assays. Recent advancements in electrochemiluminescence (ECL) technology, exemplified by the Meso Scale Discovery (MSD) platform, offer enhanced sensitivity, broader dynamic range, and reduced sample volume compared to conventional Horseradish Peroxidase (HRP)-based colorimetric ELISA. Despite these advantages, comparative evaluations of ELISA and MSD for VEGF quantification in plasma remain limited, particularly in the context of biosimilar development, where regulatory compliance and assay reproducibility are critical. Challenges such as matrix interference, limited sensitivity, and assay performance variability necessitate the evaluation and optimization of multiple immunoassay platforms to ensure reliable and reproducible results.
Although multiple commercial immunoassay kits are available for VEGF quantification, their performance can vary significantly depending on matrix type, assay conditions, and intended application. Therefore, it is critical to assess and optimize these kits to meet the stringent requirements of clinical and regulatory applications. In biosimilar development, regulatory expectations impose the establishment of fit-for-purpose PD assays that are rigorously validated for sensitivity, specificity, and reproducibility in clinically relevant matrices.
The present study addresses these gaps by developing and validating a direct sandwich ELISA for VEGF quantification in human plasma and optimizing a sandwich ECL assay on the MSD platform using the relevant, well-characterized, and ready to use commercial kits. Both methods were systematically compared for sensitivity, dynamic range, and throughput using standardized protocols and quality control measures. This is the first study to present a direct comparison between these two commercial kits, offering valuable insights for PD assay developers and regulatory strategists involved in biosimilar development. This work provides a comprehensive assessment of immunoassay platforms for VEGF PD biomarker analysis, supporting informed platform selection in clinical pharmacology and regulatory submissions.
2. Material and Methods
2.1. Instruments
ELISA employed the Synergy H1 multimode Microplate reader for absorbance readings, and the BioTek ELISA Microplate washer was employed for washing of the plates. MesoTM Sector S 600 Micro plate Reader used for ECL signal detection in MSD assays.
2.2. Reagents and Chemicals
Recombinant Human VEGF (CR08) sourced from R&D Systems was used for VEGF quantification. PBS (Phosphate-buffered saline) tablets and BSA (Bovine serum albumin) were used for in-house diluent preparation and were supplied by Sigma. Normal human plasma was sourced from Darpan Diagnostic Research Centre. The Human VEGF Quantikine ELISA kit, sourced from R&D Systems, included components such as a Human VEGF 96-well Microplate, Assay Diluent (RD1W), Anti-human VEGF Conjugate, Wash Buffer (25X), Color Reagent A, Color Reagent B, Stop Solution, and Human VEGF Standard.
V-PLEX Plus Human VEGF-A Kit from MSD involved components Human VEGF small spot 96 well plate pre-coated with mouse monoclonal capture antibody, 50X SULFO-TAG Anti-hu VEGF detection Antibody, Cytokine Panel 1 (human) Calibrator Blend, Diluent 43, Diluent 3, MSD Read Buffer T, Plate Seals, Wash Buffer (20X), 100mL, Cytokine Panel 1 (human) Control 1- 472 pg/mL, Control 2- 143 pg/mL and Control 3- 49.6 pg/mL. Refer to Table 9 for a detailed summary of antibody pairing and reagent usage across assay formats.
2.3. Procedures
2.3.1. Preparation of Solutions
All buffers used in the experiments were either provided in the commercial kit or prepared in-house. The washing buffer was prepared by diluting 8 mL of 25X concentrated wash buffer supplied in the kit with 192 mL of Milli-Q water to make 200 mL of 1X washing buffer. The substrate solution was freshly prepared by mixing equal volumes of Color Reagent A and Color Reagent B (1 mL each) to yield a total volume of 2 mL substrate solution. Additionally, the capture PBS buffer was prepared by dissolving one PBS tablet in 200 mL of Milli-Q water. The Assay buffer contained 1 g of BSA dissolved in 100 mL of capture PBS buffer.
The washing buffer (1X) was prepared by diluting 15 mL of 20X concentrated wash buffer provided in the kit with 285 mL of Milli-Q water to make 300 mL of 1X washing buffer. Alternatively, PBS+0.05% Tween-20 was evaluated during the optimization process. Diluent 3, supplied as part of the MSD kit, was used for reconstituting and diluting the detection antibody. Diluent 43 was used for the dilution of plasma samples and calibrators at a 2-fold dilution. Read Buffer T (2X) was prepared by mixing 10 mL of 4X Read Buffer T and 10 mL of deionized water to obtain 20 mL of 2X working solution. Read Buffer T is a Tris-based buffer containing TPA as a co-reactant for light generation in ECL immunoassays. Detection Antibody (1X) was prepared by mixing 0.060 mL of SULFO-TAG Anti-hu VEGF-A Ab (50X) and 2.940 mL of Diluent 3 to get 3 mL of 1X Detection Antibody. Ten recombinant human proteins, in diluent, buffered, and lyophilized, were supplied. The standard curve included eight VEGF concentrations: 1080, 270, 67.5, 16.9, 4.22, 1.05, 0.264, and 0.00 pg/mL, corresponding to standards STD 01 through STD 08, respectively.
2.3.2. ELISA Methodology for VEGF Quantification [11,12]
The colorimetric sandwich ELISA was performed using the Human VEGF Quantikine ELISA Kit, which employs a 96-well microplate pre-coated with a monoclonal antibody specific for Sf21-expressed recombinant human VEGF. Each well received 100 µL of assay diluent (RD1W, a buffered protein base), followed by 100 µL of plasma sample, calibrator, or control in duplicate. The plates were covered and incubated for 2 hours at 25 ± 3 °C. After incubation, wells were washed three times with 300 µL of 1X wash buffer (containing 2 mM imidazole, 160 mM NaCl, 0.02% Tween 20, and 0.5 mM EDTA) to remove unbound material. Subsequently, 200 µL of HRP-conjugated polyclonal anti-human VEGF antibody was added to each well, and the plate was incubated for an additional 2 hours at 25 ± 3 °C. A second wash was performed to eliminate unbound detection antibody, followed by the addition of 200 µL of Tetramethylbenzidine (TMB) substrate solution. Plates were incubated for 30 ± 2 minutes at 25 ± 3 °C, during which a blue color developed in proportion to the amount of VEGF present. The reaction was stopped by adding 50 µL of stop solution to each well, changing the color to yellow. Absorbance was measured at 450 nm with a reference wavelength of 570 nm within ten minutes of adding the stop solution.
2.3.3. ECL Methodology for VEGF Quantification [13,14]
A sandwich ECL immunoassay was performed using a high-binding carbon electrode 96-well small spot plate (MSD V-PLEX) pre-coated with a monoclonal capture antibody specific for human VEGF-A. The plate was washed three times with 150 µL/well of phosphate-buffered 1X wash solution containing surfactant. Subsequently, 50 µL of prepared plasma samples, calibrators, or controls were added to each well and incubated at room temperature (20–26 °C) with shaking at approximately 700 rpm for 2 hours. After incubation, plates were washed, and 25 µL of anti-human VEGF-A detection antibody conjugated with SULFO-TAG, a ruthenium-based electro chemiluminescent label, was added to complete the sandwich complex. Plates were sealed and incubated under identical conditions for an additional 2 hours, followed by a final wash. Afterwards, 150 µL of 2X Read Buffer T was added to each well to drive the electro chemiluminescent redox reaction. The plates were immediately analyzed using an MSD instrument, which applied voltage to the electrode surface, generating excited states of the ruthenium complex. The relaxation of these excited states produced photon emission (~620 nm), which was captured by a charge-coupled device camera, yielding a signal proportional to VEGF-A concentration.
2.3.4. Validation Parameters of Sandwich ELISA
The sandwich ELISA method developed for quantifying VEGF in human plasma was validated using the Human VEGF Quantikine ELISA kit. Validation was conducted in accordance with regulatory guidelines and scientific considerations [15,16,17,18,19,20,21], encompassing key performance parameters including accuracy, precision (intra- and inter-assay), parallelism, MRD, and sensitivity. These assessments were performed to ensure the reliability, reproducibility, and suitability of the assay for clinical sample analysis.
2.3.4.1. Screening of Individual Plasma Samples
Human plasma samples containing sodium citrate as an anticoagulant were used as the biological matrix for the development of the VEGF assay. A total of 33 individual plasma lots were initially screened to determine endogenous VEGF levels using the validated ELISA method.
2.3.4.2. Data Analysis and Calibration Curve
All the intermediate stock solutions for calibration standards and quality control samples were prepared. The Calibration curve and Quality control samples were prepared freshly by spiking an appropriate volume of VEGF in assay buffer and processed during validation. Linearity was determined by plotting a curve of optical density (OD) versus nominal concentrations. The standard calibration curve consisted of a blank and eight non-zero standards, including two anchor points, one above upper limit of quantification (ULOQ) and one below lower limit of quantification (LLOQ). A calibration curve was generated using a Non-Linear 4 Parameter Logistic (PL) regression model with a weighing factor 1/y2. Data was analyzed using the Synergy H1 Microplate reader using GEN5TM (version: 2.09 Secure) Software. The concentration of Calibrators within the quantifiable range should be between 80% and 120% of nominal concentration. For the LLOQ and ULOQ, the concentration should be between 75% and 125% of the nominal concentration. The precision measured as the percent coefficient of variation (% CV) between duplicates of each calibrator should be ≤20%. For the LLOQ and ULOQ, the precision should be ≤ 25%. No such acceptance criteria are applicable for anchor points, however anchor points may be masked (i.e., to improve curve fit) with appropriate justification.
2.3.4.3. Accuracy and Precision in Assay Buffer
Inter-run and intra-run precision and accuracy values were determined across six precision and accuracy runs by analyzing six replicates of QC (Quality Control) samples prepared in Assay buffer at five concentration levels upper limit of quantification quality control (ULOQQC), High Quality Control (HQC), Medium Quality Control (MQC), Low Quality Control (LQC), and lower limit of quantification quality control (LLOQQC) in each run. The accuracy of the assay was defined as the ratio of back-calculated mean values of the quality control samples to their respective nominal values. Precision was measured as the % CV over the concentration range of quality control samples during the validation. The back-calculated concentrations, obtained by averaging duplicate values, were considered for reporting. This experiment was conducted to assess the accuracy and precision in the assay buffer. The inter-run and intra-run precision (% CV) for LQC, MQC, and HQC samples should be ≤20% and ≤25% for ULOQQC & LLOQQC. The inter-run and intra-run accuracy & %Bias were between 80-120% & ± 20% for LQC, MQC, HQC, and between 75-125% & ± 25% for ULOQQC & LLOQQC. Total error (% TE) must be ≤ 30% for LQC, MQC, HQC, and ≤ 40% for LLOQQC and ULOQQC.
2.3.4.4. Accuracy and Precision for Plasma Samples
Accuracy and Precision of endogenous VEGF levels in pooled plasma samples (PM-01 and PM-02) were assessed over six runs conducted on four separate days. Fresh VEGF calibration standards were prepared in Assay Buffer. Pooled matrix samples were diluted at the selected MRD with a 4-fold dilution in Assay Buffer.
2.3.4.5. Parallelism Evaluation
Parallelism was performed to demonstrate that the sample dilution-response curve was parallel to the standard concentration-response curve. It is an indicator that the interaction of the assay’s critical reagents with the standard calibrator material and the analyte of interest in the samples is similar, and that the assay is therefore suitable for measuring the analyte. Ten individual human plasma samples were serially diluted in Assay Buffer till they crossed the analytical range below LLOQ using dilution factors ranging from 1 (undiluted) to 1:32. VEGF concentrations were back calculated at each dilution level to assess parallelism and confirm the assay’s ability to maintain linearity across the dilution range.
2.3.4.6. Minimal Required Dilution
The lowest dilution at which at least 80% of samples have accuracy between 80% and 120% is selected as the MRD for individuals and future sample analysis.
2.3.4.7. Sensitivity
The highest back-calculated concentration from the selected MRD of all individuals will be the sensitivity of the method.
2.3.4.8. Stability Experiments
Stability for the endogenous Pooled matrix PM-01 and PM-02 of VEGF was determined by comparing the mean of back-calculated concentrations of the samples under various stability conditions with those of freshly retrieved comparison pooled matrix samples of PM-01 and PM-02.
2.3.5. Study Sample Collection and Analysis
The validated ELISA method was applied to quantify VEGF concentrations in 147 human plasma samples collected for PD evaluation from 20 subjects enrolled in an open-label, prospective clinical study to explore PK, PD, safety and efficacy of Bevacizumab (BVZ) intravitreal injection in wet AMD (Age-related Macular Degeneration) patients. Each patient received three intravitreal injections of different doses of BVZ (1.25 mg, 1.00 mg or 0.75 mg based on body weight groups) in the study eye on Day 1, Day 30, and Day 60. Blood samples for systemic VEGF level assessment were collected at the following points: Day 1 (pre-dose and 3 hours post-dose), Day 3, Day 7, Day 15, Day 30, Day 60 (pre-dose and 3 hours post-dose), Day 67, and Day 90. Plasma was separated into two aliquots and stored at -80 °C. Days 3, 15, and 67 were optional and not collected for all subjects. Pre-dose samples established baseline VEGF levels, while post-dose samples assessed systemic VEGF changes following treatment.
Plate Layout consisted of a Blank, Calibration curve, and subject samples with at least two sets of QC samples in buffer, along with PM-01 & PM-02 samples (pooled during Method Validation) in each plate. All the samples for each subject were analyzed in duplicate, and each time point for the subject was analyzed consecutively in the same analytical run (Plate) to minimize the effect of variation within subject samples.
3. Results
3.1. ELISA Optimization for VEGF
The ELISA-based PD assay configuration for the Direct Sandwich ELISA was optimized for measuring free VEGF-A 165 in human plasma using the Quantikine Human VEGF immunoassay Kit. Optimization focused on different concentrations of the Diluent, Stop Solution, and Wash Buffer provided in the Manufacturer’s Kit and prepared in-house to enhance assay sensitivity and reproducibility. Modifications to the manufacturer’s protocol were made to strengthen signal-to-background ratios and improve overall assay performance.
3.1.1. Standard and Dilution Optimization
The recombinant Human VEGF (CR08) from R&D Systems was used to evaluate the assay’s linearity (tested from 15 to 2600 pg/mL) and the optimum dilution factor. Sixty individual plasma lots were screened to determine the endogenous VEGF concentration, which ranged from 9.1 to 749.2 pg/mL, with an average of 257.0 pg/mL. Eighteen lots showed concentration greater than 300.0 pg/mL. Various MRD of plasma samples were tested at 1:2, 1:4, 1:8, 1:16, and 1:32. The final VEGF concentration in the well was 62.5–2000.0 pg/mL. The optimal dilution was identified as 1:4, which provided the best balance between signal intensity and background reduction.
3.1.2. In-House Diluent Composition
The in-house assay buffer, 1% BSA in PBS, was evaluated against the manufacturer’s diluents. The in-house buffer demonstrated comparable performance in maintaining signal consistency across replicates and was used for further optimization experiments.
3.1.3. Stop Solution and Wash Buffer Optimization
The stop solution provided in the commercial kit was compared with an in-house 2N sulfuric acid solution. Preliminary trials confirmed that its kit-provided stop solution effectively halted the colorimetric reaction without overshooting the signal and was therefore selected for the final protocol. For the wash buffer, the manufacturer supplied a 25X wash buffer, and a freshly prepared PBS + 0.5% Tween 20 solutions were evaluated. The kit buffer diluted to 1X (using Milli-Q water) showed consistent performance and was adopted for the method.
These minor modifications, comprising adjustments to buffer composition, optimization of dilution factors, and refinement of wash conditions, contributed to an improved signal-to-noise ratio and enhanced assay precision, ensuring compliance with regulatory validation requirements.
3.2. MSD ECL Assay Optimization for VEGF
The MSD sandwich immunoassay was optimized using the V-PLEX Plus Human VEGF Kit, which employs ECL detection for enhanced sensitivity and dynamic range. The platform’s ECL system, combined with optimized read buffers, enabled low background and high signal stability. Optimization focused on critical parameters, including diluent selection, shaking speed, and calibration curve generation. The final protocol utilized a shaking speed of 700 rpm and a minimum required dilution (MRD) of 2, ensuring accurate quantification across a broad range of concentrations.
The MSD assay achieved a validated quantification range of 7.7–562 pg/mL, supporting detection of low-abundance VEGF levels. Serial dilution factors of 2, 4, 8, 16, 32, 64, 128, 256, 512, and 1024 were evaluated to confirm linearity and precision across the dynamic range. A representative calibration curve is shown in Figure 1, demonstrating the non-linear 4-parameter logistic (4PL) regression model applied for data fitting. These optimizations collectively improved assay reproducibility and sensitivity, aligning with the platform’s capability for biomarker analysis in complex clinical studies.
This figure illustrates the standard curve generated using the MSD platform for VEGF quantification. The curve demonstrates the electro chemiluminescent signal response across the calibration range (0.264–1080 pg/mL), confirming assay linearity and sensitivity.
3.3. Validation Results of the ELISA for VEGF
3.3.1. Screening of Individual Plasma Samples
VEGF concentrations across 33 lots ranged from 70.9 pg/mL to 783.2 pg/mL with mean of 335.6 pg/mL. Based on this screening, plasma lots with high VEGF levels were pooled to create two distinct plasma batches for further validation experiments. Pool PM-01 was prepared from biological matrix lot numbers BM-20-1091 (783.2 pg/mL), BM-20-1137 (649.2 pg/mL), and BM-20-1140 (752.2 pg/mL); Pool PM-02 comprised BM-20-1113 (414.1 pg/mL) and BM-20-1150 (432.1 pg/mL). Additionally, ten individual plasma lots exhibiting high VEGF levels were selected for parallelism evaluation, MRD assessment, and sensitivity testing. Two lots (BM-20-1091 and BM-20-1113) were chosen to perform the further validation activities after performing an accuracy and precision run.
3.3.2. Calibration Curve (Linearity)
Eight-point calibration curves, including anchor points, were plotted within the range from 62.5 to 2000.0 pg/mL for VEGF. Nineteen accepted calibration curves were analyzed in this range. Back-calculated concentrations of VEGF in calibration standards were determined by taking the mean of each duplicate value for each standard calculated for the run. The 4PL fit of the calibration curve of VEGF was observed to be sigmoidal, as shown in Figure 2. The results for freshly prepared calibrators, analyzed across multiple runs are presented in Table 1. This table presents the performance metrics of calibration standards used in the VEGF ELISA assay. These results confirm the assay’s reproducibility and accuracy across the dynamic range of 62.5–2000 pg/mL.
3.3.3. Accuracy and Precision in Assay Buffer
The intra-run and inter-run accuracy and precision results are summarized in Table 2 and Table 3, respectively. QC levels with intra-run % CV, accuracy, and bias demonstrate repeatability of the ELISA assay. Inter-assay precision is expressed as % CV, accuracy as % Bias relative to nominal concentrations, and % TE as the sum of absolute bias and precision. All values were within the predefined acceptance criteria, confirming the assay’s reliability under buffer conditions.
3.3.4. Accuracy and Precision for Plasma Samples
Upper Accuracy limit for endogenous levels of Plasma samples for PM-01 and PM-02 was 118.66. The lower accuracy limit for endogenous levels of Plasma samples for PM-01 and PM-02 was 81.34. Results for each plasma sample are presented in Table 4. All results fell within this range, indicating consistent assay performance in the plasma matrix.
3.3.5. Parallelism Evaluation
The results demonstrate consistent recovery and proportional decrease in measured concentrations with increasing dilution, supporting the validity of the assay for quantifying endogenous VEGF across a broad dynamic range. Dilution linearity was maintained until concentrations fell below the LLOQ, confirming the assay’s sensitivity and robustness in the plasma matrix. Figure 3 represents the Parallelism of VEGF Quantification across Dilution Factors.
Back-calculated VEGF concentrations (pg/mL) for ten individual plasma samples at serial dilutions (1 to 1:32) demonstrate proportional decrease and confirm assay linearity.
3.3.6. Minimal Required Dilution
MRD was determined using parallelism data from ten individual plasma samples serially diluted in Assay Buffer. Accuracy was calculated at each dilution level relative to the concentration observed at 4-fold dilution, considered as the nominal (100%) reference. Dilution factors ranging from 1 (neat) to 1:32 were assessed for each plasma lot. Accuracy values between 80% and 120% were considered acceptable. Among all dilution levels, the 4-fold dilution consistently demonstrated the least deviation and highest compliance with acceptance criteria across individual samples. Therefore, a 4-fold dilution was selected as the MRD for clinical sample analysis to ensure reliable quantification of VEGF within the validated analytical range. Results are presented in Table 5.
3.3.7. Sensitivity
Sensitivity was assessed using Parallelism data. At the selected MRD, 4-fold dilution, when considering the concentration as nominal (100%), it was found that at the 16-fold dilution, the % accuracy for all ten lots ranged from 80–120%, except one plasma lot. “Common dilution method” was employed whereby the greatest dilution, i.e., 16-fold, at which all individual samples produced a parallel response was identified. The highest concentration observed at 16-fold dilution is set as the sensitivity of the endogenous VEGF level. Results are presented in Table 6. The selected sensitivity for the endogenous concentration of VEGF in human plasma is 47.5 pg/mL which will be used for analyzing clinical samples.
3.3.8. Stability Experiments
The % CV between the duplicates for each plasma sample was ≤20%. The % accuracy at each plasma sample was between 81.34% and 118.66%. The % Difference at each QC level, HQC and LQC, was between ±20%. Stability is acceptable as 2 out of the 3 sets at each plasma sample met above acceptance criteria. The stability, expressed as a % difference, is presented in Table 7.
3.4. Application of Validated Sandwich ELISA
The validated Quantikine colorimetric sandwich ELISA method was applied to quantify systemic free VEGF concentrations in human plasma samples collected during a clinical study. Measured concentrations for each subject were calculated using the calibration curve generated during analysis and tabulated against scheduled time points (Table 8). The calibration curve range was adequate for quantifying the study samples, and quality control coverage was ensured through the inclusion of HQC, MQC, LQC, and parallel monitoring samples (PM-01 and PM-02) in each analytical run.
A total of 147 plasma samples were analyzed across eight runs, including repeat analysis. The calibration curve demonstrated acceptable accuracy and precision across the validated range, confirming suitability for clinical sample analysis. The primary objective was to evaluate the potential systemic VEGF inhibition resulting from systemic exposure following intravitreal administration of BVZ. VEGF concentrations were reported for all subjects and time points; these values will serve as the basis for subsequent pharmacodynamic calculations.
Table summarizes VEGF plasma concentrations in pg/mL obtained after administering three intravitreal injections of different doses of BVZ in the study eye on Days 1, 30, and 60 in wet AMD patients (n=20) including instances of BLQ= below limit of quantification (Sensitivity 47.5 pg/mL), which were common at later time points, consistent with expected VEGF suppression.
4. Discussion
4.1. Strategy and Design for Assay Development
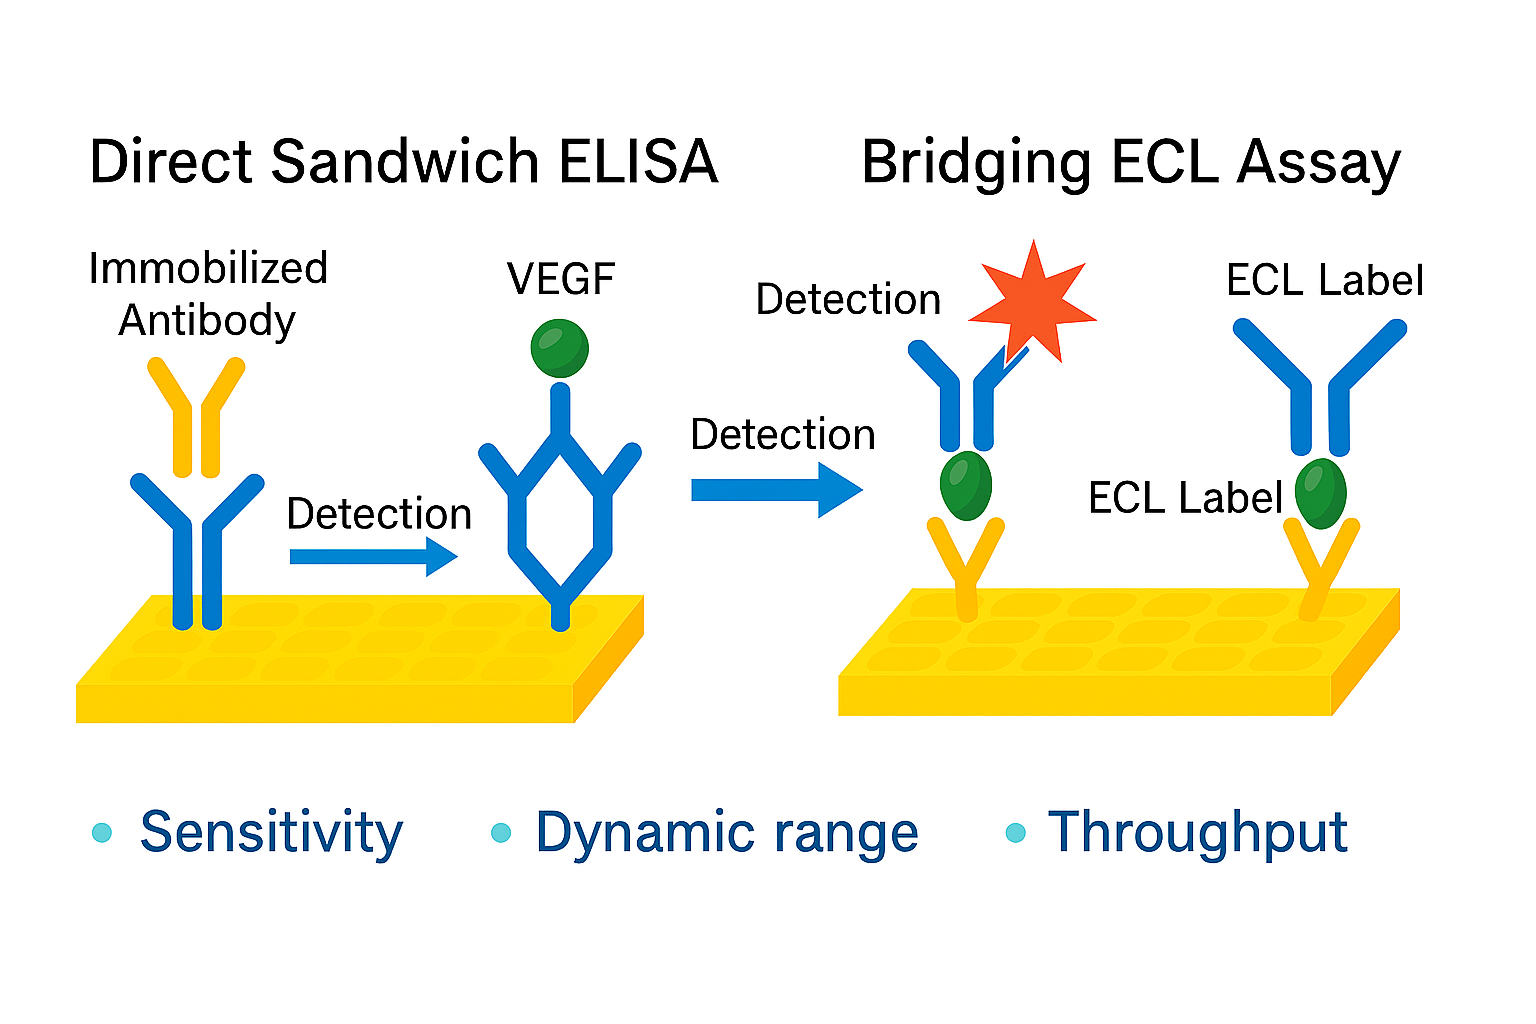
The development of PD biomarker assays for VEGF quantification was approached using both ELISA and MSD platforms, integrating commercially available kits and in-house optimization to ensure assay sensitivity, specificity, and reproducibility. Both platforms relied on validated commercial kits that provided standardized reagents and protocols, facilitating consistency across laboratories. However, customized validation was essential to ensure assay reliability for biosimilar evaluation [22]. This dual-platform approach was strategically selected to provide robust performance across diverse clinical and analytical contexts. The ELISA method employed a quantitative sandwich immunoassay format, where VEGF in the sample was captured between a pre-coated monoclonal antibody and an enzyme-linked polyclonal detection antibody, resulting in a colorimetric signal. ELISA was chosen for its reliability, cost-effectiveness, and adaptability in routine bioanalytical workflows. In parallel, the MSD platform was selected for its advanced ECL detection technology, which offers superior sensitivity and dynamic range [23]. The rationale for including MSD was to explore its potential for detecting VEGF at lower concentrations, supporting informed selection for clinical and regulatory requirements.
For this study, the Quantikine Human VEGF ELISA kit (R&D Systems) was selected because it is widely recognized as the gold standard for VEGF measurement, offering well-characterized performance, regulatory acceptance, and compatibility with plasma matrices. Its established use in clinical and translational research ensures reliability and comparability with existing literature. In parallel, the MSD V-PLEX Plus Human VEGF kit was selected for its advanced ECL technology, which offers superior sensitivity, a broader dynamic range, and reduced sample volume compared to conventional colorimetric ELISA. The MSD platform also supports multiplexing capabilities, enabling efficient biomarker analysis in complex clinical studies. Together, these kits represent two distinct and widely adopted technologies, allowing a robust comparative evaluation of traditional ELISA versus ECL-based immunoassays for pharmacodynamic biomarker quantification.
4.2. Comparative Assessment of PD Assays Developed for VEGF
A comparative evaluation of the ELISA and MSD platforms was conducted to assess their suitability for VEGF quantification in human plasma. Both assays used sodium citrate-treated plasma and recombinant VEGF (CR08) as the standard. MSD provided enhanced analytical sensitivity as expected due to ECL detection compared to the colorimetric signal measured with ELISA. This comparative analysis highlights the strengths of each platform. ELISA offers a cost-effective and scalable solution for routine PD analysis, while MSD is better suited for low-abundance detection in early-phase or specialized clinical studies. Key assay parameters are summarized in Table 9 to guide the selection of assays based on clinical study needs.
The comparative evaluation of ELISA and MSD platforms for VEGF quantification highlights fundamental differences in sensitivity, dynamic range, and operational parameters that influence platform selection for PD studies. Both assays employ a sandwich immunoassay format but differ in detection chemistry: ELISA uses enzyme-linked colorimetric detection, whereas MSD employs ECL, leveraging ruthenium-based SULFO-TAG labels triggered by an electrical stimulus in the presence of tripropylamine (TPA). This technological distinction underpins the superior analytical performance of MSD. The validated ELISA method achieved a quantification range of 62.5–2000 pg/mL.
In contrast, MSD demonstrated a markedly lower quantification range (7.7–562 pg/mL) and vendor-reported LLOD of 1.12 pg/mL, aligning with published studies [24,25] that emphasize ECL’s ability to detect low-abundance biomarkers with high precision. This enhanced sensitivity is crucial for PD studies, where systemic VEGF levels may drop below conventional ELISA detection limits following anti-VEGF therapy. Both platforms require approximately 5 hours for assay completion; however, MSD’s multiplexing capability offers scalability for simultaneous measurement of multiple angiogenic biomarkers, improving efficiency in complex PD studies. Both assays employed non-linear 4PL regression with a 1/Y² weighting factor, ensuring accurate curve fitting across wide concentration ranges. MSD’s broader dynamic range (up to 1080 pg/mL) provide flexibility for samples with variable VEGF expression, reducing the need for repeat dilutions.
Study objectives should guide the choice between ELISA and MSD. ELISA remains a cost-effective, regulatory-accepted option for routine PD analysis when VEGF concentrations are expected to be within mid-range levels. Conversely, MSD is advantageous for studies requiring high sensitivity, low sample volume, and multiplexing, particularly in biosimilar development and clinical scenarios involving VEGF suppression. ECL technology has been increasingly adopted for biomarker quantification due to its low background noise, multiple excitation cycles, and decoupling of signal from stimulation, which collectively enhance assay robustness. Our findings corroborate literature reports that MSD assays outperform conventional ELISA in detecting VEGF at sub-picogram levels, supporting its application in pharmacodynamic monitoring and immunogenicity assessments.
5. Conclusions
This study advances the field of bioanalytical assay development by presenting a comparative evaluation of two distinct VEGF pharmacodynamic assay platforms, Quantikine sandwich ELISA and MSD V-PLEX ECL assay, optimized for use in human plasma. The validated ELISA demonstrated robust sensitivity within the regulatory bioanalytical framework and was successfully applied to the analysis of clinical samples. In contrast, the MSD assay achieved higher sensitivity, offering a promising solution for studies that require ultra-sensitive detection. Compared to conventional approaches, this dual-platform strategy provides a practical framework for assay selection tailored to study-specific needs, striking a balance between sensitivity, cost efficiency, and regulatory compliance.
Limitations and Future Directions
Only the ELISA method was fully validated and applied to clinical sample analysis, while the MSD assay was optimized but not validated to the same extent. The cost and accessibility of MSD technology may also limit its widespread adoption in routine workflows. Future work should focus on the full validation of the MSD assay, the inclusion of plasma samples from patients undergoing anti-VEGF therapy to evaluate potential interference and leveraging MSD’s multiplexing capability for the simultaneous quantification of VEGF and related angiogenic biomarkers. Comparative studies with external reference methods and clinical correlation will further strengthen translational relevance and regulatory acceptance.
Author Contributions
Conceptualization, Vikas Chandnani; Data curation, Sandeep Jagtap; Formal analysis, Amol Pawar; Investigation, Amol Pawar; Methodology, Vikas Chandnani; Project administration, Suhas Khandave; Resources, Manoj Bob; Supervision, Sanjay Tiwari; Validation, Sandeep Jagtap; Visualization, Supraja Atheriya; Writing – original draft, Vikas Chandnani; Writing – review & editing, Muddukrishna Badamane Sathyanarayana.
Funding
No Funding.
Data Availability
Data will be made available on request.
Acknowledgments
The authors extend their gratitude to the Lupin Bioresearch Center, India, and the Manipal Academy of Higher Education for their technical support. This paper forms part of the research conducted for the fulfillment of the Doctor of Philosophy degree from the Department of Pharmaceutical Quality Assurance, Manipal College of Pharmaceutical Sciences, Manipal Academy of Higher Education, a Deemed University in Manipal, India.
Declaration of interests
The authors declare that they have no known financial or personal conflicts of interest that could have influenced the findings presented in this paper.
Statement: on using Artificial Intelligence
No.
References
- Zhao Y, Gu H, Postelnek J, et al (2020) Fit-for-purpose protein biomarker assay validation strategies using hybrid immunocapture-liquid chromatography-tandem-mass spectrometry platform: Quantitative analysis of total soluble cluster of differentiation 73. Anal Chim Acta 1126:144–153. [CrossRef]
- Strauss DG, Wang YM, Florian J, Zineh I (2023) Pharmacodynamic Biomarkers Evidentiary Considerations for Biosimilar Development and Approval. Clin Pharmacol Ther 113:55–61. [CrossRef]
- Ho QT, Kuo CJ (2007) Vascular endothelial growth factor: Biology and therapeutic applications. International Journal of Biochemistry and Cell Biology 39:1349–1357. [CrossRef]
- Zheng X, Gao S, Wu J, Hu X (2021) A Fluorescent Aptasensor Based on Assembled G-Quadruplex and Thioflavin T for the Detection of Biomarker VEGF165. Front Bioeng Biotechnol 9:764123. [CrossRef]
- Göpfert JC, Reiser A, Yañez VAC, et al (2019) Development and evaluation of an ultrasensitive free VEGF-A immunoassay for analysis of human aqueous humor. Bioanalysis 11:875–886. [CrossRef]
- Sumner G, Georgaros C, Rafique A, et al (2019) Anti-VEGF drug interference with VEGF quantitation in the R&D systems human quantikine VEGF ELISA kit. Bioanalysis 11:381–392. [CrossRef]
- Zhou Q, Yan H, Ran F, et al (2018) Ultrasensitive enzyme-free fluorescent detection of VEGF165 based on target-triggered hybridization chain reaction amplification. RSC Adv 8:25955–25960. [CrossRef]
- Takahashi H, Nomura Y, Nishida J, et al (2016) Vascular Endothelial Growth Factor (VEGF) Concentration Is Underestimated by Enzyme-Linked Immunosorbent Assay in the Presence of Anti-VEGF Drugs. Invest Ophthalmol Vis Sci 57:462–466. [CrossRef]
- Panoilia E, Schindler E, Samantas E, et al (2015) A pharmacokinetic binding model for bevacizumab and VEGF 165 in colorectal cancer patients. Cancer Chemother Pharmacol 3:791–803. [CrossRef]
- Avery RL, Castellarin AA, Steinle NC (2014) Systemic pharmacokinetics following intravitreal injections of ranibizumab, bevacizumab or aflibercept in patients with neovascular AMD. Br J Ophthalmol 98:1636–1641. [CrossRef]
- Usa, Canada, China Human VEGF Immunoassay Quantikine ® ELISA Catalog Number DVE00 Catalog Number SVE00 Catalog Number PDVE00 For the quantitative determination of human Vascular Endothelial Growth Factor (VEGF) concentrations in cell culture supernates, serum, and plasma. ….
- Quantikine® Colorimetric Sandwich ELISA Kit Assay Principle: R&D Systems. https://www.rndsystems.com/products/quantikine-colorimetric-sandwich-elisa-assay-principle. Accessed 2 Jan 2026.
- V-PLEX Plus Human VEGF Kit | Meso Scale Discovery. https://www.mesoscale.com/en/products/v-plex-plus-human-vegf-kit-k151rhg/. Accessed 2 Jan 2026.
- Why Electrochemiluminescence | Meso Scale Discovery. https://punchout.mesoscale.com/en/technical_resources/our_technology/ecl. Accessed 2 Jan 2026.
- Food and Drug Administration (FDA). Guidance for Industry, Bioanalytical Method Validation, Rockville, MD: US Department of Health and Human Services, FDA, Center for Drug Evaluation and Research: May 2018.
- (2022) ICH M10 Harmonised Guideline Bioanalytical Method Validation and Study sample analysis.
- Marini JC, Anderson M, Cai XY, et al (2014) Systematic Verification of Bioanalytical Similarity Between a Biosimilar and a Reference Biotherapeutic: Committee Recommendations for the Development and Validation of a Single Ligand-Binding Assay to Support Pharmacokinetic Assessments. Botanical Review 16:1149–1158. [CrossRef]
- Thway TM, Wang YM, Booth BP, et al (2020) Current Perspectives on Ligand-Binding Assay Practices in the Quantification of Circulating Therapeutic Proteins for Biosimilar Biological Product Development. AAPS J 22:. [CrossRef]
- Piccoli SP, Michael Sauer J, Ackermann B, et al (2019) Points to Consider Document: Scientific and Regulatory Considerations for the Analytical Validation of Assays Used in the Qualification of Biomarkers in Biological Matrices Biomarker Assay Collaborative Evidentiary Considerations Writing Group, Critical Path Institute (C-Path).
- Stevenson LF, Purushothama S (2014) Parallelism: Considerations for the development, validation and implementation of PK and biomarker ligand-binding assays. Bioanalysis 6:185–198. [CrossRef]
- Tu J, Bennett P (2017) Parallelism experiments to evaluate matrix effects, selectivity and sensitivity in ligand-binding assay method development: Pros and cons. Bioanalysis 9:1107–1122. [CrossRef]
- Islam R, Kar S, Ritzén H, et al (2019) Recommendations for classification of commercial LBA kits for biomarkers in drug development from the GCC for bioanalysis. Bioanalysis 11:645–653. [CrossRef]
- Rhyne PW, Wong OT, Zhang YJ, Weiner RS (2009) Electrochemiluminescence in bioanalysis. Bioanalysis 1:919–935. [CrossRef]
- Wyant T, Yang L, Rosario M (2021) Comparison of the ELISA and ECL Assay for Vedolizumab Anti-drug Antibodies: Assessing the Impact on Pharmacokinetics and Safety Outcomes of the Phase 3 GEMINI Trials. AAPS Journal 23:1–10. [CrossRef]
- Collet-Brose J, Couble P-J, Deehan MR, et al (2016) Evaluation of Multiple Immunoassay Technology Platforms to Select the Anti-Drug Antibody Assay Exhibiting the Most Appropriate Drug and Target Tolerance. [CrossRef]
Figure 1.
Representative Calibration Curve for VEGF (MSD).

Figure 2.
A Representative Calibration Curve PD ELISA.

Figure 3.
Parallelism of VEGF Quantification across Dilution Factors.


Table 1.
Results of Calibrator.
| Calibration Standards | Spiked Concentration (pg/mL) | Measured Mean Concentration (pg/mL) | Inter-Assay Precision (% CV) | Inter-Assay Accuracy (% Bias) | Total Error (% TE) | |
|---|---|---|---|---|---|---|
| STD 1 | 2600 | Upper Anchor point | ||||
| STD 2 / ULOQ | 2000 | 1979.1 | 1.18 | -1.04 | 2.22 | |
| STD 3 | 1000 | 1002.0 | 1.94 | 0.21 | 2.15 | |
| STD 4 | 500 | 506.43 | 1.86 | 1.29 | 3.15 | |
| STD 5 | 250 | 248.8 | 1.61 | -0.46 | 2.07 | |
| STD 6 | 125 | 121.4 | 1.98 | -2.85 | 4.83 | |
| STD 7/ LLOQ | 62.5 | 65.8 | 5.01 | 5.39 | 10.40 | |
| STD 8 | 31.25 | Lower Anchor point | ||||
STD=Standard.
Table 2.
Intra-Run Accuracy and Precision in Assay Buffer.
| Quality Control | Intra-run precision (% CV) | Intra-run accuracy | Intra-run % Bias |
|---|---|---|---|
| ULOQQC | 3.69% to 12.29% | 86.83% to 98.23% | 13.17% to -1.77% |
| HQC | 1.70% to 3.99% | 89.76% to 94.24% | -10.24% to -5.76% |
| MQC | 2.39% to 4.45% | 90.91% to 105.85% | -9.09% to 5.85% |
| LQC | 3.77% to 7.14% | 91.62% to 107.41% | -8.38% to 7.41% |
| LLOQQC | 5.06% to14.39% | 91.32% to 106.21% | -8.68% to 6.21% |
Table 3.
Inter-Run Accuracy and Precision in Assay Buffer.
| Quality Control | Spiked Concentration (pg/mL) | Measured Mean Concentration (pg/mL) | Inter-Assay Precision (% CV) |
Inter-Assay Accuracy (% Bias) | Total Error (% TE) |
|---|---|---|---|---|---|
| ULOQQC | 2000 | 1879.5 | 7.40 | -6.02 | 13.42 |
| HQC | 1500 | 1385.4 | 3.44 | -7.64 | 11.08 |
| MQC | 350 | 346.7 | 6.14 | -0.93 | 7.07 |
| LQC | 180 | 180.6 | 7.58 | 0.36 | 7.94 |
| LLOQQC | 62.5 | 61.9 | 10.01 | -0.91 | 10.92 |
Table 4.
Accuracy and Precision in Plasma.
| Level | PM-01 | PM-02 |
|---|---|---|
| Mean VEGF Conc. | 787.4 pg/mL | 468.5 pg/mL |
| SD | 44.9 | 31.6 |
| % CV | 5.70 | 6.74 |
| n | 36 | 36 |
| Mean CV | 6.22 | |
| Range (3* Mean CV) | 18.66 | |
| Upper Limit (100+Range) | 118.66% | |
| Lower Limit(100-Range) | 81.34% | |
Acceptance limits for accuracy were derived from three times the global mean % CV, establishing a range of 81.34% to 118.66%.
Table 5.
MRD.
| Analyte Name | VEGF | ||||||||||||||||||||
| Individual Plasma ID | BM-20-1091 | BM-20-1106 | BM-20-1113 | BM-20-1120 | BM-20-1133 | BM-20-1137 | BM-20-1138 | BM-20-1140 | BM-20-1145 | BM-20-1150 | |||||||||||
| Dilution Fold | Conc. (pg/mL)* Dilution Fold |
% Accuracy |
Conc. (pg/mL)* Dilution Fold |
% Accuracy |
Conc. (pg/mL)* Dilution Fold |
% Accuracy |
Conc. (pg/mL)* Dilution Fold |
% Accuracy |
Conc. (pg/mL)* Dilution Fold | %Accuracy | Conc. (pg/mL)* Dilution Fold | %Accuracy | Conc. (pg/mL)* Dilution Fold | %Accuracy | Conc. (pg/mL)* Dilution Fold | %Accuracy | Conc. (pg/mL)* Dilution Fold |
% Accuracy |
Conc. (pg/mL)* Dilution Fold | %Accuracy | |
| % Accuracy using no Dilution | 1 | 727.0 | 100.00 | 526.6 | 100.00 | 397.0 | 100.00 | 442.4 | 100.00 | 525.0 | 100.00 | 559.3 | 100.00 | 489.8 | 100.00 | 724.5 | 100.00 | 496.7 | 100.00 | 435.9 | 100.00 |
| 2 | 696.7 | 95.82 | 558.9 | 106.14 | 397.3 | 100.09 | 492.1 | 111.25 | 507.3 | 96.63 | 553.3 | 98.94 | 516.8 | 105.50 | 758.8 | 104.74 | 577.2 | 116.22 | 434.8 | 99.76 | |
| 4 | 776.2 | 106.76 | 589.9 | 112.02 | 377.7 | 95.15 | 525.2 | 118.73 | 556.0 | 105.90 | 592.1 | 105.88 | 545.9 | 111.45 | 805.4 | 111.17 | 610.0 | 122.81 | 460.4 | 105.62 | |
| 8 | 882.5 | 121.38 | 612.5 | 116.31 | 397.6 | 100.15 | 540.2 | 122.13 | 563.3 | 107.29 | 781.7 | 139.78 | 555.5 | 113.41 | 837.4 | 115.59 | 651.7 | 131.21 | 447.6 | 102.69 | |
| 16 | 746.4 | 102.66 | 548.5 | 104.16 | 334.8 | 84.34 | 493.8 | 111.63 | 511.9 | 97.50 | 642.4 | 114.86 | 497.2 | 101.51 | 761.2 | 105.07 | 628.5 | 126.54 | 360.7 | 82.76 | |
| 32 | 618.5 | 85.07 | 518.7 | 98.51 | 221.9 | 55.90 | 457.1 | 103.33 | 363.2 | 69.19 | 460.3 | 82.31 | 479.8 | 97.96 | 600.6 | 82.90 | 539.8 | 108.68 | 179.2 | 41.11 | |
| % Accuracy using 1 in 2 Dilution | 1 | 104.36 | 94.22 | 99.91 | 89.89 | 103.49 | 101.07 | 94.79 | 95.47 | 86.04 | 100.24 | ||||||||||
| 2 | 100.00 | 100.00 | 100.00 | 100.00 | 100.00 | 100.00 | 100.00 | 100.00 | 100.00 | 100.00 | |||||||||||
| 4 | 111.42 | 105.54 | 95.07 | 106.72 | 109.60 | 107.01 | 105.64 | 106.14 | 105.67 | 105.88 | |||||||||||
| 8 | 126.67 | 109.59 | 100.06 | 109.77 | 111.04 | 141.27 | 107.50 | 110.35 | 112.90 | 102.94 | |||||||||||
| 16 | 107.14 | 98.13 | 84.26 | 100.34 | 100.90 | 116.09 | 96.22 | 100.32 | 108.88 | 82.96 | |||||||||||
| 32 | 88.78 | 92.81 | 55.85 | 92.88 | 71.60 | 83.19 | 92.85 | 79.15 | 93.51 | 41.21 | |||||||||||
| % Accuracy using 1 in 4 Dilution |
1 | 93.67 | 89.27 | 105.09 | 84.23 | 94.43 | 94.45 | 89.73 | 89.95 | 81.42 | 94.68 | ||||||||||
| 2 | 89.75 | 94.75 | 105.19 | 93.71 | 91.24 | 93.45 | 94.66 | 94.22 | 94.63 | 94.44 | |||||||||||
| 4 | 100.00 | 100.00 | 100.00 | 100.00 | 100.00 | 100.00 | 100.00 | 100.00 | 100.00 | 100.00 | |||||||||||
| 8 | 113.69 | 103.84 | 105.25 | 102.86 | 101.31 | 132.02 | 101.77 | 103.97 | 106.84 | 97.23 | |||||||||||
| 16 | 96.16 | 92.98 | 88.63 | 94.02 | 92.06 | 108.48 | 91.08 | 94.52 | 103.03 | 78.35 | |||||||||||
| 32 | 79.68 | 87.94 | 58.74 | 87.03 | 65.33 | 77.74 | 87.90 | 74.57 | 88.49 | 38.92 | |||||||||||
| Individual ID | BM-20-1091 | BM-20-1106 | BM-20-1113 | BM-20-1120 | BM-20-1133 | BM-20-1137 | BM-20-1138 | BM-20-1140 | BM-20-1145 | BM-20-1150 | |||||||||||
| Dilution Fold | Conc. (pg/mL)* Dilution Fold |
% Accuracy |
Conc. (pg/mL)* Dilution Fold |
% Accuracy |
Conc. (pg/mL)* Dilution Fold |
% Accuracy |
Conc. (pg/mL)* Dilution Fold |
% Accuracy |
Conc. (pg/mL)* Dilution Fold | %Accuracy | Conc. (pg/mL)* Dilution Fold | %Accuracy | Conc. (pg/mL)* Dilution Fold | %Accuracy | Conc. (pg/mL)* Dilution Fold | %Accuracy | Conc. (pg/mL)* Dilution Fold |
% Accuracy |
Conc. (pg/mL)* Dilution Fold | %Accuracy | |
| % Accuracy using 1 in 8 Dilution | 1 | 82.38 | 85.98 | 99.85 | 81.88 | 93.20 | 71.54 | 88.17 | 86.52 | 76.21 | 97.38 | ||||||||||
| 2 | 78.94 | 91.25 | 99.94 | 91.10 | 90.06 | 70.79 | 93.02 | 90.62 | 88.58 | 97.14 | |||||||||||
| 4 | 87.95 | 96.31 | 95.01 | 97.22 | 98.70 | 75.75 | 98.27 | 96.18 | 93.60 | 102.85 | |||||||||||
| 8 | 100.00 | 100.00 | 100.00 | 100.00 | 100.00 | 100.00 | 100.00 | 100.00 | 100.00 | 100.00 | |||||||||||
| 16 | 84.58 | 89.55 | 84.21 | 91.40 | 90.87 | 82.17 | 89.50 | 90.90 | 96.44 | 80.59 | |||||||||||
| 32 | 70.09 | 84.69 | 55.81 | 84.61 | 64.48 | 58.88 | 86.37 | 71.72 | 82.83 | 40.03 | |||||||||||
| % Accuracy using 1 in 16 Dilution | 1 | 97.41 | 96.01 | 118.57 | 89.58 | 102.57 | 87.06 | 98.51 | 95.17 | 79.03 | 120.83 | ||||||||||
| 2 | 93.34 | 101.90 | 118.68 | 99.66 | 99.11 | 86.14 | 103.93 | 99.69 | 91.85 | 120.54 | |||||||||||
| 4 | 103.99 | 107.55 | 112.83 | 106.36 | 108.62 | 92.18 | 109.79 | 105.80 | 97.06 | 127.63 | |||||||||||
| 8 | 118.24 | 111.67 | 118.76 | 109.40 | 110.05 | 121.69 | 111.73 | 110.01 | 103.69 | 124.09 | |||||||||||
| 16 | 100.00 | 100.00 | 100.00 | 100.00 | 100.00 | 100.00 | 100.00 | 100.00 | 100.00 | 100.00 | |||||||||||
| 32 | 82.87 | 94.58 | 66.28 | 92.57 | 70.96 | 71.66 | 96.50 | 78.90 | 85.89 | 49.67 | |||||||||||
| % Accuracy using 1 in 32 Dilution | 1 | 117.55 | 101.51 | 178.90 | 96.78 | 144.54 | 116.55 | 102.08 | 120.62 | 92.01 | 243.25 | ||||||||||
| 2 | 112.64 | 107.75 | 179.06 | 107.66 | 139.66 | 115.32 | 107.70 | 126.34 | 106.94 | 242.66 | |||||||||||
| 4 | 125.50 | 113.71 | 170.23 | 114.90 | 153.07 | 123.41 | 113.77 | 134.09 | 113.00 | 256.93 | |||||||||||
| 8 | 142.68 | 118.07 | 179.18 | 118.19 | 155.08 | 162.92 | 115.78 | 139.42 | 120.73 | 249.80 | |||||||||||
| 16 | 120.68 | 105.73 | 150.88 | 108.03 | 140.92 | 133.88 | 103.62 | 126.74 | 116.43 | 201.31 | |||||||||||
| 32 | 100.00 | 100.00 | 100.00 | 100.00 | 100.00 | 95.93 | 100.00 | 100.00 | 100.00 | 100.00 | |||||||||||
Table 6.
Sensitivity.
| Analyte Name: | VEGF | ||||||||||
| Dilution Fold | BM-20-1091 | BM-20-1106 | BM-20-1113 | BM-20-1120 | BM-20-1133 | BM-20-1137 | BM-20-1138 | BM-20-1140 | BM-20-1145 | BM-20-1150 | |
| Obtained concentration in pg/mL | |||||||||||
| Neat | 727.0 | 526.6 | 397.0 | 442.4 | 525.0 | 559.3 | 489.8 | 724.5 | 496.7 | 435.9 | |
| 1:2 | 348.3 | 279.4 | 198.6 | 246.0 | 253.6 | 276.6 | 258.4 | 379.4 | 288.6 | 217.4 | |
| 1:4 | 194.0 | 147.4 | 94.4 | 131.3 | 139.0 | 148.0 | 136.4 | 201.3 | 152.5 | 115.1 | |
| 1:8 | 110.3 | 76.5 | 49.7 | 67.5 | 70.4 | 97.7 | 69.4 | 104.6 | 81.4 | 55.9 | |
| 1:16 | 46.6 | 34.2 | 20.9 | 30.8 | 31.9 | 40.1 | 31.0 | 47.5 | 39.2 | 22.5 | |
| 1:32 | 19.3 | 16.2 | 6.9 | 14.2 | 11.3 | 14.3 | 14.9 | 18.7 | 16.8 | 5.6 | |
Table 7.
Summary of Stability Experiments for VEGF in Human Plasma.
| Stability Condition & Temperature | QC Level | % Difference (n=3) | Duration | ||
|---|---|---|---|---|---|
| FT Stability II cycle & -75 °C | PM-01 | -0.19 | 7.78 | 12.72 | Up to six FT cycles |
| PM-02 | -4.70 | -9.54 | -4.05 | ||
| FT Stability IV cycle & -75 °C | PM-01 | 11.50 | 9.07 | 9.36 | |
| PM-02 | 0.02 | -2.24 | -5.00 | ||
| FT Stability VI cycle & -75 °C | PM-01 | 7.22 | -0.09 | 6.55 | |
| PM-02 | -3.90 | -0.69 | -3.60 | ||
| FT Stability II cycle & -20 °C | PM-01 | -0.39 | 6.97 | 13.10 | Up to six FT cycles |
| PM-02 | 8.38 | 6.25 | 2.00 | ||
| FT Stability IV cycle & -20 °C | PM-01 | 9.34 | 6.02 | 0.78 | |
| PM-02 | -1.09 | 1.45 | -0.96 | ||
| FT Stability VI cycle & -20 °C | PM-01 | 4.80 | 1.97 | 1.60 | |
| PM-02 | -4.33 | 2.23 | 5.75 | ||
| Bench Top Stability at Room Temperature |
PM-01 | 6.57 | 9.98 | 6.65 | 27 Hours |
| PM-02 | 8.93 | -3.17 | -4.89 | ||
| Refrigerator Stability at 2-8 °C |
PM-01 | 9.00 | 12.33 | 9.59 | 74 hours |
| PM-02 | -9.98 | -11.57 | -10.53 | ||
FT= Freeze-Thaw.
Table 8.
Concentration of VEGF in Human plasma (pg/mL).
| Subject ID | Day 1- Pre Dose | Day 1- Post Dose | Day 3 | Day 7 | Day 15 | Day 30 | Day 60 | Day 60- Post Dose | Day 67 | Day 90 |
|---|---|---|---|---|---|---|---|---|---|---|
| 11-202 | Missing | Missing | 71.5 | BLQ | BLQ | 70.6 | BLQ | 72.5 | BLQ | 59.5 |
| 11-203 | BLQ | Missing | BLQ | BLQ | BLQ | BLQ | 70.2 | BLQ | BLQ | 84.4 |
| 11-204 | 127.3 | 235.2 | 67.1 | 174.3 | 158.1 | 137.1 | 103.3 | 156.7 | Missing | 123.8 |
| 11-205 | 195.5 | 286.8 | 89.5 | BLQ | BLQ | BLQ | 90.2 | Missing | Missing | Missing |
| 11-206 | 62.7 | 73.6 | BLQ | BLQ | BLQ | BLQ | 69.9 | BLQ | BLQ | BLQ |
| 11-210 | 74.8 | 50.4 | 50.4 | BLQ | BLQ | 68.4 | BLQ | BLQ | BLQ | Missing |
| 21-001 | BLQ | BLQ | BLQ | BLQ | 54.3 | BLQ | Missing | |||
| 21-002 | BLQ | BLQ | BLQ | BLQ | BLQ | BLQ | BLQ | |||
| 21-003 | BLQ | BLQ | BLQ | BLQ | BLQ | BLQ | BLQ | |||
| 21-004 | BLQ | BLQ | BLQ | BLQ | BLQ | BLQ | BLQ | |||
| 21-005 | BLQ | 54.8 | BLQ | BLQ | 83.0 | BLQ | BLQ | |||
| 21-006 | 65.9 | BLQ | BLQ | BLQ | BLQ | Missing | BLQ | |||
| 21-007 | BLQ | BLQ | BLQ | BLQ | BLQ | BLQ | BLQ | |||
| 21-008 | BLQ | BLQ | BLQ | BLQ | BLQ | 230.6 | BLQ | |||
| 21-009 | BLQ | BLQ | BLQ | BLQ | BLQ | BLQ | BLQ | |||
| 21-010 | 121.7 | 59.6 | 126.0 | BLQ | BLQ | BLQ | BLQ | |||
| 21-011 | 80.3 | BLQ | BLQ | BLQ | BLQ | 75.6 | BLQ | |||
| 21-012 | 133.2 | 101.5 | 82.9 | 138.3 | 90.2 | BLQ | 116.9 | |||
| 21-013 | BLQ | BLQ | BLQ | BLQ | BLQ | BLQ | BLQ | |||
| 21-014 | BLQ | BLQ | BLQ | BLQ | BLQ | BLQ | Missing |
Table 9.
Comparative Assessment PD assays developed for VEGF by ELISA and MSD.
| PD assays for VEGF in plasma | |||
|---|---|---|---|
| Parameter | ELISA | MSD | |
| Biological matrix | : | Normal Human plasma | Normal Human plasma |
| Plasma Anticoagulant | : | Sodium Citrate | Sodium Citrate |
| Standard | : | Recombinant Human VEGF (CR08) | Recombinant Human VEGF (CR08) |
| Calibration curve range | : | 62.5 pg/mL –2000.0 pg/mL | 7.7 - 562 pg/mL |
| Anchor points | : | Upper – 2600.0 pg/mL, Lower-31.25 pg/mL, MRD: 4 | 1.12- 1080 pg/mL, MRD: 2 |
| Analytical technique | : | Direct Sandwich ELISA- Dual Colorimetric Detection | Sandwich ECL Detection |
| Regression | : | Non-Linear (4PL) | Non-Linear (4PL) |
| Weighing factor | : | 1/Y² | 1/Y² |
| Sample Volume | : | 100 µL | 50 µL |
| Time required | : | 05 Hours | 05 Hours |
| Wash steps | : | 2 | 3 |
| Kit / Vendor | : | Human VEGF Quantikine ELISA kit, R&D systems |
V-PLEX Plus Human VEGF Kit, MSD |
| Pre-coated plate | : | mAb specific for Sf21-expressed recombinant human VEGF-A165 | Anti-hu VEGF Antibody |
| Detection Antibody | : | peroxidase-conjugated Anti-human VEGF Conjugate polyclonal Ab | SULFO-TAG™ Anti-hVEGF Antibody |
Disclaimer/Publisher’s Note: The statements, opinions and data contained in all publications are solely those of the individual author(s) and contributor(s) and not of MDPI and/or the editor(s). MDPI and/or the editor(s) disclaim responsibility for any injury to people or property resulting from any ideas, methods, instructions or products referred to in the content. |
© 2026 by the authors. Licensee MDPI, Basel, Switzerland. This article is an open access article distributed under the terms and conditions of the Creative Commons Attribution (CC BY) license (http://creativecommons.org/licenses/by/4.0/).
Copyright: This open access article is published under a Creative Commons CC BY 4.0 license, which permit the free download, distribution, and reuse, provided that the author and preprint are cited in any reuse.


