

Submitted:
28 February 2026
Posted:
02 March 2026
You are already at the latest version
Abstract
This paper reports on an online survey of 2,000 English adults, designed to inform the debate about the potential for wider adoption of e-micromobility modes, such as e-bikes, e-cargo bikes and e-scooters. It shows that, by 2023, take-up was already greater than for electric cars, with 11% of households owning at least one of those vehicles and 9% of adults using one at least once a month. On average, users were more likely to be male, young, well-educated urban dwellers, but findings also suggested relatively high take-up by people with children, greater appeal to women than conventional cycling, and the potential to appeal to a wider range of age groups over time. Use of e-micromobility was associated with more varied mobility strategies, and lower levels of frequent car use. Over 50% of adults were interested in trying out vehicles, and evidence from other UK trials and existing users suggests that being able to trial vehicles may be key for purchase decisions. On balance, non-users were broadly positive (or neutral) towards these modes, though with particular concerns arising around the safety of e-scooters and their relationship with pedestrians. Cost, fear of theft, difficulties with storage and parking, unsafe road environments and lack of confidence cycling all emerged as key barriers. Users of e-micromobility were less likely to be sedentary and more likely to be meeting physical activity targets than non-users, highlighting important synergies with other active travel modes (i.e. walking and cycling), but any measures to increase uptake need to find ways to ensure that different active travel modes can safely coexist.
Keywords:
micromobility
; e-micromobility
; e-bikes
; e-cargo bikes
; e-scooters
; cycling
1. Introduction
While conventional motor vehicle electrification is supported by governments worldwide as a solution to decarbonise transport and mitigate climate change, assessments indicate that this alone will be insufficient to deliver the required emission reductions to achieve climate targets (UK Climate Change Committee, 2023). Improvements in fuel efficiency in recent decades have been counteracted by other trends – in particular, the average size of cars has grown (Brand et al., 2024) – and traffic levels are increasing again after COVID-19 (DfT, 2025a). Therefore, there is a need to transition to the adoption of smaller vehicles, comprising not only smaller private cars but also other modes such as micromobility and active travel.
Electric micromobility (denoted as e-micromobility) takes a number of forms, from 1 to 4-wheel small electric vehicles “that can typically be manoeuvred by one human without motor assistance, at least for short distances” and that are ‘micro’ in terms of “energy demand, ..environmental impact and... the use of road space, compared to automobile-based transportation” (Behrendt et al., 2023, p27; SAE, 2019). Such vehicles include e-bikes, e-cargo bikes and e-scooters. These modes are considerably less energy intensive to use (given their lower weights and speeds), and, in most scenarios, have the potential to achieve emissions reductions (see section 2 for caveats). In addition, they often have the potential to increase physical activity in line with other forms of active travel, thereby delivering important co-benefits (Bourne et al 2022, Cook et al 2022, Larrington-Spencer 2024).
With important exceptions (De Ceunynck et al., 2021, Mesimäki & Lehtonen, 2023), existing studies have often focused on specific modes; shared schemes; and evidence from current users. Yet understanding the experience, perceptions and attitudes of the wider population, and how use of particular modes or schemes influences general mobility patterns, is key for understanding differences between early adopters and others, and the scope for increasing future uptake (Rogers, 2003, Talke & Heidenreich, 2014).
Therefore, this paper reports on new national survey data for England. This has involved a series of detailed questions about experience of, and opinions on, e-bikes, e-scooters, and e-cargo bikes, together with broader information about mobility patterns and attitudes, as part of assessing the viability of future take-up of e-micromobility options and the likely effects on car use. Specifically, it addresses the research questions:
- What is the current prevalence of e-micromobility ownership and use in England?
- Who are the users of (different forms of) e-micromobility?
- How does use of e-micromobility affect general mobility patterns?
- What are the attitudes and barriers towards e-micromobility currently evident in the wider population and what do these suggest about the potential for (e-)micromobility to diffuse more widely?
Insights from England are relevant, both because take-up of e-micromobility modes is substantially less than in many other European countries, and because there are various other data sources which augment the survey findings.
2. Literature Review
In this section, we provide a (necessarily brief) overview of the current evidence about e-micromobility in the UK, followed by a somewhat more detailed summary of the evidence on the 3 key modes considered in our survey – e-bikes, e-cargo bikes and e-scooters.
2.1. The Status of e-Micromobility in the UK
As already highlighted, the UK lags behind many other countries in its take-up of e-micromobility (Visavadia, 2025). E bikes make up only 9% of UK bike sales compared to over 50% in places like Germany, The Netherlands, Austria and Belgium (Irons, 2025), and, unlike the situation in other countries, there have been no grants for individual purchase. In 2022, sales of only 4,000 e-cargo bikes were reported in the UK, compared with 70,000 in France and 90,000 in Germany (Garadis, 2023). Moreover, e-scooters are not legal to ride except as part of city trials (Gov.uk, 2025), unlike the situation in other parts of Europe (Urbetter, 2023). Meanwhile, media debate is often highly polarised. To some, these modes put the fun back into travel, expanding opportunities for people with mobility problems (particularly older people) and offer an environmental solution (see, for example, Businessmile 2023, Delaney 2020, Walker 2022, Nicholas 2024). For others, they provide a getaway mode for criminals, represent a serious hazard to pedestrians and constitute a death trap for transporting children (see, for example, Simons 2023, Laver 2025, Walsh 2025, Monaghan 2025). One specific issue has been the media misrepresentation of electric motorbikes as e-bikes, and prominent stories about battery fires, which are rarely, if ever, caused by batteries from reputable manufacturers (BA, 2023, The Electric Bike Alliance 2024, Eland 2025, Sutton 2024). Given the extreme debate, it is difficult to understand what public opinions about these modes actually are, and whether there is anything unique about the UK context which means they are less likely to be successful here.
One source of overview information is the Department of Transport’s ‘Transport and Technology Tracker’ (Marshall et al, 2023, 2024), which has been running since 2017, and includes questions on e-cycles and e-scooters. Different waves have used different methodologies and questions – with the latest comprising an online survey of 7091 people aged 16+1. Findings are summarised in Table 1.
In the T&T Tracker, respondents are also asked to select from a list of advantages and disadvantages for the two modes. For e-cycles, key advantages are seen as being less effort to use, enabling people to travel further and faster. For e-scooter use, the top two advantages are seen as speed and convenience. For both, environmental reasons also rank relatively high. In terms of disadvantages, for e-cycles, cost, theft, risk of battery fire, needing to recharge the battery and bikes being heavy all rank highly. For e-scooters, safety, including risk to pedestrians, danger in using on busy roads, and lack of proper regulation are seen as the key issues.
These findings complement a range of insights from mode specific research, which are discussed further below.
2.2. E-Bikes
Of the three e-micromobility modes that our survey explored in depth, e-bikes are the most well-established and researched. Early research suggested that they were particularly appealing for older people, although more recent studies suggest a greater appeal to younger adults (Melia & Bartle, 2022; Simsekoglu & Klöckner, 2019, Rérat, 2021). Studies also suggest a higher share of women use e-bikes than conventional bikes, though they may still be less likely to use them than men (Fyhri & Fearnley, 2015; Møller et al., 2024; Rérat, 2021). In places where they are becoming more widespread, the socio-demographic characteristics of users are typically becoming less distinct, as they appeal to a wide range of people (Zhang et al, 2025)
Melia and Bartle (2022) identify the main motivators to use as being benefits to health and wellbeing, particularly in the context of aging, ill health or disability; improving fitness; fun and exploration; widening transport options; and pro-environmental attitudes coupled with interest in reducing car-use. Being able to readily undertake longer journeys, to potentially travel faster and to overcome hills are also key. Factors discouraging e-bike purchase and use include: cost of initial purchase; space, storage and security concerns (including fear of theft); lack of parking opportunities; weight; size; and manoeuvrability around physical obstacles on cycle paths, such as steps and narrow gates. Many of these factors are also identified by other commentators (Behrendt et al., 2021; Philips et al., 2024; Rérat, 2021).
E-bikes have also been shown to have positive environmental impacts. Based on information about area type, local car-use patterns, the geodemographics of the population (including their physical capability) and the whole lifecycle emissions of different modes, Philips et al (2022) have estimated that substituting car travel for e-bike use could save 24.4 MtCO2 per annum in England, equivalent to 38% of all car travel in 2022. McQueen et al (2020) calculated that reaching a 15% e-bike mode share (by distance) in the US city of Portland could reduce CO2 emission from passenger transport by 12%. Meanwhile, car use reductions have been shown in a variety of trials and studies (Cairns et al, 2017, Fyhri et al 2016, Gioria 2016, McArthur et al 2018, McQueen et al 2019, Wolf & Seebauer 2014, Hiselius & Svenssons 2014, Bourne et al 2020). A recent review also suggests that their use can be associated with a range of health benefits (Bourne et al, 2022).
In the UK, CoMoUK’s data indicates that about 7% of British people have ever used a shared e-bike with 4% doing so in 2023/24, and that current fleets are 70% electric-assist (CoMoUK,2025). Meanwhile, the most substantial UK intervention on e-bikes has been the national e-cycle programme, which ran between March 2022 and December 2023, delivering 3,619 one-month-free e-bike loans and 13,900 training sessions in four UK locations (Steer, 2024). Loan participants were more likely to be male (55% vs 49% nationally), less likely to be from a white background (67% vs 82% nationally) and more likely to be relatively young (48% aged 25-44 compared with 27% nationally). There was a broad distribution of income levels, and 51% were working full time. A higher share of women and older people took part in the training sessions. By the end of the loan period, 7% people had bought an e-cycle, and 33% said they were more likely to buy one (whilst 23% said less likely). For those completing the training, the proportion of respondents stating they were ‘likely’ or ‘very likely’ to purchase an e-cycle increased from 58% to 72% after training. However, this fell to 45% one month later. The most common reason cited for why participants were unlikely to purchase or continue to use an e-cycle was the cost (73%). Other barriers mentioned included security concerns, storage issues, and whether there was fit for-purpose cycling infrastructure. A range of benefits were reported from participation in the programme, including mental health benefits.
2.3. E-Cargo Bikes
E-cargo bikes are still niche, with most of the literature looking at their use in logistics (Narayanan & Antoniou, 2022). However, there is a small but growing body of research on domestic use, including Riggs 2016, Riggs & Schwartz 2018, Becker & Rudolf 2018, Boterman 2018, Bjørnarå et al. 2019, Thomas 2021, Bissel & Becker 2024, Marincek et al. 2024a+b and Philips et al 2025.
In a recent synthesis, Carracedo & Mostofi (2022) concluded that in terms of socio-demographic determinants, personal e-cargo bike users were more likely to be upper or middle class, male, in their late thirties or early forties, educated to degree level, existing cyclists, and in households with children and cars. In work post-dating this synthesis, Marincek et al. (2024a) found similar characteristics, but noted that, in Swiss sharing schemes, there were significant proportions of cargo-bike-sharers who were under 30 and had relatively low incomes. In addition, 46% of their cargo bike owners did not own cars. Bissel and Becker (2024) reported that over half of their German cargo-bike-sharers were in households without cars. Moreover, although many studies have found a male bias, the potential appeal of e-cargo bikes to women has also been highlighted– for example, 43% of e-cargo bike sharers in Bissel & Becker (2024) survey were female; Riggs and Schwartz (2018) reported that women were more likely to use cargo bikes for trips with children than men; and Marincek et al. (2024a) noted that, although two-thirds of their survey respondents were male, 79% of cargo bike owners shared them with other family members. Others have noted their appeal to parents of young children (Bjørnarå et al., 2017, Boterman, 2020, Thomas 2021). Carracedo & Mostofi (2022) report that motivations for e-cargo bike use include lower total costs of ownership compared with car use; social aspects including physical and mental health benefits; and environmental concerns, and these are echoed in many of the later studies.
Research has also suggested that e-cargo bikes can substitute for car use. Specifically, Riggs (2016) found a substantial reduction in the proportion of e-cargo bike owners listing car as their primary travel mode after purchase, with associated reductions in car trips. Reductions in car trips were also reported from trials in Norway (Bjørnarå et al., 2019), e-cargo bike sharers in Germany and Austria (Becker & Rudolf, 2018) and Swiss e-cargo bike owners (Marincek et al, 2024b). Bissel & Becker (2024) and Marincek et al (2024b) also report on reductions in car ownership from e-cargo bike use.
Work on e-cargo bikes in the UK has been limited, although there have been successful grants offered for businesses (Anderson, 2025). In related work for this project (Philips et al 2025), e-cargo bikes were lent to 49 households in UK suburbs. Household usage varied considerably, but, overall, participants averaged 38-42km per week, and indicated that over half of the distance travelled would otherwise have been made by car. 10 households (20%) had purchased one a year later, and 32 (65%) said that participating in the trial had made their household ‘somewhat’ or ‘much’ more likely to buy an e-cargo bike (with 6 saying somewhat or much less likely). Meanwhile, barriers to use were similar to those for e-bikes, including cost, fear of theft, difficulties with storage and lack of appropriate infrastructure.
2.4. E-Scooters
There has been the explosion in e-scooters around the world and there is a growing body of research on their use and their users. Much of this is focused on shared schemes, though with various studies looking at both shared and private use, and concluding that there are often substantial differences – for example, in frequency of use, and the nature of mode substitution
In a recent review of studies, Badia & Jenelius, (2023) concluded that two-thirds of shared e-scooter users are male, with a mean age of 30-35, slightly higher than average salary and a university degree. Similar characteristics have been found in other studies, albeit some suggestion that private e-scooter owners may be slightly older (Oostendorp & Hardinghaus, 2023; Laa and Leth 2020). Private e-scooter users often use them more for commuting trips, while users of shared scheme are more likely to use them for leisure (Badia & Jenelius, 2023, Oostendorp & Hardinghaus, 2023). Badia & Jenelius (2023) conclude that reasons for use comprise “the perceived playfulness and novelty… the convenience derived from shorter travel times and the flexibility of door-to-door trips… a secondary motivation is the lower pollution of vehicles” (p. 821). Meanwhile, they report that barriers to use are, above all, perceived (and actual) safety, whilst other factors include weather, limited availability of scooters, lack of knowledge of how to ride or prevailing regulations, price and payment methods. In 2021, Canadian research by Mitra & Hess suggested that 21% of adults would consider using e-scooters for some of their current trips, with, on average, positive perceptions of their health, environment and efficiency impacts. Buehler et al (2021) report on before-and-after surveys of an e-scooter scheme in the US, finding that stated intention to ride before system launch was greater than actual ridership, with the greatest drop-off for older age groups and women, but, at the same time, perceptions about the scheme were more positive among non-riders after system launch
The environmental impacts of e-scooters are an issue of debate in the literature. The short life span of early (shared) e-scooters and the often relatively high mode shift from walking, cycling and public transport have been raised as concerns (Hollingsworth et al. 2019; Mitra and Hess 2021; Sanders et al. 2020). However, e-scooters can also encourage public transport use if they facilitate the first or last mile of the trip, and some studies suggest that American e-scooter schemes and private e-scooters substitute for a higher share of car trips than studies of shared schemes elsewhere suggest (Badia & Jenelius 2023; Laa and Leth 2020; Oostendorp and Hardinghaus 2023). Moreover, some recent studies suggest potential net benefits, not least due to improvements in the longevity of shared e-scooters and more efficient operational procedures (Chaniotakis et al., 2023, Cazzola & Crist 2020, ITF 2024).
In England, CoMoUK’s latest data suggests that 3.7 million people (6%) have ever used a shared e-scooter and 2% actively did so in 2023/24, with three-quarters of these users also using shared cycles. The Department for Transport has commissioned two major pieces of research on e-scooters, whose findings largely reflect those in the wider literature. In 2020, 4,046 adults aged 16+ in Great Britain were interviewed (Kantar 2021). 90% were ‘aware’ of e-scooters, whilst 53% claimed to have some degree of knowledge (15% knew a lot or a fair amount and 38% knew a little). Levels of knowledge and interest were higher amongst males, younger respondents, those living in urban areas, and those from higher social grades. In that survey, 7% reported that they had ever used an e-scooter. If legal and available, 9% of respondents thought it was likely that they would buy an e-scooter and 15% said it was likely that they would hire one. Safety was seen as the overriding disadvantage among respondents, cited by 53%.
In July 2020, e-scooter city trials started in England, and were evaluated at the end of 2021 (Ove Arup & Natcen, 2022), with activities including evaluation of 14.5 million trips, together with surveys of 6,864 users and 3,620 residents living in trial areas. 71% of users were male, and 74% were aged under 35. Motivations for use included time and cost savings, convenience and enjoyment, with e-scooters generally deemed quicker than users’ alternatives. 29% said that they were motivated to choose e-scooters over other modes because they were better for the environment. The novelty factor initially attracted new users but became less important over time. A recurring motivation among female participants was that using an e-scooter was safer than walking home at night in the dark. In December 2021, 21% of trips were reported to substitute for private transport (car, van or taxi), 9% would not have been made, whilst the remainder replaced walking, cycling or public transport use. Over the study period, the share of utility trips and the proportion substituting for car use increased.
In the residents’ survey, 43% had either tried an e-scooter or were interested in doing so, though the share was dependent on age. Women and older people were more likely to express safety concerns, and e-scooters were perceived as more of a safety risk than either bicycles or e-bikes, by pedestrians, drivers, and cyclists alike. Although most e-scooter users reported feeling safe on e-scooters, with their confidence growing over time, the majority also considered them less safe than all other modes of transport, with the exception of mopeds and motorcycles.
However, at that time, only 4% of resident survey respondents felt that e-scooter use should be illegal. Around half (51%) of residents saw e-scooters as a positive addition to their local transport system, with similar proportions agreeing that e-scooters were good for the environment (56%), that they were a good alternative to other forms of transport (52%) and that their local area was well-suited to e-scooter use (44%). There was some indication that views were becoming more negative over time, and that older age groups were less positive.
3. Methods
3.1. Survey Instrument
As part of the ELEVATE research project (Philips et al. 2024; 2025), a survey was designed to investigate the use, perceptions, and attitudes of the adult English population towards e-micromobility. The questionnaire was composed of 7 main sections. First, three successive sections, shown in randomised order, for e-bikes, e-cargo bikes and e-scooters respectively, enquired about people’s use, ownership and attitudes towards each mode. Then, respondents were asked about their ownership, use and hire of other transport modes. The fifth section asked more general attitudinal questions relating to travel and the environment. Section 6 asked a series of questions about physical activity, taken from the WHO’s GPAQ questionnaire (WHO 2021). Finally, socio-demographic characteristics were collected.
At the start of each e-micromobility section, a short description of the mode was given including a cost estimate and 1 or 2 pictures (see Table 2). A first question asked respondents if they owned the mode or accessed it in another way, and then their intention to purchase (another) one. Three questions were then formulated differently for owners and non-owners about affordability, ease of storage and risk of theft. Then, respondents were asked how frequently they used the mode, if they knew anyone personally who regularly used one and if they would like to try one. They were also asked four opinion questions. Finally, seven statements asked about their attitudes towards use on a 5-level Likert scale, together with a “don’t know/prefer not to say” answer choice. These questions were asked in the conditional for non-users of the mode (defined as those not using it at least once a month). Users received an additional question about car substitution.
3.2. Data Collection and Analysis
The survey was disseminated online by the market research company YouGov Plc through their panel. It ran from 31st May to 18th July 2023. Active sampling was conducted, aiming to ensure representativeness across region, age, gender, ethnicity and social grade - see Table A1 in Appendix for a comparison of survey respondent characteristics with 2021 Census data (Office for National Statistics 2021) and National Travel Survey data (Department for Transport 2023). Responses were received from 2,000 English adults. YouGov provided weighting to provide full representativeness for the characteristics listed. However, unweighted data have been used in this paper, on the basis that the match between the sample and the other data sources was relatively good, and because the use of weights risked distortion to some of the smaller sub samples considered (such as e-cargo bike users). Although not used for sampling, the survey was paused after initial launch and checks were made on the shares of frequent cyclists and car owners responding, in case the initial survey description unintentionally led to an over-representation of frequent cyclists or non-car-owners. In fact, it was the opposite - our survey captured a smaller share of frequent cyclists, and a slightly higher share of car owners, compared with the National Travel Survey, reducing concerns about possible bias.
Statistical analyses have been performed in R (R Core Team 2021). Descriptive statistics are reported. Column headings give the total number of people in each category, but do not always give the sample size then used to calculate the proportions below, as ‘don’t know / prefer not to say’ responses were excluded from calculations, unless stated. Pearson’s Chi-squared tests and t-tests were conducted for bivariate comparisons on categorical or continuous variables respectively, and reported effect sizes are measured with Cohen’s d. For the 5-point interval scales, ‘don’t know’ responses have either been removed, or merged into the neutral responses where applicable. Differences between independent groups have been assessed with the Wilcoxon Rank Sum test. Most statistical relations were tested, but only headline results are shown for conciseness. Many of the statistical tests relate to a specific group and their inverse (e.g. e-bike users compared with non-ebike users).
As well as users of e-bikes, e-cargo bikes and e-scooters (defined as those using each of these at least once a month), we have created other groups of mobility users for analysis purposes. Specifically, we have defined e-micromobility users (also denoted as emm) as those using an e-bike, an e-cargo bike or an e-scooter at least once a month, and non-users as those who don’t. Utility cyclists have been defined as anyone cycling for transport at least once a month on any kind of bike (including e-cycles). Finally, ‘frequent walkers’ have been defined as people walking at least three times a week anywhere ‘for 20 minutes of more without stopping’ and ‘frequent car users’ have been defined as people using a car at least three times a week. There is some overlap between many of the groups (with the exception of the e-micromobility users and non-users). In particular, 62% of all e-micromobility users were also monthly utility cyclists, whilst 34% of utility cyclists were also e-micromobility users.
4. Results
In this section, we first discuss the adoption of three e-micromobility modes: e-bikes, e-cargo bikes and e-scooters. Then, we compare the profile of these e-micromobility users to non-users, active mode users and frequent car users. In section 4.4, we broaden the scope by assessing interests and the potential of e-micromobility in England. Finally, in the remaining three sections we look at attitudes, barriers, and opinions towards e-micromobility or transport in general.
4.1. Levels of Adoption of e-Micromobility in England
Ownership, use and knowledge of e-bikes, e-cargo bikes and e-scooters are shown in Table 3. 11% of households owned at least one of the three modes. E-bikes were the most commonly owned of the three modes and were also the most frequently used. While lower than for e-bikes, it is notable that 4% of respondents owned an e-scooter, since the use of privately owned e-scooters on roads and cycle lanes is not allowed in the UK2. Awareness of where to hire each of the three forms of micromobility was highest for e-scooters. There was considerable overlap in ownership and use of the three modes – for example, as shown in Table 5, 62% of people who used an e-scooter at least monthly also used an e-bike at least monthly.
E-cargo bikes were the most niche, with 95% of people having never tried one and only 5% knowing someone regularly using one (compared with 28% for e-bikes). Analysis of comments made in the survey showed that many people had never even heard of e-cargo bikes before (Glachant et al. 2025). Two-thirds of respondents did not know anyone using an e-micromobility mode regularly.
Looking in more detail at frequencies of use, the data showed that 6% of respondents were using at least one of the three e-micromobility modes weekly with 9% doing so at least monthly. If including people cycling regularly, the proportion increased to 14% weekly, 21% monthly, and if including those walking for more than 20 minutes, the share rose to 76% weekly, 86% monthly. Hence, whilst micromobility modes are, individually niche, when combined with each other, and with other active travel, a much larger proportion of the population stands to benefit from policies which favour them.
4.2. Socio-Demographic Profile of Different Groups of Mobility Users
Table 4 considers the key socio-demographic characteristics of different mode use groups (whilst additional analysis was also performed relating to e-micromobility ownership). E-micromobility modes were being used more by men than women (p < .001). This gender difference was even stronger when considering utility cyclists compared to non-utility cyclists (p < .001). In contrast, frequent walkers and car users had a gender balance which reflected the general population. Men were more likely to be in a household that owned an e-bike than women (p = 0.017), whilst no significant gender differences were found for ownership of the e-cargo bikes or e-scooters (not least, perhaps, because people were asked about household ownership rather than personal ownership).
In terms of age, (e-)micromobility users were more likely to be young, with over half being under 35. Few users of e-cargo bikes and e-scooters were over 50 (<6.5%), while 25% of e-bike users were. Owners of e-micromobility modes were also significantly younger than non-owners for all modes (p < .001). This age difference was less strong for e-bikes (t = 5.34, p < .001, d= 0.43) than e-cargo bikes (t = 12.8, p < .001, d = 1.1) and e-scooters (t =10.78, p < .001, d = 0.86) as indicated by their larger effect sizes. Specifically, median values indicated that over half of e-bike owners were under 40, e-cargo bike owners were under 30 and e-scooter owners were under 35.
Another key finding was that more than half of e-micromobility users had children in their household (increasing to 70% for e-cargo bike and e-scooter users), while this was not the case for cyclists and frequent walkers. This may partly be a reflection of the age biases for e-micromobility use. E-micromobility users, especially e-cargo bike users (p = .03) and e-scooter users (p = .005) were more likely to be located in urban areas compared to rural areas. Compared to non-users, e-micromobility users were also more likely to be other than white, to be employed and to have a degree.
We also compared the BMI of the different mode users, based on height and weight data stored by YouGov about their panel members, together with information asked about physical activity. These data showed that e-micromobility users, utility cyclists and frequent walkers were more likely to have a healthy BMI than their counterparts (although only the difference for frequent walkers, compared to non-frequent walkers, was statistically significant). They were also statistically significantly less likely to be sedentary for 8 hours or more and were more likely to be meeting physical activity guidelines (of 600 METS)3. E-micromobility users were also, on average, undertaking 3 times the amount of active travel (defined to include use of e-bikes and e-cargo bikes4) as non-users, twice as much as frequent walkers, and 25% more than utility cyclists. (noting that there were some overlaps of membership between all of the groups5). Each category of e-micromobility user also included a higher share of people with a disability that their counterparts, potentially indicating the value of electrical assistance to people with mobility problems.
4.3. Mobility Profile of Different Groups of Mobility Users
All respondents were asked about how often they were using a range of different transport options. For each mobility user group, Table 5 shows the share who were using different transport modes regularly. 83% of e-micromobility users were in a household with access to a car, compared to 81% of non e-micromobility users, and 82% of e-micromobility users were travelling by car at least once a month. However, they were significantly less likely to be frequent car users. Specifically, 62% of e-micromobility users were using a car at least once a week, compared with 72% of non-e-micromobility users, a statistically significant difference (χ2 emm = 6.84, p = .009) and 47% were doing so 3+ times a week, compared with 55% (χ2 emm = 3.30, p = .06). Compared to non-users, e-micromobility users were also significantly more likely to use other transport modes monthly, including buses (51% vs 32%), trains (45% vs 24%), taxis (39% versus 15%) and mopeds (26% vs 2.4%); p < .001 in each case. In contrast, e-micromobility users were less likely to walk frequently, with 46% walking at least 3 times a week for 20 minutes or more without stopping, compared to 53% of non-users (p =.015), though with a similar share of both groups walking at least once a month for at least 20 minutes.
Interestingly, the same was not true for utility cyclists, who were more likely to be frequent walkers than the general population. It is hard to know whether this indicates that e-micromobility modes are more likely to substitute for walk trips than conventional bikes, or because conventional cycle trips are more likely to be undertaken in diverse environments where walking may be a more appropriate mode in some situations.
4.4. Interest in, and Potential of, e-Micromobility Modes
The survey asked ‘on a scale of 1-5, how interested would you be in...’ and then included ‘the opportunity to try out an e-[mode] for a few minutes in the local park’ and ‘the free loan of an e-[mode] for a month’. Questions were asked for e-bikes, e-scooters and e-cargo bikes, and the ‘few minutes’ questions were also asked for a range of less conventional e-micromobility vehicles (each illustrated by a picture). Separately, people were also asked how likely their household was to buy the three types of e-micromobility in the next 12 months. Both questions on e-scooters clarified that this was in a context where it became legal to use e-scooters where conventional bikes can be ridden in the UK. Users were asked whether they were happy to be identified as a user of each mode, whilst non users were asked if they could see themselves doing so regularly. People were also asked whether they thought people who were important to them would approve of them doing so.
As shown in Table 6, there were remarkably high levels of interest in each mode among those who were not regular users – with 46% of non-users interested in trying an e-bike; 28% interested in trying an e-cargo bike, and 38% interested in trying an e-scooter. Taken together, of all non e-micromobility users, 55% were interested in trying out at least one form of e-micromobility for a few minutes in a local park and 51% were interested in a free monthly loan. The proportions of non-users who saw themselves as a potential regular user were smaller, though at least 10% for all three modes (rising to 25% for e-bikes), and, for each mode, a higher share thought that people important to them would approve of them doing so.
Among regular users, more than three-quarters were still interested in future opportunities to try them. Likelihood of purchasing in the next 12 months was also remarkably high amongst existing users (45% for e-bike users, 64% for e-cargo bike users and 62% for e-scooter users), which was partly due to the fact that many users were not in households that owned these vehicles (23% of e-bikes users were in households that did not own e-bikes, 57% for e-cargo bikes and 52% for e-scooters). Conversely, only a small proportion of non-user households (8%) said they were likely to purchase them (5% for e-bikes, 2% for e-cargo bikes and 4% for e-scooters). Taken together, these findings indicate the importance of being able to try out these vehicles as part of making purchase decisions and that many people might be interested in trial opportunities.
Looking at levels of interest in these three modes in more depth, there were no significant gender or age differences in terms of interest in trying out these vehicles. However, the profile of people (users and non-users) stating they were likely to buy each micromobility mode was similar to that of the existing users - i.e. they were more likely to be young and male than average.
Table 7 provides more information about interest in trying out a range of modes for a few minutes in a local park. Interest in all the modes considered was relatively high, comprising over 20% of the population for each mode, with the exceptions of the bike for carrying a wheelchair (13%) and the electric rickshaw (19%). Two-thirds of the respondents were interested in trying at least one of the 9 modes considered, and half were interested in trying at least one of the more uncommon modes. As in the table above, existing e-micromobility users were more interested in all modes than non-users – for example, over 90% of e-cargo bike users or e-scooter users were interested in trying out an e-bike (p < .001). Utility cyclists were also significantly more likely to be interested in trying out all of the modes listed (p < 0.001) than non-cyclists. However, frequent walkers were not (p = .30).
4.5. Attitudes and Opinions on e-Bikes, e-Cargo Bikes and e-Scooters
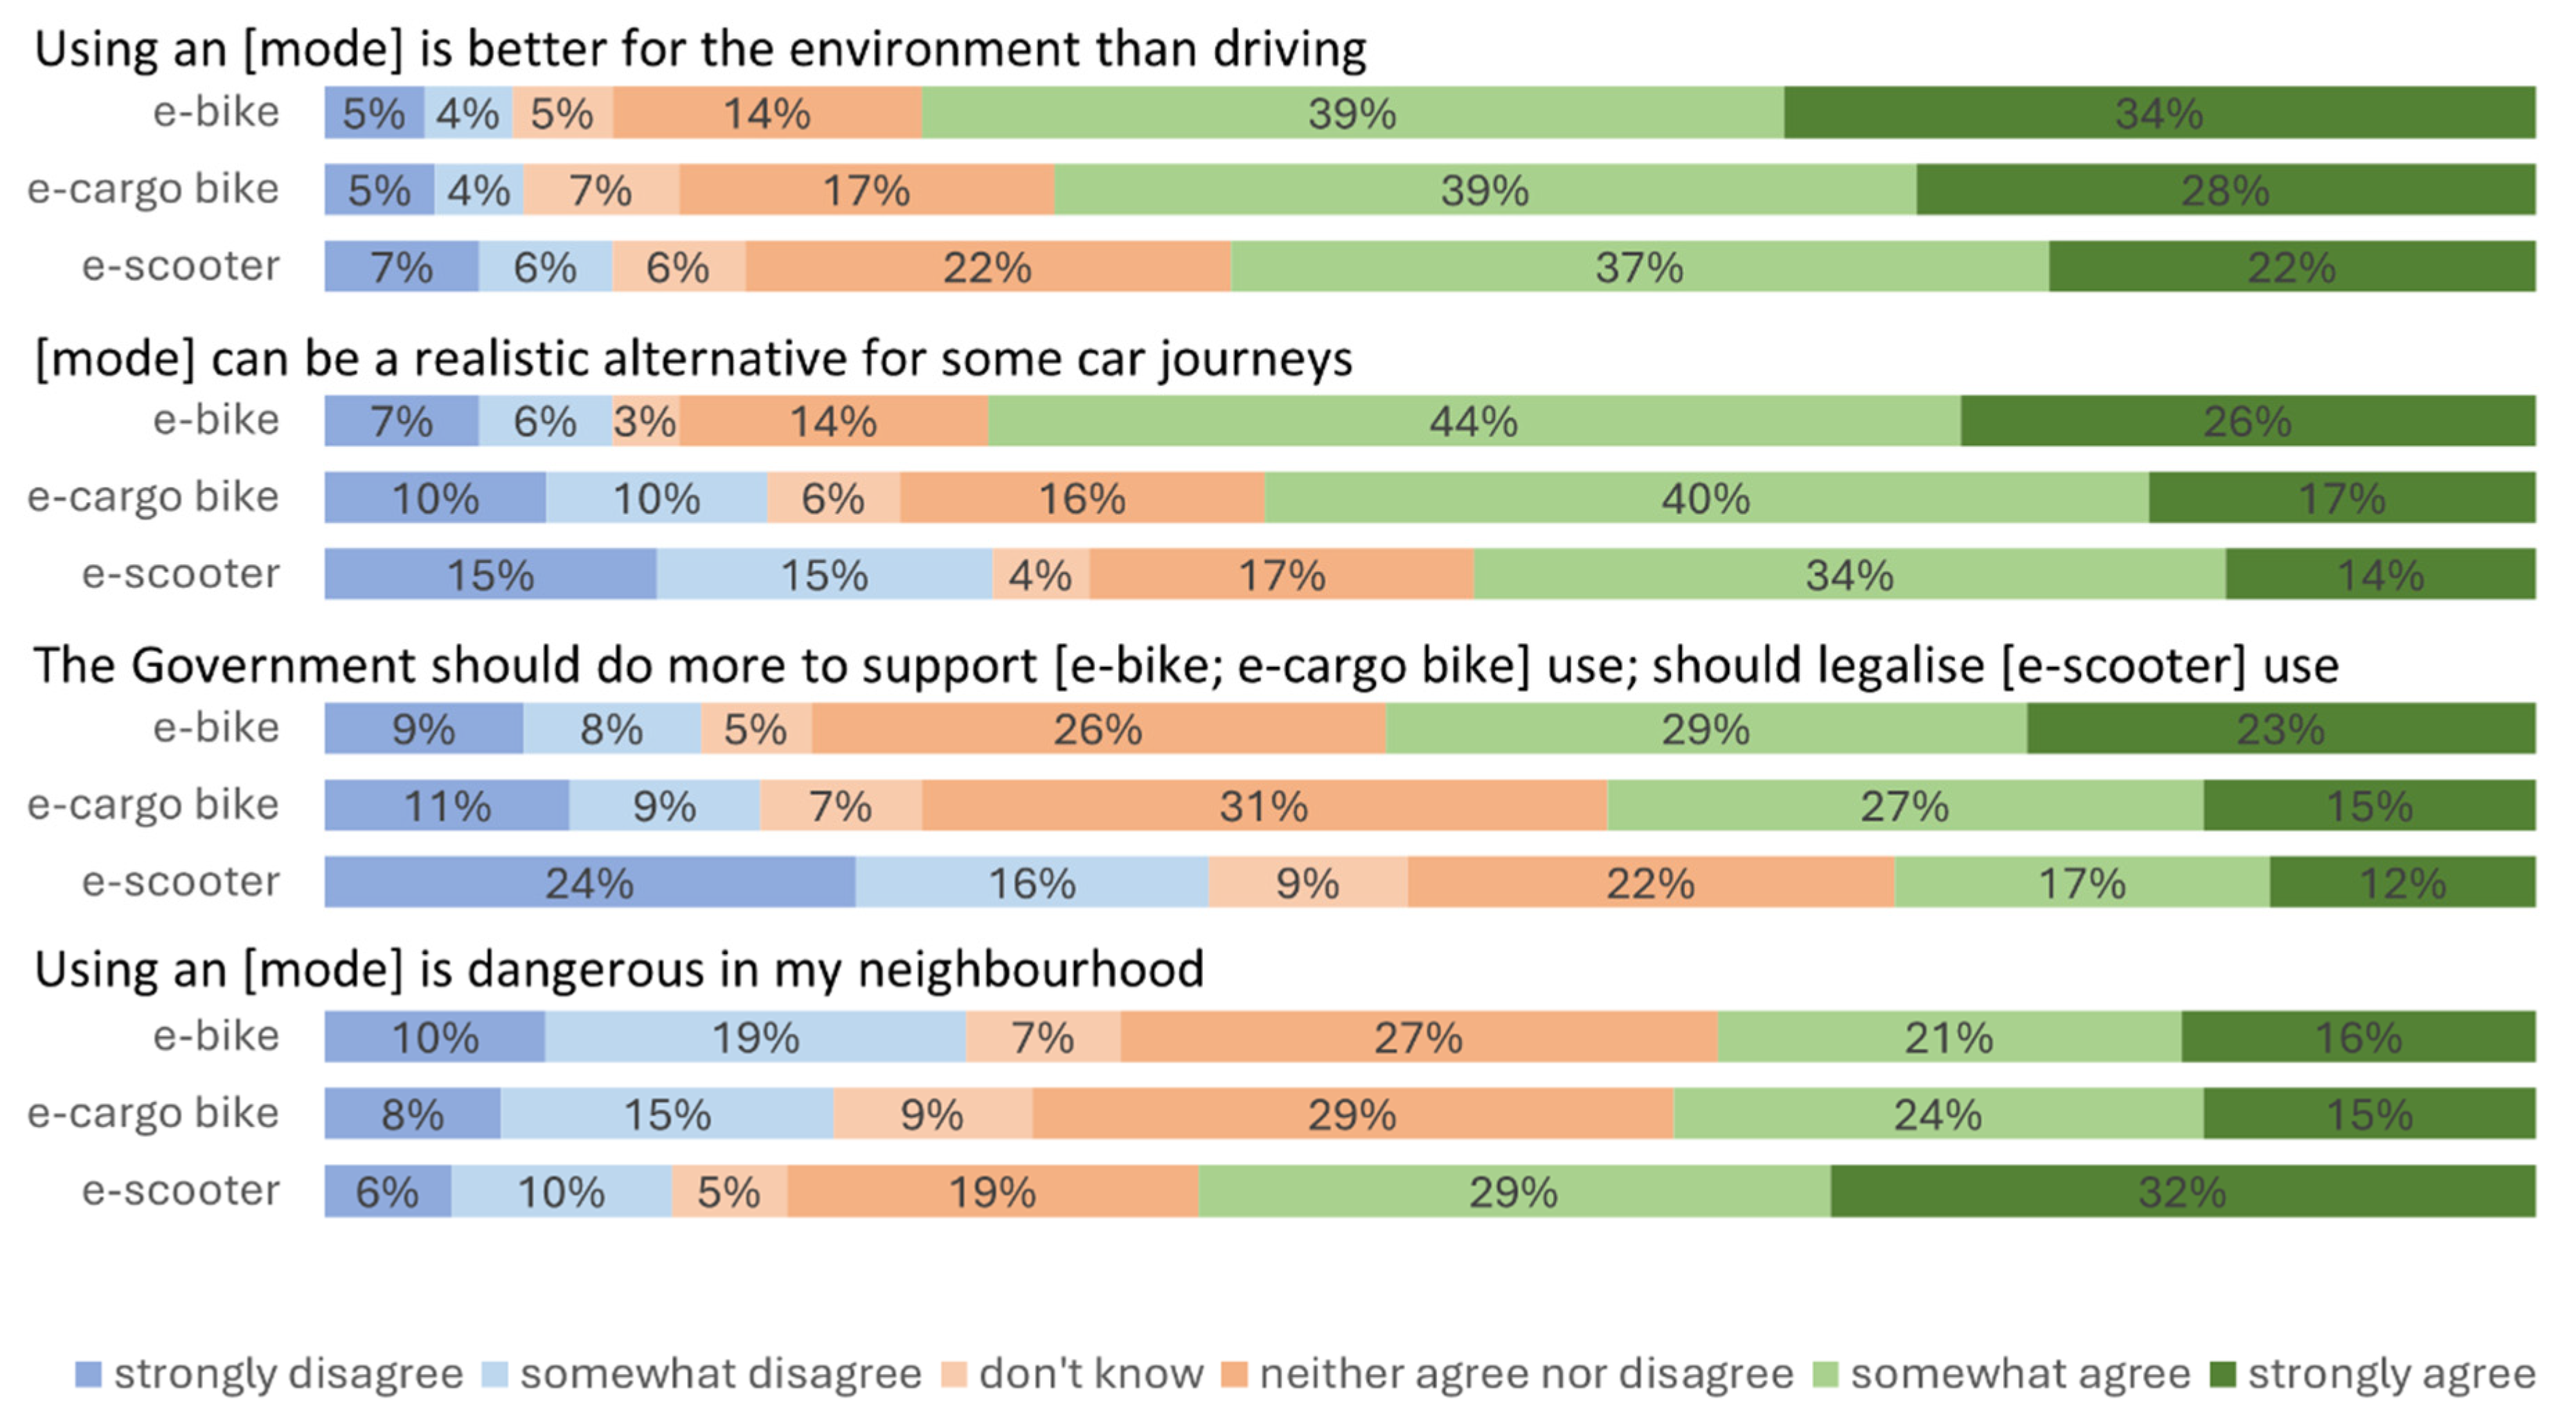
Respondents were asked for levels of agreement or disagreement with a series of opinion statements relating to the e-micromobility modes, as shown in Table 8 and in Figure 3. In general, for all respondents, opinions were more favourable towards e-bikes than the other two modes, with over 50% of non-users saying the Government should do more to support them. In addition, for all modes, users of the mode were more likely than non-users to have positive opinions on it, though these differences were greater for e-scooters than for the other modes. In particular, amongst non-users, using e-scooters in their neighbourhood was seen as dangerous by more people (60%) than e-bikes (37%) or e-cargo bikes (39%). Non-users were also more likely to be neutral or say ‘don’t know’ when asked about whether modes should receive Government support, or how dangerous they are to use in the local neighbourhood.
For all statements and modes, a higher proportion of younger adults were in favour of e-micromobility than older adults. For example, support for e-scooters was significantly lower among adults over 50: 69% considered using them in their local neighbourhood to be dangerous (p< .001) and 48% did not think they should be legalised (p< .001), compared to adults aged less than 50 where 50% considered using them dangerous and 29% did not think they should be legalised.
Figure 3.
a: Opinions of e-micromobility users about the mode they use: e-bike, e-cargo bike or e-scooters. For e-scooters, due to their different legal context in the UK, the third statement is different: “The Government should legalise private e-scooter use”. Percentages are only given on the chart if they are above 3%.
Figure 3.
a: Opinions of e-micromobility users about the mode they use: e-bike, e-cargo bike or e-scooters. For e-scooters, due to their different legal context in the UK, the third statement is different: “The Government should legalise private e-scooter use”. Percentages are only given on the chart if they are above 3%.
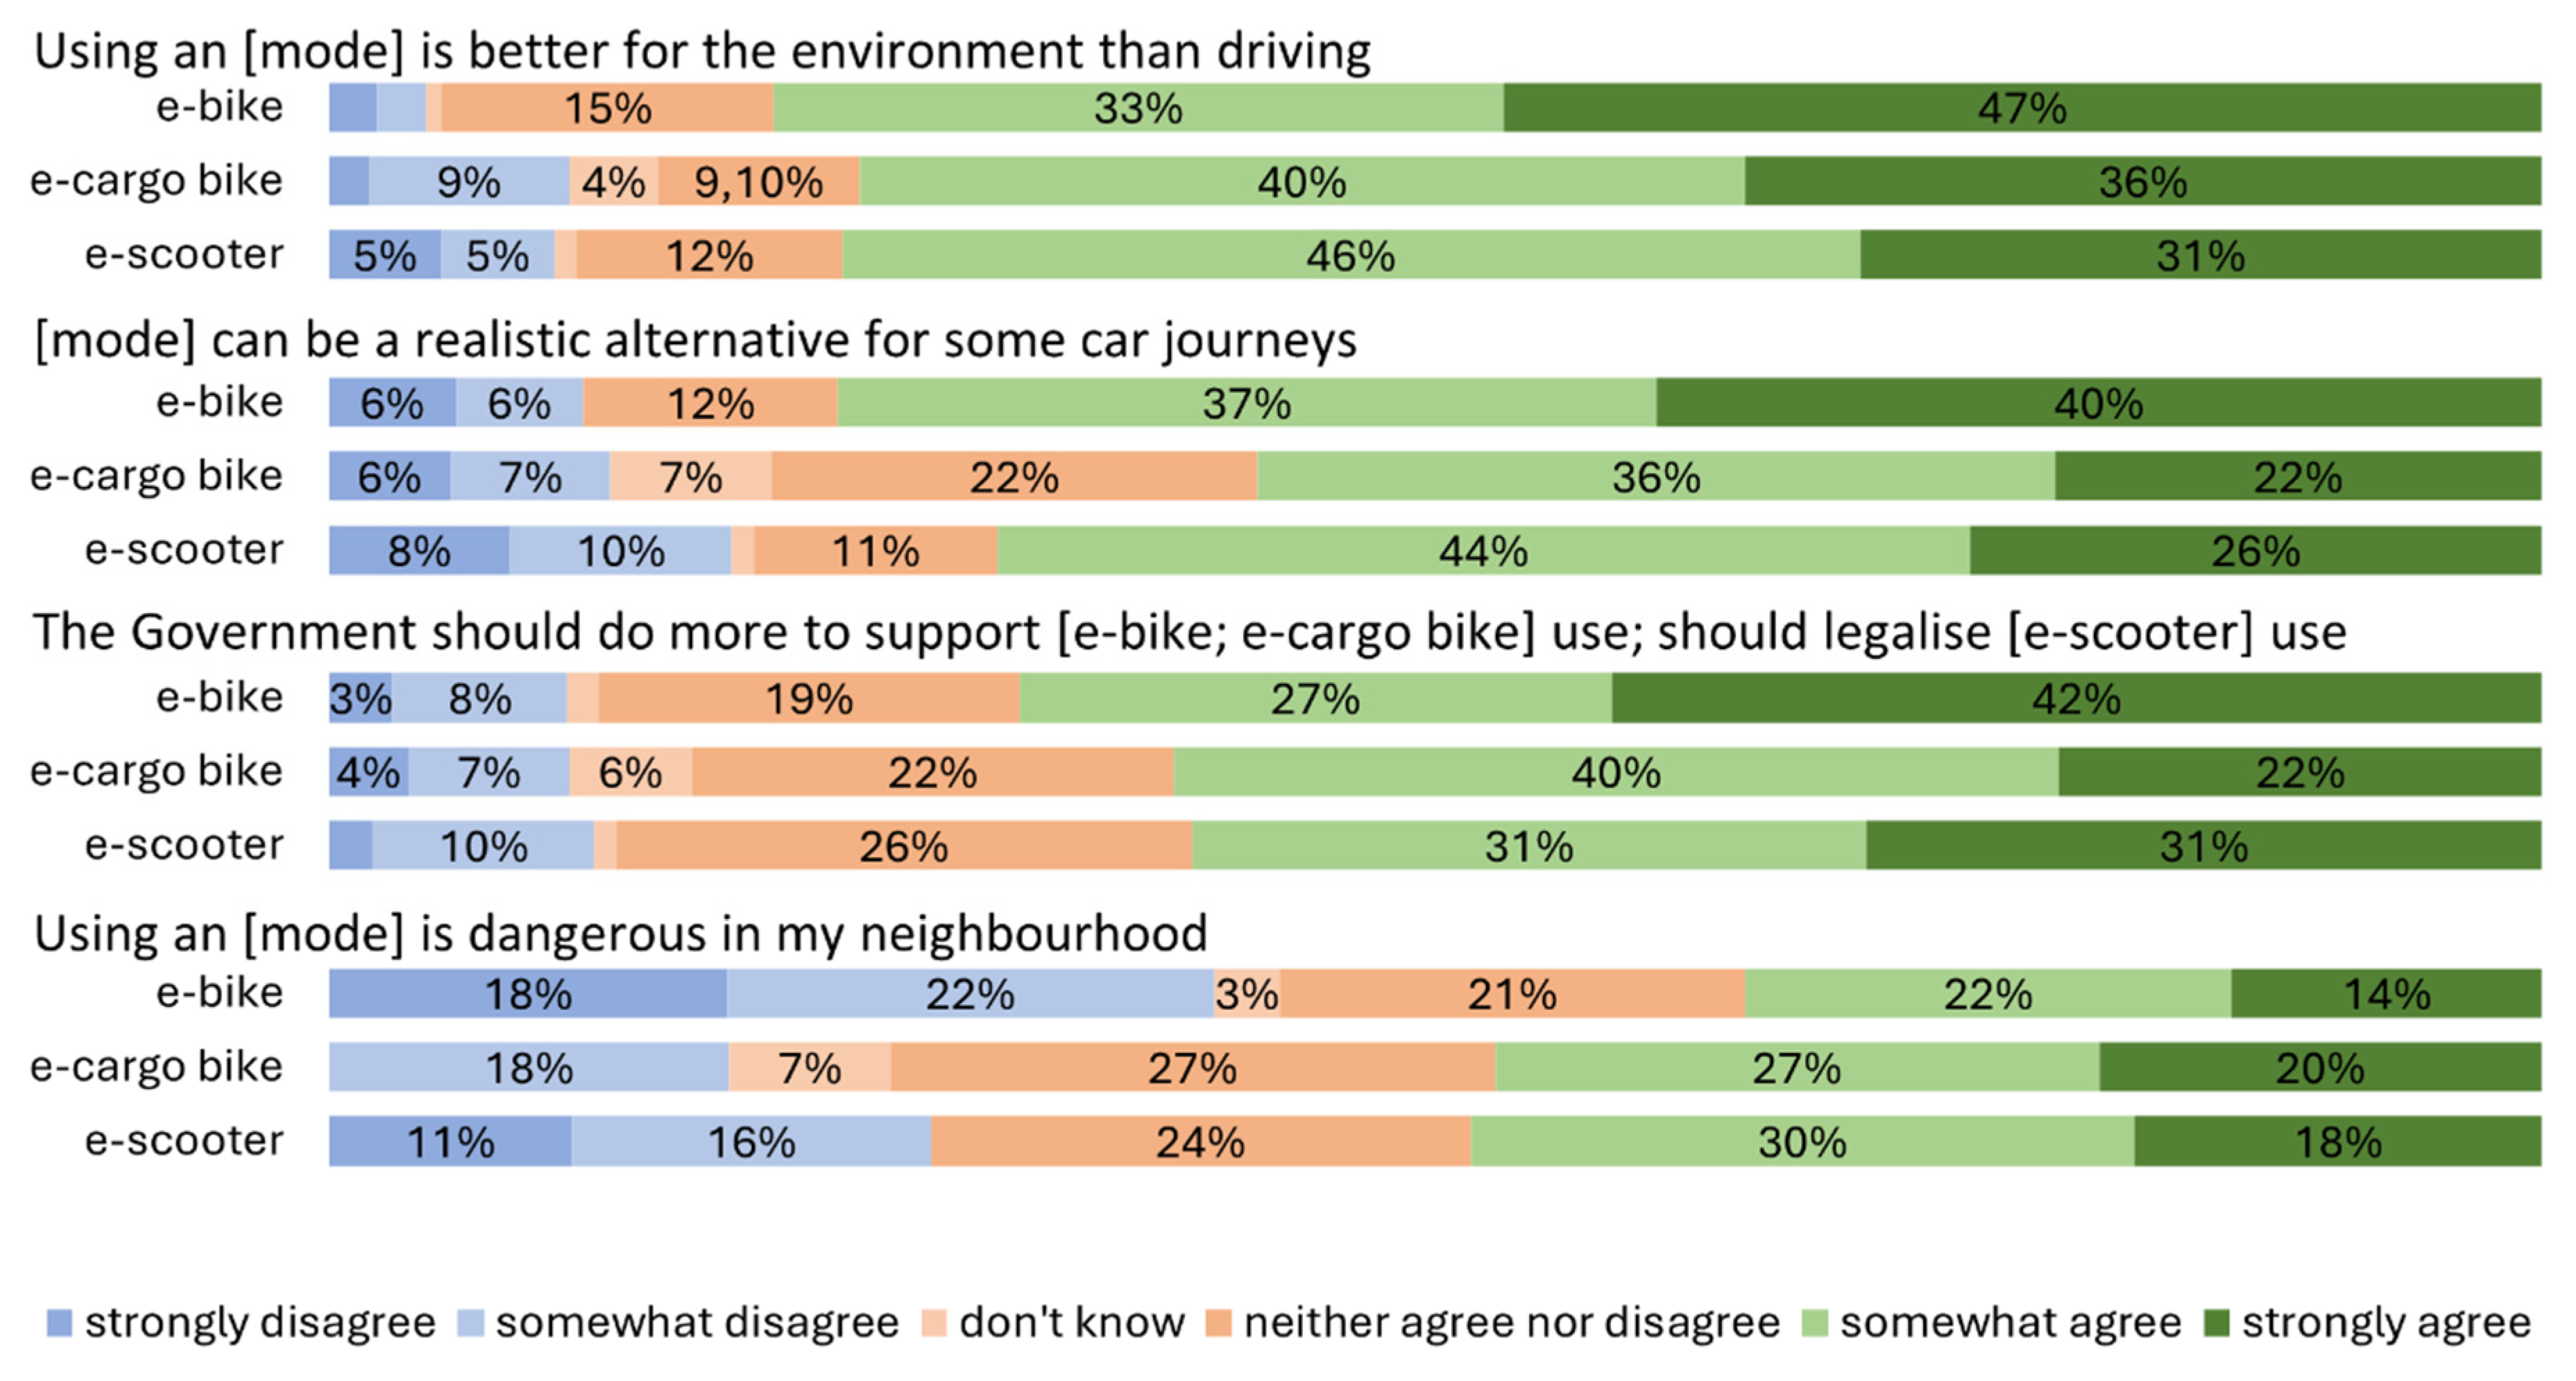
Figure 3.
b: Opinions of non-users of the modes regarding e-bike, e-cargo bike and e-scooters. For e-scooters, due to their different legal context in the UK, the third statement should be read as: “The Government should legalise private e-scooter use”.
Figure 3.
b: Opinions of non-users of the modes regarding e-bike, e-cargo bike and e-scooters. For e-scooters, due to their different legal context in the UK, the third statement should be read as: “The Government should legalise private e-scooter use”.
4.6. Barriers To access
Table 9 and Figure 4 indicate responses to some questions about barriers to ownership of e-micromobility vehicles. Affordability is one of the key barriers to ownership. Among non-owners, only 49% agreed they could easily afford an e-scooter; 38% an e-bike; and 24% an e-cargo bike. Storage was also seen as difficult for 46% of non-owners in the case of an e-bike, 31% for an e-scooter and 69% for an e-cargo bike. Theft was also a worry, shared by at least two-thirds of non-owners for all three modes (see Figure 4). Among owners, theft was still a worry, although to a lower extent for e-scooters, possibly because owned e-scooters are small and designed to be easily taken inside a building for storage. While they already owned the mode, storage was still reported to be difficult for some, with 30% of e-bike owners and 55% of e-cargo bike owners agreeing that storing an e-(cargo) bike at home is difficult.
4.7. General Attitudes of e-Micromobility Users and Non-Users
Table 10 and Table 11 and Figure 5a, Figure 5b and Figure 6 provide some insights on the attitudes of e-micromobility users and others to car use, travel and related issues. These aimed to probe general interest in environmental issues and support for car use restrictions; to understand personal car dependence; and to understand other factors that might affect use and future take-up of e-micromobility modes.
Figure 5.
a: Intensity of opinions of users and non-users of e-micromobility.
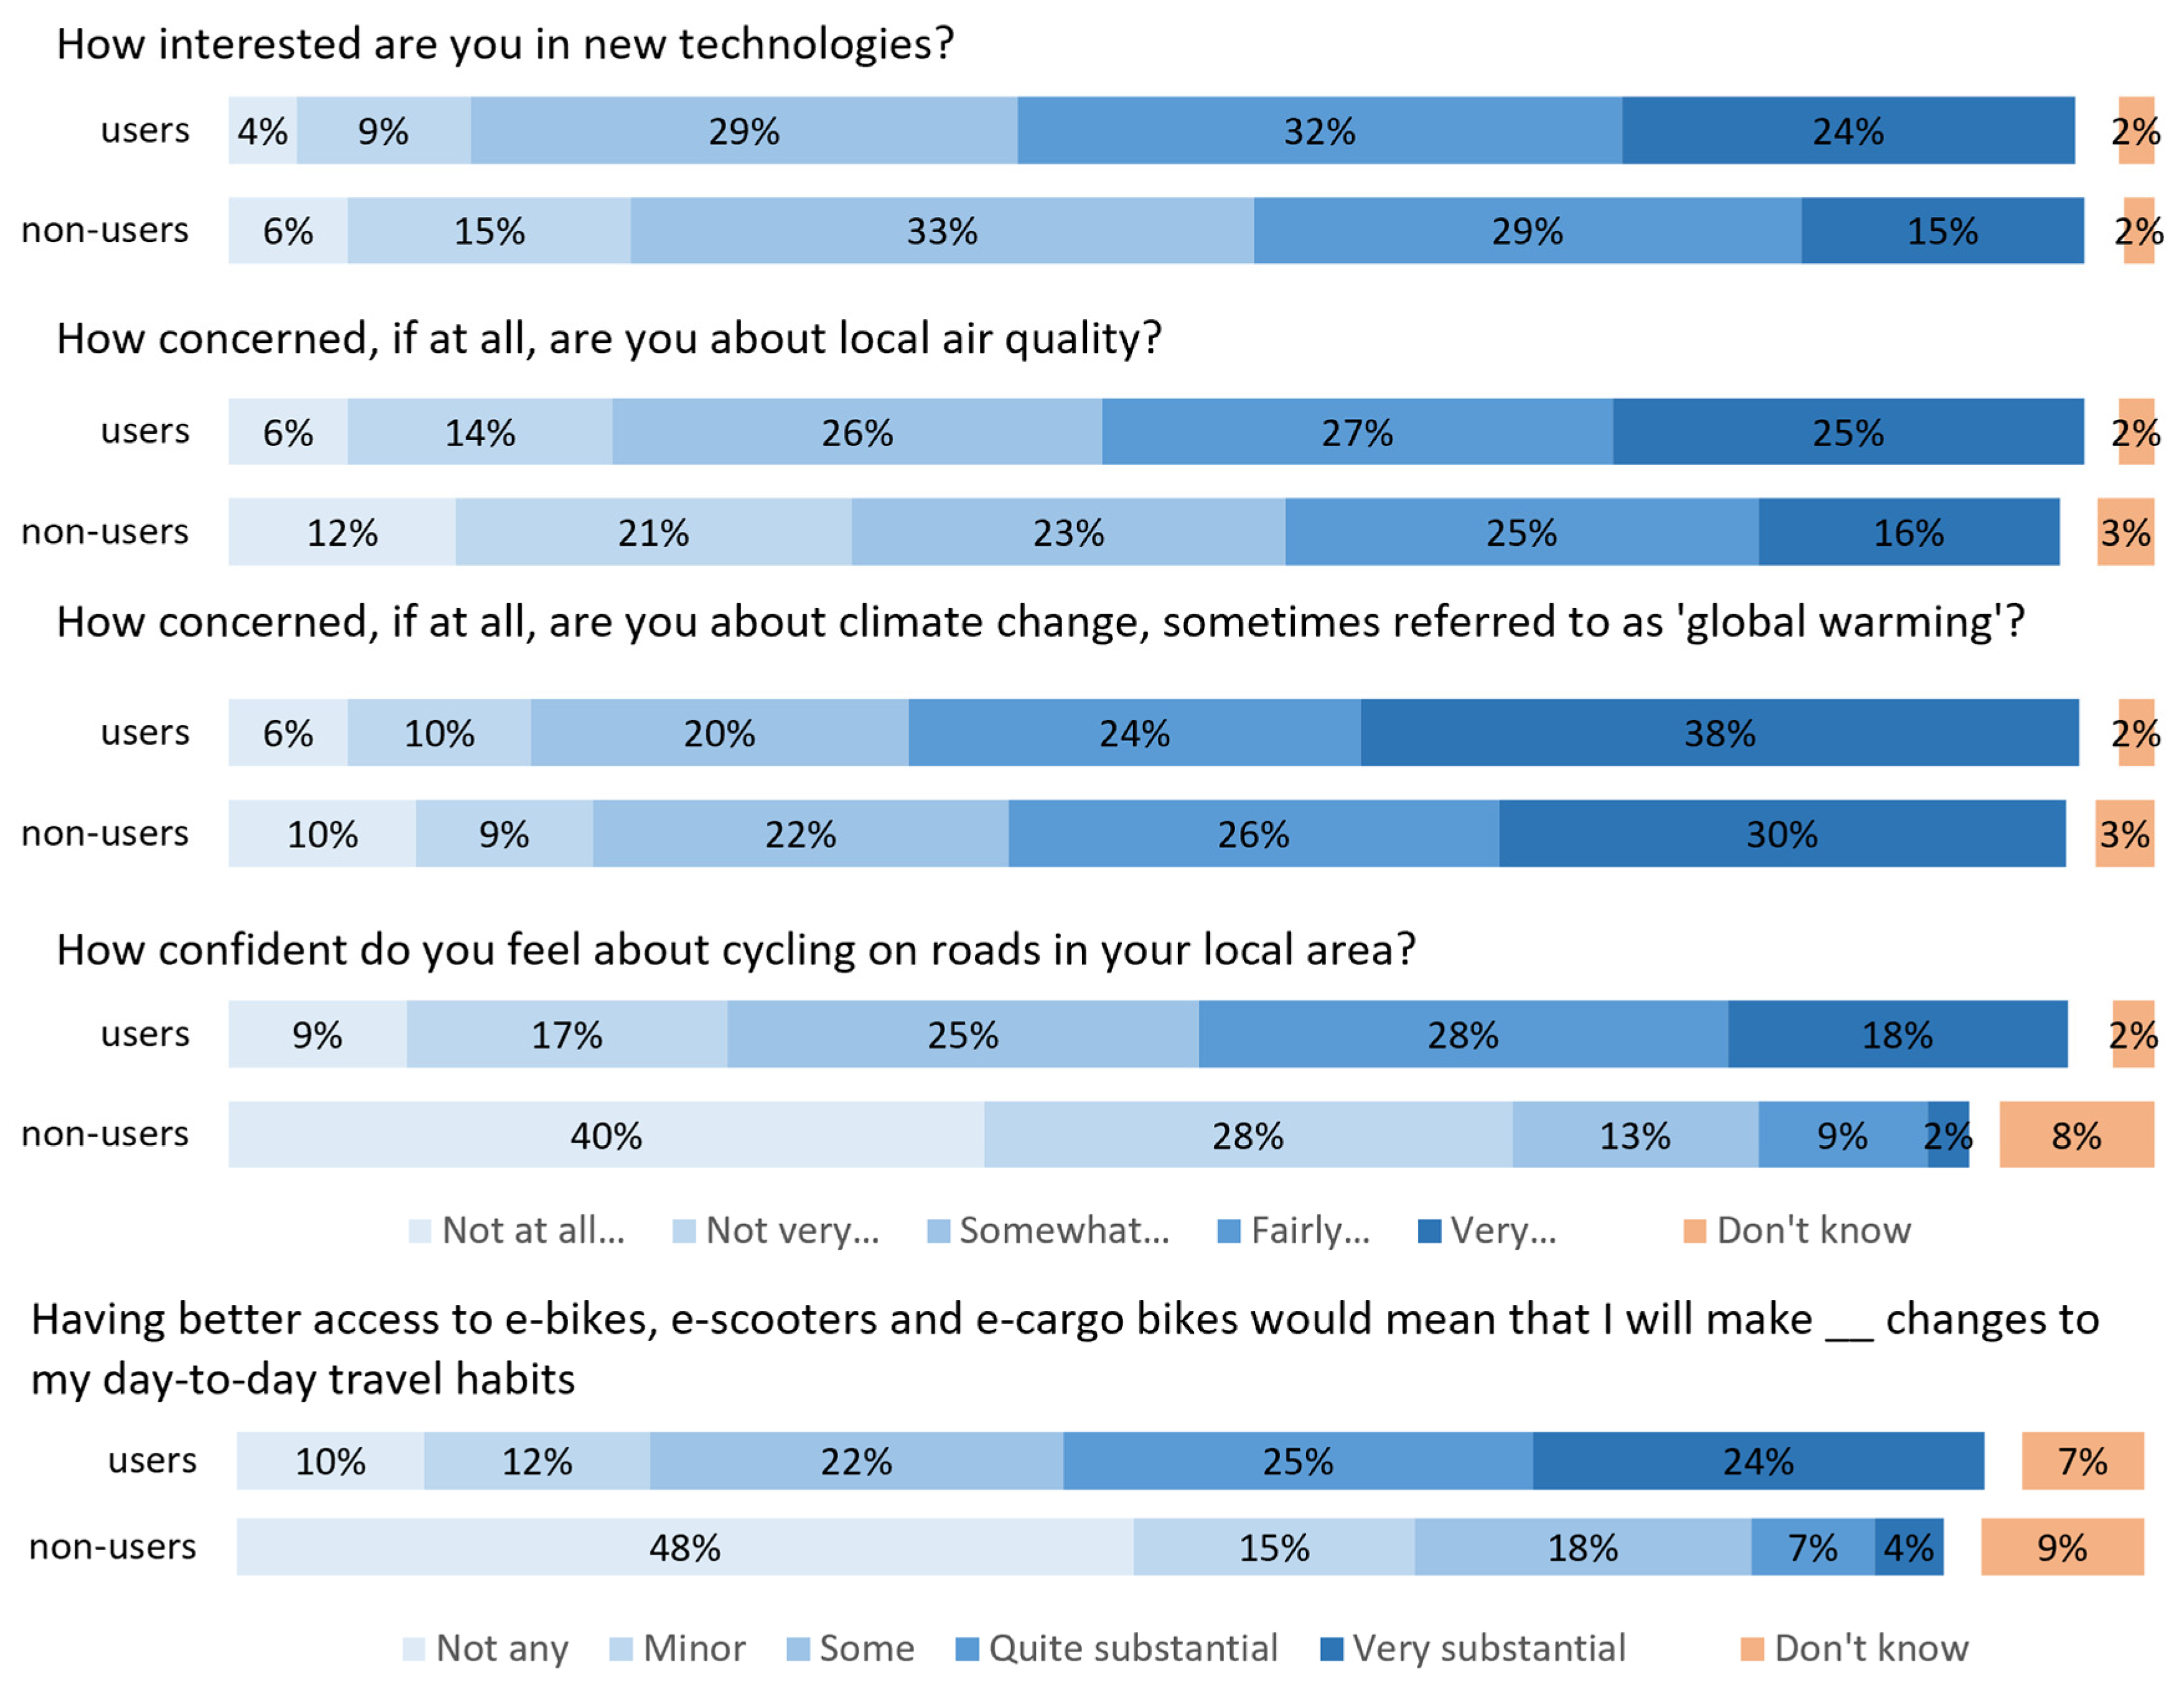
Figure 5.
b: Positive and negative opinions of users and non-users of e-micromobility.
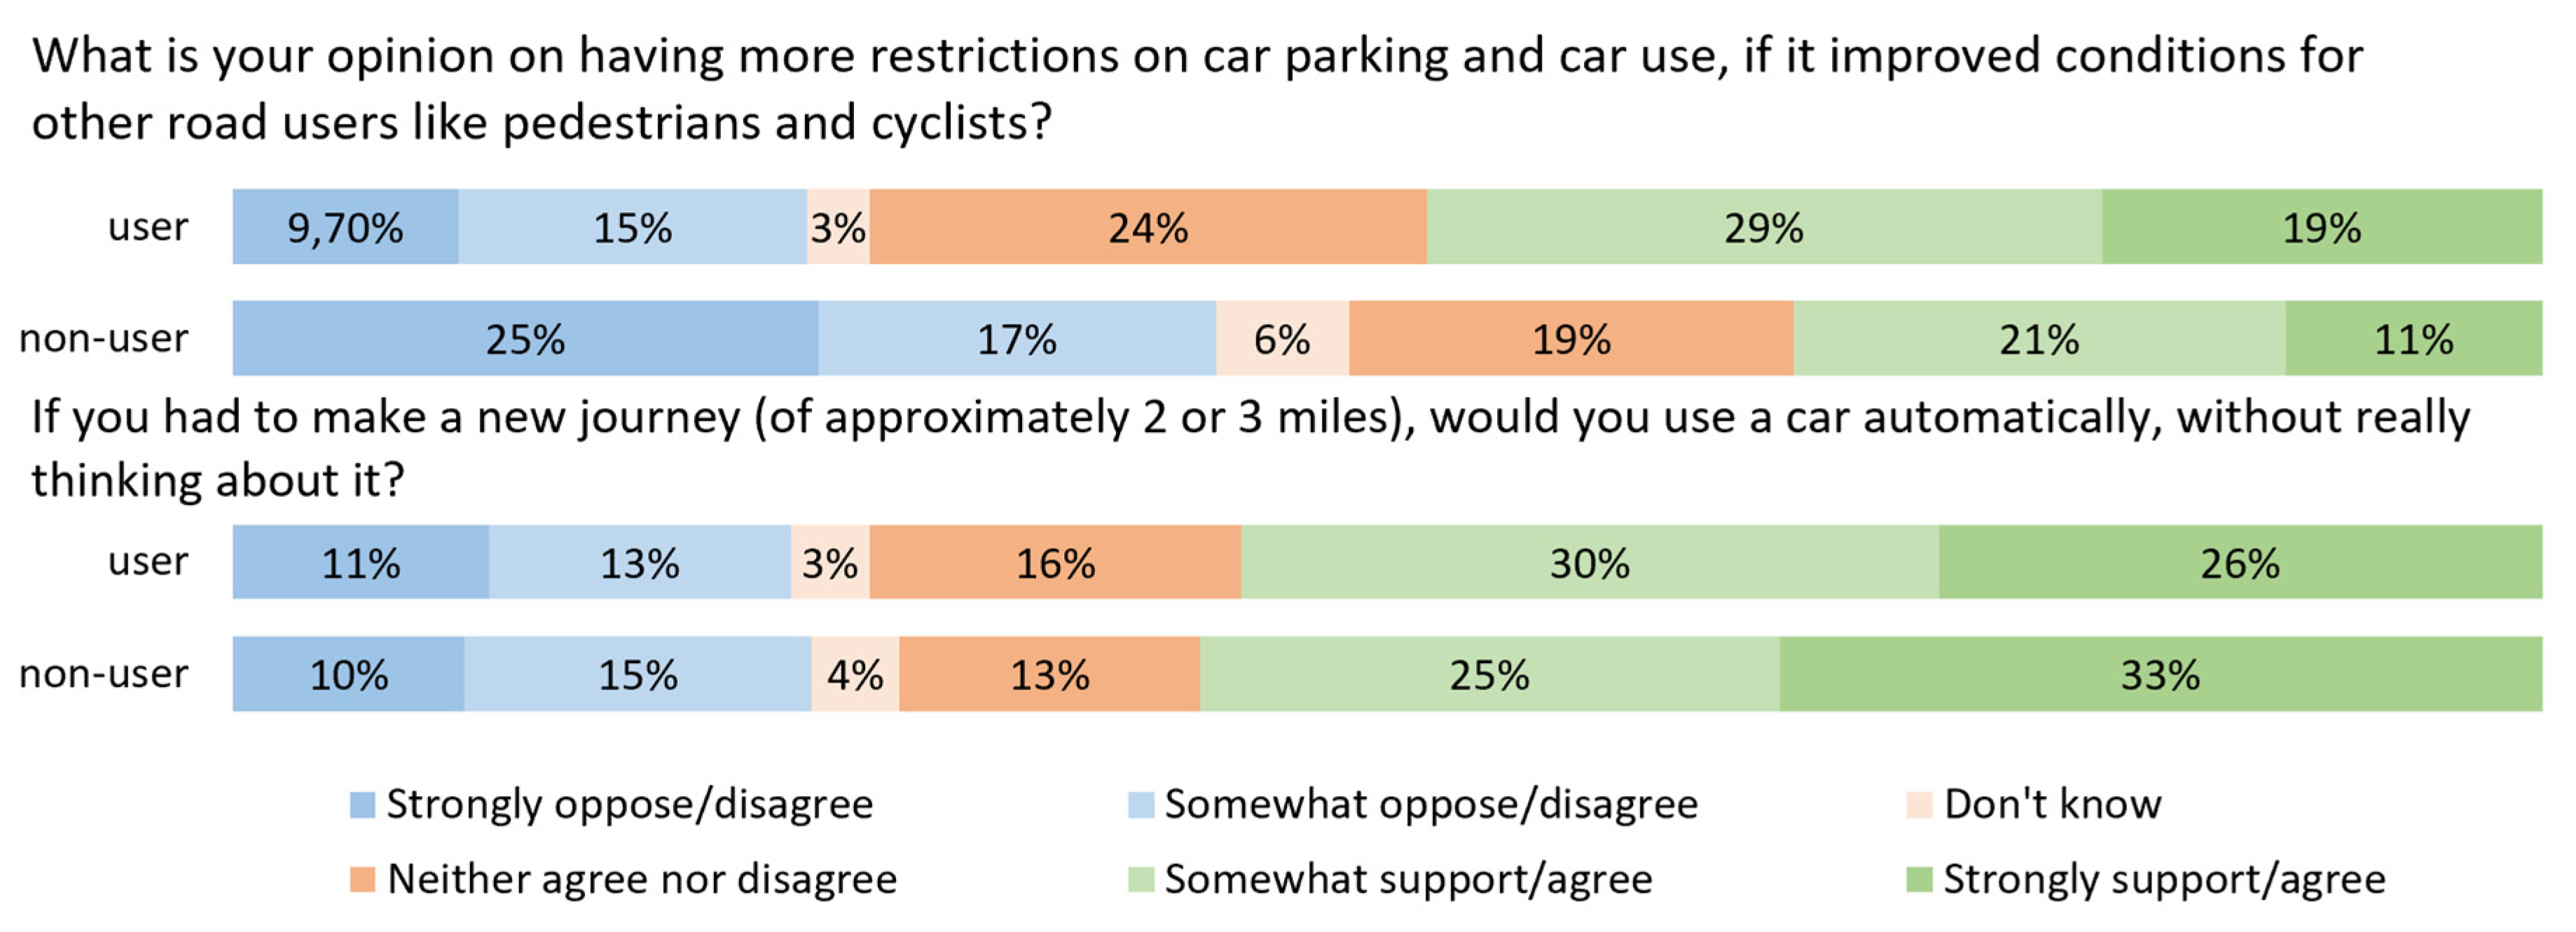
Figure 6.
Attitudes towards driving and car use of e-micromobility users and non-users.
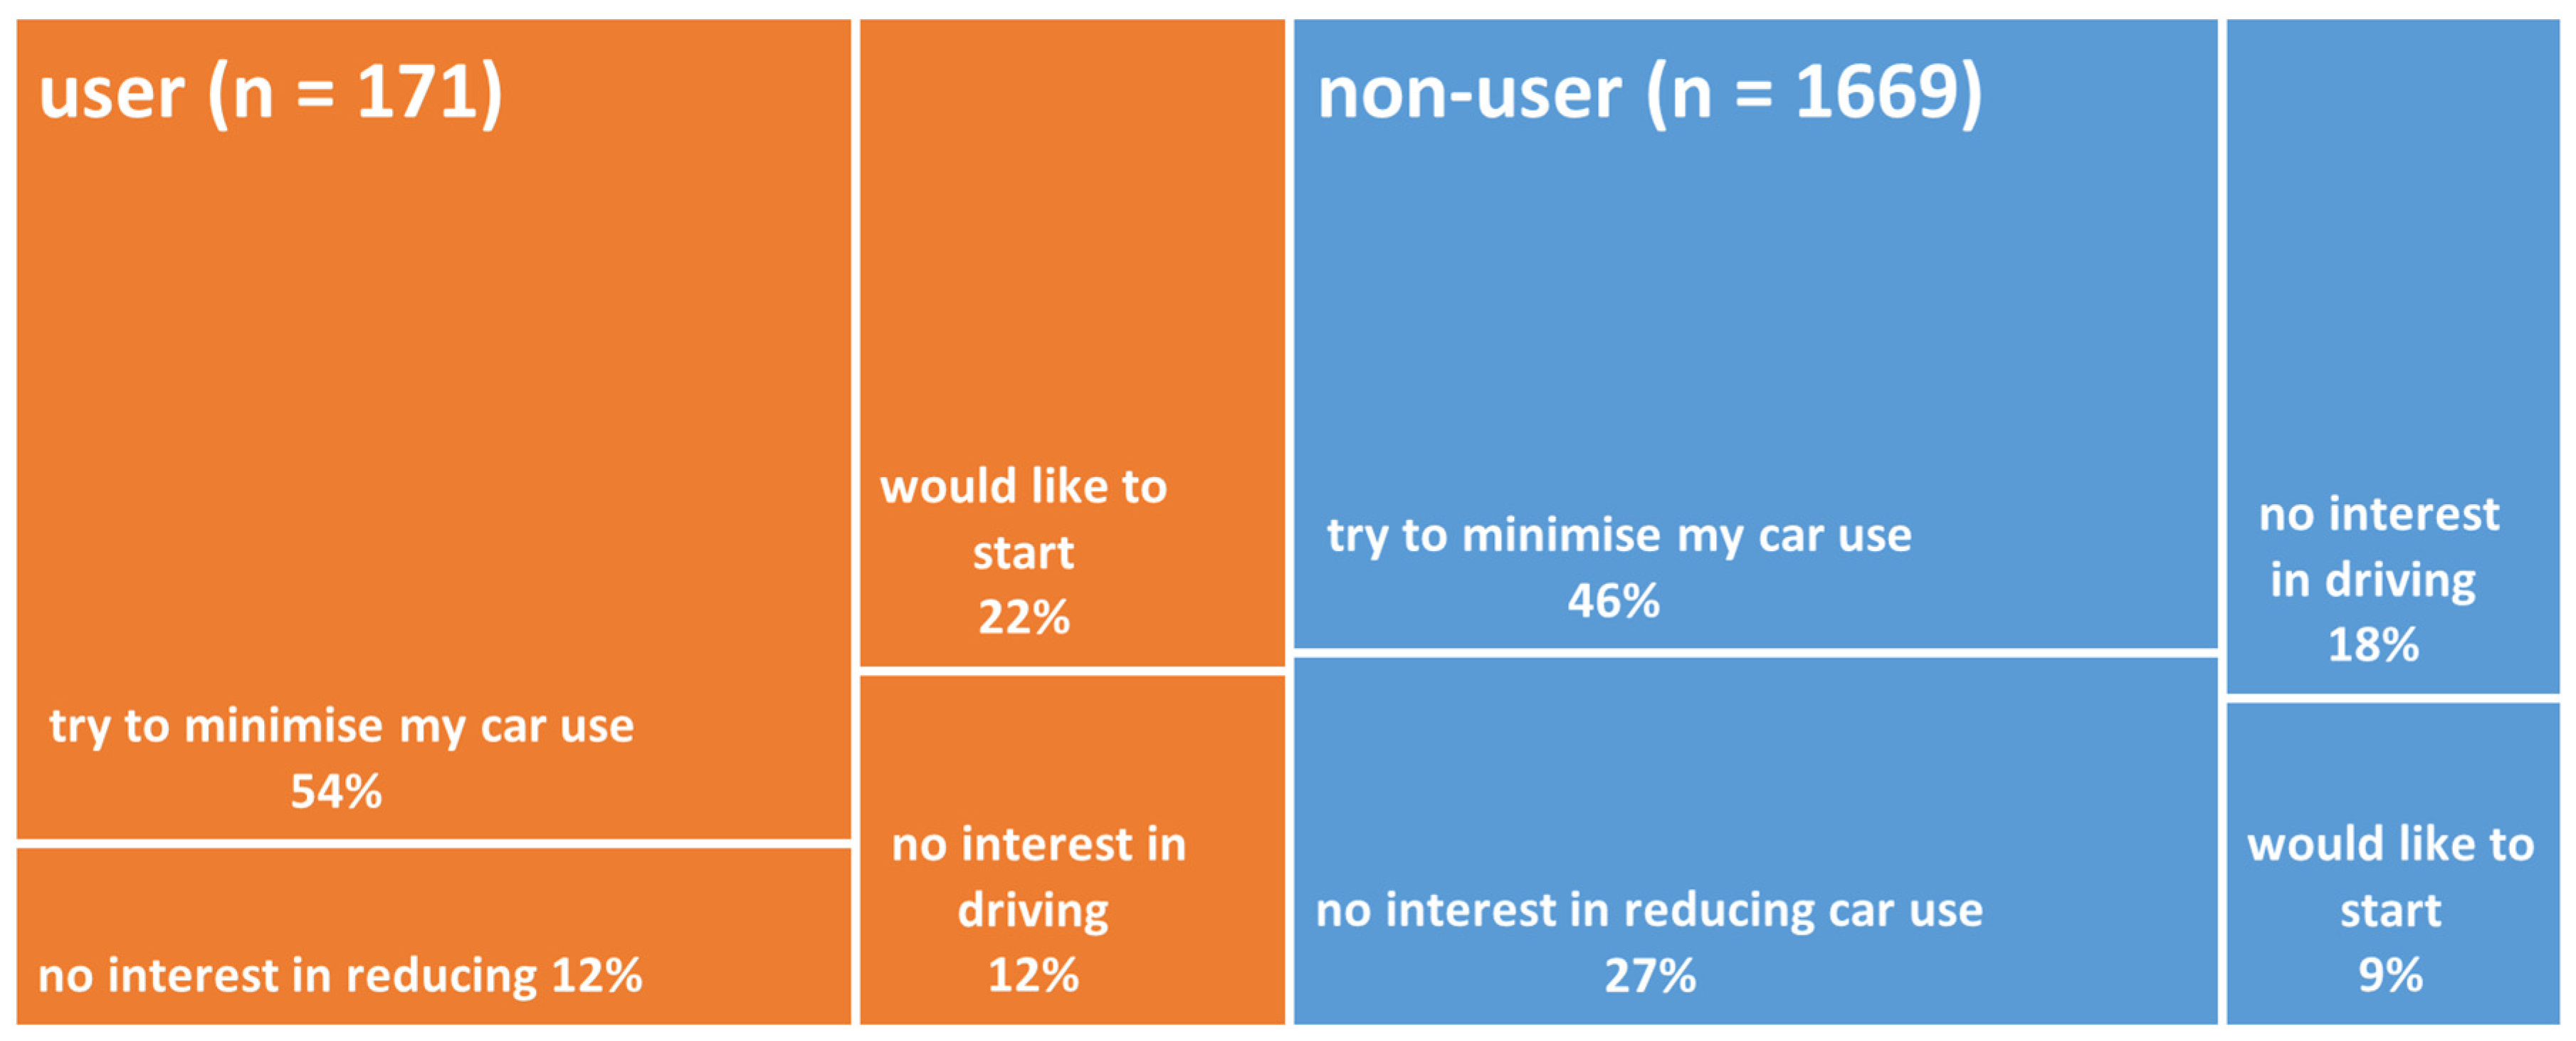
In terms of general interest in environmental issues, one striking finding is that, in line with other surveys, over 77% of all groups were somewhat, fairly or very concerned about climate change, with over half in the top two categories. Significantly higher levels of concerns were reported by cyclists and walkers (but not e-micromobility users). Concerns about air quality were also high, although this time, they were significantly higher for all the active travel groups compared to the population as whole. People were also asked about their opinion on “having more restrictions on car parking and car use, if it improved conditions for other road users like pedestrians and cyclists”. Generally, survey respondents were fairly evenly split into thirds (support, oppose, don’t know), although support for car restrictions policies was higher (over 50%) among all categories of active mode users6.
To assess personal car dependence, those who had the option of a car were asked “if you had to make a new journey (of approximately 2-3 miles), would you use a car automatically, without really thinking about it”. The proportion agreeing was lower amongst utility cyclists, frequent walkers and e-cargo bike users (compared with non-utility cyclists, non-frequent walkers and non-e-cargo bike users respectively). Nevertheless, e-micromobility users did differ in their relationship to driving, as shown in Figure 6. Compared to e-micromobility users, a higher share of non-users drive (73% versus 66%) and those drivers also had less interest in reducing their car use (63% compared to 84%). However, 22% of e-micromobility users would like to start driving, compared to 9% of non-users.
People were also asked about whether better access to e-bikes, e-cargo bikes and e-scooters would affect their day-to-day travel habits. About half of e-micromobility users indicated that better access meant they would make quite substantial or very substantial changes to their day-to-day travel habits, with a particularly high share of e-cargo bike users indicating this. These proportions were significantly higher than for non-users and also higher than for utility cyclists.
Two other factors were explored which might be key to whether people use e-micromobility, and both are potentially important. First, people were asked about how confident they feel cycling on roads in their local area. On average, micromobility users (including cyclists) indicated that they were significantly more confident than non-users. However, at the same time, about half of current utility cyclists and e-micromobility users indicate that they are not fairly or very confident cycling in their local area. This highlights the crucial role that measures such as safer infrastructure, speed limits, cycling training and other measures have to play in enabling people to feel more confident about active travel in their local areas. Second, people were asked about their interest in new technologies. Levels of interest were significantly higher amongst e-micromobility users, but also frequent cyclists, highlighting that the ‘tech’ part of these vehicles may be a selling point for attracting future market segments.
5. Discussion and Conclusions
This paper outlines the results of a national survey designed to understand the experience and opinions of the general population in England towards electrically-assisted micromobility, particularly e-bikes, e-cargo bikes and e-scooters, and to situate those opinions within the wider context of their travel behaviour and more general attitudes. As highlighted in section 2, England lags behind many other European countries in take-up of such modes, which is partly due to policy decisions about their promotion and use. Results from this survey are intended to clarify whether politicians are simply reflecting antipathy by the general public towards such modes, and what scope there is for use of these modes to increase, given the need to switch to less energy intensive forms of travel due to the climate crisis.
The first finding is that 11% of households owned at least one of these three forms of micromobility. 6% of the population used one at least weekly, 9% were doing so at least once per month and 19% had ever tried them. Findings for e-cycles (where question wording enabled comparison) were reasonably consistent with those from the Department for Transport’s 2023 Transport and Technology Tracker (Marshall et al, 2023) – with 7% of people in our survey using an e-bike at least once a month and 15% ever doing so, compared to 6% monthly and 13% annually in the T&T Tracker, suggesting the order of magnitude of our findings is reasonable. Levels of use of e-cargo bikes were lower than for e-cycles (3% monthly), with e-scooter use being in between (5% monthly). CoMoUK’s research suggests 2% of people actively used a shared scooter in 2023/24, whilst our survey suggested 4% of households now own an e-scooter, indicating that the difference in values will partly be due to private use (despite it being illegal on public roads in the UK). Interestingly, the T&T Tracker suggests that levels of knowledge of electric cars/ vans are higher than for micromobility – with 47% of people saying that they knew a great deal or fair amount about them in 2023, compared to 26% for e-cycles and 32% for e-scooters. And yet, in August, less than 5% of cars in the UK were fully electric (ZapMap, 2025). Hence, levels of use of e-micromobility are likely to be higher than for electric cars7, even though they have not received the same policy promotion and many people do not feel well informed about them. This implies they potentially have a higher innate appeal (not least due to their lower costs), which policy makers need to consider.
Second, our findings on demographics were consistent with many other studies (see, for example, Fyhri & Fearnley, 2015; Møller et al., 2024; Rérat, 2021, Melia & Bartle, 2022; Simsekoglu & Klöckner, 2019, Steer 2024, Carracedo & Mostofi 2022, Marincek et al 2024a, Badia & Jenelius 2023, Kantar 2021, Ove Arup & NatCen 2021). Specifically, we found that men were more likely to use micromobility modes than women (with 61% of users being male). Micromobility users were also more likely to be young, with over half being under 35, and to be living in urban areas (85% compared to 80% of non-users). Compared to non-users, e-micromobility users were more likely to have children in their household (52% vs 20%), to be employed (68% vs 59%), to have a degree (63% vs 53%) and to be other than white (25% vs 7%). However, gender differences were less marked than for utility cyclists (of whom 65% were male), and the age, urban, employment and education bias was less strong for e-cyclists than for e-cargo bike users or e-scooter users. The lower level of gender bias, compared to utility cycling, highlights that the reduced effort required for e-micromobility use may mean that such modes can potentially be more inclusive than conventional cycling – and the high level of children present indicates the potential for household sharing of vehicles, a finding consistent with other work on e-cargo bikes (Riggs & Schwartz 2018, Marincek et al 2024a). As other studies have suggested (Zhang et al 2025, Rérat, 2021, Melia & Bartle 2021), with greater adoption, e-cycles can appeal to a wider variety of market segments over time, consistent with our findings for the lower biases for e-cycles (the most established of the three modes studied in England). In other words, although our findings confirm stereotypes – namely that e-micromobility modes are more likely to be used by young, male, well-educated urban dwellers – they also suggest relatively high take-up by families, greater appeal to women than conventional cycling, and the potential (for e-bikes at least) to appeal to a wider range of age groups as they become more widely adopted.
Third, the survey results suggest that e-micromobility use is often associated with more varied mobility strategies. Although 82% of e-micromobility users were using a car at least once a month (compared with 79% of non-users), the proportion using cars 3+ times a week was smaller (47% vs 55%), and a substantially higher share were making at least monthly use of buses (51% vs 32%), trains (45% vs 24%), taxis (39% versus 15%) and mopeds (26% vs 2.4%). However, there was potentially some substitution between e-micromobility and walking, as a smaller proportion were frequent walkers (46% vs 53%). As already highlighted, other studies have also suggested that use of e-micromobility can reduce car use, including studies of e-bikes (Cairns et al, 2017, Fyhri et al 2016, Gioria 2016, McArthur et al 2018, McQueen et al 2019, Wolf & Seebauer 2014, Hiselius & Svenssons 2014, Bourne et al 2020); e-cargo bikes (Riggs 2016, Bjørnarå et al., 2019, Becker & Rudolf 2018 and Marincek et al 2024b); and e-scooters, particularly those privately owned and/or being used in the US (Badia & Jenelius 2023; Laa and Leth 2020; Oostendorp and Hardinghaus 2023; Ove Arup & NatCen 2022).
Fourth, the findings suggest that there is considerable potential to increase use. Over 50% of people were quite or very interested in trialling them for free for a few minutes in a local park or via a monthly loan. Over 20% people were also interested in trialling some more unconventional micromobility modes (including fold-up e-cycles, e-tricycles or two-seater e-cycles). This high level of interest perhaps mirrors the high levels of participation achieved in the national e-bikes trial (Steer, 2024), and the 43% of residents who either had, or were interested, in trying an e-scooter in UK cities where e-scooters were introduced (Ove Arup & Natcen 2022).
High proportions of existing e-micromobility users often did not own their own vehicles, with 55% saying they were likely to buy an e-bike, e-cargo bike or e-scooter in the next 12 months. (It should be noted that this figure included e-scooter users who would do so “if it became legal for privately owned e-scooters to be ridden where you can ride a standard pedal cycle”). 8% of non-users also said that they were likely to buy one of the three vehicles in the next 12 months (with the same question wording clarifying that this was if e-scooter use became legal). The much higher levels of purchase interest from existing users, and the general interest in trials, indicates the importance of trial opportunities as a way of enabling people to assess the value of a purchase. Previously, Mesimäki & Lehtonen (2023) also found that increased familiarity with light electric vehicles was associated with more favourable views concerning them. In the UK national e-bike trial, people who loaned bikes or who undertook training said they were more likely to buy one afterwards, although with that share then potentially affected by revealed costs (Steer, 2024). Equally, in recent loans of e-cargo bikes to households, 20% went on to buy one, and 65% said that their household was ‘somewhat’ or ‘much’ more likely to buy one after trying them (Philips et al, 2025).
The potential benefits of owning and using e-micromobility modes are relatively well documented in the literature and include being able to travel further, faster and up hills with less effort, compared to other modes; potential physical and mental health benefits; perceived environmental advantages and fun (Melia & Bartle 2022, Marshall et al, 2023, 2024, Steer 2024, Carracedo & Mostofi 2022, Badia & Jenelius 2023, Ove Arup & NatCen 2021). Consequently, our survey focused on more general attitudes, particularly amongst non-users, and showed that they often had positive views. Specifically, over half of non-users thought that each of the e-micromobility modes were better for the environment; 47% or more thought that they had potential to substitute for car use; and 29% or more thought that the Government should do more to support them. In addition, a high proportion of people were either neutral or said they didn’t know. This was in a context where the majority of non-users were somewhat, fairly or very concerned about climate change, and over two-thirds of non-user drivers said they would like to reduce their car use.
However, views did vary by micromobility mode (together with levels of background knowledge). E-bikes were by far the best known (and supported) of the three, with 28% of people personally knowing a regular user and 15% having tried them. In contrast, e-cargo bikes were the least well known, with the equivalent figures being 5% and 5%. Meanwhile, for non-users, e-scooters generated more negative perceptions than the other two modes: compared to e-bikes and e-cargo bikes, 60% felt they were dangerous to use in local neighbourhoods (compared to 37% and 39% respectively); only 47% agreed they were a realistic alternative to the car for some journeys (compared to 70% and 57%) and only 59% thought they were better for the environment than driving (compared to 73% and 67%). This may partly relate to the fact that they are illegal for private use and are more likely to be used illegally in pedestrian environments, as well as objective differences in their characteristics.
Other barriers to ownership identified in this study were similar to those found in many others. People were concerned about the costs of e-micromobility modes. Amongst non-owners of each mode, only 49% agreed they could easily afford an e-scooter; 38% an e-bike; and 24% an e-cargo bike, and at least two-thirds would worry about their vehicle getting stolen if they bought one. Storage was also seen as difficult for e-scooters by 31% of non-owners; for e-bikes by 46% of non- owners and for e-cargo bikes by 69% of non-owners. The safety of travel environments and personal confidence when cycling were also important, with concerns about the safety of e-scooters reflecting the wider literature, particularly in relation to pedestrian safety (Marshall et al 2023, 2024, Badia & Jenelius 2023, Kantar 2021, Ove Arup & NatCen 2022). Other issues identified in the literature for e-bikes and e-cargo bikes include weight, manoeuvrability and parking (Melia & Bartle 2022, Behrendt et al., 2021; Philips et al., 2024, 2025; Rérat, 2021). Conversely, some commentators have highlighted that lower total costs of ownership may be a motivation for e-cargo bike purchase compared to car ownership (Carracedo & Mostofi, 2022).
In terms of important differences between the attitudes of users and non-users, e-micromobility users were more likely to be concerned about local air quality (49% vs 43%), more likely to be interested in new technologies (57% vs 45%) and more likely to feel relatively confident cycling on roads in their local area (45% vs 16%). Hence, if policy makers want to increase uptake of these modes, clarifying the benefits for local air quality and the novelty of the technology may be important. The findings also highlight the value of cycle training to increase confidence in cycling, coupled with changes to local environments such as protected road space and reduced speed limits.
Finally, the survey provides some insights into the relationship between e-micromobility, cycling and walking. Specifically, e-micromobility users were less likely than non-users to be sedentary for more than 8 hours, and more likely to be undertaking the recommended amount of physical activity each week. They were also, on average, undertaking 3 times the amount of active travel (defined to include use of e-bikes and e-cargo bikes) as non-users, twice as much as frequent walkers, and 25% more than utility cyclists. This suggests that use of such modes is often providing health benefits and should be seen as an important form of active travel (Bourne et al, 2022; Cook et al 2022, Larrington-Spencer 2024). Notably, those using e-micromobility and/or undertaking utility cycling at least once a month comprise 21% of the population. Adding in those who also walk frequently takes the total to 86% of the population. This highlights that making space for modes without major power would benefit the majority of people (even though many are also car users). However, there are also clearly some conflicts, particularly between pedestrians and e-scooter users. Hence, in allocating space for active travel, it is important that policy makers recognise that the speeds and needs of these different groups are not necessarily the same, or that speed capping for different vehicles is harmonised or other mechanisms are adopted to ensure that they can coexist successfully.
In brief, our survey has shown that England has considerably greater potential to increase the use of e-micromobility modes. Barriers and advantages are largely the same as those for other countries; interest in being able to trial vehicles is high; and attitudes are, on average, positive. However, there are also a series of key issues that need addressing, including vehicle costs, theft, storage, cycle training and safer road environments, with additional measures needed to address the safety concerns of e-scooters. Given the critical need to move towards less environmentally damaging forms of transport, finding practical ways to safely increase uptake of these vehicles therefore offers a solution that might be both politically popular and practically effective.
Funding
This work is part of the ELEVATE project, funded by the Engineering and Physical Sciences Research Council/UKRI, grant reference: UKRI EP/S030700/1.
Institutional Review Board Statement
The study has ethical approval from the Business, Environment, Social Sciences Faculty Research Ethics Committee (FREC) of the University of Leeds, UK. Reference FREC 2023-0477-1198 (date 21 April 2023).
Acknowledgments
Grateful thanks to Ian Philips (University of Leeds), who leads the project, and to Gavin Ellison from YouGov Plc. Also grateful thanks to the rest of the ELEVATE project team, including Jillian Anable, Noel Cass, Theresa Nelson and Pirjo Johnson (University of Leeds); Labib Azzouz and Christian Brand (University of Oxford); Mary Darking and Nick Marks (University of Brighton); Frauke Behrendt and Clara Glachant (TU Eindhoven) and Eva Heinen (ETH Zurich).
Conflicts of interest
External funders have had no role in the design of this study; in the collection, analyses, or interpretation of data; in the writing of the manuscript; or in the decision to publish the results. SC’s activities have been partially supported by a 20% contribution from her (one person) consultancy, in line with the standard academic convention of funding 80% of costs. She has previously done a range of research work on cycling and micromobility, which has been funded by a variety of sources, including some pro-cycling organisations. The work has only ever been funded to provide objective insights and advice.
Appendix A1. Socio-Economic and Transport Characteristics of Our sample Compared to National Statistics

Table A1.
Socio-economic characteristics of our sample compared to national statistics.
| Socio-economic variables |
Our survey n= 2000 (Adults in England) |
Census 2021 (% of the adult population in England) |
|
Gender Female Male Other |
Gender 999 (50%) 955 (48%) 46 (2%) |
Sex 52% 48% |
|
Age 18-34 35-49 50-64 65+ |
533 (27%) 494 (25%) 478 (24%) 449 (23%) |
28% 25% 25% 23% |
|
Social Grade123456AB C1 C2 DE |
556 (28%) 623 (31%) 351 (18%) 470 (24%) |
23% 34% 21% 22% |
|
Region East Midlands East of England London North East North West South East South West West Midlands Yorkshire and the Humber |
186 (9.3%) 225 (11%) 298 (15%) 100 (5.0%) 261 (13%) 329 (16%) 206 (10%) 200 (10%) 195 (9.8%) |
8.7% 11.2% 15.4% 4.7% 13.1% 16.4% 10.3% 10.4% 9.7% |
Table A2.
Transport characteristics of our sample compared to national statistics.
|
Transport variables |
Our survey n= 2000 (Adults in England) |
National Travel Survey (2023) (% of population in England) |
|
Private car Travel monthly Travel weekly |
77% 68% |
90% 82% |
|
Local bus Travel monthly Travel weekly Surface rail Travel monthly Travel weekly |
34% 21% 26% 11% |
34% 21% 24% 9% |
|
Cycling Monthly weekly |
17% 11% |
21% 12% |
|
Private car(household ownership) own at least one car own more than one car |
79% 33% |
78% 34% |
| 1 | Comparisons with our survey (using the 2023 wave, which matches best with our survey timing) suggest that the views of car owners may be slightly over-represented ,as the share of people with access to a household car is relatively high (87% in wave 11, compared to 80% in our survey and 78% in the National Travel Survey 2023). However, its findings are still of interest. |
| 2 | For more information, see www.gov.uk/guidance/e-scooter-trials-guidance-for-users
|
| 3 | One minute of moderate activity = 4 METS whilst 1 minute of vigorous activity = 8 METS (WHO, undated) MET figures are potentially high for all groups compared to other sources of data like the Active Lives Survey (Sport England 2024), due to differences in survey methodology and administration, but should be internally comparable |
| 4 | Respondents were not asked about minutes spent travelling by e-scooter, given the lack of clarity about the physical activity impacts of doing so. |
| 5 | Note that each of the individual e-micromobility user groups – e-bike users, e-cargo-bike users and e-scooter users – had higher average active travel METS than e-micromobility users. This is because some of those undertaking the greatest amounts of active travel were included in all three categories, whilst those with relatively low active travel minutes were often only included in one. |
| 6 | Note that each of the individual e-micromobility user groups – e-bike users, e-cargo-bike users and e-scooter users – had higher average support than e-micromobility users as a whole. This is because more positive people were more likely to be users of all three modes, whilst less positive people were less likely to be so. |
| 7 | The T&T Tracker does not contain a use metric that can be readily compared, and the relationship between share of the vehicle fleet, and proportion of regular drivers using them, may be complicated by shared household ownership. |
References
- Anderson T (2025) E-bike incentives and programmes. Presentation on Energy Saving Trust adminstered programmes, ELEVATE financial workshop 14/5/25.
- Badia, H., & Jenelius, E. (2023). Shared e-scooter micromobility: review of use patterns, perceptions and environmental impacts. Transport Reviews, 43(5), 811–837. [CrossRef]
- Becker S & Rudolf C (2018) Exploring the potential of free cargo-bikesharing for sustainable mobility. GAIA - Ecol. Perspect. Sci. Soc. 27, 156–164. [CrossRef]
- Behrendt, F., Cairns, S., Raffo, D., & Philips, I. (2021). Impact of E-Bikes on Cycling in Hilly Areas: Participants’ Experience of Electrically-Assisted Cycling in a UK Study. Sustainability, 13(16), 8946. [CrossRef]
- Behrendt, F., Heinen, E., Brand, C., Cairns, S., Anable, J., Azzouz, L., & Glachant, C. (2023). Conceptualising Micromobility: The Multi-Dimensional and Socio-Technical Perspective. Preprints. [CrossRef]
- Bieliński T, Kwapisz A, Ważna A (2021) Electric bike-sharing services mode substitution for driving, public transit, and cycling, Transportation Research Part D: Transport and Environment (96), . [CrossRef]
- Bissel M & Becker S (2024) Can cargo bikes compete with cars? Cargo bike sharing users rate cargo bikes superior on most motives – Especially if they reduced car ownership. Transportation Research Part F: Traffic Psychology and Behaviour (101), pp218-235, . [CrossRef]
- Bjørnarå, H., Berntsen, S., J te Velde, S., Fyhri, A., Deforche, B., Andersen, L., Bere, E. (2019) From cars to bikes – The effect of an intervention providing access to different bike types: A randomized controlled trial. PLoS ONE, 14(7): e0219304. [CrossRef]
- Bösehans, G., Bell, M., Thorpe, N., & Dissanayake, D. (2023). Something for every one? - An investigation of people’s intention to use different types of shared electric vehicle. Travel Behaviour and Society, 30, 178–191. [CrossRef]
- Boterman, W.R. (2018) Carrying class and gender: cargo bikes as symbolic markers of egalitarian gender roles of urban middle classes in Dutch inner cities. Soc. Cult. Geogr. 21, 245–264. [CrossRef]
- Bourne, J. E., Cooper, A. R., Kelly, P., Kinnear, F. J., England, C., Leary, S., & Page, A. (2020). The impact of e-cycling on travel behaviour: A scoping review. Journal of Transport & Health, 19, 100910. [CrossRef]
- Bourne J, Levine JG, Landeg-Cox C & Bartington SE (2022). Environmental and Health Impacts of E-cycling, TRANSITION Clean Air Network Policy Briefing Note No.4, pp1-7, Birmingham, UK. [CrossRef]
- Bourne JE, Sauchelli S, Perry R, Page A, Leary S, England C, et al. (2018) Health benefits of electrically-assisted cycling: a systematic review. International Journal of Behavioral Nutrition and Physical Activity 15(1) . [CrossRef]
- Brand, C., Götschi, T., Dons, E., et al. (2021). ‘The Climate Change Mitigation Impacts of Active Travel: Evidence from a Longitudinal Panel Study in Seven European Cities’. Global Environmental Change 67 (March): 102224. [CrossRef]
- Brand, C. (2024). Confronting mobesity is vital for the global electrification of transport. Nature Energy, 9(8), 909–909. [CrossRef]
- Buehler, R., Broaddus, A., Sweeney, T., Zhang, W., White, E., & Mollenhauer, M. (2021). Changes in Travel Behavior, Attitudes, and Preferences among E-Scooter Riders and Nonriders: First Look at Results from Pre and Post E-Scooter System Launch Surveys at Virginia Tech. Transportation Research Record, 2675(9), 335-345. [CrossRef]
- Businessmole (2023) 12 Reasons Why Electric Bikes Are Gaining Popularity, 11/12/23.
- Cairns S., Behrendt F., Raffo D., Beaumont C. and Kiefer C. (2017) Electrically-assisted bikes: Potential impacts on travel behaviour Transportation Research Part A: Policy and Practice, 103, pp. 327-342, . [CrossRef]
- Carracedo, D., & Mostofi, H. (2022). Electric cargo bikes in urban areas: A new mobility option for private transportation. Transportation Research Interdisciplinary Perspectives, 16, 100705. [CrossRef]
- Cazzola, P. and Crist, P. (2020). Good to Go? Assessing the Environmental Performance of New Mobility. Paris. Available at: https://www.itf-oecd.org/sites/default/files/docs/environmental-performance-new-mobility.pdf.
- Chaniotakis, E., Johnson D.T, Kamargianni M., (2023). Emissions Savings Estimation for E Scooters: A Framework for Analysis and Illustrative Application. Report prepared for Voi Technology (Voi Technology).
- Climate Change Committee (2023) Progress in reducing UK emissions. 2023 Report to Parliament. CCC, London.
- CoMoUK. 2025. Annual Shared Micromobility Report UK. CoMoUK, and information available on their webpages, accessed 13/08/25. https://www.como.org.uk/documents/annual-shared-micromobility-report-uk-2024.
- Cook S, Stevenson L, Aldred A, Kendall M, Cohen T (2022) More than walking and cycling: What is ‘active travel’?, Transport Policy,126, pp151-161, . [CrossRef]
- De Ceunynck, T., Wijlhuizen, G. J., Fyhri, A., Gerike, R., Köhler, D., Ciccone, A., Dijkstra A, Dupont E & Cools, M. (2021). Assessing the willingness to use personal e-transporters (PeTs): Results from a cross-national survey in nine European cities. Sustainability (Switzerland), 13(7). [CrossRef]
- Delaney B (2020) I thought electric bikes were only for lazy people – until I tried one. The Guardian, 14/5/20.
- Department for Transport (2025a) National Road Traffic Estimates, Table TRA01,.
- Department for Transport (2025b) National Travel Survey Data Tables Tables NTS0313 and NTS0703.
- Fan, Zhufeng, and Corey D. Harper. 2022. ‘Congestion and Environmental Impacts of Short Car Trip Replacement with Micromobility Modes’. Transportation Research Part D: Transport and Environment 103 (February): 103173. [CrossRef]
- Fyhri A & Fearnley N (2015) Effects of e-bikes on bicycle use and mode share, Transportation Research Part D: Transport and Environment, 36, pp45-52, . [CrossRef]
- Fyhri A., Sundfør H. B. and Weber C. (2016) Effect of subvention program for e-bikes in Oslo on bicycle use, transport distribution and CO2 emissions. TØI Report 1498/2016. Available at: www.toi.no/getfile.php?mmfileid=43454.
- Garidis, S. (2023) Bicycle Association UK ebike market results, e-bike summit 05 September 2023. Blavatnik School of Government, University of Oxford. https://www.ebikesummit.org/agenda.
- Gioria C. (2016) Etude d’évaluation sur les services vélos – Enquête sur les aides à l’achat de vélos à assistance électrique. ADEME.
- Glachant, C., de Séjournet, A., Philips, I., Behrendt, F., & Cairns, S. (2025). Experienced and Imagined Barriers to E-Cargo Bike Adoption: Findings from Trial Loans in the UK. Preprints. [CrossRef]
- Gov.uk (2025) Riding an electric scooter: the rules.
- Hiselius L.W. and Svenssona A. (2014) Could the increased use of e-bikes (pedelecs) in Sweden contribute to a more sustainable transport system? Paper for the 9th International Conference on Environmental Engineering, 22–23 May 2014, Vilnius, Lithuania.
- Hollingsworth, Joseph, Brenna Copeland, and Jeremiah X Johnson. 2019. ‘Are E-Scooters Polluters? The Environmental Impacts of Shared Dockless Electric Scooters’. Environmental Research Letters 14 (8): 084031. [CrossRef]
- Irons S (2025) The (e-)cycle market and industry priorities. Bicycle Association presentation at an ELEVATE finance workshop.
- ITF (2024). Greener Micromobility (131; International Transport Forum Policy Papers). OECD Publishing.
- Jenkins, Michael, Lucio Lustosa, Victoria Chia, et al. 2022. ‘What Do We Know about Pedal Assist E-Bikes? A Scoping Review to Inform Future Directions’. Transport Policy 128 (November): 25–37. [CrossRef]
- Kantar (2021) Perceptions of current and future e-scooter use in the UK: summary report. Report to the Department for Transport.
- Kroesen M (2017) To what extent do e-bikes substitute travel by other modes? Evidence from the Netherlands, Transportation Research Part D: Transport and Environment, 53, pp377-387, . [CrossRef]
- Laa, Barbara, and Ulrich Leth. 2020. ‘Survey of E-Scooter Users in Vienna: Who They Are and How They Ride’. Journal of Transport Geography 89 (December): 102874. [CrossRef]
- Larrington-Spencer, H. (2024). Defining Active Travel: A Response to Cook et al. (2022). Active Travel Studies: An Interdisciplinary Journal, 4(1): 3, 1–4. DOI: . [CrossRef]
- Laver A (2025) E-bike battery warning after man killed in blaze. BBC News 6/8/25.
- Marincek D, Rérat P & Lurkin V (2024a) Cargo bikes for personal transport: A user segmentation based on motivations for use. International Journal of Sustainable Transportation 18 (9). https://www.tandfonline.com/doi/full/10.1080/15568318.2024.2402753.
- Marincek, D., Rérat, P. & Lurkin V(2024b) V. Cargo bikes and their modal shift effects: from substitution to car renunciation. Transportation (2024). [CrossRef]
- Marshall, Ben, Holly Day, Glenn Gottfried, and Alex Bollen. 2024. DfT Technology Tracker: Wave 11. For Department for Transport Wave 11. IPSOS.
- MacArthur, John, Christopher Cherry, Michael Harpool and Daniel Scheppke (2018). A North American Survey of Electric Bicycle Owners. NITC-RR-1041. Portland, OR: Transportation Research and Education Center (TREC). [CrossRef]
- McQueen, M., MacArthur, J., and Cherry, C. The E-Bike Potential: Estimating the Effect of E-Bikes on Person Miles Travelled and Greenhouse Gas Emissions. Portland, OR: Transportation Research and Education Center (TREC), 2019. [CrossRef]
- McQueen, Michael, John MacArthur, and Christopher Cherry. 2020. ‘The E-Bike Potential: Estimating Regional e-Bike Impacts on Greenhouse Gas Emissions’. Transportation Research Part D: Transport and Environment 87 (October): 102482. [CrossRef]
- Melia, S., & Bartle, C. (2021). Who uses e-bikes in the UK and why? International Journal of Sustainable Transportation, 16(11), 965–977. [CrossRef]
- Mesimäki, J., & Lehtonen, E. (2023). Light electric vehicles: the views of users and non-users. European Transport Research Review, 15, Article 33. [CrossRef]
- Mitra, Raktim, and Paul M. Hess. 2021. ‘Who Are the Potential Users of Shared E-Scooters? An Examination of Socio-Demographic, Attitudinal and Environmental Factors’. Travel Behaviour and Society 23 (April): 100–107. [CrossRef]
- Mitropoulos, L., Stavropoulou, E., Tzouras, P., Karolemeas, C., & Kepaptsoglou, K. (2023). E-scooter micromobility systems: Review of attributes and impacts. Transportation Research Interdisciplinary Perspectives, 21, 100888. [CrossRef]
- Møller, M., Useche, S. A., Siebert, F. W., & Janstrup, K. H. (2024). What differentiates e-bike riders from conventional cyclists in Denmark? A user-based study. Journal of Transport and Health, 34, Article 101748. [CrossRef]
- Monagham L (2025) Call to tighten rules on e-scooters and e-bikes BBC News 18/7/25.
- Nicholas J (2024) EVs are booming but electric bikes are really cutting emissions. The Guardian, 10/4/24.
- Office for National Statistics (2021) Census 2021.
- Oostendorp, Rebekka, and Michael Hardinghaus. 2023. ‘Shared vs. Private e-Scooters: Same Vehicle – Different Mode? Empirical Evidence on e-Scooter Usage in Germany’. Transportation Research Procedia 72: 2173–80. [CrossRef]
- Ove Arup & Partners and Natcen Social Research (2022) National evaluation of e-scooter trials Findings report. Report to Department for Transport.
- Philips, Ian, Jillian Anable, and Tim Chatterton. 2022. ‘E-Bikes and Their Capability to Reduce Car CO2 Emissions’. Transport Policy 116 (February): 11–23. [CrossRef]
- Philips, I., Azzouz, L., de Séjournet, A., Anable, J., Behrendt, F., Cairns, S., Cass, N., Darking, M., Glachant, C., Heinen, E., Marks, N., Nelson, T., & Brand, C. (2024). Domestic Use of E-Cargo Bikes and Other E-Micromobility: Protocol for a Multi-Centre, Mixed Methods Study. International Journal of Environmental Research and Public Health, 21(12), 1690. [CrossRef]
- Philips I, Cairns S, De Séjournet A, Anable J, Azzouz L, Behrendt F, Brand C, Cass N, Darking M, Glachant C, Heinen E, Marks N and Nelson T (2025) E-cargo bikes as a personal transport mode in the UK: Insights from surveys and suburban trials, Journal of Cycling and Micromobility Research, Volume 6, . [CrossRef]
- R Core Team (2021) R: A Language and Environment for Statistical Computing. Vienna, Austria.
- Rérat P (2021) The rise of the e-bike: Towards an extension of the practice of cycling?, Mobilities, 16:3, 423-439, . [CrossRef]
- Riggs W & Schwartz J (2018) The impact of cargo bikes on the travel patterns of women. Urban, Planning and Transport Research, 6 (1) (2018), pp. 95-110.
- Riggs W (2016) Cargo bikes as a growth area for bicycle vs. auto trips: exploring the potential for mode substitution behavior. Transportation Research F 43, pp48-55, . [CrossRef]
- Rogers, E. M. (2003). Diffusion of innovations (5th ed.). Free Press.
- Roig-Costa, O., Miralles-Guasch, C., & Marquet, O. (2024). Shared bikes vs. Private e-scooters. Understanding patterns of use and demand in a policy-constrained micromobility environment. Transport Policy, 146, 116–125. [CrossRef]
- Samadzad, M., Nosratzadeh, H., Karami, H., & Karami, A. (2023). What are the factors affecting the adoption and use of electric scooter sharing systems from the end user’s perspective? Transport Policy, 136, 70–82. [CrossRef]
- Sanders, Rebecca L., Michael Branion-Calles, and Trisalyn A. Nelson. 2020. ‘To Scoot or Not to Scoot: Findings from a Recent Survey about the Benefits and Barriers of Using E-Scooters for Riders and Non-Riders’. Transportation Research Part A: Policy and Practice 139 (September): 217–27. [CrossRef]
- Simons JW (2023) The dangers of cargo bikes. Just look at the way they’re designed. The Spectator 18/8/23.
- Simsekoglu O and Klöckner CA (2019) The role of psychological and socio-demographical factors for electric bike use in Norway, International Journal of Sustainable Transportation, 13 (5) 315-323, . [CrossRef]
- Steer (2024) National E-Cycle Programme Evaluation Report. Department for Transport, London.
- Talke, K. and Heidenreich, S. (2014), Passive and Active Innovation Resistance. J Prod Innov Manag, 31: 894-907. [CrossRef]
- Thomas, A. (2021). Electric bicycles and cargo bikes—Tools for parents to keep on biking in auto-centric communities? Findings from a US metropolitan area. International Journal of Sustainable Transportation, 16(7), 637–646. [CrossRef]
- Urbetter (2023) A Guide To Electric Scooter Laws in Europe. Website accessed 10/08/25. https://urbetterride.com/blogs/post/a-guide-to-electric-scooter-laws-in-europe.
- Visavadia H (2025) Britons fail to back e-bikes as uptake of green vehicles falls to lowest level across Europe GB News, 13/08/25.
- Walker P (2022) UK ministers urged to promote e-bikes to tackle health and climate crises. The Guardian 13/3/22.
- Walsh H (2025) 'Children as young as 11 are riding illegal e-bikes' BBC News 30/7/25.
- Wolf A. and Seebauer S. (2014) Technology adoption of electric bicycles: a survey among early adopters. Transport. Res. Part A 69, 196–211, . [CrossRef]
- World Health Organisation (2021) Global physical activity questionnaire (GPAQ) Analysis Guide. WHO Switzerland.
- Zapamp (2025) EV market stats 2025, accessed 6/9/25, How many EVs are there in the UK - EV market statistics 2024 - Zapmap.
- Zhang Y, Kasraian D, van Wesemael P (2025), E-bike ownership and use determinants and their trends in the Netherlands, Journal of Transport Geography, 125, . [CrossRef]
Figure 4.
Views regarding affordability, storage and theft of e-bikes, e-cargo bike and e-scooter for non-owners of each mode.
Figure 4.
Views regarding affordability, storage and theft of e-bikes, e-cargo bike and e-scooter for non-owners of each mode.
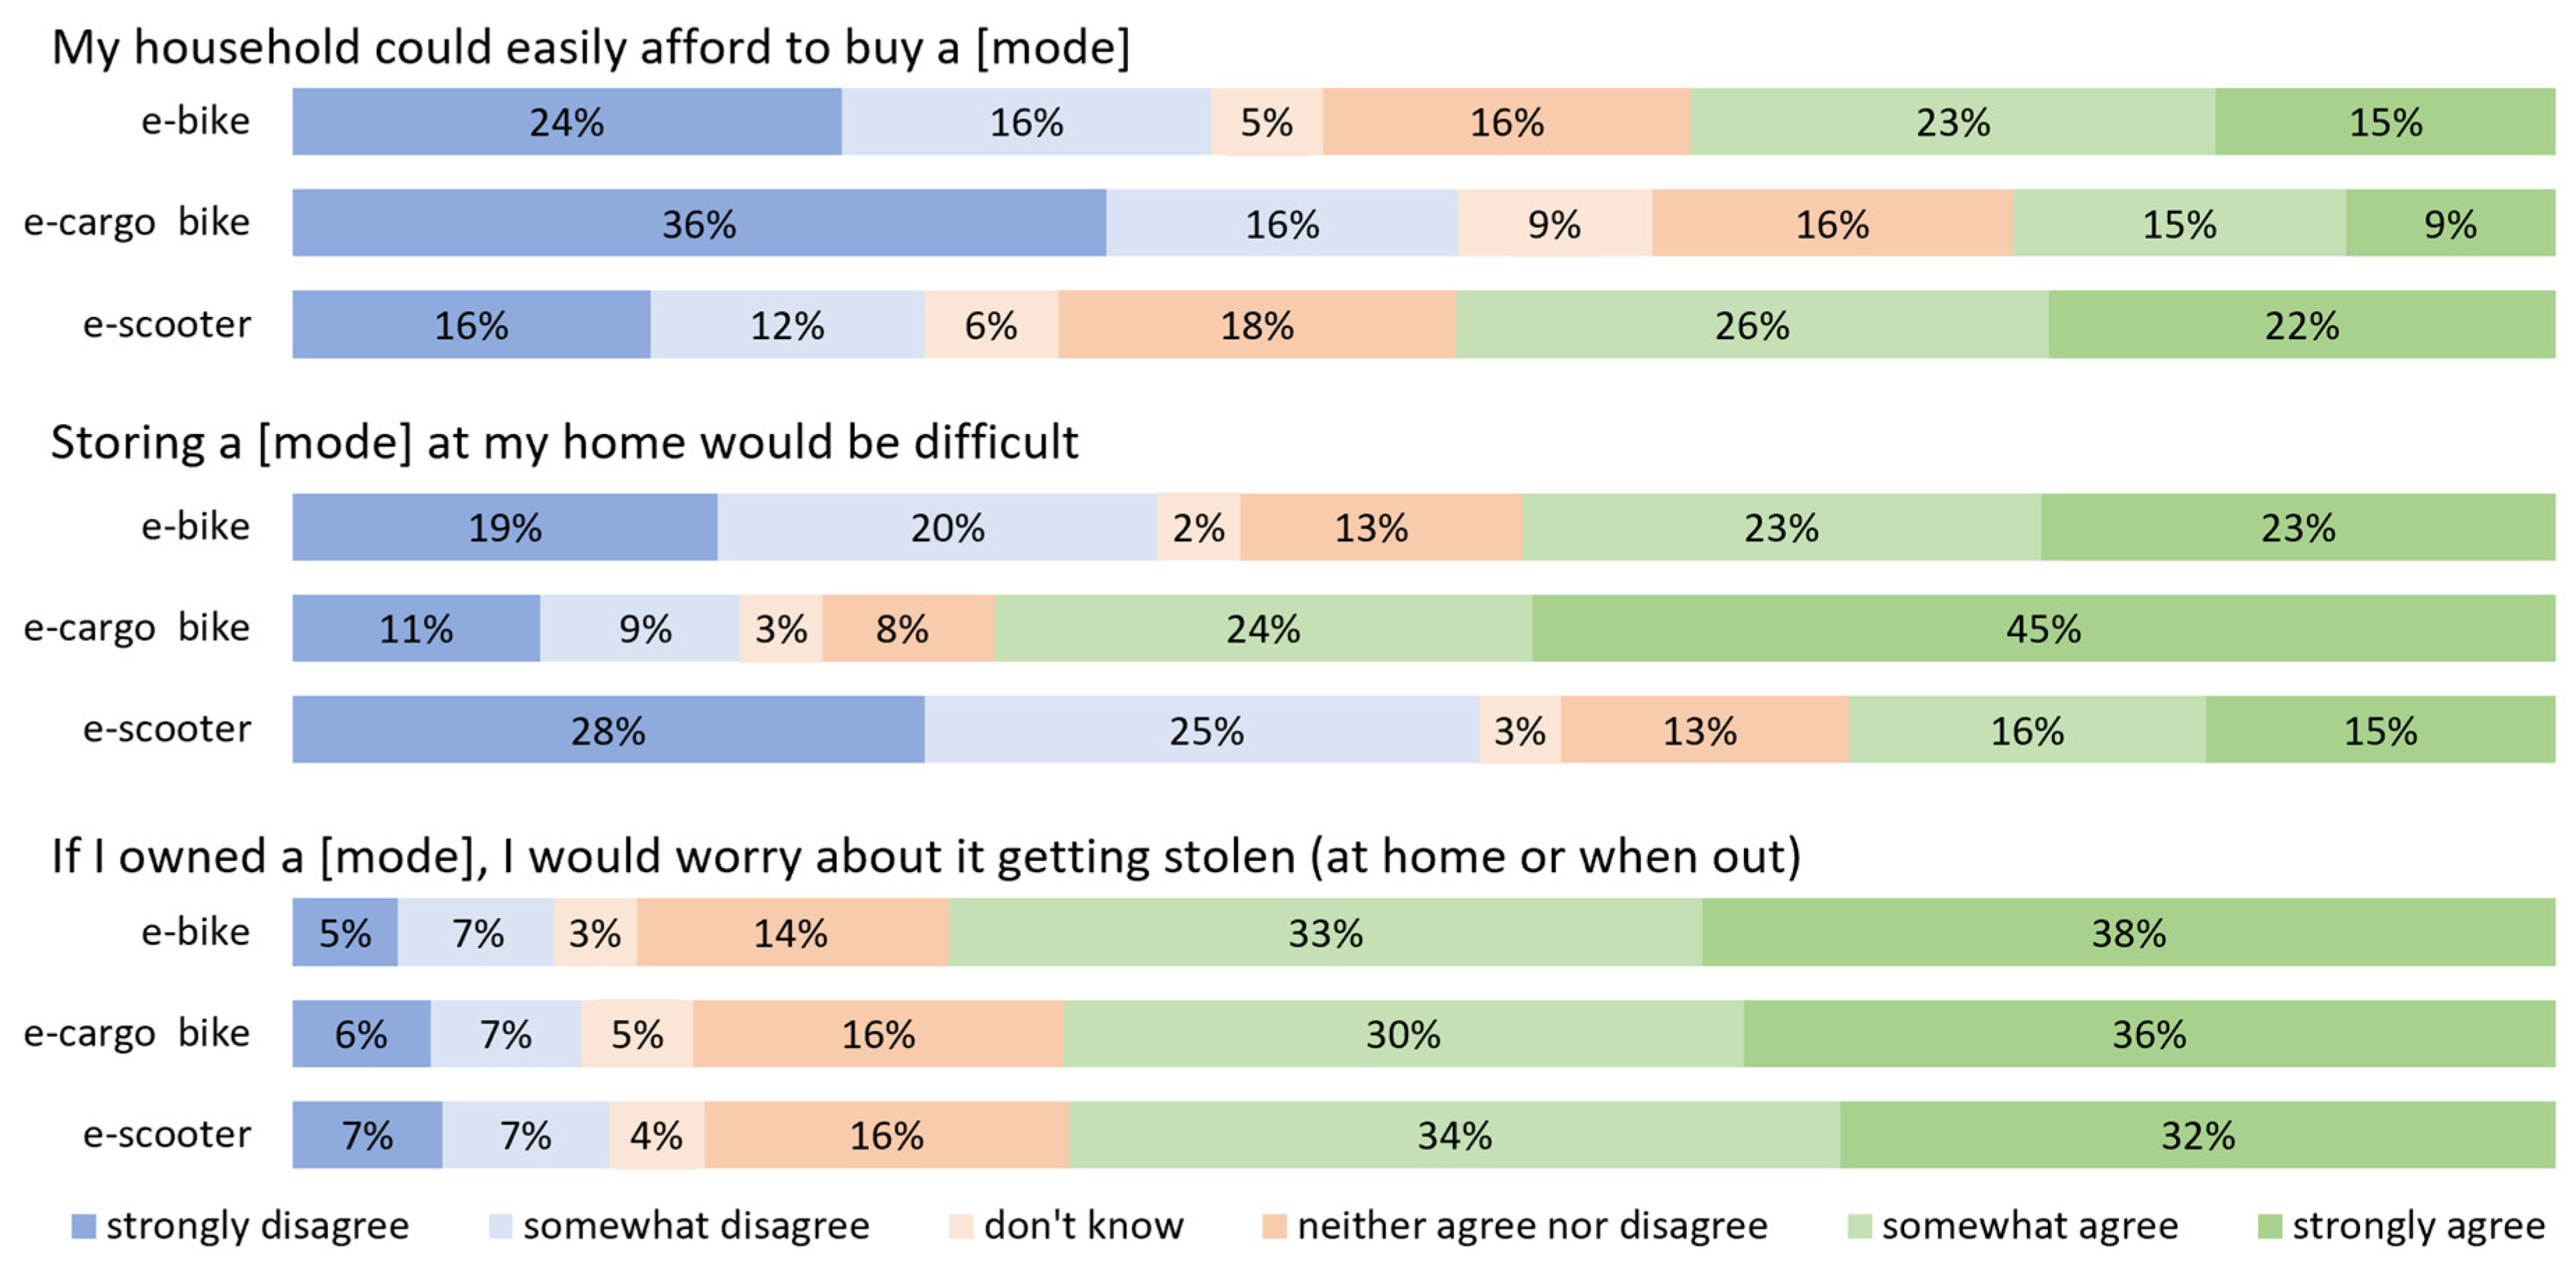
Table 1.
Key findings from the UK Department for Transport’s Transport and Technology Tracker.
| Wave 10 (Dec 22) | Wave 11 (Dec 23) | Wave 12 (Sep-Oct 24) | |
| % who have at least heard of e-cycles | 93 | 94 | 92 |
| % who know a ‘great deal/fair amount’ about e-cycles | 25 | 26 | 26 |
| % using an e-cycle at least annually | 8 | 10 | 9 |
| % using an e-cycle at least monthly | 5 | 6 | 4 |
| % of non-owners ‘fairly or very likely’ to purchase an e-cycle in the next 12 months | 3 | 5 | 3 |
| % ‘fairly or very likely’ to use an e-cycle share scheme in their area | 12 | 11 | 12 |
| % who have at least heard of e-scooters | 98 | 98 | 95 |
| % who know a ‘great deal/fair amount’ about e-scooters | 31 | 32 | 26 |
| % owning an e-scooter | 2 | 2 | 2 |
| % using a shared e-scooter at least annually | 7 | 7 | 4 |
| % of non-owners ‘fairly or very likely’ to purchase an e-scooter in the next 12 months | 4 | 4 | 2 |
Table 2.
Description of e-micromobility modes (e-bikes, e-cargo bikes and e-scooters) provided in the survey to respondents.
Table 2.
Description of e-micromobility modes (e-bikes, e-cargo bikes and e-scooters) provided in the survey to respondents.
E-bikes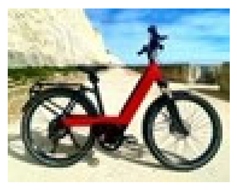
|
E-cargo bikes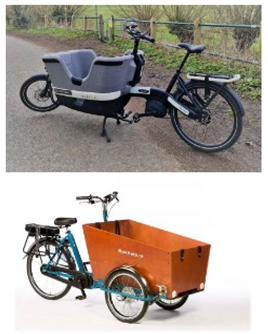
|
E-scooters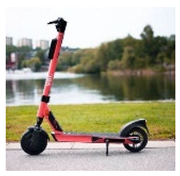
|
| An e-bike, or electrically-assisted bike, is like a conventional bike or cycle, but it is assisted by a motor when you pedal. It can (only) be ridden where you can ride a standard pedal cycle. Costs vary, but a new e-bike might typically cost £1,000 - £2,000. | An e-cargo bike is an electrically-assisted cycle that is purpose-built to carry more cargo than a conventional bike. There are many types. The ‘bike’ may have 2, 3 or 4 wheels and include storage at the front or back, capable of transporting other people or shopping. It can (only) be ridden where you can ride a standard pedal cycle. Costs vary, but a new e-cargo bike might typically cost £3,000 - £6,000. | An e-scooter is a 2-wheeled scooter, designed to carry one person in a standing position, which is fitted with an electric motor. Owning an e-scooter is legal, and a new one might typically cost £300 - £600. However, only e-scooters that are part of specific city schemes can be legally ridden on public roads. These scooters can (only) be ridden where you can ride a standard pedal cycle. The city schemes mostly involve on-street hire, although some include personal hire. |
Table 3.
Share of respondents who own, use, hire or personally know someone who uses the three e-micromobility modes.
Table 3.
Share of respondents who own, use, hire or personally know someone who uses the three e-micromobility modes.
| E-bike | E-cargobike | E-scooter | Any of the three | |
| Own at least one in the household | 167 (8.4%) | 40 (2.0%) | 83 (4.2%) | 212 (11%) |
| Use at least monthly | 139 (7.1%) | 55 (2.8%) | 98 (5.0%) | 185 (9.3%) |
| Use at least once, less than monthly | 144 (7.4%) | 37 (1.9%) | 144 (7.4%) | 199 (10.0%) |
| Use never | 1,673 (86%) | 1,864 (95%) | 1,717 (88%) | 1,616 (81%) |
| Hire - know of a place to hire one within walking distance | 341 (18%) | 97 (5.0%) | 443 (23%) | 589 (30%) |
| Personally know someone who regularly uses one | 535 (28%) | 89 (4.6%) | 294 (15%) | 675 (34%) |
Notes. Respondents who said ‘don’t know/prefer not to say’ have been removed from the calculated percentages.
Table 4.
Socio-demographic profile of (e-)micromobility, active mode and frequent car users (i.e. mobility user groups).
Table 4.
Socio-demographic profile of (e-)micromobility, active mode and frequent car users (i.e. mobility user groups).
| England | Non e-mm users | E-micro mobility users | E-bike users | E-cargo bike users | E-scooter users | Utility cyclists | Frequent walkers | Frequent car users | |||
| Sample size | 2000 | 1753 | 185 | 139 | 55 | 98 | 343 | 1014 | 1042 | ||
| Gender | p-value | <.001 | .001 | .031 | .007 | <.001 | >.90 | >.30 | |||
| Female | 999 (51%) | 906 (52%) | 66 (37%) | 49 (37%) | 18 (35%) | 33 (36%) | 118 (35%) | 510 (51%) | 515 (50%) | ||
| Male | 955 (48%) | 820 (47%) | 108 (61%) | 82 (61%) | 32 (62%) | 56 (61%) | 219 (65%) | 487 (48%) | 516 (50%) | ||
| Other | 22 (1.1%) | 17 (1.0%) | 4 (2.2%) | 3 (2.2%) | 2 (3.8%) | 3 (3.3%) | 2 (0.6%) | 11 (1.1%) | 5 (0.5%) | ||
| Age | p-value | < .001 | <.001 | <.001 | <.001 | <.001 | <.001 | <.001 | |||
| 18-24 | 270 (14%) | 191 (11%) | 59 (32%) | 44 (32%) | 21 (38%) | 33 (34%) | 58 (17%) | 129 (13%) | 84 (8.1%) | ||
| 25-34 | 297 (15%) | 233 (13%) | 48 (26%) | 35 (25%) | 21 (38%) | 31 (32%) | 58 (17%) | 125 (12%) | 123 (12%) | ||
| 35-49 | 502 (25%) | 450 (26%) | 40 (22%) | 25 (18%) | 12 (22%) | 28 (29%) | 92 (27%) | 256 (25%) | 260 (25%) | ||
| 50-64 | 480 (24%) | 449 (26%) | 23 (12%) | 20 (14%) | 0 (0%) | 4 (4.1%) | 89 (26%) | 279 (28%) | 310 (30%) | ||
| 65+ | 451 (23%) | 430 (25%) | 15 (8.1%) | 15 (11%) | 1 (1.8%) | 2 (2.0%) | 46 (13%) | 225 (22%) | 265 (25%) | ||
| Household | p-value | < .001 | <.001 | <.001 | <.001 | <.001 | .019 | .030 | |||
| Child in household | 456 (23%) | 346 (20%) | 94 (52%) | 68 (50%) | 38 (70%) | 67 (70%) | 104 (31%) | 211 (21%) | 260 (25%) | ||
| No child | 1511 (77%) | 1,388 (80%) | 88 (48%) | 68 (50%) | 16 (30%) | 29 (30%) | 232 (69%) | 794 (79%) | 774 (75%) | ||
| Ethnicity | p-value | < .001 | <.001 | <.001 | <.001 | .015 | .011 | < .001 | |||
| White | 1,736 (91%) | 1,573 (93%) | 126 (75%) | 92 (73%) | 33 (66%) | 65 (74%) | 286 (88%) | 899 (92%) | 947 (94%) | ||
| Other than White | 175 (9.2%) | 118 (7.0%) | 42 (25%) | 34 (27%) | 17 (34%) | 23 (26%) | 40 (12%) | 73 (7.5%) | 61 (6.1%) | ||
| Area type | p-value | .057 | .2 | .017 | .003 | .20 | .03 | <.001 | |||
| Rural | 394 (20%) | 359 (20%) | 27 (15%) | 22 (16%) | 4 (7.3%) | 8 (8.2%) | 60 (17%) | 209 (21%) | 262 (25%) | ||
| Urban | 1,606 (80%) | 1,394 (80%) | 158 (85%) | 117 (84%) | 51 (93%) | 90 (92%) | 283 (83%) | 805 (79%) | 780 (75%) | ||
| Income | p-value | .10 | .040 | .001 | .6 | .056 | <.001 | <.001 | |||
| <£20,000 | 381 (26%) | 319 (24%) | 44 (33%) | 36 (35%) | 19 (50%) | 22 (31%) | 57 (22%) | 170 (22%) | 143 (18%) | ||
| £20,000-£49,999 | 646 (44%) | 586 (45%) | 51 (38%) | 35 (34%) | 9 (24%) | 29 (40%) | 106 (41%) | 346 (45%) | 364 (46%) | ||
| £50,000+ | 444 (30%) | 400 (31%) | 40 (30%) | 31 (30%) | 10 (26%) | 21 (29%) | 93 (36%) | 257 (33%) | 280 (36%) | ||
| Employment | p-value | 0.013 | .30 | <.001 | <.001 | <.001 | .028 | <.001 | |||
| Employed | 1,135 (59%) | 993 (59%) | 122 (68%) | 86 (64%) | 45 (83%) | 76 (80%) | 235 (71%) | 603 (61%) | 659 (65%) | ||
| Not employed | 793 (41%) | 702 (41%) | 57 (32%) | 49 (36%) | 9 (17%) | 19 (20%) | 94 (29%) | 381 (39%) | 355 (35%) | ||
| Education | p-value | .049 | .040 | .015 | .022 | <.001 | .004 | .054 | |||
| Degree or equ. | 1,014 (54%) | 895 (53%) | 106 (63%) | 83 (65%) | 36 (69%) | 61 (68%) | 205 (63%) | 561 (57%) | 557 (55%) | ||
| 5 GCSE passes or equ., no degree | 704 (37%) | 638 (38%) | 49 (29%) | 36 (28%) | 10 (19%) | 22 (24%) | 107 (33%) | 341 (35%) | 373 (37%) | ||
| Fewer or no qualifications | 165 (8.8%) | 145 (8.6%) | 13 (7.7%) | 9 (7.0%) | 6 (12%) | 7 (7.8%) | 13 (4.0%) | 75 (7.7%) | 74 (7.4%) | ||
| BMI | p-value | .60 | .6 | .2 | .6 | .060 | <.001 | .011 | |||
| Healthy BMI | 646 (40%) | 571 (40%) | 64 (42%) | 49 (42%) | 22 (49%) | 33 (42%) | 134 (45%) | 379 (44%) | 324 (37%) | ||
| Unhealthy | 983 (60%) | 874 (60%) | 90 (58%) | 68 (58%) | 23 (51%) | 45 (58%) | 167 (55%) | 477 (56%) | 556 (63%) | ||
| Disability | p-value | .12 | 0.063 | <.001 | .10 | .037 | <.001 | .001 | |||
| Activities limited a little or a lot by disability | 595 (31%) | 516 (30%) | 64 (36%) | 51 (38%) | 28 (52%) | 36 (39%) | 88 (26%) | 228 (23%) | 282 (28%) | ||
| Activities not limited by disability | 1,327 (69%) | 1,180 (70%) | 113 (64%) | 83 (62%) | 26 (48%) | 57 (61%) | 247 (74%) | 751 (77%) | 736 (72%) | ||
| Sedentarity | p-value | <.001 | .002 | .15 | .032 | .009 | .004 | 0.1 | |||
| Sedentary for up to 8 hours a day | 1,063 (70%) | 915 (69%) | 120 (85%) | 91 (84%) | 33 (80%) | 58 (82%) | 212 (77%) | 567 (74%) | 575 (72%) | ||
| Sedentary for more than 8 hours a day | 445 (30%) | 415 (31%) | 22 (15%) | 17 (16%) | 8 (20%) | 13 (18%) | 64 (23%) | 201 (26%) | 220 (28%) | ||
| Physical activity | p-value | <.001 | <.001 | <.001 | <.001 | <.001 | <.001 | <.001 | |||
| Average MET for active travel per week | 1,825 | 1,538 | 4,778 | 5,402 | 8,309 | 6,311 | 3,818 | 2,383 | 1,374 | ||
| Physical activity | p-value | .002 | .001 | .023 | .007 | <.001 | <.001 | .80 | |||
| Achieve 600 MET per week | 1,369 (78%) | 1,204 (79%) | 142 (89%) | 109 (91%) | 41 (93%) | 73 (91%) | 280 (93%) | 821 (95%) | 712 (78%) | ||
| Don't achieve 600 MET per week | 376 (22%) | 325 (21%) | 17 (11%) | 11 (9.2%) | 3 (6.8%) | 7 (8.8%) | 20 (6.7%) | 45 (5.2%) | 199 (22%) | ||
Notes. For gender, only male versus female characteristics are compared, given low count for ‘Other’; for METS active travel, Wilcoxon rank sum test is used instead of Chi-square. P-values indicate significance either between users and non-users, or between members of each group and their inverse – e.g. e-bike users and non e-bike users.
Table 5.
Mobility profiles of different mobility user groups.
| Share of… | ||||||||||
| England | Non emm users | E-micro mobility users | E-bike users | E-cargo bike users | E-scooter users | Utility cyclists | Frequent walkers | Frequent car users | ||
| n= 2000 | n= 1753 | n= 185 | n= 139 | n= 55 | n= 98 | n= 343 | n= 1014 | n= 1042 | ||
| who are using at least [monthly] … | car (monthly) | 1,542 (79%) | 1,374 (79%) | 145 (82%) | 110 (82%) | 40 (78%) | 70 (77%) | 271 (80%) | 795 (79%) | — |
| car (3+/week) | 1,042 (53%) | 944 (55%) | 84 (47%) | 66 (49%) | 13 (25%) | 34 (37%) | 170 (50%) | 541 (54%) | — | |
| taxis (monthly) | 330 (17%) | 254 (15%) | 70 (39%) | 52 (38%) | 33 (62%) | 48 (51%) | 86 (25%) | 183 (18%) | 121 (12%) | |
| moped (monthly) | 92 (4.7%) | 42 (2.4%) | 47 (26%) | 41 (31%) | 27 (50%) | 33 (35%) | 55 (17%) | 37 (3.7%) | 46 (4.5%) | |
| bus (monthly) | 676 (34%) | 559 (32%) | 92 (51%) | 68 (50%) | 33 (61%) | 54 (56%) | 164 (48%) | 401 (40%) | 207 (20%) | |
| train (monthly) | 525 (27%) | 424 (24%) | 81 (45%) | 65 (48%) | 33 (61%) | 49 (52%) | 146 (43%) | 337 (33%) | 202 (20%) | |
| cycle (monthly) | 343 (18%) | 223 (13%) | 115 (62%) | 99 (71%) | 38 (69%) | 49 (50%) | — | 212 (21%) | 170 (16%) | |
| cycle (3+/week) | 118 (6.0%) | 82 (4.7%) | 34 (18%) | 31 (22%) | 7 (13%) | 9 (9.2%) | 118 (34%) | 81 (8.1%) | 52 (5.0%) | |
| walk (monthly) | 1,684 (86%) | 1,502 (87%) | 156 (88%) | 118 (89%) | 49 (92%) | 86 (91%) | 320 (95%) | — | 903 (88%) | |
| walk (3+/week) | 1,014 (52%) | 919 (53%) | 81 (46%) | 57 (43%) | 15 (28%) | 40 (43%) | 212 (63%) | — | 541 (53%) | |
| e-bike (monthly) | 139 (7.1%) | 0 (0%) | 139 (77%) | — | 46 (85%) | 58 (62%) | 99 (29%) | 57 (5.7%) | 66 (6.4%) | |
| e-cargo bike (monthly) | 55 (2.8%) | 0 (0%) | 55 (31%) | 46 (34%) | — | 42 (45%) | 38 (11%) | 15 (1.5%) | 13 (1.3%) | |
| e-scooter (monthly) | 98 (5.0%) | 0 (0%) | 98 (54%) | 58 (43%) | 42 (76%) | — | 49 (14%) | 40 (4.0%) | 34 (3.3%) | |
Notes. ‘Monthly’ means ‘at least monthly’ and ‘3+/week’ means ‘at least three times per week’.
Table 6.
Interest to try e-micromobility, among people not using one, and people using one at least once a month, and their perceptions of the acceptability of doing so.
Table 6.
Interest to try e-micromobility, among people not using one, and people using one at least once a month, and their perceptions of the acceptability of doing so.
| E-bike | E-cargobike | E-scooter | One of the three | |||||
| non-users | user | non-users | user | non-users | user | non users | users | |
| n = 1817 | n= 139 | n = 1901 | n = 55 | n = 1861 | n = 98 | n = 1753 | n = 185 | |
| Interest to try for a few minutes | 819 (46%) | 106 (78%) | 517 (28%) | 45 (85%) |
689 (37%) | 78 (85%) |
953 (55%) | 163 (89%) |
| Interest to try for a month | 796 (45%) | 104 (76%) | 443 (24%) | 45 (83%) |
579 (31%) | 81 (85%) |
888 (51%) | 163 (89%) |
| Likely to buy in next 12 months | 87 (4.9%) | 62 (45%) |
37 (2.0%) | 35 (64%) |
81 (4.4%) | 59 (62%) |
131 (7.5%) | 102 (55%) |
| Happy with identity | 450 (25%) | 98 (71%) |
206 (11%) | 26 (47%) |
191 (10%) | 60 (61%) |
521 (30%) |
133 (72%) |
| Important others would approve | 589 (32%) | 95 (68%) |
388 (20%) | 33 (60%) |
277 (15%) | 61 (62%) |
647 (37%) |
125 (68%) |
Notes. The first three questions asked: their interest in the opportunity to try an e-[mode] for a few minutes in a local park, the interest in the free loan of an e-[mode] for a month and how likely their household was to buy an(other) e-[mode]. The next two asked to agree or disagree with the statements “I see myself as the kind of person who might regularly ride a [mode]/I am happy to be identified as someone who rides a [mode]” and “People who are important to me (would) support me using a [mode]”. ‘Don’t know/prefer not to say’ options were excluded from the percentage calculations for the first three questions, but included in the latter two. For all variables and modes, differences between users and non-users were significant at p < .001. For the last two columns, users are defined as those using at least one of the three modes monthly, and the figures correspond to the composite results of them agreeing to the statement or being interested by at least one of the three modes.
Table 7.
Interest in the opportunity to try different types of e-micromobility, for a few minutes in a local park, according to mobility user groups.
Table 7.
Interest in the opportunity to try different types of e-micromobility, for a few minutes in a local park, according to mobility user groups.
| Interest to try e-micromobility | England | Non emm users | E-micro mobility users | E-bike users | E-cargo bike users | E-scooter users | Utility cyclists | Frequent walkers |
| n= 2000 | n= 1753 | n= 185 | n= 139 | n= 55 | n= 98 | n= 343 | n= 1014 | |
| At least one of the 9 modes | 1,286 (66%) | 1,080 (63%) | 172 (93%) | 128 (93%) | 54 (98%) | 96 (98%) | 279 (82%) | 524 (52%) |
| E-bike | 942 (48%) | 777 (45%) | 144 (80%) | 106 (78%) | 49 (92%) | 90 (93%) | 224 (65%) | 503 (50%) |
| E-cargobike | 577 (30%) | 446 (26%) | 112 (63%) | 84 (64%) | 45 (85%) | 68 (73%) | 148 (44%) | 286 (29%) |
| E-scooter | 782 (40%) | 638 (37%) | 124 (71%) | 94 (71%) | 43 (86%) | 78 (85%) | 185 (55%) | 413 (41%) |
| At least one of the 6 unconventional modes | 994 (50%) | 811 (46%) | 152 (82%) | 114 (82%) | 51 (93%) | 89 (91%) | 238 (69%) | 524 (52%) |
| A fold-up electric cycle | 640 (33%) | 497 (29%) | 120 (67%) | 91 (66%) | 40 (75%) | 67 (71%) | 196 (57%) | 353 (35%) |
| An electric tricycle | 513 (26%) | 399 (23%) | 95 (53%) | 71 (53%) | 41 (79%) | 62 (65%) | 119 (35%) | 246 (25%) |
| A side-by-side two seater electric cycle | 460 (24%) | 356 (21%) | 91 (51%) | 68 (51%) | 39 (75%) | 64 (69%) | 107 (32%) | 229 (23%) |
| A two seater electric go-kart | 518 (26%) | 413 (24%) | 87 (49%) | 69 (53%) | 41 (79%) | 59 (61%) | 124 (37%) | 242 (24%) |
| An electric rickshaw | 378 (19%) | 292 (17%) | 72 (41%) | 54 (41%) | 34 (65%) | 52 (56%) | 87 (26%) | 170 (17%) |
| A specialist bike for carrying a wheelchair | 248 (13%) | 160 (9.3%) | 75 (43%) | 62 (47%) | 39 (78%) | 57 (61%) | 72 (22%) | 103 (10%) |
Notes. With the exception of frequent walkers, for all interest variables and mobility user groups, users were significantly more likely to be interested than non-users (p < .001).
Table 8.
Opinions about the different modes, regarding their impact on the environment, their potential as an alternative to cars, whether the government should do more to support them (or legalise them in the case of e-scooters) and how dangerous they are to use in local neighbourhoods.
Table 8.
Opinions about the different modes, regarding their impact on the environment, their potential as an alternative to cars, whether the government should do more to support them (or legalise them in the case of e-scooters) and how dangerous they are to use in local neighbourhoods.
| n (%) agreeing that | e-bike | e-cargo bike | e-scooter | |||
| non-users | users | non-users | users | non-users | users | |
| Sample size | 1817 | 139 | 186 | 55 | 1861 | 98 |
| using an [mode] is better for the environment than driving | 1,334 (73%) | 111 (80%) | 1,266 (67%) | 42 (76%) | 1,094 (59%) | 75 (77%) |
| p-value | .004 | .12 | .002 | |||
| [mode] can be a realistic alternative for some car journeys | 1,266 (70%) | 107 (77%) | 1,093 (57%) | 32 (58%) | 880 (47%) | 68 (69%) |
| p-value | .003 | .40 | < .001 | |||
| the Government should do more to support [e-bike; e-cargo bike] use; the Government should legalise [e-scooter] use | 947 (52%) | 96 (69%) | 783 (41%) | 34 (62%) | 538 (29%) | 60 (61%) |
| p-value | < .001 | .003 | < .001 | |||
| Using an [mode] is dangerous in my neighbourhood | 673 (37%) | 51 (37%) | 746 (39%) | 26 (47%) | 1,123 (60%) | 47 (48%) |
| p-value | .081 | .081 | .14 | .14 | < .001 | < .001 |
Notes. The table depicts the share agreeing with these statements. “Don’t know” responses to the statements are included in the percentage calculations.
Table 9.
Barriers to e-micromobility ownership, according to ownership.
| n (%) agreeing that | E-bike | E-cargo bike | E-scooter | |||
| non-owners | owners | non-owners | owners | non-owners | owners | |
| n = 1812 | n= 167 | n = 1934 | n = 40 | n = 1894 | n = 83 | |
| My household could easily afford to buy a [mode]/ the [mode] we own | 692 (38%) | 103 (62%) | 464 (24%) | 24 (60%) | 920 (49%) | 47 (57%) |
| Storing a [mode] at my home would be/is difficult | 827 (46%) | 50 (30%) | 1,334 (69%) | 22 (55%) | 591 (31%) | 39 (47%) |
| If I owned a [mode], I would worry / I worry about it getting stolen (at home or when out) | 1,286 (71%) | 98 (59%) | 1,275 (66%) | 24 (60%) | 1,244 (66%) | 43 (52%) |
Notes. Difference between owners and non-owners were not tested here, due to the differences in statement formulations.
Table 10.
Opinions of different user mobility groups.
| England | Non emm users | E-micro mobility users | E-bike users | E-cargo bike users | E-scooter users | Utility cyclists | Frequent walkers | Frequent car users | |
| Sample size | 2000 | 1753 | 185 | 139 | 55 | 98 | 343 | 1014 | 1042 |
| % who for a new journey would automatically use the car (if applicable) | 57% | 58% ns |
56% | 57% ns |
78% ** |
68% ns |
41% *** |
46% *** |
68% *** |
| % who support having more restrictions on car parking and car use, if it improved conditions for other road users like pedestrians and cyclists | 34% | 33% *** |
48% | 52% *** |
64% *** |
53% *** |
55% *** |
37% *** |
25% *** |
| % feeling fairly to very confident about cycling on roads in their local area | 18% | 16% *** |
45% | 49% *** |
53% *** |
44% *** |
49% *** |
20% * |
17%ns |
| % who are fairly to very concerned about climate change | 56% | 57% ns |
56% | 56% ns |
58% ns |
55% ns |
64% *** |
61% *** |
54% *** |
| % who are fairly to very concerned about local air quality | 43% | 43% * |
49% | 53% ** |
58% ** |
51% * |
55% *** |
47% ** |
38% *** |
| % who are fairly to very interested in new technologies | 46% | 45% *** |
57% | 55% *** |
60% ns |
62% *** |
57% *** |
50% * |
48% ns |
| % who, with a better access to an ebike, e-cargobike or e-scooter, would make quite to very substantial changes to their day-to-day travel habits | 14% | 10% *** |
49% *** |
52% *** |
78% *** |
58% *** |
31% *** |
14% ns |
11% *** |
Notes. ‘Don’t know responses’ are included in the calculated percentages. On the question about habitual car use, non-car owners were removed (n= 290). P-values indicate significance either between users and non-users, or between members of each group and their inverse – e.g. e-bike users and non-e-bike users and is noted as: ns for p > .05, * for p ≤ .05, ** for p ≤ 0.01, *** for p ≤ 0.001.
Table 11.
Car use and driving attitudes and habits for different mobility groups.
| England | Non emm users | E-micro mobility users | E-bike users | E-cargo bike users | E-scooter users | Utility cyclists | Frequent walkers | Frequent car users | |
| sample size | 2000 | 1753 | 185 | 139 | 55 | 98 | 343 | 1014 | 1042 |
| Don't know / None of the above | 128 | 84 | 14 | 10 | 3 | 3 | 17 | 35 | 34 |
| Share not driving | 27% | 27% | 34% | 32% | 54% | 43% | 26% | 29% | 8% |
| I do not drive, and have no interest in doing so | 63% | 67% | 35% | 38% | 39% | 35% | 54% | 62% | 51% |
| I do not drive, but would like to start doing so | 37% | 32% | 65% | 63% | 61% | 65% | 46% | 38% | 49% |
| Share driving | 73% | 73% | 66% | 68% | 46% | 57% | 75% | 71% | 93% |
| I drive, but try to minimise my car use | 64% | 63% | 82% | 82% | 87% | 81% | 80% | 69% | 58% |
| I drive, and am not interested in reducing my car use | 36% | 37% | 18% | 18% | 13% | 19% | 20% | 31% | 42% |
Notes. Respondents were asked to choose from four statements about driving. A fifth statement: Don’t know / Prefer not to say / None of the above, has been removed from the given percentages.
Disclaimer/Publisher’s Note: The statements, opinions and data contained in all publications are solely those of the individual author(s) and contributor(s) and not of MDPI and/or the editor(s). MDPI and/or the editor(s) disclaim responsibility for any injury to people or property resulting from any ideas, methods, instructions or products referred to in the content. |
© 2026 by the authors. Licensee MDPI, Basel, Switzerland. This article is an open access article distributed under the terms and conditions of the Creative Commons Attribution (CC BY) license (http://creativecommons.org/licenses/by/4.0/).
Copyright: This open access article is published under a Creative Commons CC BY 4.0 license, which permit the free download, distribution, and reuse, provided that the author and preprint are cited in any reuse.