
Submitted:
25 February 2026
Posted:
28 February 2026
You are already at the latest version
Abstract
This study aims to examine the interrelated effects of finance structure, institutional quality, and macro-demographics on CO₂ emissions per capita in OECD countries from 2004 to 2021. Building on the conventional linear and aggregate nature of the finance–environment relationship, this study suggests an improved methodology based on a hybrid framework combining panel estimation, machine learning-based clustering, and nonlinear modeling. The empirical findings support a positive relationship between bank-based intermediation structure, represented by private credit and credit quality, and CO₂ emissions per capita, which could be explained by a scale effect. At the same time, a negative relationship is found between non-performing loans and CO₂ emissions per capita. In addition, a negative relationship is found between the assets of pension funds and mutual funds and CO₂ emissions per capita. This suggests a critical role played by long-horizon investors in offsetting the carbon footprint of economic activity. Government effectiveness is found to have a positive relationship with CO₂ emissions per capita. This could reflect development stage considerations rather than institutional failure. Finally, a weak positive relationship is found between population density and CO₂ emissions per capita. This supports scale efficiencies. The K-means clustering methodology reveals a strong structural heterogeneity in the finance–environment relationship. This supports the view that there are unique structural regimes in which similar CO₂ emissions per capita outcomes are influenced by a variety of interrelated finance structure and institutional quality drivers. In addition, the Random Forest methodology outperforms other machine learning techniques. This suggests a strong nonlinear nature in the finance–environment relationship. Finally, the empirical findings support a relatively stronger emphasis placed on structural finance structure and institutional quality variables rather than short-run macroeconomic variables in explaining variations in CO₂ emissions per capita.
Keywords:
financial structure
; CO₂ emissions
; Institutional quality
; sustainable finance
; machine learning
1. Introduction
In recent decades, concerns about the climate crisis have led to an increase in discussions about economic development and sustainability from both theoretical and practical points of view. Carbon dioxide emissions are one of the core concerns in economic development and sustainability discussions due to their direct relationship with energy consumption and production activities. While technology has played an important role in economic development for a low-carbon climate, recent literature has emphasized the role of the financial system in facilitating economic development. The financial system can act as a catalyst for or a barrier to environmental sustainability depending on its consistency with a carbon-intensive production structure. One of the important gaps in recent literature is an examination of the relationship between the financial system and economic development in terms of its impact on levels of CO₂ emissions. However, the literature has shown certain limitations in providing a comprehensive understanding of the finance-environment relationship. Firstly, a large body of literature has been devoted to exploring the relationship between financial development and environmental quality in terms of CO₂ emissions. Secondly, a significant amount of attention has been paid to exploring the relationship between economic growth, urbanization, and demographics in the context of CO₂ emissions. Thirdly, recent studies have shown the significance of institutions in explaining the finance-environment relationship, with a positive association found for enhanced regulatory capacity in the context of environmental quality. However, a large part of the literature has been focused on a specific dimension of the finance-environment relationship or a broad indicator of financial development. Based on the above, two specific gaps in the literature are evident. Firstly, a limited amount of research has been conducted on the differential impacts of the various components of the financial system on CO₂ emissions, particularly in the context of bank-based finance, market-based finance, and the role of institutional investors. This is because the financial system as a whole might not capture the specific objectives, time horizon, and risk-management strategies of banks, pension funds, and mutual funds, which might differ systematically from each other. Secondly, the overwhelming use of linear regressions in the literature might be too restrictive in a cross-country context, where a large amount of heterogeneity in financial systems, institutions, and financial development might require a more flexible approach than homogeneous average effects. The main research question that is being addressed in this specific study is: What is the role of the unique components of the financial system in per capita CO₂ emissions, and how is this relationship nonlinear across different institutional settings and macro-demographic contexts? To address this specific research question, an integrated methodological framework is being used, which includes a combination of panel data econometrics, machine learning clustering, and machine learning regression. This specific combination is considered a methodological novelty, and it is a unique combination that has not been used in previous studies. Panel data econometrics is used to control country-specific factors and to uncover temporal relationships. Unlike previous studies, the proposed model explicitly accounts for the influence of bank-based finance in per capita CO₂ emissions, as measured by private credit and credit quality. In addition, it explicitly accounts for market-based finance, as measured by mutual fund assets and pension fund assets, as well as other factors, which include government effectiveness, economic growth, and population density. The second pillar, machine learning clustering, provides a new perspective in addressing heterogeneity through the formulation of country groups based on unique combinations of financial, institutional, and macroeconomic variables. This enables the assessment of whether similar environmental outcomes are replicable through different structural configurations. In addition, it shifts the focus from averages to regime-based analysis of environmental performance. The third pillar, machine learning regression based on the Random Forest algorithm, adds a non-linear predictive component to the assessment of environmental performance. This enables a more nuanced assessment of the finance–environment relationship. In addition, it provides a more precise assessment of environmental outcomes. Overall, the study makes several contributions to the literature through this unified framework and harmonized cross-country panel data. First, it provides a new perspective in addressing the finance–environment relationship in terms of the significance of financial structure. In addition, it highlights the importance of heterogeneity in the finance–environment relationship. Second, it provides policy-relevant insights in terms of how the financial system and institutions could align more closely with a low-carbon economy. Finally, it proposes a bridge between conventional econometric approaches and contemporary machine learning techniques in better understanding the structural determinants of CO₂ emissions.
The article continues as follows. Section 2 reviews the related literature. Section 3 describes the data and the empirical methodology. Section 4 presents the econometric results and discusses the interpretation of the finance–environment nexus. Section 5 introduces the K-Means clustering approach and provides an empirical interpretation of the identified regimes. Section 6 compares alternative predictive models and motivates the choice of Random Forest on the basis of predictive accuracy and explanatory power. Section 7 summarizes the main empirical findings on financial structure, institutions, and CO₂ emissions. Section 8 discusses policy strategies aimed at reconciling financial development with environmental sustainability. Finally, Section 9 concludes.
2. Literature Review
The set of contributions for 2026 represents a significant step forward in the literature on the finance–environment nexus, as it shifts focus from aggregate finance–environment nexus to mechanisms, heterogeneity, and finance governance within sustainable finance. From a preliminary reading of the framework, it is clear that the contributions to the 2026 set corroborate the main proposition of the framework: environmental outcomes are not driven by aggregate finance but by the structure of finance, finance governance, and regimes. The initial set of contributions to the 2026 set deals with the greenwashing issue in the finance–environment nexus literature. In a series of contributions, Doğan et al. (2026) ask if green transactions in China contribute to sustainability outcomes or if they represent greenwashing strategies. In another set of contributions, Ding et al. (2026) focus on substance rather than form in analyzing carbon transactions. Chen et al. (2026) examine greenwashing from a perspective focusing on site visits by institutional investors. These contributions, in sum, represent a focus on substance rather than form, which is a central proposition of the framework, moving from aggregate finance to a focus on structural finance and governance in the finance–environment nexus. The results from Random Forest and clustering in the framework highlight that ESG or financial labeling hides significantly divergent emission outcomes across different regimes of finance. Relatedly, the literature explores the concept of information roles, disclosure, and digital technologies. Luo et al. (2026) examine the role played by artificial intelligence in ESG disclosure and practice. Zhang, A. et al. (2026) and Huang et al. (2026) investigate the influence of fintech and sustainability disclosure on corporate environmental information and bank liquidity risk, respectively. Xu and Zhang (2026) and Jiang et al. (2026) examine the influence of digital technologies and managerial focus on digital transformation in the context of internal information environments and stock price synchronicity, respectively. Within this context, these studies shed additional light on why market-based finance, as captured by MFA, and institutional quality, as captured by GEFF, are found to be the most important predictors in the above models. Improved information environments and digital technologies enable monitoring and disciplining by long-horizon investors, which in turn limits firm environmental performance. Improved information environments and digital technologies shed additional light on why the relative importance of structural and institutional factors emphasized in machine learning methods focuses on short-run emission growth dynamics. A second major theme deals with financial structure and capital allocation. In this area, Li, J. et al. (2026) offer evidence of the effectiveness of green credit guidelines in banking in China in terms of environmental outcomes, and Choudhary and Thenmozhi (2026) examine the contribution of fintech to clean energy and green partnerships worldwide. In a further contribution to this area of the special issue, Subhani et al. (2026) revisit the Pecking Order Theory in a green context and demonstrate the impact of financial development and climate change on environmental outcomes. In another contribution to this area of the special issue, Wang and Wang (2026) examine common ownership and green innovation efficiency, and Sun et al. (2026), as well as Zhang (2026), emphasize the importance of patient capital in low-carbon and AI-oriented strategies for innovation. These findings support the panel evidence on the positive association of bank-based credit (PCR) with emissions because of a scale effect, except in the presence of green guidelines, and the negative association of long-term investors (PEN and MFA) with emissions in line with a reallocation effect, thus supporting the central hypothesis of composition being more important than size. The emphasis on institutional investors and analysts indicates a good trend and supports this result. Wei et al. (2026) investigate the capital markets for analysts' competence in ESG. You and Payne (2026) explore ESG demand from both retail and institutional investors. Gaba and R. (2026) investigate pressure-sensitive institutional investors in India and CSR value creation. Huang et al. (2026) investigate whether motivated funds can solve ESG conflicts in China. Finally, Qin et al. (2026) expand the framework by including a level of governance through an examination of geographical concentration of institutional shareholders as an explanation for disagreements in ESG ratings. These papers offer an explanation for why MFA and PEN are among the most important variables in the Random Forest results: institutional investors are key players that influence environmental practices, information environments, and innovation strategies of firms. These results are consistent with the results from the clustering, which indicated that similar levels of emissions can be driven by different financial systems depending on their interaction with governance. A third set of papers focuses on the dimensions of risk, stability, and macrofinancial. In this group, Li, W. et al. (2026) investigate climate risk and asset-liability maturity mismatches; Zhuang et al. (2026) investigate shadow banking and equity mispricing; Cao et al. (2026) investigate the effects of compliance reforms on insider trading in state-owned enterprises in China; and Huang et al. (2026) investigate sustainability disclosures in bank liquidity risk. Shahin & Djoundourian (2026), like Yahya & Lee (2026), investigate the role of central banks in addressing climate concerns and emissions in the financial sector. These papers are in line with the negative relationship between non-performing loans and emissions and suggest the role of NPLs as a contractionary mechanism in the model. They also support the proposition underlying the model: the close link between climate risks and financial stability, with climate risks affecting financial balances, structures, and prices in the same way as any other risk factors. A further dimension relates to the role of technology, innovation, and industrial structure. Zambrano-Monserrate et al. (2026) find a nonlinear impact of industrial robots on energy intensity with varying macroeconomic environments. Wang et al. (2026) investigate conglomerates’ green innovation in China. Chen, Zhang, and Duan (2026) find media coverage of environmental issues to be associated with green innovation through regulatory pressure and institutional investor attention. These papers also support the nonlinear effects and regime dependence found in the machine learning analysis. Technology, in itself, does not guarantee a reduction in emissions; it depends on the macrofinancial environment. This explains the better performance of the Random Forest model compared to linear methods. Additionally, the legal and regulatory dimension is included in the analysis. Hubková and Kud (2026) examine sustainable finance soft law developed by ESMA and the Green Capital Markets Union. This paper can be considered a kind of institutional counterpart to the regression finding that GEFF is relevant as a driving variable but is positively correlated with emissions due to development stage effects. This implies that institutions need to be supplemented with a type of climate-focused financial regulation in order to obtain decarbonization rather than just facilitating a more efficient type of high-carbon growth. Finally, the geographical dimension introduces another relevant perspective in the literature under review. Specifically, Bista and Bishwakarma examine green finance in Nepal and identify issues related to developing countries. Li and Shahzad use machine learning and deep learning techniques to examine biodiversity risk exposure in China from a natural capital perspective. These papers can be considered a type of institutional counterpart to the regime-based clustering finding that countries and regions are located in structurally distinct positions in the finance-environment space, which implies a type of policy solution specific to each country or region rather than a universal solution. The presence of both high- and low-emitting clusters with structurally distinct types of financial systems supports the diversity of the literature from a geographical perspective. Finally, there are several papers on market behavior and prices. In this regard, Zhuang et al. (2026) deal with the issue of shadow banking and mispricing. Additionally, Wei et al. (2026) focus on the role of analysts, while You and Payne (2026) discuss investor responses to rankings. Overall, these papers emphasize the role of environmental information, which is increasingly capitalized but not fully reflected in prices. They also focus on the role of institutional investors and market-based finance in achieving a proper fit between financial systems and environmental objectives. In this regard, they also discuss the negative effects of simply expanding credit without properly taking into account the role of institutions and information. The latter is consistent with the positive coefficient on PCR. Overall, the 2026 papers robustly validate the results of the integrated approach used in this paper. The results from panel regression models, clustering results, and Random Forest models converge to emphasize the role of financial structure, the mediating role of institutions and information environments, where finance can sometimes be a force for greener innovation and sometimes a force for maintaining brown assets. In addition, the results emphasize the prevalence of heterogeneity and non-linear effects. The progression from Doğan et al. to Huang et al. (2026) not only adds to the existing body of knowledge but also points to a paradigmatic shift in the way we understand finance. It is no longer viewed as a single driver of growth and emissions. Rather, it is now viewed as a complex system with its own composition, structure, and interface with the low-carbon transition. See Table 1.
3. Methodology and Data
The above Table 2 illustrates a coherent and theoretically informed set of variables that strongly motivate the proposed empirical model. In choosing to designate CO₂ emissions per capita (CO2P) as the dependent variable, the model focuses on a well-known and internationally comparable metric of environmental pressure and climate performance. In doing so, it allows for a direct investigation of the ways in which economic, financial, and institutional structures inform sustainability outcomes, which is a key theme in both academic and policy-based discussions of the green transition. The inclusion of GDP growth (GDPG) allows the model to control for the business cycle aspect of economic activity; as the expansion of the economy tends to increase pressure on the climate, controlling for this factor is necessary to isolate the structural effects of the model’s financial and institutional variables. Furthermore, population density (POPD) is included to take into consideration the role played by urbanization and spatial agglomeration, which may generate efficiency effects through scale economies in infrastructure or transportation, or pressures on the natural environment in urbanized areas. This variable controls for a crucial structural driver of emissions that is independent from financial development. Government effectiveness (GEFF) encompasses the institutional dimension of the model. This variable encompasses the quality of public services, policy-making, and implementation, and therefore the capacity of governments to enforce environmental policies and induce a transition towards a more sustainable economic configuration. This variable is included in the model because it recognizes the interdependence between the financial system and its institutional context, which plays a crucial role in determining its environmental implications. The financial dimension of the model is addressed through complementary indicators. Private credit (PCR) measures the extent and scale effects of banking intermediation. Non-performing loans (NPL) are included as a proxy for financial stability and quality, which are essential for investment capacity and behavior. Pension fund assets (PEN) and mutual fund assets (MFA) are included as indicators of long-run and market-based institutional investors, respectively, to emphasize the role played by capital allocation mechanisms in facilitating or impeding a transition towards a more sustainable economic configuration. These variables allow the model to embrace a comprehensive framework for analyzing the interdependence between bank-based and market-based systems in determining CO₂ emissions. See Table 2.
The descriptive statistics offer an extensive description of the distribution characteristics of the major variables used in the study and offer insights into interesting features of the dataset. In terms of sample size, it is evident that all variables have a large sample size, with values above 600 recorded in most cases. However, there are some missing values recorded for NPL, MFA, PEN, PCR, and CO2P. On the other hand, GDPG, GEFF, and POPD are recorded without any missing values. The range of central tendency measures reveals a high level of heterogeneity among the variables under consideration. In terms of CO2P, it can be seen that the mean and median are relatively close to each other. This indicates that the distribution of mean values of CO₂ emissions across all countries under consideration is relatively symmetric. In contrast, for variables such as MFA and PEN, there is a high level of divergence between the mean and median values. In particular, for MFA, it can be seen that there exists a high level of divergence between the mean and median values. Such a feature indicates the presence of extreme values in the dataset. The same has also been recorded for PCR and POPD, where it has been seen that the mean values are significantly higher than the median values. In terms of GDPG and GEFF, it has been seen that both mean and median values are relatively close to each other. These results are also supported by the results of the dispersion statistics, in that MFA, POPD, PCR, and PEN present relatively high values of standard deviation, variance, and interquartile range, indicating that there is considerable cross-country heterogeneity in terms of financial development and demographic variables. In contrast, the results for the series of the GEFF indicator present relatively lower values of dispersion, indicating that there is only moderate variation in terms of institutional quality at the country-level sample. The shape of the empirical density curves also characterizes the series under consideration. The results of the skewness and kurtosis indicators suggest that several series, including NPL and MFA, are highly skewed to the right and peaked in terms of kurtosis, indicating that these series present relatively heavy-tailed and concentrated distributions with extreme values in the right tail of the distribution. In contrast, the results for the series of GDPG and GEFF present negative skewness values and relatively lower kurtosis values. Overall, the results of the summary statistics suggest that the dataset under consideration is heterogeneous in terms of non-normality in several dimensions of financial development and demographic variables. The implications of these results for the empirical estimation of the determinants of CO₂ emissions per capita are highly relevant in terms of the choice of appropriate estimation models and techniques that can accommodate non-normal distributions in the context of the estimation of environmental quality determinants. See Table 3.
The empirical approach adopted by this research is founded on a combination of three distinct methodological approaches: panel data econometrics, machine learning clustering, and machine learning regression. The combination of these three methodological approaches is particularly appropriate for the research question at hand. The research aims at shedding light on the combined effects of financial structures, institutional quality, and macroeconomic conditions on CO₂ emissions per capita across a panel of heterogeneous countries. Firstly, panel data econometrics forms the foundation of causal inference in this research. The panel data approach allows for the control of unobserved country-specific time-invariant factors that might have a potential impact on the results. Such factors might include the country-specific history and contexts in which countries have developed. The difference between the fixed and random effects models, combined with robust tests for spurious relationship detection, helps ensure that results are not merely spurious correlations. Secondly, the research employs machine learning clustering methods. The panel regression approach typically imposes a homogeneous country effect assumption. However, it is implausible to assume homogeneity across countries due to significant cross-country variations in financial systems and levels of development. The clustering approach offers a different route for identifying distinct regimes according to multiple criteria. The approach allows for the identification of countries with similar financial and institutional characteristics and different emission profiles. The approach relaxes the homogeneous country effects assumption in favor of a heterogeneous country effects assumption. Finally, the research employs machine learning regression approaches. The Random Forest regression approach is employed as a different perspective from the results obtained from the panel regression approach. The superior predictive performance of the approach can shed further light on the relative importance of financial and institutional factors compared with macroeconomic factors in the short term. See Figure 1.
4. Empirical Results and Interpretation of the Finance–Environment Nexus
Specifically we have estimated the following equation:
where i=38 and t=[2004;2021].
The dataset and the results of the econometric analysis put together provide a complete framework for analyzing the impact of macroeconomic factors, demographic factors, governance factors, and factors related to the composition of the financial system on environmental outcomes such as per capita carbon dioxide emissions. The selection of CO2P as a variable in the regression is appropriate for this research as it captures the emission intensity relative to the economy’s overall population. The incorporation of GDP growth as a regressor is crucial in analyzing the structural effects of economic growth on CO₂ emissions. In the past, there has been a positive relationship between economic growth and environmental emissions due to the increase in energy consumption caused by economic growth. The positive and statistically significant coefficient of GDPG in the random effects model and the fixed effects model is consistent with the scale effects relationship between economic growth and environmental emissions. The density of the population is included with a negative coefficient that is only weakly significant. The negative sign suggests that on average, countries with higher densities tend to have lower levels of emissions. The results can be explained by urbanization efficiencies due to density, which can have a positive impact on reducing pollution due to efficient transportation options. In addition, the role of governance is represented through the Government Effectiveness (GEFF) variable. The positive and statistically significant result of the GEFF variable in both regressions might be considered counterintuitive since it would be expected that improved governance would be positively related to environmental policy effectiveness. It is interesting to note that those countries that scored high on the GEFF indicator are also those that are economically developed, industrialized, and energy-intensive in absolute terms. As such, it might be argued that the development effect dominates the environmental effect across both cross-country and within-country variations included in the model. In such an interpretation, the GEFF indicator would be considered an indicator of economic development, and it would be noted that during the period under consideration, improved governance would be positively related to increased emissions per capita. The financial variables represent an important contribution of this study since it establishes a direct link between financial intermediation and environmental outcomes. The private credit to GDP ratio, regardless of the financial intermediary used for its channeling, presents a positive and highly significant result. As such, it might be noted that improved financial development would be positively related to increased emissions per capita. Such an interpretation would suggest that an increase in the scale of financial system development would be positively related to increased production and energy use. The channeling of such an increase in credit might be used for both carbon-intensive and green production activities in the absence of green credit or similar financial instruments for environmental outcomes. Such an interpretation would not suggest that finance per se has an adverse impact on environmental outcomes; rather, it would suggest that the direction and composition of such an increase in credit would be important for environmental outcomes. The coefficient for non-performing loans to gross loans is negative and significant. It suggests that with rising levels of distress in the banking sector, there is a decline in emissions per capita. It can be seen as a type of 'contraction effect,' where higher levels of distress in the banking sector result in a decline in credit. The negative sign can also be seen as a manifestation of the procyclicality relationship between emissions and banking sector distress. It should be noted that procyclicality should not be interpreted as suggesting that higher levels of banking sector distress are beneficial. A stable banking sector is desirable. The distress in the sector acts as a countervailing force. The most striking results relate to long-run institutional investors. The coefficient for pension funds to GDP and mutual funds to GDP is negative and highly significant. The coefficient for mutual funds is more precise. These results suggest that there exists a negative relationship between market-based and long-run investors and per capita emissions. Several factors might contribute to such a relationship. One such factor could be that investors with longer investment horizons and greater incentives to address long-run risks, including climate-related risks, are more likely to invest in clean technologies, renewable energy, and environmental-focused companies. Another factor might be that the entry of large investors into stewardship and ESG investing has a material impact on companies. The negative relationship between PEN and MFA/CO2P supports the idea that the structure of financial intermediation has an important role to play in facilitating the transition to a low-carbon economy. In addition, a change in the structure of financial intermediation from bank-based systems to capital markets and institutional investment might be able to facilitate such a transition. In terms of methodology, it has been noted that the comparison between random effects and fixed effects has provided several interesting results. Firstly, it has been noted that the Hausman test has rejected the null hypothesis of consistency for the random effects estimator, suggesting that unobserved country effects are correlated with regressors. In addition, it has also been noted that the fixed effects results confirm the signs and significance of key variables, providing an increased level of confidence in the results obtained for the relationships. Finally, it has also been noted that the within country R-squared of 0.53 is quite high for such an outcome variable and such a limited set of regressors. Diagnostic tests also validate the appropriateness of HAC standard error correction with significant levels of heteroskedasticity, serial correlation, and cross-sectional dependence. The statistically significant results from the Pesaran CD tests also validate the presence of common shocks/spillovers across countries. The results could be due to the effects of global fluctuations in energy prices. The results from the Wooldridge serial correlation tests also validate the presence of serial correlation in the error terms. The HAC correction helps address this issue by preventing the overstatement of statistical significance. The results from the Durbin-Watson statistical test also validate the positive serial correlation effects in the residuals with low values relative to the critical values. The results suggest that future research should consider dynamic modeling effects with lagged dependent variables. The descriptive statistics validate the results with a mean of the dependent variable close to 7.9 with a standard deviation of 4.17. The results validate significant heterogeneity in per capita emissions across countries. The results from the random effects model validate significant model variance with significant structural differences across countries. The results also validate significant differences in levels of development across countries. The results from the fixed effects model validate significant changes in financial structure and conditions with levels of macroeconomic conditions across countries. Overall, the results validate a nuanced perspective on the relationship between finance and the environment. The results validate positive associations between the expansion of traditional banking credit and levels of emissions. The results validate a negative relationship between the expansion of institutional investors and market finance. The results validate positive associations with levels of government effectiveness. The negative coefficient on non-performing loans validates the cyclical nature of emissions. Overall, the empirical findings support the theoretical proposition that an effective green transition involves not only an effective design in environmental policy and innovation in technology but also a transformation in the nature of finance in society. In this regard, a policy that supports long-term institutional investment in sustainable finance systems and channels bank credit to green activities has the potential to reconcile finance development with environmental protection. The positive relationship between growth and emissions, along with serial correlation in residuals, suggests a gradual green transition. In this respect, the model provides a useful framework to investigate the banking system and finance in addressing climate risks. See Table 4.
5. K-Means Clustering for the Finance–Environment Nexus: Model Choice and Empirical Interpretation
Based on this multi-criteria evaluation of the quality of clustering results, K-Means can be identified as the most appropriate algorithm from the considered methods. In this assessment, the criteria that need to be maximized include the Calinski–Harabasz index, the Dunn index, gamma of Pearson’s correlation coefficient, and minimum separation, while the criteria that need to be minimized include maximum diameter, entropy, and the Herfindahl–Hirschman index. In addition to the three conventional criteria of compactness, separation, and overall clustering structure, the relative sizes of the resulting clusters are also given special importance because highly polarized clustering results, in which one cluster is significantly larger than the others, are undesirable. From this perspective, the Density-Based and Hierarchical clustering methods can be identified as having very poor performance because of the highly unbalanced relative sizes of the resulting clusters, as evidenced by the very high HH values indicating excessive concentration in these methods, making these methods practically useless for clustering purposes. The relative sizes of the resulting clusters in the Fuzzy C-Means and Model-Based clustering methods are less concentrated but are disadvantaged in terms of both poor separation and high entropy values. The relative sizes of the resulting clusters in the Random Forest clustering method are relatively balanced but do not achieve high values in internal validity indices that measure cluster compactness and separation. In contrast to these methods, K-Means achieves an outstanding performance in terms of the Calinski–Harabasz index, indicating high relative variance between the resulting clusters compared to the variance within the resulting clusters, while also achieving relatively low values in terms of entropy and the HH index, indicating an even distribution of the relative sizes of the resulting clusters. Although K-Means does not achieve the highest values in terms of some of the cluster separation criteria, these values are still within an acceptable range without any extreme trade-offs that are found in the results of the other methods. Thus, K-Means can be identified as the optimal compromise solution that meets all the relevant criteria in an acceptable manner without any disadvantages, making this method the most appropriate for the purposes of this analysis. See Table 5.
The K-means clustering outcomes provide a nuanced grouping of the sample with regard to financial, institutional, and macroeconomic variables, while at the same time highlighting the role of CO₂ emissions per capita as the key outcome of interest. The distribution of the observations in the clusters is relatively balanced, with several medium-sized clusters and a small number of small but well-defined clusters. This suggests that the K-means clustering algorithm avoids extreme polarization with regard to the distribution of the observations in the clusters, with the presence of a dominant group. Such an approach is in line with the aim of identifying interpretable and empirically meaningful regimes. With regard to the within-cluster heterogeneity and the within-cluster sum of squares, the outcomes suggest the presence of variation in the internal compactness of the clusters. Clusters such as 6, 3, and 8 suggest relatively low levels of dispersion and high values of silhouette. This implies well-separated and internally coherent profiles. With regard to the outcomes in the context of the profile of CO2P, the K-means clustering outcomes suggest clear and economically meaningful patterns. Clusters such as 3 and 6 suggest high levels of emission, with the clusters having a significantly positive standardized center with regard to the levels of CO2P. In contrast, clusters such as 1, 2, 4, 5, and 8 suggest below-average levels of emission. From the perspective of the empirical analysis, the K-means clustering outcomes suggest the presence of heterogeneous relationships between financial variables and environmental outcomes. That is, the outcomes suggest the presence of heterogeneous relationships between the levels of financial development, financial stability, and the levels of emissions. The financial characteristics of these clusters also support this view. For example, for clusters dominated by high levels of CO2P, such as cluster 6, there are extremely high levels of mutual fund assets combined with lower levels of pension fund assets and private credit levels that are either negative or moderate. Similarly, for cluster 3, which also has high levels of emissions, there are high levels of private credit combined with high levels of pension fund assets. The coexistence of these two clusters with high levels of emissions but different financial characteristics serves to emphasize that high levels of emissions are not necessarily linked to any one financial system but can be explained through different channels, which are exactly those that cluster analysis seeks to uncover. In contrast, for those clusters that have lower levels of emissions, there are weaker or lower levels of financial indicators and, in some cases, also positive levels of government effectiveness. For example, for clusters 1 and 4, there are negative or moderately negative levels of CO2P combined with lower levels of private credit and, in some cases, positive levels of institutional characteristics. Population density also varies across clusters, with some of those clusters characterized by lower levels of emissions also experiencing positive levels of population density. Thus, from a general perspective, it can be concluded that the above results suggest that K-means classification is not only statistically valid, as confirmed by internal validation indices, but it is also economically significant in relation to the main research hypothesis concerning CO2P. The above clusters represent specific combinations of financial structure, credit conditions, institutional quality, and macroeconomic environment, which are associated with systematically different levels of emissions. This is a robust foundation for further analysis, which can be used to estimate how the effect of financial variables on CO₂ emissions differs across regimes, rather than imposing a restrictive relationship across the whole sample. See Table 6.
The K-Means analysis shows significant structural heterogeneity across clusters with respect to financial, institutional, and macroeconomic factors. The differences with respect to CO₂ emissions per capita (CO2P), however, are particularly significant. The values reported above are standardized. Therefore, the cluster centers should be interpreted relative to the sample mean. The clusters identify distinct regimes that integrate credit quality, financial structure, institutional performance, and macroeconomic factors in different ways. Therefore, they can be useful for understanding cross-country variation in environmental performance. There are several clusters with relatively low levels of CO2P. Clusters 1, 4, 7, and 10 have negative or moderately negative CO2P cluster centers. Therefore, these regimes have below-average levels of CO2P. The regimes tend to have relatively moderate or weak financial indicators and sometimes relatively strong institutional or demographic characteristics. Cluster 10, for example, has below-average levels of CO2P and also has relatively high levels of government effectiveness and population density, as well as positive levels of GDP growth. Therefore, it is consistent with the idea that relatively strong institutions and urban scale effects can offset environmental pressures even with positive GDP growth. Cluster 1 has low levels of CO2P and also has low levels of private credit and institutional quality. Therefore, it suggests a configuration where relatively low financial depth is associated with relatively low levels of CO2P. On the other hand, clusters 5 and 8 emerge as high emission regimes with strongly positive CO2P centers. These two clusters display very dissimilar financial profiles, indicating that high emission economic structures can emerge under very different financial conditions. In cluster 5, high CO2P is combined with relatively low credit conditions and below-average values of all financial indicators. In cluster 8, very high CO2P is combined with very low values of both pension fund assets and mutual fund assets, as well as very low institutional quality. The remaining clusters occupy an intermediate position in the figure and highlight further sources of heterogeneity in the results. Cluster 3 combines positive GDP growth, high government effectiveness, and high values of pension fund assets with below-average CO2P values, indicating an economic structure that combines institutional quality and growth with a relatively low level of CO₂ emissions. Cluster 6 is characterized by extremely high values of both private credit and non-performing loans, combined with negative CO2P values, indicating an economically intensive but not necessarily high emission economic structure that may correspond to a more advanced economic structure that is also more energy efficient. Clusters 2 and 9 display more ambiguous profiles with CO2P values close to the mean value and relatively moderate deviations in financial and institutional indicators, reinforcing the impression that there is no straightforward relationship between financial development and CO₂ emissions. On the whole, the K-Means classification exercise in the context of the classification problem presented in this study reveals that the relationship between finance, institutions, and environmental outcomes is indeed highly dependent on the regime in question. The co-existence of both high and low-emitting clusters and their association with varying financial structures highlight the need to go beyond the average effects and employ an empirical approach that permits the estimation of heterogeneous effects of financial variables on CO₂ emissions. See Table 7.
The Figure 2 provides a comprehensive illustration of the K-Means clustering solution. In particular, Panel A illustrates the information criteria (AIC and BIC) and the within-cluster sum of squares (WSS) as a function of the increasing number of clusters. This clearly illustrates a pattern of improvement in the model until a ten-cluster specification is reached. In particular, the minimum value of the BIC suggests this specification as a compromise between model parsimony and explanatory power. This supports the selection of a ten-cluster solution as an empirically grounded classification rather than an arbitrary classification. Panel B illustrates the clusters in a reduced-dimensional space. In particular, it illustrates a reasonably differentiated set of groups with limited overlap. This suggests that the K-Means algorithm identifies relatively discrete regimes. In addition, it illustrates a range of clusters from more compact to more dispersed. This suggests a degree of heterogeneity in terms of internal cohesion. This is consistent with the complex nature of the underlying data. In Panel C, the standardized cluster means are presented for the main variables, providing a clear economic interpretation of the groups. It should be noted that the clusters show significant differences in their financial structure, credit conditions, institutional quality, macro-demographics, but also, and most importantly, in their levels of CO₂ emissions per capita. In some clusters, countries are characterized by high levels of private credit, while in others they are characterized by high levels of non-performing loans. Similarly, in some clusters, the role of mutual and pension funds is more significant, while in others the role of government effectiveness and population density is more pronounced. What is common in all these clusters, however, is the systematically different levels of CO2P. In this regard, it should be noted that the presence of clusters with high levels of emissions and clusters with low levels of emissions, which are associated with different levels of financial structure, suggest a non-linear relationship between finance and the environment. In any case, the figure above shows that the K-Means solution is statistically justified, visually well-separated, and economically interpretable, providing a firm basis for the subsequent analysis, which will aim to estimate the variation in the impact of financial and institutional variables on CO₂ emissions. See Figure 2.
The Figure 3 provided prior to this discussion represents a complete set of pairwise plots for the standard variables used in K-Means clustering and displays the observations color-coded according to cluster membership. This figure provides an intuitive understanding of the overall structure of the data and the extent of segregation provided by the clustering solution. A number of observations can be made based on the figure provided. Firstly, there is significant dispersion and skewness in some of the variables, such as the MFA and PCR variables, where a subset of observations has much higher values than the remaining observations. This represents the clusters where extreme values of the financial profiles exist. Secondly, the figure provides evidence of the fact that the differentiation of the clusters is not based on a single variable but is based on a combination of financial variables, as well as institutional and macroeconomic variables, as indicated by the partial overlaps and better differentiation in other cases. The heterogeneous relationship of the CO2P variable with financial variables is evident from the figure provided, as higher levels of PCR or MFA in some cases relate to higher levels of CO2P in some clusters and lower levels in other clusters, as the relationship is regime-dependent in nature and is connected to the environment and finance. The relationship between the GEFF and the CO2P variable is evident from the figure provided and represents a generally positive relationship where better levels of institutional quality relate to lower levels of CO2P, though this is not universal in nature and is affected by other factors as well. The figure provided represents a discrete distribution of the population density and is such that several of the clusters aggregate in the low to moderate range of the variable and several of the clusters separate well in the higher range of this variable. This provides evidence of the fact that K-Means clustering is capable of finding multivariate structure in the data that is not explained by the correlation structure of the data. Although there is a partial overlap of the clusters for the variable under consideration, such an overlap is expected in a high-dimensional space and is not of significant concern in the context of the clusters formed in this space. See Figure 3.
6. Model Selection Based on Predictive Accuracy and Explanatory Power: Evidence in Favor of Random Forest
A comparative analysis of all the predictive models shows that the Random Forest model is the most appropriate in solving this problem. This has been determined through an integrative analysis of the error metrics and performance criteria, such as MSE, scaled MSE, RMSE, MAE/MAD, MAPE, and R². From the analysis, the Random Forest model has the highest ranking in comparison to the error metrics. It has the least values in comparison to the other predictive models in terms of MSE and RMSE, which implies minimal average error. It also has the least values in comparison to the other predictive models in terms of MAE/MAD and MAPE, which implies stability. It is also evident from the analysis that the model has a good bias-variance trade-off, which is desirable in tree-based models such as the Random Forest. It has the ability to combine multiple weak models to improve the predictive model. In terms of the ability to explain the model, the Random Forest model has the highest ranking compared to the other predictive models. This has been determined by the fact that the model has the highest R² values compared to the other predictive models. It has the ability to explain the variance in the dependent variable compared to linear regression, regularized regression, and other machine learning algorithms such as KNN and neural networks. Although the KNN model has the same error values as the Random Forest model, it has the least values in terms of the R² values, which implies low ability to explain the variance in the dependent variable. Although the linear regression model, the LASSO regression model, and the SVM model have low error values compared to the Random Forest model, they also have low values in terms of the R² values, which implies low flexibility to explain the complexity of the dataset. Moreover, the model has the advantage of reducing the chances of overfitting compared to the decision trees model. It has the ability to average the weak decision trees. It is, therefore, evident from the analysis of all the error metrics and performance criteria that the Random Forest model is the most reliable and accurate predictive model in solving the problem. See Table 8.
Given the varying definitions included in the empirical model, the results for Random Forest importance can be understood in a way that is closely related to the underlying theoretical framework. The fact that MFA and POPD are the most important predictors suggests that, based on the underlying data set, the structure of market-based finance and the demographic-spatial dimension are key in determining CO₂ emissions per capita. From a purely economic perspective, this implies that capital allocation through mutual funds and other market-based investors, as well as the degree of urbanization/population concentration, are key determinants in explaining emission patterns. This is consistent with the argument that capital reallocation across industries and scale effects due to population density can play a material role in determining the carbon footprint of economic activity. GEFF and PEN are the next most important variables, supporting the above interpretation in a way that is closely related to institutional factors and investment orientation. The quality of governments and their ability to formulate policies are key in explaining differences in emissions across countries, supporting the argument that institutions are a fundamental channel through which the above influence environmental outcomes. At the same time, the significance of pension fund assets points to the importance of long-run institutional investors, which are often linked to more stable investment strategies and a greater willingness to engage in sustainable and green projects. As regards NPL and PCR, which capture banking sector stability and credit intermediation depth, these variables appear to be associated with an intermediate level of importance. This result can be interpreted as supporting the idea that the banking channel is significant for environmental outcomes, although less so than institutional investors and governance quality. In other words, credit conditions and financial stability contribute to explaining emissions, although within a broader framework where capital allocation mechanisms and institutional effectiveness appear to play a greater role. Finally, GDPG is associated with the lowest level of importance across all three importance metrics, which can be interpreted as supporting the idea that short-run fluctuations in economic growth play a relatively minor role in explaining variations in CO₂ emissions, conditional on a set of structural financial, institutional, and demographic factors. See Table 9.
The table below displays the predicted values by the Random Forest model for five representative cases and breaks down the predicted values into a baseline and the marginal contribution of the explanatory variables, in line with an additive form of the model's output. The baseline is a constant across all cases and represents the average predicted value in the sample, while the other components represent the contribution of each variable to the predicted value in comparison to this baseline. In all cases, the predicted values far exceed the baseline by a considerable amount, indicating that the particular configurations of financial, institutional, and macroeconomic variables all contribute to pushing the predicted value upwards in a systematic fashion. Of the explanatory variables included in the model, MFA and PEN consistently have large positive contributions to the predicted values, indicating that for these cases in particular, having well-developed market-based financial intermediation and large pension assets is associated with higher predicted values of the dependent variable. This is in line with the idea that the structure of institutional investors and capital markets is a key driver of the model's output in general. POPD and GEFF exhibit significant and stable positive contributions, which highlight the importance of demographic density and institutional quality in explaining cross-sectional variations across different cases. The contributions of NPL and PCR are moderate and divergent across different cases, which is in line with their relatively moderate importance in the global variable importance ranking. This suggests that banking sector conditions and credit depth are significant for predictions, although not as prominent as those of institutional investors and structural factors. GDPG, although consistently positive across different cases, exhibits relatively lower contributions, which reinforces the idea that short-run growth cycles are less significant once structural financial and institutional factors are taken into account. The steady increase in predicted values from Case 1 to Case 5 is a result of cumulative contributions from a number of significant variables, namely MFA, PEN, and POPD. This shows how the Random Forest model uses a combination of different factors in a non-linear but transparent manner to generate predictions that deviate from the sample averages. Overall, it is confirmed that predictions generated by the model are driven by structural financial and institutional factors rather than short-run macroeconomic cycles, and it is transparent how different factors contribute to a predicted value in a given case. See Table 10.
The above Figure 4 gives a comprehensive assessment of the performance of the Random Forest model in terms of prediction accuracy and the structure of the model, as shown in the various components in the figure. Panel A shows the predicted values and the observed values. From the points plotted in the above figure, it is clear that a significant relationship exists between the predicted values and the observed values, as shown by the clustering of the points around the 45-degree line in the above figure. Panel B shows the variation in the out-of-bag mean squared errors with respect to the number of trees included in the model. From the above figure, it is evident that the model converges rapidly with the inclusion of diverse trees in the model and ends with a minimal bias level. Panel C shows the variable importance in the model based on the mean decrease in accuracy for each variable included in the model, while Panel D shows the variable importance based on the total increase in node purity for each variable included in the model. From the above two panels, it is evident that population density and mutual fund assets are the most important variables in the model, followed by government effectiveness and pension fund assets. GDP growth rate has a weak influence in the model, while variables related to the banking sector, such as private credit and non-performing loans, are in the middle in the above two panels. From all the above panels, it is evident that the Random Forest model has a strong prediction accuracy with rapid convergence and a greater emphasis on structural variables rather than macro variables in the model, which indicates the suitability of the Random Forest model in explaining the complex relationship in the dependent variable. See Figure 4.
7. Summary of Empirical Findings on Financial Structure, Institutions, and CO₂ Emissions
The empirical results provide a consistent set of results through the integration of panel data econometrics, clustering based on machine learning methods, and machine learning regression, each providing novel and complementary insights into the relationship between financial structure, financial institutions, and CO₂ emissions per capita. The panel data regression results are core inferential evidence. The random effects and fixed effects panel regression results both show that economic growth has a positive and significant relationship with emissions, reinforcing the persistence of a scale effect. Population density has a weakly negative relationship with emissions, which might suggest urban scale efficiencies. However, the relatively low levels of significance suggest that country-specific effects are important. Government effectiveness has a positive relationship with emissions, which might be interpreted as evidence of a level of economic development and industrialization in institutionally developed economies rather than an actual link between good governance and emissions. In terms of financial structure, private credit has a strong positive relationship with emissions, suggesting that deeper bank-based financial systems are associated with increased carbon-intensive economic activity in the absence of green finance. In contrast, non-performing loans are negatively related to emissions, suggesting a contractionary effect where financial system health dampens economic activity. Most importantly, pension fund assets and mutual fund assets have strong negative relationships with emissions, reinforcing the role of long-term and market-based financial actors in facilitating lower-carbon development paths. The Hausman test supports the fixed effects panel regression results. The consistency of coefficients across panel regression methods and HAC correction methods gives strong support to these causal effects. Machine learning clustering extends these findings on average effects by revealing a notable structural heterogeneity across countries and over time. The K-Means solution, which is selected based on a range of internal validity criteria, reveals distinct regimes with differing combinations of financial structure, institutional quality, demographic characteristics, and emission levels. There are clearly clusters with high emission levels, but these differ substantially in their accompanying financial structures, with one cluster exhibiting a strong bank-based and long-term investor intensity configuration and another a market-based configuration. Conversely, several clusters with low emission levels are accompanied by weaker financial structures or stronger institutional and demographic characteristics, such as government effectiveness or population density, respectively. This regime-based approach therefore confirms that there is no universal finance-environment relationship, with similar emission outcomes driven by differing financial structures and similar financial structures driving differing environmental outcomes depending on the accompanying institutional and broader macroeconomic context. Finally, machine learning regression, and in particular the Random Forest model, introduces a predictive and nonlinear extension to the above empirical findings. A comparison across the range of algorithms applied reveals the Random Forest model to produce the best overall performance in terms of both error metrics and explanatory power, suggesting a range of nonlinearities and interactions in the underlying relationships in the data that are not captured by linear or more rigid models. Variable importance measures consistently reveal population density and mutual fund assets as the most important predictors, followed by government effectiveness and pension fund assets, with GDP growth playing a relatively minor role once structural features are controlled for. This again emphasizes the findings of the econometric and clustering analysis: in the long run, structural properties of the financial system, institutions, and demographics are more important for emissions than cyclical properties in the short run. The case-level decomposition of the predictions once again demonstrates the ability of the models to explain how different variables contribute to outcomes in a non-linear fashion and in interaction with other variables. Overall, the three approaches complement each other and provide a more complete picture of the results: panel econometrics provide average causal directions, clustering estimates provide regime-dependent heterogeneity, and machine learning regression provides non-linear effects and relative importance. The overall consistency of the findings of the three approaches again underpins the idea that the composition of financial intermediation and the quality of institutions in a country are key in determining environmental performance and that successful climate strategies must take into account structural differences across countries as well as the non-linear interactions of economic, financial, and institutional variables. See Table 11.
8. Policy Strategies for Reconciling Financial Development and Environmental Sustainability
The results obtained in this study have several important policy implications for governments and financial sector regulators aiming at striking a balance between the requirements of economic growth and mitigating the effects of climate change. First, the significant positive relationship between GDP growth and CO₂ emissions per capita suggests further that the scale effect of growth is likely dominating the results. The implication is that solely depending on growth as a means of mitigating the effects of climate change by promoting technological advancements or improving efficiencies is not sufficient. Therefore, the financial sector policy mix aimed at mitigating the effects of climate change should be improved. In parallel with this, the relatively small negative coefficient on population density suggests that spatial dimensions of growth matter. Therefore, investments aimed at improving urban densities can yield scale efficiencies that can help governments achieve a balance between growth and greenhouse gas emissions. The results obtained regarding the effects of financial sector structure have significant and important policy implications for sustainable finance. The positive and statistically significant coefficient on private credit suggests that conventional bank-based financial sector deepening has a scale effect. The implication is that financial sector deepening can be used as a means of mitigating the effects of climate change. However, this should not be understood as a negation of the conventional role of banks. On the contrary, it suggests that there is a need for a paradigm shift in the way banks allocate credit. Therefore, financial sector policymakers can consider several options. First, they can consider making banks active participants in mitigating the effects of climate change. They can achieve this by making explicit provisions in the regulation of banks regarding the effects of climate change. They can also consider making provisions aimed at making investments in green technologies relatively more attractive compared to those in non-green technologies. The negative relationship between non-performing loans and emissions also points to this cyclical effect: in times of financial crisis, investments decrease, leading to lower emissions. Although this result does not suggest that financial system instability is an appropriate policy tool in the fight against climate change, it does highlight the importance of climate risk being integrated into conventional financial stability risk assessment approaches. The most interesting result in terms of policy implications is the role of institutional investors in the financial system, measured by assets held in pension funds and mutual funds, which always seem to go hand in hand with lower emissions. This points to an interesting conclusion: not only is the size of the financial system relevant in terms of climate change mitigation policy, but also its composition. A financial system composed of long-term-oriented institutional investors in a financially stable environment seems to be better placed to internalize the risks of climate change in the long term and channel investments into green technologies or sustainable business models. To exploit this channel effectively, policymakers could focus on enhancing disclosure practices in climate risk, developing codes of conduct for ESG reporting, and establishing effective codes of practice for institutional investor engagement. In addition, policymakers could remove any regulatory or accounting barriers that hinder long-term investment decisions in the financial system and develop deep green bond markets and equity markets that can act as agents of climate change mitigation. The positive coefficient for institutional investors must be viewed with caution because this could merely indicate higher levels of development and industrial intensity. The overall implication is evident: even institutions alone are not sufficient to reduce emissions and that what is required is for governments to integrate climate change into broader development, industrial, and financial systems. This includes ensuring alignment of investment strategies with net zero targets and mobilizing private capital for green infrastructure through development banks. This means developed economies must not rely on their existing institutional advantages and must therefore step up the pace of structural change to decouple development and emissions. The clustering of results reveals the absence of a universal or one-size-fits-all policy for emission reduction and mitigation. Instead, economies tend to cluster into distinct groups with unique configurations of financial structure, institutional quality, and emissions profiles. This implies the need for differentiated policy approaches in line with country-specific circumstances. For instance, a country in a high-emitting bank-based system must prioritize green banking and capital market development for long-run sustainable investment; a country in a market-based system must improve stewardship and protect against greenwashing; and a country in a low-emitting bank-based system must prioritize maintaining quality and urban efficiency gains. Lastly, the significance of population density, mutual funds' assets, government effectiveness, and pension funds in the context of short-run fluctuations in growth rates, as revealed in the Random Forest analysis, underscores the significance of addressing fundamental rather than short-run changes in the context of climate policy. While short-run stimulus or restraint may have limited significance, long-run progress will require fundamental reform in the context of the financial system, urbanization patterns, and the broader institutional framework in which investment decisions are made. From a governance perspective, climate policy should reflect long-run commitments, transition paths, and policy environments characterized by low levels of uncertainty and strong incentives for the actors in the financial system to invest in low-carbon assets. Overall, the policy implications of this study support an integrated policy approach in which a harmonization of environmental policy and development in the context of the financial system is a key goal in facilitating a transition in which the development of the financial system and the sustainability of the environment are complementary rather than conflicting objectives.
9. Conclusions
This study examines the relationship between financial structure, institutional quality, and CO₂ emissions per capita using a novel integrated methodological approach, which combines panel data econometrics, machine learning-based clustering, and nonlinear predictive modeling. The goal is to transcend the conventional linear relationship between finance and environment and offer a deeper understanding of how financial variables influence CO₂ emissions per capita. The results from each methodological approach are integrated to form a set of conclusions. The results from the panel data econometric method show that economic scale is a significant determinant of growth's influence on CO₂ emissions per capita, which suggests that economic decoupling between growth and emissions is not complete within the OECD region. The results indicate a weakly negative relationship between population density and emissions per capita. The positive relationship between government effectiveness and emissions per capita can be interpreted as a measure of a country's economic development and industrialization, which contribute to a rise in CO₂ emissions. The results imply that although good institutional quality is a prerequisite, it is not a sufficient condition for reducing emissions per capita. First and foremost, the results highlight the importance of the role played by financial structure in the finance-environment relationship. This is particularly evident in the case of the bank-based deepening variable, private credit, for which a robust positive relationship with emissions is found, suggesting a scale effect in which the expansion of bank credit can support economic activity in activities with a greater environmental footprint in the absence of green allocation mechanisms. On the other hand, the negative relationship found with non-performing loans and emissions suggests a contraction effect in which financial stress can reduce economic activity and therefore its environmental footprint. A particularly interesting result concerns the relationship between long-term and market-based investors and emissions, for which pension fund assets, and particularly mutual fund assets, are found to exhibit a robust negative relationship with CO₂ emissions per capita. This is consistent with the notion that institutional investors can influence investment portfolios in activities with a smaller carbon footprint due to their long investment horizon and heightened awareness of climate change risks. Second, the results from the K-Means clustering analysis reveal a substantial amount of structural heterogeneity across countries and over time. The emergence of distinct structural regimes based on unique combinations of financial structure, institutional quality, and macro-demographic variables underlines the absence of a universal finance-environment relationship in which similar environmental outcomes are driven by different financial structures and in which similar financial structures drive different environmental outcomes depending on the institutional and economic context in which they operate. Third, the results from the Random Forest model further highlight the highly nonlinear nature of the finance-environment relationship and confirm the relative importance of structural effects compared to macroeconomic effects in driving the relationship with emissions. In particular, the variable importance plot reveals market-based systems, population density, government effectiveness, and pension fund assets as driving emissions more than GDP growth. Moreover, the excellent performance of the Random Forest model underlines the notion that linearity in the finance-environment relationship is an oversimplified assumption. Overall, these results indicate that reconciling financial development with climate objectives is not only about improving aggregate financial development or governance but also about the composition of finance, the incentives faced by different financial intermediaries, and the institutional underpinnings of finance. Thus, promoting sustainable finance frameworks that recognize the role of long-term institutional investors and channeling bank lending to low-carbon activities seem to be crucial in reconciling financial development with sustainability objectives. In this context, the integrated econometric and machine learning techniques used in this paper highlight the usefulness of causal methods, regime estimation methods, and nonlinear prediction methods in capturing the complex and heterogeneous drivers of the low-carbon transition.
References
- Doğan, B., Hossain, M. R., Khalfaoui, R., Nassani, A. A., & Ghosh, S. (2026). Navigating Chinese green deals through green investment, green technology, and green energy development: A race for sustainability or greenwashing? Financial Innovation, 12(1), 67. [CrossRef]
- Luo, K., Xue, J., Rassiah, P., & Lim, E. K. (2026). Smart accountability: Leveraging AI to align ESG disclosure with practice. International Journal of Accounting Information Systems, 57, 100773. [CrossRef]
- Li, W., Padmanabhan, P., & Huang, C.-H. (2026). Climate risk and asset-liability maturity mismatches. Global Finance Journal, 69, 101223. [CrossRef]
- Zhuang, J., Zhang, T., & He, J. (2026). Impact of shadow banking of nonfinancial firms on equity mispricing. Global Finance Journal, 69, 101236. [CrossRef]
- Cao, W., Shan, Y. G., & Yang, J. W. (2026). Asymmetric impact of compliance management reform on opportunistic insider trading: Evidence from Chinese state-owned enterprises. Emerging Markets Review, 72, 101438. [CrossRef]
- Jiang, J., Lu, X., Xie, L., Ye, R., & Cheng, P. (2026). The impact of managerial attention to digital transformation on stock price synchronicity from the dynamic capability perspective. Journal of International Accounting, Auditing and Taxation, 60, 100751. [CrossRef]
- Zambrano-Monserrate, M. A., Erum, N., & Bergougui, B. (2026). Asymmetric effects of industrial robots on energy intensity: The moderating role of macroeconomic factors. Journal of Economic Asymmetries, 33, e00449. [CrossRef]
- You, L., & Payne, J. (2026). The origins of ESG demand: Evidence from retail and institutional investor responses to environmental rankings. Review of Financial Economics, 44(2), e70039. [CrossRef]
- Yahya, F., & Lee, C.-C. (2026). Assessing the role of central banks in addressing financial sector carbon emissions. Research in International Business and Finance, 84, 103318. [CrossRef]
- Li, P., & Shahzad, U. (2026). Corporate biodiversity risk exposure in China: A system-based perspective from natural capital theory using machine and deep learning algorithms. Ecological Economics, 242, 108906. [CrossRef]
- Wei, Y., Cahan, S. F., & Chen, L. (2026). ESG expertise and analysts' roles in capital markets. International Review of Financial Analysis, 112, 105117. [CrossRef]
- Li, J., Kim, J. R., & Adegbite, E. (2026). The impact of green credit guidelines on green lending and environmental outcomes: Evidence from Chinese banks. Ecological Economics, 242, 108900. [CrossRef]
- Choudhary, P., & Thenmozhi, M. (2026). Does fintech drive sustainability? Insights from clean energy and global partnerships. Research in International Business and Finance, 84, 103330. [CrossRef]
- Chen, L., Zhang, K., & Duan, L. (2026). Media environmental coverage and corporate green innovation: A dual-mechanism test based on incurred regulatory pressure and institutional investors’ green attention. Finance Research Letters, 92, 109581. [CrossRef]
- Hubková, P., & Kud, H. (2026). ESMA’s sustainable finance soft law—Fuel for the green Capital Markets Union. Capital Markets Law Journal, 21(1), kmaf027. [CrossRef]
- Qin, L., Li, D., & Bo, W. (2026). Institutional shareholders’ geographical concentration, coordinated governance effects, and ESG rating disagreement. China Journal of Accounting Research, 19(1), 100462. [CrossRef]
- Wang, Y., Feng, X., Sun, G., & Xu, D. (2026). Impact of conglomerates on corporate green innovation in China. Journal of Innovation and Knowledge, 12, 100915. [CrossRef]
- Ding, B., Luo, S., & Zhou, G. (2026). Substance over form: A carbon performance examination on corporate ESG practices. International Review of Economics and Finance, 106, 104902. [CrossRef]
- Shahin, W., & Djoundourian, S. (2026). Climate change concerns in central banks policies: A commentary. Journal of Banking Regulation, 27(1), 1. [CrossRef]
- Bista, S., & Bishwakarma, S. (2026). Green finance for environmental sustainability in Nepal. International Journal of Empirical Economics, 5(1), 2550009. [CrossRef]
- Huang, J., Hsieh, S.-L., & Wang, J. (2026). Sustainability disclosure and bank liquidity risk: Evidence from global banking sector. North American Journal of Economics and Finance, 83, 102582. [CrossRef]
- Subhani, B. H., Ali, A., & Ali, F. (2026). Revisiting Pecking Order Theory in a green era: Financial development, climate uncertainty, and environmental investment. The Manchester School, 94(2), 145–167. [CrossRef]
- Wang, Z., & Wang, Q. (2026). Common ownership and corporate green innovation efficiency: Based on a two-stage value chain perspective. Asia Pacific Journal of Regional Science, 10(1), 8. [CrossRef]
- Zhang, J. (2026). Financial patience and technological ambition: How patient capital shapes corporate AI strategy. Finance Research Letters, 91, 109520. [CrossRef]
- Zhang, A., Zhao, Y., & Liu, B. (2026). Bank fintech and corporate environmental information disclosure: The role of financial mismatch. Economic Modelling, 156, 107479. [CrossRef]
- Xu, L., & Zhang, L. (2026). How digital capabilities affect tax planning: The internal information environment. Finance Research Letters, 92, 109540. [CrossRef]
- Sun, Q., Zhang, C., & Yao, Y. (2026). Patient capital and firm green low-carbon cycle innovation. Finance Research Letters, 91, 109439. [CrossRef]
- Gaba, N., & R., M. (2026). Do pressure-sensitive institutional investors moderate CSR decisions towards value creation of Indian firms? Journal of Financial Reporting and Accounting, 24(1), 344–365. [CrossRef]
- Chen, L., Fang, H., Xiong, J., & Yang, Z. (2026). Institutional investors' site visits and corporate greenwashing: Evidence from China. Journal of International Financial Management and Accounting, 37(1), 38–62. [CrossRef]
- Huang, X., Song, Y., Wu, H., & Lin, L. (2026). Can motivated funds mitigate ESG disagreement? Evidence from China. Finance Research Letters, 89, 109346. [CrossRef]
Figure 1.
A Triple-Method Empirical Framework for Analyzing the Drivers of CO₂ Emissions per Capita. Note. This figure illustrates the integrated research design combining panel data econometrics, machine learning clustering, and Random Forest regression to identify causal effects, heterogeneous regimes, and nonlinear predictive drivers of CO₂ emissions, linking financial structure, institutions, and macroeconomic conditions to policy-relevant insights.
Figure 2.
Selection and Interpretation of the K-Means Clustering Solution. Note. Panel A shows information criteria and within-cluster sum of squares guiding the choice of ten clusters. Panel B displays cluster assignments. Panel C reports standardized cluster means, highlighting heterogeneous financial, institutional, and macroeconomic regimes associated with different CO₂ emission profiles.
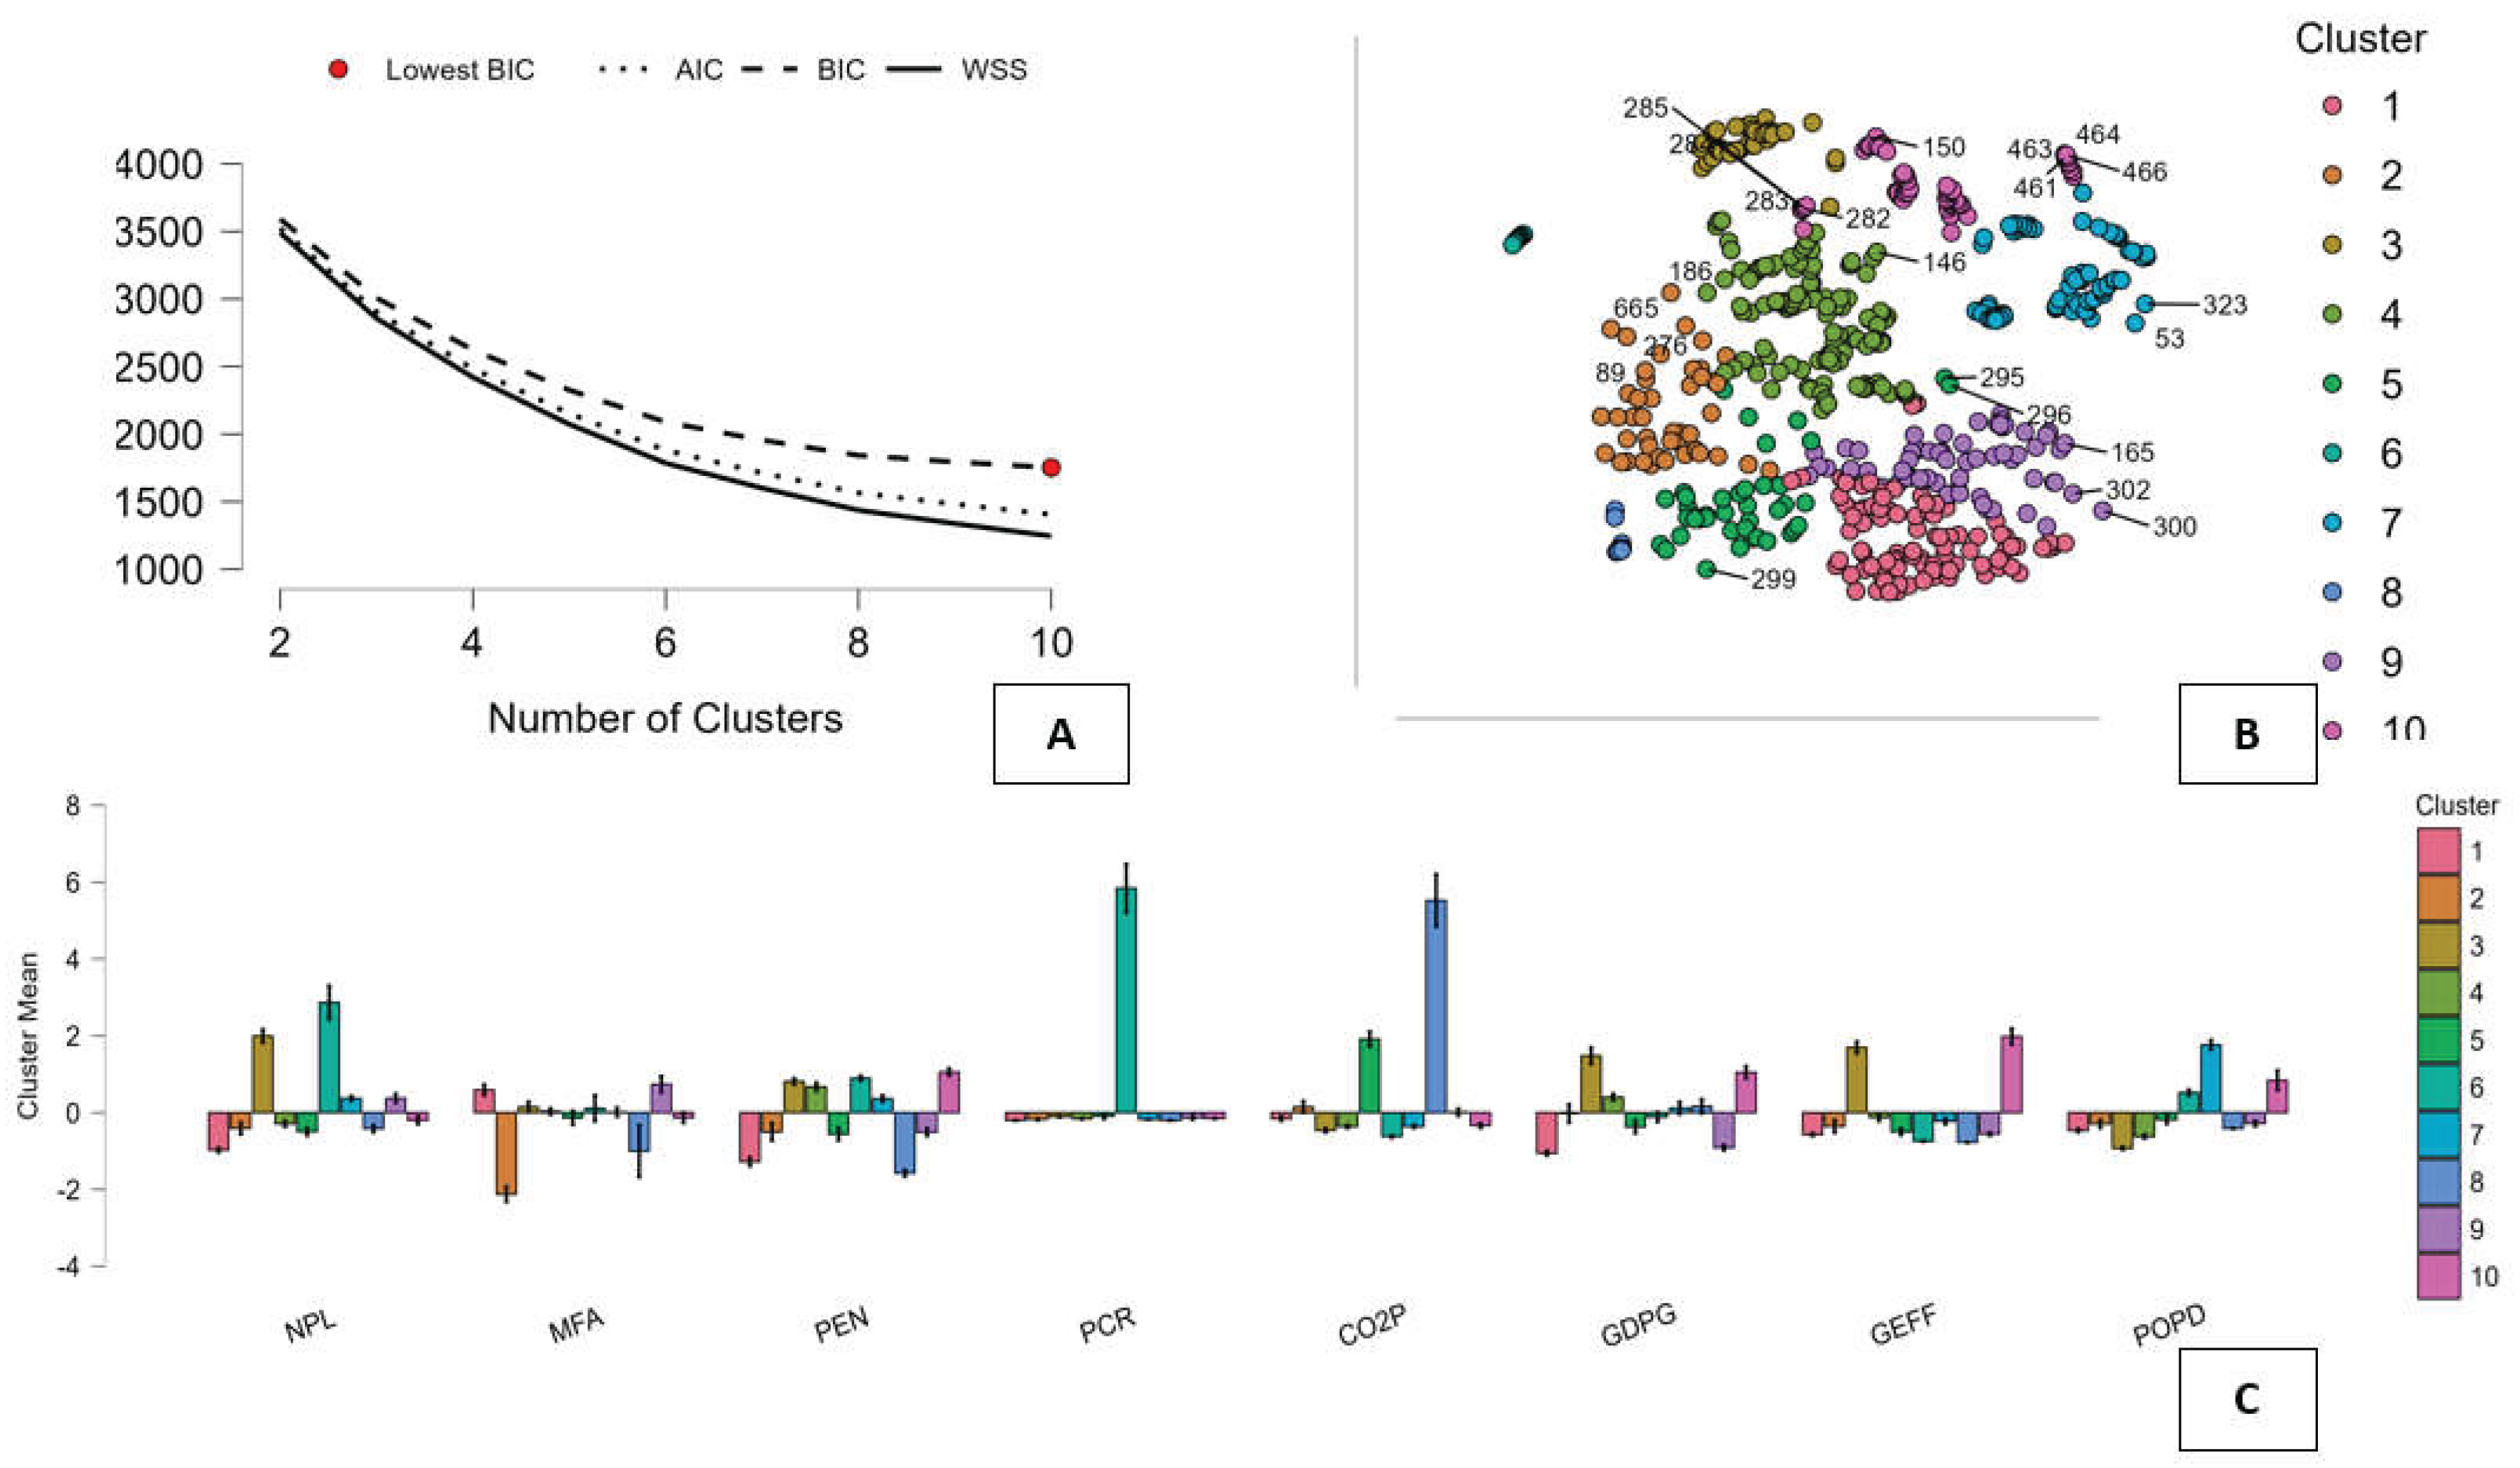
Figure 3.
Pairwise Relationships among Financial, Institutional, Macroeconomic Variables, and CO₂ Emissions by Cluster. Note. This figure presents a scatterplot matrix of standardized variables colored by K-Means clusters. It visualizes nonlinear relationships, overlapping regimes, and heterogeneous patterns, illustrating how different combinations of finance, institutions, and macroeconomic conditions are associated with distinct CO₂ emission profiles across countries.
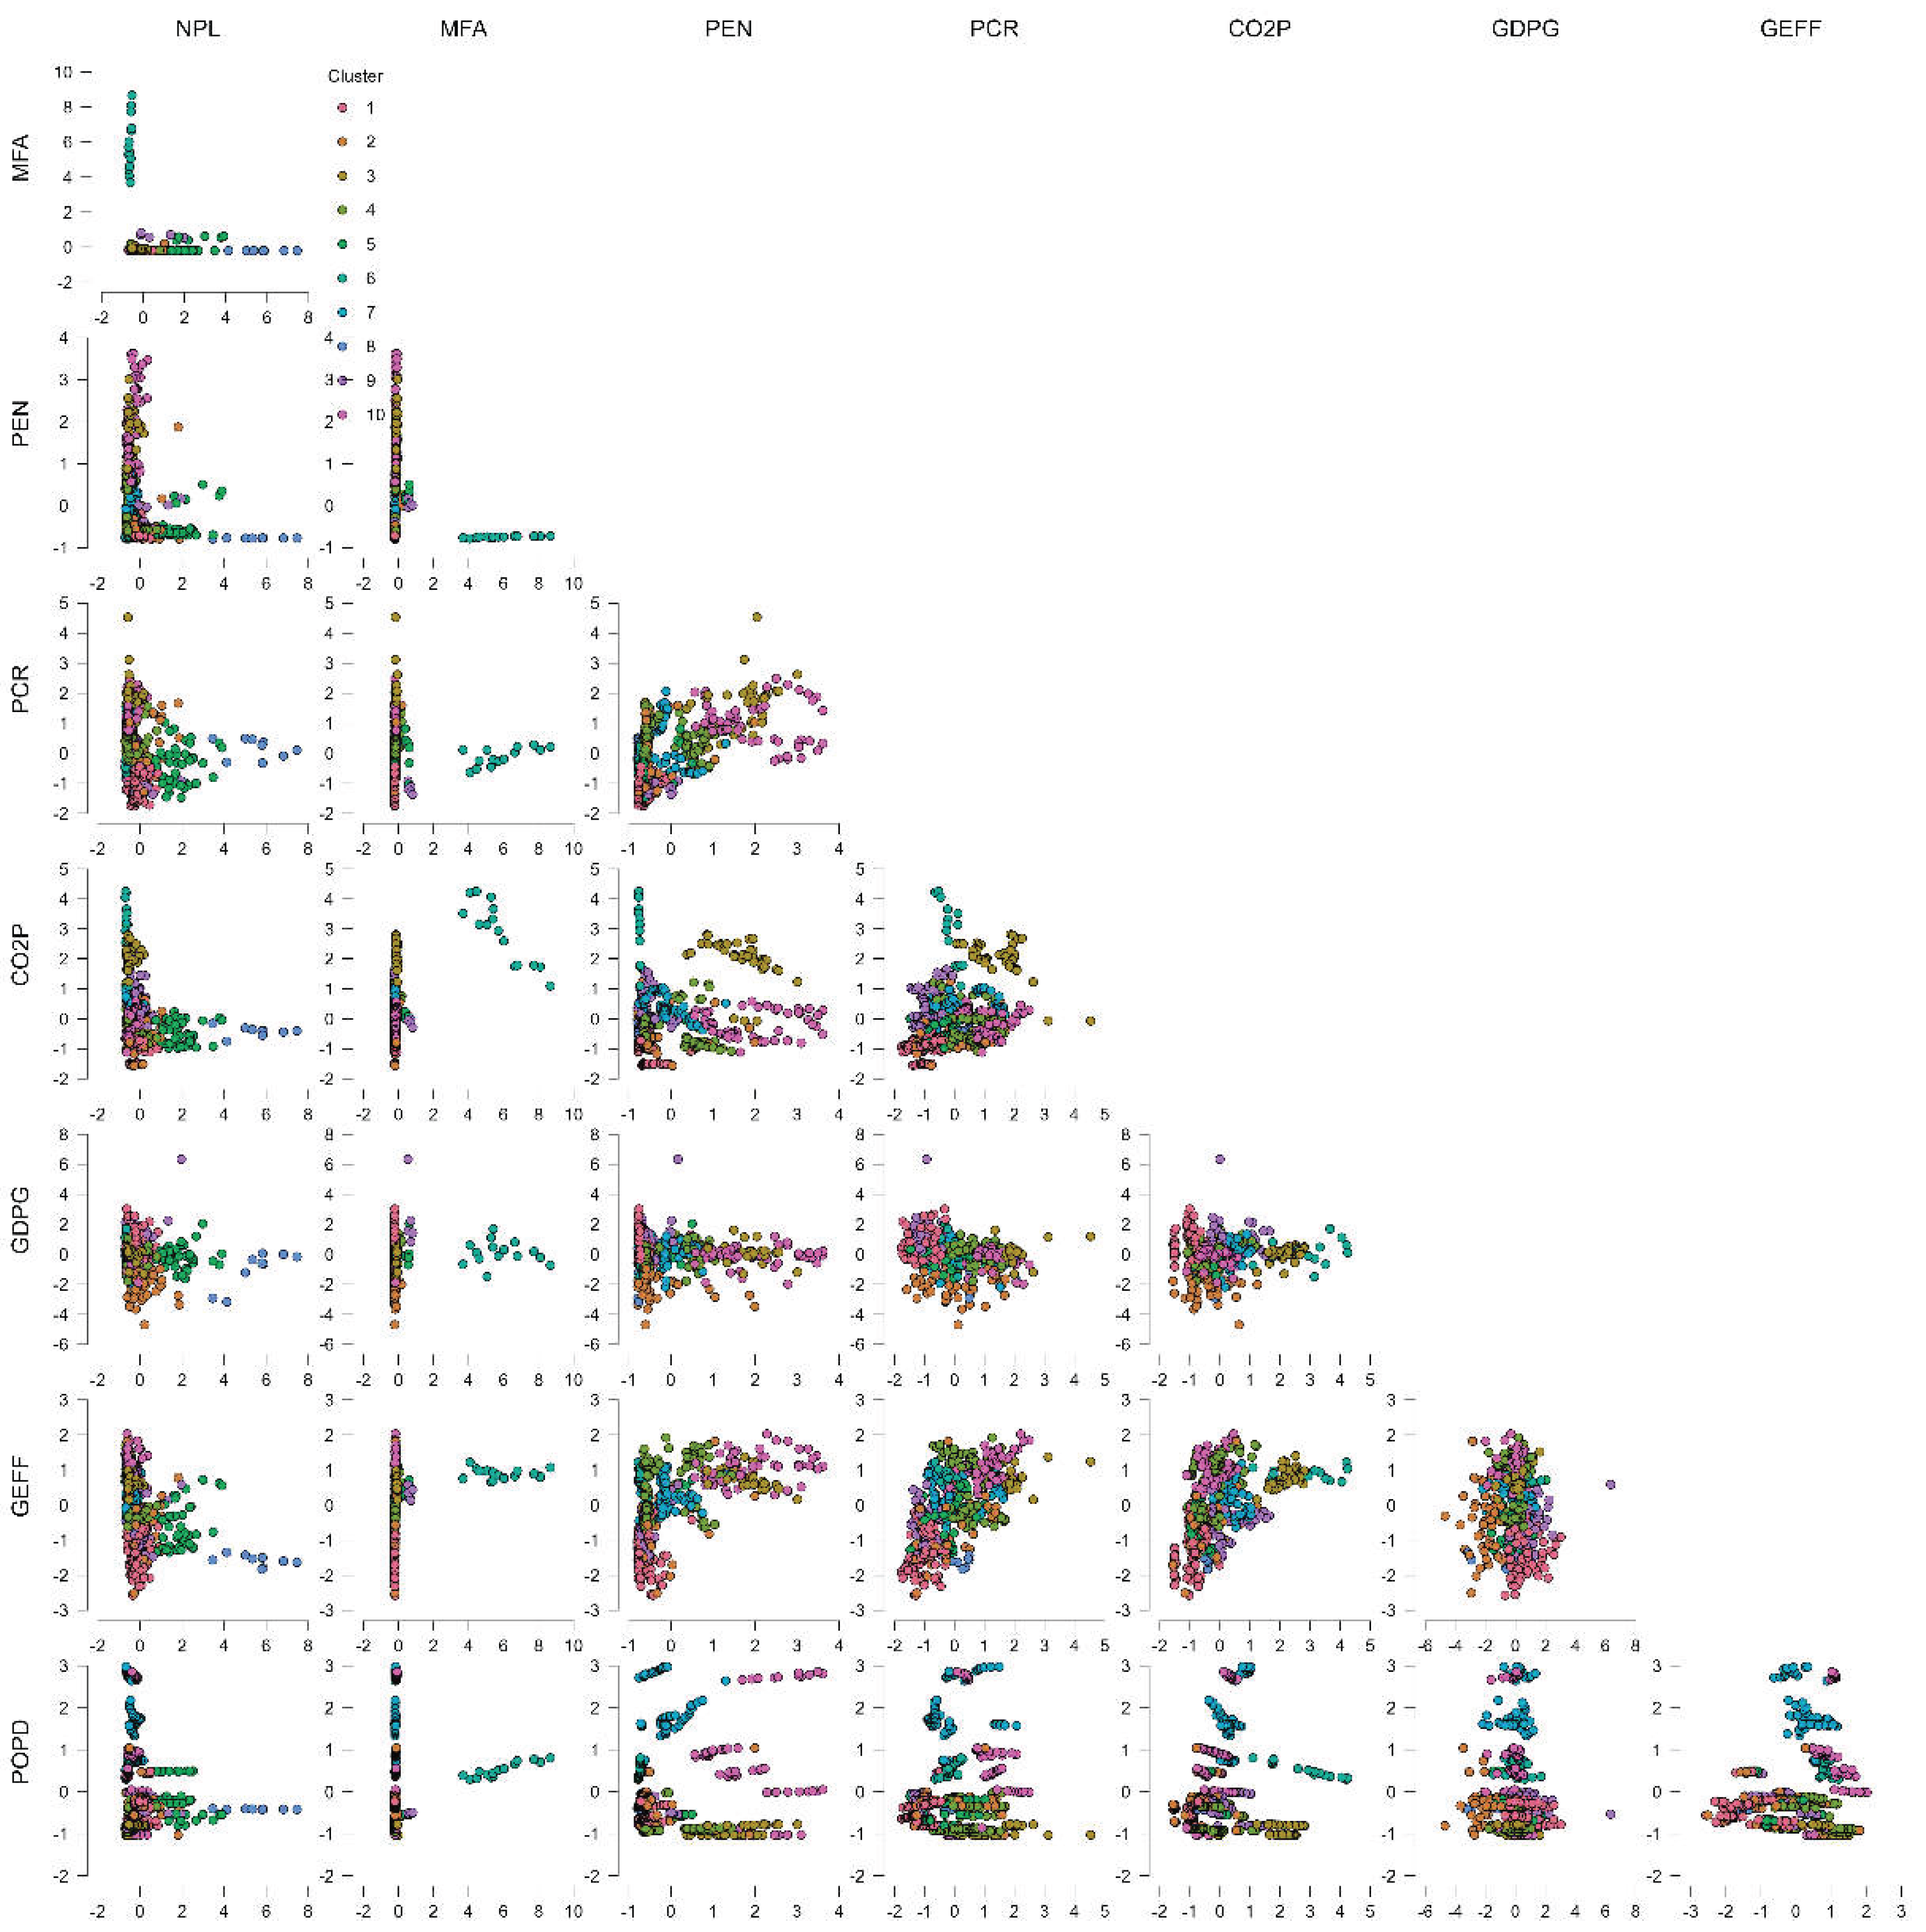
Figure 4.
Random Forest Predictive Performance and Variable Importance for CO₂ Emissions per Capita. Note. Panel A compares observed and predicted values, Panel B reports out-of-bag error convergence, and Panels C–D show variable importance rankings. The results confirm strong predictive accuracy and highlight the dominance of structural financial, institutional, and demographic drivers over short-run growth fluctuations.
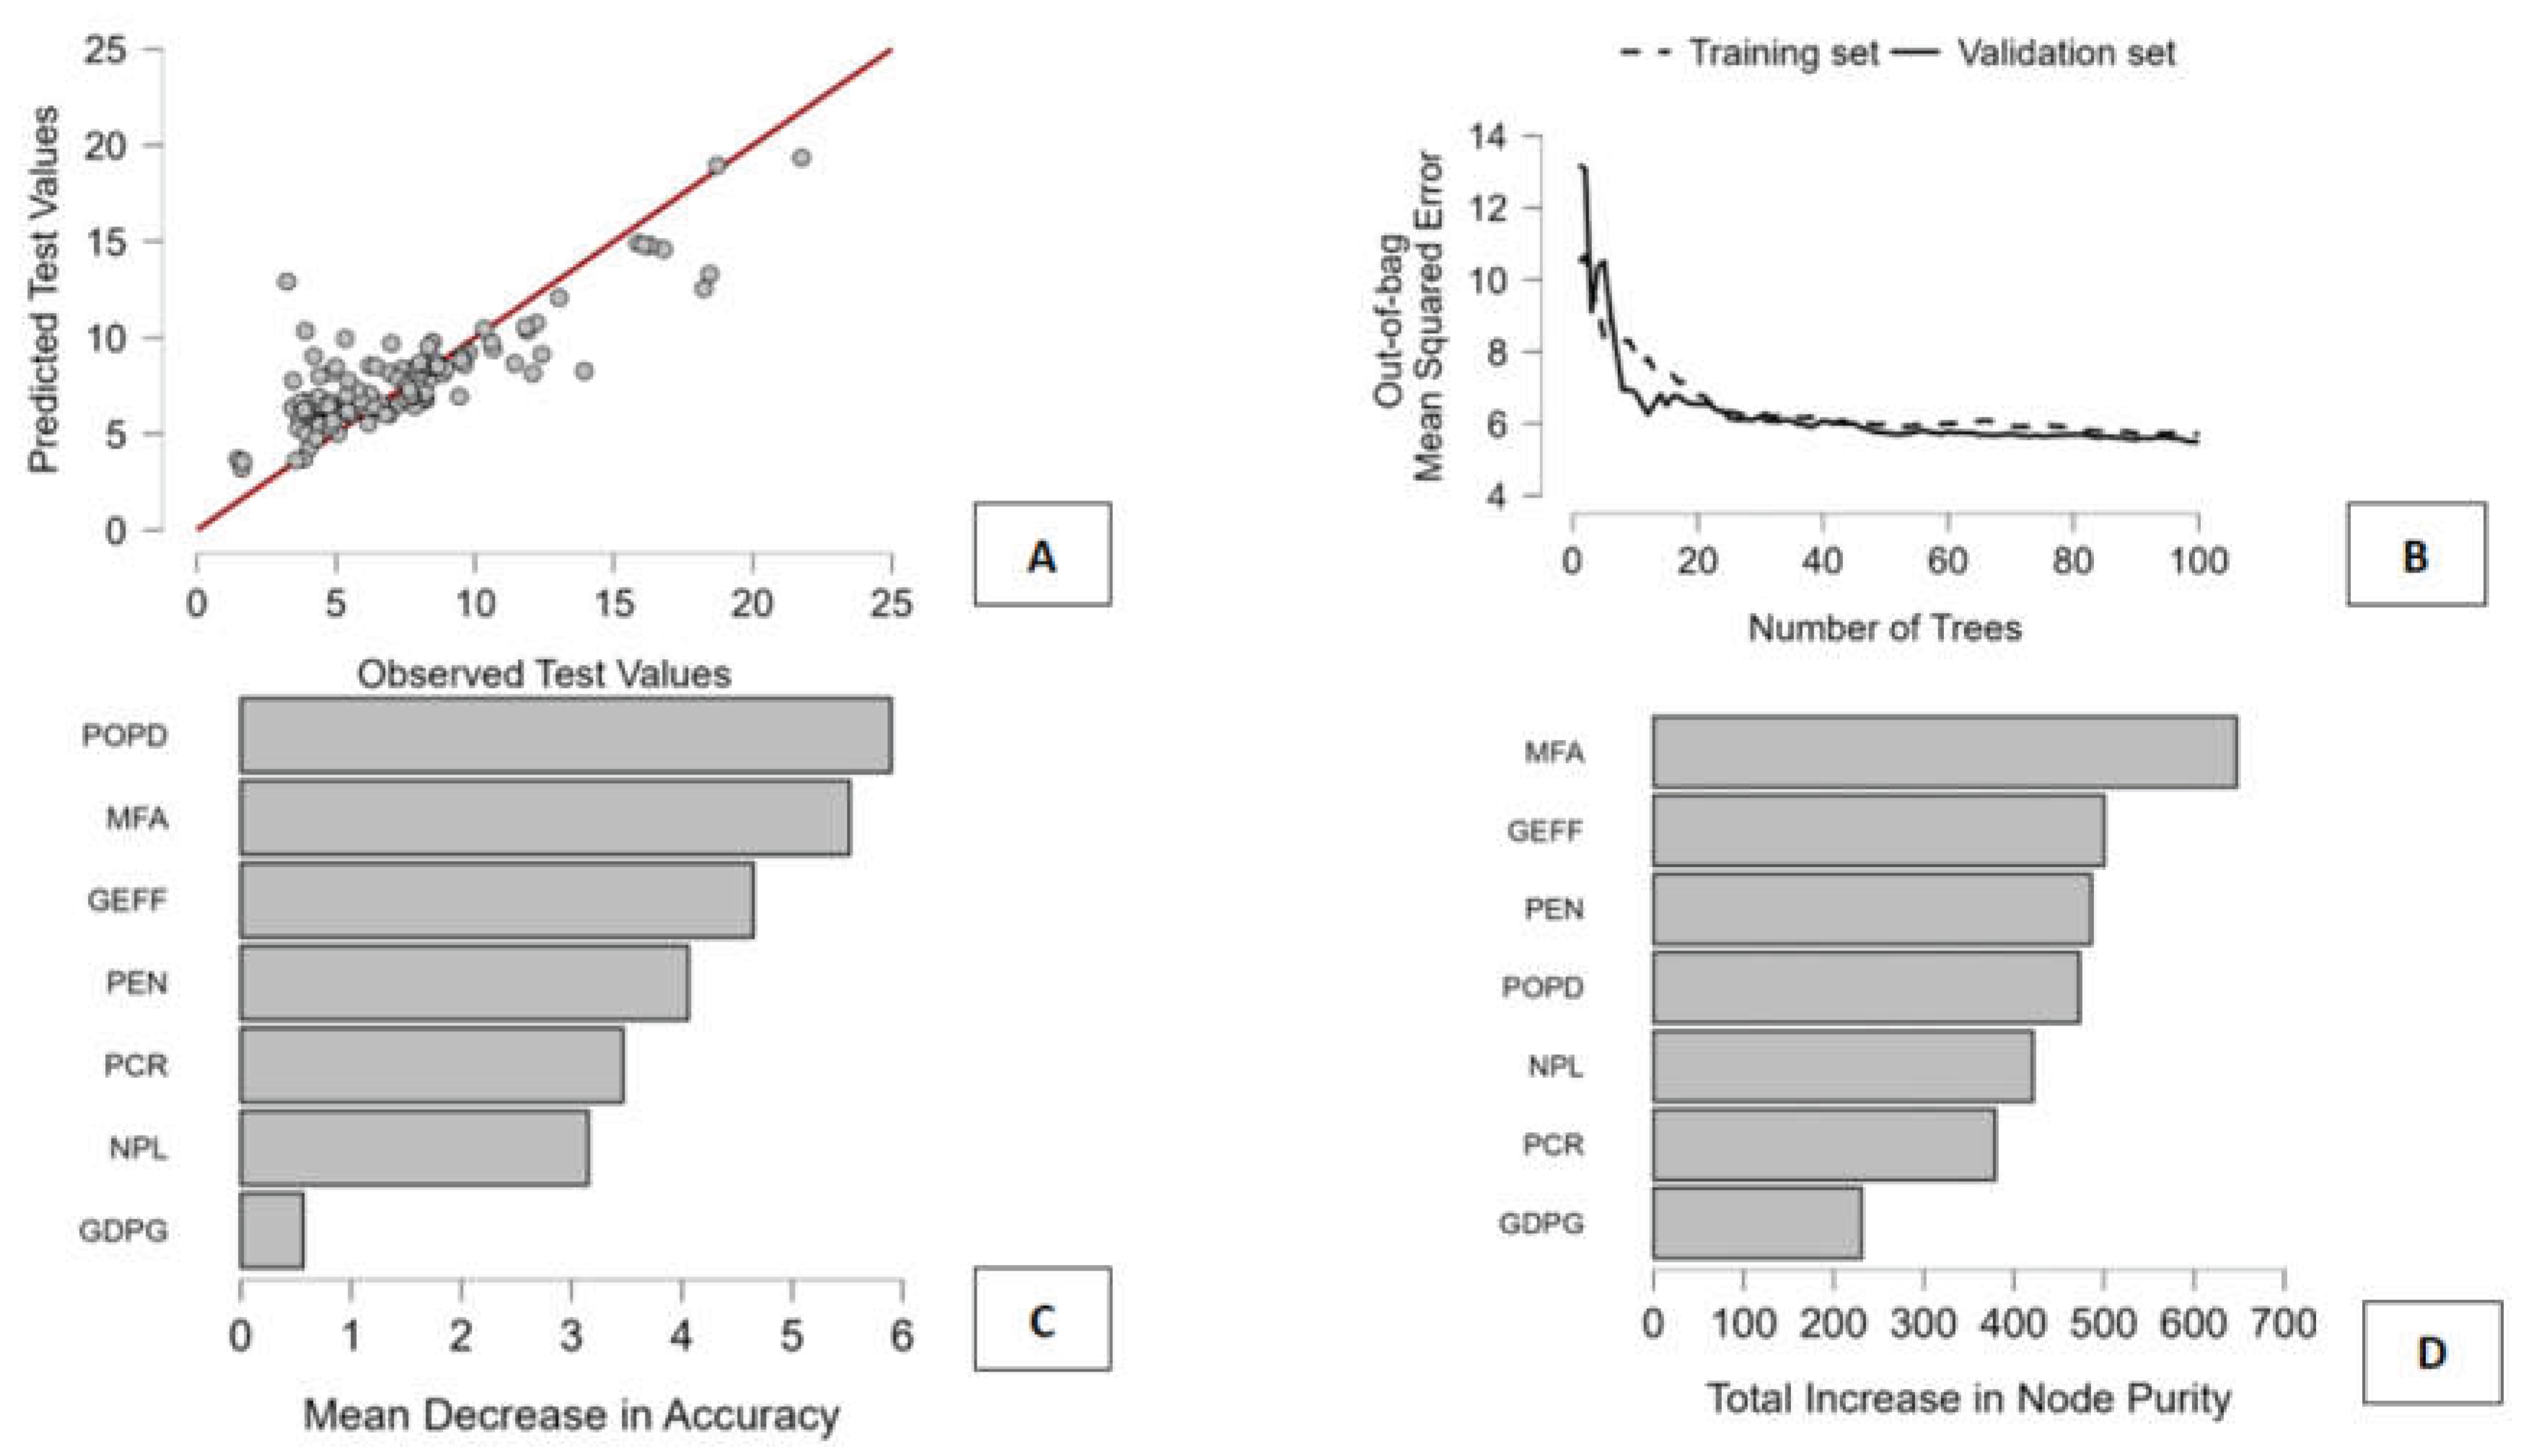

Table 1.
Recent Literature on the Finance–Environment Nexus: Themes, Methods, Findings, and Links to the Proposed Framework.
Table 1.
Recent Literature on the Finance–Environment Nexus: Themes, Methods, Findings, and Links to the Proposed Framework.
| Macro-theme | Key References (2026) | Main Methodologies | Core Findings | Link to Your Framework |
| 1. Greenwashing, ESG credibility, and information quality | Doğan et al.; Ding et al.; Chen et al. (site visits); Luo et al.; Zhang, A. et al.; Huang et al. (bank liquidity risk); Xu & Zhang; Jiang et al. | Panel regressions; difference-in-differences; text-based ESG measures; AI-based disclosure analysis; firm-level microdata; event studies | Evidence of gaps between ESG labels and real environmental performance; AI and fintech can improve alignment between disclosure and practice; better information environments reduce opacity and greenwashing; sustainability disclosure affects risk and market behavior | Supports your result that institutional quality (GEFF) and market-based finance (MFA) matter more than sheer financial depth; confirms need to go beyond headline indicators and focus on allocation mechanisms and information structures; consistent with ML evidence on nonlinear, regime-dependent effects |
| 2. Financial structure, capital allocation, and patient capital | Li, J. et al. (green credit); Choudhary & Thenmozhi; Subhani et al.; Wang & Wang (common ownership); Sun et al.; Zhang (patient capital & AI) | Bank-level and firm-level panel data; policy evaluation (quasi-natural experiments); structural models; innovation efficiency analysis | Green credit policies redirect lending and improve environmental outcomes; fintech supports clean energy investment; patient capital fosters low-carbon and strategic innovation; financial development affects environmental investment under climate uncertainty | Directly matches your panel results: bank credit (PCR) → scale effect and higher emissions unless guided; PEN and MFA → reallocation and stewardship channel → lower emissions; reinforces claim that composition of finance > size of finance |
| 3. Institutional investors, analysts, and ESG demand/disagreement | Wei et al.; You & Payne; Gaba & R.; Huang et al. (motivated funds); Qin et al. | Capital market microdata; analyst-level and fund-level regressions; investor behavior analysis; ESG rating disagreement models | ESG expertise shapes market outcomes; investor demand responds to rankings; pressure-sensitive and motivated funds influence CSR and reduce ESG disagreement; ownership structure affects governance and ESG assessments | Explains why MFA and PEN emerge as top predictors in your Random Forest; supports your clustering result that similar emissions arise under different financial regimes depending on investor governance and engagement |
| 4. Risk, stability, macro-financial channels, and regulation | Li, W. et al. (climate risk & ALM); Zhuang et al.; Cao et al.; Shahin & Djoundourian; Yahya & Lee; Hubková & Kud; Bista & Bishwakarma; Li & Shahzad | Macro-financial panel models; risk and balance-sheet analysis; legal-institutional analysis; machine learning (biodiversity risk); country case studies | Climate risk affects balance sheets and maturity mismatches; shadow banking distorts pricing; compliance reforms affect behavior; central banks and regulation matter for decarbonization; strong institutions alone are not sufficient; developing countries face structural constraints | Consistent with your negative NPL coefficient (contraction channel) and with the need to integrate climate into prudential and macro-financial policy; supports your regime-based view and ML evidence on heterogeneity and nonlinearity |
Note. This table synthesizes recent 2026 contributions, organizing them by macro-themes, methodologies, and findings, and relates each strand to our empirical framework, highlighting how financial structure, institutions, and information environments jointly shape heterogeneous and nonlinear emissions outcomes.
Table 2.
Variable Definitions for the Empirical Model.
| Acronym | Variable name | Description |
| CO2P | CO₂ emissions (per capita) | Measures carbon dioxide emissions per person and represents the environmental outcome of the model. It is a standard proxy for climate performance and environmental pressure, used to assess how financial-system characteristics affect sustainability. |
| GDPG | GDP growth | Annual growth rate of gross domestic product. It captures business-cycle conditions and economic expansion, which typically increase energy demand and emissions. Included as a macroeconomic control to disentangle growth effects from financial and institutional influences. |
| POPD | Population density | Population per unit of land area. It reflects urbanization and potential energy-efficiency scale effects. Higher density may imply more efficient infrastructure and transport systems, or alternatively greater environmental pressure in densely populated regions. |
| GEFF | Government Effectiveness | Index capturing the quality of public services, policy formulation, and implementation capacity. It reflects governance quality and the ability to enforce regulations, including environmental policies, thereby shaping how institutions influence environmental and sustainability outcomes. |
| PCR | Private credit by banks and other financial institutions to GDP | Ratio of private-sector credit to GDP, proxying financial and banking intermediation depth. It indicates how strongly the financial system supports real economic activity, with potential scale effects on production and the financing of green investments. |
| NPL | Non-performing loans to gross loans | Share of impaired loans in total lending, measuring credit quality and banking-sector stability. Higher values signal financial stress and tighter credit conditions, which can constrain investment and indirectly affect economic activity and emissions dynamics. |
| PEN | Pension fund assets to GDP | Assets of pension funds relative to GDP, proxying long-term institutional investors. It reflects the capacity of the financial system to provide long-horizon capital, often associated with sustainable investment strategies and financing of green and low-carbon projects. |
| MFA | Mutual fund assets to GDP | Assets of mutual funds relative to GDP, capturing market-based financial intermediation. It reflects the role of institutional investors in reallocating capital across sectors, potentially supporting investment in cleaner technologies and lower-carbon economic activities. |
Note. Data are drawn from the World Bank Global Financial Development and Sovereign ESG databases for 2004–2021, covering 38 OECD countries1, and include harmonized measures of emissions, macroeconomic conditions, governance quality, banking intermediation, and institutional investors.
Table 3.
Descriptive Statistics of Financial, Institutional, Macroeconomic, and Environmental Variables.
Table 3.
Descriptive Statistics of Financial, Institutional, Macroeconomic, and Environmental Variables.
| Statistic | NPL | MFA | PEN | PCR | CO2P | GDPG | GEFF | POPD |
| Valid | 615 | 626 | 632 | 661 | 646 | 684 | 684 | 684 |
| Missing | 69 | 58 | 52 | 23 | 38 | 0 | 0 | 0 |
| Mode | 0.8 | 0.255 | 0.011 | 14.768 | 1.363 | -16.04 | -0.344 | 2.595 |
| Median | 2.429 | 21.156 | 12.624 | 89.285 | 7.331 | 2.473 | 1.296 | 100.308 |
| Mean | 3.908 | 199.92 | 38.774 | 95.807 | 7.871 | 2.325 | 1.193 | 133.25 |
| Std. Error of Mean | 0.22 | 38.162 | 1.901 | 1.803 | 0.165 | 0.142 | 0.023 | 5.058 |
| 95% CI Mean Upper | 4.339 | 274.861 | 42.507 | 99.348 | 8.196 | 2.604 | 1.238 | 143.181 |
| 95% CI Mean Lower | 3.476 | 124.98 | 35.041 | 92.266 | 7.546 | 2.046 | 1.148 | 123.319 |
| Std. Deviation | 5.454 | 954.803 | 47.788 | 46.366 | 4.203 | 3.717 | 0.6 | 132.287 |
| MAD | 1.467 | 16.455 | 10.126 | 35.721 | 2.274 | 1.51 | 0.433 | 68.822 |
| MAD robust | 2.176 | 24.397 | 15.012 | 52.96 | 3.371 | 2.239 | 0.643 | 102.036 |
| IQR | 3.096 | 40.464 | 52.723 | 72.867 | 4.637 | 2.98 | 0.885 | 159.433 |
| Variance | 29.751 | 911649.474 | 2283.723 | 2149.801 | 17.664 | 13.82 | 0.36 | 17499.735 |
| Skewness | 3.846 | 6.19 | 1.436 | 0.573 | 1.238 | -0.535 | -0.48 | 1.452 |
| Kurtosis | 18.769 | 38.735 | 0.965 | -0.092 | 1.877 | 4.769 | -0.657 | 1.411 |
| Minimum | 0.1 | 0.255 | 0.011 | 14.768 | 1.363 | -16.04 | -0.344 | 2.595 |
| Maximum | 45.572 | 8330.594 | 196.574 | 304.575 | 25.61 | 24.616 | 2.347 | 531.109 |
| 25th percentile | 1.069 | 6.752 | 6.557 | 56.801 | 4.793 | 1.096 | 0.792 | 32.227 |
| 50th percentile | 2.429 | 21.156 | 12.624 | 89.285 | 7.331 | 2.473 | 1.296 | 100.308 |
| 75th percentile | 4.165 | 47.216 | 59.28 | 129.668 | 9.43 | 4.077 | 1.676 | 191.66 |
| Sum | 2403.126 | 125150.011 | 24505.302 | 63328.642 | 5084.675 | 1590.479 | 816.239 | 91142.995 |
Note. This table reports descriptive statistics for all variables used in the analysis. The distributions display substantial heterogeneity, skewness, and kurtosis, motivating the use of robust econometric methods and machine learning techniques capable of handling non-normality and cross-country structural differences.
Table 4.
Financial Intermediation, Governance, and CO₂ Emissions: Random-Effects and Fixed-Effects Estimates (HAC Robust Standard Errors).
Table 4.
Financial Intermediation, Governance, and CO₂ Emissions: Random-Effects and Fixed-Effects Estimates (HAC Robust Standard Errors).
| Dependent Variable | CO2P | |
| Item | Random-effects (GLS), HAC | Fixed-effects, HAC |
| const (coef, se, stat, p) | 8.68736 | 1.78381 | z=4.870 | <0.0001 *** | 9.78734 | 1.79124 | t=5.464 | <0.0001 *** |
| GDPG | 0.0614398 | 0.0172770 | z=3.556 | 0.0004 *** | 0.0603135 | 0.0171419 | t=3.518 | 0.0012 *** |
| POPD | -0.0163858 | 0.00844238 | z=-1.941 | 0.0523 * | -0.0232104 | 0.0121850 | t=-1.905 | 0.0646 * |
| GEFF | 1.40264 | 0.507920 | z=2.762 | 0.0058 *** | 1.30145 | 0.523329 | t=2.487 | 0.0175 ** |
| PCR | 0.0107346 | 0.00347631 | z=3.088 | 0.0020 *** | 0.0107031 | 0.00346818 | t=3.086 | 0.0038 *** |
| NPL | -0.0501152 | 0.0143777 | z=-3.486 | 0.0005 *** | -0.0504499 | 0.0145634 | t=-3.464 | 0.0014 *** |
| PEN | -0.0201460 | 0.00622089 | z=-3.238 | 0.0012 *** | -0.0193218 | 0.00668940 | t=-2.888 | 0.0064 *** |
| MFA | -0.00251304 | 0.000169108 | z=-14.86 | <0.0001 *** | -0.00249123 | 0.000222920 | t=-11.18 | <0.0001 *** |
| Mean dependent var | 7.886086 | 7.886086 |
| S.D. dependent var | 4.171004 | 4.171004 |
| Sum squared resid | 20246.56 | 373.6697 |
| S.E. of regression | 6.023634 | 0.847700 |
| Log-likelihood | -1812.744 | -684.8997 |
| Akaike criterion | 3641.487 | 1459.799 |
| Schwarz criterion | 3676.182 | 1654.956 |
| Hannan-Quinn | 3655.029 | 1535.973 |
| rho | 0.708864 | 0.708864 |
| Durbin-Watson | 0.577562 | 0.577562 |
| Between variance | 42.4398 | — |
| Within variance | 0.661362 | — |
| mean theta | 0.966532 | — |
| Joint test on regressors | Chi-square(7)=4376.96 | p=0 | F(7,37)=607.56 | p=3.5189e-36 |
| Breusch-Pagan test | Chi-square(1)=2715.73 | p=0 | — |
| Hausman test | Chi-square(7)=2386.31 | p=0 | — |
| Normality of residuals | Chi-square(2)=496.657 | p=1.42037e-108 | Chi-square(2)=390.268 | p=1.79619e-85 |
| Wooldridge autocorrelation | F(1,37)=71.0472 | p=3.89221e-10 | — |
| Pesaran CD | z=12.1147 | p=8.8336e-34 | z=11.0076 | p=3.51049e-28 |
| Different group intercepts | — | Welch F(37,161.3)=204.464 | p=2.19168e-117 |
| Heteroskedasticity (Wald) | — | Chi-square(38)=8421.34 | p=0 |
Note: The dependent variable is CO2P (CO₂ emissions per capita). Both specifications are estimated using random-effects (GLS) and fixed-effects models with HAC (heteroskedasticity and autocorrelation consistent) robust standard errors, which are robust to heteroskedasticity and serial correlation in the error terms. Reported coefficients are followed by robust standard errors, test statistics, and p-values. Statistical significance is denoted by *** p < 0.01, ** p < 0.05, * p < 0.10. The Hausman test rejects the consistency of the random-effects estimator, supporting the fixed-effects specification as the preferred model. Diagnostic tests for cross-sectional dependence, autocorrelation, and heteroskedasticity are reported at the bottom of the table.
Table 5.
Comparison of Clustering Algorithms Based on Internal Validity and Distribution Criteria.
| Statistics | Density Based | Fuzzy C-Means | Hierarchical | Model Based | K-Means | Random Forest |
| Maximum diameter | 0.815 | 0.688 | 0.000 | 1.000 | 0.108 | 1.000 |
| Minimum separation | 0.944 | 0.000 | 1.000 | 0.124 | 0.116 | 0.256 |
| Pearson's γ | 0.987 | 0.000 | 1.000 | 0.192 | 0.457 | 0.125 |
| Dunn index | 0.624 | 0.000 | 1.000 | 0.073 | 0.110 | 0.152 |
| Entropy | 0.000 | 0.827 | 0.233 | 1.000 | 0.976 | 0.951 |
| Calinski-Harabasz index | 0.000 | 0.056 | 0.069 | 0.401 | 1.000 | 0.491 |
| HH Index | 1.000 | 0.084 | 0.701 | 0.000 | 0.010 | 0.015 |
Note. This table compares alternative clustering methods using compactness, separation, entropy, and concentration metrics. K-Means emerges as the best compromise solution, combining high between-cluster variance, acceptable separation, and balanced cluster sizes without extreme trade-offs across competing validation criteria.
Table 6.
K-Means Cluster Profiles: Financial Structure, Institutions, Macroeconomic Conditions, and CO₂ Emissions.
Table 6.
K-Means Cluster Profiles: Financial Structure, Institutions, Macroeconomic Conditions, and CO₂ Emissions.
| Cluster | 1 | 2 | 3 | 4 | 5 | 6 | 7 | 8 | 9 | 10 |
| Size | 96 | 44 | 42 | 118 | 41 | 15 | 83 | 9 | 63 | 54 |
| Explained proportion within-cluster heterogeneity | 0.113 | 0.125 | 0.062 | 0.175 | 0.074 | 0.045 | 0.137 | 0.020 | 0.102 | 0.145 |
| Within sum of squares | 141.216 | 155.810 | 77.345 | 217.650 | 92.282 | 55.983 | 170.992 | 25.470 | 127.570 | 180.894 |
| Silhouette score | 0.282 | 0.139 | 0.509 | 0.289 | 0.233 | 0.632 | 0.324 | 0.495 | 0.214 | 0.189 |
| Center NPL | -0.158 | 0.147 | -0.463 | -0.364 | 1.914 | -0.624 | -0.364 | 5.523 | 0.011 | -0.337 |
| Center MFA | -0.203 | -0.175 | -0.107 | -0.160 | -0.094 | 5.841 | -0.177 | -0.205 | -0.133 | -0.153 |
| Center PEN | -0.574 | -0.358 | 1.695 | -0.125 | -0.499 | -0.747 | -0.225 | -0.774 | -0.556 | 1.978 |
| Center PCR | -1.058 | -0.023 | 1.480 | 0.399 | -0.373 | -0.114 | 0.119 | 0.164 | -0.912 | 1.045 |
| Center CO2P | -0.975 | -0.410 | 1.993 | -0.291 | -0.498 | 2.866 | 0.370 | -0.416 | 0.372 | -0.199 |
| Center GDPG | 0.589 | -2.127 | 0.148 | 0.030 | -0.137 | 0.113 | 0.013 | -1.002 | 0.735 | -0.132 |
| Center GEFF | -1.278 | -0.503 | 0.814 | 0.673 | -0.562 | 0.896 | 0.363 | -1.575 | -0.509 | 1.055 |
| Center POPD | -0.466 | -0.293 | -0.932 | -0.623 | -0.184 | 0.520 | 1.761 | -0.414 | -0.281 | 0.838 |
Note. This table reports cluster sizes, validation metrics, and standardized centers for each variable. The results identify distinct regimes combining financial structure, institutional quality, and macroeconomic conditions, associated with systematically different CO₂ emissions per capita across the sample.
Table 7.
Standardized Cluster Centers for Financial, Institutional, and Macroeconomic Variables and CO₂ Emissions.
Table 7.
Standardized Cluster Centers for Financial, Institutional, and Macroeconomic Variables and CO₂ Emissions.
| Cluster | NPL | MFA | PEN | PCR | CO2P | GDPG | GEFF | POPD |
| 1 | -0.975 | 0.589 | -1.278 | -0.203 | -0.158 | -1.058 | -0.574 | -0.466 |
| 2 | -0.410 | -2.127 | -0.503 | -0.175 | 0.147 | -0.023 | -0.358 | -0.293 |
| 3 | 1.993 | 0.148 | 0.814 | -0.107 | -0.463 | 1.480 | 1.695 | -0.932 |
| 4 | -0.291 | 0.030 | 0.673 | -0.160 | -0.364 | 0.399 | -0.125 | -0.623 |
| 5 | -0.498 | -0.137 | -0.562 | -0.094 | 1.914 | -0.373 | -0.499 | -0.184 |
| 6 | 2.866 | 0.113 | 0.896 | 5.841 | -0.624 | -0.114 | -0.747 | 0.520 |
| 7 | 0.370 | 0.013 | 0.363 | -0.177 | -0.364 | 0.119 | -0.225 | 1.761 |
| 8 | -0.416 | -1.002 | -1.575 | -0.205 | 5.523 | 0.164 | -0.774 | -0.414 |
| 9 | 0.372 | 0.735 | -0.509 | -0.133 | 0.011 | -0.912 | -0.556 | -0.281 |
| 10 | -0.199 | -0.132 | 1.055 | -0.153 | -0.337 | 1.045 | 1.978 | 0.838 |
Note. This table reports standardized means for each variable by cluster. The profiles highlight strong regime heterogeneity, showing that similar emission levels arise under different financial structures and that financial variables exert cluster-specific, nonlinear effects on CO₂ emissions across countries.
Table 8.
Comparison of Predictive Models Based on Error Metrics and Explanatory Power.
| Statistics | Boosting | Decision Tree | KNN | Linear Reg | Neural Net | Random Forest | LASSO | SVM |
| MSE | 0.489 | 0.253 | 0.000 | 1.000 | 0.878 | 0.089 | 0.959 | 0.956 |
| MSE (scaled) | 0.181 | 0.227 | 0.088 | 0.945 | 1.000 | 0.000 | 0.553 | 0.890 |
| RMSE | 0.563 | 0.319 | 0.000 | 1.000 | 0.904 | 0.121 | 0.968 | 0.966 |
| MAE / MAD | 0.627 | 0.209 | 0.000 | 0.867 | 1.000 | 0.153 | 0.958 | 0.772 |
| MAPE | 0.666 | 0.010 | 0.000 | 0.800 | 1.000 | 0.055 | 0.620 | 0.604 |
| R² | 0.778 | 0.723 | 0.890 | 0.041 | 0.000 | 1.000 | 0.375 | 0.083 |
Note. This table compares alternative predictive models using multiple error measures and R². Random Forest achieves the best overall trade-off, combining low prediction errors with superior explanatory power, while linear, regularized, and other machine learning models show lower flexibility in capturing nonlinear relationships.
Table 9.
Variable Importance in the Random Forest Model for CO₂ Emissions per Capita.
| Variables | Mean decrease in accuracy | Total increase in node purity | Mean dropout loss |
| MFA | 5.521 | 647.302 | 2.564 |
| GEFF | 4.648 | 500.293 | 2.428 |
| PEN | 4.058 | 485.833 | 2.302 |
| POPD | 5.896 | 472.802 | 2.524 |
| NPL | 3.150 | 421.255 | 2.227 |
| PCR | 3.466 | 379.314 | 2.206 |
| GDPG | 0.565 | 231.126 | 1.870 |
Note. This table reports variable importance using three complementary metrics. Results show that market-based finance, institutions, and demographics dominate explanatory power, while GDP growth plays a limited role, supporting the view that structural factors matter more than short-run macroeconomic fluctuations.
Table 10.
Decomposition of Random Forest Predictions into Baseline and Variable Contributions.
| Case | Predicted | Base | NPL | MFA | PEN | PCR | GDPG | GEFF | POPD |
| 1 | 13.307 | 8.073 | 1.190 | 1.206 | 0.735 | 0.003 | 0.230 | 0.690 | 1.182 |
| 2 | 12.538 | 8.073 | 0.186 | 0.731 | 1.067 | 0.155 | 0.207 | 1.051 | 1.068 |
| 3 | 14.583 | 8.073 | 0.709 | 1.194 | 1.417 | 0.341 | 0.539 | 1.179 | 1.131 |
| 4 | 14.785 | 8.073 | 0.579 | 1.277 | 1.348 | 0.400 | 0.917 | 1.044 | 1.147 |
| 5 | 14.796 | 8.073 | 0.655 | 1.222 | 1.549 | 0.498 | 0.477 | 1.004 | 1.319 |
Note. This table decomposes predicted CO₂ emissions into a baseline and marginal contributions of each variable for representative cases. Results show cumulative effects of financial structure, institutions, and demographics, highlighting nonlinear but transparent predictions driven mainly by structural factors rather than short-run macroeconomic fluctuations.
Table 11.
Summary of Methods, Key Findings, and Contributions to the Finance–Environment Nexus.
| Methodology | Key Results | Discussion and Interpretation | Innovativeness and Originality |
| Panel Data Econometrics | GDP growth is positively associated with CO2P; population density shows a weakly negative effect; private credit (PCR) increases emissions; non-performing loans (NPL) reduce emissions; pension fund assets (PEN) and mutual fund assets (MFA) have significant negative effects on CO2P; government effectiveness (GEFF) is positively correlated with emissions. | These results indicate a persistent scale effect of economic growth on emissions. The positive role of PCR suggests that bank-based financial deepening tends to expand carbon-intensive activity, while the negative effect of NPL reflects a contraction channel through financial stress. The negative coefficients for PEN and MFA highlight the role of long-term and market-based investors in reallocating capital toward less carbon-intensive activities. The positive coefficient on GEFF likely captures the higher level of development and industrial intensity of more institutionally advanced economies. Overall, the panel estimates identify average causal directions while controlling for unobserved heterogeneity. | The originality lies in jointly modeling bank-based finance, market-based finance, and institutional quality within a unified panel framework focused on environmental outcomes, going beyond the standard finance–growth or environment–growth literature and providing a more granular decomposition of financial channels affecting emissions. |
| Machine Learning Clustering (K-Means) | Identification of distinct regimes with heterogeneous combinations of financial structure, institutional quality, and macroeconomic conditions; presence of both high- and low-emission clusters with different financial profiles; relatively balanced cluster sizes; clear differentiation of CO2P across regimes. | The clustering reveals strong structural heterogeneity in the finance–environment nexus. High emissions can arise under different financial configurations, while low-emission regimes are associated with diverse mixes of financial depth, institutional quality, and demographic structure. This shows that average relationships mask important regime-specific dynamics and that the impact of finance on emissions is context-dependent. | The innovative contribution consists in using unsupervised machine learning to uncover latent, data-driven regimes in the finance–environment relationship, moving beyond ad hoc country groupings and enabling a regime-based interpretation of environmental performance. |
| Machine Learning Regression (Random Forest) | Best predictive performance among all algorithms; highest R² and lowest error metrics; most important predictors are POPD and MFA, followed by GEFF and PEN; GDP growth has low relative importance; strong evidence of nonlinearities and interactions. | These results show that emissions are driven primarily by structural financial, institutional, and demographic factors rather than by short-term growth dynamics. The prominence of MFA and POPD underscores the role of capital allocation mechanisms and spatial structure, while the model’s performance confirms the presence of complex nonlinear relationships. | The originality lies in complementing causal panel estimates with a high-performing nonlinear predictive model, providing variable importance rankings and case-level decompositions that offer a novel, interpretable bridge between prediction and economic explanation in the climate–finance literature. |
Note. This table synthesizes results from panel econometrics, clustering, and Random Forest models, highlighting how financial structure, institutions, and demographics shape emissions through heterogeneous and nonlinear channels, and showing that policy-relevant insights emerge only by combining causal, regime-based, and predictive perspectives.
| 1 | Countries are: Australia, Austria, Belgium, Canada, Chile, Colombia, Costa Rica, Czech Republic, Denmark, Estonia, Finland, France, Germany, Greece, Hungary, Iceland, Ireland, Israel, Italy, Japan, Korea, Rep., Latvia, Lithuania, Luxembourg, Mexico, Netherlands, New Zealand, Norway, Poland, Portugal, Slovak Republic, Slovenia, Spain, Sweden, Switzerland, Turkey, United Kingdom, United States. |
Disclaimer/Publisher’s Note: The statements, opinions and data contained in all publications are solely those of the individual author(s) and contributor(s) and not of MDPI and/or the editor(s). MDPI and/or the editor(s) disclaim responsibility for any injury to people or property resulting from any ideas, methods, instructions or products referred to in the content. |
© 2026 by the authors. Licensee MDPI, Basel, Switzerland. This article is an open access article distributed under the terms and conditions of the Creative Commons Attribution (CC BY) license (http://creativecommons.org/licenses/by/4.0/).
Copyright: This open access article is published under a Creative Commons CC BY 4.0 license, which permit the free download, distribution, and reuse, provided that the author and preprint are cited in any reuse.


