
Submitted:
16 February 2026
Posted:
28 February 2026
You are already at the latest version
Abstract
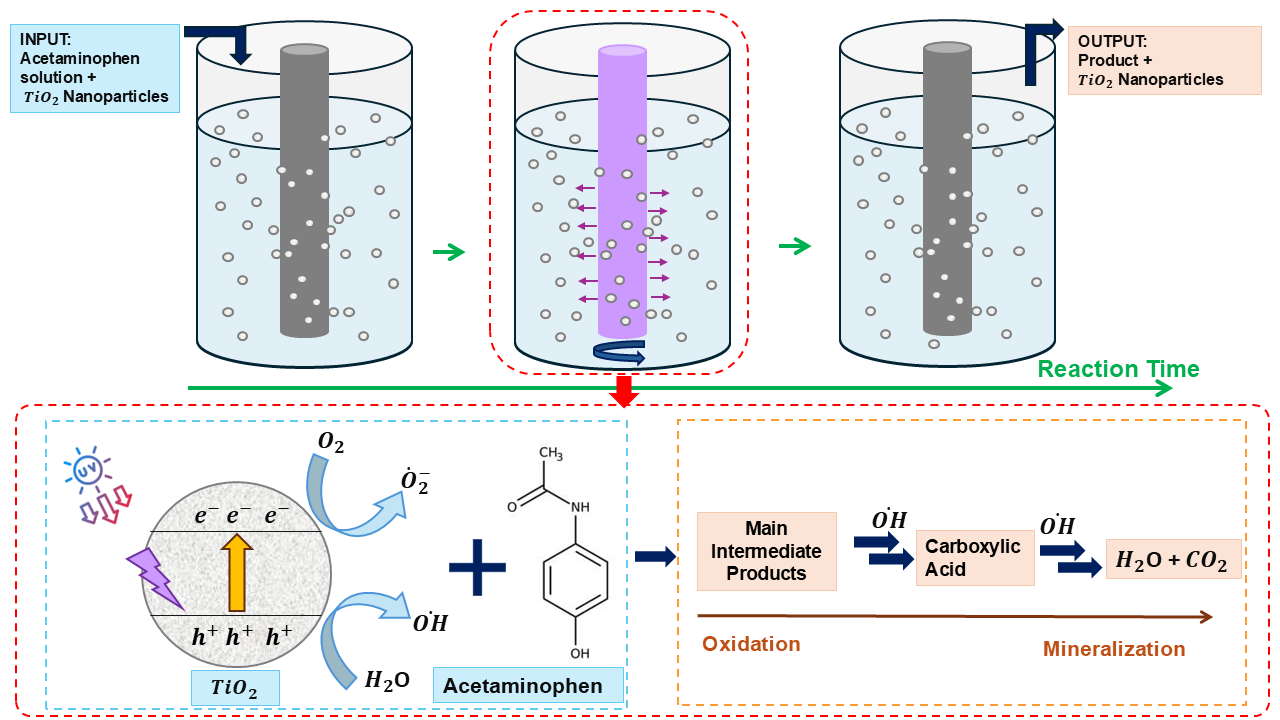
Traditional wastewater treatment plants are not generally designed to handle degradation of pharmaceuti-cal-based contaminants, nor do such plants generally incorporate processes that enable complete elimina-tion of pharmaceutical residues. Therefore, pharmaceutical metabolites can be found in groundwater, sur-face water, and even drinking water in low concentrations. Advanced Oxidation Processes (AOPs) are promising to avoid the contamination of agricultural land and aquifers. Here, we focus specifically on the use of photocatalytic degradation processes via titanium dioxide (TiO2) nanoparticles as a photocatalyst, as-sisted by UV radiation and enhanced by H2O2. This degradation approach may allow the degradation of pharmaceutical compounds, such as acetaminophen (ACE), in municipal water treatment plants in which a tertiary treatment phase is suitable. We employ a batch, water-cooled jacketed reactor equipped with a UV lamp containing a TiO2 nanoparticle suspension for the degradation of ACE. We identify favorable condi-tions for contaminant degradation (~63%) at low concentrations of both ACE and titanium dioxide after 90 minutes of treatment. Several combinations of potential AOPs approaches were compared (e.g., UV-C only, UV-C/H2O2, UV-C/H2O2/TiO2 and H2O2 alone). In general, the combined action of the techniques leads to a better degradation of the contaminant. The results suggest AOPs are promising candidates for removal of pharmaceutical metabolites from wastewater effluents.
Keywords:
bio-pharmaceutical
; advanced oxidation processes
; suspension reactors
; AOP enhancers
1. Introduction
The extensive use of pharmaceuticals for the treatment of both human and animal health conditions has expanded into an emerging environmental problem due to their continuous discharge into water systems and their persistence [1]. These products, sometimes referred to as pharmaceutically active compounds (PhACS), are discharged into wastewater effluents either largely unchanged, i.e. in their original chemical state or in the form of degradation products that are typically not suitable to elimination in traditional water treatment plants [2]. Depending on the nature of the chemical compounds and the treatment used to eliminate them, the PhACS will reach surface and ground water systems and, in the worst cases, will be found in drinking water [3,4,5].
In general, traditional wastewater treatment plants have not been designed to deal with contaminants such as pharmaceuticals and other related biomedicines [6]. Due to the inability of such wastewater treatment plants to completely eliminate drug residues and their metabolites, the presence of these can be found in groundwater, surface water, and even, in some cases, in drinking water at low concentrations [4,7]. As examples, studies have shown the presence of contaminants such as acetaminophen, ibuprofen, diclofenac, and carbamazepine at levels of 10 μgL-1, 112 ngL-1, 518 ngL-1 and 263 ngL-1, respectively, in different bodies of water [8]. Even though the concentration of organic compounds is within the currently accepted limits, the tests measuring their concentrations indicate that there is a continuous inflow of these substances into water systems that, eventually, will lead to accumulation [9]. There is, therefore, a need for efficient and environmentally-friendly technologies to eliminate these pharmaceuticals from water sources for a clean, healthy, and sustainable environment. In summary, evidence indicates an increasingly-alarming picture of bioaccumulation of pharmaceutical and industrial organic matter in water supplies suggesting the potential to have a negative impact on human health and the sustainability of wildlife and entire ecosystems [4,10].
Advanced oxidation processes (AOPs) have the potential to remove pharmaceutical and other organic water contaminants from our water supply [11,12,13]. AOPs can be used in water purification and treatment, including for the destruction of naturally occurring toxins, contaminants of emerging concern (e.g., estradiol etc.), and pesticides, to name a few [14]. The development of AOPs began in the 1990s and includes a variety of methods to generate hydroxyl radicals and other reactive oxygen species such as superoxide anion radical, hydrogen peroxide and singlet oxygen [15]. Hydroxyl radicals can abstract an electron from electron-rich substrates to form a radical cation which, in an aqueous medium, will hydrolyze and ultimately form an oxidized product. AOPs include but are not limited to UV/O3, UV/H2O2, Fenton, photo-Fenton, non-thermal plasmas, sonolysis, and photocatalysis [16].
This contribution focuses on the study of the degradation of ACE via a selected group of AOPs. In wastewater treatment plants (WWTPs), the tertiary stage of treatment is where such degradation might most likely be achieved. Table 1 briefly describes some of the challenges and potential areas where investigation is needed as related to tertiary treatment processes at municipal WWTPs. As the table shows, different approaches to treat stable contaminants have been taken (such as the use of chlorine), and some of these have unfavorable outcomes. Notably, other techniques that underperform contaminant degradation include the use of UV-based treatment processes, however, these have been utilized without addition of enhancers [14]. The inadequacy of current techniques at removing ACE and similar pharmaceutical contaminants is thus an area of great concern. To this end, we investigate the use of enhancers, including TiO2 and H2O2. Our results indicate that enhancers greatly increase the degradation rate of UV-based treatment processes, providing an exciting new approach to enhance the capacity of WWTPs to remove hazardous organic contaminants from our water supply.

1.1. Model Compound (Acetaminophen)
Acetaminophen (a.k.a., N-acetyl-p-aminophenol, paracetamol) (see Figure 1) is a non-narcotic analgesic drug used for relieving minor aches and pains associated with backache, headache, and arthritis. It is a widely used over-the-counter drug and is a common component of cold and flu medications. The demand for acetaminophen in the United States was estimated to be 30–35 thousand tons per year [17], and dramatic increases in product demand were observed during 2020-2022, associated with SARS-CoV-2 pandemic [14]. Furthermore, demand is expected to continue to increase as the population continues to grow and as availability and access expands to previously underserved global economies [14].
Acetaminophen is not a naturally occurring compound and was first synthesized by Harmon Northrop Morse in 1877 [18]. Today, it is known, that acetaminophen (or paracetamol, as it is referred to in some parts of the world) is a major product of the metabolism of degradation of phenacetin. The physical and chemical properties of acetaminophen are summarized in Table 2. Due to its widespread use and incomplete degradation, large amounts of acetaminophen have been found in river water, groundwater, sewage, and landfill leachate at levels ranging from a few ng/L to μg/L [19]. Overdose of this compound can lead to the accumulation of toxic metabolites causing fetal hepatotoxicity [20]. In the United States, acetaminophen toxicity is the most common cause of acute hepatic failure, which frequently requires organ transplantation [19].

2. Materials and Methods
2.1. Materials
A batch, temperature-controlled Pyrex photochemical glass reactor with a 1000 mL capacity and equipped with a magnetic stirrer, a water circulating jacket, and an opening for aeration was used (see Figure 2). The photoreactor has a T 60/40 center joint and three T 14/20 angle joints. Among the three joints, one is used as a sample port, one is helpful to insert a thermometer to measure the reaction temperature, and the remaining port is maintained airtight by inserting a solid rubber stopper. The reactor vessel holds a Hanovia 450 UV mercury vapor lamp in the reactor central port to radiate UV light to the reaction solution. The lamp was attached to an external power supply (See Figure 2, right side). The list of equipment includes a UV-Visible spectrophotometer, a pH meter, a 28 mm syringe, and Corning 0.45 µm filter paper sheets that were purchased from Fisher Scientific.
2.2. Chemicals
Acetaminophen (N-(4-hydroxyphenyl) acetamide) powder of pure quality (100%) was purchased from Fisher Scientific and used in the reaction. The photocatalyst, TiO2 nanoparticles (Titanium (IV) dioxide, 98% anatase powder), was supplied by Sigma-Aldrich and was used to test its effect on the degradation of the pharmaceutical compound at different concentrations. Hydrogen peroxide (30% in water) was purchased from Fisher Scientific. 1M (molar solution) sulfuric acid (H2SO4) and 1M sodium hydroxide (NaOH) were used to change the pH of the solution.
During the suspension study performed in the batch reactor, a number of possibilities (see Table 3) were investigated to check for the most suitable degradation conditions of ACE. The data collected was used for input or guiding the selection of conditions for the proposed technique for the partial or total removal of the contaminant from aqueous solutions.
2.3. Photocatalytic Experiments
As indicated in Section 2.1, a cylindrical borosilicate glass photoreactor with a total capacity of one liter was used in the experiments (see Figure 2). During these studies, 0.05 g of acetaminophen was prepared in 500 mL deionized (DI) water and fed into the reactor vessel. The light source used was a medium pressure mercury lamp (Hanovia 450 W UV, Ace Glass, Vineland, NJ, USA) which was placed into the double-wall immersion well containing jacket, with tap water in circulation to cool the reactor (see Figure 2). The light source was connected to a 450 W power supply. Additionally, a magnetic stirrer was utilized to properly mix the suspension.
2.4. Factorial Design
In order to determine the optimal number of experiments to be conducted (see Table 3), a 2n factorial experimental design [14,22] was used. Here, n corresponds to the primary variables to be tested in the experiment. The following two variables were used: (i) ACE concentration and (ii) TiO2 concentration, both with a high (+) level and a low (-) level. As shown in Table 3, four experiments (n=2) were designed for testing.

A clarification in Table 3: The following values were used for TiO2: Low = 0.5 g/ 500 mL; High = 1.00 g/ 500 mL and for ACE: Low = 0.05 g/ 500 mL; High = 0.1 g/ 500 mL
2.5. Experimental Procedure
After preparation of the reaction suspension, experiments were performed in the batch reactor. The ultraviolet treatment was conducted for total of 90 minutes with a 5 mL sample taken out from the reactor in ten-minute intervals to check for degradation of ACE. Samples were taken with a 28 mm syringe and then filtered through a 0.45 µm filter in order to remove the solid particles. The pH of the suspension was monitored with a pH meter, and the reaction temperature was maintained at room temperature. For the actual determination of concentration, a 1 mL sample was removed from the 5 mL sample by using a micropipette and diluted to 10 mL in order to determine the particular contaminant concentration by following the procedure outlined in the section below.
2.6. Sample Analysis
The spectrophotometric-based process is an excellent analytic technique to quantitatively measure the concentration of different organic compounds present in aqueous media. The photocatalytic degradation of acetaminophen was analyzed by using a Perkin Elmer Lambda 2 UV spectrophotometer at a wavelength of 243 nm, that corresponds to the maximum absorbance of acetaminophen. A 1 mL sample was removed from the samples taken from the batch reactor at a given time, by using a micropipette and diluted to 10 mL with deionized water for accurate detection to help dissolve other compounds (such as intermediaries that do not completely degrade) that may be present in that suspension samples.
Absorbance was converted to concentration by using the Beer- Lambert Law (see Appendix 1) yielding the following relationship:
C1 = C0
3. Data Collected and Brief Descriptions and Observations of Results
Based on the implementation of the experimental strategy described in Section 2.4 (See Table 3), a series of experiments were conducted, and degradation results were successfully collected for description and analysis (see Section 3.2). A description of the different experiments is offered in Section 3.1, and a discussion of the key trends found in the results collected is included in Section 3.2.
3.1. Description of Experiments and Results Collected
Degradation of ACE as a model pharmaceutical contaminant in an aqueous solution with the aid of TiO2 as a photocatalyst used as a suspension of nanoparticles in the batch reactor was monitored over the period of 90 minutes. The experimental conditions followed a 2n factorial design described in the Section 2.4, (See Table 3). The absorbance of all the samples was measured under the fixed wavelength of 243 nm from the spectrophotometer used to determine the concentration of ACE as a function of time. The total treatment time was 90 minutes for the various cases studied.
Figure 3 shows the photocatalytic degradation of ACE for the case with the highest concentrations of both the model contaminant and TiO2. The results show a degradation of 11.8% and 45.2% degradation at 10 and 90 minutes, respectively. During the experiment, the pH level in the reaction vessel was also monitored indicating that the pH remains relatively constant in the acidic domain between 4.7 and 5.5.
Figure 4 shows the degradation of the model contaminant for the case of high concentration of ACE, and low concentration of TiO2 during the total 90 minutes of treatment time. The levels of degradation, at 10 and 90 minutes of treatment time, were 10.5% and 51.4%, respectively, as measured by the spectrophotometric technique indicated above. With the conditions of the experiment, the pH remains within a relatively small acidic range with values between 4.7 and 5.0.
Figure 5 shows the degradation of the model contaminant for the case of low concentration of ACE and high concentration of TiO2 during 90 minutes of total treatment time. The levels of degradation at 10 and 90 minutes of treatment time, were 13.3% and 54.3%, respectively, as measured at 243 nm by the spectrophotometric technique. In this condition, the pH remained acidic with the values between 4.5 and 5.5.
Figure 6 shows the degradation of the model contaminant for the case of low concentration of ACE and low concentration of TiO2 during 90 minutes of total treatment time. The degradation at 10 and 90 minutes of treatment time was 17.7% and 62.9%, respectively, as measured at 243 nm by the spectrophotometric technique. As before, in this condition, the pH remained acidic, with values between 4.8 and 5.5.
Finally, Figure 7 provides a comparison of the degradation of ACE at different times of reactor exposure within the total time of 90 minutes frame for different ratios of concentration of ACE and concentration of the photocatalyst. A quick observation is that the case of low concentration of ACE treated with the low concentration of photocatalyst seems to be the most effective for all the times that measurements were taken. On the contrary, the case of highest concentration of ACE treated with the highest concentration of the photocatalyst shows that the degradation is less effective. Data from samples collected during the low ACE concentration and high photocatalyst concentration studies as well as the high ACE concentration and low photocatalyst concentrations are intermediate to the low-low and high-high design experiments. Additional comments will be offered in the section below.
3.2. Discussion of Degradation Results
From Figure 7, as was indicated in Section 3.1, it can be observed that favorable conditions for the ACE degradation (~63%) were identified at low concentrations of the contaminant treated with a low concentration of titanium dioxide at 90 minutes of treatment. Although more studies are needed, a preliminary explanation of the results reported can be suggested. The photocatalytic efficiency depends on the interactions of radiation with the compound on the photocatalyst surface. It seems that incident light with this wavelength having low concentrations of the ACE and photocatalyst has a better light-surface contact and less light dispersion. Therefore, more energy may be used for a greater photocatalytic activity producing more electron (e-) (h+) pairs on the TiO2 surface, which is helpful for the degradation of the ACE compound [23].
In the case of high substrate (ACE) concentration, photonic efficiency diminishes because more organic substances are absorbed on the TiO2 surface. However, the intensity of radiation and irradiation time are constant, which possibly limits the formation of O2.- and OH- on the TiO2 surface, which ultimately decreases the photo-degradation [24]. In the suspension medium, the catalyst particles are freely dispersed in fluid phase, therefore, the photocatalyst is fully integrated into the liquid mobile phase. One potential aspect limiting efficiency that has been indicated in the literature is the light scattering effect [14]. Therefore, only the proper amount of photocatalyst as it is needed should be added to the solution due to the increase in light scattering and adsorption by particles in the suspended medium. This aspect was not studied in the project, and it will require further work to completely determine the optimal level of nanoparticles needed in the solution.
4. Different Degradation Approaches
In order to gain a better understanding of the different degradation techniques associated with AOPs and their impact on the extent of conversion of ACE, additional studies were performed. The aim of these experiments was to compare the degradation levels achieved with different AOPs including the use of UV (alone), H2O2 treatment, dual UV/H2O2, and UV/H2O2/TiO2 combined. The effect of H2O2 volume (i.e., 1 mL and 5 mL) was also used to investigate degradation of ACE. Furthermore, data collected was used for comparisons with the experiments already conducted for the case of UV/TiO2 (See Section 3.1). Table 4 gives the experimental design matrix of the different AOPs for different experiments performed and selected remarks are also included.

R1: Figure 8 shows the degradation of ACE with the application of only UV-C radiation during 90 minutes of treatment. The degradation of ACE at the 10- and 90-minute points of the photocatalytic process was 2.4% and 13.5%, respectively. The pH measured during the entire process remained between 4.7 and 5.
R2: Figure 9 summarizes the degradation of ACE achieved by the treatment with the application of only H2O2. Spectroscopic analysis was performed on the samples of ACE treated solution as a function of time. During the 90 minutes of reaction time, only 11.5% of ACE degradation was achieved in the acidic medium (pH = 4.7 to 5.1).
R3/R4: In Figure 10, a comparison of the degradation of ACE in acidic medium when using different volumes of H2O2 (1 mL and 5 mL) and while applying UV-C radiation is shown. The results reveal degradation values of 11.5% and 72.4% were achieved by applying 1 mL of H2O2 after 10 minutes and 90 minutes of treatment, respectively. Similarly, we found that by applying 5 mL of H2O2 during the testing, degradation levels of ACE were 15.4% and 80.3% after 10 minutes and 90 minutes of treatment, respectively.
R5: In Figure 11, a comparison of the degradation of ACE in basic medium when using different volumes of H2O2 (1 mL and 5 mL) and while applying UV-C radiation is shown. The results show that after addition of 1 mL H2O2 that 8.7% and 71.2% of ACE was degraded after 10 minutes and 90 minutes of treatment, respectively. Similarly, by applying 5 mL of H2O2 to the solutions, the results indicate that the ACE degradations achieved were 14.3% and 76.0% at 10 and 90 minutes, respectively.
The effect of pH on ACE degradation is summarized in Table 5. As expected [4], the largest conversion of ACE is found for the neutral medium (pH=7.3). For example, at 10 minutes of treatment, the conversion was 15.6%, compared to 11.5% in the acidic medium (pH=5) and 8.7% in the case for basic medium (pH=9). When the treatment time increases to 90 minutes, the values change to 75.7% (neutral), 72.4% (acidic) and 71.2% (basic). The volume of H2O2 that was used in all three cases was 1 mL. The effect of increasing the volume of H2O2 was also tested by using 5 mL. The results of the degradation of ACE for the case of 10 minutes of treatment show that the degradation reaches 19.7% (neutral), 15.4% (acidic) and 14.3% (basic) while for 90 minutes of treatment the degradation increased to 81.1% (neutral), 80.3% (acidic) and 76% (basic).

R6: 6 The effect of adding TiO2 along with the UV+H2O2 treatment was also tested, please see case F in Table 6. Also, in Table 6, a comparison of the degradation of ACE with the application H2O2 (1 mL and 5 mL), TiO2 (0.5g and 1.0g), and UV light are shown. The results indicate that by applying 1.0 mL H2O2 and 0.5g TiO2, degradation rates were 23.7% and 82.8% during 10 and 90 minutes of treatment, respectively. Contaminant degradation after application of 5 mL H2O2 and 1g TiO2 were 15.2% and 67.1% degradation during 10 and 90 minutes of treatment, respectively. .
A comparison of all results is provided in Table 6. The results show the most favorable conditions for ACE degradation were achieved with the application of UV/H2O2/TiO2 after 90 minutes of treatment, yielding a degradation of 82.8%. In general, one can observe the beneficial action of the mutual work of two or more of the degradation techniques working together. For example, the use of UV-only and H2O2-only produces similar degradation and relatively low values (i.e. at 90 minutes of treatment, 13.50% vs 11.50%) while when the actions of UV-TiO2 are together the degradation reaches 62.90% for the same treatment time; this increases to 82.80% with the addition of 1 mL of H2O2. Additional comments and a statistically based analysis is provided in Section 5, below.

5. Comparative Results: Discussion on Different AOPs
The research reported in this contribution is aimed to increase understanding of the role of the different AOPs in degrading ACE. For example, with the application of only UV-C radiation, ACE was not degraded efficiently, consistent with results reported elsewhere. It has been postulated that the presence of –NH2 groups stabilizes the compound under these conditions [25]. However, the degradation of ACE significantly increases with UV-C and H2O2 or TiO2, or H2O2 and TiO2 combined (see Table 6). Addition of these enhancers most likely helps to generate hydroxyl radicals (HO.), which are highly reactive, have a short lifespan, and are capable of oxidizing different organic compounds [25]. The formation of radicals takes place when H2O2 is combined with UV-C radiation according to the following possible reaction mechanism [26].
H2O2 + hv 2HO. ….…(1)
H2O2 + HO. H2O + HO.2….................(2)
HO.2 + HO. H2O + O2 ……………..…(3)
5.1. Effect of H2O2 Volume
When small amounts of H2O2 are introduced into the UV-C/TiO2 system, the rate of degradation is increased due to the considerable generation of hydroxyl radicals by UV-C/H2O2. (See Table 6, Case F; and Figure 10). Since H2O2 is a strong electron acceptor, oxygen reacts with electrons which are coming from the valence band of the photocatalyst to generate HO. and OH.. If the reactive species, such as oxygen, and H2O2 are not present near the surface of the TiO2, the electron-hole pairs will recombine and the energy absorbed will degenerate as heat [27]. As a result, if H2O2 is low, the photocatalyst is capable of suppressing radical formation, leading to reduced contaminant degradation. Conversely, excess H2O2 can act like an electron hole, or it may react with H2O2 which ultimately forms peroxide compounds and hampers the degradation process [28]. Therefore, optimal concentrations of H2O2 are needed to attain maximum degradation results.
5.2. Effect of pH on Acetaminophen Photodegradation
Results with the effect of solution pH are summarized in Table 5. The pH of the solution determines the surface charge properties of TiO2, the size of aggregates formed, the charge of organic molecules, adsorption of molecules on the catalyst, and the concentration of the hydroxyl radicals [29]. In an acidic or neutral medium, ACE is in its non-ionic form, where water solubility is the highest and the adsorption on the photocatalyst is increased. At a nearly neutral pH, the degradation reaches the highest efficiency. This is most likely due to the fact that a larger number of OH– radicals are generated since, as pH increases, more hydroxide ions on the active sites of TiO2 can be oxidized to form more OH–. However, as the pH increases, electrostatic repulsion occurs between the photocatalyst surface and ACE (pKa = 9.5). Faster destruction of oxidizable compounds present in alkali medium could compete for the hydroxyl radical Therefore, it leads to lower ACE degradation and minor mineralization.
At a high pH level (pH > 9), in the UV-C/H2O2 system, the degradation of ACE is slow due to the self-decay of H2O2. This would foster the waste of H2O2. The molar extinction coefficient of HO–2 on UV-C absorption will be higher with H2O2 in the system, so less HO. will be generated. With the increase of the pH level, a fraction of HO–2 will also increase and possibly scavenge more H2O2 and HO. in the system. Therefore, the overall degradation rate would decrease [27].
5.3. Effect of Photocatalyst Dosage
Results with TiO2 addition are included in Section 3.2. For these studies, photocatalytic degradation increases with the increase of TiO2 dosages. However, further increase of TiO2 may lead to a detrimental effect on degradation [9]. The increase in the degradation rates is due to the increase in total surface area, i.e. number of active sites, available for the photocatalytic reaction. When the dosage of TiO2 is in excess, the intensity of incident light will be reduced because of the decrease in light penetration and the rise of light scattering. This will lessen the overall photo degradation process [30].
5.4. Effect of Acetaminophen Concentration
The photocatalytic degradation depends on the initial concentration of ACE. The degradation rate will increase with the increasing concentration of ACE, however, further increase in the concentration of reactants will show a negative trend on degradation [31]. This most likely occurs due to the number of photocatalyst active sites already occupied by the increased amount of ACE present in the solution, thereby blocking the formation of oxidants [32]. Additionally, higher contaminant concentrations of ACE can compete with the absorbance of photons to activate and the photocatalyst and produce electron-hole pairs, that would hinder the activation of photocatalyst causing the lower degradation of ACE [33].
6. Statistical Analysis of the Degradation Results
An ANOVA (no replication) method has been applied to the data collected for the degradation of ACE at different time intervals with the application of UV, H2O2, UV/H2O2, UV/TiO2 and UV/H2O2/TiO2 as it is shown in Table 6. Each degradation method has been considered a different group (A-F). Furthermore, two hypotheses for the ANOVA can be stated as: 1- H0 (Null Hypothesis): The null hypothesis posits that there is no significant variance between the methods utilized for the degradation of ACE. It specifically assumes equal means for the response across all groups. 2. H1 (Alternative Hypothesis):The alternative hypothesis proposes that there exists a significant difference among the methods applied for the degradation of ACE. It suggests that at least one group’s mean differs from the others.
To study the behavior of the case of UV only vs UV/TiO2, (columns A-F in Table 6), we summarize the results of the ANOVA test in Table 7. For this case the F-statistics are high while the p-value is less than 0.05. Therefore, it can be stated that a statistically significant difference exists between the groups; the asterisk (*) count represents the level of intensity; model is successful. The rejection of the null hypothesis (H0) suggests a notable dissimilarity among the various groups.

Therefore, it can be inferred that the different applied methods significantly impact the degradation of ACE, thereby supporting the alternative hypothesis (H1). Also, for multiple comparison and to further comprehend the relationships between groups, post-hoc tests are necessary. In this study, Tukey’s test has been applied to the data of Table 6 for this purpose, and the results are included in Table 8. Some useful observations can be made from this table. For example, when comparing all pairs of groups, if the obtained p-value is below 0.05, it indicates a statistically significant difference between the two distinct degradation methods. In Table 8, The notation “ns”, signifies that there is no statistically significant difference between the two groups being compared. Furthermore, from the values shown in Table 8, there are significant differences between following groups:
- UV Only vs. UV/H2O2(5 mL)
- UV Only vs. UV/H2O2/TiO2
- H2O2 Only vs. UV/H2O2(5 mL)
- H2O2 Only vs. UV/H2O2/TiO2
In addition, the percentage reduction of ACE for these top two groups is as below, based on Table 6 are:
- UV/H2O2(5 mL) : 81.10%
- UV/H2O2/TiO2 : 82.80%
Conversely, by comparing the p-values of UV/H2O2(5 mL) with UV/H2O2/TiO2, no statistically significant differences were observed in the outcome.
- UV/ H2O2(5 mL) vs. UV/ H2O2/ TiO2 (ns)
This result indicates that by adding TiO2 to the treatment method no significant change has been achieved with respect to the UV/H2O2(5 mL) method. There is no added value. Analysis similar to this can help in identifying the most promising combinations of AOPs in order to optimize resources and investment when trying to design a new AOP implementation for the degradation of ACE.

7. Summary, Concluding Remarks and Future Work
The efforts of this research project focused on two key aims: The first one was the testing of the degradation of acetaminophen with the use of TiO2 photocatalyst in the form of a nanoparticle suspension added to a batch photoreactor. The second aim was focused on testing a few selected options of Advanced Oxidation Processes and collecting data for comparison purposes. These included UV-C only, UV-C/H2O2, UV-C/H2O2/TiO2 and H2O2 alone. For the planning of both sets of experiments, a 2n factorial design matrix was utilized and implemented in order to guide the collection of data. The total treatment time was set at 90 minutes, and ten-minute intervals were used to collect samples of treated solution for analysis. All the concentration analyses were measured under the fixed wavelength of 243 nm from the spectrophotometer used to identify the concentration of ACE as a function of time.
For the first aim, a successful degradation of ACE in aqueous solution in the batch photoreactor was achieved for two different concentrations of the TiO2 photocatalyst. The encouraging circumstances for a contaminant degradation of approximately 63% were identified at low concentrations of ACE versus low concentration of titanium dioxide at 90 minutes of treatment at pH 5.5. When either higher concentration of photocatalyst or higher concentration of ACE was used, the degradation efficiency was tampered either by potential dispersion of light due to the increase in nanoparticles or competing adsorption of the contaminant sites with the photocatalyst sites which affected the utilization of the UV-light. These types of results are useful outcomes for the potential use of thin-film photocatalyst approaches that will avoid the filtration stage which is usually costly in the implementation of suspension reactors [4].
For the second aim of comparing selected AOPs, an effective comparison was performed to see the degradation of ACE with different AOPs (e.g., UV-C only, UV-C/H2O2, UV-C/H2O2/TiO2 and H2O2 alone). The most favorable condition for the acetaminophen degradation of 81.5% was found to be the application of UV/H2O2/TiO2 at 90 minutes of treatment. The research also indicated that the treatment using UV/H2O2(5 mL) produced an 81.10% degradation of ACE compared to the treatment of UV/H2O2/TiO2 that led to an 82.80% degradation of ACE, with no statistically significant differences observed. This type of result implies that more work needs to be conducted in order to advance the technology for the degradation of ACE. Among potential efforts, the thin-film approaches with the addition of H2O2 and/or other potential enhancers should be an excellent target of future efforts [4,14,34,35].
Funding:Partial: support in the form of graduate assistantships was provided by the School of Environmental Studies to SR and from the Center for the Management, Utilization and Protection of Water Resources (Water Center) at Tennessee Tech University to HR. The authors are grateful to the Department of Chemical Engineering, Tennessee Tech University for the use of research laboratories.
Data Availability Statement
The original contributions presented in this study are included in the article. Further inquiries can be directed to the corresponding author: Pedro E. Arce, PhD, FRSC (parce@tntech.edu).
Acknowledgments
Consultation with Rashed Rashidi (city of Dallas, TX) for the statistical analysis and suggestions to improve the manuscript from Daniel Betancourt (PhD Program, School of Medicine, Florida State University) are gratefully acknowledged.
Conflicts of Interest
The authors declare no conflicts of interest.
Appendix A
=According to the Beer- Lambert Law, the absorbance and the concentration are related as:
A = ԑ b C ………………………………………………A1
where A = absorbance, b = path length, C = concentration and, ԑ = molar absorption coefficient.
Therefore, with a fixed path length and constant molar absorption coefficient, it can be inferred that the absorbance is directly proportional to the concentration (C).
A C ………………………….......……….……………….A2
Considering two different measurements, it can be shown that
= ……………………………………………..A3
where A0 and C0 are absorbance and concentration, respectively, at time zero, while A1 and C1 are the absorbance and concentration, respectively, at time t1. Since ԑ b are constant values independent of the concentration, the following relationship is achieved:
C1 = C0 …………………….……………….. ...………....A4
References
- Kanakaraju, D.; Glass, B.D.; Oelgemöller, M. Advanced oxidation process-mediated removal of pharmaceuticals from water: A review. J. Environ. Manag. 2018, 219, 189–207. [Google Scholar] [CrossRef]
- Gros, M.; Petrović, M.; Barceló, D. Wastewater treatment plants as a pathway for aquatic contamination by pharmaceuticals in the Ebro river basin (northeast Spain). Environ. Toxicol. Chem. 2007, 26, 1553–1562. [Google Scholar] [CrossRef] [PubMed]
- Petrović, M.; de Alda, M.J.L.; Diaz-Cruz, S.; Postigo, C.; Radjenovic, J.; Gros, M.; Barceló, D. Fate and removal of pharmaceuticals and illicit drugs in conventional and membrane bioreactor wastewater treatment plants and by riverbank filtration. Philos. Trans. R. Soc. A 2009, 367, 3979–4003. [Google Scholar] [CrossRef]
- Rawal, S.; Buer, S.H.; Sanders, J.R.; Arce, P.E. Photocatalytic degradation of acetaminophen in water via ultraviolet light and titanium dioxide thin films part II: Chemical and kinetic aspects. Int. J. Chem. React. Eng. 2022, 20, 113–127. [Google Scholar] [CrossRef]
- Daughton, C.G.; Ternes, T.A. Pharmaceuticals and personal care products in the environment: Agents of subtle change? Environ. Health Perspect. 1999, 107, 907–938. [Google Scholar] [CrossRef]
- Moctezuma, E.; Leyva, E.; Aguilar, A.C.; Luna, R.A.; Montalvo, C. Photocatalytic degradation of paracetamol: Intermediates and total reaction mechanism. J. Hazard. Mater. 2012, 243, 130–138. [Google Scholar] [CrossRef]
- Heberer, T. Occurrence, fate and removal of pharmaceutical residues in the aquatic environment: A review of recent research data. Toxicol. Lett. 2002, 131, 5–17. [Google Scholar] [CrossRef]
- De la Cruz, N.; Gimenez, J.; Esplugas, S.; Grandjean, D.; de Alencastro, L.F. Degradation of 32 emergent contaminants by UV and neutral photo-Fenton in domestic wastewater effluent previously treated by activated sludge. Water Res. 2012, 46, 1947–1957. [Google Scholar] [CrossRef]
- Aguilar, C.A.; Montalvo, C.; Ceron, J.G.; Moctezuma, E. Photocatalytic degradation of acetaminophen. Int. J. Environ. Res. 2011, 5, 1071–1078. [Google Scholar] [CrossRef]
- Kümmerer, K. The presence of pharmaceuticals in the environment due to human use—present knowledge and future challenges. J. Environ. Manag. 2009, 90, 2354–2366. [Google Scholar] [CrossRef]
- Ibhadon, A.O.; Fitzpatrick, P. Heterogeneous photocatalysis: Recent advances and applications. Catalysts 2013, 3, 189–218. [Google Scholar] [CrossRef]
- Kabra, K.; Chaudhary, R.; Sawhney, R.L. Treatment of hazardous organic and inorganic compounds through aqueous phase photocatalysis: A review. Ind. Eng. Chem. Res. 2004, 43, 7683–7696. [Google Scholar] [CrossRef]
- Singh, H.K.; Saquib, M.; Haque, M.M.; Muneer, M. Heterogeneous photocatalyzed degradation of uracil and 5-bromouracil in aqueous suspensions of titanium dioxide. J. Hazard. Mater. 2007, 142, 425–430. [Google Scholar] [CrossRef]
- Rawal, S. Advanced Oxidation of Acetaminophen for Wastewater Treatment: Testing a New Approach for Degradation by Photocatalytic Methods via TiO2 Films. PhD Dissertation, Tennessee Technological University, Cookeville, TN, USA, 2021. [Google Scholar]
- Dewulf, J.; Van Langenhove, H.; De Smedt, E.; Guens, S. Combination of advanced oxidation processes and gas absorption for the treatment of chlorinated solvents in waste gases. Water Sci. Technol. 2001, 44, 173–180. [Google Scholar] [CrossRef]
- De Lasa, H.; Serrano, B.; Salaices, M. Photocatalytic Reaction Engineering; Springer: New York, NY, USA, 2005; p. 16. [Google Scholar]
- Mirasol, F. Acetaminophen market sees moderate price hike. Chem. Mark. Rep. 1998, 254, 5. [Google Scholar]
- Mangus, B.C.; Miller, M.G. Pharmacology Application in Athletic Training; F.A. Davis: Philadelphia, PA, USA, 2005; Volume 18, p. 39. [Google Scholar]
- Li, Y.; Song, W.; Fu, W.; Tsang, D.C.W.; Yang, X. The roles of halides in the acetaminophen degradation by UV/H2O2 treatment: Kinetics, mechanisms, and products analysis. Chem. Eng. J. 2015, 271, 214–222. [Google Scholar] [CrossRef]
- Bunchorntavakul, C.; Reddy, K.R. Acetaminophen-related hepatotoxicity. Clin. Liver Dis. 2013, 17, 587–607. [Google Scholar] [CrossRef] [PubMed]
- Koutahzadeh, N.; Esfahani, R.M.; Arce, P.E. Removal of Acid Black 1 from water by the pulsed corona discharge advanced oxidation method. J. Water Process Eng. 2016, 10, 1–8. [Google Scholar] [CrossRef]
- Design of Experiments: A No-Name Approach; Lorenzen, T., Anderson, V., Eds.; CRC Press: Boca Raton, FL, USA, 2018; p. 22. [Google Scholar]
- Muneer, M.; Qamar, M.; Saquib, M.; Bahnemann, D.W. Heterogeneous photocatalysed reaction of three selected pesticide derivatives, propham, propachlor and tebuthiuron in aqueous suspensions of titanium dioxide. Chemosphere 2005, 61, 457–468. [Google Scholar] [CrossRef]
- Rahman, A.M.; Muneer, M. Heterogeneous photocatalytic degradation of picloram, dicamba and floumeturon in aqueous suspensions of titanium dioxide. J. Environ. Sci. Health A 2005, 40, 247–267. [Google Scholar] [CrossRef]
- Tsitonaki, A.; Petri, B.; Crimi, M.; Mosbæk, H.; Siegrist, R.L.; Bjerg, P.L. In situ chemical oxidation of contaminated soil and groundwater using persulfate: A review. Crit. Rev. Environ. Sci. Technol. 2010, 40, 55–91. [Google Scholar] [CrossRef]
- Hu, X.; Yang, J.; Yang, C.; Zang, J. UV/H2O2 degradation of 4-aminoantipyrine: A voltammetric study. Chem. Eng. J. 2010, 26 161, 68–72. [Google Scholar] [CrossRef]
- Chu, W.; Choy, W.K.; So, T.Y. The effect of solution pH and peroxide in the TiO2-induced photocatalysis of chlorinated aniline. J. Hazard. Mater. 2007, 141, 86–91. [Google Scholar] [CrossRef] [PubMed]
- Poulios, I.; Kositzi, M.; Kouras, A. Photocatalytic decomposition of triclopyr over aqueous semiconductor suspensions. J. Photochem. Photobiol. A 1998, 115, 175–183. [Google Scholar] [CrossRef]
- Gaya, U.I.; Abdullah, A.H. Heterogeneous photocatalytic degradation of organic contaminants over titanium dioxide: A review of fundamentals, progress and problems. J. Photochem. Photobiol. C 2008, 9, 1–12. [Google Scholar] [CrossRef]
- Chen, S.; Liu, Y. Study on the photocatalytic degradation of glyphosate by TiO2 photocatalyst. Chemosphere 2007, 67, 1010–1017. [Google Scholar] [CrossRef]
- Li, Y.; Kurniawan, A.T.; Ying, Z.; Albadarin, B.A.; Walker, G. Enhanced photocatalytic degradation of acetaminophen from wastewater using WO3/TiO2/SiO2 composite under UV–VIS irradiation. J. Mol. Liq. 2017, 243, 761–770. [Google Scholar] [CrossRef]
- Kanakaraju, D.; Motti, C.A.; Glass, B.D.; Oelgemöller, M. Photolysis and TiO2-catalyzed degradation of diclofenac in surface and drinking water using circulating batch photoreactors. Environ. Chem. 2014, 11, 51–62. [Google Scholar] [CrossRef]
- Yang, L.; Yu, L.E.; Ray, M.B. Degradation of paracetamol in aqueous solutions by TiO2 photocatalysis. Water Res. 2008, 42, 3480–3488. [Google Scholar] [CrossRef] [PubMed]
- Arce, P.E.; Mahajan, S.; Jevtic, K. A photocatalytic process for hydrogen production: Selecting new semiconductors as co-catalyst. In Proceedings of the Student Research and Creative Inquiry Day; Tennessee Technological University: Cookeville, TN, USA, April 2017. [Google Scholar]
- Ross, H.; Arce, P.E.; Sanders, R.; Arce-Trigatti, A. Acetaminophen Degradation in Wastewater Using TiO₂ Suspension: Photocatalysis with AOP Enhancers—A Foundry Guided Approach . Poster presented at the AIChE Annual Meeting, Boston, USA, 2–6 November 2025. [Google Scholar]
Figure 1.
Acetaminophen Molecule.

Figure 2.
UV-Photocatalytic Set Up for Project [21].
Figure 2.
UV-Photocatalytic Set Up for Project [21].

Figure 3.
Photocatalytic Degradation of High Concentration of Acetaminophen VS High Concentration of TiO2 measured at 243 nm by the spectrophotometric technique. (Acetaminophen = 0.1 g, TiO2 =1.07 g, Total Volume = 500 mL).
Figure 3.
Photocatalytic Degradation of High Concentration of Acetaminophen VS High Concentration of TiO2 measured at 243 nm by the spectrophotometric technique. (Acetaminophen = 0.1 g, TiO2 =1.07 g, Total Volume = 500 mL).

Figure 4.
Photocatalytic Degradation of High Concentration of Acetaminophen VS Low Concentration of TiO2 measured at 243 nm by spectrophotometric technique. (Acetaminophen = 0.1 g, TiO2 = 0.5 g, pH= 5.0, Total Volume = 500 mL).
Figure 4.
Photocatalytic Degradation of High Concentration of Acetaminophen VS Low Concentration of TiO2 measured at 243 nm by spectrophotometric technique. (Acetaminophen = 0.1 g, TiO2 = 0.5 g, pH= 5.0, Total Volume = 500 mL).

Figure 5.
Photocatalytic Degradation of Low Concentration of Acetaminophen VS High Concentration of TiO2 measured at 243 nm by spectrophotometric technique. (Acetaminophen =0.05 g, TiO2 =1.05 g, pH= 5.5, Total Volume = 500 mL).
Figure 5.
Photocatalytic Degradation of Low Concentration of Acetaminophen VS High Concentration of TiO2 measured at 243 nm by spectrophotometric technique. (Acetaminophen =0.05 g, TiO2 =1.05 g, pH= 5.5, Total Volume = 500 mL).

Figure 6.
Photocatalytic Degradation of Low Concentration of Acetaminophen vs Low Concentration of TiO2 measured at 243 nm by spectrophotometric technique. (Acetaminophen=0.05 g, TiO2 =0.5 g, pH=5.5, Total Volume = 500 mL).
Figure 6.
Photocatalytic Degradation of Low Concentration of Acetaminophen vs Low Concentration of TiO2 measured at 243 nm by spectrophotometric technique. (Acetaminophen=0.05 g, TiO2 =0.5 g, pH=5.5, Total Volume = 500 mL).

Figure 7.
Comparison of the Degradation of Acetaminophen on different Time Intervals with different Concentrations of Photocatalyst (TiO2) and Model Compound ACE.
Figure 7.
Comparison of the Degradation of Acetaminophen on different Time Intervals with different Concentrations of Photocatalyst (TiO2) and Model Compound ACE.

Figure 8.
Photocatalytic Degradation of Acetaminophen (ACE) with the Application of UV light measured at 243 nm by spectrophotometric techniques. (Acetaminophen = 0.05 g, pH = 4.8, Total volume = 500 mL).
Figure 8.
Photocatalytic Degradation of Acetaminophen (ACE) with the Application of UV light measured at 243 nm by spectrophotometric techniques. (Acetaminophen = 0.05 g, pH = 4.8, Total volume = 500 mL).

Figure 9.
Photocatalytic Degradation of ACE with the Application of H2O2 (only) measured at 243 nm by spectrophotometric techniques. (Acetaminophen=0.05 g, pH=4.9, volume of H2O2 = 5 mL, Total Volume = 500 mL).
Figure 9.
Photocatalytic Degradation of ACE with the Application of H2O2 (only) measured at 243 nm by spectrophotometric techniques. (Acetaminophen=0.05 g, pH=4.9, volume of H2O2 = 5 mL, Total Volume = 500 mL).

Figure 10.
Comparison of the Degradation of Acetaminophen when Using Different Volumes of H2O2 (1 mL and 5 mL) and with Application of UV Light and an Acidic Medium (pH= 4.8) (Acetaminophen = 0.05 g, Total Volume = 500 mL).
Figure 10.
Comparison of the Degradation of Acetaminophen when Using Different Volumes of H2O2 (1 mL and 5 mL) and with Application of UV Light and an Acidic Medium (pH= 4.8) (Acetaminophen = 0.05 g, Total Volume = 500 mL).

Figure 11.
Comparison of the Degradation of Acetaminophen when Using Different Volumes of H2O2 (1 mL and 5 mL) and with Application of UV Light and Basic Media (pH= 9.0 and 11.3) (Acetaminophen = 0.05 g, Total Volume = 500 mL).
Figure 11.
Comparison of the Degradation of Acetaminophen when Using Different Volumes of H2O2 (1 mL and 5 mL) and with Application of UV Light and Basic Media (pH= 9.0 and 11.3) (Acetaminophen = 0.05 g, Total Volume = 500 mL).

Disclaimer/Publisher’s Note: The statements, opinions and data contained in all publications are solely those of the individual author(s) and contributor(s) and not of MDPI and/or the editor(s). MDPI and/or the editor(s) disclaim responsibility for any injury to people or property resulting from any ideas, methods, instructions or products referred to in the content. |
© 2026 by the authors. Licensee MDPI, Basel, Switzerland. This article is an open access article distributed under the terms and conditions of the Creative Commons Attribution (CC BY) license (http://creativecommons.org/licenses/by/4.0/).
Copyright: This open access article is published under a Creative Commons CC BY 4.0 license, which permit the free download, distribution, and reuse, provided that the author and preprint are cited in any reuse.


