Submitted:
26 February 2026
Posted:
28 February 2026
You are already at the latest version
Abstract
Due to the changing climate, an increasing number of organizations are focusing on Resource-Efficient Innovations (REI). This paper investigates a currently missing mul-tilevel perspective on the determinants of REI at the micro (firm), meso (intersectoral), and macro (policy) levels. Based on a comprehensive review of the literature and ex-isting gaps, the REI framework, comprising three levels and six categories (financial, technical, organizational, market, collaboration, and legal) with fourteen unique driv-ers and ten barriers, has been developed. Theoretically, the REI framework is grounded in the Porter hypothesis. To test the framework, novel data collected on more than 13,000 European SMEs are employed. The baseline results using logit regression em-pirically validate the framework, and the moderation analysis demonstrates an inter-play among the three levels. In addition to financial resources and technical expertise, meso-level cooperation is one of the most relevant factors for resource-efficient organ-izations. It arguably serves as an adhesive between micro and macro levels. Further-more, barriers – mainly located at the macro-level – may also accelerate the REI sup-porting the dynamic implications of the Porter hypothesis. Therefore, this paper pro-vides valuable new strategic insights for organizations aiming to foster REI.
Keywords:
eco-innovation
; resource efficiency
; European Union
1. Introduction
The global temperature is undeniably rising due to the overuse of resources. The 12th Sustainable Development Goal (SDG12) of the United Nations (UN) focuses on the need for responsible consumption and production, which includes Circular Economy (CE) concepts and improved Resource Efficiency (RE) [1,2]. In 2023, the UN revealed that “only 15 percent of the targets are on track” [3], which shows a higher need for commitment and action.
To achieve sustainability through climate action, the European Union (EU) has approved the European Green Deal to become a “modern, resource-efficient and competitive economy” [4]. Large public corporations and Small and Medium-sized Enterprises (SMEs) in the EU take different actions towards those goals. These objectives are central to evolved investments and action plans in Environmental Innovations (EI), and CE [5,6]. These action plans specifically target SMEs, which make up 99.8% of all registered companies in the EU and produce 53% of total economic value-added [7]. Since cumulative SME production activities play a crucial role in an economy, their investments in RE have a significant impact on the environment and firm growth [8]. European organizations seek the right investment strategies and design their business models in line with the drivers, barriers, and contextual factors of RE [2,9]. Regarding this transformation, the main research question of this paper is: what are the key determinants at the micro-, meso-, and macro-levels that affect organizations, particularly SMEs, in becoming more resource-efficient? Broadly, in transition theory, the Multi-Level Perspective (MLP) has been widely discussed [10,11,12], which also appears in earlier studies exploring the determinants of RE-Innovations (REI) [13,14,15,16]. However, there remains a lack of a comprehensive framework integrating such an MLP. Specifically, there is a lack of focus on the meso level, which encompasses intersectoral dynamics, alongside the micro (organizational level) and macro (regional policy level) determinants. In doing so, this paper addresses three research gaps. First, this paper develops a comprehensive framework by identifying and categorizing the relevant drivers and barriers for REI into three levels, based on a review of the existing literature and identified gaps. Secondly, this paper adds to the understanding of Porter`s hypothesis regarding REI in a partial-dynamic analysis, which claims that environmental regulations may lead to a competitive advantage over time, even though they are often considered a barrier for organizations, initially [17,18]. While the role of regulations has been studied extensively in the literature, the other form of deterrence (e.g., a lack of material supply) that exerts a similar external pressure has not been examined as a channel for this hypothesis. Our results support and enrich the Porter hypothesis and its dimension. Thirdly, we conduct a quantitative analysis of organizations and their REI [19] using a recent, novel dataset of almost 13,000 European SMEs, which is long overdue for a comprehensive update in light of a constantly evolving (formal and informal) institutional context. Next to cooperation, other crucial drivers are financial resources and technical know-how, whereas the labelling and certification, and the high costs of environmental actions present substantial barriers to REI, leading to eventual competitive advantage. More precisely, the research argues, based on interaction analysis, that an interplay between levels reveals that collaboration at the meso-level might help overcome difficulties between the micro- and macro-levels. The results are used to suggest organizational and policy strategies to foster REI and tackle climate change.
Section 2 of the paper justifies the need for organizations to pursue REI and provides an overview of relevant definitions and concepts. In this vein, the merger of the term EI with the concept of CE, and the development of the topic specifically within the REI model in organizations, are carried out. In section 3, a thorough analysis of the existing literature yields a REI framework comprising three levels and six categories. Applying the concept of REI, we identified factors that positively affect REI in organizations as drivers and those that negatively affect it as barriers. Following this, drivers and barriers are assigned to one of the six categories, each of which belongs to one of three levels: micro, meso, or macro. In Section 4, this REI framework is empirically applied and tested. In section 5, we present our results, followed by a discussion and implications in section 6 and a conclusion in section 7.
2. Need for Organizations to Integrate REI
To fight climate change and become more sustainable, innovation is crucial [2,20]. Organizations strive to integrate sustainability into their strategies and to pursue innovations that are resource-efficient [21,22,23]. In the literature, eco-innovation (“environmental innovation”, “green innovation”, “sustainable innovation”) is used interchangeably, enabling organizations to achieve sustainable transformation, avoid environmental damage, and create competitive advantage [2,24]. EI is understood as “the production, assimilation or exploitation of a product, production process, service or management or business method that is novel to the organization […] and which results […] in a reduction of environmental risk, pollution and other negative impacts of resource use”[25]. EI is related to a specific activity, e.g., the Edding group – an international family business based in Germany – installed return boxes for its unused pens to recycle them. On the broader industrial level, EI is embedded in the concept of CE, which refers to an entire economic system [26] in which the waste of one organization is used as input from a cooperation partner. CE is an “economic system that is based on business models which replace the ‘end-of-life’ concept with reducing, alternatively reusing, recycling, and recovering materials in production/distribution and consumption processes [26,27]. It is widely defined by the R principles, which combine reuse and recycling as core activities [28,29], often with reduction as a third R [30,31] or further activities such as refuse, rethink, repair, refurbish, remanufacture, repurpose, recover, restore/regenerate, and re-mine [31]. The CE concept is an approach for organizations to reach their RE goals [32,33]. A prominent example is the Kalundborg Symbiosis in Denmark, where industrial companies exchange waste and resources (e.g., steam, sludge, fly ash, or hot water). This research merges both constructs, CE and EI, into the definition of RE. For RE, there is no general definition; [34] generally, expect RE to improve the economy's environmental performance. One element of RE is saving resources, such as water, energy, and materials, during consumption and production [35]. Moreover, using more sustainable resources, such as renewable energy, cleaner production, and green technologies, is another action towards RE [36]. The newly developed concept of REI originates from the RE stream and combines several possible ways to minimize resource dependence (not just one, but several EIs). Like EI, it takes place at the organizational level, but unlike EI, it refers to RE's activities, which go beyond EI's. Comparing REI to CE, REI incorporates CE's activities at the organizational level. One could therefore summarize that REI combines the level at which innovation takes place from EI with the innovation activities from CE. To mention some of these activities, it could be: 1. Saving resources through reducing and reusing (saving water, energy, materials, and less waste), 2. Using more sustainable resources through recycling and refurbishing (renewable energies, greener supplies, recycling), 3. Innovating through rethinking and repurposing (selling waste, product design). We realize that existing concepts fall short of identifying this distinction.
REI specifically focuses on innovation activities based on CE principles, such as saving resources, using renewable resources, and developing green technologies, to strive for RE at the organizational level.
Given the current state of the literature, this research attempts to address three research gaps. First, it focuses on developing a framework identifying the relevant drivers and barriers for REI. While studies in the fields of CE, EI, and RE have increased in recent years, the main works have focused only on literature analysis (e.g., [37,38,39]). Whereas most of the literature analyzed drivers of EI, only a few articles considered barriers. However, this is important, since SMEs face higher hurdles than other (larger) organizations [40]. Another shortcoming of existing research is the level of analysis. Some studies do not provide a comprehensive assessment of relevant factors across different levels and instead adopt a broad approach. Additionally, collaboration at the meso-level is a fruitful avenue for future exploration of resource-efficient organizations [2,41]. Collaboration is an inter-organizational relationship focused on achieving common goals or firm-specific goals [42]. Organizations collaborate by working towards these goals, building trust, social learning, developing joint processes, and sharing costs or information [43,44]. By including collaboration as a unique meso-level aspect, we propose a first-of-its-kind RE framework and extend the previous research to highlight the role of crucial technological and organizational knowledge transfer [20,45].
Second, we attempt to understand Porter`s hypothesis regarding REI in a partial-dynamic analysis, which claims that environmental regulations, which can be a barrier for organizations [17,18], may lead to a competitive advantage [24]. This is important since the transition from traditional organizations towards CE is associated with tensions, e.g., from suppliers, customers, stakeholders, and society as a whole [2,46]. The role of regulation is the only barrier studied in the previous research. In this paper, we show that other barriers may behave similarly, as we find that barriers are ultimately overcome and become drivers. Additionally, this paper theoretically grounds its REI framework in the Porter hypothesis and applies its principles across three levels: micro-organizational, meso-interfirm, and macro policy. At the micro level, the Porter hypothesis suggests that well-designed, stringent environmental regulation can stimulate firm-level innovation that offsets or even surpasses compliance costs, thereby improving competitiveness and efficiency. At the meso and macro levels, this mechanism scales up through diffusion of green innovations across industries, clusters, and the wider economy, potentially enhancing sectoral dynamics and national competitive advantage, albeit with outcomes strongly mediated by institutional and policy design [25].
Third, our paper contributes to prior research methodologically. Current research consists of literature reviews [32,39] or qualitative analyses (e.g., case studies [30,47]). There is a strong need to employ appropriate updated data and conduct a quantitative analysis of organizations and their RE [19]. This will help validate the consistency and current relevance of the previously available pioneering empirical evidence on drivers and barriers. Under the institutional theory, this is essential because the (formal and informal) institutional context within which organizations are embedded constantly evolves. For example, changing coercive external factors (laws and regulations, e.g., European Green Deal), normative pressures (industry standardization and expectations, e.g., label and certification), and mimetic pressures (demand for similar environmentally friendly products) are relevant to measuring REI and require recent evidence [48]. By using a novel dataset of almost 13,000 European SMEs and by conducting logit regression, we significantly contribute to addressing this gap and include novel variables. In addition, we provide novel evidence of an interactive interplay among the three levels. For example, smaller, financially and technically constrained organizations are benefiting more by using meso-level opportunities (e.g., external support) to adopt REI. This addresses the claims of recent research claiming that “although the debate on the adoption of environmental innovations is well underway, the discussion on eco-innovation in the context of small- and medium-sized enterprises (SMEs) is at a less developed stage and deserves more attention, especially given the relevance of these companies in the economic system of several countries” [49] (p. 1432). Especially knowing that SMEs face resource constraints to deal with constantly demanding legal costs and a lack of bargaining power towards their suppliers [50].
3. Three-Level Driver and barrier Framework for REI in Organizations
3.1. State of Research
When organizations strive for greater sustainability, they evolve their business models toward RE and introduce REI [2,22,23,35,46,51]. Within this process, drivers and barriers regarding organizational, technical, and environmental changes arise [17,52]. Recently, there has been a growing focus on the connection between organizations and their transition to resource efficiency [22,23,46,51]. To offer an overview of the literature, we have summarized relevant literature sources in a supplementary file attached to this paper (S.1).
Regarding their methodological approach, there is a mix in this field of research that underlies its steady progress. Most of the literature deals with a literature review or attempts to assimilate different arguments to advance the conceptualization [49,53]. Literature-based studies [32,39,54] employ systematic approaches to detect the field of research. [39] conduct two bibliometric analyses and identify four antecedents or enablers of how organizations become more resource-efficient, e.g. the institutional environment and resources, which are particularly important. Some articles follow a qualitative research design using case studies or interviews [21,55]. A few further articles apply quantitative methods, such as meta-analyses [56] or structural equation modeling [57]. There is also a huge range of sample sizes, ranging from 4 cases that have been analyzed [30] up to more than 6000 innovative Spanish manufacturing and service firms [58].
When it comes to the level of analysis, most of the studies do not even consider a certain level in their analyses [37] [27] [49] [59]. Those studies that include a level mainly use the differentiation between internal and external factors [19,21,52]. Other studies focus on the institutional frame, including it at a specific level in their article [23,45,51,55].
Regarding drivers and barriers, not all articles differentiate between the two of them. Predominantly, the studies [53,57] just refer to analyzing factors or determinants of REI in general without specifically declaring it as a driver or barrier to REI. The study of [60] concentrates on the drivers only, whereas [18,40] or [2] only consider the barriers in their analyses. Typically, categories like product, resources/technology, customer, market, and regulations are listed as affecting REI in organizations [19,45,61].
3.2. REI Framework with Levels and Categories
A few studies put emphasis on the institutional background, since regulations and legislation, the lack of governmental subsidies, or politics can heavily affect the transition to a more sustainable organization [23,38,41,45,60]. Literature underlies the importance of the organization’s surroundings for successful REI, such as the regulatory situation/pressure [23,62]. The authors state that there is a range of drivers for REI, as diverse as increases in organizational reputation to low costs and compliance. This is why our framework integrates prior research and identifies macro-level factors (see Figure 1).
On the other hand, unlike the macro-level, prior research focuses on the internal level of an organization. [19] differentiate between internal and external drivers and barriers and argue that this is “one of the most widespread approaches in the extant studies” (p.4). Internal drivers and barriers refer to determinants that belong to the organization itself. These factors mainly refer to the resources or characteristics of the organization [18,22,49,59,61]. Therefore, this article considers the internal perspective as the micro-level.
Between the two levels, micro and macro, our framework includes a kind of intermediate inter-sectoral meso-level. It is also extremely important to consider this level since the organization and the contextual environment would not be sufficient for REI to be successful. Innovation as such needs collaboration with others to be successful in the market, e.g., suppliers or customers [23,41]. When analyzing the transition from traditional to sustainable business models in general, [46] detects that collaboration is a key instrument in this process. Similarly, [23] emphasizes the importance of connecting the different levels. They highlight the “co-evolution” of micro- and macro-level since they are “highly variable and contextual through complex interplay with both internal, corporate factors (micro-level), and external, societal factors (macro-level)” (p.542). This is particularly true for REI, as it is even more challenging for organizations due to the multiple requirements of different stakeholder groups [53]. Despite the importance of external partners in such innovation processes, to our best knowledge, prior research has not explicitly identified this level as a unique one in the REI framework. Hence, the meso-level comprises market and collaboration categories and serves as an adhesive between the other two levels – completing an MLP of REI determinants.
Theoretically, the three levels of the developed REI framework are rooted in the Porter hypothesis. According to the Porter hypothesis, the introduction of more stringent regulation can incentivize valuable EI and minimize uncertainty for organizations. Regulations incentivize organizations through environmental or transport taxes, creating demand pressure, and rewarding them if they exceed current standards, and may even create new standards [2,20,24,63]. However, there might be an issue of double externality, and EI might be underproduced [64]. Transferring this logic to the REI framework levels, at the micro level, the Porter hypothesis posits that sufficiently stringent but well-designed environmental regulation can trigger firm-level REI whose efficiency gains more than offset compliance costs, thereby enhancing productivity and competitiveness rather than merely imposing a regulatory burden. Likewise, at the meso level, this mechanism is projected onto industries, clusters, and value chains, where regulatory pressure induces REI within individual organizations, which then diffuses through supplier–producer–customer relationships and reshapes cost structures, market shares, and patterns of entry and exit across entire sectors. At the macro level, the Porter hypothesis is interpreted in terms of national or regional competitiveness, suggesting that ambitious environmental policy can generate economy-wide REI waves, upgrade factor and demand conditions, and create comparative advantages in clean technologies, even though these aggregate effects are empirically harder to identify due to heterogeneity of institutions and cross-sectoral interactions [24].
Additionally, our research particularly considers the time dimension of Porter’s hypothesis, these temporal shifts, which naturally occur when previous hurdles have been overcome in the past and then turn into drivers to accelerate REI [9,24]. In Figure 1, the left-hand arrow extends over present (t=0), past (t − n) and future (t + n) to represent the partial-dynamic properties of the framework. These are motivated by Porter’s hypothesis and are empirically reflected in the survey data (see supplementary file S.2). While the barrier variables refer to past constraints, the driver variables capture future-oriented incentives, and the REI approach reflects firms’ current strategic orientation.
Based on the findings of prior research presented above, our REI framework combines two main streams of research, namely levels and categories of drivers and barriers. Based on these levels, we include organization-related categories, such as the financial, technical, and organizational categories, on the micro-level. Furthermore, at the meso-level, crucial interactions with vertical and horizontal partners, such as suppliers, customers, and other companies, occur to satisfy demand. The macro-level refers to institutional categories, especially legal regulation, or policy-related subsidies, which could affect managerial practices. Thus, our REI framework applies the micro, meso, and macro levels, along with six categories within them. Our framework includes drivers and barriers across six categories (see Figure 1) and their specific drivers and barriers (see Table 1), derived from prior research.
Overall, organizations need to understand the drivers and barriers to designing resource-efficient, future-proof business models by fostering REI through MLP. With the introduction of the meso-level next to micro and macro, the “collaboration” category becomes a unique driver. Despite the potential risks of losing control over the organization`s knowledge [32,59] it is crucial for firms to work together to reach an overarching RE-target and be EI-oriented [41,51,54].
4. Materials and Methods
In line with the highlighted research gaps, the novel dataset Flash Eurobarometer 498: “SMEs, Resource Efficiency and Green Markets, Wave 5” was published by the European Commission [68] that is used to run a Logit regression model. The survey offers valuable information on RE, drivers, and barriers, along with firm and sector-specific control variables. Data is collected through computer-assisted telephone interviews (CATI) from regional SMEs across 27 European Union countries and 8 other non-EU countries. Thus, this dataset has an intended methodological robustness for an empirical comparative analysis. For our analysis, from the total sample of 17,662 SMEs, we focused on 27 countries of the European Union, with a sample of 13,073 SMEs in our full model, for barriers and drivers. Several questions in the questionnaire allow respondents to answer a single question with multiple-choice options (or the top three), thereby raising the need for multivariate modeling. However, based on correlation and multicollinearity tests, no such issues are diagnosed. As argued previously, the formulation of the survey questions can be interpreted to have a time dimension. Therefore, our dataset offers insights that can be interpreted as partial dynamics, making it feasible to apply Porter’s hypothesis. This implies that the data itself is static, but the questions tap into organizational past experiences and future expectations. A complete list of variables used, their definitions, and measurement approaches is provided in the supplementary file (S.2). To the best of our knowledge, some of the drivers and barriers listed in this wave are unique and contribute to the literature. In the drivers’ section, especially “assessment tool” and “demonstration” are new variables. The barrier “complexity with labeling” is new compared to previous waves and shows the ongoing discussions about this topic [69]. In Figure 2, the levels and categories are populated with the selected variables based on the comprehensive argumentation provided in the previous sections.
Given the binary nature of our variables, we considered using qualitative binary response models, such as the Logit and Probit models. After comparing both models for best fit using different criteria (e.g., AIC, BIC, McFadden’s R-square)2, the logit model that assumes a logistic probability function [70] is utilized. In practice, the preference of one model over another does not make a significant difference. For the convenience of interpreting regression coefficients, we have post-estimated Average Marginal Effects (AMEs). AME for an independent variable (let’s say: d) simply calculates differences between the presence of its effect (d=1) versus the absence of its effect (d=0), where is the means of all other variables.
AME interprets that one unit (in our case, discrete: 0 to 1) change in the independent variable results in a change in the probability of the dependent variable by a % marginal effect. A positive marginal effect implies that from the base level 0 to the change level of 1 in the independent variable, a positive contribution to the probability of the dependent variable is made, i.e., an increase in RE actions. For example, in Table 3, which presents our results for the drivers’ model, one of the driver cooperatives has a marginal effect of 0.107 (in column 3). This can be interpreted as meaning that a one-unit change in cooperation (discrete change: going from 0=organizations that do not cooperate to 1=organizations that do cooperate) will increase the probability of the dependent variable by 10.7%. This means that, due to cooperation, there will be 10.7% more organizations with (1=Many or some RE actions; 0=few to none RE actions). This interpretation applies to all the variables defined in the supplementary file (S.2).
Model specification is assessed using standardized tests for the logit model: the link test, the log-likelihood ratio (LR) test, and the Hosmer–Lemeshow goodness-of-fit test. The link test evaluates potential omitted variables and the functional relationship between the independent and the dependent variables. The LR test compares restricted and full specification models under the assumption of nested models, and the Hosmer–Lemeshow test assesses overall model fit. With the inclusion of necessary interaction terms and the stepwise exclusion of selected variables (financial resources), driver and barrier, both models pass the diagnostic tests. However, given the known limitations of these tests in applied econometrics (e.g., Linktest, see [71]), particularly sensitivity in large samples, we rely on theoretical centrality as well as empirical compliance with diagnostics. Relying solely on empirical indications from such tests, at the expense of theoretically grounded baseline specifications, may itself lead to model misspecification. Accordingly, we present both treated and untreated models along with their AME as post-estimates. For comparative transparency, firmage is the only variable that becomes significant in the treated specification, having been insignificant in the baseline model. Perhaps, in the absence of access to its own financial resources, firm size considers this effect, implying that the larger the firm, the more likely it is to have financial resources. In the discussion section, we conduct interaction or moderation analysis to build on these models. Due to the nonlinearity of the model, the moderation analysis is extended to post-estimates of the marginal difference and their statistical significance.
5. Results
5.1. Drivers
The descriptive statistics are presented in Table 2. Descriptive statistics show that REI actions are above average, with almost 71% diffusion. On the micro-level, firms primarily rely on their financial resources (financial category) by almost 67%. This is followed by reliance on grants and subsidies by almost 44%. Similarly, 55% of firms build their own technical expertise (technical category). At the meso-level, an active demonstration (market category) to learn about new technologies or processes, and better possibilities for cooperation (collaboration category) for REI are mentioned by more than a quarter of firms. The sampled firms mainly sell directly to other businesses (75%) and customers (60%), while almost 29% also sell to the public administrations. Lastly, at the macro level, 19% of firms in the legal category also state that clearer rules on the use of secondary raw materials would drive the adoption of REI. The estimation of the driver model's correlation matrix showed no multicollinearity issues, as confirmed by formal VIF tests. The correlation matrix is available in the attached supplementary file (S.3).

Table 2.
Descriptive statistics.
| Variable | Full model (n=13,073) |
|
| RE | 0.712 (0.453) |
|
| Drivers | ||
| Micro Level Financial Category | ||
| FINANCIAL RESOURCES | 0.678 (0.467) |
|
| GRANTS SUBSIDIES | 0.447 (0.497) |
|
| FINANCIAL ADVICE | 0.255 (0.436) |
|
| Micro Level Technical Category | ||
| TECHNICAL EXPERTISE | 0.545 (0.498) |
|
| Micro Level Organizational Category | ||
| CONSULTANCY | 0.268 (0.443) |
|
| FIRMSIZE | 0.240 (0.427) |
|
| FIRMAGE | 0.826 (0.380) |
|
| Meso Level Market Category | ||
| ASSESMENT TOOL | 0.169 (0.375) |
|
| DEMONSTRATION | 0.261 (0.439) |
|
| B2C | 0.596 (0.491) |
|
| B2B | 0.752 (0.432) |
|
| B2G | 0.285 (0.451) |
|
| Meso Level Collaboration Category | ||
| EXTERNAL SUPPORT | 0.273 (0.445) |
|
| DATABASE | 0.178 (0.383) |
|
| COOPERATION | 0.285 (0.451) |
|
| Macro Level Legal Category | ||
| REUSE RULES | 0.191 (0.393) |
|
|
Barriers |
||
| Micro Level Financial Category | ||
| ENV COST | 0.284 (0.451) |
|
| Micro Level Technical Category | ||
| LACKING ENVEXP | 0.221 (0.415) |
|
| Micro Level Organizational Category | ||
| DIFFICULTY ACTIONCHOICE | 0.212 (0.409) |
|
| Meso Level Market Category | ||
| LACKING SUPPLYMATER | 0.258 (0.437) |
|
| LACKING DEMAND | 0.194 (0.396) |
|
| Macro Level Legal Category | ||
| ADMIN COMPLEX | 0.337 (0.473) |
|
| ADPT REGULATIONS | 0.211 (0.408) |
|
| OLDTECH REGULATIONS | 0.195 (0.396) |
|
| COMPLEX LABEL CERT | 0.201 (0.401) |
|
| MANU | 0.208 (0.406) |
|
| RETAIL | 0.274 (0.445) |
|
| SERV | 0.296 (0.457) |
|
| IND | 0.222 (0.415) |
|
Standard deviations in parentheses. All the variables have max value =1 and min value = 0.
Table 3.
Logit Results – Drivers.
| (1) | (2) | (3) | (4) | ||||||||||||||||||||||||||||||
| VARIABLES | Estimates |
Robust Estimates |
Marginal Effects | Robust Marginal Effects |
|||||||||||||||||||||||||||||
| Micro Level Financial Category | |||||||||||||||||||||||||||||||||
|
FINANCIAL RESOURCES |
1.241*** | 0.180*** | |||||||||||||||||||||||||||||||
| (0.0501) | (0.00655) | ||||||||||||||||||||||||||||||||
| GRANTS SUBSIDIES | 0.498*** | 0.563*** | 0.0724*** | 0.0868*** | |||||||||||||||||||||||||||||
| (0.0481) | (0.0469) | (0.00692) | (0.00711) | ||||||||||||||||||||||||||||||
| FINANCIAL ADVICE | 0.535*** | 0.597*** | 0.0778*** | 0.0921*** | |||||||||||||||||||||||||||||
| (0.0547) | (0.0539) | (0.00786) | (0.00816) | ||||||||||||||||||||||||||||||
| Micro Level Technical Category | |||||||||||||||||||||||||||||||||
|
TECHNICAL EXPERTISE |
1.037*** | 0.883*** | 0.151*** | 0.136*** | |||||||||||||||||||||||||||||
| (0.0499) | (0.0462) | (0.00675) | (0.00679) | ||||||||||||||||||||||||||||||
| Micro Level Organizational Category | |||||||||||||||||||||||||||||||||
|
CONSULTANCY |
0.456*** | 0.534*** | 0.0663*** | 0.0824*** | |||||||||||||||||||||||||||||
| (0.0534) | (0.0526) | (0.00770) | (0.00799) | ||||||||||||||||||||||||||||||
| FIRMSIZE | 0.278*** | 0.349*** | 0.0405*** | 0.0538*** | |||||||||||||||||||||||||||||
| (0.0598) | (0.0584) | (0.00868) | (0.00896) | ||||||||||||||||||||||||||||||
| FIRMAGE | 0.0964 | 0.147** | 0.0140 | 0.0226** | |||||||||||||||||||||||||||||
| (0.0599) | (0.0589) | (0.00871) | (0.00908) | ||||||||||||||||||||||||||||||
| Meso Level Market Category | |||||||||||||||||||||||||||||||||
|
ASSESMENT_TOOL |
0.661*** | 0.705*** | 0.0961*** | 0.109*** | |||||||||||||||||||||||||||||
| (0.0673) | (0.0658) | (0.00968) | (0.0100) | ||||||||||||||||||||||||||||||
| DEMONSTRATION | 0.603*** | 0.674*** | 0.0878*** | 0.104*** | |||||||||||||||||||||||||||||
| (0.0545) | (0.0533) | (0.00781) | (0.00804) | ||||||||||||||||||||||||||||||
| B2C | 0.115** | 0.137*** | 0.0167** | 0.0211*** | |||||||||||||||||||||||||||||
| (0.0536) | (0.0520) | (0.00780) | (0.00802) | ||||||||||||||||||||||||||||||
| B2B | 0.0349 | 0.0642 | 0.00508 | 0.00991 | |||||||||||||||||||||||||||||
| (0.0593) | (0.0584) | (0.00862) | (0.00900) | ||||||||||||||||||||||||||||||
| B2G | 0.189*** | 0.189*** | 0.0275*** | 0.0292*** | |||||||||||||||||||||||||||||
| (0.0551) | (0.0534) | (0.00801) | (0.00824) | ||||||||||||||||||||||||||||||
| Meso Level Collaboration Category | |||||||||||||||||||||||||||||||||
| EXTERNAL SUPPORT | 1.039*** | 0.691*** | 0.151*** | 0.107*** | |||||||||||||||||||||||||||||
| (0.0669) | (0.0574) | (0.00929) | (0.00870) | ||||||||||||||||||||||||||||||
| DATABASE | 0.628*** | 0.689*** | 0.0913*** | 0.106*** | |||||||||||||||||||||||||||||
| (0.0652) | (0.0644) | (0.00937) | (0.00977) | ||||||||||||||||||||||||||||||
| COOPERATION | 0.734*** | 0.813*** | 0.107*** | 0.125*** | |||||||||||||||||||||||||||||
| (0.0546) | (0.0536) | (0.00777) | (0.00801) | ||||||||||||||||||||||||||||||
| Macro Level Legal Category | |||||||||||||||||||||||||||||||||
| REUSE RULES | 0.687*** | 0.767*** | 0.0999*** | 0.118*** | |||||||||||||||||||||||||||||
| (0.0631) | (0.0626) | (0.00906) | (0.00946) | ||||||||||||||||||||||||||||||
|
MANU |
0.389*** | 0.462*** | 0.0566*** | 0.0712*** | |||||||||||||||||||||||||||||
| (0.0739) | (0.0727) | (0.0107) | (0.0111) | ||||||||||||||||||||||||||||||
| RETAIL | 0.0202 | 0.0707 | 0.00294 | 0.0109 | |||||||||||||||||||||||||||||
| (0.0651) | (0.0637) | (0.00948) | (0.00982) | ||||||||||||||||||||||||||||||
| SERV | -0.116* | -0.0852 | -0.0169* | -0.0131 | |||||||||||||||||||||||||||||
| (0.0635) | (0.0618) | (0.00924) | (0.00953) | ||||||||||||||||||||||||||||||
| o.IND | - | - | - | - | |||||||||||||||||||||||||||||
|
Constant |
-2.267*** | -1.631*** | - | - | |||||||||||||||||||||||||||||
| (0.130) | (0.125) | ||||||||||||||||||||||||||||||||
| Observations | 13,073 | 13,073 | 13,073 | 13,073 | |||||||||||||||||||||||||||||
| Country FE | YES | YES | YES | YES | |||||||||||||||||||||||||||||
| Pseudo-R-squared | 0.254 | 0.214 | |||||||||||||||||||||||||||||||
| Log-likelihood | -5855 | -6170 | |||||||||||||||||||||||||||||||
| Robust standard errors in parentheses | |||||||||||||||||||||||||||||||||
| *** p<0.01, ** p<0.05, * p<0.1 | |||||||||||||||||||||||||||||||||
Following the framework, Table 3 presents the logit model coefficient estimates and marginal effects. All the drivers are statistically significant, but they vary in their effect sizes.
Regarding the micro-level, all three categories (financial, technical, and organizational) generally affect REI. Own financial resources have the largest marginal effect to increase REI actions, providing support for previous empirical evidence [72]. Results show that firm-based technical know-how (technical category) – after financial resources – has the largest marginal effects on REI. To financially support basic and applied collaboration, government grants and subsidies, and financial advice to identify such funding opportunities and investment opportunities are also statistically significant drivers in the financial category. Regarding the organizational category, building on the REI's risk and uncertainty perceptions, large and established firms are expected to take on such risks. The variables firm size and firm age, as indicated by their statistical significance, show these implications.
Furthermore, REI is influenced by the market and collaboration categories at the meso-level. At the meso-level, inter-sectoral possibilities for cooperation amongst firms are one of the most important drivers in the model (collaboration category). Despite being a large and established market player, perhaps due to incomplete information and inherent appropriation, uncertainty about the REI external support and consultancy (organizational category) is also a statistically significant driver (as later confirmed by interaction analysis). The collaboration category further shows that there is a positive impact of creating a database that may entail records of REI projects that inspire the benefits of such innovations. At the nexus of science-industry-policy [73], it is highly likely that sharing basic research will drive REI across organizations. Similarly, drivers such as assessment tools and demonstrations can help clarify the REI market competition landscape, underscoring the importance of the market category. These results are justified from the lens of evolutionary economics, which dictates the consistent need for innovation to maintain natural selection in the industrial dynamics and competition [74]. Finally, results also show that operating in B2C and B2G settings drives REI. What is interesting, though, is that B2B segmentation has no statistically significant contribution in driving REI.
Finally, at the macro level, in line with the vast literature on regulation, we see that clarity in rules and regulations on the use of secondary raw materials will drive the REI (legal category). A further elaboration on the implications of these results is presented in the discussion section.
5.2. Barriers
As per descriptive statistics on barriers, Table 2 shows that there are no clear ‘outliers’ similar to financial resources in the driver model. At the macro level, the expected regulatory administrative complexity in the legal category is a top barrier. At the meso-level, the lack of supply of materials, parts, products, or services is almost 26% (market category). At the micro-level, the firm-specific private environmental costs constitute another top barrier (financial category). In third place is the 22% lack of environmental expertise (technical category). A correlation matrix of barriers (see supplementary file S.4) showed no strong correlations, indicating that multicollinearity is not an issue.
Table 4 presents the logit estimates and marginal effects for barriers. Based on the somewhat expected implications of partial-dynamic framing of the barrier question, all barriers are positive contributors to increased REI actions. Especially considering our definition of REI. In the joint effect of barriers, some interaction terms have negative signs and are statistically significant, indicating a negative combined impact on organizations.
Identified further channels of Porter’s competitive advantage due to barriers, the robust model shows that the macro-level legal category has the largest positive barrier, which has driven the REI over time. This barrier is the complexity of environmental labelling and certification. This result should not appear surprising, as desirable commercial use of such labels and certifications follows strict, third-party-verified, and consistently evolving criteria in the EU [75]. Other regulatory barriers, such as administrative complexity proxying for bureaucratic red tape, are also positive and statistically significant. At the meso-level, market forces (supply and demand) act as positive, statistically significant barriers. Due to the unavailability of required materials, parts, products, or services, firms innovated around it. The friction would have been overcome by sourcing alternative supply materials, leading to REI. Similarly, the lack of demand for certain REI actions over time is expected to increase as climate change-related awareness has recently penetrated consumerism. Climate consciousness is becoming a universal consumer value, and organizations are learning to abide by it. Also, there have been several apocalyptic natural disasters (e.g., flash floods, wildfires) across the globe, thereby increasing the sense of urgency and decreasing the “psychological distance” [76]. At the micro-level, the high costs of environmental actions push organizations to adopt more of them. The cost variable is highly statistically significant and has the second-largest marginal effect. This can be explained through the relative assessment of higher costs incurred in the absence of such environmental actions. For example, loss of market share, and most importantly, inefficient resource optimization (such as energy). This was also a direct argumentation of Porter’s hypothesis. In the technical category, the lack of warranted environmental expertise is also a significant barrier, with high statistical significance. A firm, in the absence of such skills, may have relied on external support and cooperation over time to overcome such barriers. The results also show that firms are unable to make suitable decisions to become more RE-innovative. This highlights a firm's behavior in the face of dual market failures. However, policy intervention and market competition could be potential reasons for overcoming this micro-level organizational inertia over time.
6. Discussion & Implications
This paper has made a profound attempt to close the outlined research gaps. We summarize the most relevant aspects of our study in Figure 3 and discuss their implications in this section.
The proposed theoretical framework updates the literature and adds incremental strategic value to organizations seeking to achieve their REI objectives through an MLP. The framework enriches and deepens the fundamental understanding by identifying and consequently integrating crucial unique transmission variables. Firstly, based on theoretical and empirical arguments, the framework shows that, on the one hand, there are several drivers at the meso- and micro-level. On the other hand, half of the barriers are allocated at the macro-level. This implies top-to-bottom RE transition trickle-down. Overall, these variables may act as catalysts for REI and the systematic reinforcing change between the micro-meso-macro levels.
The framework has emerged as a tool that also shows that between the two poles – macro and micro – the unique meso-level acts as a horizontal and vertical connecting adhesive [54]. The meso-level adhesive is an intersectoral collaboration that allows the joint pursuit of RE-actions aligned with market forces and the available stakeholders within the cumulative competitive landscape [41]. To empirically elaborate on our claims, show the interplay, and identify potential policy actions, we have conducted further moderation or interaction analyses between meso-level drivers and macro- and micro-levels. We present these results in Table 5.
Based on statistically significant interaction terms, the interplay revealed highly crucial collaborative organizational strategies that are conditional on organizational characteristics (micro) and are reinforced by institutional settings (macro). While the main effects of the identified drivers are positive and statistically significant for REI, these effects in our moderation analysis might be dampened or strengthened. For example, large organizations that rely on their own financial resources and technical expertise benefit less from meso-level assessment tool development, demonstrative exhibitions, and, most importantly, external support. Therefore, these meso-level variables are strengthening smaller, financially and technically expertise-constrained organizations. Similarly, database development at the meso level that allows the study of case studies of organizational REI is in demand among firms that are technically constrained. These are a few of the most important results from our analysis to provide policy actions. Our results have also previously identified that a lack of environmental expertise is a crucial barrier. At the sector level, we can also address the previously identified lack of REI adoption among B2B organizations. Interaction analysis shows that, in the presence of technical expertise, the B2B sector adopts REI, suggesting a lack of technical expertise available to it. Altogether, this directly follows and strengthens the well-established literature on SME-related constraints that motivate collaboration due to differences in size, absorptive capacity, managerial skills, access to resources, and the ability to interact with external partners, thereby reducing the cost of innovation and achieving organizational RE [77,78]. To contextualize this, an EU-wide survey has estimated that almost 70% of municipalities lack experts with environmental and climate assessment skills [79]. This emphasizes a staggering gap between willingness and ability to achieve the green transition. Nevertheless, with meso-level collaboration, this gap can be somewhat bridged. Based on this, the first policy action is to develop a relevant knowledge base and foster collaborative opportunities. How these collaborative opportunities might be strengthened is outlined by our remaining results. We further find that meso-level organizational strategies, such as participating in or attending an exhibition or demonstration of new technologies, and access to grants and subsidies, reinforce an organization's ability to conduct REI. Moreover, intersectoral organizational collaboration for research and development opportunities is motivated by consulting with other organizations on how to conduct REI. The phenomenon of cross-innovation fits well, highlighting a mechanism that reveals that innovations emerge most when partners have heterogeneity in their knowledge bases [67]. However, this cooperation results in higher organizational REI when rules are clearly defined, specifying which raw materials can be used as secondary raw materials. Therefore, highlighting important policy tools from our analysis, for instance, the allocation of grants and subsidies, state-run demonstration exhibitions as innovation spaces, and, most importantly, a well-defined and efficient secondary raw material market. To provide context on this finding, according to [80], the total circular material use rate in the EU has stagnated between 2010 (10.7%) and 2024 (12.2%). This is partially responsible due to a lack of regulated markets for secondary raw materials. For instance, virgin plastics are cheaper than recycled plastics, leading to the bankruptcy of organizations that have heavily invested in chemical recycling plants [81,82]. This reiterates that organizational collaborative REI is policy-defined and compliance-based, and regulatory competitive advantages play an important role in fostering the top-to-bottom trickle found in the proposed framework.
The barriers model explained Porter’s policy hypothesis in more detail with other channels. Especially when the joint effects of administrative complexity and regulatory adaptation have a positive, statistically significant impact on REI actions. The results of the barrier model showed that there is a top-to-bottom trickling due to policy levers. Therefore, magnifying the role of the policy levers. While our positive barriers are best explained by Porter’s hypothesis, we acknowledge a few caveats. In the survey questionnaire, it is not possible to infer how long this average dynamic conversion time of barriers into drivers might be. Given the potential to tap into past events, memory bias (see, e.g., [83]) may also amplify responses and results in this manner. Behavioral science also warns against expecting biased answers when asking about past events (e.g., the Peak-End heuristic). In addition, a natural empirical concern is potential selection bias, whereby firms that report REI may also be more likely to report implementation difficulties, leading to positive estimated coefficients. This, in turn, implies that the barrier variable is symptomatic of engagement rather than actual difficulties. To assess this, we conducted cross-tabulations between barriers and REI. The results revealed that this concern is incorrect: across barrier variables, 7% to 17% of reported barriers are observed among organizations that did not successfully conduct REI. Therefore, organizations report actual barriers, strengthening our previous partial-dynamic claims.
From this paper, several implications are deduced. Regarding policy, despite the claim's obviously ambitious nature, it is possible to suggest that meso-level factors act as an adhesive for several polarized macro- and micro-level factors. We may check across levels and across categories to make an economic policy. While micro-level factors are important, they are aggregated and embedded into institutions. While this is true, the transmission catalyst ought to be at the meso-level in a well-functioning, connected market, fostering collaboration across and within sectors through demonstration sites and financial support mechanisms. By doing so, organizations can benefit from knowledge exchange with other sectors, which is important for enhancing REI.
Whereas quantitative studies like this one are highly demanded to generalize findings [19], this paper is not without limitations. There are some restrictions on the data, as it is secondary, specific to the EU, and static. Nevertheless, future data collection can build on our framework and the results. This paper provides some fruitful perspectives for future research. Having presented a comprehensive framework at several levels, future research could investigate in more detail how the specific factors evolve throughout the innovation process and how they interact with one another. Another interesting area for future research is analyzing their impact in specific institutional settings, such as the increasing literature on emerging markets [83].
Finally, this whole paper provides an effective blueprint for organizations that strive for REI. Specifically, financial resources and technical know-how are important drivers. While gaining eco-labels and other compliance costs are identified as barriers, they are crucial for overcoming organizational inertia and gaining a competitive advantage in the long run. Therefore, investments in those categories do pay off in the end, as organizations become legally compliant, market-relevant, and ready to compete and collaborate.
7. Conclusions
This paper catches up on crucial theme and investigates the adoption pathways of REI in organizations. Building on the recent literature and justified gap in it, the authors developed a first-of-its-kind comprehensive theoretical framework that includes three levels of micro, meso, and macro, and six categories within these levels. Empirical results confirm the framework's drivers and barriers. Most key determinants show comparable marginal effects, indicating that different factors are essential to organizations and that a strategic mix of them is necessary. European SMEs face a variety of options, and every organization has a different path to REI. However, a ranking and concentration of factors at a given level or category is visible. More precisely, this study confirms the importance of financial resources, technical knowledge, cooperation, and its mechanics. Technical expertise allows firms to build on their knowledge and, combined with opportunities in consultancy supported by clear market tools, to gain an even broader view of technical approaches to becoming resource-efficient. In terms of barriers, the macro-level regulations are relevant. In line with the Porter hypothesis, this paper shows that barriers, primarily at the macro level, were addressed and overcome in the next step, becoming innovative driving forces. Policymakers should consider triggering these aspects with a balanced approach. In line with that, this research highlights that the government, as a policy maker, influences REI directly through subsidies, reuse rules, and B2G companies within the financial, legal, and market categories, and indirectly by shaping spaces for collaboration on external support, databases, and cooperation. This multilevel perspective on drivers and barriers reveals how stakeholders can foster REI by actively collaborating and changing barriers into drivers.
Supplementary Materials
The following supporting information can be downloaded at: https://www.mdpi.com/article/doi/s1, Table S1: Summary of the Literature; Table S2: Description of the variables; Table S3: Correlation Matrix – Drivers Model; Table S4: Correlation Matrix – Barriers Model.
Author Contributions
Conceptualization, A.A., K.W. and V.B.; methodology, A.A., K.W. and V.B.;; software, A.A.; validation, A.A., K.W. and V.B.; formal analysis, A.A.; investigation, A.A.; data curation, A.A.; writing—original draft preparation, A.A., K.W. and V.B; writing—review and editing, A.A., K.W. and V.B; visualization, V.B. All authors have read and agreed to the published version of the manuscript.
Funding
We acknowledge support by the Open Access Publication Fund of Rhine-Waal University of Applied Sciences. This research did not receive any specific grant from funding agencies in the public, commercial, or not-for-profit sectors.
Data Availability Statement
The dataset was derived from the following resources available in the public domain: European Commission, Brussels (2020). Flash Eurobarometer 486 (SMEs, Start-ups, Scale-ups and Entrepreneurship) (ZA7637; Version 2.0.0) [Data set]. GESIS, Cologne. https://doi.org/10.4232/1.13639.
Acknowledgments
We acknowledge support from the Open Access Publication Fund of Rhine-Waal University of Applied Sciences.
Conflicts of Interest
The authors declare no conflicts of interest.
Abbreviations
The following abbreviations are used in this manuscript:
| REI | Resource Efficient Innovations |
| EI | Eco-Innovation |
| CE | Circular Economy |
| SMEs | Small and Medium-sized Enterprises |
| EU | European Union |
References
- Michael V. Russo; Céline Louche; Marcus Wagner. A Solid Foundation But What Will Be Built on It? Reviews of the Management, Organizations, and Environmental Sustainability Field. Organization & Environment 2024, 37, 119–132. [CrossRef]
- Lina Dagilienė; Viktorija Varaniūtė. Transitioning to a Circular Economy: Paradoxical Tensions of the Circular Business Model. Organization & Environment 2023, 36, 559–589. [CrossRef]
- United Nations. Only 15 Per Cent of Global Development Goals on Track, as Multiple Factors Stall, Hamper, Reverse Inclusive and Sustained Development, Third Committee Stresses | Meetings Coverage and Press Releases, 2023. Available online: https://press.un.org/en/2023/gashc4372.doc.htm.
- European Commission. The European Green Deal Striving to be the first climate-neutral continent, 2024. Available online: https://commission.europa.eu/strategy-and-policy/priorities-2019-2024/european-green-deal_en.
- European Commission. 2020 Circular Economy Action Plan International Aspects, 2020.
- European Commission. Communication from the Commission to the European Parliament, the Council, the European economic and social committee and the Committee of the regions on "Innovation for a sustainable Future - The Eco-innovation Action Plan (Eco-AP). COM(2011) 899 final 2011, 1–20.
- L. Di Bella; A. Katsinis; J. Lagüera-González; L. Odenthal; M. Hell; B. Lozar; European Commission. Joint Research Centre.; Industry European Commission. Directorate-General for Internal Market. Annual report on European SMEs 2022/2023 : SME performance review 2022/2023, 2023.
- Fatih Cemil Özbuğday; Derya Fındık; Kıvılcım Metin Özcan; Sıdıka Başçı. Resource efficiency investments and firm performance: Evidence from European SMEs. Journal of Cleaner Production 2020, 252. [CrossRef]
- Andrea Urbinati; Simone Franzò; Davide Chiaroni. Enablers and Barriers for Circular Business Models: an empirical analysis in the Italian automotive industry. Sustainable Production and Consumption 2021, 27, 551–566. [CrossRef]
- Frank W Geels. Technological transitions as evolutionary reconfiguration processes: a multi-level perspective and a case-study. Research Policy, 31.
- René Kemp; Johan Schot; Remco Hoogma. Regime shifts to sustainability through processes of niche formation: The approach of strategic niche management. Technology Analysis and Strategic Management 1998, 10, 175–198. [CrossRef]
- Jan Rotmans; Derk Loorbach; René Kemp. Transition management: Its origin, evolution and critique, 2007.
- Klaus Rennings. Redefining innovation-eco-innovation research and the contribution from ecological economics. Ecological Economics, 32.
- Jens Horbach. Determinants of environmental innovation-New evidence from German panel data sources. Research Policy 2008, 37, 163–173. [CrossRef]
- Jens Horbach; Christian Rammer; Klaus Rennings. Determinants of Eco-innovations by Type of Environmental Impact The Role of Regulatory Push / Pull , Technology Push and Market Pull Determinants of Eco-innovations by Type of Environmental Impact The Role of Regulatory Push / Pull , Technology Push and M. Journal of Cleaner Production 2011. [CrossRef]
- Rene Kemp; Tim Foxon. Typology of eco-innovation 2007.
- Martin Geissdoerfer; Tomas Santa-Maria; Julian Kirchherr; Carla Pelzeter. Drivers and barriers for circular business model innovation. Business Strategy and the Environment 2023, 32, 3814–3832. [CrossRef]
- Fabian Takacs; Dunia Brunner; Karolin Frankenberger. Barriers to a circular economy in small- and medium-sized enterprises and their integration in a sustainable strategic management framework. Journal of Cleaner Production 2022, 362. [CrossRef]
- Maryam Hina; Chetna Chauhan; Puneet Kaur; Sascha Kraus; Amandeep Dhir. Drivers and barriers of circular economy business models: Where we are now, and where we are heading. Journal of Cleaner Production 2022, 333. [CrossRef]
- Giulio Cainelli; Alessio D’Amato; Massimiliano Mazzanti. Resource efficient eco-innovations for a circular economy: Evidence from EU firms. Research Policy 2020, 49. [CrossRef]
- Graziela Darla Araujo Galvão; Steve Evans; Paulo Sergio Scoleze Ferrer; Marly Monteiro de Carvalho. Circular business model: Breaking down barriers towards sustainable development. Business Strategy and the Environment 2022, 31, 1504–1524. [CrossRef]
- Jonatan Pinkse; Florian Lüdeke-Freund; Oliver Laasch; Yuliya Snihur; René Bohnsack. The Organizational Dynamics of Business Models for Sustainability: Discursive and Cognitive Pathways for Change. Organization & Environment 2023, 36, 211–227. [CrossRef]
- Noora Piila; Milla Sarja; Tiina Onkila; Marileena Mäkelä. Organisational Drivers and Challenges in Circular Economy Implementation: An Issue Life Cycle Approach. Organization & Environment 2022, 35, 523–550. [CrossRef]
- Michael E Porter; Claas Van Der Linde. Toward a New Conception of the Environment-Competitiveness Relationship. Journal of Economic Perspectives, 9.
- René Kemp; Peter Pearson. Final report MEI project about measuring eco-innovation, 2007. Available online: http://www.merit.unu.edu/MEI.
- Julian Kirchherr; Denise Reike; Marko Hekkert. Conceptualizing the circular economy: An analysis of 114 definitions; Elsevier B.V, 2017. Resources, Conservation and Recycling, 127.
- Marta Ormazabal; Vanessa Prieto-Sandoval; Rogério Puga-Leal; Carmen Jaca. Circular Economy in Spanish SMEs: Challenges and opportunities. Journal of Cleaner Production 2018, 185, 157–167. [CrossRef]
- Piera Centobelli; Roberto Cerchione; Davide Chiaroni; Pasquale Del Vecchio; Andrea Urbinati. Designing business models in circular economy: A systematic literature review and research agenda. Business Strategy and the Environment 2020, 29, 1734–1749. [CrossRef]
- Julian Kirchherr; Nan Hua Nadja Yang; Frederik Schulze-Spüntrup; Maarten J. Heerink; Kris Hartley. Conceptualizing the Circular Economy (Revisited): An Analysis of 221 Definitions; Elsevier B.V, 2023. Resources, Conservation and Recycling, 194.
- Valtteri Ranta; Leena Aarikka-Stenroos; Saku J. Mäkinen. Creating value in the circular economy: A structured multiple-case analysis of business models. Journal of Cleaner Production 2018, 201, 988–1000. [CrossRef]
- Heidi Simone Kristensen; Mette Alberg Mosgaard. A review of micro level indicators for a circular economy – moving away from the three dimensions of sustainability?; Elsevier Ltd, 2020. Journal of Cleaner Production, 243.
- Murillo Vetroni Barros; Rodrigo Salvador; Guilherme Francisco do Prado; Antonio Carlos de Francisco; Cassiano Moro Piekarski. Circular economy as a driver to sustainable businesses; Elsevier Ltd, 2021. Cleaner Environmental Systems, 2.
- OECD. The OECD Re-Circle Project. The Economics of the transition to a more resource-efficient, circular economy, 2022. Available online: http://www.oecd.org/termsandconditions.
- Fengmei Ma; Heming Wang; Heinz Schandl; Tomer Fishman; Xiaoting Tan; Yang Li; Lei Shi; Peng Wang; Wei Qiang Chen. Exploring the relationship between economic complexity and resource efficiency. Resources, Conservation and Recycling 2022, 186. [CrossRef]
- Katherine A. Whalen. Three circular business models that extend product value and their contribution to resource efficiency. Journal of Cleaner Production 2019, 226, 1128–1137. [CrossRef]
- René Kemp. Green transition, industrial policy, and economic development. Never Source: Oxford Review of Economic Policy 2017, 33, 66–84. [CrossRef]
- Marcos Ferasso; Tatiana Beliaeva; Sascha Kraus; Thomas Clauss; Domingo Ribeiro-Soriano. Circular economy business models: The state of research and avenues ahead. Business Strategy and the Environment 2020, 29, 3006–3024. [CrossRef]
- Germán López Pérez; Isabel María García Sánchez; José Luis Zafra Gómez. A systematic literature review and bibliometric analysis of eco-innovation on financial performance: Identifying barriers and drivers. Business Strategy and the Environment 2024, 33, 1321–1340. [CrossRef]
- Matheus G. Tardin; Marcelo G. Perin; Cláudia Simões; Luiza D. Braga. Organizational Sustainability Orientation: A Review. Organization & Environment 2024, 37, 298–324. [CrossRef]
- Julian Kirchherr; Laura Piscicelli; Ruben Bour; Erica Kostense-Smit; Jennifer Muller; Anne Huibrechtse-Truijens; Marko Hekkert. Barriers to the Circular Economy: Evidence From the European Union (EU). Ecological Economics 2018, 150, 264–272. [CrossRef]
- Kuhlmann, M.; Meuer, J.; Bening, C.R. Interorganizational Sensemaking of the Transition Toward a Circular Value Chain. Organization & Environment 2023, 36, 411–441. [CrossRef]
- Xavier Castañer; Nuno Oliveira. Collaboration, Coordination, and Cooperation Among Organizations: Establishing the Distinctive Meanings of These Terms Through a Systematic Literature Review. Journal of Management 2020, 46, 965–1001. [CrossRef]
- Mônica Cavalcanti Sá de Abreu; Fabiana Nogueira Holanda Ferreira; João F. Proença; Domenico Ceglia. Collaboration in achieving sustainable solutions in the textile industry. Journal of Business and Industrial Marketing 2021, 36, 1614–1626. [CrossRef]
- Gábor Herczeg; Renzo Akkerman; Michael Zwicky Hauschild. Supply chain collaboration in industrial symbiosis networks. Journal of Cleaner Production 2018, 171, 1058–1067. [CrossRef]
- Dante I. Leyva-de la Hiz; Nuria Hurtado-Torres; María Bermúdez-Edo. The Heterogeneity of Levels of Green Innovation by Firms in International Contexts: A Study Based on the Home-Country Institutional Profile. Organization & Environment 2019, 32, 508–527. [CrossRef]
- Lüdeke-Freund, F.; Froese, T.; Dembek, K.; Rosati, F.; Massa, L. What Makes a Business Model Sustainable? Activities, Design Themes, and Value Functions. Organization & Environment 2024, 37, 194–220. [CrossRef]
- Laura Rocca; Monica Veneziani; Cristian Carini. Mapping the diffusion of circular economy good practices: Success factors and sustainable challenges. Business Strategy and the Environment 2023, 32, 2035–2048. [CrossRef]
- Surajit Bag; Pavitra Dhamija; David J. Bryde; Rajesh Kumar Singh. Effect of eco-innovation on green supply chain management, circular economy capability, and performance of small and medium enterprises. Journal of Business Research 2022, 141, 60–72. [CrossRef]
- Renato Passaro; Ivana Quinto; Giuseppe Scandurra; Antonio Thomas. The drivers of eco-innovations in small and medium-sized enterprises: A systematic literature review and research directions. Business Strategy and the Environment 2023, 32, 1432–1450. [CrossRef]
- Mickey Howard; Steffen Böhm; Dan Eatherley. Systems resilience and SME multilevel challenges: A place-based conceptualization of the circular economy. Journal of Business Research 2022, 145, 757–768. [CrossRef]
- Olesson, E.; Nenonen, S.; Newth, J. Enablers and Barriers: The Conflicting Role of Institutional Logics in Business Model Change for Sustainability. Organization & Environment 2023, 36, 228–252. [CrossRef]
- Martin Agyemang; Simonov Kusi-Sarpong; Sharfuddin Ahmed Khan; Venkatesh Mani; Syed Tahaur Rehman; Horsten Kusi-Sarpong. Drivers and barriers to circular economy implementation: An explorative study in Pakistan’s automobile industry. Management Decision 2019, 57, 971–994. [CrossRef]
- Bahman Peyravi; Artūras Jakubavičius. Drivers in the Eco-Innovation Road to the Circular Economy: Organiational Capabilities and Exploitative Strategies. Sustainability (Switzerland) 2022, 14. [CrossRef]
- Burbano, V.C.; Delmas, M.A.; Cobo, M.J. The Past and Future of Corporate Sustainability Research. Organization & Environment 2024, 37, 133–158. [CrossRef]
- Nancy M.P. Bocken; Thijs H.J. Geradts. Barriers and drivers to sustainable business model innovation: Organization design and dynamic capabilities. Long Range Planning 2020, 53. [CrossRef]
- Zhongju Liao; Yan Liu. What drives environmental innovation? A meta-analysis. Business Strategy and the Environment 2021, 30, 1852–1864. [CrossRef]
- Ines Diez-Martinez; Angel Peiro-Signes; Marival Segarra-Oña. The links between active cooperation and eco-innovation orientation of firms: A multi-analysis study. Business Strategy and the Environment 2023, 32, 430–443. [CrossRef]
- Ángela Triguero; María C. Cuerva; Carlos Álvarez-Aledo. Environmental innovation and employment: Drivers and synergies. Sustainability (Switzerland) 2017, 9. [CrossRef]
- Vasileios Rizos; Arno Behrens; Wytze van der Gaast; Erwin Hofman; Anastasia Ioannou; Terri Kafyeke; Alexandros Flamos; Roberto Rinaldi; Sotiris Papadelis; Martin Hirschnitz-Garbers; et al. Implementation of circular economy business models by small and medium-sized enterprises (SMEs): Barriers and enablers. Sustainability (Switzerland) 2016, 8. [CrossRef]
- Agustí Segarra-Blasco; Mercedes Teruel; Josep Tomàs-Porres. Circular economy and public policies: A dynamic analysis for European SMEs. Business Strategy and the Environment 2024, 33, 3532–3549. [CrossRef]
- Marín-Vinuesa, L.M.; Scarpellini, S.; Portillo-Tarragona, P.; Moneva, J.M. The Impact of Eco-Innovation on Performance Through the Measurement of Financial Resources and Green Patents. Organization & Environment 2020, 33, 285–310. [CrossRef]
- Tyler, B.; Lahneman, B.; Beukel, K.; Cerrato, D.; Minciullo, M.; Spielmann, N.; Discua Cruz, A. SME Managers’ Perceptions of Competitive Pressure and the Adoption of Environmental Practices in Fragmented Industries: A Multi-Country Study in the Wine Industry. Organization & Environment 2020, 33, 437–463. [CrossRef]
- Knut Blind; Martin Kenney; Aija Leiponen; Timothy Simcoe. Standards and innovation: A review and introduction to the special issue. Research Policy 2023, 52. [CrossRef]
- Adam B Jaffe; Richard G Newell; Robert N Stavins. A tale of two market failures: Technology and environmental policy. Ecological Economics 2005, 54, 164–174. [CrossRef]
- Isabel Maria Bodas-Freitas; Nicoletta Corrocher. The use of external support and the benefits of the adoption of resource efficiency practices: An empirical analysis of european SMEs. Energy Policy 2019, 132, 75–82. [CrossRef]
- Aline Sacchi Homrich; Graziela Galvão; Lorena Gamboa Abadia; Marly M. Carvalho. The circular economy umbrella: Trends and gaps on integrating pathways. Journal of Cleaner Production 2018, 175, 525–543. [CrossRef]
- Benjamin Weber; Sven Heidenreich. When and with whom to cooperate? Investigating effects of cooperation stage and type on innovation capabilities and success. Long Range Planning 2018, 51, 334–350. [CrossRef]
- Brussels European Commission. Flash Eurobarometer 498 (SMEs, Resource Efficiency and Green Markets, wave 5), 2022.
- Brussels European Commission. Flash Eurobarometer 456 (Small and Medium Enterprises, Resource Efficiency and Green Markets, wave 4), 2018.
- WH William H . Greene. Econometric analysis 7th Ed. Journal of the American Statistical Association 2012, 97.
- StataCorp. Stata 18 Base Reference Manual, 2023. Stata Press.
- Arslan Austin; Imran Ur Rahman. A triple helix of market failures: Financing the 3Rs of the circular economy in European SMEs. Journal of Cleaner Production 2022, 361, 132284. [CrossRef]
- Loet Leydesdorff; Henry Etzkowitz. The Triple Helix as a model for innovation studies. Science and Public Policy 1998. [CrossRef]
- David J. Teece; Gary Pisano; Amy Shuen. Dynamic capabilities and strategic management. Strategic Management Journal 1997, 18, 509–533. [CrossRef]
- European Commission. Product groups and criteria Discover the full range of EU Ecolabel products and criteria, 2024. Available online: https://environment.ec.europa.eu/topics/circular-economy/eu-ecolabel/product-groups-and-criteria_en.
- Rachel I. McDonald; Hui Yi Chai; Ben R. Newell. Personal experience and the ’psychological distance’ of climate change: An integrative review; Academic Press, 2015. Journal of Environmental Psychology, 44.
- David B. Audretsch; Maksim Belitski; Rosa Caiazza; Phillip Phan. Collaboration strategies and SME innovation performance. Journal of Business Research 2023, 164. [CrossRef]
- Simão Bichinho; Mário Franco; Margarida Rodrigues. Interorganisational cooperation as a way of accessing green technologies for the integration of sustainable practices in SMEs. Green Technologies and Sustainability 2025, 100295. [CrossRef]
- T. Bending; J Delanote; I. Dos Santos; Gilson. N.; Guyot. N.; P. Harasztosi; A. Kolev; A. Martens; T. Olejnik; J. Schanz; et al. The state of local infrastructure investment in Europe EIB Municipalities Survey 2022-2023, 2023.
- Eurostat. Circular economy Monitoring framework, 2026. Available online: https://ec.europa.eu/eurostat/web/circular-economy/monitoring-framework.
- Henk Diepenmaat; René Kemp; Myrthe Velter. Why sustainable development requires societal innovation and cannot be achieved without this. Sustainability (Switzerland) 2020, 12. [CrossRef]
- René Kemp; Henk Diepenmaat; Laura Nieboer; Jan Wynarski. SYSCHEMIQ Policy briefs and guidelines on the circular systemic solutions adopted, 2025.
- Arslan Austin; Sedat Alataş; Darlington Agbonifi. Financing Eco-Innovation in an Emerging Economy: The Role of Internal Resources, External Support and Government in Turkish SMEs. Sustainable Development 2025. [CrossRef]
| 1 | whereas cooperation focuses on the implementation of agreed goals |
| 2 | We used the fitstat command in STATA. |
Figure 1.
REI framework with driver and barrier categories in micro, meso and macro levels.
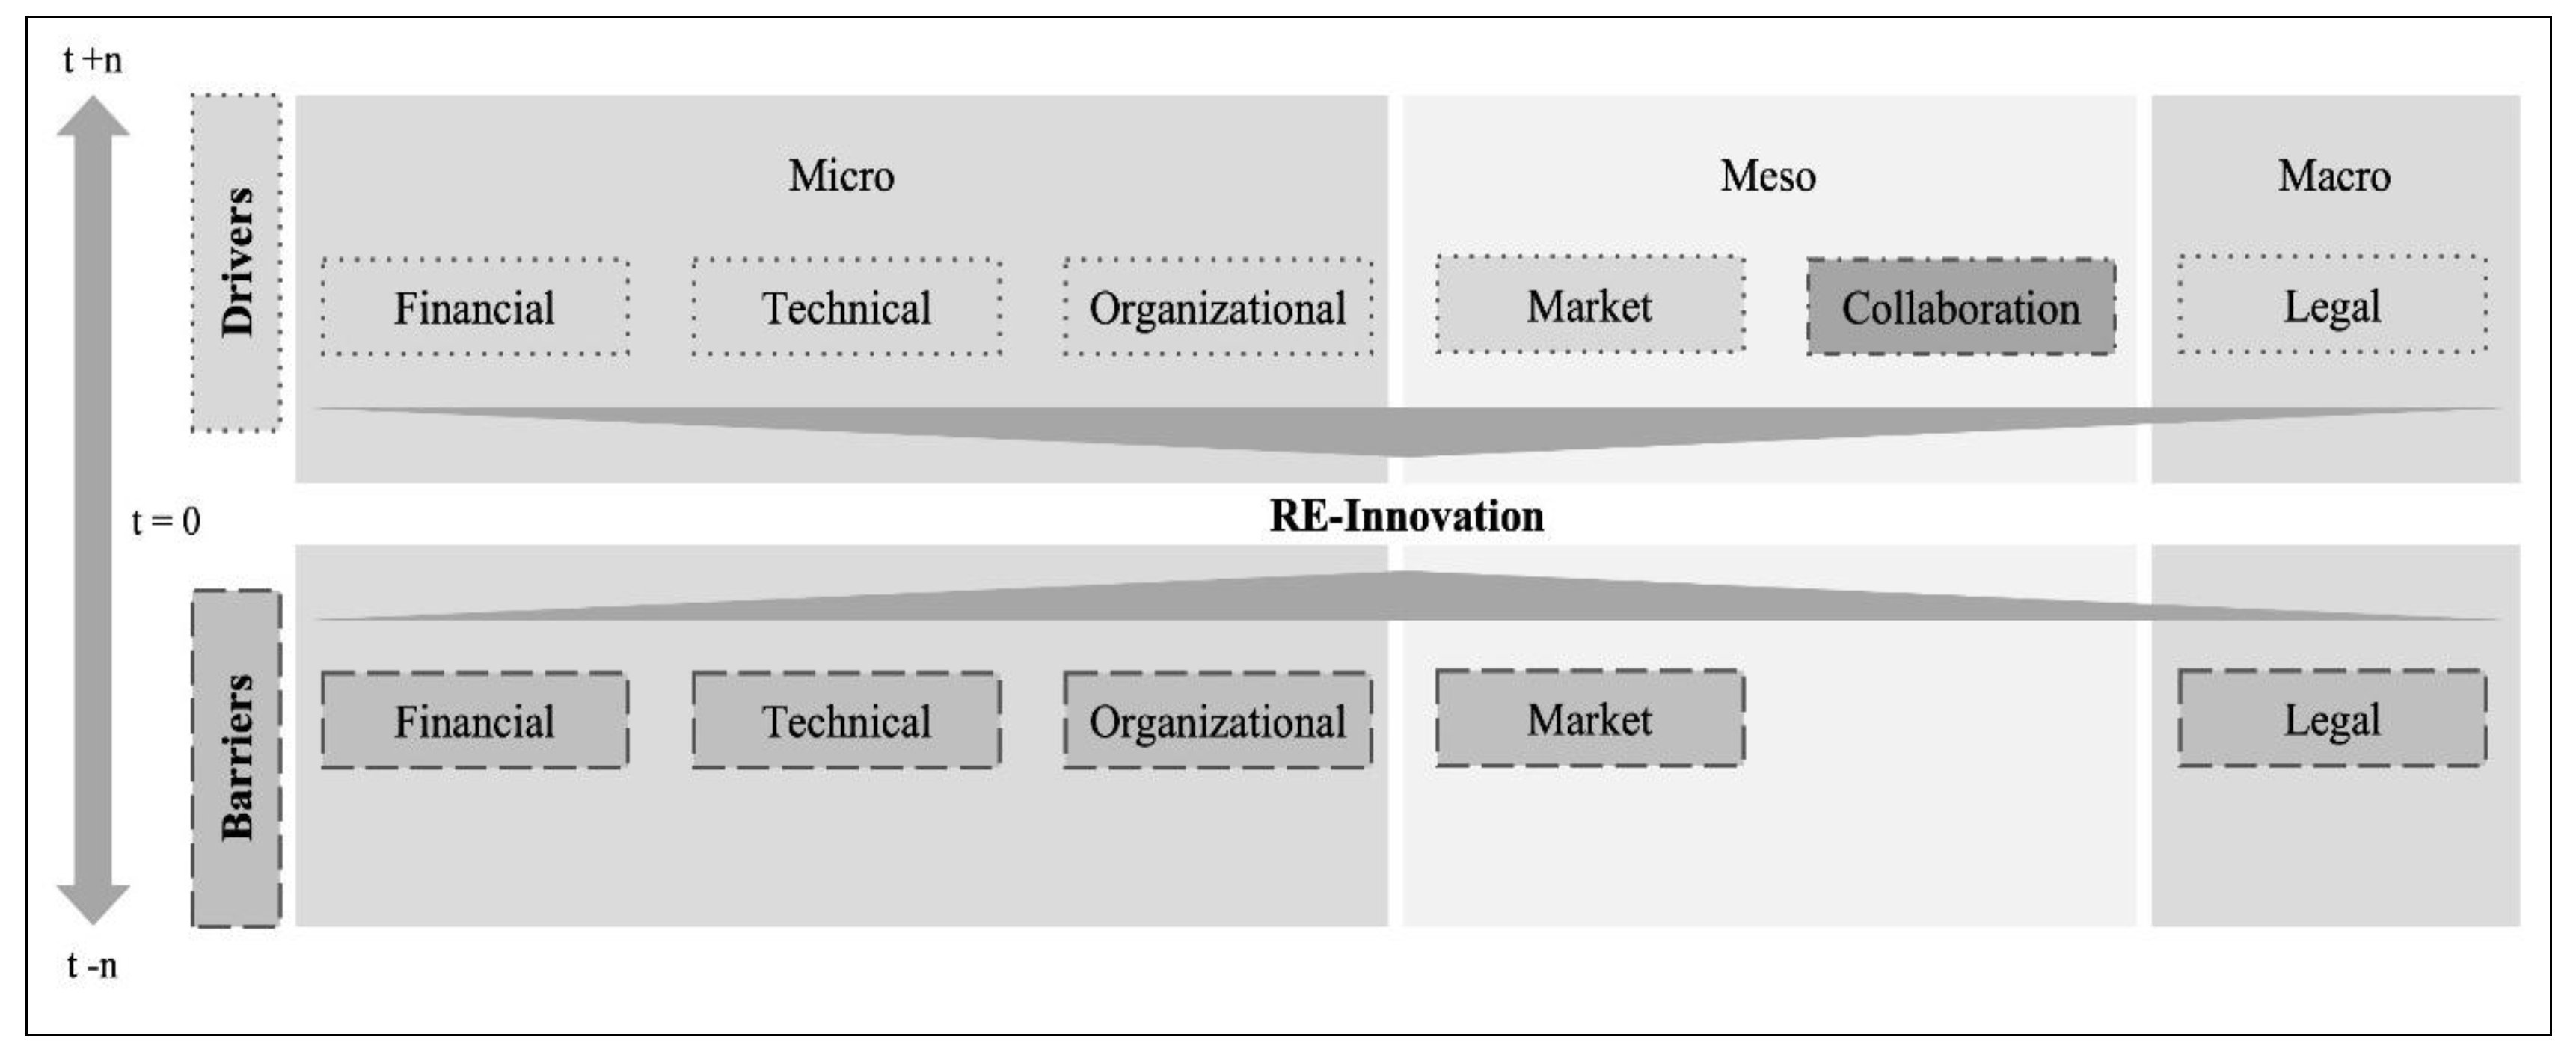
Figure 2.
Operationalization of Resource Efficient Innovation framework.
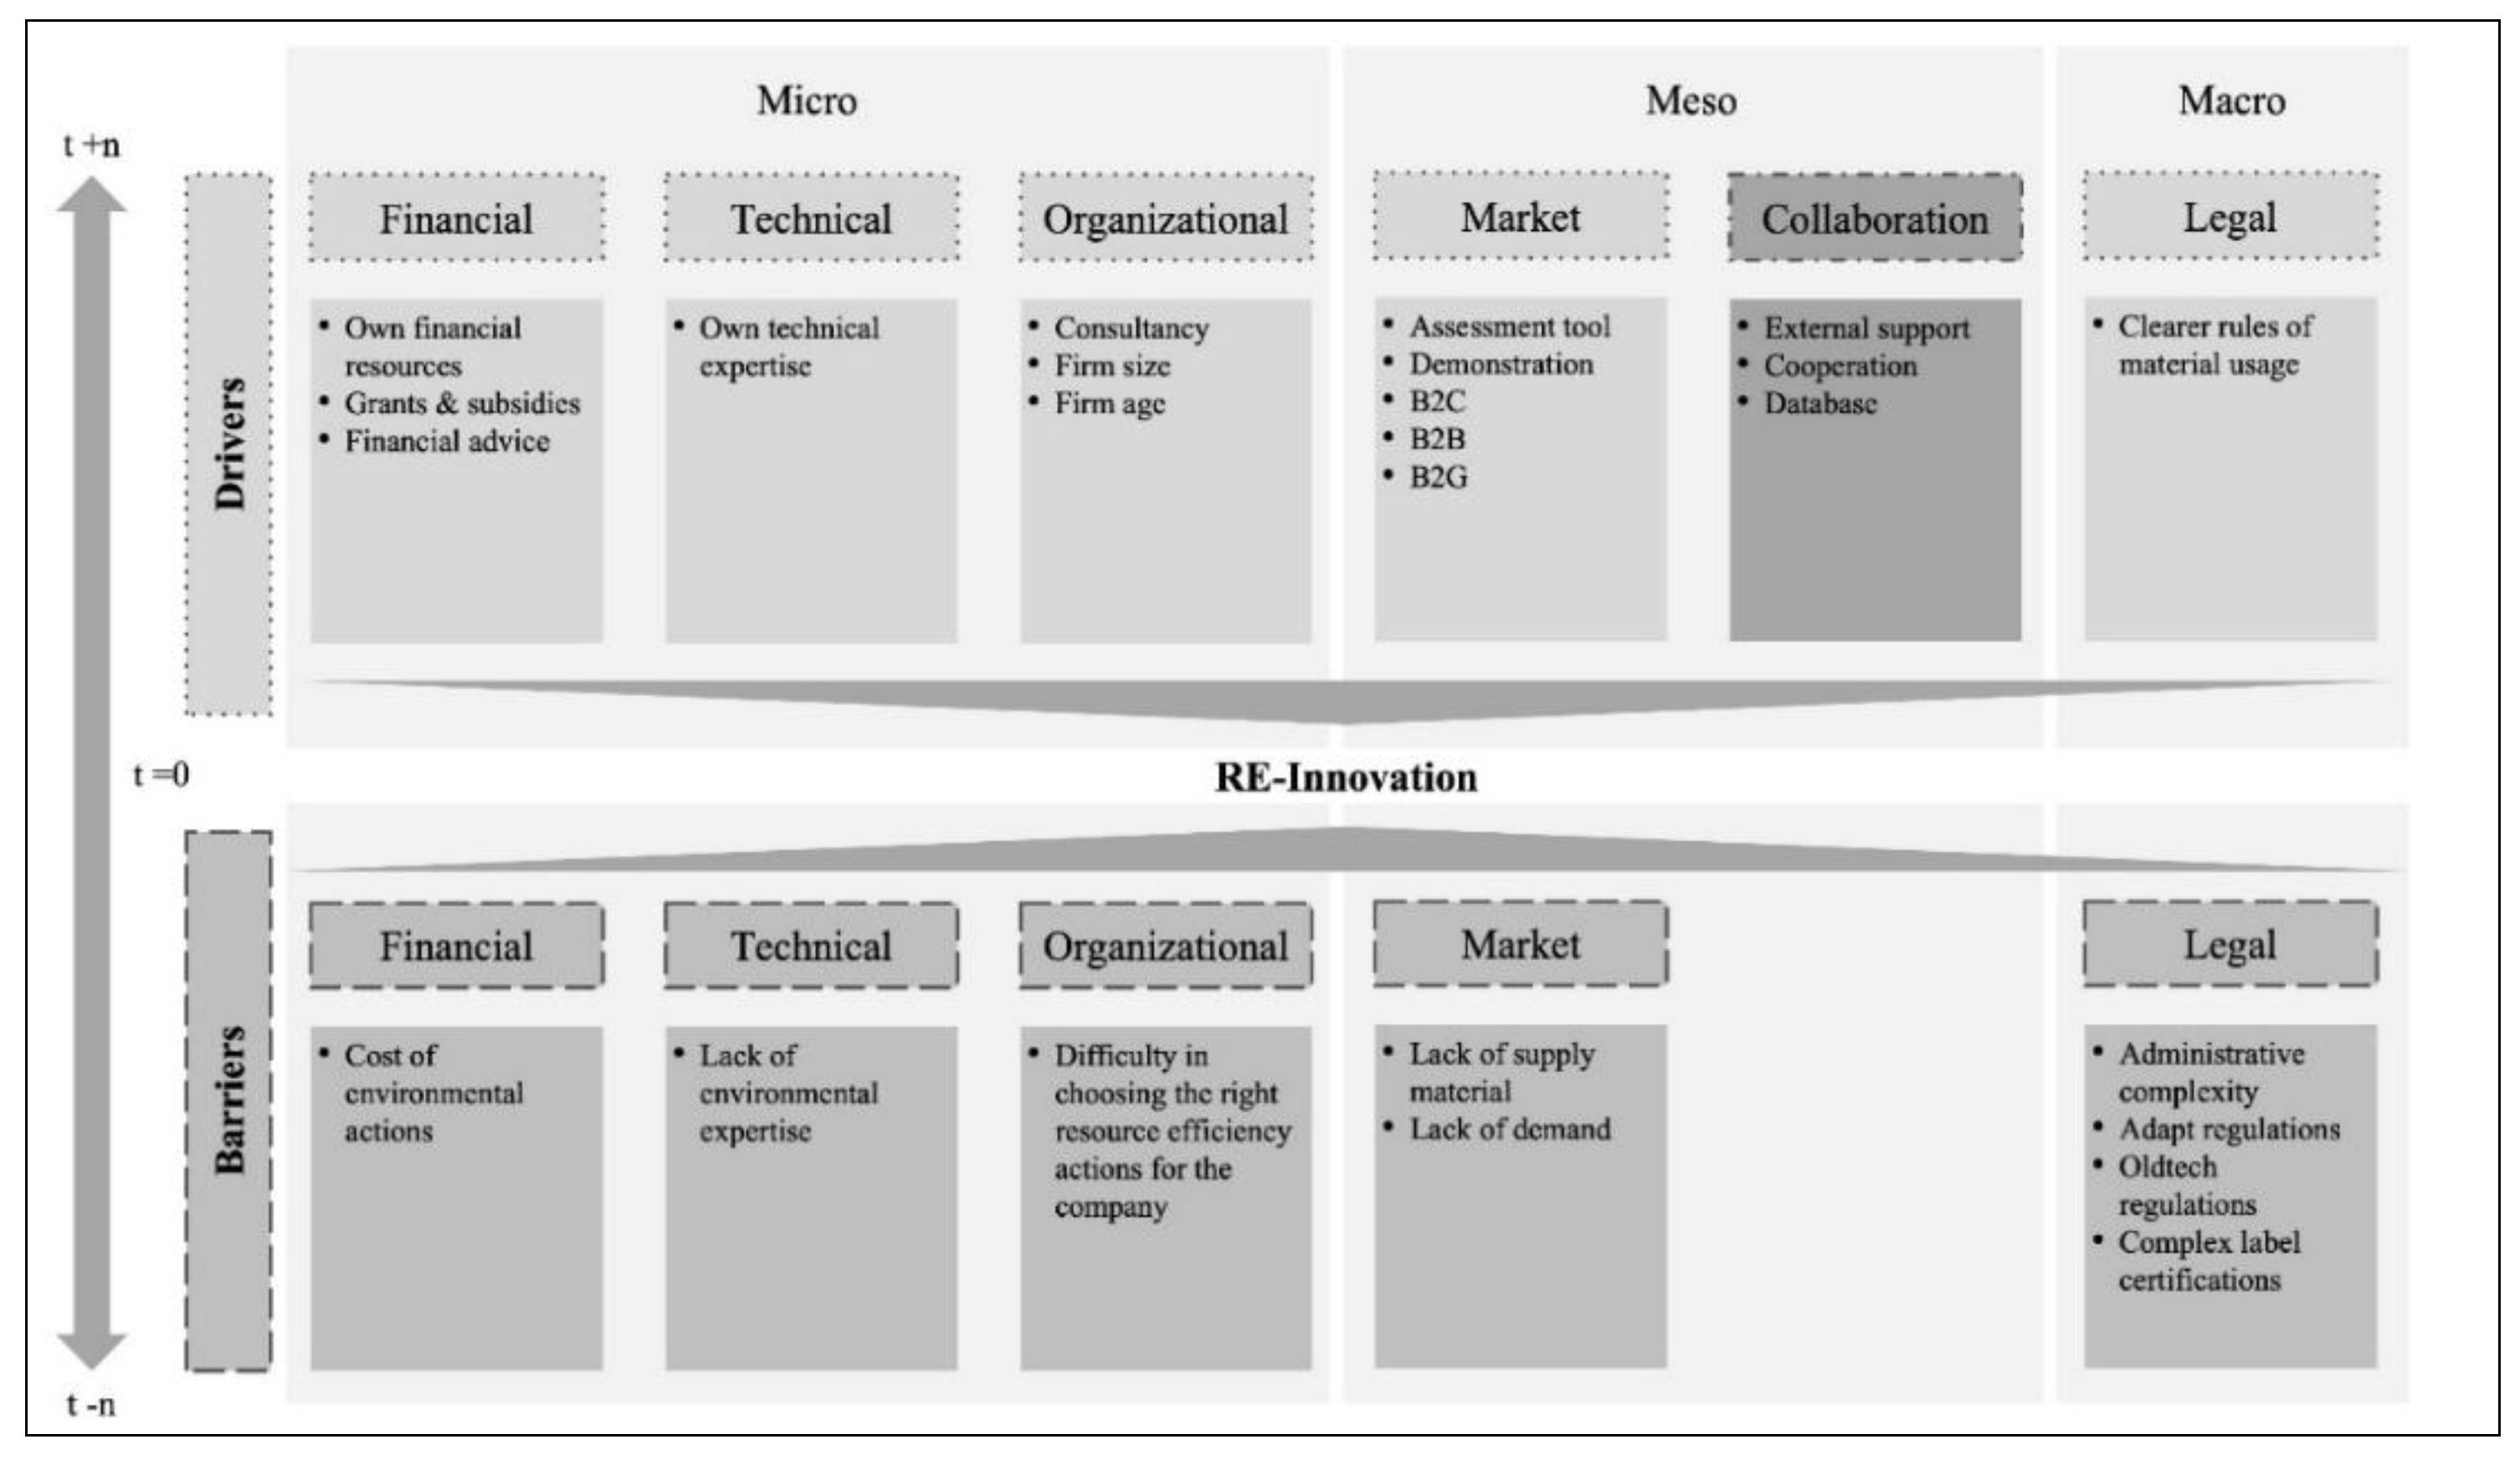
Figure 3.
Summary of results.
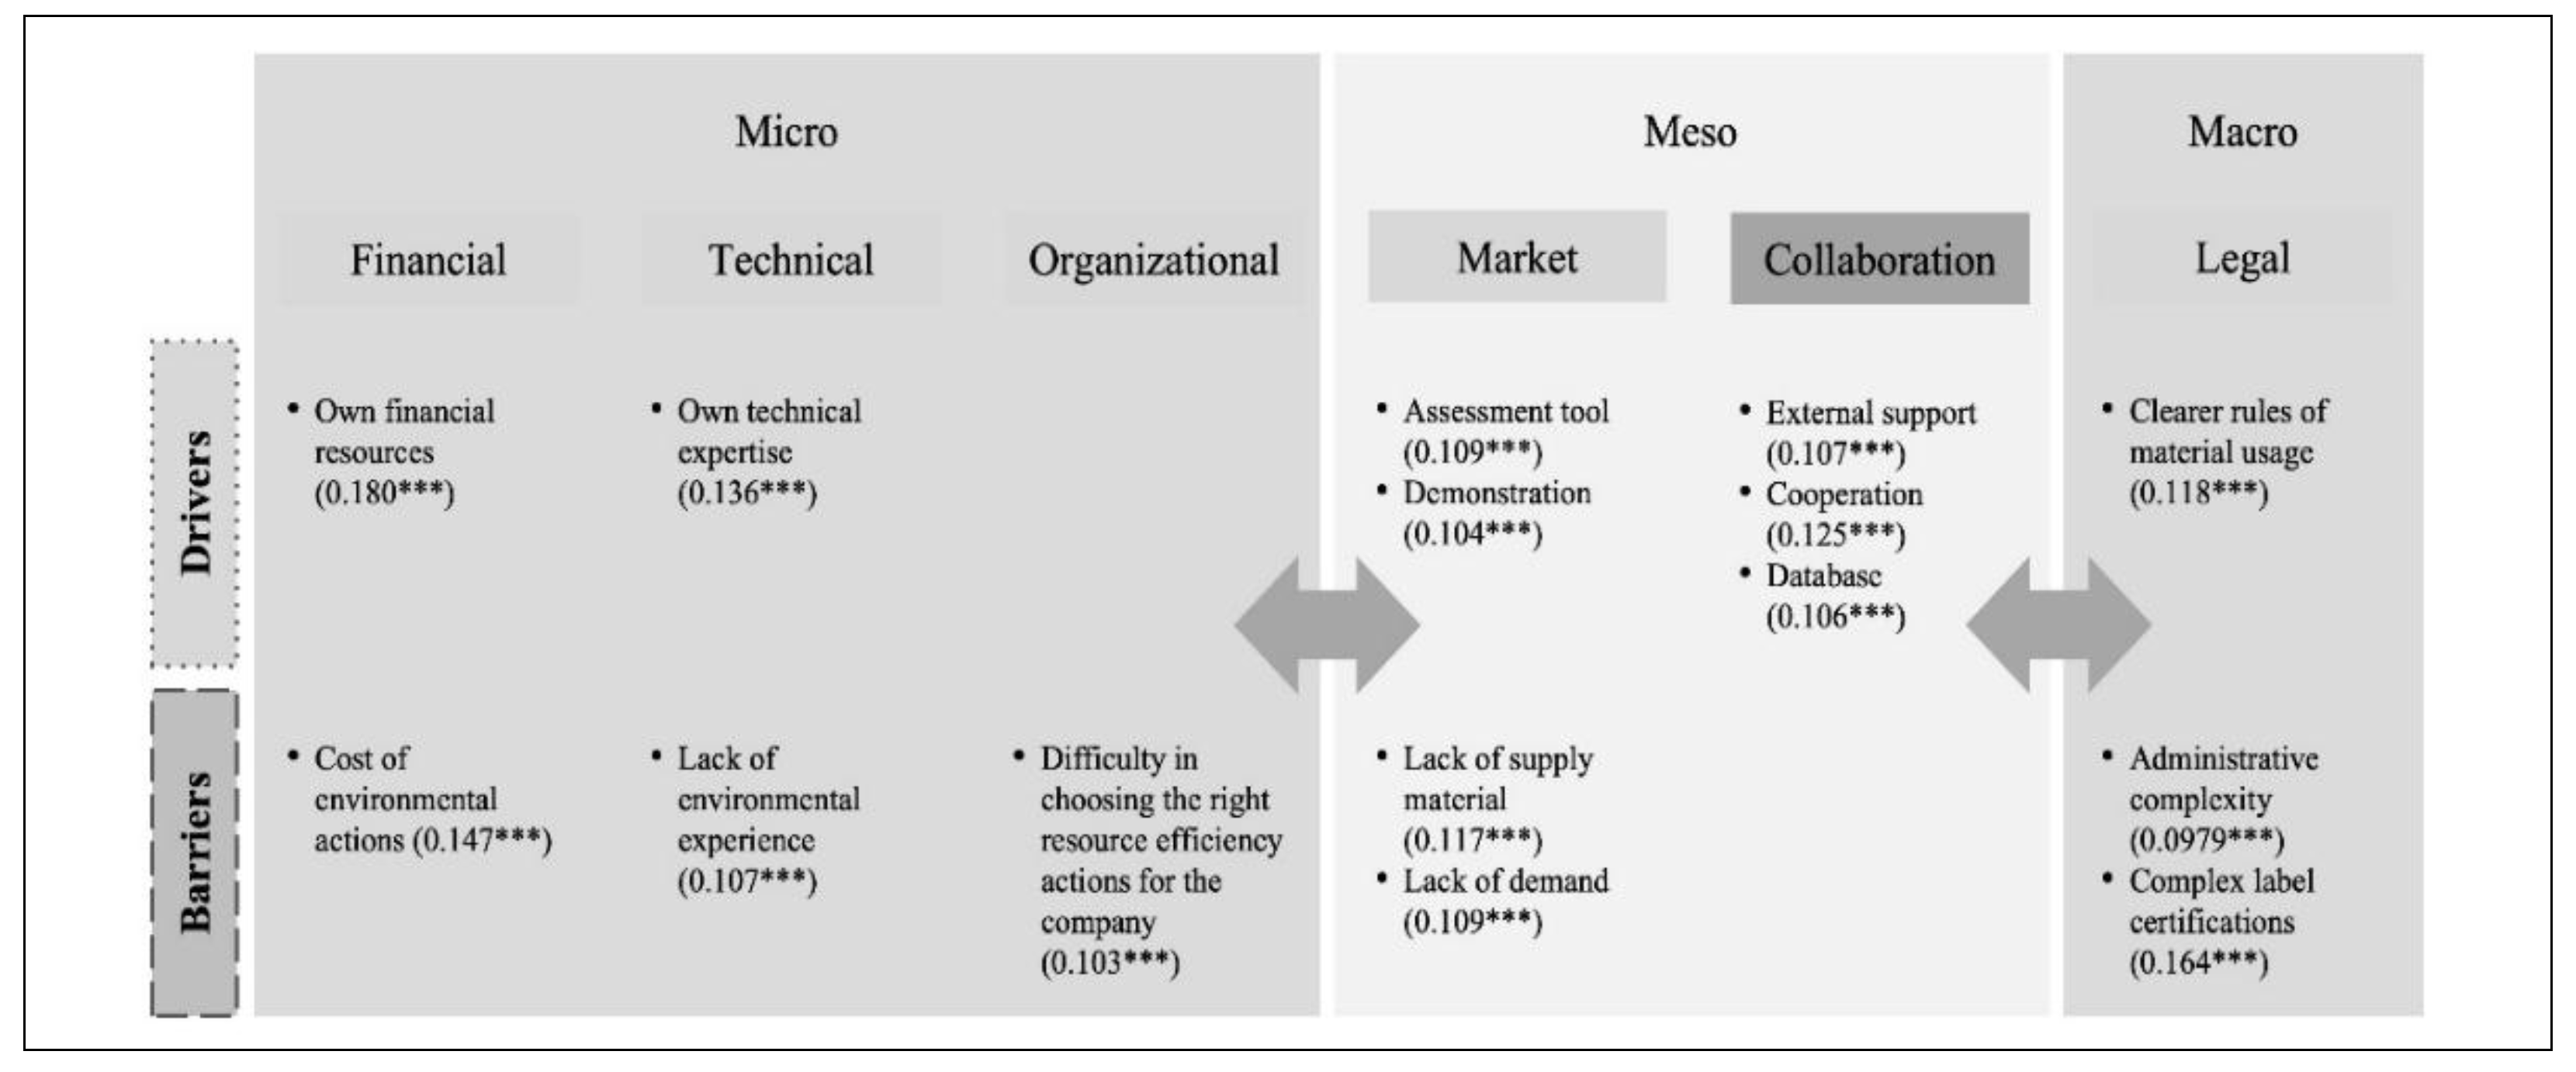
Table 1.
Specific drivers and barriers of REI framework.
| Level | Category | Drivers | Barriers |
| Micro | Financial | direct financial support, incentives, and investments in RE, encouragement due to subsidies or financial advice [19,61] | costs of environmental investments, especially if managers are not well-informed [52] |
| Technical | technical expertise within organizations[49,56,57] | lack of environmental expertise [18,52] | |
| Organizational | consultancy services can help reduce/overcome knowledge barriers[65] firm size and firm age are relevant because larger and older organizations usually have a greater innovation capability due to more resources [38,49,56,58] successful innovations need to be accepted by the market and its Business-to-Consumer (B2C), Business-to-Business (B2B), and Business-to-Government (B2G); [47,66] different stakeholder pressures as a motivator for organizational improvement, which can become a competitive advantage[30,41] |
difficulty of deciding on strategic RE actions, such as the internal skill development strategy or circularity strategy[9,55] |
|
| Meso | Market | lifecycle assessment tools [89] and demonstrations like demonstration sites to test in real-life settings [90] may help organizations understand their level of RE. |
lack of demand[27,49,56] lack and complexity of biodegradable supply material [9] |
| Collaboration | multidisciplinary and cross-sectoral collaboration as a driver for innovation in general [55,67], and specifically regarding EI [49,53] external support as an overarching form of support that focuses on inter-organizational relationships1[44] the database acts as a common ground of shared knowledge and information [46]. |
||
| Macro | Legal | claims such as the “Supply Chain Act” which demonstrate the role of the EU in striving more towards RE since they implement new rules [93] e.g., the rules of material usage and recycling should be clear for all stakeholders[27,49]. | high administrative complexity or when the technical requirements of legislation are not up to date [21,56] independent labeling and certification |
Table 4.
Logit Results – Barriers.
| (1) | (2) | (3) | (4) | |
| VARIABLES | Full Model | Robust | Marginal Effects |
Robust Marginal Effects |
| Micro Level Financial Category | ||||
|
ENV COST |
0.727*** | 0.928*** | 0.117*** | 0.147*** |
| (0.0619) | (0.0935) | (0.00977) | (0.0146) | |
| Micro Level Technical Category | ||||
| LACKING ENVEXP | 0.493*** | 0.672*** | 0.0794*** | 0.107*** |
| (0.0691) | (0.108) | (0.0110) | (0.0171) | |
| Micro Level Organizational Category | ||||
|
DIFF ACTIONCHOICE |
0.468*** | 0.647*** | 0.0754*** | 0.103*** |
| (0.0697) | (0.105) | (0.0112) | (0.0167) | |
| Meso Level Market Category | ||||
| LACKING SUPPLYMATER | 0.578*** | 0.739*** | 0.0931*** | 0.117*** |
| (0.0607) | (0.0844) | (0.00963) | (0.0132) | |
| LACKING DEMAND | 0.437*** | 0.687*** | 0.0704*** | 0.109*** |
| (0.0722) | (0.112) | (0.0115) | (0.0176) | |
| Macro Level Legal Category | ||||
| ADMIN COMPLEX | 0.481*** | 0.616*** | 0.0775*** | 0.0979*** |
| (0.0578) | (0.0808) | (0.00921) | (0.0127) | |
| ADPT REGULATIONS | 0.150** | 0.243** | 0.0242** | 0.0385** |
| (0.0699) | (0.110) | (0.0113) | (0.0174) | |
| OLDTECH REGULATIONS | 0.291*** | 0.329*** | 0.0469*** | 0.0523*** |
| (0.0725) | (0.0734) | (0.0117) | (0.0116) | |
| COMPLEX LABEL CERT | 0.550*** | 1.034*** | 0.0886*** | 0.164*** |
| (0.0762) | (0.134) | (0.0122) |
(0.0212) |
|
|
FIRMSIZE |
0.489*** | 0.477*** | 0.0788*** | 0.0758*** |
| (0.0566) | (0.0574) | (0.00901) | (0.00903) | |
| FIRMAGE | 0.108* | 0.101* | 0.0174* | 0.0160* |
| (0.0575) | (0.0583) | (0.00927) | (0.00925) | |
| MANU | 0.528*** | 0.523*** | 0.0851*** | 0.0830*** |
| (0.0712) | (0.0721) | (0.0114) | (0.0113) | |
| RETAIL | 0.0638 | 0.0663 | 0.0103 | 0.0105 |
| (0.0622) | (0.0629) | (0.0100) | (0.00998) | |
| SERV | -0.0578 | -0.0525 | -0.00932 | -0.00834 |
| (0.0600) | (0.0609) | (0.00967) | (0.00968) | |
| o.IND | - | - | - | - |
| B2C | 0.185*** | 0.187*** | 0.0298*** | 0.0297*** |
| (0.0505) | (0.0511) | (0.00812) | (0.00810) | |
| B2B | 0.180*** | 0.180*** | 0.0289*** | 0.0286*** |
| (0.0560) | (0.0567) | (0.00901) | (0.00899) | |
| B2G | 0.234*** | 0.239*** | 0.0377*** | 0.0379*** |
| (0.0519) | (0.0524) | (0.00835) |
(0.00832) |
|
| (0.189) | ||||
| Constant | -0.588*** | -0.696*** | ||
| (0.115) | (0.117) | |||
| Observations | 13,073 | 13,073 | 13,073 | 13,073 |
| Country FE | YES | YES | YES | YES |
| Interactions | YES | YES | ||
| Pseudo-R-squared | 0.194 | 0.200 | ||
| Log-likelihood |
-6325 | -6274 | ||
| Robust standard errors in parentheses | ||||
| *** p<0.01, ** p<0.05, * p<0.1 |
Table 5.
Interaction Analysis – Only Statistically Significant Results.
| Full driver model & per variable Interactions a, b |
Full driver model & all interactions c |
||||||
|
VARIABLES |
(1) Logit Estimates |
(2) Marginal Effects |
(3) Logit Estimates |
(4) Marginal Effects |
|||
|
ASSESMENT_TOOL x FIRMSIZE |
-0.358** (0.174) |
-0.0531** (0.0257) |
-0.348** (0.175) |
-0.0502** (0.0252) |
|||
| DEMONSTRATION x FINANCIAL RES. |
-0.288** (0.112) |
-0.0426** (0.0166) |
-0.230** (0.116) |
-0.0333** (0.0167) |
|||
| DEMONSTRATION x GRANTS_SUB. |
0.291** (0.115) |
0.0430** (0.0170) |
0.295** (0.117) |
0.0426** (0.0169) |
|||
| B2B x TECHNICAL EXPERTISE |
0.246** (0.109) |
0.0365** (0.0162) |
0.235* (0.128) |
0.0339* (0.0184) |
|||
| EXTERNAL SUP. x FINANCIAL RES. |
-0.929*** (0.125) |
-0.135*** (0.0179) |
-0.921*** (0.126) |
-0.133*** (0.0181) |
|||
| EXTERNAL SUP. x TECHNICAL EXP. |
-0.903*** (0.125) |
-0.131*** (0.0181) |
-0.902*** (0.127) |
-0.130*** (0.0182) |
|||
| DATABASE x TECHNICAL EXP. |
-0.276** (0.137) |
-0.0409** (0.0203) |
-0.265** (0.141) |
-0.0382* (0.0203) |
|||
| COOPERATION x CONSULTANCY |
0.361** (0.144) |
0.0535** (0.0213) |
0.373** (0.147) |
0.0538** (0.0211) |
|||
| COOPERATION x REUSE_RULES |
0.334** (0.155) |
0.0495** (0.0229) |
0.331** (0.158) |
0.0478** (0.0228) |
|||
| Constant |
-2.509*** (0.231) |
||||||
| Observations | 13,073 | 13,073 | 13,073 | 13,073 | |||
| Country FE | YES | YES | YES | YES | |||
| Pseudo-R-squared | 0.266 | ||||||
| Log-likelihood |
-5473 | ||||||
| Robust standard errors in parentheses *** p<0.01, ** p<0.05, * p<0.1 (a) Based on the driver model, for brevity, the results report only statistically significant interaction effects between meso variables and both macro- and micro variables in both b) and c). (b) Derived from a specification that includes the driver model and the interaction of a single variable (e.g., Assessment Tool) with macro and micro variables. (c) The full model extends the previous specification by including interactions among all variables simultaneously, thereby demonstrating robustness. | |||||||
Disclaimer/Publisher’s Note: The statements, opinions and data contained in all publications are solely those of the individual author(s) and contributor(s) and not of MDPI and/or the editor(s). MDPI and/or the editor(s) disclaim responsibility for any injury to people or property resulting from any ideas, methods, instructions or products referred to in the content. |
© 2026 by the authors. Licensee MDPI, Basel, Switzerland. This article is an open access article distributed under the terms and conditions of the Creative Commons Attribution (CC BY) license (http://creativecommons.org/licenses/by/4.0/).
Copyright: This open access article is published under a Creative Commons CC BY 4.0 license, which permit the free download, distribution, and reuse, provided that the author and preprint are cited in any reuse.


