
Submitted:
26 February 2026
Posted:
27 February 2026
You are already at the latest version
Abstract
This article presents results of hydrological research on the Ruda River, which is the largest tributary of the Cetina River situated in the Dinaric karst of Croatia. Hydrology of this river has been substantially altered after the construction of the Orlovac Hydropower Plant (HP) and the Buško Blato reservoir in 1973. The main aim of research was generation of new knowledge about the hydrological functioning of the river, where the focus was on the discharge and water temperature regimes that experienced most severe alterations. The methodology is based on classical hydrological, statistical, and time series analysis methods adapted to particularities of study area and available data. Daily and hourly time series of air temperature, precipitation, water temperature, and discharge are analyzed to find trends, change points, inter-annual, seasonal, and sub-daily variations, durations, time shifts, and linear dependencies. The obtained results provide information on effects of climate change, duration of diffuse, conduit, and mixed flow, importance of groundwater exchange, retention times, heat transfer times, referent water temperatures. It determined the role of operational mode of the Orlovac HP in the discharge from spring, inter-annual and sub-annual redistribution of water, hydropeaking, and thermopeaking. The obtained information defines the present state of Ruda River hydrology and illustrates alterations.
Keywords:
karst hydrology
; Ruda River
; time series analysis
; river temperature
; hydropeaking
; karst spring discharge
1. Introduction
The basic characteristic of karst is the existence of underground voids in limestone/dolomite rock mass. Karst underground voids are subsurface cavities formed primarily by the dissolution of soluble rocks (limestone, dolomite, gypsum, or salt). Following standard karst geomorphology and hydrogeology literature [1,2,3,4,5], the classification of karst underground voids can be approached by origin, geometry and morphology, hydrogeological function, and scale. From the standpoint of groundwater circulation, most important thing is scale. The scale implies a size-based classification where four types of voids are distinguished: (1) microvoids (dissolved pores and microfractures, < 1 mm), (2) mesovoids (enlarged fractures and small fissures, 1 mm – 10 cm), (3) macrovoids (conduits, channels and small caves, 10 cm – 10 m), and (4) megavoids (large, interconnected cave networks > 10 m). The size is controlled by lithology (solubility and purity of rock mass), structural geology (presence of faults, bedding and joints), hydrology (recharge type, base level and flow regime), chemical factors (concentration of CO2 and acids in water), and climate. The size, geometry, and connectivity of voids directly control how groundwater flows, stores, and responds within the karst aquifer [6,7], so it defines the shape of karst spring hydrographs [8]. Diffuse, conduit and mixed flow through the karst aquifer can be distinguished [9,10,11,12]. The diffuse flow occurs in small voids such as microvoids so dominates in poorly developed or low-karstification zones (e.g., dolomitic terrains). It is slow, laminar flow following Darcy’s law. Recharge is diffuse, spread over a wide area. On a karst spring hydrograph, diffuse flow has several characteristic manifestations related to timing, shape, and behavior of baseflow recession. Diffuse flow dominance is shown by smooth rising limbs, moderate and broad peaks, long and gentle recessions, stable baseflow, and low flashiness. During recession period, temperature and chemistry of spring water are stable implying long residence time. The conduit flow is turbulent flow dominated by gravity and pressure gradients that occur in macrovoids. In addition to diffuse recharge through microvoids, conduit flow is formed also by concentrated recharge through vertical shafts. These voids drain the system quickly after recharge events, producing flashy hydrographs at karst springs. Hydraulic response to rainfall is fast, with short residence time so temperature and chemistry of spring water are unstable. The mixed flow exists in mesovoids with highly variable hydraulic conductivity depending on fracture and fissure density, aperture, and connectivity, where water flows through a combination of laminar and transitional regimes.
Consequently, water temperature is a valuable natural tracer of groundwater circulation and residence time in karst systems [13,14,15]. Stable temperature of karst spring water denotes long residence of infiltrated rainwater in underground karst system. Sudden temperature changes produced by influx of surface rainwater or stream denotes short residence time. Karst spring water temperature helps infer recharge events, flow path lengths, velocity, and connectivity between groundwater and spring [16,17,18,19,20]. Namely, infiltrating water often has different temperatures than aquifer water, leading to drops or rises in spring temperature during and after rainfall events. Along the flow path within a karst conduit, the thermal signal is changed by mixing, heat exchange, and storage effects, so temperature patterns provide spatial information on flow path length, conduit geometry, and exchange zones. Longer flow paths, contact with rock, and hyporheic zones reduce amplitude of temperature changes and introduce lags [21,22,23,24,25,26]. If water moves rapidly in large conduits, channels and caves temperature fluctuations will be large and rapid because of little contact between rock and water. If water flows slower through fractures, small fissures, dissolved pores and microfractures, there is more contact so temperature variations will be damp and delayed. Amplitude of temperature changes and how quickly it responds to recharge and discharge events can give clues about storage, mixing, and residence time. For example: narrow range of temperature implies well-mixed flow or long-residence time. Even in karst springs with relatively stable mean temperature, careful time-series analysis of temperature can yield insights into aquifer behavior, recharge dynamics and mixing processes [27,28]. Downstream of the karst spring, the water-temperature regime of karst rivers is under the influence of complex heat-exchange process with riverbeds and atmosphere [29]. However, this regime usually is mostly defined by temperature of tributaries and unfortunately anthropogenic inflows, such as wastewater, dam releases and diversions [30,31].
The subject of interest of this paper is the Ruda River located in Croatia, which is characterized by its unique ecological dynamics strongly influenced by anthropogenic factors and karst hydrology. During the last few decades, investigations on this river have been focused on biological and ecological problems. Biological monitoring and physical and chemical spot measurements have been conducted as part of multi-river karst surveys and focused faunal studies. Major studies sampled macroinvertebrates, selected physical and chemical parameters, caddisflies, mayflies and freshwater snails at multiple sites and seasons, producing community and water-quality snapshots rather than long continuous records [32,33,34]. Research on the Ruda River and its catchment highlights ecological sensitivity of karst tributaries and biological responses to flow alteration and local habitat change. Studies show that regulation and direct hydrological alterations can reduce diversity at directly affected sites while lateral springs and karst connectivity can buffer impacts in other reaches [35]. The Ruda is an interesting example of karst river which shows that despite flow regulation the overall species richness and diversity can still be large. The existing research provided good biological baseline data but lacks an integrated systematic assessment of hydrology, which is critical for understanding the karst water system, ensuring safe water supply, protecting ecosystem, and managing sustainably. This paper presents results of hydrological research on the Ruda River based on available data and information. The main aim was the generation of new knowledge about the hydrological functioning of the Ruda River, where the focus was on discharge and water temperature regimes that experienced severe anthropogenic alterations. The methodology used includes classical hydrological and statistical methods as well as methods of time series analysis that, to the best of our knowledge, have not been applied yet in a form like the one presented here.
2. Materials and Methods
2.1. Study Area
The Ruda River is the largest tributary of the Cetina River, which lies in Middle Dalmatia, Croatia (Figure 1). The Ruda Spring is located at the bottom of Kamešnica Mountain at approximate elevation of 298–302.5 m a. s. l. The catchment is set within the Dinaric karst, where conduit and fissure flow in carbonate aquifers produce springs that feed surface streams and create strong groundwater–surface water coupling. It is part of a complex karst hydrological system influenced by groundwater flows, ponors, and subsurface connections [36,37,38,39,40]. It is composed of thick Mesozoic carbonate rocks (limestones and dolomites) with high secondary porosity caused by fracturing and karstification. Dominant lithology is Cretaceous and Jurassic limestones, locally interbedded with dolomitic layers. These rocks are highly permeable due to intense tectonic faulting and dissolution. There are many faults and fractures, forming preferential groundwater flow paths toward the Ruda Spring. Impermeable flysch deposits occur locally, acting as hydrogeological barriers that guide groundwater toward spring zones. Consequently, the aquifer feeding the Ruda Spring is a karst aquifer with conduit and fissure flow. Due to the karstic nature of the terrain, the hydraulic connectivity between surface and subsurface waters is strong and rapid, leading to fast groundwater responses to rainfall events.
Human impacts and hydrological changes are strong, so spring and river function under a substantially altered hydrological regime. The Ruda Spring is vital source of freshwater. Allowed abstraction is 540 l/s or 8,000,000 m3 per year. Actual abstraction is approximately 4,500,000 m3 per year. Before the 1970s, the discharge from spring was controlled by natural karst hydrology, fed by underground aquifers and precipitation cycles. The spring was fed by the water from ponors found in Livanjsko Polje (Bosnia and Herzegovina) and by the infiltrated water from higher karst plateaus of the Kamešnica Mountain. After the Buško Blato reservoir started to work in 1973, significant alterations in natural spring discharge and river flow were seen. The Buško Blato reservoir has an active storage of 786 × 106 m3, with an average level of 716.4 m a. s. l. Water from the Buško Blato reservoir is diverted through the Lipa reservoir and then used for hydropower generation in the Orlovac Hydropower Plant (HP) in Croatia. The Lipa reservoir is situated at 700 m a. s. l., and its capacity is 1.6 million m3. It serves also as a compensation reservoir into which the canal system brings one-day inflows from the Livanjsko Polje. From there, through a 12,100 m long tunnel beneath the Kamešnica Mountain, the water is conveyed to the Orlovac HP. During the rainy period, when the inflow exceeds consumption requirements of the Orlovac HP, the Lipa reservoir fills up, and the surplus water is pumped by a pumping station into the Buško Blato reservoir [41]. Installed capacity of this high-pressure underground hydropower plant is 237 MW, hydraulic head 380 m, and average annual electricity production is approximately 800 GWh. Installed discharge through turbines is 70 m3/s [42]. After being used for power generation, this water is discharged via an open channel into the Ruda River, approximately 1.2 km downstream from the spring. Consequently, Ruda’s flow regime is now mostly artificial, as it receives water primarily from hydropower operations rather than from its natural karst sources. Practically, construction of the Buško Blato and Lipa reservoirs, and operation of the Orlovac HP, have transformed the Ruda River into an engineered discharge outlet, affecting the natural balance and ecological health of the karst river. The artificial regulation decreased natural flow variability (less difference between wet and dry periods), altered temperature and sediment regimes, and reduced ecological connectivity along the river system.
2.2. Available Time Series
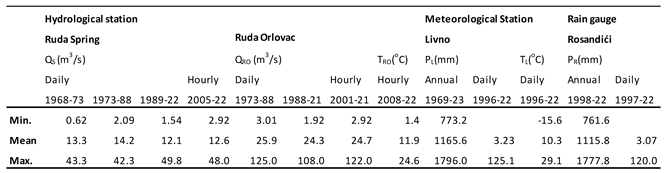
Information about precipitations and air temperatures on the catchment of Ruda Spring are obtained from the daily time series collected at the Livno Meteorological Station (MS) located in the Livanjsko Polje and the Rosandići Rain Gauge (RG) situated at the foothills of the Kamešnica Mountain (Figure 1). Information about daily and hourly discharges is obtained from three hydrological stations situated in the wider area of the Ruda Spring: Ruda 1, Ruda Kanal, and Ruda Orlovac (Figure 2). Discharges from the spring are calculated as sum of discharges measured at the hydrological stations Ruda 1 and Ruda Kanal. Cumulative inflows and losses along the segment of river from the Ruda Spring to the Ruda Orlovac Hydrological Station (HS) are represented by differences between measured discharges at the Ruda Orlovac HS and calculated discharges for the Ruda Spring. It should be noted that cumulative inflows and losses are dominantly generated by discharges from the Orlovac HP. However, there are intervals in time series when the discharge at Ruda Orlovac HE is lower than the discharge from Ruda Spring, which denotes the existence of losses at this segment of the river. They are registered during non-operational periods of Orlovac HP. Continuous monitoring of water temperatures is performed only at Ruda Orlovac HS. Basic statistical characteristics of observed air temperatures, precipitations, discharges, and water temperatures are presented in Table 1, including periods of monitoring, analyzed time steps, minimal and maximal registered values, and means.
2.3. Methods
Let and represent two analyzed time series or two sets of measured data that have means , , standard deviations , , and covariance [43].
Values of Duration Curve (DC) of time series are estimated by using an empirical cumulative distribution:
Values of Moving Average (MA) filter of time series for a window size are calculated by following expression:
The Pearson correlation coefficient between time series and is [43]:
Linear Regression (LR) between and is defined by:
where is slope, intercept, and residuals. Parameters of line, and , are determined by minimizing the sum of squared residuals. Goodness of fit of LR is estimated by a coefficient of determination , where . Statistical significance of is evaluated for level by using statistics [46]:
that follows a t-distribution with degree of freedom .
Let represent covariance between time series , and , and let represent covariance between time series and , where . Values of the Pearson Cross-Correlation Function (CCF) between time series and at lag is defined as (Box and Jenkins, 2008):
3. Results
Analyzed time series are precipitations from Livno MS (PL), precipitations from Rosandići RG (PR), air temperatures from Livno MS (TL), water temperatures from the Ruda Orlovac HS (TRO), discharges from the Ruda Spring (QS), discharges from the Ruda Orlovac HS (QRO), and inflows/losses (QIL) standing for discharges from the Orlovac HP. Mean, maximal, and minimal values for each year are presented in Figure 3. Homogeneity of time series was controlled by using the Levene test (Brown-Forsythe version) for variances, the independent t-test for means, and the Wilcoxon test for trends [46,47,48]. Results show that annual precipitations PL and PR are similar (Figure 3a), but they have a wide range from 761 to 1796 mm. Air temperatures from the Livno MS (Figure 3b) and discharges from the Ruda Spring (Figure 3c) are inhomogeneous. Annual air temperatures TL have an upward trend, where the increase is approximately 1 °C in 20 years. Annual discharges QS have a mean shift in 1988. Namely, the mean annual discharge from Ruda Spring during period 1973-1988 was 14.2 m3/s. During period 1989–2022, it was 12.1 m3/s. The mean shift coincides with the beginning operation of Đale HP situated about 12 km downstream from the spring. Figure 3e presents also results of application of MA filter to annual discharges QIL. Results describe inter-annual variations in intensity of operation of the Orlovac HP in the form of five-years means (size of window in Equation 2). Period of the most intensive operation of the Orlovac HP was 1977–1981 with five-years mean of 19.2 m3/s. Period of the lowest intensity was 1984–1988 with five-years mean of only 7.9 m3/s.
RAPS of annual precipitations PL, and annual discharges QRO, QS, and QIL, are compared in Figure 4. Upward or positive trends in RAPS are periods with values mostly above average. Downward or negative trends are periods with values mostly below average. Sharp change in direction denotes possible regime shift. Maximum or minimum point is potential change-point location. It can be noted that inter-annual variations in annual discharges QRO generally have followed variations in annual precipitations PL during the entire period. On the other hand, two components of QRO (QS and QIL) had different behaviors. They both deviated from annual precipitations PL, especially during the period before 1988. The change point in year 1988 in RAPS(QS) is clear, which confirms inhomogeneity of annual discharges QS. Differences in variations between RAPS(QS) and other functions are most obvious for period 1983–1988, where only RAPS(QS) have positive trends. Concerning annual discharges QIL before 1988, RAPS(QIL) have positive trends for period 1973–1981, and negative trends after that. Comparing RAPS(QIL) in Figure 4 with results of MA filter in Figure 3e, it can be noted that positive trends in RAPS(QIL) coincide with the period of the most intensive operation of the Orlovac HP, from 1977 to 1981. After this period, the period of the lowest intensity operation is present, from 1984 to 1988, with negative trends in RAPS(QIL). It should be emphasized that negative trends in RAPS(QIL) coincide with positive trends in RAPS(QS) during this period, which shows that the decrease in annual discharges of the Orlovac HP generated the increase in annual discharges from the Ruda Spring.
DC of daily discharges QS for periods 1973–1988 and 1989–2022 are compared in Figure 5a. High-flow segment describes rapid conduit flow, direct recharge response, and flood dynamics. Steeper slope denotes more flashy system. In karst, it is usually very steep, which shows strong hydraulic connection and low attenuation. Middle segment describes mixed flow (conduit + fracture) and transitional storage release. Shape shows degree of internal regulation. Low-flow segment describes matrix drainage, long-term storage and drought behavior. If flat, it shows strong baseflow regulation. If steep, it shows limited matrix storage. The simplest approach to comparing DC is pointwise comparison at characteristic percentiles, P10 for high flows, P50 for mixed flows, and P90 for low flows. It can be noted that corresponding discharges for percentiles P10, P50 and P90 are higher for the first period. In Figure 5b, both DC are presented in log-normal probability plot. Using probability plot enhances visualization of extreme values, makes regime changes more visible, helps find statistical distribution, and simplifies comparison between datasets. Breaks in slope may suggest multiple storage compartments. For example, karst systems often activate conduits above certain recharge thresholds. On probability plot this appears as kink or inflection point or sudden slope increase. This may show overflow conduits, epiphreatic activation, or temporary spring connections. However, DC obtained for period 1989–2022 is rather linear, so almost the entire range of discharges can be approximated by log-normal distribution. Exceptions are only 1% highest values. DC obtained for period 1973–1988 has a more complex that reveals differences in functioning of the karst spring during two periods. The shape of DC for period 1973–1988 at probabilities between 0.1 and 0.99 shows that the karst aquifer of Ruda Spring during this period had more inflows. During both periods baseflow has been stable, which is a characteristic of permanent spring.
RAPS of daily time series including precipitations PL, discharges QS, QRO, QIL, water temperatures TRO, and air temperatures TL are compared in Figure 6. They cover time periods 1996–2021 (PL, QS, QRO, QIL) or 2009–2023 (TRO, TL) depending on comparison requirements and availability of daily data. Since daily time series are autocorrelated, seasonality, trends, and fluctuations are clear in all RAPS. Seasonality dominates in water temperatures and air temperatures, while in precipitations and discharges it is only an additional fluctuation that distorts inter-annual trends. In daily precipitations TL, three periods can be distinguished, 1996–2009, 2009–2015 and 2015–2021. The first period had below-average precipitations, so RAPS(PL) has generally negative trends. The second period had the most abundant precipitations, so trends are positive. These trends last until 2015 when they are changed again. The regime of daily discharges QS follows the regime of daily precipitations PL, so inter-annual variations in RAPS(QS) and RAPS(PL) are similar. However, due to retention of rainwater in karst aquifer, sub-annual fluctuations are attenuated, and seasonal variations are amplified, so change points in 2009 and 2015 are evident in RAPS(QS). Regime of daily discharges QIL is different in such a way that RAPS(QIL) is more uniform and without multi-year trends, so a change point does not exist. It is a consequence of Buško Blato reservoir, which enables multi-year regulation of discharges, so daily discharges QIL have been generated over the years mostly by electric power demands.
In Figure 6, it can be noted also that variations in RAPS(QS), RAPS(QIL) and RAPS(QRO) have a time delay from variations in RAPS(PL). The values of these delays are estimated by CCF between two RAPS as the time lag where CCF reaches its maximum. The obtained four CCF are presented in Figure 7. Time delay between RAPS(PL) and RAPS(QS) is an average retention time of rainwater in the karst aquifer of Ruda Spring, and it amounts to 68 days. Time delay between RAPS(PL) and RAPS(QIL) is an average retention time of rainwater that is used by the Orlovac HP. Because of effects of Buško Blato reservoir, this time is larger and amounts 92 days. As expected, the time delay between RAPS(PL) and RAPS(QRO) is between these two values and amounts 82 days. Considering effects of air temperatures on water temperatures, the obtained maximum in CCF(RAPS(TL), RAPS(TRO)) has the lowest value of all CCF presented, but it is still statistically significant confirming that air temperatures play a key role. Time delay of 16 days is an average time needed for the heat transfer from the air in Livanjsko Polje to the water in Ruda River by the system of open canals, two reservoirs, and the tunnel of Orlovac HP.
Effects of the Orlovac HP on discharges at the Ruda Orlovac HS are presented in a seasonal daily graph (Figure 8). It shows means as well as minimal and maximal registered discharges for each day of the year (1–365) at the Ruda Spring and the Ruda Orlovac HS during period 1989–2021. These curves show differences in spring and river peaks, summer low flows, autumn response of river and spring to rainfall, and winter baseflow conditions. The regime of river has been primarily defined by operation of HP Orlovac. Maximal daily discharges at the Ruda Orlovac HS were seen during spring months, April and May, up to 108 m3/s. Maximal discharges from Ruda Spring, up to 49.8 m3/s, were seen during autumn months, from October to December, which are most abundant with precipitation. Mean daily discharges have a similar seasonal regime as maximal. Ratio between mean daily discharges MEAN(QRO)/MEAN(QS) calculated for each day in the year range from 1.34 in September to even 3.00 in Jun. Ratio between maximal discharges MAX(QRO)/MAX(QS) goes up to 4.88 in July. The regime of minimal discharges has been changed the least, because these values are mostly registered during nonoperation of the Orlovac HP.
The water temperature regime of the river is influenced by the air temperature in Livanjsko Polje and the discharge from Orlovac HP. LR between monthly air temperatures TL and monthly water temperatures TRO is presented in Figure 9a. Linear dependence is clear and coefficient of determination is high. However, maximal influence is registered during winter and summer. LR between monthly discharges QIL and monthly water temperatures TRO for February and August are presented in Figure 9b. Values of two intercepts, 9.1 and 15.3 °C, represent average water temperatures for February and August at the Ruda Orlovac HS without effects of discharges from the Orlovac HP.
Concerning seasonal variations in daily air and water temperatures, Figure 10 shows mean values as well as minimal and maximal registered values for each day of the year at the Livno MS and the Ruda Orlovac HS during 2009–2022. Daily air temperatures have clear seasonality. In the coldest month, January, they ranged from -13 to 9 °C with a mean about 1 °C. In the warmest month, July, they were between 12 and 28 °C with a mean of about 22 °C. Irregular fluctuations are evident, especially at minimal values during winter period, from December to February, when air temperatures were between -13 and 1 °C. Two components, seasonal and fluctuations, are observable also in water temperatures, but both are attenuated because of heat capacity of water. During winter months, daily water temperatures ranged from 2 to 10 °C, whereas during summer they were from 12 to 24 °C. Minimal daily water temperatures in the coldest month, January, were between 2 and 4 °C. Maximal daily values were in July and August, between 20 and 24 °C.
Figure 11a and Figure 11b represent basic statistical characteristics of variations in hourly discharges QRO and hourly water temperatures TRO, respectively. Mean values, median, minimal and maximal registered values, as well as percentiles P5 and P95 for each hour of the day (1–24) are presented. The maximal hourly discharge QRO during the analyzed period was 122 m3/s. Two peaks in mean discharges, median values, and extreme high discharges P5 are clear, the first at 12 h and the second at 20 h. Since Orlovac HP often works in low operational mode during night hours, discharges at peak hours are more than twice as large as discharges at night hours. For example, ratios between discharges at 20 h and discharges at 3 h are 2.17, 2.46 and 2.12 for mean, median and P5, respectively. Similar two peaks are observable also in water temperatures, at 13 and 21h, most obviously in percentiles P95 and P5 (denoted as TRO_95 and TRO_5), showing strong interdependency between variations in discharges and water temperatures. Results reveal also that water temperature in some peak hours during winter can be as low as 0.4 °C, while during summer it can reach up to 25.9 °C.
Similarly, as for QRO in Figure 11a, characteristic values P5 and means for each hour in the day have been calculated also for hourly discharges QIL. The obtained series are denoted as QIL_5 and QIL_MEAN. LR between QIL_MEAN and TRO_95, QIL_MEAN and TRO_5, QIL_5 and TRO_95, QIL_5 and TRO_5, are presented in Figure 12. Values of coefficient of determination R2 are remarkably high, between 0.90 and 0.96. It shows that strong interdependences between hourly discharges from the Orlovac HP and hourly water temperatures at the Ruda Orlovac HS exist from average to extreme values of discharges. Intercepts for discharges QIL_MEAN (7.2 and 15.9 °C) and QIL_5 (7.5 and 15.2 °C) represent referent values for minimal and maximal water temperatures at the Ruda Orlovac HS without discharges from the Orlovac HP.
4. Discussion
The first step in analyses of time series was identification and explanation of trends and change points. Multiple hydrological and meteorological investigations have demonstrated statistically significant upward trends in air temperatures from meteorological stations in Croatia and Bosnia and Herzegovina [49,50,51,52]. The Livno MS is not an exception, so an upward trend exists. However, there is no statistical evidence that this upward trend in air temperatures in Livanjsko Polje has been reflected in regimes of precipitation on catchment, discharges from the Ruda Spring, or temperatures of the Ruda River.
Effects of hydropower plants on the River Cetina have been elaborated in several studies [37,39,40,42] including effects of the Đale HP on groundwater levels [53]. The mean shift in discharge from Ruda Spring registered in 1988 coincides with the beginning of operation of this hydropower plant. Results show that there was a difference between operation of the Orlovac HP before connection of the Đale HP to hydroelectric power system of the Cetina River and after connection, which most probably affected the functioning of Ruda Spring.
Differences in the functioning of Ruda Spring before and after 1988 were analyzed by using DC of daily discharges. DC is one of the most useful tools in the analysis of karst springs because it condenses long discharge time series into a form that clearly shows variability, regulation capacity, and extremes. DC allows comparison of different karst springs, same spring before and after engineering works, or natural vs. regulated regime [54,55,56]. Probability distributions are sometimes used to parameterize the relationship between discharges and exceeding probabilities, transforming the empirical DC into a continuous analytical function suitable for interpolation, extrapolation, and comparison. When presented in probability plot, DC becomes even more informative for interpreting karst aquifer behavior, so comparison is plainer [57]. In this study, log-normal distribution has been used. The results obtained revealed that DC from the period after 1988 can be approximated by this distribution in almost the entire range of probabilities, from 0.01 to 0.99, which indicates that the Ruda Spring had a relatively consistent functioning without multiple storage compartments (without activations some additional conduits above certain recharge thresholds, epiphreatic activations, temporary spring connections, activations of ponors, etc.). It is not case with the period before 1988, when DC had irregular form that cannot be approximated by any theoretical distribution. Comparison of DC from two periods revealed that DC from the period before 1988 had larger discharges at all segments, low flow, middle flow, and high flow, which implies the existence of continuous inflows during this period. Exceptions are only extreme values, high flows below probability of 0.01 and low flows above 0.99.
Small yet systematic changes over time are often hidden by the variability of data itself but sometimes they enclose particularly essential information [58,59]. RAPS is a statistical method used for detecting these changes in hydrological time series such as precipitation, river discharge, groundwater levels, and water temperature. RAPS visualizes cumulative deviations from the mean value, and thereby highlights change points, data clustering, long-term trends, irregular fluctuations, and periodicities in the time series. Most hydrological papers have applied RAPS to annual precipitation totals or annual mean discharges, because it provides the clearest signal of structural change [44,60,61,62]. Daily values are less proper for classical RAPS trend detection because of strong autocorrelation that produces fluctuations and seasonality. So, RAPS of daily data has been used much less often, for regime change analysis or event-based hydrology [63,64,65]. In this study, RAPS of daily precipitations and discharges were used for comparison of regimes and for estimation of retention times. Results show that inter-annual variations in discharges from Ruda Spring have followed variations in precipitations, while variations in discharges from the Orlovac HP have been more uniform, reflecting effects of water retention in Buško Blato Reservoir. It was noted that time delays between RAPS of precipitations and RAPS of discharges exist, which represent retention times. Average retention times for the entire period were estimated as lags with maximal correlation in CCF between RAPS of precipitations and RAPS of discharges. Because of rainwater retention in the Buško Blato Reservoir, the retention time of rainwater used by the Orlovac HP was 24 days longer than the retention time of rainwater in the karst aquifer of Ruda Spring. The average time needed for heat transfer from the air in Livanjsko Polje to the water in Ruda River was obtained in analogous way by using CCF between RAPS of air temperature and RAPS of water temperature. It shows that changes in the air temperature at the Livno MS have been recorded in the water temperature at the Ruda Orlovac HS after 16 days.
Seasonal effects of the Orlovac HP on the discharge regime of Ruda River were quantified by comparing seasonal daily graphs of the Ruda Spring and the Ruda Orlovac HS. Seasonal daily graphs presented mean values for each day of the year computed over entire observed period, as well as minimal and maximal values registered for each day. They removed inter-annual variability and highlighted the typical seasonal regimes comparing natural vs. regulated discharges. Results show that minimal discharges have increased, total volume of discharges has doubled, but maximal discharges have changed most significantly. They have increased by almost five times in summer months, and they have larger fluctuations due to irregular operation of the Orlovac HP.
The regime of river water temperature is under strong influence of the air temperature in Livanjsko Polje and the discharge from Orlovac HP. LR was used to confirm interdependence, establish linear relationships between variables, control level of statistical significance of relationships, and estimate referent water temperatures (water temperatures without discharges from the Orlovac HP). The established LR between monthly air temperatures at the Livno MS and monthly water temperatures at the Ruda Orlovac HS had coefficient of determination R2 about 0.84. LR between monthly discharges from the Orlovac HP and monthly water temperatures at the Ruda Orlovac HS for February and August had values 0.80 and 0.69, respectively. As result of this influence, the water temperature regime of the Ruda River was changed. Depending on discharges, monthly water temperatures may increase during summer, above 20 °C, and decrease during winter bellow 4 °C. On the other hand, two intercepts show that referent water temperatures for February and August were about 9.1 and 15.3 °C, respectively.
As well as discharges, seasonal variations in daily water temperatures at the Ruda Orlovac HS were also analyzed by seasonal daily graphs presenting mean values of temperatures for each day in the year computed over the entire observed period, and minimal and maximal temperatures registered for each day. Results show that minimal and maximal daily water temperatures come from less than 2 °C in January to above 24 °C in July. Mean values are 6 – 8 °C for winter days and 16 – 18 °C for summer days.
In addition to significant seasonal variations, large sub-daily variations in discharges at the Ruda Orlovac HS were also registered. Namely, discharges from the Orlovac HP have two peaks within the day, at 12 and 20 h, where the largest peak discharges are multiple times greater than minimum discharges in night hours. Ratios between discharges in peak hours and night hours go up to almost 30 for median values. Hourly variations in discharges at the Ruda Orlovac HS are typical for a river influenced by peaking hydropower plant. This plant works in a way that rapidly increases or decreases release to meet fluctuations in electricity demand (hydropeaking operational mode). Because of rapid start/stop cycles needed to match energy peak demand, it has highly variable water release with sub-daily changes and large amplitudes. This type of water release alters river systems in ways that can stress ecological and physical processes downstream by altering discharge and water temperature regimes [66,67]. Hydropeaking usually produces thermopeaking – rapid, short-term fluctuations in river water temperature caused by hydropower plant operations [68,69,70,71]. Consequently, strong interdependences between extreme discharges P5 from the Orlovac HP and extreme water temperatures P5 and P95 at the Ruda Orlovac HS were detected, and two peaks within the day in hourly water temperatures at the Ruda Orlovac HS were registered. These two peaks have a time delay of one hour from peaks in discharges. The time delay is a travel time of water from the Buško Blato reservoir to the Orlovac HP. Estimated referent hourly water temperatures were about 7 °C for winter period and 16 °C for summer, which is in accordance with field measurements. Namely, water temperatures measured during 2004 and 2005 about 100 m downstream from the Ruda Spring ranged from 6.8 °C in February to 16.9 °C in August, with average of 11.8 °C [35]. Hourly water temperatures measured at the Ruda Orlovac HS had much wider range, from 0.4 to 25.9 °C, which proves large alterations of temperature regime.
Despite large alterations of discharge and water temperature regime, the Ruda River still is a permanent karst stream with stable physical and chemical conditions. There is no continuous monitoring of the water quality of the Ruda River, but occasional spot measurements showed that physical and chemical characteristics are typical for karst rivers in Dalmatia, strongly influenced by the limestone geology and groundwater input [34]. pH values ranged from 7.45 to 8.55, showing mildly alkaline waters. Electrical conductivity ranged from 282 – 588 µS/cm, showing moderate mineralization. Alkalinity ranged from 140 – 215 mg/L CaCO3, classifying the water as moderately hard. Dissolved oxygen levels were high (10.4–15.5 mg/L), and oxygen saturation never dropped below 90%.
5. Conclusions
Discharge and water temperature regimes of Ruda River were investigated by using a methodology based on classical hydrological, statistical and time series analysis methods adapted to particularities of study area and available data. RAPS of annual data are used to compare inter-annual variations in precipitations and discharges, and to find change points. Differences in two operational periods of the Orlovac HP, before and after 1988, are clarified by MA filter. Empirical and analytical forms of DC of are used to (1) compare the regime of Ruda Spring before and after 1988, (2) detect the existence of groundwater interchange, and (3) obtain basic information about the duration of diffuse, conduit, and mixed flow at the spring. RAPS of daily data are used to compare regimes of precipitation, discharge, water temperature, and air temperature, where retention times and heat transfer times have been estimated by CCF between two RAPS. LR between extreme discharges P5 from the Orlovac HP and extreme water temperatures P5 and P95 at the Ruda Orlovac HS have been used to (1) confirm the direct interdependence between the discharge from hydropower plant and the river temperature, (2) establish relationships, and (3) estimate referent water temperatures for the Ruda Orlovac HS without discharges from the Orlovac HP. The results obtained advance existing knowledge about the hydrology of Ruda River.
Air temperatures on catchment have statistically significant trend, which is result of global climate change registered at meteorological stations in wider regions. Discharges from Ruda Spring have a mean shift in 1988, which coincides with the beginning of operation of Đale HP. This mean shift is a consequence of differences in operation of Orlovac HP before and after 1988, and it confirms that annual discharges from the spring depend on the operating mode of Orlovac HP.
After 1988, the karst aquifer of Ruda Spring has had persistent storage without significant gains or losses through interchange with neighboring catchments depending on groundwater levels, or gains through allogenic recharge. The Ruda Spring is a permanent karst spring with a stable baseflow and significant seasonal variations depending on recharge conditions. Average retention time of the rainwater is about 68 days.
The discharge regime of Ruda River has been under strong influence of the discharge from Orlovac HP. Discharges from Orlovac HP have been generated over the years mostly by electric power demands. Installed discharge is larger than maximal discharge seen at the spring. The maximal seen hourly discharge at the Ruda Orlovac HS was 122 m3/s, while the maximal discharge from the Ruda Spring during the same period was only 48 m3/s. Sub-annual redistribution of water exists from autumn to spring months. Sub-daily variations with two pronounced peaks at 12 and 20 h are typical for a river influenced by a peaking hydropower plant. Average retention time of the rainwater used by the Orlovac HP is about 92 days.
The water temperature regime of the Ruda River has been substantially altered. Depending on discharge, monthly water temperature ranges from bellow 4 °C during winter to above 20 °C during summer. In addition to seasonal variations, hydropeaking produced thermopeaking so there are two peaks in sub-daily variations of water temperature. Since the water from Buško Blato reservoir needs time to reach the Orlovac HP, these two peaks have a time delay of about one hour from peaks in discharge. Hourly temperatures seen at the Ruda Orlovac HS ranged from 0.4 to 25.9 °C. Without discharges from the Orlovac HP, water temperatures would range from about 7 °C to about 16 °C. Changes in the air temperature in Livanjsko Polje are observable in the river water temperature after 16 days.
Author Contributions
Conceptualization, D.J. and V.D.J.; methodology, D.J.; software, D.J.; validation, D.J. and V.D.J.; formal analysis, D.J. and V.D.J.; investigation, D.J.; resources, D.J. and V.D.J.; data curation, V.D.J.; writing—original draft preparation, D.J. and V.D.J.; writing—review and editing, D.J. and V.D.J.; visualization, D.J.; supervision, D.J. and V.D.J.; project administration, V.D.J.; funding acquisition, D.J. and V.D.J. All authors have read and agreed to the published version of the manuscript.
Funding
This research received no external funding.
Data Availability Statement
The data presented in this study are available on request from Croatian Meteorological and Hydrological Service, Croatian Waters, and Federal Hydrometeorological Institute of Bosnia and Herzegovina.
Acknowledgments
This work was supported by the RESILIO – Resilience and Vulnerability Assessment of Diocletian’s Palace project (IP-UNIST-19), funded through the Institutional Research Projects Program of the University of Split, financed by the Recovery and Resilience Facility of the European Union.
Conflicts of Interest
The authors declare no conflicts of interest.
Abbreviations
The following abbreviations are used in this manuscript:
| HP | Hydropower plant |
| DC | Duration curve |
| RAPS | Rescaled adjusted partial sums |
| MA | Moving average |
| LR | Linear regression |
| CCF | Cross-correlation function |
| HS | Hydrological station |
| MS | Meteorological station |
| RG | Rain gauge |
References
- Atkinson, T.C. Diffuse flow and conduit flow in limestone terrain in the Mendip Hills, Somerset (Great Britain). J. Hydrol. 1977, 35: 93–110. [CrossRef]
- White, W.B. Geomorphology and Hydrology of Karst Terrains. New York: Oxford University Press, 1988.
- Ford, D.; Williams, P. Karst Hydrogeology and Geomorphology. Wiley: Chichester, UK, 2007.
- Klimchouk, A.B. The Karst Paradigm: Changes, Trends and Perspectives. Acta Carsologica 2016, 44(3). [CrossRef]
- Hartmann, A.; Baker A. Modelling karst vadose zone hydrology and its relevance for paleoclimate reconstruction. Earth-Sci. Rev. 2017, 172, 178–192. [CrossRef]
- Kovács, A.; Perrochet, P. A quantitative approach to spring hydrograph decomposition. J. Hydrol. 2008, 352: 16–29.
- Worthington, S.R.H.; Ford, D.C. Self-Organized Permeability in Carbonate Aquifers. Groundwater 2009, 47: 326–336. [CrossRef]
- Bonacci, O. Karst springs hydrographs as indicators of karst aquifers. Hydrol. Sci. 1993, 38(1), 51. [CrossRef]
- Smart, E.T.; Hobbs, S.L. Characterization of carbonate aquifers: A conceptual base. Proceedings of the Environmental Problems in Karst Terranes and Their Solutions, Conference, Bowling Green KY, October 28–30, 1986.
- White, W.B. Karst hydrology: Recent developments and open questions. Eng. Geol. 2002, 65, 85–105. [CrossRef]
- Gams, I. Types of the contact karst. Studia carsologica 1995, 6, 98–116, Ljubljana, Karst in Slovenia.
- Kuniansky, E.L.; Taylor C.J.; Williams J.H.; Paillet F. Introduction to karst aquifers. The Groundwater Project 2022. [CrossRef]
- Anderson, M.P. Heat as a ground water tracer. Ground Water 2005, 43(6): 951–968. [CrossRef]
- Doucette, R.; Peterson, E. Identifying water sources in a karst aquifer using thermal signatures. Environ. Earth. Sci. 2014, 72:5171–5182. [CrossRef]
- Genthon, P.; Bataille, A.; Fromant, A.; D’Hulst, D.; Bourges, F. Temperature as a marker for karstic waters hydrodynamics. Inferences from 1 year recording at La Peyrére cave (Ariège, France), J. Hydrol. 2005, 311, 1–4, 157–171. [CrossRef]
- Kogovšek, J.; Petrič, M. Water temperature as a natural tracer: case of Malenščica karst spring (SW Slovenia), Geol. Croat. 2010, 63/2, 171–177.
- Covington, M.D.; Luhmann, A.J.; Gabrovšek, F.; Saar, M.O.; Wicks, C.M. Mechanisms of heat exchange between water and rock in karst conduits. Water Resour. Res. 2011, 47, W10514. [CrossRef]
- Luhmann, A.J.; Covington, M.D.; Peters, A.J.; Alexander, S.C.; Anger, C.T.; Green, J.A.; Runkel, A.C.; Alexander, E.C., Jr. Classification of Thermal Patterns at Karst Springs and Cave Streams. Groundwater 2011, 49, 324–335. [CrossRef]
- Luhmann, A. J.; Covington, M. D.; Myre, J. M.; Perne, M.; Jones, S. W.; Alexander, E. C.; Saar, M. O. Thermal damping and retardation in karst conduits. Hydrology and Earth System Sciences 2015, 19 (1), 137–157. [CrossRef]
- Stroj, A.; Briški, M.; Oštrić, M. Study of groundwater flow properties in a karst system by coupled analysis of diverse environmental tracers and discharge dynamics, Water 2020, 12, 2442. [CrossRef]
- Rau,G.; Cuthbertb, M.; Andersen, M.; Baker, A.; Rutlidge H.; Markowska, M.; Roshan, H.; Marjo, C.; Graham, P.; Acworth, I. Controls on cave drip water temperature and implications for speleothem-based paleoclimate reconstructions. Quat. Sci. Rev. 2015, 127:19–36. [CrossRef]
- Saar, M. Review: Geothermal heat as a tracer of large-scale groundwater flow and as a means to determine permeability fields. Hydrogeol. J. 2011, 19(1), 31–52. [CrossRef]
- Luo, M.; Chen, Z.; Zhou, H.; Zhang, L.; Han, Z. Hydrological response and thermal effect of karst springs linked to aquifer geometry and recharge processes. Hydrogeol. J. 2017, 26(2), 629–639. [CrossRef]
- Skoglund, R.Ø.; Pennos, C.; Per¸soiu, A.; Sotiriadis, Y. Karstic Aquifers—Simple or Hybrid Systems? Thermal Stories from Maaras Cave, Greece. Water 2023, 15, 488. [CrossRef]
- Wang, Z.; Chen, Q.; Yan, Z; Luo, M; Zhou, H.; Liu, W. Method for identifying and estimating karst groundwater runoff components based on the frequency distributions of conductivity and discharge. Water 2019, 11, 2494. [CrossRef]
- Wang, Z.; Zhou, H.; Wen, Z.; Luo, M.; Kuang, Y. A study of the thermal behavior of exposed karst water systems in a mountainous area of Zigui County, Hubei Province, Central China, Hydrogeol. J. 2021, 29, 2821–2835 . [CrossRef]
- Jukić, D., Denić-Jukić, V., Kadić, A. Temporal and spatial characterization of sediment transport through a karst aquifer by means of time series analysis, J. Hydrol. 2022, 609, 127753. [CrossRef]
- Bonacci, O.; Roje-Bonacci, T. Water temperature and electrical conductivity as an indicator of karst aquifer: the case of Jadro Spring (Croatia), CARBONATE EVAPORITE 2023, 38, 55. [CrossRef]
- Dugdale, S. J.; Hannah, D. M.; Malcolm, I. A. River temperature modelling: a review of process-based approaches and future directions. Earth-Sci. Rev. 2017, 175, 97-113. [CrossRef]
- Zganec, K. The effects of water diversion and climate change on hydrological alteration and temperature regime of karst rivers in central Croatia. Environ. Monit. Assess. 2012, 184(9), 5705–5723. [CrossRef]
- Bonacci, O.; Oštrić, M.; Roje Bonacci, T. Water resources analysis of the Rječina karst spring and river (Dinaric karst). Acta Carsol. 2018, 47/2-3, 123-137.
- Rađa, B.; Puljas, S. Do Karst Rivers ‘deserve’ their own biotic index? A ten-year study on macrozoobenthos in Croatia, Int. J. Speleol. 2010, 39, 2, 137–147. [CrossRef]
- Filipović Marijić, V.; Kapetanović, D.; Dragun, Z.; Valić, D.; Krasnići, N.; Redžović, Z; Grgić, I.,; Žunić, J., Kružlicová, D.; Nemeček, P.; Ivanković, D.; Vardić Smrzlić, I.; Erk, M. Influence of technological and municipal wastewaters on vulnerable karst riverine system, Krka River in Croatia. Environ. Sci. Pollut. Res. 2018, 25, 5, 4715–4727. [CrossRef]
- Vučković, I.; Kučinić, M.; Čukušić, A.; Vuković, M.; Ćuk, R.; Stanić-Koštroman, S.; Cerjanec, D.; Plantak, M. Biodiversity, DNA barcoding data and ecological traits of caddisflies (Insecta, Trichoptera) in the catchment area of the Mediterranean karst River Cetina (Croatia). Ecol. Monten. 2021, 44, 69-95. [CrossRef]
- Vilenica, M.; Previšić, A.; Ivković, M. Mayfly (Insecta: Ephemeroptera) assemblages of a regulated perennial Mediterranean river system in the Western Balkans. Biologia 2016, 71, 1038–1048. [CrossRef]
- Magdalenić, A. Hidrogeologija sliva Cetine. Krš Jugosl. 1971, 7, 89-169.
- Bonacci, O.; Roje-Bonacci, T. The influence of hydroelectrical development on the flow regime of the Karstic River Cetina. Hydrol. Process. 2003, 17, 1-15. [CrossRef]
- Stevanovic, Z.; Kukurić, N.; Pekaš, Ž.; Jolović, B.; Pambuku, A.; Radojevic, D. Dinaric Karst Aquifer – One of the world’s largest transboundary systems and an ideal location for applying innovative and integrated water management. Karst without Boundaries, 3-25, 2016. [CrossRef]
- Pavlek, K.; Faivre, S. Geomorphological changes of the Cetina River channel since the end of the nineteenth century, natural vs anthropogenic impacts (the Dinarides, Croatia). Environ. Earth Sci. 2020, 79, 482. [CrossRef]
- Denić-Jukić, V.; Lozić, A.; Jukić, D. An Application of Correlation and Spectral Analysis in Hydrological Study of Neighboring Karst Springs. Water 2020, 12, 3570. [CrossRef]
- Stambuk-Giljanovic, N. The quality of water in the Busko Blato reservoir. Environ. Monit. Assess. 2001, 71(3), 279-96. [CrossRef]
- Bonacci O.; Andrić, I.; Roje-Bonacci, T.; Oskoruš, D.; Vrsalović, A. Impact of large human constructions on a karst river hydrology: Case of the Cetina River (Dinaric karst), Acta hydrotech. 2020, 33/59, 155–174.
- Box, G.E.P.; Jenkins, G.M.; Reinsel, G.C. Time Series Analysis: Forecasting and Control. 4th Edition, Wiley, Oxford, 2008. [CrossRef]
- Buishand, T.A.; de Haan, L.; Zhou, C. On spatial extremes: With application to a rainfall problem. Ann. Appl. Stat. 2008, 2 (2) 624 – 642. [CrossRef]
- Đurin, B.; Plantak, L.; Dogančić, D.; Kranjčić, N. Hydro Energy Suitability of Rivers Regarding Their Hydrological and Hydrogeological Properties. Environ. Sci. Proc. 2021, 7, 3. [CrossRef]
- Helsel, D.; Hirsch, R.; Ryberg, K.; Archfield, S.; Gilroy, E. Statistical Methods in Water Resources 2020. [CrossRef]
- Saliba, Y.; Bărbulescu, A. A Multi-Method Approach to Analyzing Precipitation Series and Their Change Points in Semi-Arid Climates: The Case of Dobrogea. Water 2025, 17, 391. [CrossRef]
- Harisuseno, D. Comparative study of meteorological and hydrological drought characteristics in the Pekalen River basin, East Java, Indonesia. J. Water and Land Dev. 2020,45 (IV–VI), 29–41. [CrossRef]
- Čadro, S.; Uzunović, M.; Omerović, Z.; Vlahovljak, E. Konjić, A.; Marković, M. Climate Change Influence on Occurrence of Extreme Dry-Wet Periods in Bosnia and Herzegovina. Agric. For. 2024, 70(1), 325-344. [CrossRef]
- Ugarković, D.; Kelava Ugarković, N. Changes and trends of climate elements and indices in the region of Mediterranean Croatia, J. Cent. Eur. Agric. 2013, 14 (1), 236-249. [CrossRef]
- Bonacci, O.; Ljubenkov, I.; Roje-Bonacci, T. Different Climate Changes at Two Locations on a Small Karst Island Korčula (Adriatic Sea, Croatia). NAŠE MORE 2021, 68 (1), 1-13. [CrossRef]
- Vrsalović, A.; Andrić, I.; Bonacci, O.; Kovčić, O. Climate Variability and Trends in Imotski, Croatia: An Analysis of Temperature and Precipitation. Atmosphere 2023, 14. [CrossRef]
- Bonacci, O.; Roje-Bonacci, T. Impact of grout curtains on karst groundwater behavior: An example from the Dinaric karst. Hydrol. Process. 2012, 26, 2765–2772. [CrossRef]
- Searcy, J.K., Flow-duration curves. U.S. Geological Survey Water Supply Paper 1542-A, 1959, Reprinted 1963. [CrossRef]
- Olarinoye, T.; Gleeson, T.; Hartmann, A. Karst spring recession and classification: efficient, automated methods for both fast- and slow-flow components. Hydrology and Earth System Sciences 2022, 26, 21, 5431—5447. [CrossRef]
- Florea, L.J.; Vacher, H. L. Morphologic Features of Conduits and Aquifer Response in the Unconfined Floridian Aquifer System, West Central Florida. 2006, School of Geosciences Faculty and Staff Publications, 1815. https://digitalcommons.usf.edu/geo_facpub/1815.
- Soulios, G. Infiltration efficace dans le karst hellénique, J. Hydrol. 1984, 75, 1–4, 343–356. [CrossRef]
- Garbrecht, J.; Fernandez, G. P. Visualization of trends and fluctuations in climatic records. JAWRA 1994, 30(2), 297–306. [CrossRef]
- Bonacci, O. Analysis of Long-Term (1878-2004) Mean Annual Discharges of the Karst Spring Fontaine de Vaucluse (France). ACTA CARSOLOGICA 2007, 36, 1. https://digitalcommons.usf.edu/kip_articles/10400.
- Kundzewicz, Z.W.; Robson, A.J. Change detection in hydrological records—a review of the methodology. Hydrol. Sci. J. 2004, 49:1, 7-19. [CrossRef]
- Kahya, E.; Kalaycı, S. Trend analysis of streamflow in Turkey, J. Hydrol. 2004, 289, 1–4, 128–144. [CrossRef]
- Partal, T.; Kahya, E. Trend Analysis in Turkish Precipitation Data. Hydrologic. Process. 2006, 20, 2011–2026. [CrossRef]
- Đurin, B.; Kranjčić, N.; Kanga, S.; Singh, S.K.; Sakač, N.; Pham, Q.B.; Hunt, J.; Dogančić, D.; Di Nunno, F. Application of Rescaled Adjusted Partial Sums (RAPS) method in hydrology – an overview. Advances in Civil and Architectural Engineering 2022, 13, 25, 58-72. [CrossRef]
- Ðurin, B.; Plantak L.; Bonacci, O.; Di Nunno, F. A Unique Approach to Hydrological Behavior along the Bednja River (Croatia) Watercourse. 2023, Water 15(3), 589. [CrossRef]
- Đurin, B.; Raić, M.; Sušilović, P. Application of the RAPS method of time series analysis to the assessment of grout curtain performance in karst. Hydrology 2022, 9(11), 192. [CrossRef]
- Huđek, H.; Žganec, K.; Pusch, M.T.A review of hydropower dams in Southeast Europe – distribution, trends and availability of monitoring data using the example of a multinational Danube catchment subarea, RSER 2020, 117, 109434. [CrossRef]
- Bipa, N.J.; Stradiotti, G.; Righetti, M.; Pisaturo, G.R. Impacts of hydropeaking: A systematic review. Sci. Total Environ. 2024, 912:169251. [CrossRef]
- Choi, B.; Choi, S.U. Impacts of hydropeaking and thermopeaking on the downstream habitat in the Dal River, Korea. Ecological Informatics 2018, 43, 1–11. [CrossRef]
- Weber, M.; Rinke, K; Hipsey, M.R.; Boehrer, B. Optimizing withdrawal from drinking water reservoirs to reduce downstream temperature pollution and reservoir hypoxia, J. Environ. Manag. 2017, 197, 96-105. [CrossRef]
- Feng, M.; Zolezzi, G.; Pusch, M. Effects of thermopeaking on the thermal response of alpine river systems to heatwaves. Science of the Total Environment 2018, 612, 1266–1275. [CrossRef]
- Ferencz, S. B.; Muñoz, S.; Neilson, B.T.; Cardenas, M. B. Riverbed Temperature and Heat Transport in a Hydropeaked River. Water Resour. Res. 2021, 57. [CrossRef]
Figure 1.
Location map of the Cetina River catchment with groundwater connections determined by tracing tests.
Figure 1.
Location map of the Cetina River catchment with groundwater connections determined by tracing tests.
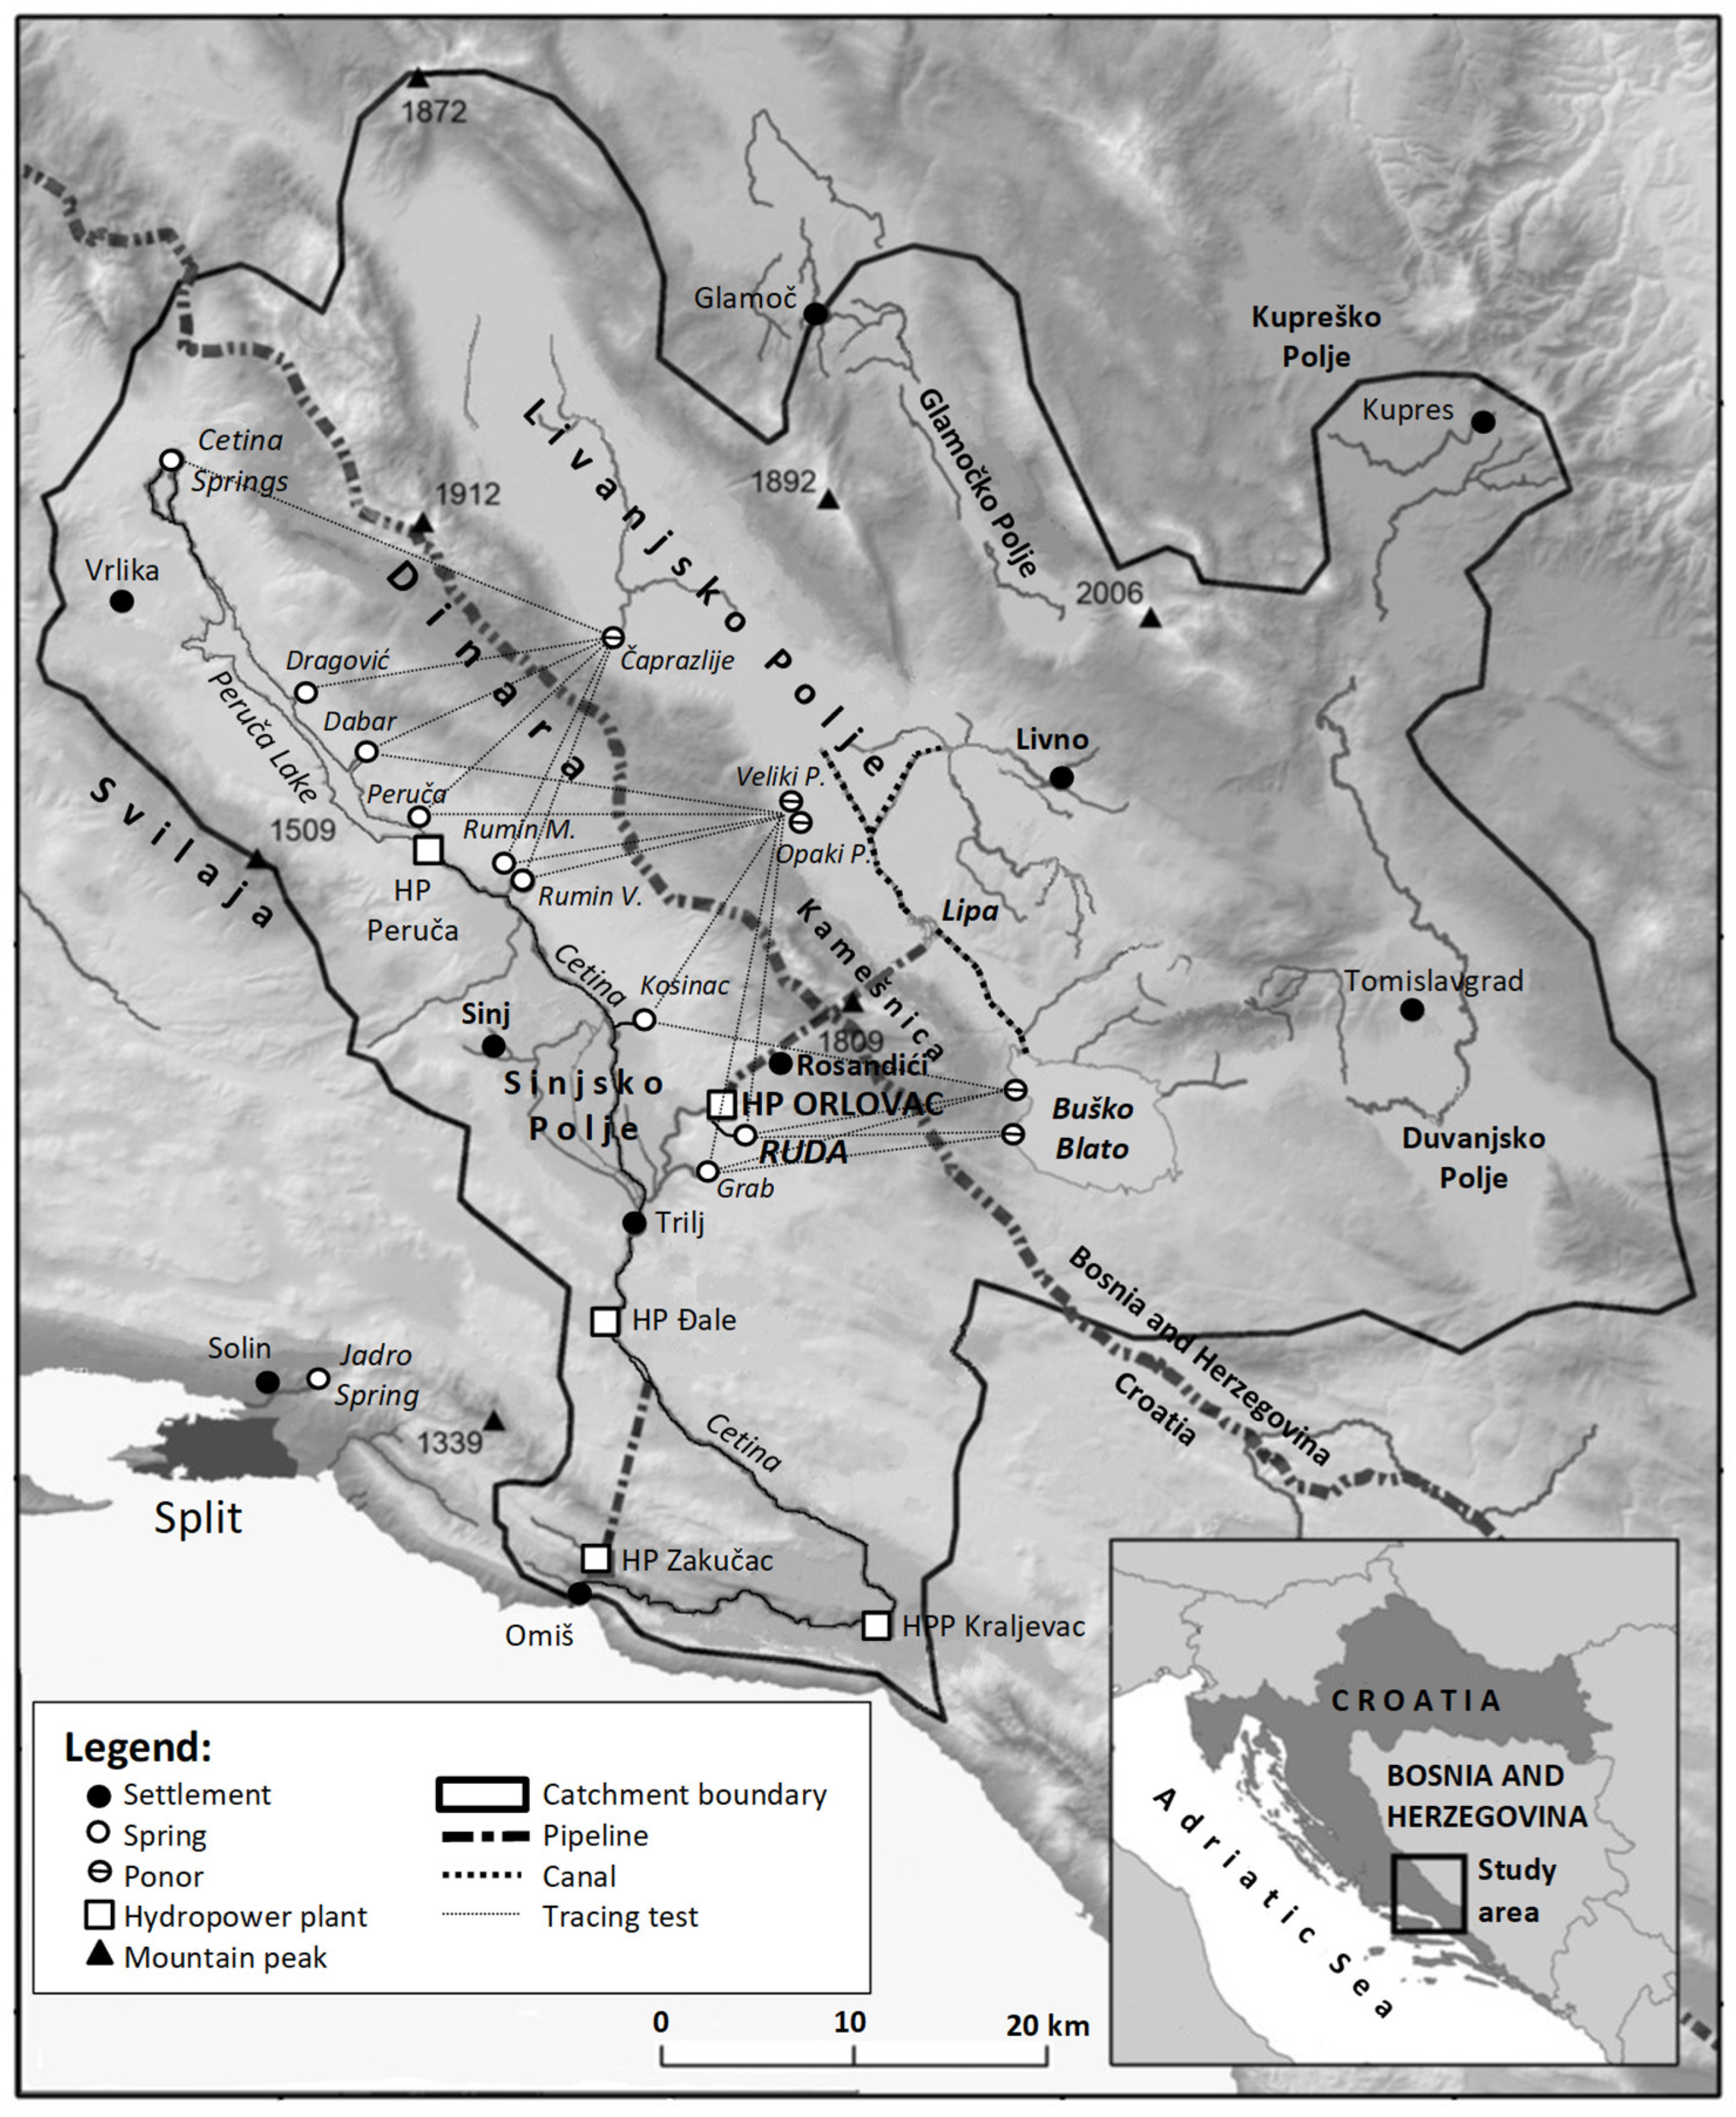
Figure 2.
Schematic presentation of locations of hydrological stations.
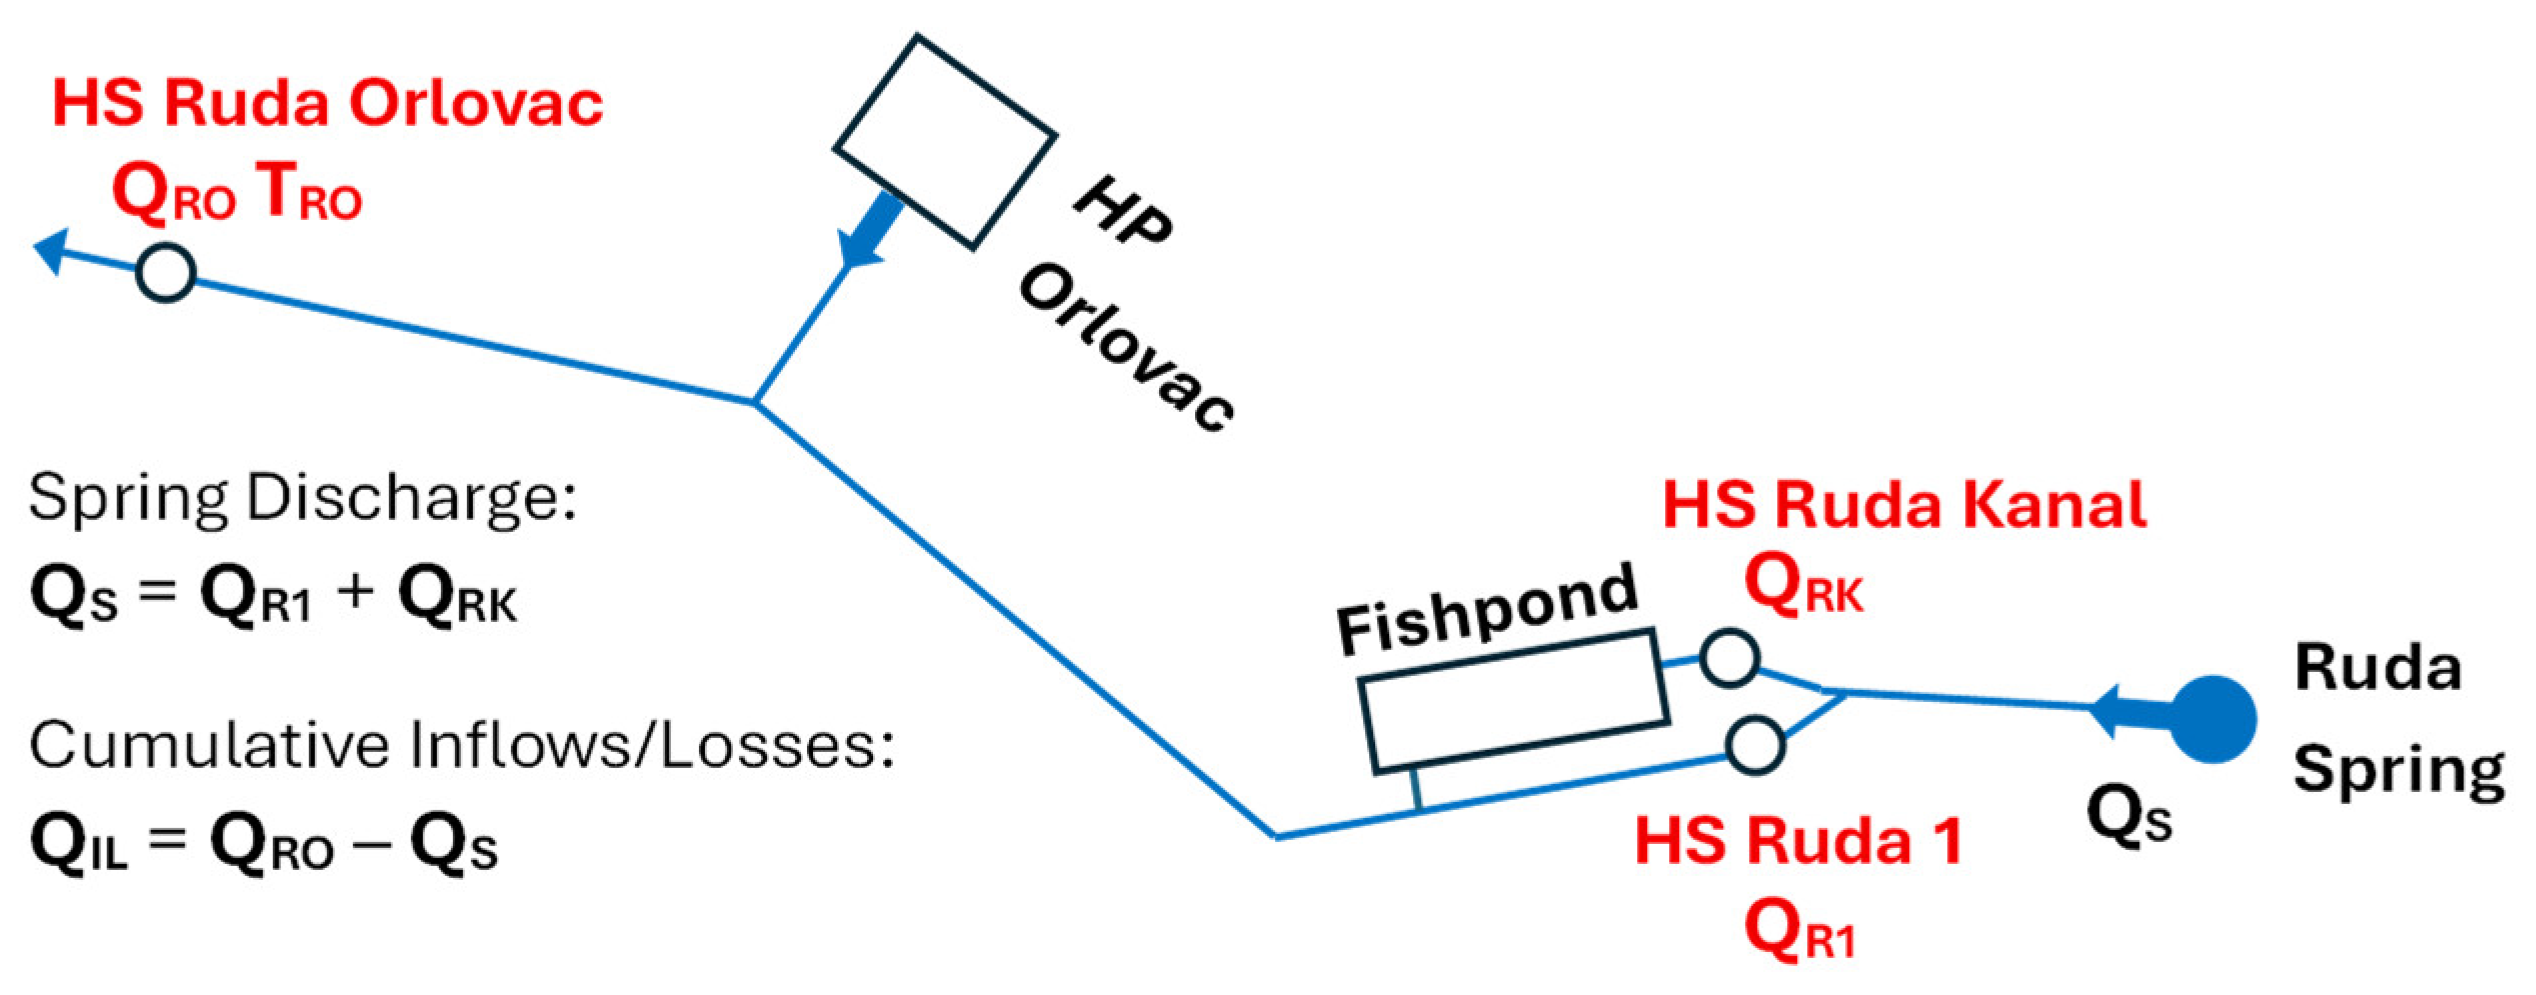
Figure 3.
Mean, maximal, and minimal values for each year for (a) precipitations from Livno MS and Rosandići RG, (b) air temperatures from Livno MS and water temperatures from Ruda Orlovac HS, (c) discharges from Ruda Spring, (d) discharges from Ruda Orlovac HS, (e) inflows/losses standing for discharges from Orlovac HP.
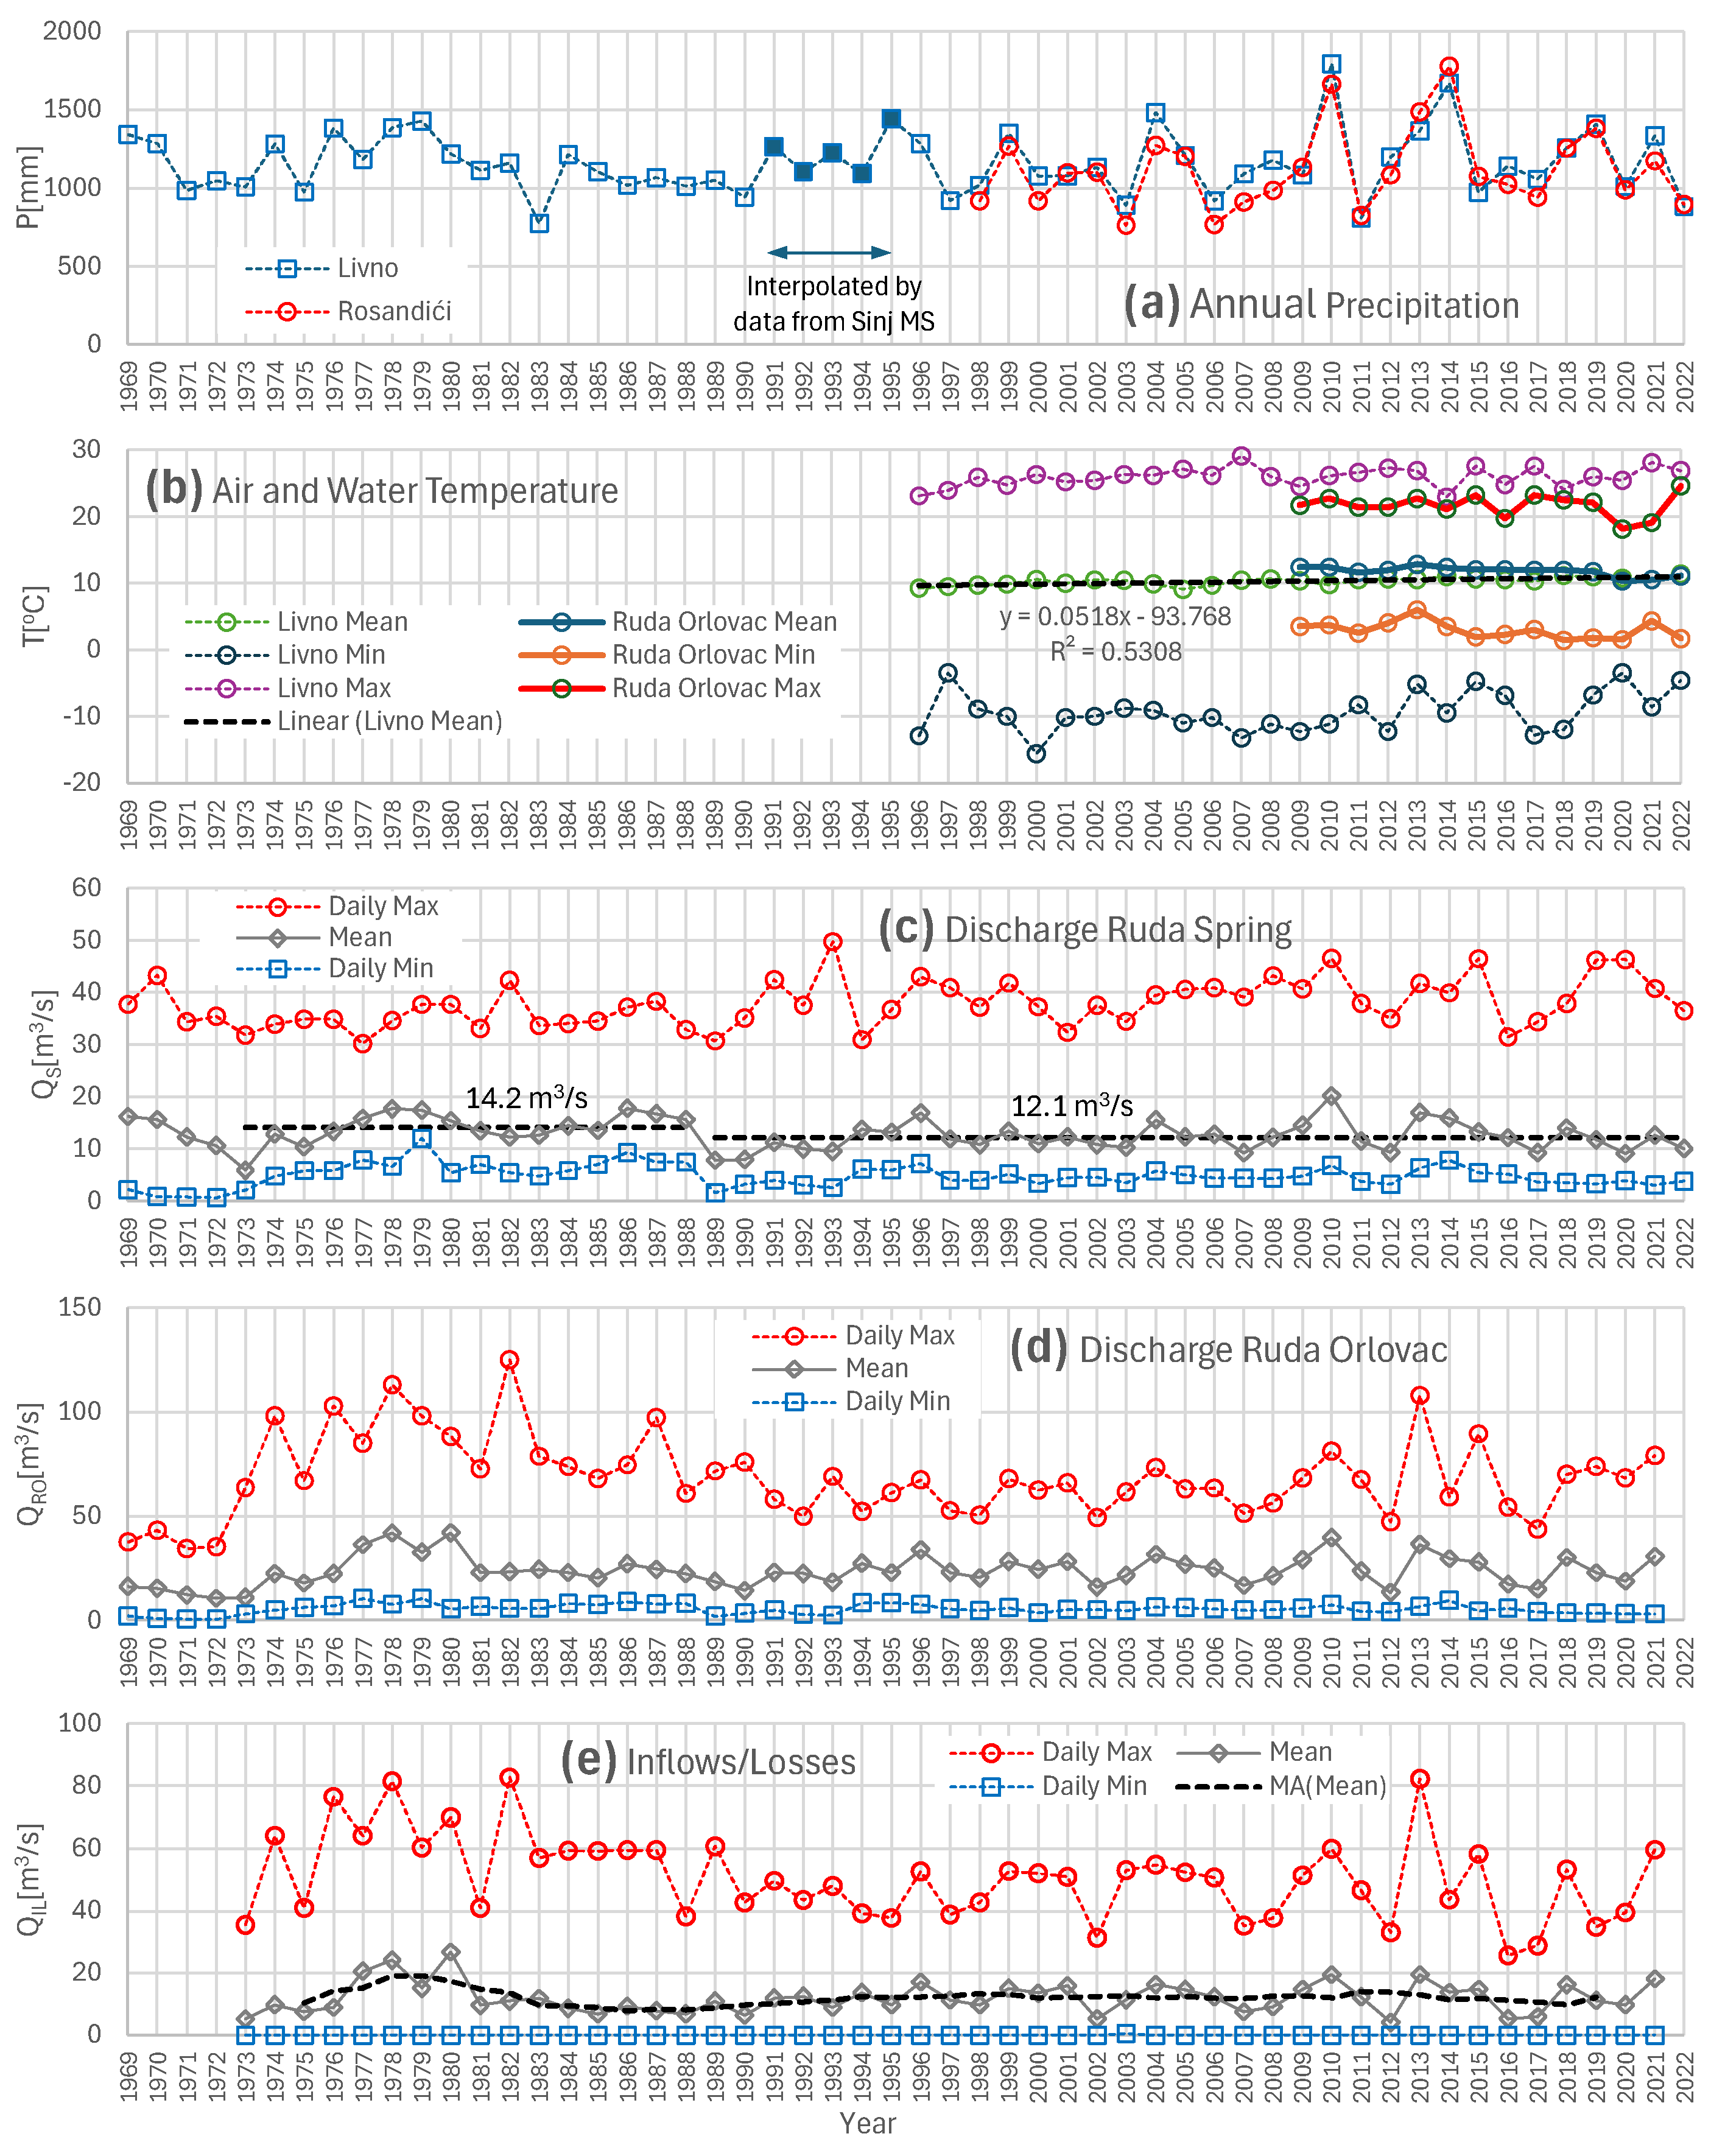
Figure 4.
RAPS of annual precipitations from Livno MS and annual discharges from Ruda Spring, Ruda Orlovac HS, and Orlovac HP.
Figure 4.
RAPS of annual precipitations from Livno MS and annual discharges from Ruda Spring, Ruda Orlovac HS, and Orlovac HP.
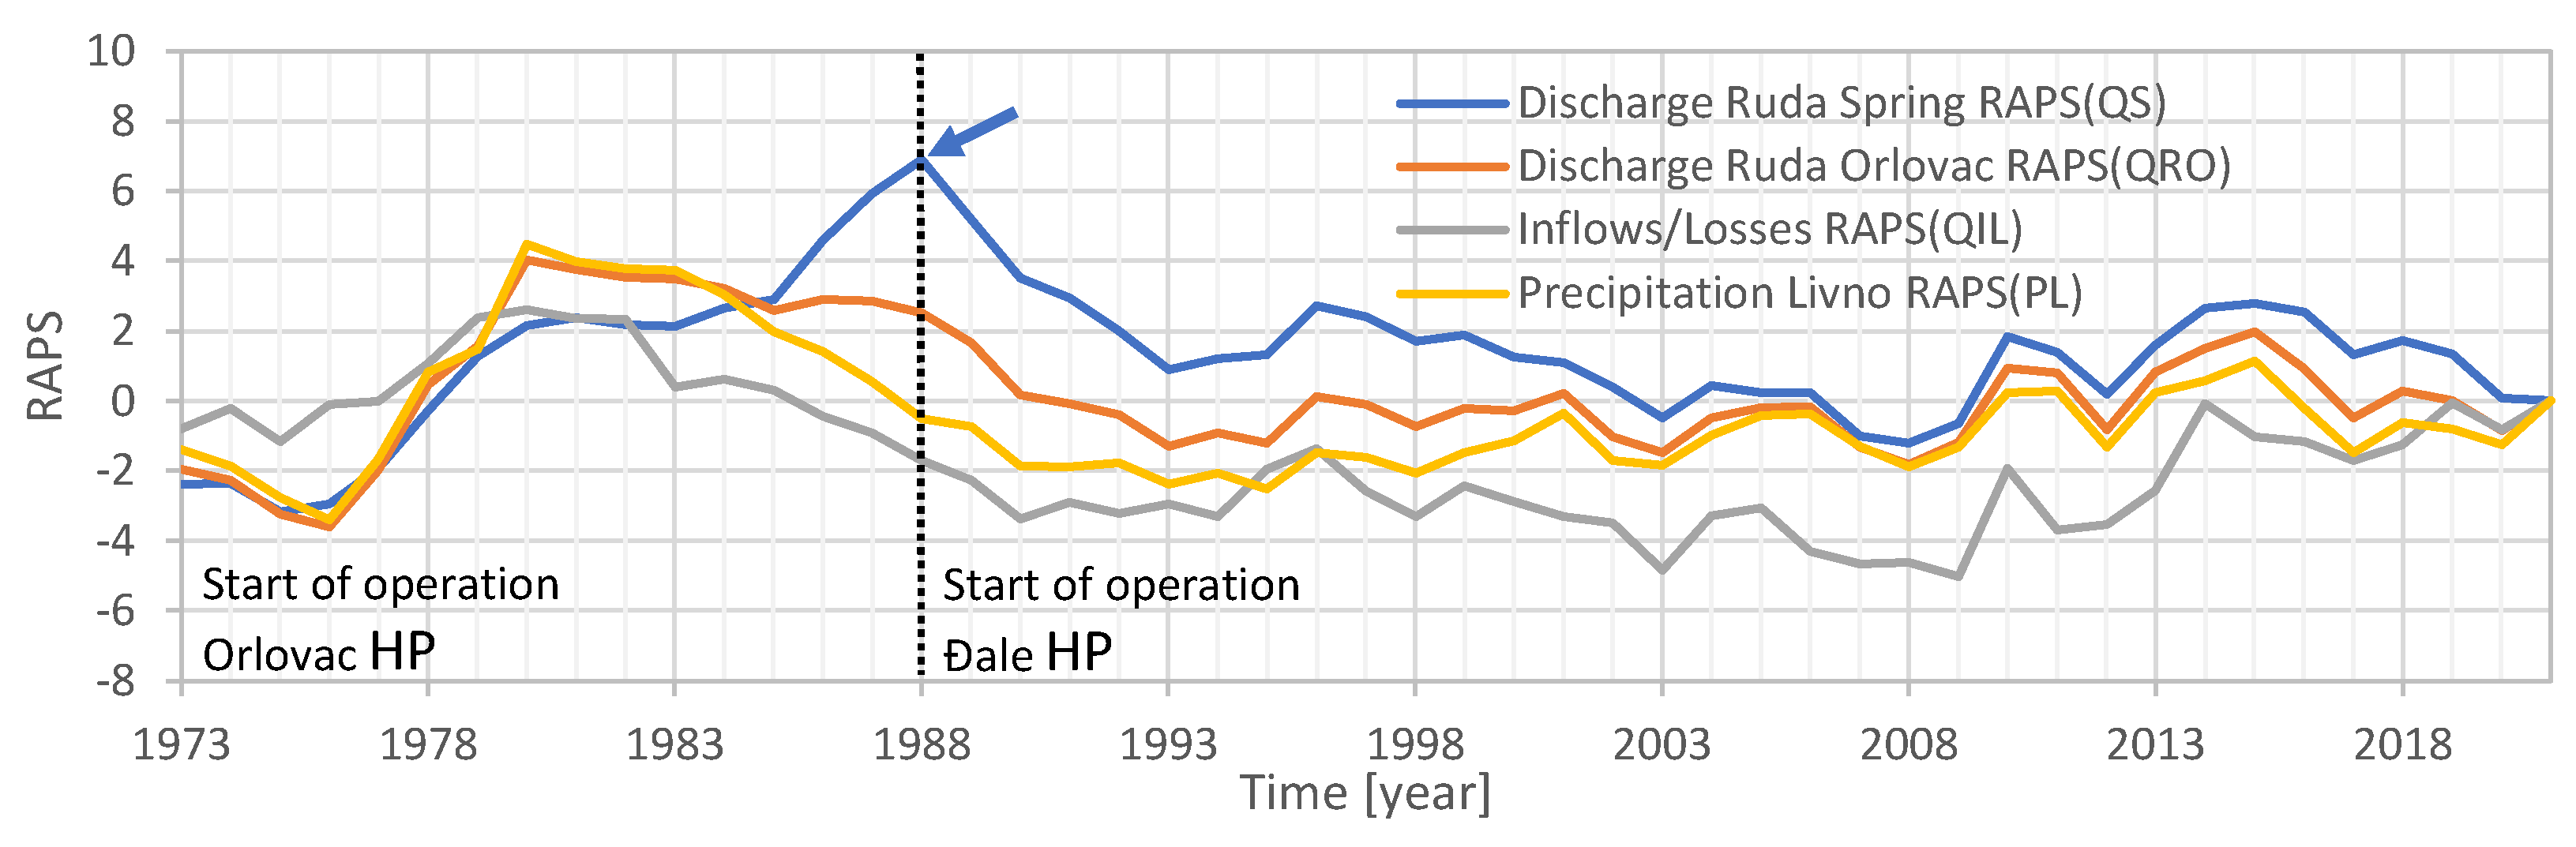
Figure 5.
DC of daily discharges from Ruda Spring for periods 1973-1988 and 1989-2022 presented on (a) regular graph, and (b) probability graph.
Figure 5.
DC of daily discharges from Ruda Spring for periods 1973-1988 and 1989-2022 presented on (a) regular graph, and (b) probability graph.
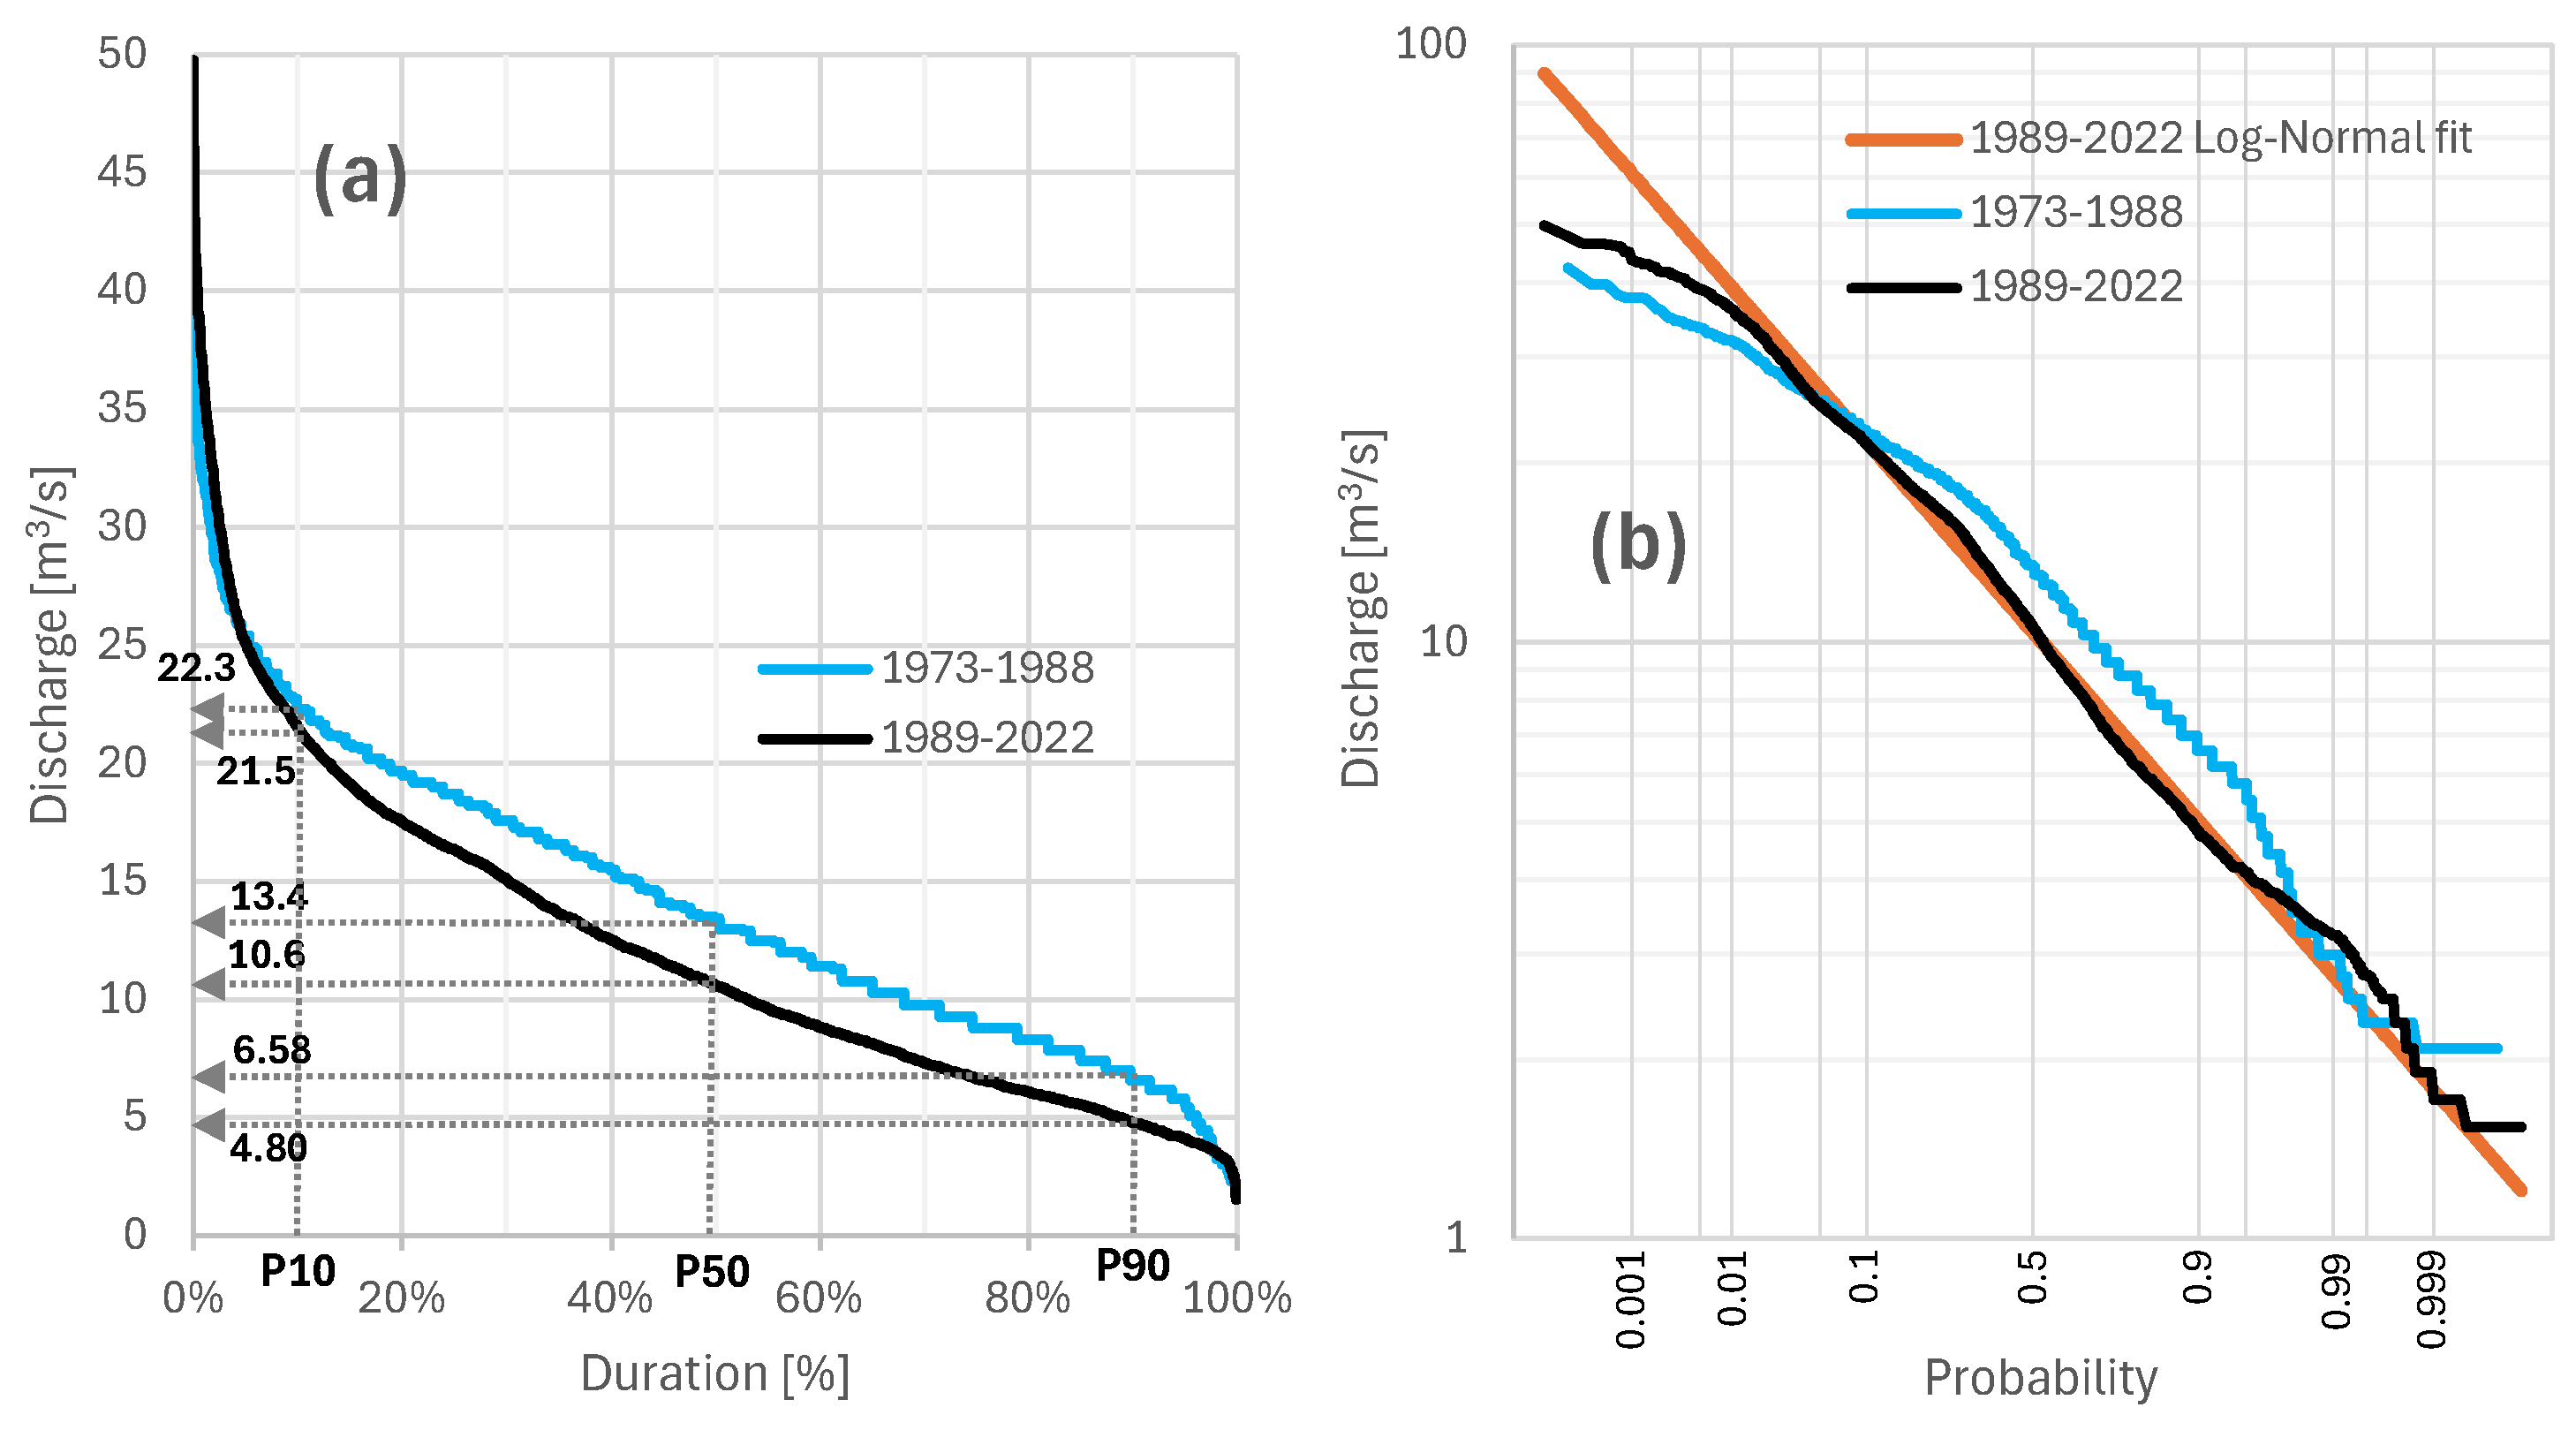
Figure 6.
RAPS of daily precipitations from Livno MS, daily discharges from Ruda Spring, Ruda Orlovac HS, and Orlovac HP, daily air temperatures from Livno MS, and daily water temperatures from Ruda Orlovac HS.
Figure 6.
RAPS of daily precipitations from Livno MS, daily discharges from Ruda Spring, Ruda Orlovac HS, and Orlovac HP, daily air temperatures from Livno MS, and daily water temperatures from Ruda Orlovac HS.
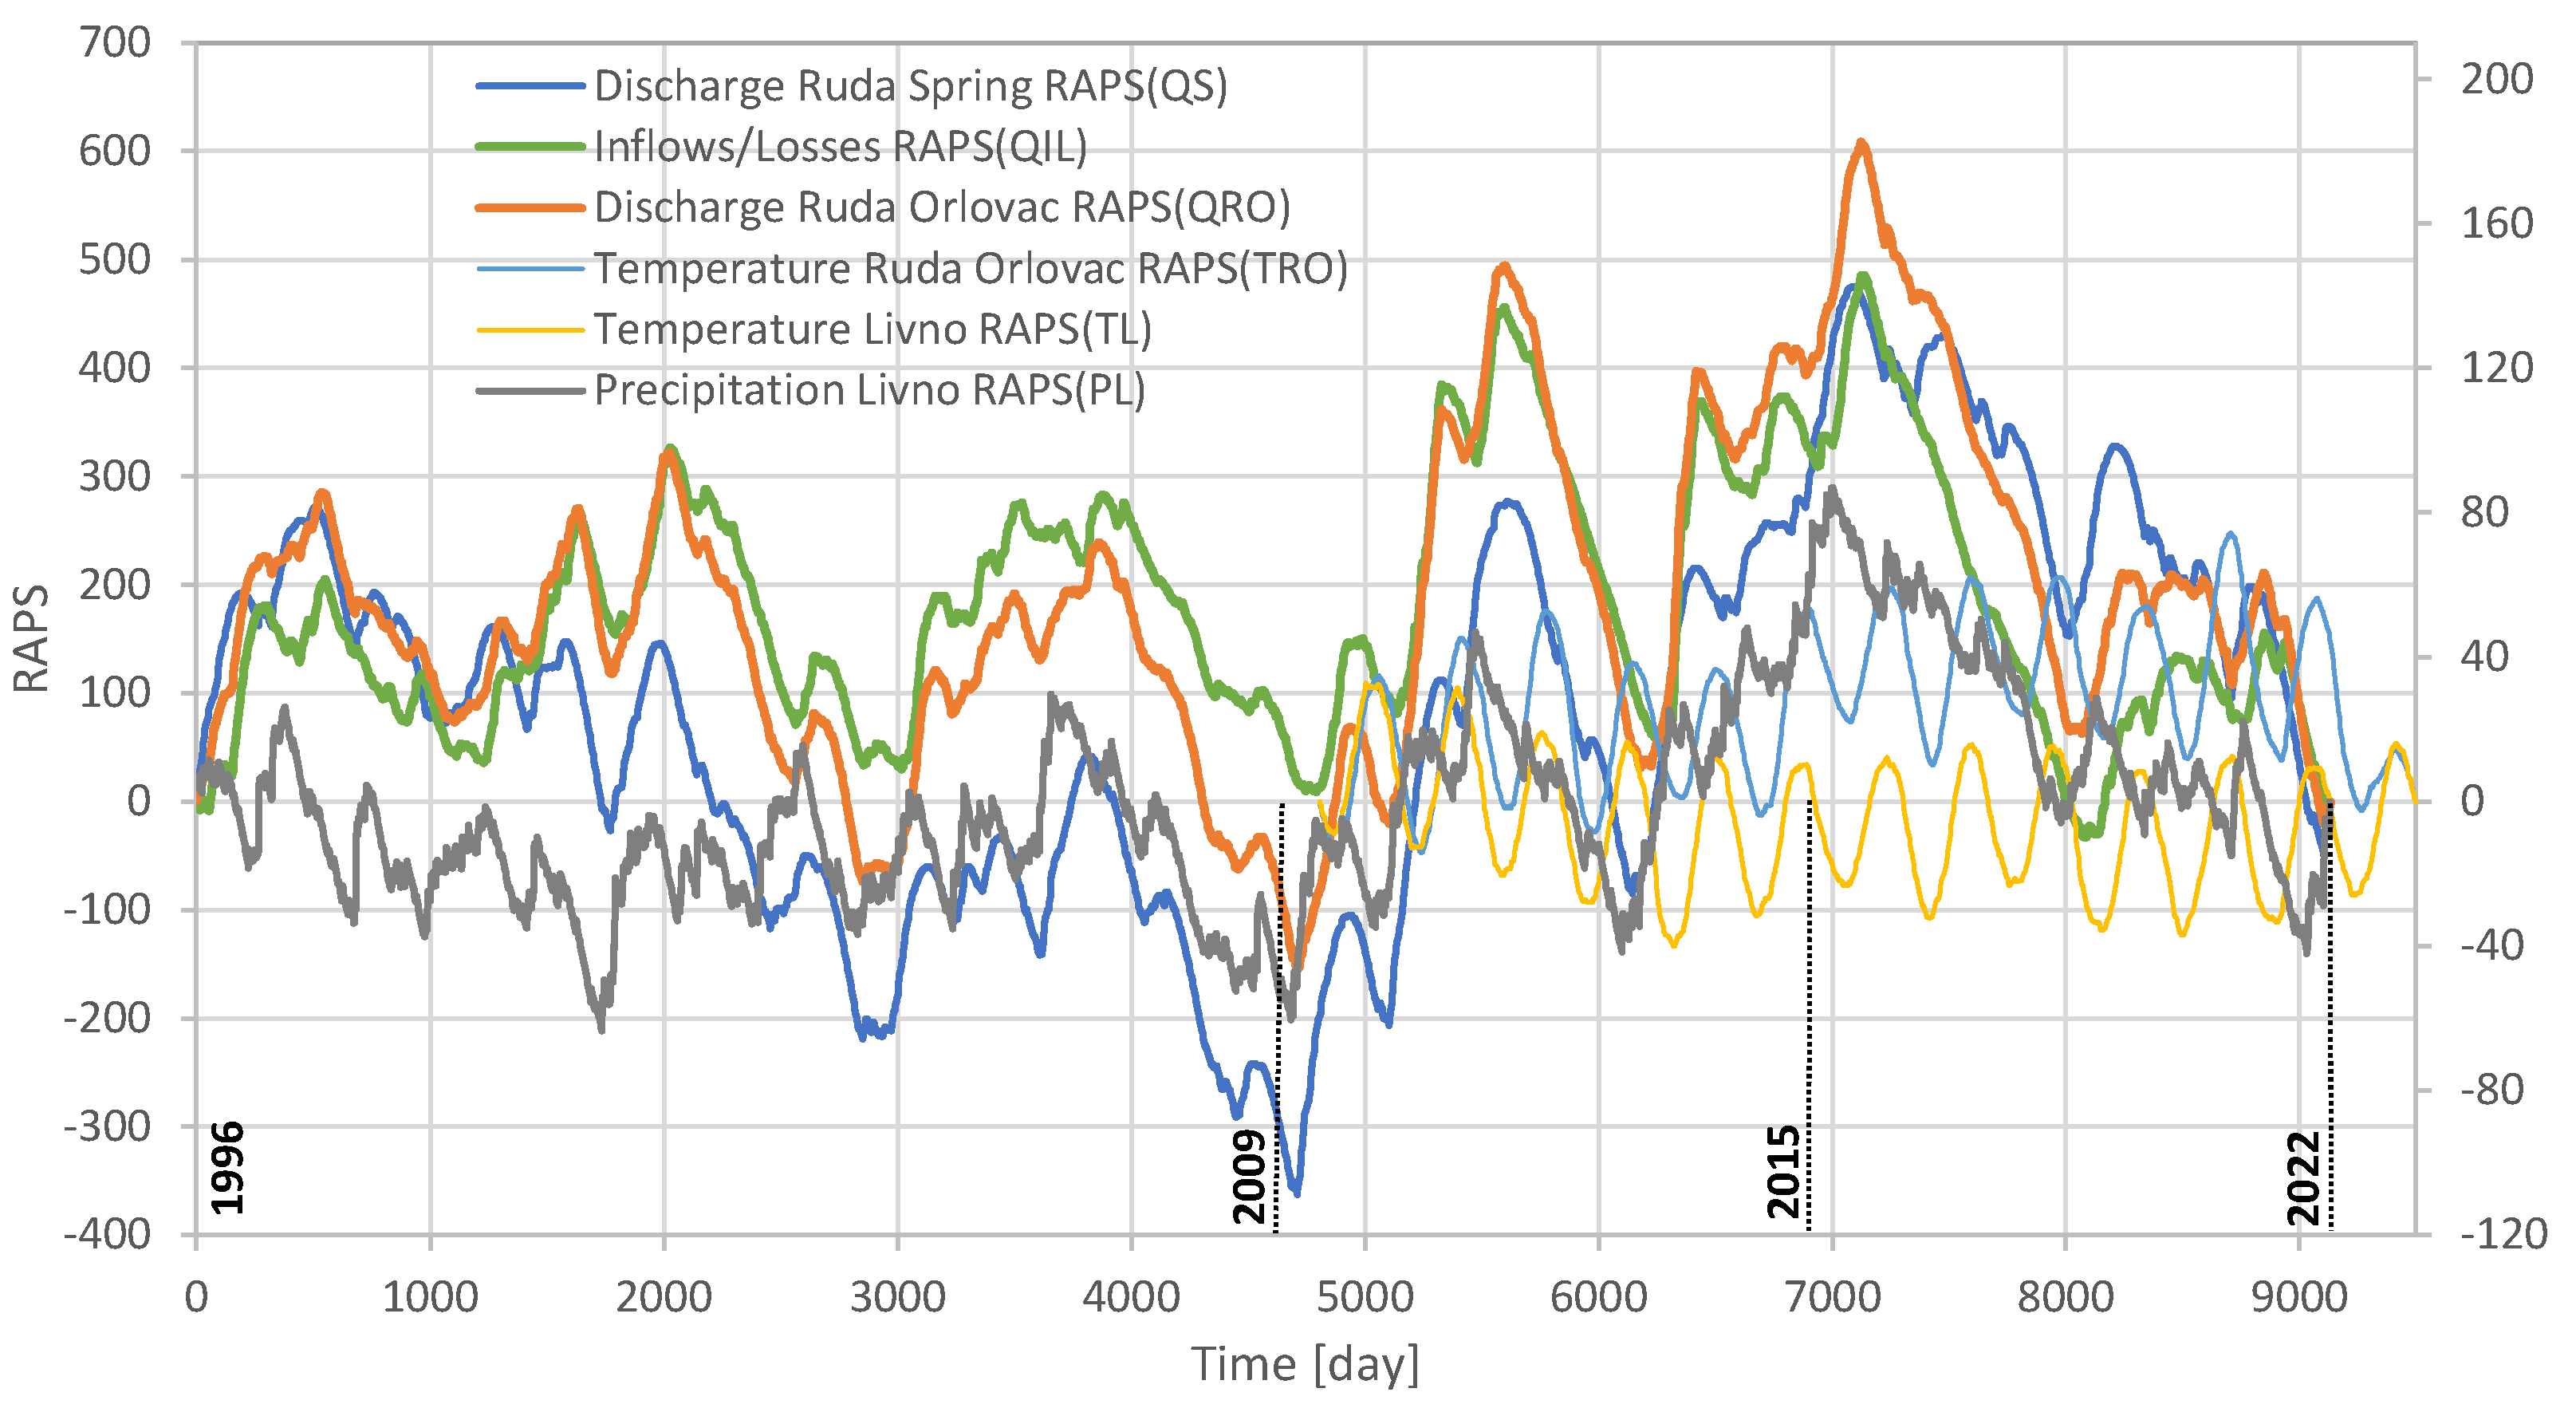
Figure 7.
CCF between RAPS of daily data with estimated time delays.
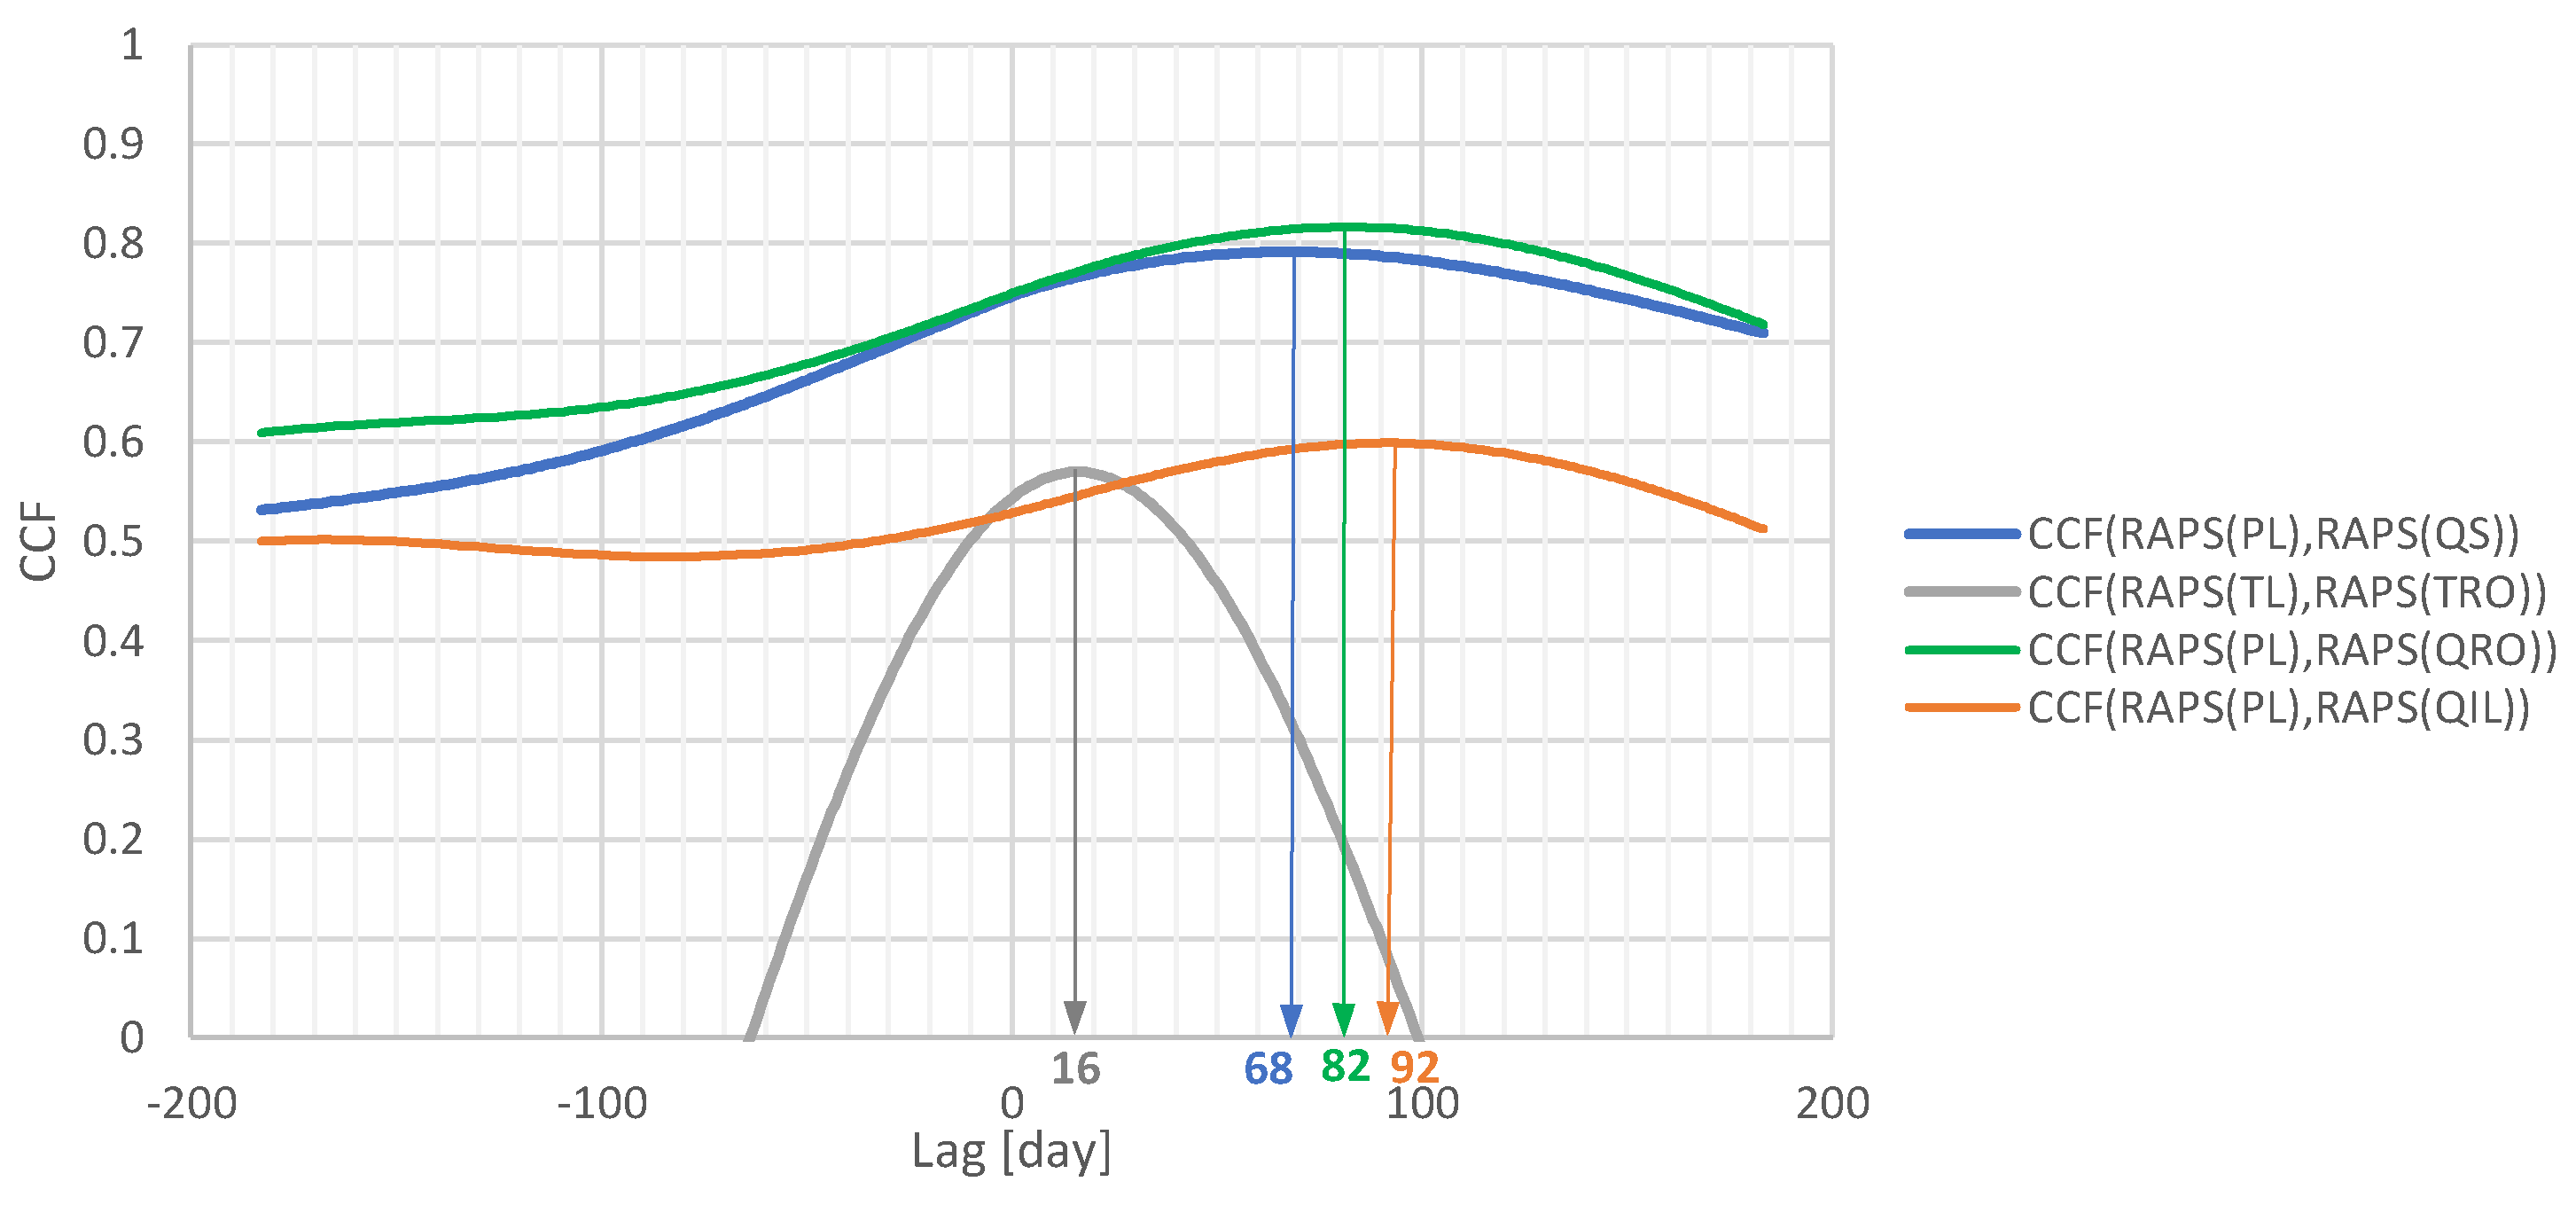
Figure 8.
Mean discharges and minimal and maximal registered discharges for each day of the year at the Ruda Spring and the Ruda Orlovac HS.
Figure 8.
Mean discharges and minimal and maximal registered discharges for each day of the year at the Ruda Spring and the Ruda Orlovac HS.
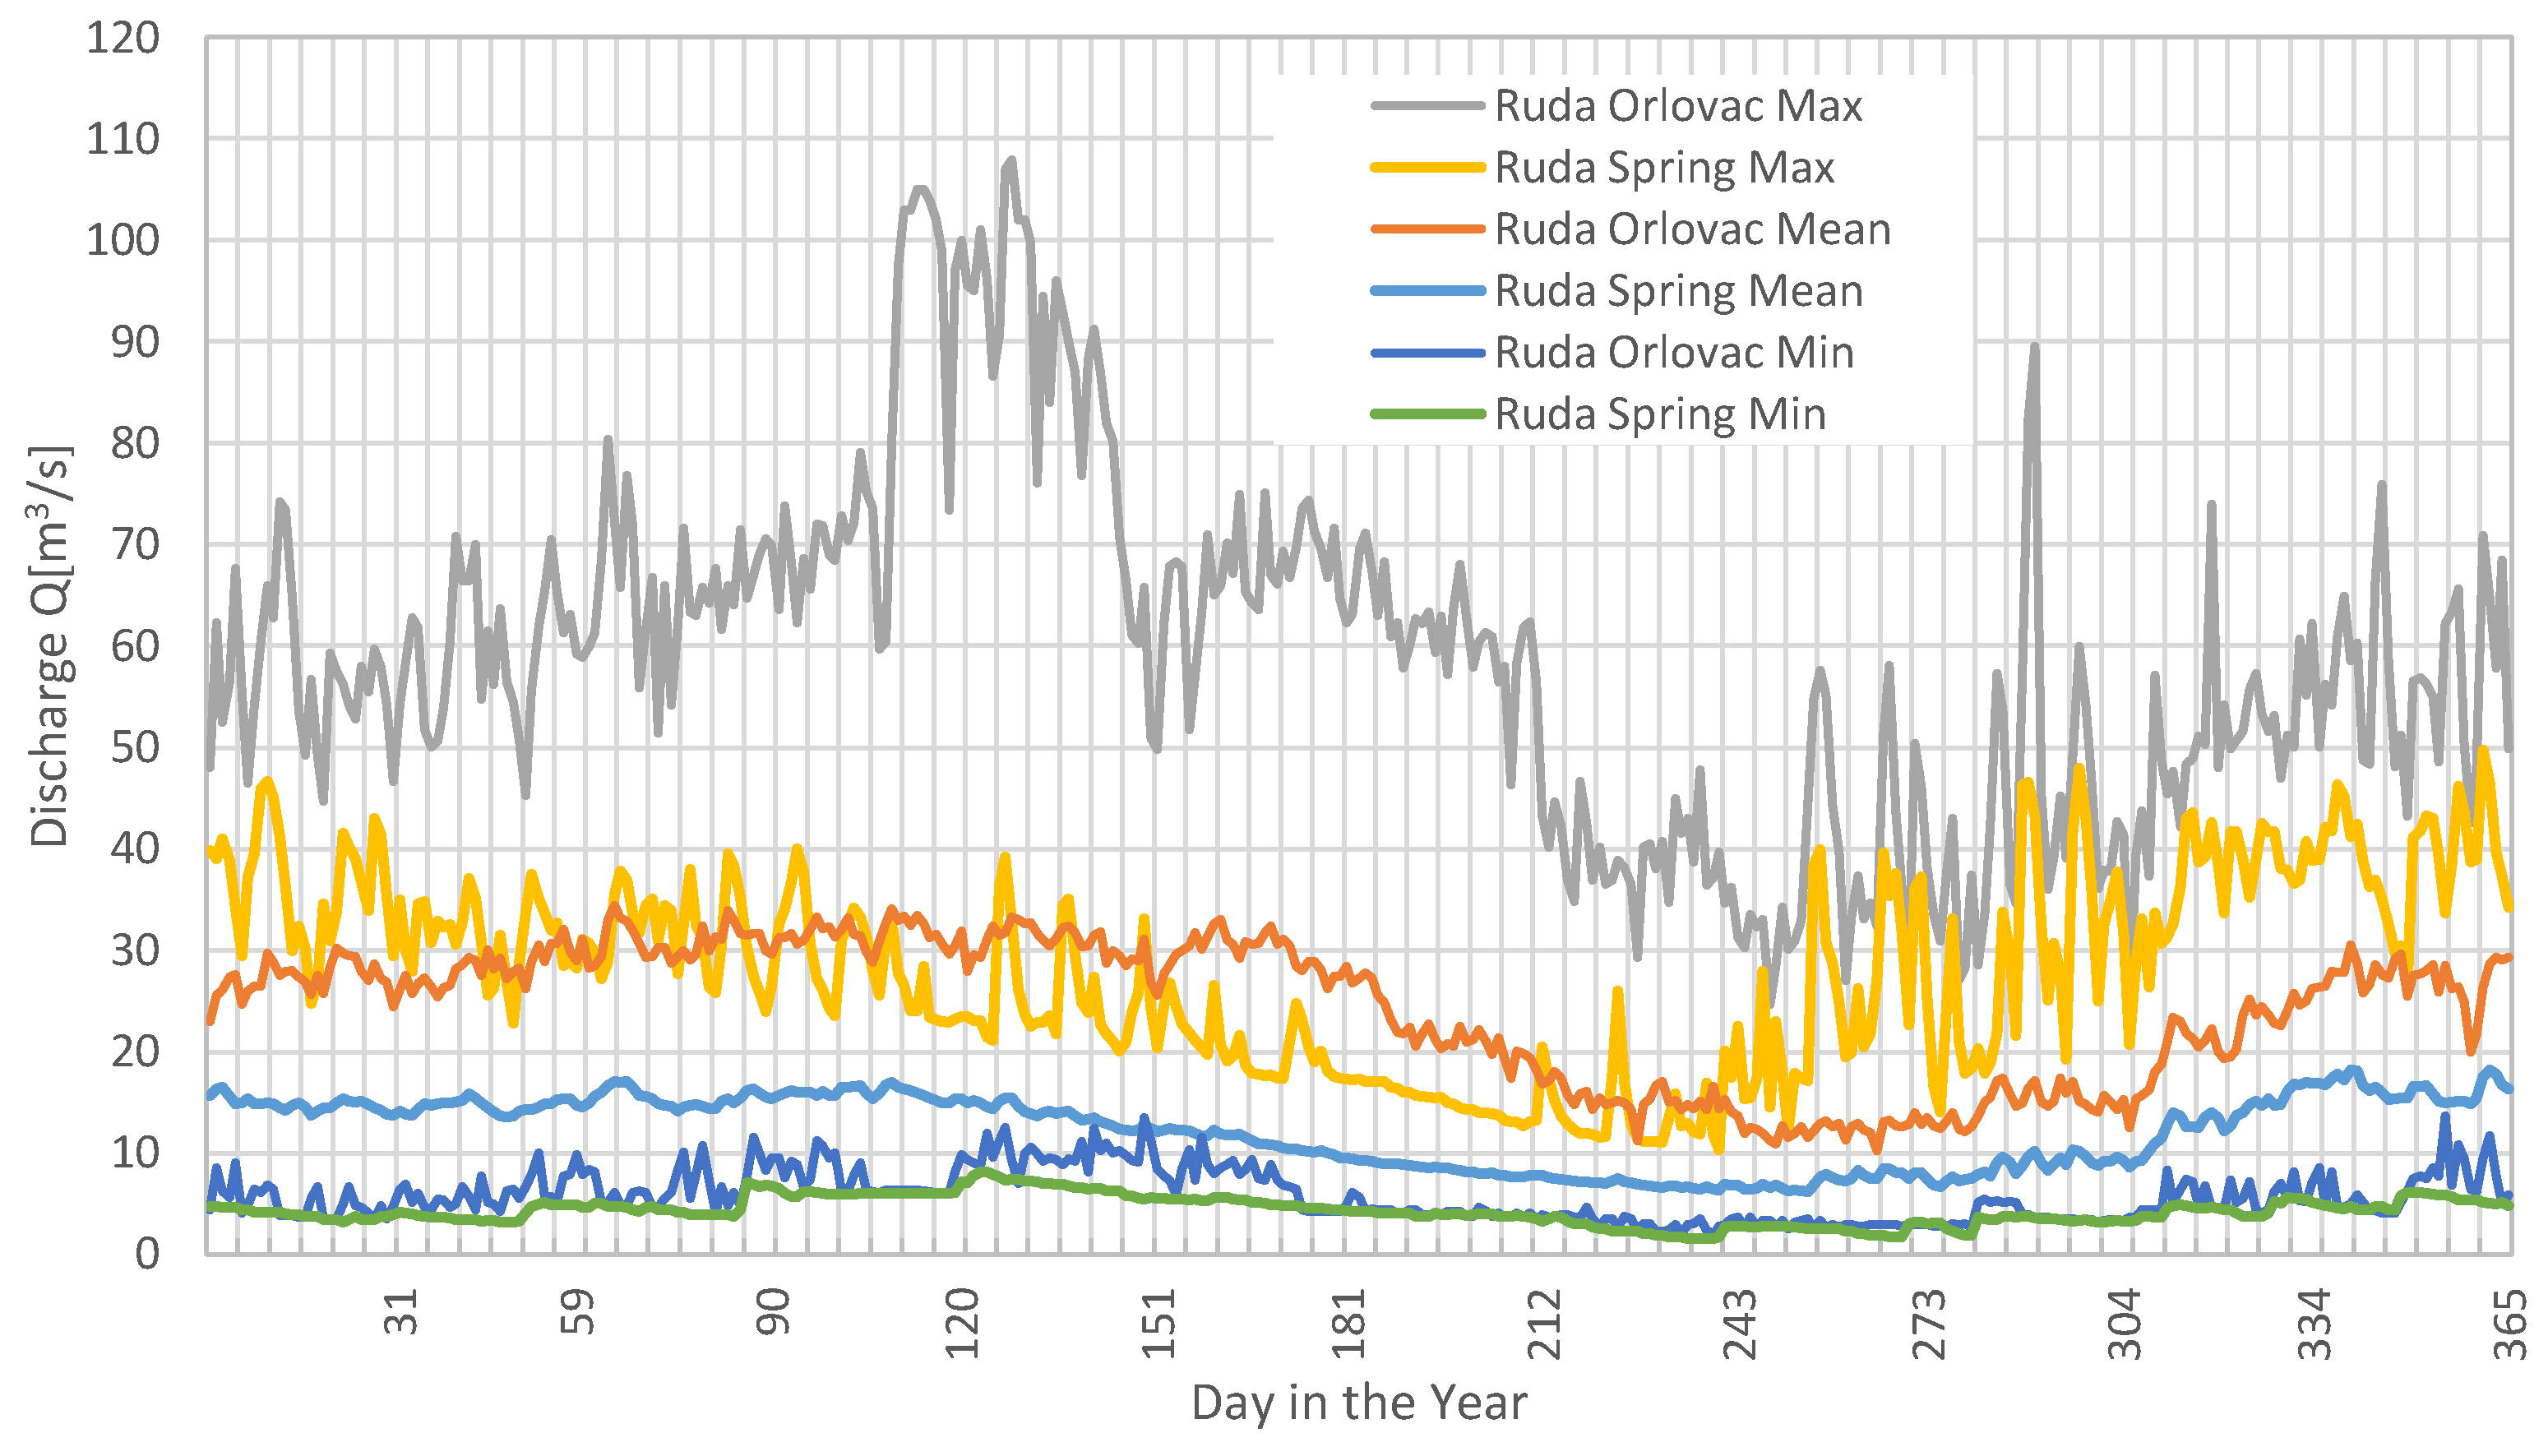
Figure 9.
(a) LR between monthly air temperatures from Livno MS and monthly water temperatures from Ruda Orlovac HS. (b) LR between monthly discharges from Orlovac HP and monthly water temperatures from Ruda Orlovac HS for February and August.
Figure 9.
(a) LR between monthly air temperatures from Livno MS and monthly water temperatures from Ruda Orlovac HS. (b) LR between monthly discharges from Orlovac HP and monthly water temperatures from Ruda Orlovac HS for February and August.
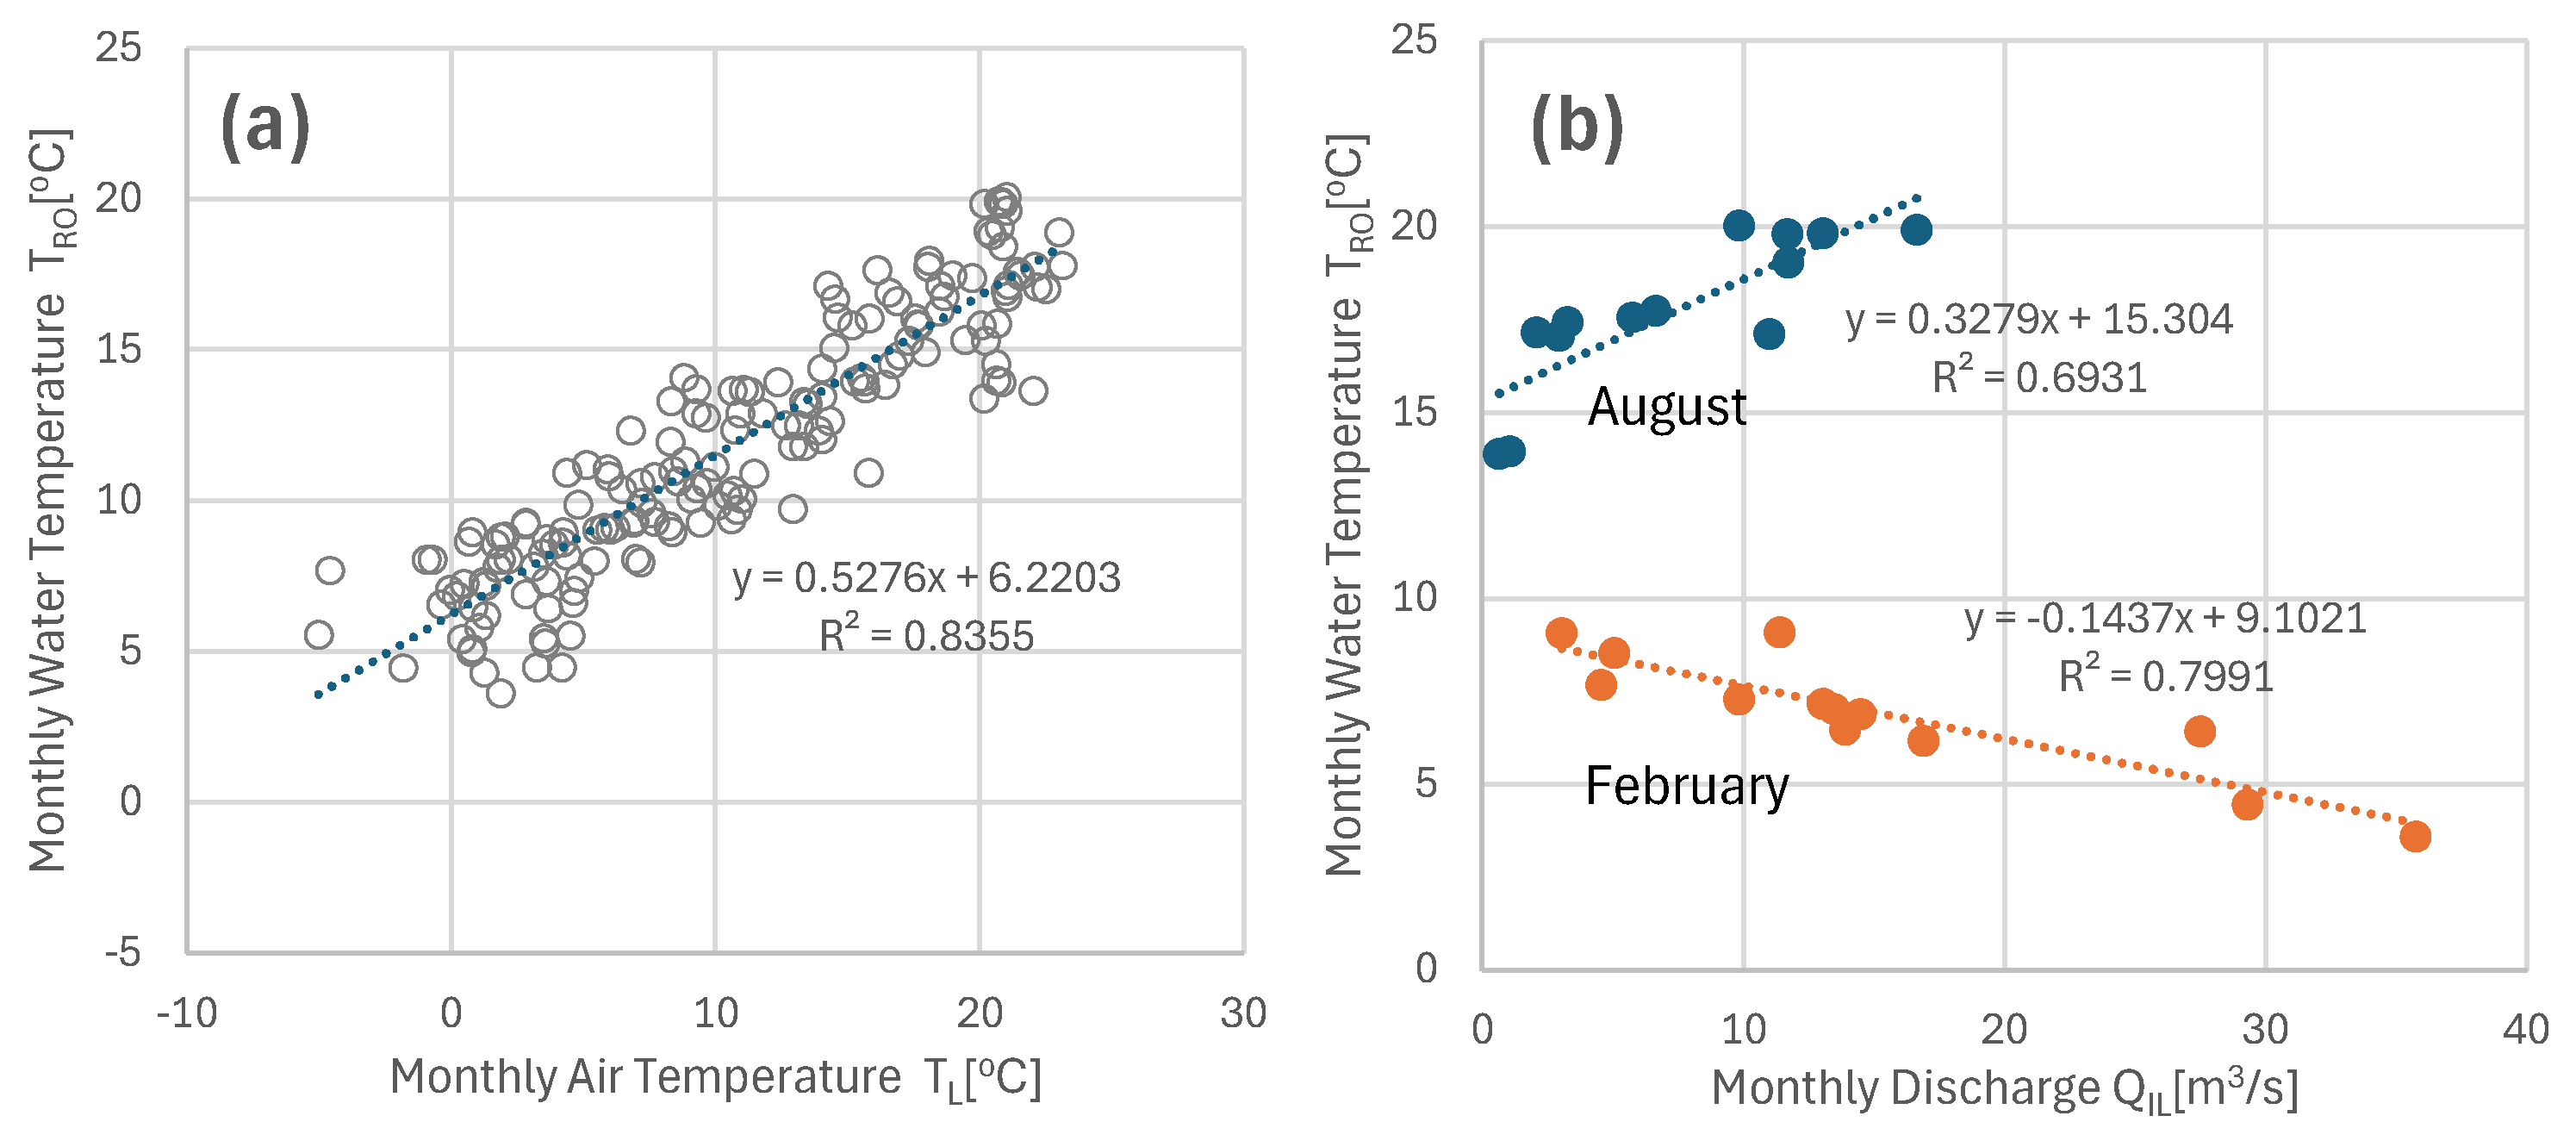
Figure 10.
Mean temperatures, and minimal and maximal registered temperatures for each day of the year for air at the Livno MS and for water at the Ruda Orlovac HS.
Figure 10.
Mean temperatures, and minimal and maximal registered temperatures for each day of the year for air at the Livno MS and for water at the Ruda Orlovac HS.
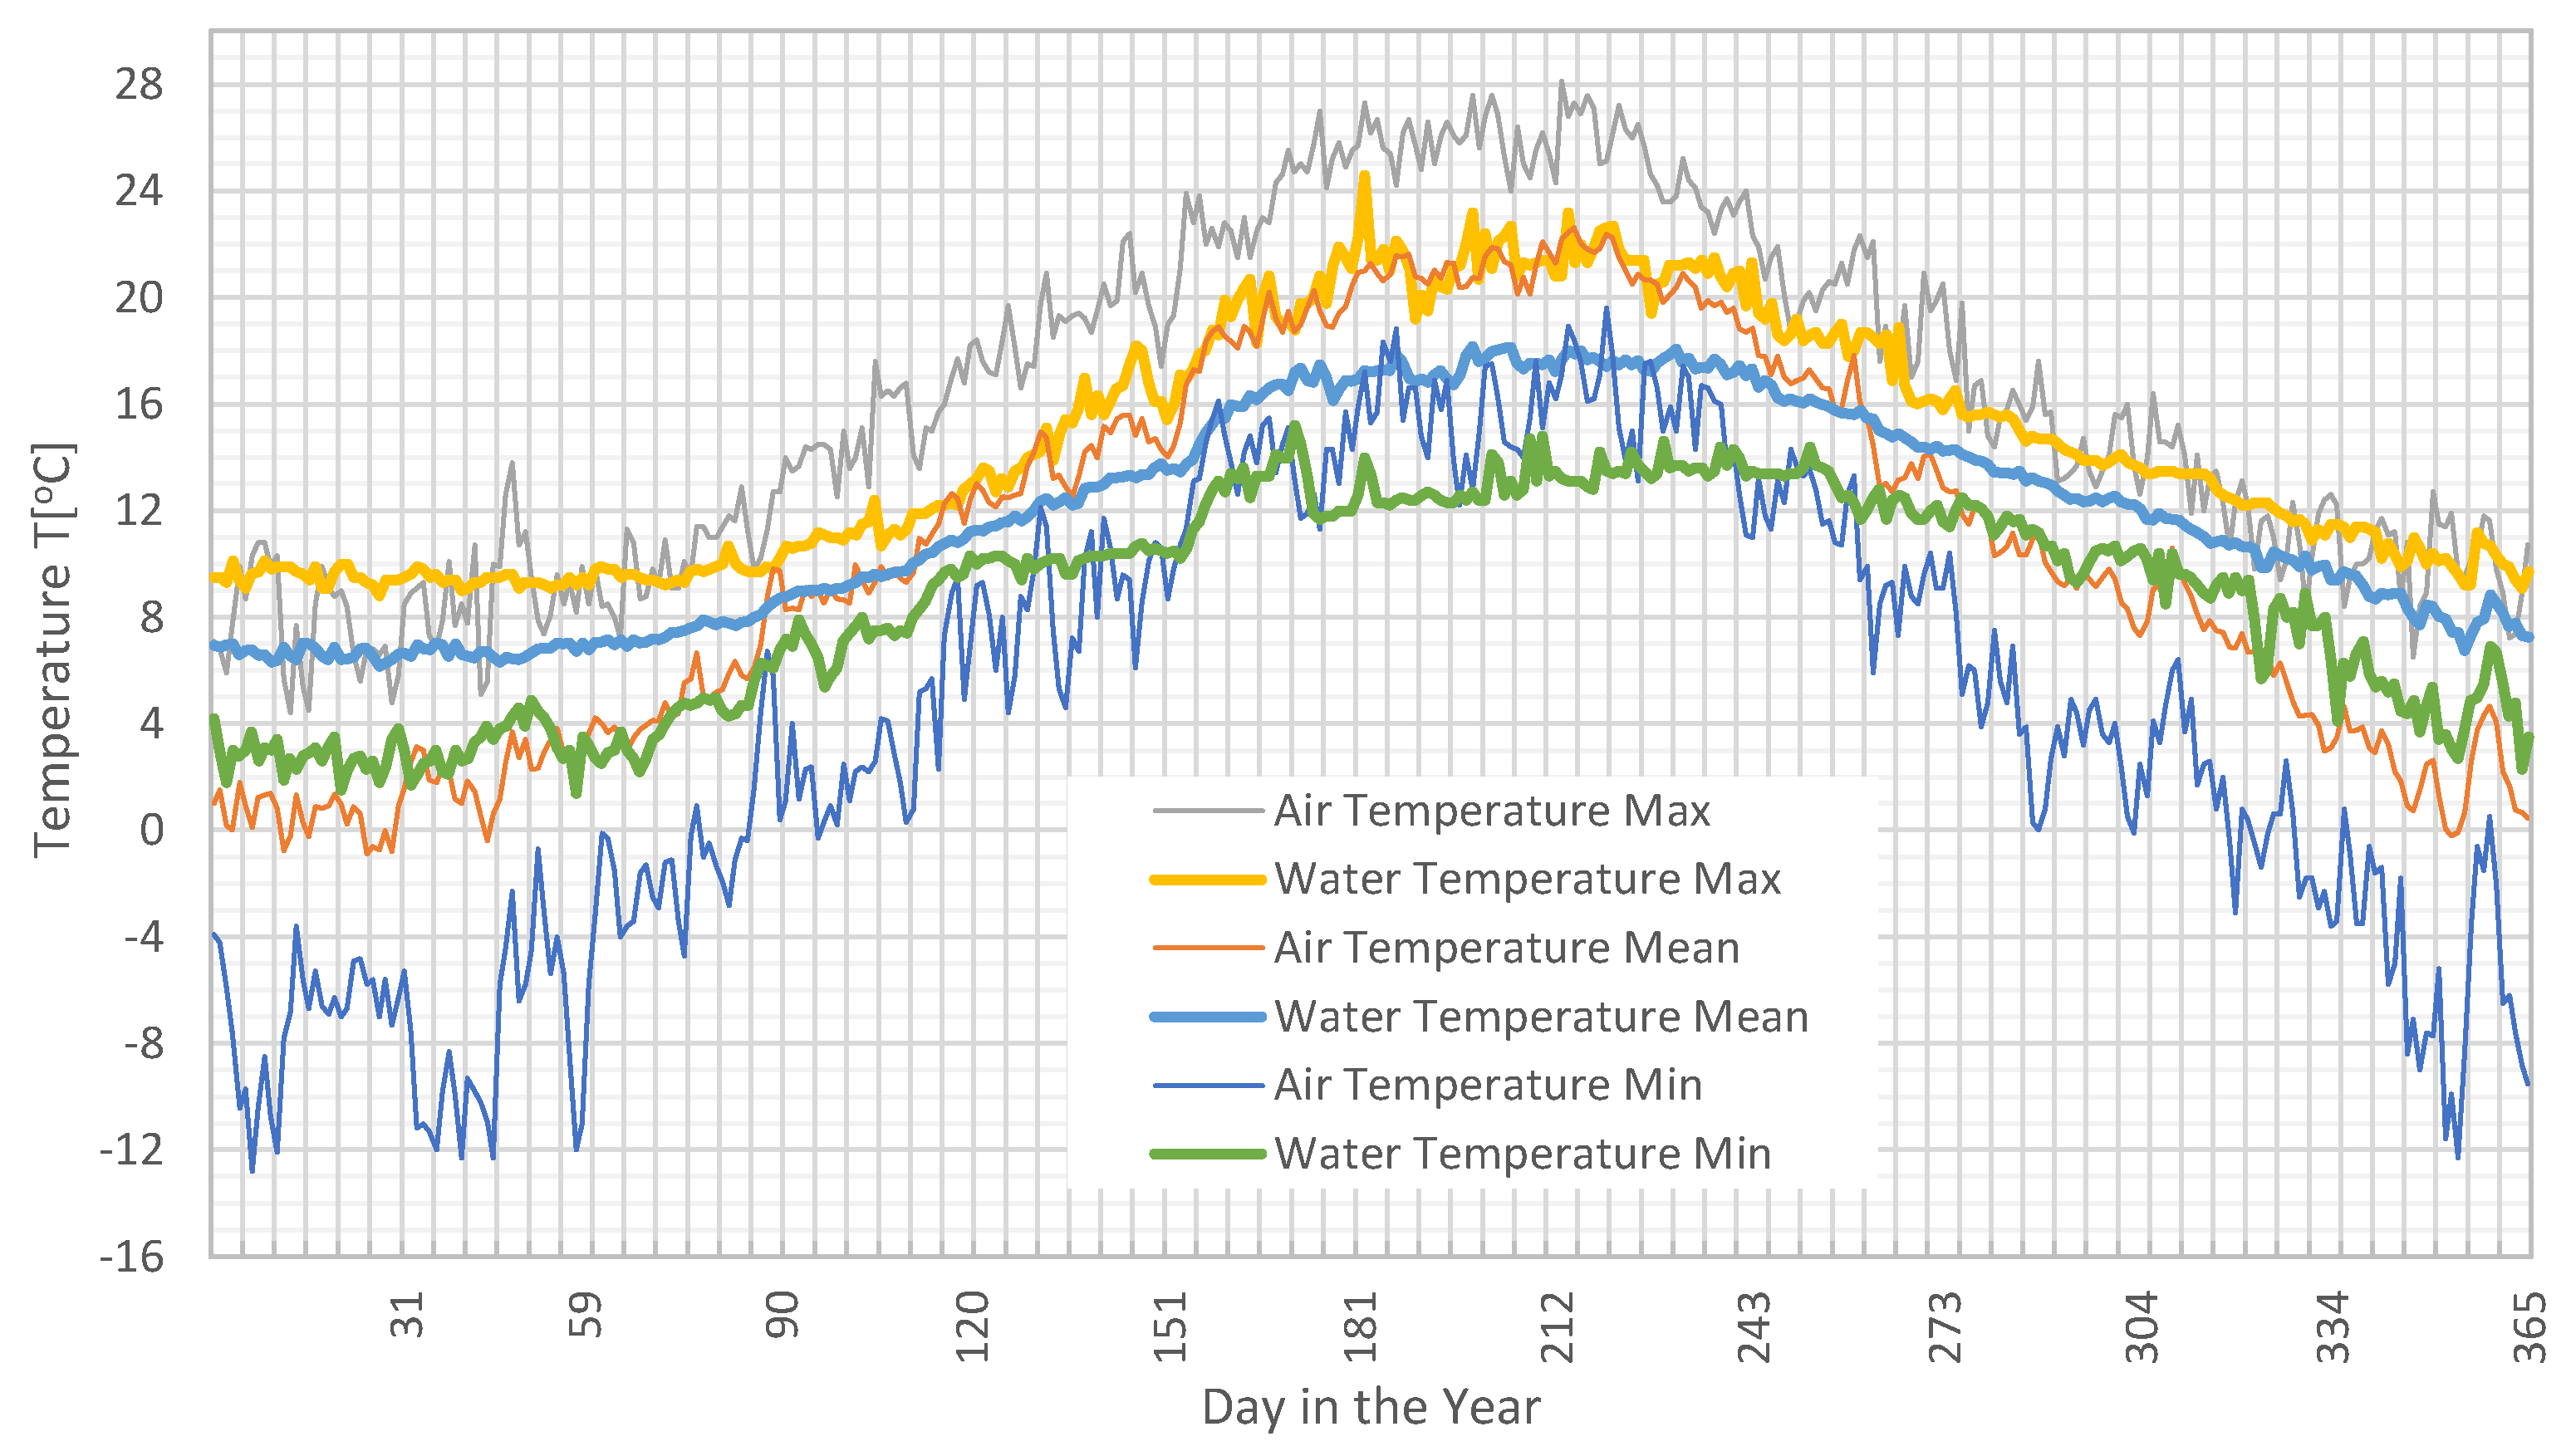
Figure 11.
Mean values, median, minimal and maximal registered values, percentiles P5, and percentiles P95 for each hour of the day for (a) discharges, and (b) water temperatures at Ruda Orlovac HS.
Figure 11.
Mean values, median, minimal and maximal registered values, percentiles P5, and percentiles P95 for each hour of the day for (a) discharges, and (b) water temperatures at Ruda Orlovac HS.
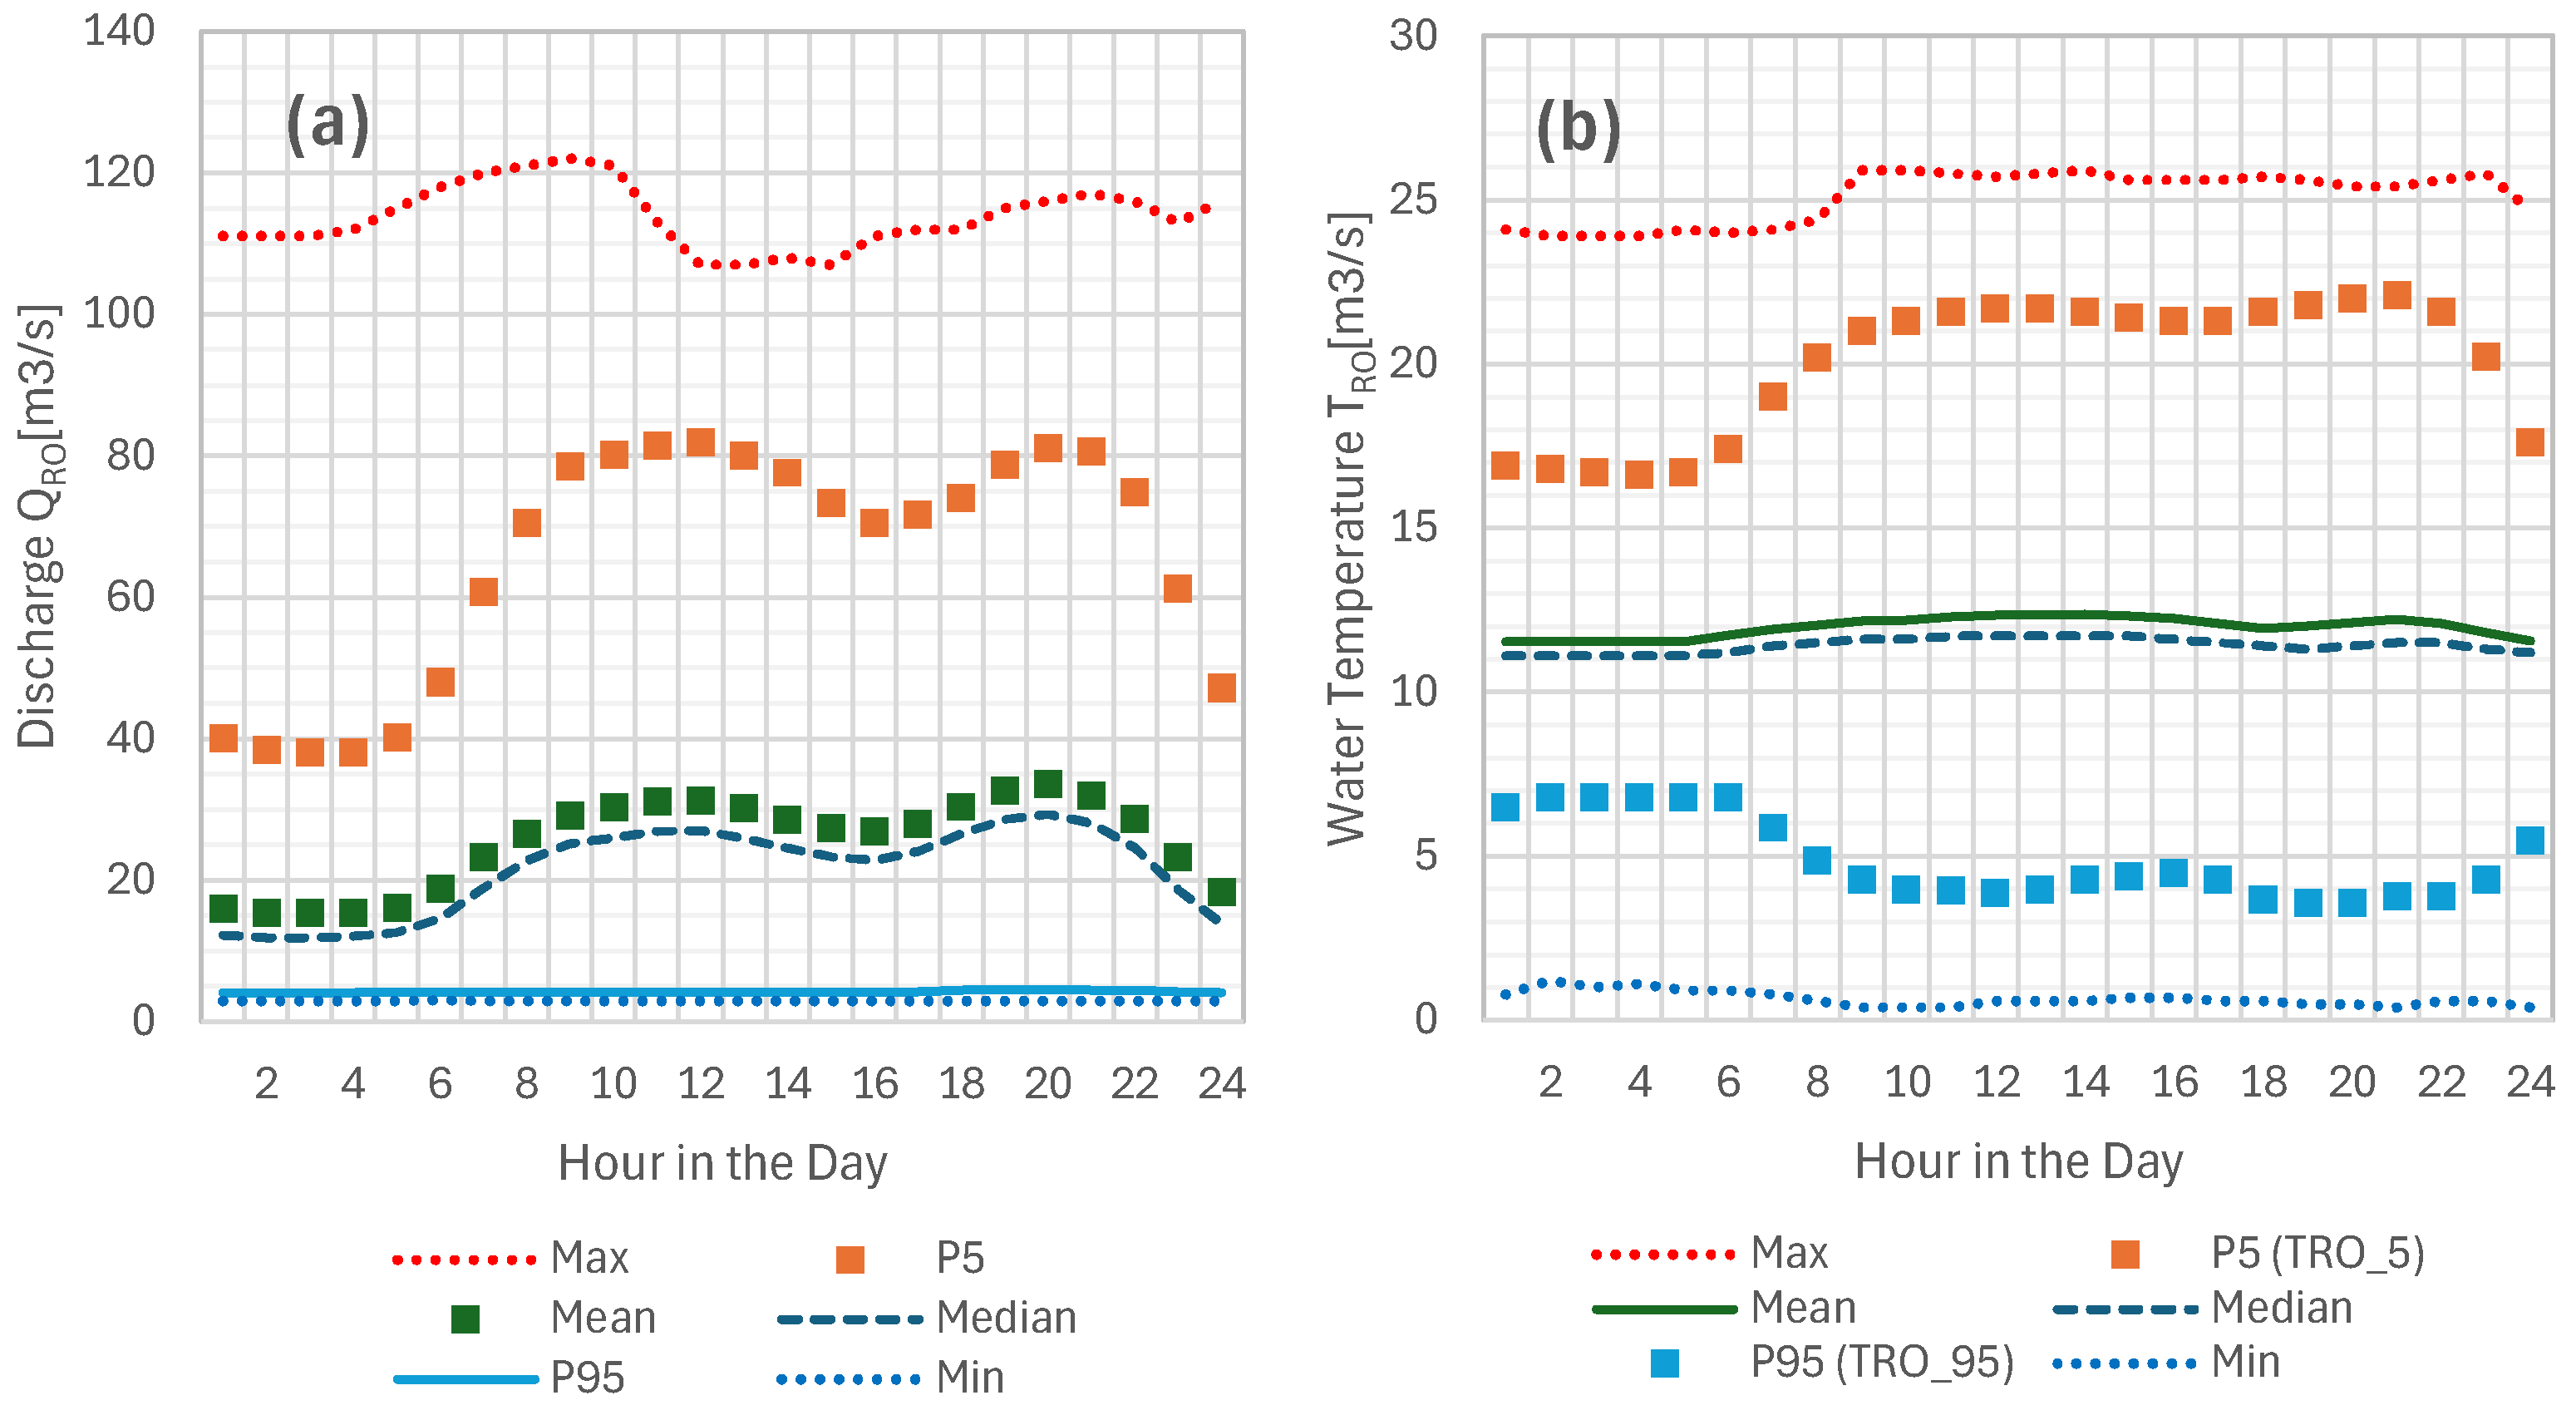
Figure 12.
LR between extreme discharges from Orlovac HP and extreme water temperatures at Ruda Orlovac HS, as well as between mean discharges from Orlovac HP and extreme water temperatures at Ruda Orlovac HS.
Figure 12.
LR between extreme discharges from Orlovac HP and extreme water temperatures at Ruda Orlovac HS, as well as between mean discharges from Orlovac HP and extreme water temperatures at Ruda Orlovac HS.
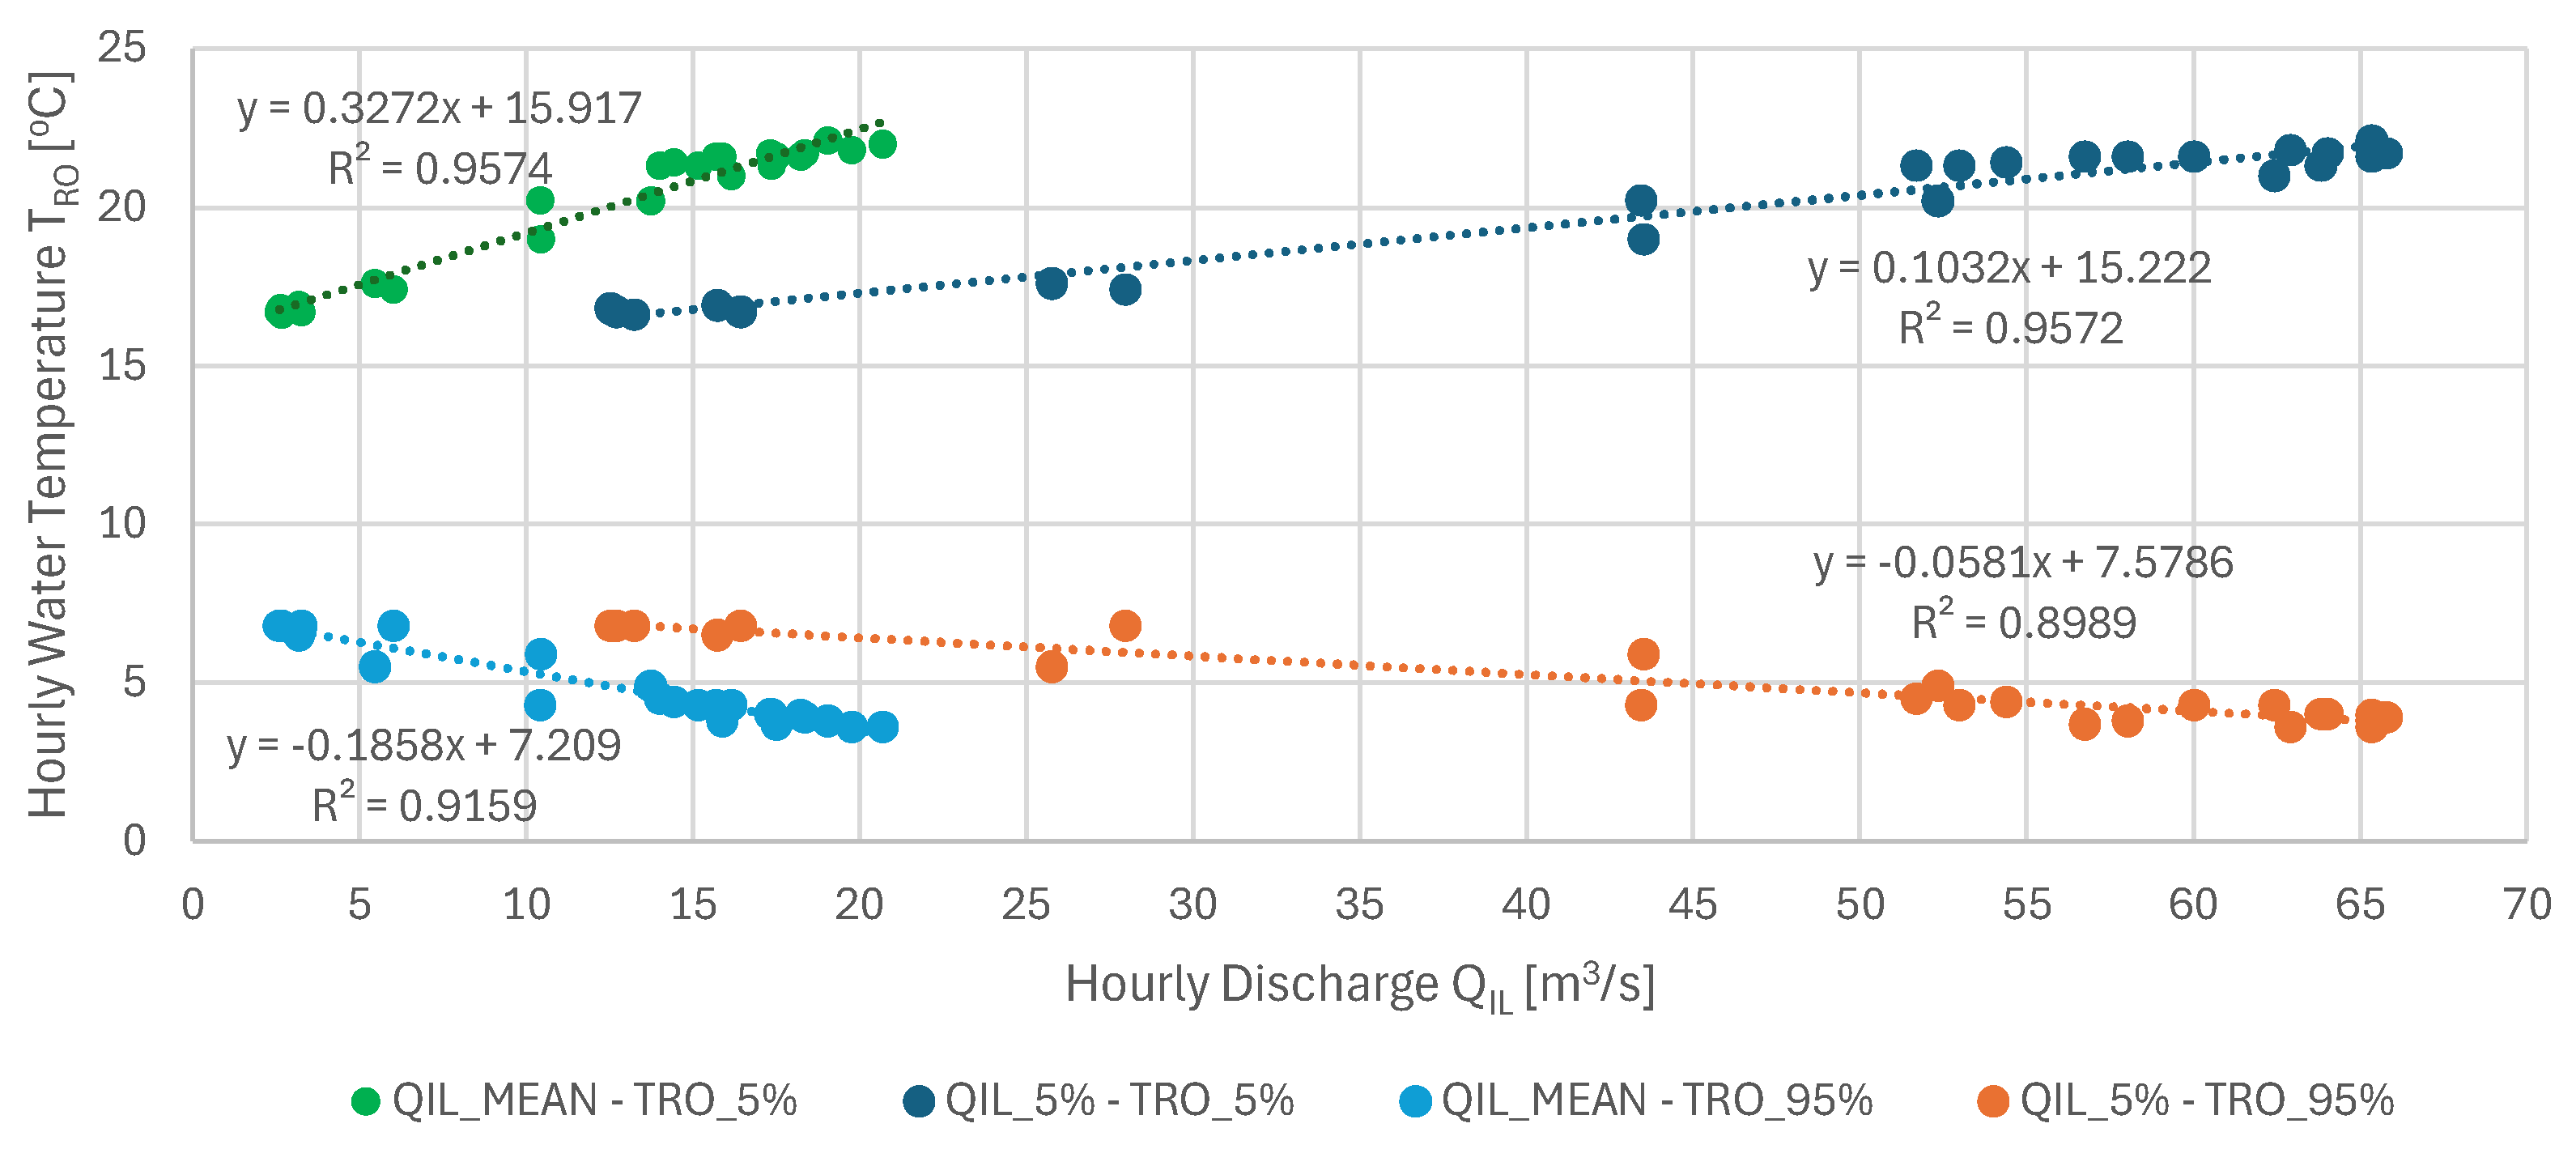

Table 1.
Basic statistical characteristics of air temperatures, precipitations, discharges, and water temperatures, including periods of monitoring, analyzed time steps, minimal and maximal registered values, and means.
Table 1.
Basic statistical characteristics of air temperatures, precipitations, discharges, and water temperatures, including periods of monitoring, analyzed time steps, minimal and maximal registered values, and means.
Disclaimer/Publisher’s Note: The statements, opinions and data contained in all publications are solely those of the individual author(s) and contributor(s) and not of MDPI and/or the editor(s). MDPI and/or the editor(s) disclaim responsibility for any injury to people or property resulting from any ideas, methods, instructions or products referred to in the content. |
© 2026 by the authors. Licensee MDPI, Basel, Switzerland. This article is an open access article distributed under the terms and conditions of the Creative Commons Attribution (CC BY) license (http://creativecommons.org/licenses/by/4.0/).
Copyright: This open access article is published under a Creative Commons CC BY 4.0 license, which permit the free download, distribution, and reuse, provided that the author and preprint are cited in any reuse.


