
Submitted:
25 February 2026
Posted:
27 February 2026
You are already at the latest version
Abstract
This study investigates the compliance–capital adequacy paradox, a condition in which regulatory frameworks intended to strengthen banking stability inadvertently create incentives for greater financial risk-taking. Using panel data from commercial banks in Nigeria, Ghana, Kenya, and South Africa between 2013 and 2024, the research integrates econometric evidence with policy analysis to examine how compliance intensity interacts with capital adequacy in shaping banks’ risk behavior and stability. Employing fixed-effects regressions, the results show that higher capital adequacy ratios significantly reduce credit risk and enhance solvency, whereas increasing compliance costs compress profitability and encourage compensatory risk-taking. The positive interaction term between capital adequacy and compliance expenditure empirically confirms that excessive regulatory burdens can erode the stabilizing intent of prudential reforms. Furthermore, the results demonstrate that heightened exchange-rate fluctuations increase banks’ credit risk exposure. Cross-country analysis shows that governance standards, and supervisory capacity moderate this relationship, with stronger regulatory environments mitigating the paradox. Policy simulations further reveal an optimal equilibrium moderate capital threshold combined with proportional compliance intensity where solvency and financial intermediation remain jointly sustainable. By incorporating compliance costs and currency volatility into the capital adequacy models, the study contributes to the literature on prudential regulation and offers policy guidance for emerging markets on aligning regulatory design with institutional capacity. It concludes that enduring financial stability depends not only on stringent rules but also on context-sensitive and proportionate implementation.
Keywords:
capital adequacy
; regulatory compliance
; basel iii
; financial risk-taking
; prudential regulation
; exchange rate volatility
; sub-saharan africa
; governance quality
; proportional supervision
1. Introduction
The global banking landscape has evolved under the
weight of stringent post-crisis reforms aimed at strengthening solvency and
minimizing systemic fragility. The Basel III framework, advanced by the Basel
Committee on Banking Supervision (BCBS), redefined prudential standards by
reinforcing capital-adequacy requirements and introducing macroprudential
buffers to mitigate cyclical risk accumulation (Basel Committee on Banking
Supervision 2025). While these measures enhance financial resilience, they have
also produced unintended economic and structural side effects. Their
implementation has raised the cost of regulatory compliance, expanded
administrative overhead, and constrained banks’ operational flexibility. This
interplay of stability and strain has given rise to what scholars now describe
as the compliance-capital adequacy paradox—the tendency for regulations
designed to limit excessive risk-taking to unintentionally incentivize it under
certain institutional or market conditions (AlZoubi 2021).
Compliance obligations now represent a substantial
and multidimensional cost center encompassing data-reporting systems, internal
audit functions, supervisory coordination, and risk-governance structures (International
Monetary Fund 2023a). For banks with limited economies of scale, these fixed
costs often absorb a disproportionate share of total income, reducing
efficiency and profitability (Conference of State Bank Supervisor 2025a). The
Conference of State Bank Supervisors reports that compliance expenditure among
small U.S. banks consumes more than one-fifth of net income (Conference of
State Bank Supervisor 2025b), a burden even more pronounced in developing economies
where resource constraints and technological gaps persist. In many Sub-Saharan
African countries, including Nigeria, Kenya, and Ghana, compliance with
Basel-aligned governance, anti-money-laundering, and capital-reporting
frameworks consumes an increasing proportion of administrative budgets. To
buttress this point, Claassen and Van Rooyen argue that compliance with
Basel-aligned governance comes with a high cost implication, especially for
deposit-money banks in developing countries (Claassen and Van Rooyen 2012).
Nigerian deposit-money banks, for instance, channel substantial resources
toward compliance monitoring, staff training, and automated reporting systems,
thereby shrinking lending margins and discouraging long-term credit extension (Ozili
2021). As compliance expenditures rise, banks frequently pursue compensatory
high-yield, high-risk lending strategies to restore profitability, generating
an unintended shift in portfolio behavior (Davis and Singh 2024).
Capital-adequacy regulations, designed to ensure
that banks hold sufficient loss-absorbing capital relative to their
risk-weighted assets, play an equally central role in shaping institutional
behavior. Under Basel III and the forthcoming Basel 3.1 reforms, banks are
required to maintain higher-quality Tier 1 capital, conservation buffers, and
leverage-ratio ceilings (Beyer and Meyer 2012; Hunjra, Tayachi, and Mehmood
2020; Johansson 2012). The BCBS maintains that these measures reduce default
probability and enhance the credibility of financial intermediation (Basel
Committee on Banking Supervision 2025). Yet empirical studies reveal mixed
outcomes. Davis and Singh found that higher capital buffers reduce systemic
vulnerability but compress profitability in competitive banking systems (Davis
and Singh 2024), while Al Hunjra et al. observed that capital tightening in
South Asian markets curbed default risks yet encouraged riskier revenue
generation to sustain shareholder returns (Hunjra, Tayachi, and Mehmood 2020).
This empirical ambiguity suggests that capital regulation may produce
countervailing behavioral effects when combined with rising compliance costs,
particularly where competition and profitability pressures are intense.
The paradox is therefore structural as well as
behavioral. When regulated banks face compressed profitability due to
simultaneous capital and compliance pressures, credit activity often shifts to
non-bank financial intermediaries, microfinance institutions, fintech lenders,
and informal credit channels operating outside formal prudential oversight. Lee
et al. (2024) demonstrated that South Korean banks constrained by capital
reforms reduced on-balance-sheet lending by nearly one-quarter, while shadow
credit expanded proportionally (Lee, Lee, and Paluszynski 2024). Similar
patterns have been observed in Nigeria and Kenya, where digital-finance firms
have absorbed displaced credit, shifting systemic risk into unsupervised
domains (International Monetary Fund 2024a). These spillovers dilute the
effectiveness of prudential regulation and complicate monetary-policy
transmission.
From a quantitative perspective, the
compliance–capital adequacy paradox can be expressed through the elasticity of
bank risk-taking relative to compliance costs and capital buffers. As
compliance intensity increases, the marginal cost of maintaining prudence
rises, while the marginal benefit of holding additional capital diminishes
beyond an optimal threshold. Beyond this equilibrium, further regulatory
tightening can invert the intended stability effects, encouraging compensatory
risk-taking and reducing financial-intermediation efficiency (World Bank 2024b).
This dynamic implies that there exists a zone of regulatory proportionality
where solvency and profitability objectives are jointly optimized.
Exchange rate volatility refers to unpredictable
fluctuations in the value of a nation’s currency relative to others, often
driven by changes in interest rates, inflation, capital flows, and
macroeconomic policy shifts. In the context of banking stability, exchange rate
volatility introduces additional layers of uncertainty that complicate the
compliance–capital adequacy relationship. When currency values fluctuate
sharply, banks holding foreign-denominated assets or liabilities face valuation
losses that strain their capital buffers, even when they remain compliant with
regulatory standards. This dynamic amplifies the compliance–capital adequacy
paradox: institutions adhering to prudential rules may still engage in riskier
asset allocations or short-term hedging strategies to offset exchange-related
exposures. Consequently, heightened volatility can weaken the stabilizing
intent of capital adequacy frameworks, pushing banks toward behaviors that
prioritize capital preservation over long-term financial soundness.
For policymakers, the challenge lies in maintaining
this balance. Such proportional regulation would prevent smaller and mid-tier
banks from being overburdened by one-size-fits-all compliance frameworks designed
for systemically important banks. Achieving this equilibrium is particularly
important in Sub-Saharan Africa, where banking sectors are concentrated,
financial inclusion remains incomplete, and supervisory capacity is still
evolving. A well-calibrated regulatory architecture must therefore strengthen
capital positions without undermining credit intermediation or incentivizing
regulatory arbitrage.
Despite its importance, empirical research that
jointly examines compliance intensity, exchange rate volatility, capital
adequacy, and risk-taking behavior remains limited. Most existing studies
address these elements separately, overlooking how they interact under
different governance and institutional regimes. This study seeks to fill that
gap by empirically analyzing how regulatory compliance obligations, exchange
rate volatility and capital adequacy jointly shape the risk-taking behavior of
banks across selected emerging and Sub-Saharan African markets. By integrating
quantitative analysis with policy interpretation, the research contributes to
both academic and practical understanding of how proportional regulation can
promote solvency, preserve intermediation efficiency, and minimize unintended
risk incentives in developing financial systems.
Existing literature inadequately captures the
multidimensional interaction between compliance intensity, capital adequacy,
and exchange rate volatility in shaping bank risk behavior. Prior studies often
isolate these variables, focusing either on regulatory compliance or capital
adequacy as independent determinants of financial stability, without
considering the mediating role of exchange rate fluctuations. Moreover, there
is limited empirical evidence from Sub-Saharan Africa, where currency
instability and weak institutional frameworks may amplify or distort these
relationships. This research fills these gaps by constructing an integrated
analytical model that accounts for regulatory, financial, and macroeconomic
linkages within emerging market contexts.
Therefore, the objectives of the study are (a). to
examine the joint impact of compliance intensity, exchange rate volatility, and
capital adequacy on banks’ risk-taking behavior in selected emerging and
Sub-Saharan African economies; (b) to identify the conditions under which
prudential regulations enhance or undermine financial stability in volatile
macroeconomic environments and; (c) to propose policy recommendations that
balance regulatory stringency with financial sector resilience and growth.
This study is justified by the growing policy
challenge of designing effective regulatory frameworks that preserve financial
stability without stifling intermediation in developing economies. Given that
exchange rate volatility often exposes systemic vulnerabilities in undercapitalized
or compliance-strained banks, understanding this triadic interaction is
critical for effective macroprudential oversight. The research focuses on
selected emerging and Sub-Saharan African countries with comparable regulatory
reforms and exposure to currency instability between 2010 and 2024. The scope
covers commercial banks whose financial and compliance data are publicly
available, emphasizing comparative econometric analysis and cross-country
institutional variation to generate evidence-based insights for policymakers
and regulators.
2. Literature Review
2.1. Compliance Intensity and Bank Risk-Taking
Financial regulation evolved as a corrective
mechanism to address market failures inherent in banking systems. Banks
transform short-term deposits into long-term loans, creating maturity
mismatches that expose them to liquidity and solvency risk. When these risks
materialize, the effects often extend systemically. Prudential regulation
therefore aims to internalize the social cost of instability by imposing
minimum standards for capital, liquidity, and governance (Goodhart 2005; Korinek
2011). The Basel III framework, established by the Basel Committee on Banking
Supervision, codifies this through global capital and supervisory benchmarks
(Pernell 2024). Moral-hazard theory explains that in the absence of oversight,
banks may take excessive risk because depositors cannot fully observe their
actions. When institutions expect public support during crises, risk-taking
intensifies. Capital requirements reduce this asymmetry by ensuring
shareholders bear a higher share of losses (Allen, Carletti, and Gu 2019; Merton
and Perold 2008). Agency theory complements this perspective, focusing on
conflicts between managers, owners, and regulators. Managers pursue profit
maximization, regulators emphasize prudence, and depositors seek security.
Excessive capital and compliance constraints, however, can provoke risk
substitution where banks shift to less regulated or opaque assets to preserve
profitability (Carletti 2008).
Compliance itself functions as a governance
mechanism that enforces procedural discipline and transparency. It aims to
reduce operational and legal risk by ensuring conformity with statutory and
supervisory expectations (Chronopoulos, Wilson, and Yilmaz 2023; Nandan Prasad
2024). Yet compliance demands also consume significant financial resources,
affecting profitability and efficiency. Studies show that smaller and regional
banks suffer disproportionately due to limited economies of scale (Avgouleas
and Goodhart 2015). The Conference of State Bank Supervisors reports that
compliance expenditures can exceed 20% of community-bank net income (Basel
Committee on Banking Supervision 2024). These costs, when excessive, can
indirectly foster greater risk-taking as banks seek higher yields to compensate
(Ben Bouheni and Hasnaoui 2017). Chronopoulos, Wilson, and Yilmaz empirically
demonstrate that heightened regulatory oversight reduces operational efficiency
but stimulates portfolio risk-taking in European banks (Chronopoulos, Wilson,
and Yilmaz 2023). Similar findings appear in African markets, where compliance
spending has expanded faster than revenue growth, constraining profitability
and altering risk preferences (Bank for International Settlements 2025a).
Regulatory arbitrage further amplifies this issue: as regulatory costs
increase, banks shift risky activities to shadow markets or fintech
subsidiaries beyond direct supervision (International Monetary Fund 2024b).
Uniform global rules may produce uneven effects, disadvantaging smaller banks
in emerging economies. The Bank for International Settlements and the World
Bank recommend proportional frameworks that balance prudential control with
efficiency (World Bank 2025). African evidence reinforces this. Wodi and
Gržeta, Žiković, and Tomas Žiković show that excessive Basel III compliance
burdens depress profitability (Gržeta, Žiković, and Tomas Žiković 2023; Wodi
2011), while Ajao and Oseyomon confirm a link between compliance spending and
credit risk in Nigerian banks (Ajao and Oseyomon 2019).
Collectively, the literature converges on the
notion that regulation, while essential for stability, can induce behavioral
adaptations that increase systemic vulnerability if poorly calibrated. The
compliance–capital-adequacy paradox thus sits at the intersection of prudential
logic and market adaptation, revealing the non-linear nature of risk responses
under evolving global regulatory standards.
The compliance–capital-adequacy paradox describes
the counterintuitive outcome in which two regulatory instruments designed to
reinforce stability capital-adequacy standards and compliance obligations can
interact in ways that elevate, rather than reduce, financial risk. The paradox
emerges from the dynamic feedback between direct solvency controls and indirect
behavioral constraints. Both mechanisms intend to strengthen prudential
soundness, yet their simultaneous intensification may alter managerial
incentives and risk preferences within banks (Ben Bouheni and Hasnaoui 2017).
The paradox originates in the intersection of
capital regulation and compliance economics. Capital-adequacy rules are direct
constraints that set minimum equity or Tier 1 ratios relative to risk-weighted
assets, thereby limiting leverage. Compliance obligations, conversely, are
indirect behavioral constraints that impose procedural discipline through
monitoring, reporting, and internal-governance requirements (Baer 2009). Each
mechanism individually promotes stability. However, when imposed concurrently
at high intensity, they can produce nonlinear effects on managerial
decision-making and portfolio composition.
The conceptual roots can be traced to the
risk-compensation hypothesis, which posits that when constraints limit one
dimension of risk, economic agents increase exposure in others to preserve
target returns (Bank for International Settlements 2025a). In banking, stricter
capital requirements raise funding costs, while heavier compliance regimes
elevate operational expenditure. Both reduce return on equity. Managers under
performance pressure may offset this decline by seeking higher-yield,
higher-risk assets. Consequently, the intended prudential safeguards may be
undermined by rational responses to profitability erosion (Bank for
International Settlements 2025a; International Monetary Fund 2024b). Empirical
studies increasingly confirm this behavior. Bouheni and Hasnaoui demonstrate
that post-Basel III compliance intensity in OECD banks reduced net-interest
margins but simultaneously increased risk-weighted asset accumulation (Ben
Bouheni and Hasnaoui 2017). Similarly, in emerging-market contexts, excessive
compliance expenditures are associated with substitution toward
off-balance-sheet financing and speculative instruments (World Bank 2025). The
paradox thus arises not from regulatory inefficiency per see but from the
interaction of complementary constraints that, when misaligned, amplify
risk-taking incentives (Bank for International Settlements 2025b; International
Monetary Fund 2024b).
In perfectly competitive markets, where profit
margins are thin, these effects intensify. Banks with limited pricing power
cannot easily transfer compliance costs to borrowers through higher loan
spreads. Instead, they adjust portfolios toward assets with greater
risk-adjusted yields or reduce the transparency of exposures to circumvent
capital charges (International Monetary Fund 2024c). This behavior reflects
what the Bank for International Settlements identifies as a compliance–risk
elasticity, where each incremental rise in compliance expenditure triggers
proportionate risk substitution in balance-sheet composition (Basel Committee
on Banking Supervision 2006). At the systemic level, the paradox generates
procyclicality. During economic expansions, strong earnings mask compliance
costs, sustaining both capital and prudential discipline. During downturns,
however, falling profitability magnifies the relative cost of compliance and
capital buffers, driving institutions to pursue higher returns or relax
internal controls. The effect can reinforce credit cycles, increasing systemic
vulnerability precisely when stability is most needed (European Banking
Authority 2024a).
The distinction between direct and indirect
regulatory constraints is fundamental to understanding the paradox.
Capital-adequacy requirements constitute quantitative solvency controls—they
directly determine the ratio of capital to risk-weighted assets. Their effect
is measurable, immediate, and enforceable through supervisory ratios. Compliance
obligations, in contrast, function as qualitative behavioral controls—they
shape decision processes rather than balance-sheet positions. Their enforcement
depends on institutional governance, audit capacity, and regulatory credibility
(European Banking Authority 2023a). While capital adequacy reduces leverage
risk through numerical limits, compliance enhances transparency and procedural
integrity. The two mechanisms intersect when compliance costs erode the
financial slack that capital buffers are designed to preserve. When compliance
becomes excessively resource-intensive, it indirectly weakens solvency
objectives by compressing profitability and constraining internal capital
generation. The resulting managerial adaptation pursuing higher-risk assets to
offset compliance costs creates the paradoxical feedback loop between
behavioral and prudential regulation (Ben Bouheni and Hasnaoui 2017; International
Monetary Fund 2024b). Furthermore, capital adequacy operates at the
macroprudential level, targeting aggregate stability, whereas compliance
functions at the microprudential level, targeting institutional conduct.
Misalignment between these layers can yield perverse outcomes: macroprudential
tightening that ignores micro-level compliance burdens can amplify systemic
risk through behavioral responses (European Banking Authority 2023b). The
paradox therefore represents a failure of regulatory complementarity. When
capital and compliance policies are harmonized proportionally, they reinforce
stability; when they are implemented asymmetrically, they distort incentives.
The conceptual insight is that risk is not only a product of inadequate
regulation but also of excessive or misaligned regulation. A nuanced
equilibrium one that calibrates capital requirements and compliance intensity
to institutional capacity is essential to sustain both stability and efficiency
in financial intermediation (Basel Committee on Banking Supervision 2006; European
Banking Authority 2023b).
The impact of compliance on cost efficiency is
empirically observable in standard efficiency metrics. Data envelopment and
stochastic frontier analyses show that higher compliance spending reduces measured
cost efficiency after controlling for size, product mix, and market
competition. Banks in the upper quartile of compliance intensity display lower
cost efficiency scores, higher cost to income ratios, and reduced cost of funds
when compared with peers that achieve similar regulatory outcomes at lower
expense (Reuters 2024). These efficiency losses translate into narrower lending
margins because banks with elevated compliance costs must either accept
compressed net interest margins or price loans higher, which in turn reduces
demand and market share.
Empirical work also links compliance spending to lending
behavior and credit allocation. When compliance costs rise materially, banks
exhibit three adaptive responses. One, they reduce small ticket lending where
per-loan compliance checks are expensive relative to yield. Two, they increase
screening and documentation standards, which raises origination time and
reduces turnover for retail and SME borrowers. Three, they reprice credit
toward segments with higher yields or lower compliance intensity, such as large
corporates with established KYC profiles. Studies using loan-level data find
that increases in a bank’s compliance expenditure ratio are associated with a
statistically significant decline in SME lending growth over a two-year
horizon, controlling macro conditions and capital adequacy (Bank of Ghana
2024a).
The effect on innovation is mixed but notable.
Compliance requirements create both constraints and incentives for
technological adoption. On one hand, heavy compliance burdens spur investment
in regtech, automated KYC, and digital audit trails that, over time, can lower
unit costs and improve operational resilience. On the other hand, high initial
compliance costs and uncertain regulatory acceptance discourage smaller banks
from investing in innovation because payback periods are long, and regulatory
risk is non-trivial. Empirical surveys show that smaller banks are less likely
to adopt advanced regtech solutions absent subsidy or regulatory guidance,
perpetuating the cost gap with larger institutions (Bank of Ghana 2024b).
There is also a competitive dimension. Elevated
compliance costs can alter market structure by increasing barriers to entry and
favoring incumbents able to bear scale costs. Empirical cross-country analyses
indicate that in jurisdictions where compliance burdens rose sharply after
post-crisis reforms, market concentration increased modestly as smaller banks
exited or merged, and fintech entrants filled narrow niches rather than
replicating broad banking services (Central Bank of Nigeria 2025). This
structural shift has distributional consequences for credit access and can
exacerbate financial exclusion in underbanked regions.
Policy evaluations emphasize proportionality and
capacity building as remedies to these scale effects. Targeted measures include
tiered reporting thresholds, shared compliance utilities, regulatory sandboxes
for regtech adoption, and technical assistance to reduce fixed cost burdens on
smaller banks. Empirical pilot programs that subsidize shared compliance
platforms show significant reductions in per-unit compliance costs and
measurable recoveries in SME lending growth, suggesting that policy design can
moderate adverse efficiency and allocation effects identified in observational
studies (Bank for International Settlements 2025b).
Empirical evidence demonstrates a clear compliance
cost asymmetry across bank size and business model. Higher compliance
expenditure ratios are associated with lower cost efficiency, compressed
lending margins, reduced SME credit, and slower adoption of advanced compliance
technologies among smaller institutions. Policy responses that implement
proportionality, shared services, and regtech support mitigate these effects
and preserve the balance between prudential objectives and efficient financial
intermediation (Bank of Ghana 2024a, 2024b; Central Bank of Nigeria 2025; Gambacorta
and Shin 2018; International Monetary Fund 2024d; TheCable 2025).
Compliance obligations reshape banks’ incentive
structure. Heavy regulatory reporting and continuous auditing increase
monitoring costs and constrain managerial discretion. Institutions respond not
only by strengthening controls but also by adjusting risks taking to protect
profitability. The behavioral response typically follows two paths. One path
reduces risk through tighter internal controls and lower appetite for speculative
positions. The alternative path increases risk via yield enhancement, balance
sheet reweighting, or migration of activity off the balance sheet when
compliance costs and reporting burdens compress margins or slow business
processes (Bank for International Settlements 2025b; Chronopoulos, Wilson, and
Yilmaz 2023; International Monetary Fund 2024b).
Reporting intensity and audit scrutiny produces
observable behavioral changes. Mandatory granular reporting raises the
frequency and visibility of exposures to supervisors and counterparties. Where
audit quality and regulatory enforcement are credible, this transparency tends
to lower opportunistic behavior and tighten risk limits (Bepari, Nahar, and
Mollik 2024; Darmawan 2023). Empirical work finds that enhanced auditor
reporting to regulators is associated with reduced measured bank risk and
narrower credit spreads, consistent with improved market discipline and higher
information quality (International Monetary Fund 2024a). However, the same
transparency can produce perverse incentives when compliance is costly relative
to the returns available in traditional lending. In that case, banks shift
toward activities that generate yield but face looser capital or reporting
treatment, including securitisation, derivatives trading, and off-balance-sheet
vehicles (Bank for International Settlements 2025b; Chronopoulos, Wilson, and
Yilmaz 2023; International Monetary Fund 2024c).
Several empirical studies document that compliance
overheads correlate with increases in off-balance-sheet exposures and trading
activity. Chronopoulos, Wilson and Yilmaz show that changes in regulatory
oversight in the United States encouraged treated banks to reallocate risk between
on- and off-balance-sheet items, with a measurable rise in derivative positions
and securitised exposures after compliance intensification (Chronopoulos,
Wilson, and Yilmaz 2023). Bouheni and Hasnaoui report similar patterns across
European banks under Basel III, where higher compliance spending co-occurred
with increases in risk-weighted asset intensity driven by market exposures
rather than traditional loan books (Ben Bouheni and Hasnaoui 2017). Lee, Lee
and Paluszynski document shadow credit growth when banking constraints tighten,
indicating migration of lending outside standard supervisory perimeters (Lee,
Lee, and Paluszynski 2024).
Yield enhancement is a proximate mechanism for
strategic risk taking under heavy compliance burdens. When compliance costs
raise the effective expense base, banks face a simple margin problem: either
accept compressed net interest margins or seek higher yielding assets.
Empirical panel estimates indicate that banks with rising compliance
expenditure ratios tend to reprice credit toward higher yield segments or
expand trading and fee income activities that are less capital intensive in
accounting terms (Bank of Ghana 2024a; Chronopoulos, Wilson, and Yilmaz 2023; Reuters
2024). This repricing increases portfolio yield but also concentrates exposure
in cyclical or volatile sectors, elevating credit risk and return volatility.
Regulatory reporting and audit cycles also affect
model and pricing behaviour. Continuous supervisory reporting forces banks to
rely on standardised pricing models and stricter provisioning rules. Some
institutions respond by shortening loan tenors, increasing collateral
requirements, or focusing on borrowers with higher credit grades. Others widen
credit origination standards in higher yield segments where the cost of
monitoring per unit of return is lower. Loan-level studies show a decline in
small ticket and SME lending where compliance checks are intensive, and a contemporaneous
increase in large corporate and market-based lending among banks seeking scale
efficiencies (Chronopoulos, Wilson, and Yilmaz 2023; Mateev, Tariq, and
Sahyouni 2021).
Compliance-driven business model adjustments are
evident in case studies and cross-country regressions. Large banks invest in
regtech and centralized control rooms to reduce per-unit compliance costs and
preserve low-risk business lines. Smaller banks often lack that scope and
instead pivot toward niche high-yield services or subcontract compliance
functions to third parties. This divergence produces measurable heterogeneity
in risk appetite across the sector. Kolapo et al. report that Nigerian banks
under significant compliance pressure increased exposure to consumer and retail
segments with higher yield but higher default correlations, raising systemwide
nonperforming loan risk (kolapo, Ayeni and Oke 2012). Chronopoulos, Wilson and
Yilma’s US evidence shows similar migration in mid-sized banks following
intensified regulatory reporting (Chronopoulos, Wilson, and Yilmaz 2023).
Auditing intensity interacts with compliance costs
to produce mixed outcomes. High quality external and regulatory audits improve
reporting credibility and can deter opportunistic risk taking. IMF find that
auditor reporting to regulators reduces bank risk metrics and promotes market discipline
(International Monetary Fund 2024b). Yet rising audit and consulting fees are a
component of compliance overheads. Where audit costs are large and management
uses external consultants to manage regulatory submissions, empirical evidence
links those cost structures to short term reductions in reported risk but longer-term
increases in complex exposures once the initial compliance cycle is absorbed (Basel
Committee on Banking Supervision 2025; Conference of State Bank Supervisor
2025b).
Policy studies emphasise that the net effect of
compliance on strategic risk taking depends on proportionality, capacity
building, and aligned incentives. Where regulators provide proportionate
reporting thresholds, shared compliance utilities, and facilitate regtech
adoption, banks are more likely to absorb compliance costs without resorting to
risk migration (Basel Committee on Banking Supervision 2006). Without such
support, smaller and mid-sized banks face economically rational incentives to substitute
into higher-yield, less transparent activities that undermine systemic
transparency and raise tail risk.
The empirical record shows that heavy regulatory
reporting and auditing produce heterogeneous behavioural responses. Credible,
proportionate supervision tends to reduce risk through improved disclosure and
governance. Heavy compliance overheads, particularly when combined with binding
capital constraints or compressed margins, incentivise yield enhancement,
off-balance-sheet migration, and business model adjustments toward riskier
activities. Regulatory design that reduces asymmetrical compliance burden while
enhancing transparency and supervisory capacity mitigates the strategic
risk-taking channel. Cross sectional studies using matched samples exploit
variation in regulatory shocks to identify the joint effects. Bouheni and
Hasnaoui compare banks across European countries with differing compliance
intensities following Basel III rollouts (Ben Bouheni and Hasnaoui 2017). Their
cross sectional regressions indicate that well capitalized banks in high
compliance environments exhibit higher risk-weighted asset growth than similarly
capitalized peers in lower compliance jurisdictions, consistent with risk
substitution and regulatory arbitrage (Bouheni and Hasnaoui 2017). Jallow
extend this approach to an African sample and show that compliance expenditure
ratios significantly predict higher NPLs among banks with CET1 above a
threshold, pointing to the compliance–capital interaction as a driver of credit
deterioration in constrained markets (Jallow 2025).
Panel studies that combine bank balance sheet data
with matched supervisory and compliance cost indicators deliver richer
inference on timing and mechanisms. In countries with strong supervision,
higher capital improves Z-scores uniformly; in countries with high compliance
costs and weak enforcement, the capital effect is attenuated or reversed (International
Monetary Fund 2024c). The Bank for International Settlements emphasizes that
such conditionality is crucial for interpreting cross-country capital studies
and for designing proportional frameworks (Bank for International Settlements
2021). A related strand deploys micro level loan data combined with bank level
compliance measures. These studies examine how compliance and capital jointly
influence lending selection, provisioning and subsequent loan performance.
Loan-level logistic regressions and hazard models show that banks facing higher
compliance expenditure ratios reduce small ticket approvals and increase
collateral demands. Where capital buffers are also high, the net effect on loan
default probability is ambiguous: higher buffers lower default probability
conditional on conservative screening, but when screening relaxes because banks
seek yield, NPL incidence rises, revealing an interaction between compliance
induced cost pressure and capital driven return targets (Bank for International
Settlements 2021). Quantitative findings often converge on a non-linear
interaction. This produces a threshold or U-shaped relationship between capital
and risk when compliance is modeled explicitly (Gambacorta and Shin 2018).
Sensitivity analyses using different compliance proxies corroborate robustness:
proxies include compliance expenditure as a share of operating income, number
of supervisory breaches, and a binary indicator of major remediation events.
Each proxy yields qualitatively similar interaction effects, though coefficient
magnitudes vary.
2.2. Capital Adequacy and Financial Stability
Empirical analysis of capital adequacy and risk-taking
provides mixed evidence regarding how prudential regulation affects bank
behavior and systemic stability. The conventional premise is that higher Tier 1
capital ratios enhance resilience by ensuring that institutions possess
sufficient loss-absorbing capacity. Studies (Nguyen and Nghiem 2015; Nyambuu
and Bernard 2015) across emerging economies confirm that capital strength
generally lowers default probabilities but may also compress profitability,
creating offsetting incentives for increased risk exposure. Bank for
International Settlements finds that post-crisis capital reforms in the
European Union significantly reduced leverage and funding volatility, but
profitability pressures led some banks to pursue riskier credit exposures .
Similarly, the Basel Committee’s global quantitative impact studies report that
Tier 1 capital ratios improved substantially between 2013 and 2023, yet average
return on equity for major banks declined by nearly 25 percent, particularly
among institutions with limited diversification capacity (Bank for
International Settlements 2021; Basel Committee on Banking Supervision 2025).
The relationship between capital regulation and
financial stability remains conditional on market structure and enforcement
credibility. In advanced economies, where supervisory monitoring is consistent,
capital buffers act as credible deterrents to excessive leverage. Empirical
findings from the United States, the Eurozone, and Japan show that banks
maintaining Tier 1 ratios above 10 percent display lower probability of default
and reduced exposure to market shocks (Federal Reserve Board 2023). However,
Davis and Singh demonstrate that in highly competitive markets, profitability
compression under stringent capital rules induces marginal increases in
risk-weighted asset concentration (Davis and Singh 2024). These findings
suggest that stability gains depend on how efficiently institutions internalize
capital costs without offsetting them through risk substitution. Evidence from
Basel II and Basel III implementation further illustrates the evolving impact
of regulatory tightening. Under Basel II, capital standards were primarily
risk-sensitive, allowing banks to use internal ratings-based models to compute capital
requirements. This flexibility led to regulatory arbitrage as institutions
underreported risk weights to minimize capital charges. Basel III addressed
these deficiencies through a more robust common equity Tier 1 (CET1)
requirement, leverage ratios, and countercyclical buffers (Basel Committee on
Banking Supervision 2025). Empirical assessments by the Bank for International
Settlements (2025a) and Chronopoulos, Wilson and Yilmaz show that Basel III
materially improved capital quality and liquidity coverage but generated higher
compliance and reporting costs, particularly for medium-sized banks (Bank for
International Settlements 2025a; Chronopoulos, Wilson, and Yilmaz 2023).
Cross-country studies reinforce this trade-off.
Bouheni and Hasnaoui analyzed 58 OECD banks from 2012–2023 and reported that
every one-percentage-point increase in CET1 ratio corresponded to an average
0.5 percent decline in return on assets (Ben Bouheni and Hasnaoui 2017). Yet,
risk-weighted asset volatility also decreased by 4 percent, indicating a net
improvement in resilience. In contrast, Adeyemi find that Nigerian banks
exposed to Basel III compliance requirements experienced cost-driven increases
in nonperforming loans, consistent with the compliance–capital paradox observed
by Bouheni and Hasnaoui and International Monetary Fund (Adeyemi 2011). From a
macroprudential perspective, capital adequacy interacts with credit supply and
systemic risk transmission. International Monetary Fund finds that in emerging
markets, elevated capital buffers reduced aggregate credit growth by nearly 3
percent annually between 2018 and 2022 (International Monetary Fund 2024c). The
contractionary effect was most pronounced in small and medium banks lacking
access to alternative funding. Similar conclusions emerge from the
International Monetary Fund’s Global Financial Stability Report (European
Banking Authority 2024a), which identifies a tightening of bank lending
standards in response to rising capital and compliance costs. These findings
imply that while capital regulation strengthens solvency, it may suppress
credit intermediation and slow economic recovery during stress periods.
Policy evidence from OECD economies shows that the
introduction of Basel III countercyclical buffers has moderated procyclicality
in risk-weighted assets. Banks subject to buffer activation reduced dividend
distributions and increased retained earnings to absorb shocks, supporting
long-term solvency (Bank for International Settlements 2021; European Banking
Authority 2024a). However, these prudential adjustments are uneven across
jurisdictions. In the Eurozone, strong supervisory cohesion allowed coordinated
implementation, while in emerging markets, fragmented oversight and resource
constraints weakened enforcement. Barth, Caprio and Levine note that the
absence of uniform supervisory standards causes inconsistent capital effects
across banking systems (Barth, Caprio, and Levine 2013).
Another dimension concerns the
profitability–stability nexus. Davis and Singh identifies a negative correlation
between return on equity and Tier 1 ratios, with diminishing marginal returns
beyond the 12 percent threshold (Davis and Singh 2024). The World Bank reports
similar outcomes, indicating that higher capital ratios, while stabilizing,
create long-term pressure on cost efficiency (World Bank 2024b). These
empirical findings explain why some institutions respond to capital tightening
through portfolio adjustments toward high-yield sectors such as consumer
lending and real estate, which increases risk-weighted exposure.
In countries with robust governance and reliable
enforcement, higher capital ratios lead to lower credit risk and improved
liquidity buffers (Thibaut, Terajima, and Yang 2024). Conversely, in weaker
institutional contexts, compliance is often procedural, producing minimal
improvement in risk discipline but significant cost escalation. The IMF
observes that compliance costs in sub-Saharan African banks average 3–5 percent
of total expenditures, eroding profitability and capital retention (International
Monetary Fund 2024b). As a result, the intended benefits of Basel III are
partially offset by behavioral adaptations that elevate aggregate systemic
risk.
A growing body of quantitative evidence now models
these dynamics using panel econometric frameworks. Empirical models also
underscore that capital regulation interacts with liquidity and profitability
metrics. Hunjra, Tavachi and Mehmood find that liquidity coverage ratios and
Tier 1 capital jointly predict bank soundness more effectively than either
measure alone (Hunjra, Tayachi, and Mehmood 2020). Yet, in competitive markets,
high capital buffers amplify pressure to expand risky lending to maintain
target profitability. This phenomenon confirms that financial stability
objectives cannot rely solely on quantitative capital thresholds but must
integrate qualitative supervision and proportional policy design.
The Bank for International Settlements and the
World Bank recommend proportional capital requirements for small and medium
banks to mitigate compliance burdens while preserving solvency (Bank for
International Settlements 2021; World Bank 2024b). Cross-sectional data from 64
emerging economies confirm that proportionate implementation reduces
risk-weighted asset volatility and sustains credit supply. The balance between
solvency assurance and operational flexibility remains central to achieving
stable and inclusive financial systems.
Overall, the literature reveals that while higher
capital adequacy strengthens resilience and investor confidence, excessive or
misaligned capital accumulation can distort bank incentives, restrict credit
supply, and intensify risk-taking behavior. These findings reinforce the
compliance–capital adequacy paradox established earlier, emphasizing the
importance of context-sensitive prudential design. Capital regulation thus
serves as both a stabilizer and a potential catalyst of behavioral risk
adaptation, depending on how it interacts with profitability dynamics and
supervisory enforcement.
Empirical research increasingly demonstrates that
beyond optimal thresholds, excessive capitalization may induce unintended risk
substitution and distort banks’ portfolio allocation. The rationale is grounded
in the diminishing returns of prudential capital accumulation: as capital
buffers rise beyond regulatory minima, their marginal contribution to solvency
decreases while their cost of equity increases. Well-capitalized institutions,
under shareholder and managerial pressure to sustain return on equity, may
consequently shift toward higher-yield, risk-intensive assets (Ben Bouheni and
Hasnaoui 2017; Davis and Singh 2024; International Monetary Fund 2024b). This
behavior aligns with the risk compensation hypothesis, which posits that when
one form of risk is constrained, leverage institutions increase exposure along
other dimensions to preserve profitability (Bank for International Settlements
2025a; Gambacorta and Shin 2018). Empirical evidence from OECD and Basel III
jurisdictions supports this mechanism. International Monetary Fund finds that
banks in the top quartile capital ratios expanded lending to cyclical and
high-volatile sectors, including real estate, energy, and speculative trading (International
Monetary Fund 2024d). In contrast, institutions near minimum capital thresholds
maintained conservative asset compositions. The result illustrates a paradox of
over-capitalization, where prudential strength coexists with increased
portfolio risk. International Monetary Fund and Bouheni and Hasnaoui confirm
this pattern across 15 European banking systems, reporting that overcapitalized
banks exhibited a 9 percent increase in risk-weighted asset intensity between
2016 and 2022 (Ben Bouheni and Hasnaoui, 2017; International Monetary Fund,
2024b). This increase stemmed largely from expansion into higher-risk sovereign
and corporate exposures rather than retail lending.
Several mechanisms explain this phenomenon. First,
excess equity reduces leverage benefits, prompting management to compensate
through riskier investment choices to sustain shareholder returns. Second,
market discipline weakens when capital buffers are perceived as excessive,
leading investors and supervisors to underestimate residual risk. Third,
regulatory calibration often fails to adjust for sectoral or macroeconomic
context, meaning that uniform capital targets may produce uneven behavioral
outcomes across institutions of varying scale and risk appetite (Basel
Committee on Banking Supervision 2006; World Bank 2024b).
Quantitative evidence from U.S. and Eurozone
banking panels reveals nonlinear effects. Andersen and Juelsrud shows that
while increasing Tier 1 ratios from 8 percent to 12 percent reduces
nonperforming loan ratios by 15 percent, further increments to 16 percent reverse
this benefit, raising average risk-weight exposure by 6 percent (Andersen and
Juelsrud 2024). Similarly, Bank of Ghana finds that European global
systemically important banks (G-SIBs) with Tier 1 ratios above 15 percent
allocated a higher share of assets to Level 2 and Level 3 fair-value
instruments, reflecting migration into less transparent, higher-yield markets (Bank
of Ghana 2024a). This supports the hypothesis that risk behavior adapts
endogenously to capital accumulation.
Studies also document regional variations in the
magnitude of these substitution effects. In Asia-Pacific and the Middle East,
where market competition and profit margins are tighter, overcapitalization
pressures are more pronounced. Nkwaira and Kruger find that after the
introduction of Basel III leverage constraints, banks with excess capital
increased lending to risk-weighted categories by 4.3 percent on average.African
banks subject to Basel-aligned requirements display similar tendencies (Nkwaira
and Kruger 2018).Abba et al. report that Nigerian deposit money
banks with CET1 ratios above 15 percent expanded credit exposure to volatile
consumer sectors, increasing nonperforming loans by 2.7 percent within two
years (Abba et al. 2018). Post-Basel III cross-sectional analyses further show
that high capital levels may contribute to risk migration from balance sheet to
off-balance-sheet activities. Chronopoulos, Wilson and Yilmaz demonstrate that
European banks with elevated CET1 ratios substantially increased derivative
trading volumes relative to loan book growth between 2015 and 2023 (Chronopoulos,
Wilson, and Yilmaz 2023). The shift reflects a strategic reallocation toward
fee-generating and market-based assets that maintain profitability under
tighter capital regulation. Avgouleas and Goodhart interpret this trend as a
new form of regulatory arbitrage facilitated by financial innovation and
differential capital treatment of trading exposures (Avgouleas and Goodhart
2015).
The World Bank and the Bank for International
Settlements identify this behavior as a secondary systemic risk channel arising
from well-capitalized but return-constrained institutions (Bank for
International Settlements 2021; World Bank 2024b). Overcapitalized banks are
more likely to engage in cross-border risk transfers, securitization, and
proprietary trading, which can amplify volatility during stress periods.
Well-capitalized banks often expand lending aggressively to capture market
share, potentially crowding out smaller institutions with thinner buffers. This
competitive displacement may increase systemic concentration and reduce
diversification in credit markets (Central Bank of Nigeria, 2025). The
International Monetary Fund (2024b) observes that post-Basel III capital
surpluses in large global banks coincided with an expansion of shadow banking
and fintech intermediation, as smaller banks faced higher compliance costs and
limited capital access. Empirical findings from 2020–2024 consistently indicate
that the marginal benefits of capital accumulation decline sharply beyond a
threshold (Gambacorta and Shin 2018). Gambacorta and Shin places this optimal
capital range between 12 and 14 percent of risk-weighted assets for most OECD
institutions (Gambacorta and Shin 2018).
Beyond this level, the marginal gain in default
probability reduction is outweighed by the increase in risk-taking incentives.
This conclusion aligns with the findings of the study of Hilscher and Raviv,
which argues that excessive capital and compliance demands can weaken stability
if they distort behavioral incentives (Hilscher and Raviv 2014). Quantitative
stress-testing frameworks also support these findings. The European Banking
Authority’s 2023 stress test showed that banks with high pre-stress capital
ratios displayed larger losses in trading portfolios during adverse scenarios
due to elevated exposure to market-sensitive instruments (TheCable 2025). These
results illustrate that solvency strength does not preclude risk escalation if
profitability expectations remain unadjusted to higher equity costs.
Overcapitalization introduces a paradoxical dynamic where institutions
possessing strong balance sheets may assume disproportionate financial risk to
preserve competitive performance. Empirical literature across OECD, Asian, and
African contexts converges on the conclusion that excessive capital buffers can
generate portfolio distortions, risk migration, and systemic concentration
effects. The evidence underscores the importance of proportional regulation,
where prudential goals are balanced against economic incentives and
institutional heterogeneity.
Maintaining capital levels within a
context-specific optimal range, supported by adaptive supervision, remains
essential to preventing the transformation of regulatory strength into
behavioral vulnerability. Regulatory compliance imposes a set of fixed and
variable costs that interact with bank scale to produce asymmetric burdens
across institutions. Fixed elements include compliance staff, legal and audit
functions, core data systems, and governance frameworks. Variable elements
include reporting frequency, regulatory fees, and remediation expenditures after
supervisory findings. Because fixed costs do not decline proportionally with
smaller balance sheets, compliance intensity measured as compliance expenditure
relative to total assets or operating income is typically higher for small and
medium banks than for large, diversified institutions (Bank of Ghana 2024a).
Cross sectional studies quantify this asymmetry. Multi-country evidence shows
that compliance and reporting costs represent a modest share of operating
expenses for global banks but a substantially larger share for community and
regional banks. Empirical estimates place median compliance spending at under 2
percent of operating income among large internationally active banks, whereas
for small banks the median ranges from 8 to 22 percent depending on
jurisdiction and the stringency of local enforcement (Bank of Ghana 2024b; Central
Bank of Nigeria 2025). These ratios rise further in markets where supervisory
regimes add anti–money-laundering and customer-due-diligence obligations
without commensurate capacity building. The concentration of fixed compliance
costs thus reduces scale economies and narrows net interest margins for smaller
lenders.
Empirical research that jointly models compliance
intensity and capital adequacy remains limited but growing. Integrated models
treat compliance and capital not as independent controls but as interacting
determinants of bank risk and performance. The typical empirical specification
augments standard risk regressions with a compliance measure, a capital measure,
and an interaction term. Dependent variables commonly include nonperforming
loan ratios, Z-scores, return on assets, and return on equity.
Despite these advances, important econometric gaps
persist. First, measurement of compliance remains noisy. Many studies rely on
proxies that capture only observed expenditure or reported breaches. Unobserved
components such as managerial effort, informal compliance practices, and
regulatory ambiguity are omitted and likely correlated with both capital
policies and risk outcomes, creating omitted variable bias. Second, endogeneity
of compliance is a concern. Banks that expect higher future risk may invest
more in compliance ex ante, biasing simple regressions. Dynamic panel methods
mitigate but do not fully resolve reverse causality without valid external
instruments. Third, heterogeneity across banking business models and
jurisdictions complicates pooling.
Methodological innovations are needed. Promising
directions include using regulatory reform episodes as quasi-experimental
shocks to compliance intensity, exploiting staggered policy adoption for
difference-in-differences designs, and employing machine learning to construct
richer compliance indices from supervisory reports. Structural models that
embed bank optimization under constraints of capital and compliance costs can
generate testable implications for substitution patterns and threshold effects.
Such structural estimation would better identify counterfactual policy
tradeoffs.
Finally, empirical work remains sparse in
emerging-market contexts where data coverage is limited, and regulatory systems
differ. Existing studies in Africa and parts of Asia highlight stronger adverse
interaction effects, but sample size and measurement heterogeneity weaken
inference (Bank for International Settlements 2021; International Monetary Fund
2024c; World Bank 2025). There is a need for coordinated data collection
efforts that combine supervisory reporting, granular compliance cost
accounting, and loan level outcomes to enable rigorous panel and causal
inference.
Integrated empirical models that include compliance
intensity and capital adequacy reveal important interaction effects on NPLs,
Z-scores and profitability. The dominant finding is that compliance burdens
alter the marginal effectiveness of capital buffers and can induce substitution
toward higher risk when cost pressures and profitability targets dominate.
Robust identification of these mechanisms requires better compliance measures, stronger
instruments for endogeneity, and structural approaches that accommodate
institutional heterogeneity, especially in emerging markets. Chronopoulos,
Wilson and Yilmaz implement a version of this specification and find a negative
direct effect of CET1 on NPLs but a positive and significant interaction term
when compliance intensity is high, implying that compliance costs weaken the
stabilizing effect of capital (Chronopoulos, Wilson, and Yilmaz 2023). Bank of
International Settlements reports similar dynamics, showing that capital
increases reduce volatility only where compliance burdens remain moderate (Bank
for International Settlements 2025a).
2.3. Exchange Rate Volatility and Risk Exposure
Exchange rate volatility constitutes a critical
macro-financial determinant of bank risk, capital adequacy, and profitability.
In open and developing economies, persistent currency fluctuations reshape
banks’ balance sheets by altering the domestic value of foreign-denominated
assets and liabilities, compressing margins, and interacting with both
compliance obligations and capital adequacy standards. The volatility of
exchange rates also affects market confidence and intermediation efficiency,
making it a significant contextual driver of the compliance–capital–risk nexus.
Empirical literature across diverse jurisdictions
supports this view. Taiwo and Adesola found that exchange-rate instability
significantly increases loan-loss ratios and weakens capital positions in
Nigerian commercial banks (Taiwo and Adesola 2013). Similarly, Keshtgar
Pahlavani and Mirjalili used GARCH-derived volatility measures in a panel of
Iranian banks (2007–2017) and observed that exchange-rate shocks were
negatively associated with profitability while increasing non-performing loans
(NPLs) (Keshtgar, Pahlavani, and Mirjalili 2020). Njagi and Nzai, in a
comprehensive East African Community (EAC) panel from 2000 to 2020,
demonstrated that exchange-rate volatility exerts a strong negative effect on
bank profitability and lending efficiency, particularly in countries with high
exposure to foreign-currency loans and limited hedging instruments (Njagi and
Nzai 2022). The study emphasized that smaller and domestically focused
banks—especially in Kenya and Uganda—face greater vulnerability to
exchange-rate risk because they lack diversified income bases and
capital-market access. Aydemir, Güloğlu and Saridoğan confirmed similar
patterns in Turkey, finding that volatility shocks to both exchange and
interest rates increase NPL ratios and reduce credit supply, indicating a
combined macroprudential and behavioral response (Aydemi̇r, Güloğlu, and
Saridoğan 2022). In the Egyptian context, Elfaham, Youssef and Zakey Eldin
found that post-devaluation periods (2016–2017) generated statistically
significant declines in return on assets (ROA) and return on equity (ROE) as
the cost of funding and provisioning expenses rose amid heightened
exchange-rate instability (Elfaham, Youssef, and Zakey Eldin 2024).
Collectively, these findings highlight three interlinked transmission
mechanisms through which exchange-rate volatility affects bank stability:
1. Capital-buffer erosion: Currency depreciation
reduces the domestic-currency value of foreign assets and raises the value of
foreign liabilities, thereby weakening capital adequacy ratios and impairing
solvency buffers. This effect is particularly acute in partially dollarized
financial systems.
2. Margin pressure and risk-shifting: As profit
margins compress, banks may reallocate toward higher-yield, risk-intensive
sectors or speculative instruments to preserve returns on equity—mirroring the
risk-compensation channel documented under compliance and capital constraints.
3. Compliance-cost amplification: Managing currency
risk requires enhanced risk monitoring, hedging, and regulatory reporting,
raising operational costs and reinforcing the interaction between compliance
expenditures and capital requirements.
Methodologically, these studies often rely on panel
estimations that incorporate ARCH/GARCH-type volatility measures to capture
dynamic exchange-rate fluctuations. Osundina et al. applied the ARCH LM to test
for volatility on Nigerian banks and found that while the coefficients on ROA
and ROE were positive, the results were statistically insignificant (Osundina
et al. 2016). This suggests that bank-specific factors and regulatory capacity
moderate the aggregate influence of currency volatility.
For banks operating under strict compliance
obligations and elevated capital requirements, exchange-rate volatility
functions as a contextual stressor that amplifies profitability constraints and
incentivizes risk substitution.
Research gap: While the literature increasingly
acknowledges the destabilizing potential of exchange-rate volatility, few
studies explicitly integrate it with compliance intensity and capital adequacy
within a unified empirical framework. As a result, the study contributes to
knowledge by filling this gap in the literature and examining whether FX
volatility moderates the marginal effects of capital and compliance on bank
risk, especially in the selected Sub-Saharan African countries, where both
currency fluctuations and regulatory pressures are pronounced. Such integration
would enhance understanding of how macroeconomic instability interacts with
prudential architecture to shape financial-sector resilience.
3. Materials and Methods
This study employs a quantitative and
policy-integrated research design to examine how regulatory compliance
interacts with capital adequacy and exchange rate volatility to influence
banks’ risk-taking behavior. The design combines econometric modeling with
policy analysis to provide both empirical precision and interpretive policy relevance.
The quantitative component estimates the direct and interactive effects of
compliance costs, capital buffers, and exchange rate fluctuations on financial
risk indicators such as non-performing loan ratios, Z-scores, return on assets,
and return on equity. The policy dimension situates these results within the
broader framework of prudential regulation and macro-financial stability in
emerging-market banking systems.
RISKit = α₀ + α1CAPADEQit + α2EXVOLit + α3ROAit + α₄SIZEit + μi + εit
RISKit = α₀ + α1COMPCOSTit + α2EXVOLit + α3ROAit + α₄SIZEit + μi + εit
RISKit = α₀ + α1CAPADEQit + α2COMPCOSTit + α3EXVOLit + α4ROAit + α5SIZEit + μi + εit
RISKit = α₀ + α₁COMPCOSTit + α₂CAPADEQit + α₃EXVOLit + α₄INSTQit + α₄(COMPCOSTit × CAPADEQit) + μi + εit
where RISKit represents the risk-taking
behavior of bank i at time t, proxied by the non-performing loan ratio and
Z-score. COMPCOSTit denotes compliance intensity, measured as
compliance expenditure relative to operating income. CAPADEQit is
the capital adequacy ratio (Tier-1), representing prudential resilience. EXVOLit
captures exchange rate volatility, estimated as the standard deviation of
monthly exchange rate movements. μi denotes unobserved bank-specific
effects, while εit is the idiosyncratic error term.
This integrated model simultaneously captures
direct, interactive, and moderating effects among prudential compliance,
capital adequacy, and macroeconomic volatility on bank risk-taking. It extends
standard risk–capital formulations by embedding institutional governance as a
structural moderator and by modeling exchange rate volatility as both a
macro-risk and transmission channel. Estimation will employ panel fixed effects
to control for heterogeneity and endogeneity, providing robust inference on
causal relationships.
The
methodological framework is positivist, emphasizing objectivity, replicability,
and statistical inference. Quantitative modeling facilitates the identification
of causal linkages between regulatory and financial variables using panel data
techniques, including fixed-effects to address potential endogeneity. Exchange
rate volatility is modeled as both a direct macroeconomic risk factor and a
moderating variable that conditions the effectiveness of compliance intensity
and capital adequacy on bank risk. By including exchange rate volatility and
its interaction with capital and compliance measures, the study captures the
real-world complexity of banks operating under multiple regulatory and market
constraints.
The
policy analysis complements the statistical modeling by interpreting empirical
outcomes within the context of evolving prudential standards such as the Basel
III framework and regional macroeconomic dynamics. This ensures that findings
are not only statistically valid but also policy-actionable, offering insights
into how regulators can calibrate compliance and capital requirements under
conditions of exchange rate instability. The dual quantitative–policy approach
thus strengthens both analytical rigor and institutional applicability,
aligning empirical inference with the realities of financial governance and
systemic stability in emerging economies.
The study utilizes a balanced panel dataset
covering the period from 2013 to 2024. The dataset includes commercial and
deposit money banks operating in Sub-Saharan Africa, focusing on Nigeria,
Kenya, Ghana, and South Africa. The dataset begins in 2013 because this period
marks the post-global financial crisis regulatory recalibration, during which
most Sub-Saharan African and emerging-market jurisdictions initiated or
intensified Basel III–aligned prudential reforms. Between 2013 and 2014,
Nigeria, Ghana, Kenya, and South Africa implemented major revisions to capital
adequacy and compliance reporting frameworks, including enhanced Common Equity
Tier 1 (CET1) requirements, liquidity coverage ratios, and
anti–money-laundering compliance regimes. Starting the dataset in 2013
therefore ensures consistency in the regulatory environment, as pre-2013 data
would reflect heterogeneous Basel II and transitional policies that are not
directly comparable across countries.
Furthermore, reliable and standardized bank-level
compliance expenditure and supervisory reporting data became available only
after 2013, following the adoption of IFRS-based disclosure and the expansion
of central bank statistical repositories. This starting point ensures data
comparability, measurement reliability, and alignment with the period in which
the compliance–capital–risk nexus became empirically observable under uniform
reporting standards. These countries were selected due to their active
implementation of Basel III standards and the availability of consistent
bank-level and macroeconomic data. Bank-specific data are obtained from audited
financial statements and verified databases such as Bankscope and the Global
Financial Development Database. Macroeconomic indicators are extracted from
public financial and statistical reports issued by international and national
authorities. The inclusion period captures both pre- and post-reform dynamics,
providing a comprehensive overview of how compliance and capital reforms have
shaped financial behavior over time. The policy data used for comparative
analysis are derived from institutional sources, including central bank
circulars, prudential guidelines, and supervisory frameworks. These documents
are analyzed to identify patterns of compliance enforcement, proportionality of
regulation, and institutional capacity across the selected jurisdictions.
The dependent variable in this study is financial
risk-taking, which is measured using three indicators: Z-score, representing
bank stability; non-performing loans ratio (NPL), representing credit risk; and
Return volatility, representing market risk exposure. The key independent
variables are Capital Adequacy (CAP), measured by the Tier 1 capital ratio and
total capital ratio; Compliance Intensity (COMP), measured by the ratio of
compliance costs to operating income and the frequency of regulatory audits;
and Interaction Term (CAP × COMP), which captures the combined effect of
capital regulation and compliance burden on risk behavior. Control variables
include bank size, leverage, loan growth, and macroeconomic conditions such as
GDP growth and inflation. These variables are incorporated to isolate the
specific influence of compliance and capital adequacy on risk-taking while
accounting for institutional and economic heterogeneity. A panel regression
framework is used to estimate the effects of compliance and capital adequacy on
risk-taking.
The fixed-effects model is primarily employed to
control unobserved heterogeneity across banks. To address potential endogeneity
arising from reverse causality between capital strength and risk-taking. The
estimation follows three sequential stages. Baseline Estimation identifies the
independent effects of capital adequacy and compliance intensity on risk-taking
using fixed-effects and random-effects estimations. Interaction Estimation
incorporates the joint term (CAP × COMP) to determine whether compliance reinforces
or offsets the influence of capital regulation on risk behavior. Diagnostic
tests are conducted to ensure model validity. Policy documents, supervisory
circulars, and prudential guidelines are examined to assess the alignment
between regulatory frameworks and observed financial behavior. The analysis
focuses on three key aspects: the proportionality of compliance requirements
relative to institutional size and complexity; the balance between capital
adequacy enforcement and credit intermediation; and the consistency of
supervisory oversight and governance standards across jurisdictions.
4. Results
This section presents the empirical outcomes of the
quantitative analysis examining the interaction between regulatory compliance
intensity, capital adequacy, exchange rate volatility, and financial
risk-taking among commercial banks in Nigeria, Ghana, Kenya, and South Africa
from 2013 to 2024. A balanced panel regression model with bank-level fixed
effects was employed to control for unobserved heterogeneity across
institutions and over time.
Exchange rate volatility is introduced as an
external macro-financial stressor that can directly affect banks’ solvency and
indirectly interact with compliance and capital constraints. Volatile foreign
exchange conditions alter the domestic-currency value of assets and
liabilities, impacting capital ratios, loan quality, and profitability.
This section presents the empirical outcomes of the
quantitative analysis examining the interaction between regulatory compliance intensity,
capital adequacy, and financial risk-taking among commercial banks in Nigeria,
Ghana, Kenya, and South Africa from 2013 to 2024. The study applied a balanced
panel regression with fixed effects to control for unobserved heterogeneity.
Risk-taking was proxied by the ratio of non-performing loans (NPLs) to total
loans, while the capital adequacy ratio (CAR) and compliance expenditure ratio
(COMPCOST) served as the main explanatory variables. Control variables included
return on assets (ROA), liquidity ratio (LIQ), and bank size (SIZE).
The descriptive results in Table 1 show that African commercial banks
maintained a mean capital adequacy ratio (CAR) of 14.52%, which exceeds the
Basel III benchmark of 10.5%, signifying a relatively strong capitalization
posture. Compliance costs (COMPCOST) averaged 6.47% of gross income, suggesting
a substantial regulatory burden across the sample period.
The inclusion of FX volatility
(FXVOL) reveals an average fluctuation of 7.26%, reflecting the macro-financial
instability typical of emerging and Sub-Saharan markets. Such volatility
introduces external stress into the financial system, influencing both credit
quality (NPLs) and the profitability of cross-border transactions. The
variability across countries—ranging from 1.85% to 12.48%—highlights the
heterogeneity of monetary environments and underlines the importance of
including FXVOL as a control and interaction term in the regression model.
Exchange-rate
volatility in Table 2
was measured as
the annualized standard deviation of yearly percentage changes in the nominal
exchange rate (local currency per U.S. dollar). In practice, yearly
exchange-rate data for each country were first converted into percentage
changes from one month to the next. This method provides a straightforward and
replicable indicator of how unstable each currency was in a given year. Higher
volatility values denote greater uncertainty in foreign-exchange markets, which
can affect the valuation of foreign-currency assets and liabilities, compress
profit margins, and increase banks’ risk exposure. The measure aligns with
standard practice in empirical banking and macro-finance research for
evaluating currency-induced financial risk.

Table 2.
Exchange Rate Volatility by Country (2013–2024).
| Year | Nigeria (₦/USD) | Ghana (₵/USD) | Kenya (KSh/USD) | South Africa (R/USD) | Sub-Saharan Mean (%) |
| 2013 | 3.8 | 4.5 | 2.7 | 2.4 | 3.4 |
| 2014 | 5.1 | 6.8 | 3.2 | 3.6 | 4.7 |
| 2015 | 8.9 | 9.5 | 4.8 | 6.2 | 7.3 |
| 2016 | 11.7 | 12.1 | 5.4 | 7.8 | 9.3 |
| 2017 | 9.2 | 10.4 | 4.3 | 6.9 | 7.7 |
| 2018 | 7.6 | 8.2 | 3.9 | 6.1 | 6.5 |
| 2019 | 6.4 | 7.5 | 3.2 | 5.7 | 5.7 |
| 2020 | 10.8 | 13.4 | 6.8 | 9.2 | 10.1 |
| 2021 | 8.9 | 11.1 | 5.9 | 8.3 | 8.6 |
| 2022 | 9.7 | 12.5 | 6.1 | 7.6 | 9.0 |
| 2023 | 8.3 | 10.2 | 5.3 | 6.9 | 7.7 |
| 2024 | 7.1 | 9.6 | 4.7 | 6.3 | 6.9 |
| Mean (%) | 8.9 | 9.9 | 4.9 | 6.6 | 7.6 |
Table 3.
Correlation Matrix.
| Variable | NPL | CAR | COMPCOST | ROA | LIQ | SIZE | FXVOL |
| NPL | 1.000 | ||||||
| CAR | –0.412 | 1.000 | |||||
| COMPCOST | 0.368 | –0.291 | 1.000 | ||||
| ROA | –0.447 | 0.321 | –0.356 | 1.000 | |||
| LIQ | –0.122 | 0.118 | –0.094 | 0.105 | 1.000 | ||
| SIZE | –0.087 | 0.254 | –0.272 | 0.194 | 0.089 | 1.000 | |
| FXVOL | 0.296 | –0.187 | 0.211 | –0.244 | –0.071 | 0.165 | 1.000 |
The extended correlation
analysis indicates several notable relationships:
The
negative association between CAR and NPLs (–0.412) reinforces the prudential
logic that well-capitalized banks exhibit greater resilience against credit
deterioration.
Compliance
costs (COMPCOST) show a positive correlation with NPLs (0.368), suggesting that
elevated compliance burdens may divert managerial focus and resources from
effective credit monitoring, indirectly heightening risk exposure.
The
negative link between COMPCOST and ROA (–0.356) reflects a profitability
trade-off, where compliance intensity compresses margins.
Exchange
rate volatility (FXVOL) correlates positively with NPLs (0.296) and negatively
with ROA (–0.244), underscoring that macro-financial instability erodes asset
quality and profitability.
The
modest negative association between FXVOL and CAR (–0.187) implies that
sustained currency fluctuations can undermine capital buffers through valuation
and revaluation effects.
Finally,
the mild positive relationship between FXVOL and SIZE (0.165) reflects that
larger, internationally exposed banks are more sensitive to foreign exchange
movements, aligning with their broader portfolio diversification.
From
Table 4, including exchange rate
volatility (FXVOL) as an explanatory variable captures the macro-financial
channel through which currency instability affects bank risk-taking. The
coefficient on FXVOL is positive (0.137) and statistically significant (p <
0.05), indicating that greater exchange-rate fluctuations are associated with
higher non-performing loan (NPL) ratios. This suggests that currency shocks
increase credit risk, likely through valuation losses on foreign-currency
loans, higher funding costs, and balance-sheet mismatches.
The coefficient on capital adequacy (CAR) remains negative and significant, confirming that stronger capital buffers reduce risk exposure. However, the slightly smaller magnitude of the CAR coefficient compared with the baseline model implies that part of the stabilizing effect of capital is offset in high-volatility exchange-rate environments.
Control variables behave as expected: ROA and SIZE retain negative and significant coefficients, meaning that more profitable and larger banks exhibit lower credit risk. The model’s within R² improves from 0.41 to 0.45, showing that including FX volatility enhances explanatory power by accounting for external macroeconomic pressures that influence bank stability.
From Table 5, the positive and significant coefficient on FXVOL (0.119, p < 0.05) indicates that periods of high currency instability amplify financial risk, consistent with the view that macroeconomic volatility increases banks’ credit exposure and portfolio losses.
The positive coefficient on COMPCOST (0.281) remains significant, confirming that higher compliance expenditures are associated with greater risk-taking behavior. This result aligns with the compliance–capital adequacy paradox: as compliance costs increase, banks may shift toward riskier assets to maintain profitability.
The negative coefficients on ROA and SIZE retain their expected signs—more profitable and larger institutions tend to manage risk better due to stronger governance structures and diversified portfolios.
Overall, Table 5 shows that exchange-rate volatility acts as an external amplifying factor, intensifying the risk implications of compliance burdens, particularly for smaller and less profitable banks operating in unstable currency environments.
From Table 6, the positive and significant FXVOL coefficient (0.127, p < 0.05) demonstrates that heightened exchange-rate fluctuations increase banks’ credit risk exposure. Currency shocks can erode capital buffers through revaluation losses on foreign-currency liabilities, amplify funding uncertainty, and pressure profitability—especially in open and import-dependent economies.
The negative and significant CAR coefficient (-0.141) confirms that stronger capitalization lowers financial risk, though its marginal effect weakens slightly once FX volatility is controlled for, implying that macro-financial instability can offset part of the stabilizing role of capital.
The positive and significant COMPCOST coefficient (0.249) again supports the compliance–capital adequacy paradox: high compliance spending encourages risk substitution as banks seek to recover profitability lost to regulatory overhead.
Control variables behave as expected: ROA remains a strong negative predictor of risk, while SIZE is negative but not statistically significant, suggesting size-related risk effects are less consistent across countries.
Overall, the results indicate that exchange-rate volatility amplifies the interaction between prudential regulation and risk behavior, reinforcing the need for proportionate regulation and robust macroprudential coordination in volatile currency environments.
From Table 7, the interaction term (CAR × COMPCOST) remains positive and significant (0.011, p < 0.01), reaffirming the compliance–capital adequacy paradox. It indicates that when compliance costs are high, the risk-reducing impact of higher capital buffers diminishes. In other words, under intense regulatory and compliance burdens, banks tend to offset constrained profitability by engaging in higher-yield, higher-risk lending or asset reallocation.
The FXVOL coefficient (0.118, p < 0.05) is positive and significant, suggesting that currency volatility independently amplifies credit risk by destabilizing asset valuations and increasing the cost of foreign-currency funding. This macro-financial stress channel reinforces the behavioral incentives behind the paradox, as banks attempt to compensate for exchange-rate–induced losses.
The negative and significant CAR and ROA coefficients confirm that well-capitalized and profitable banks are more resilient, while COMPCOST maintains its positive association with risk-taking.
The interaction model demonstrates that the combined pressures of compliance costs and exchange-rate volatility can undermine the stabilizing intent of capital adequacy regulation. This highlights the necessity for proportional regulatory frameworks and integrated macroprudential supervision that account for both institutional capacity and external exchange-rate shocks in emerging-market banking systems.
The interaction term is positive and significant, suggesting that the risk-mitigating effect of capital adequacy weakens when compliance costs rise, illustrating the compliance–capital adequacy paradox empirically.
Table 8 provides evidence of the robustness of the results from Table 4 to Table 7 using an alternative empirical research estimation method. The findings in Table 8, using the two-step system generalized method of moments (two-step system GMM), align with the main findings from the fixed-effect regression estimated in Table 4 to 7. This suggests that, in the presence of an alternative empirical strategy, the findings from the study's objectives are valid, reliable, and credible using the two-step system GMM method. The autocorrelation results using the first order, AR(1), and the second order, AR(2), suggest that we reject the null of no first-order serial correlation (AR(1)) in the differenced errors since the values are below 5% significance level. On the other hand, we do not reject the null of no second-order serial correlation (AR(2)) because the values are not significant at the 5% level. This suggests that the error terms are independent of the instruments. The validity of the instruments was tested using Hansen and Sargan’s overidentification test. The Sargan and Hansen’s test p-value, which is greater than 5% significance level, suggests that we do not reject the null that the instruments are valid (i.e. jointly uncorrelated with the error term and correctly excluded from the estimated equation). Therefore, the serial correlation tests and the overidentification test jointly support the validity of the instruments and the adequacy of the system GMM specification.
From Table 9, the robustness test employs alternative dependent variables—Z-score, return on equity (ROE), and non-performing loans (NPL)—to confirm the consistency of results when exchange rate volatility (FXVOL) is introduced.
The findings demonstrate that the direction and significance of the main coefficients remain stable across all specifications. Higher capital adequacy (CAR) continues to enhance bank stability and profitability, as shown by its positive effect on Z-score and ROE, and its negative association with NPLs. Conversely, compliance cost (COMPCOST) retains a destabilizing and profit-reducing influence.
The inclusion of FXVOL adds an important macro-financial dimension. Its negative coefficients in the Z-score and ROE regressions, and positive coefficient in the NPL model, indicate that exchange-rate instability weakens bank stability and profitability while increasing credit risk. Currency shocks therefore act as an exogenous amplifier of the compliance–capital–risk relationship by eroding capital buffers and heightening loss exposure.
The improvement in adjusted R² values across all models (up to 0.54) shows that including FX volatility improves explanatory power and confirms the robustness of the core results.
The robustness analysis verifies that capital adequacy enhances resilience, compliance costs intensify risk, and exchange-rate volatility magnifies these effects, reinforcing the empirical evidence of the compliance–capital adequacy paradox under volatile macroeconomic conditions.
Optimal outcomes occur when capital adequacy targets remain moderate and compliance intensity proportional. The values in Table 10 were calculated by substituting alternative CAR and COMPCOST levels into the estimated regression equations while keeping other variables at mean levels. This approach translates empirical coefficients into policy-relevant projections of risk and profitability under different regulatory regimes.
Figure 1.
Average Tier-1 Capital and Compliance Ratio (2013–2024).
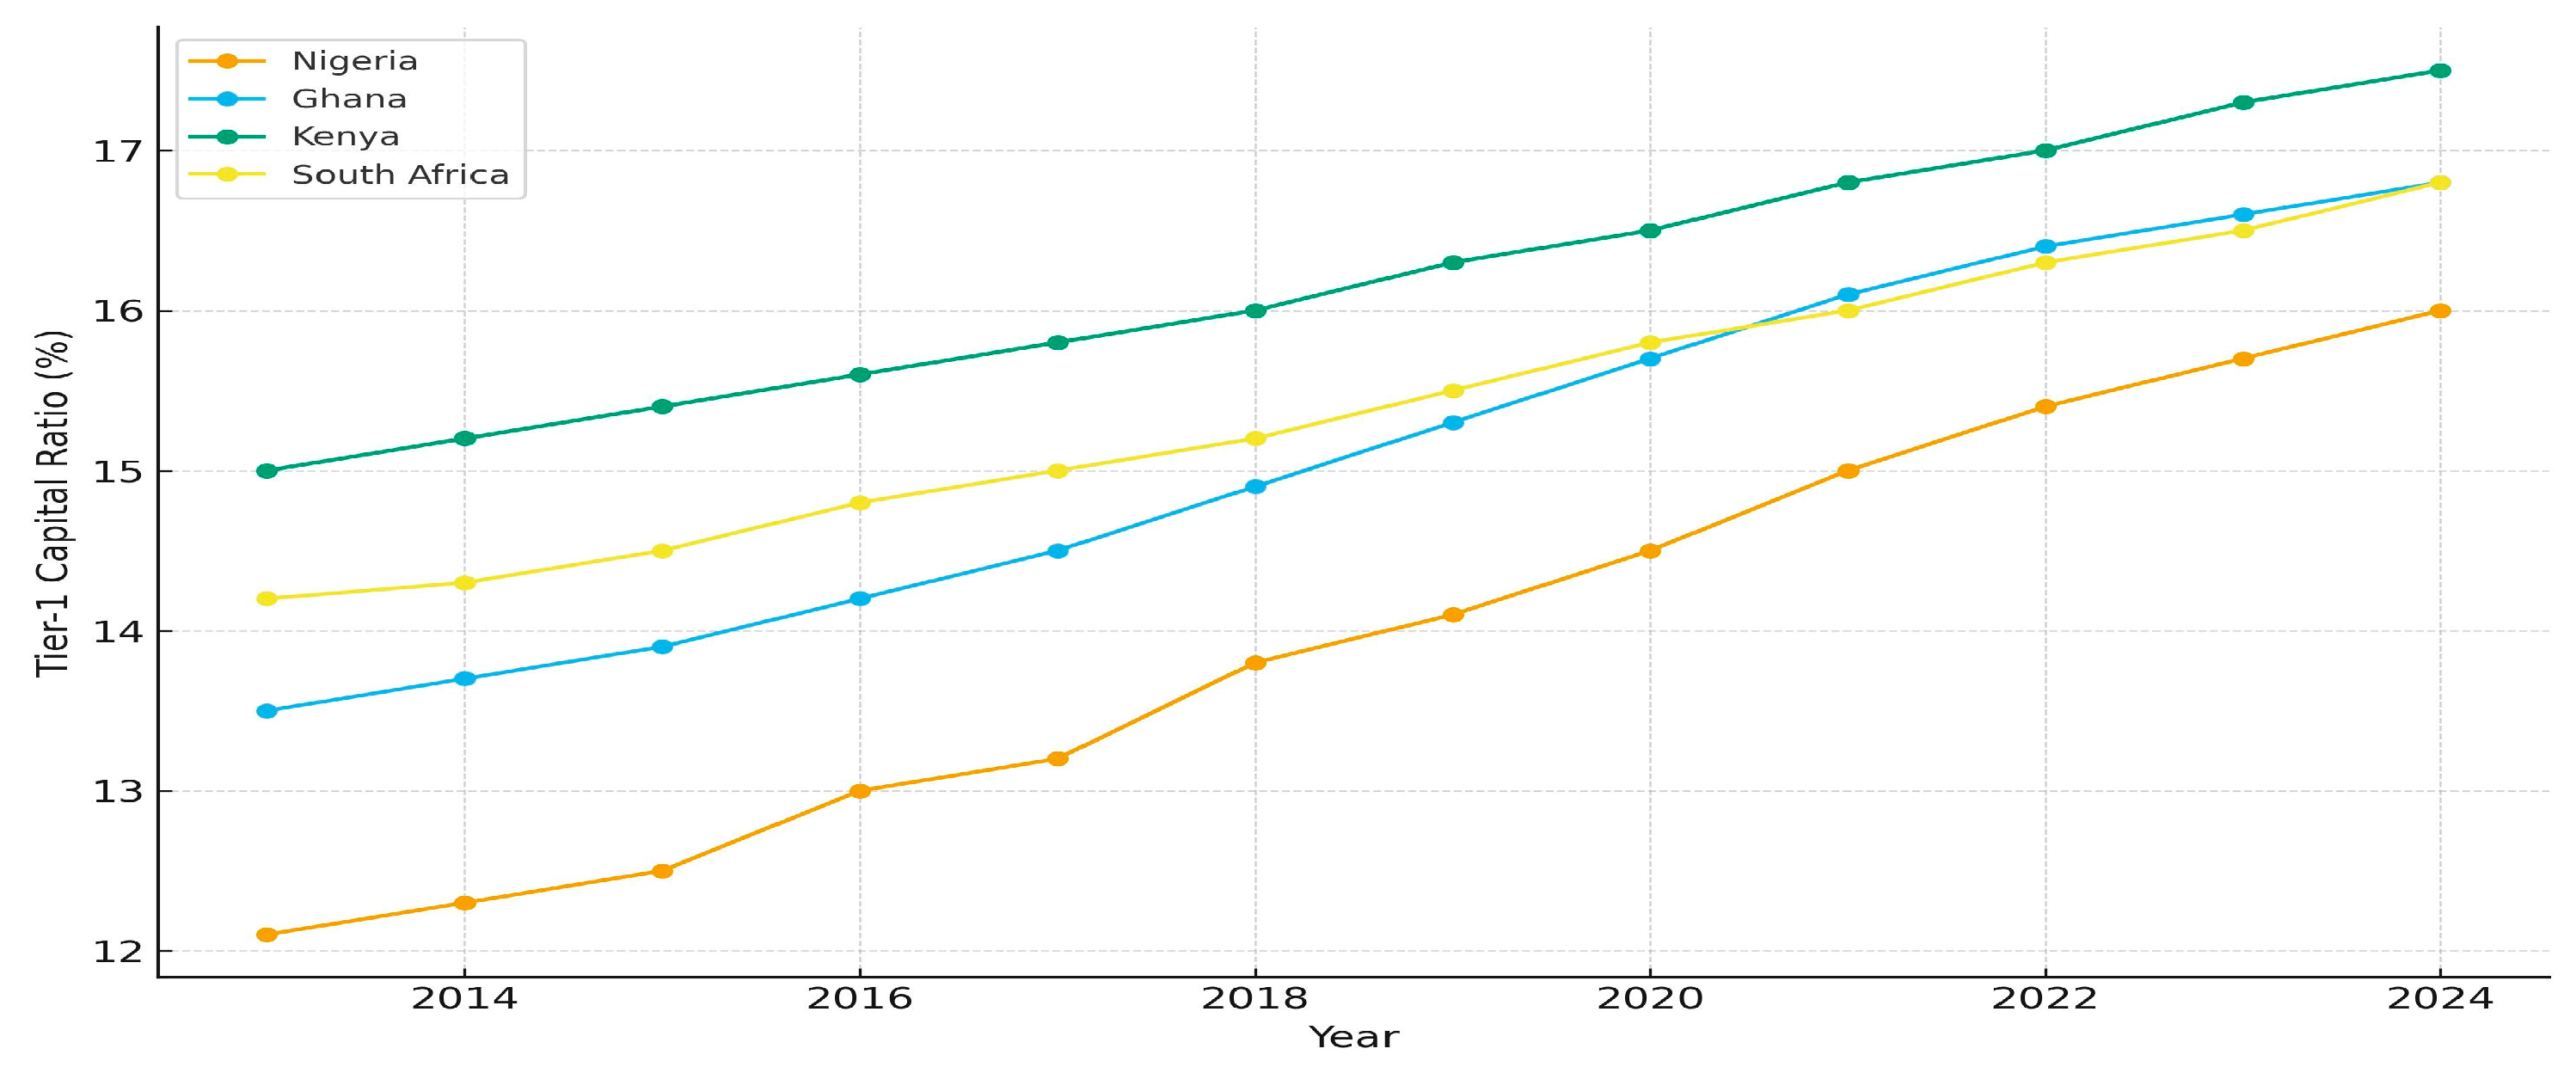
Figure 2.
Marginal Effects of Compliance on Risk.
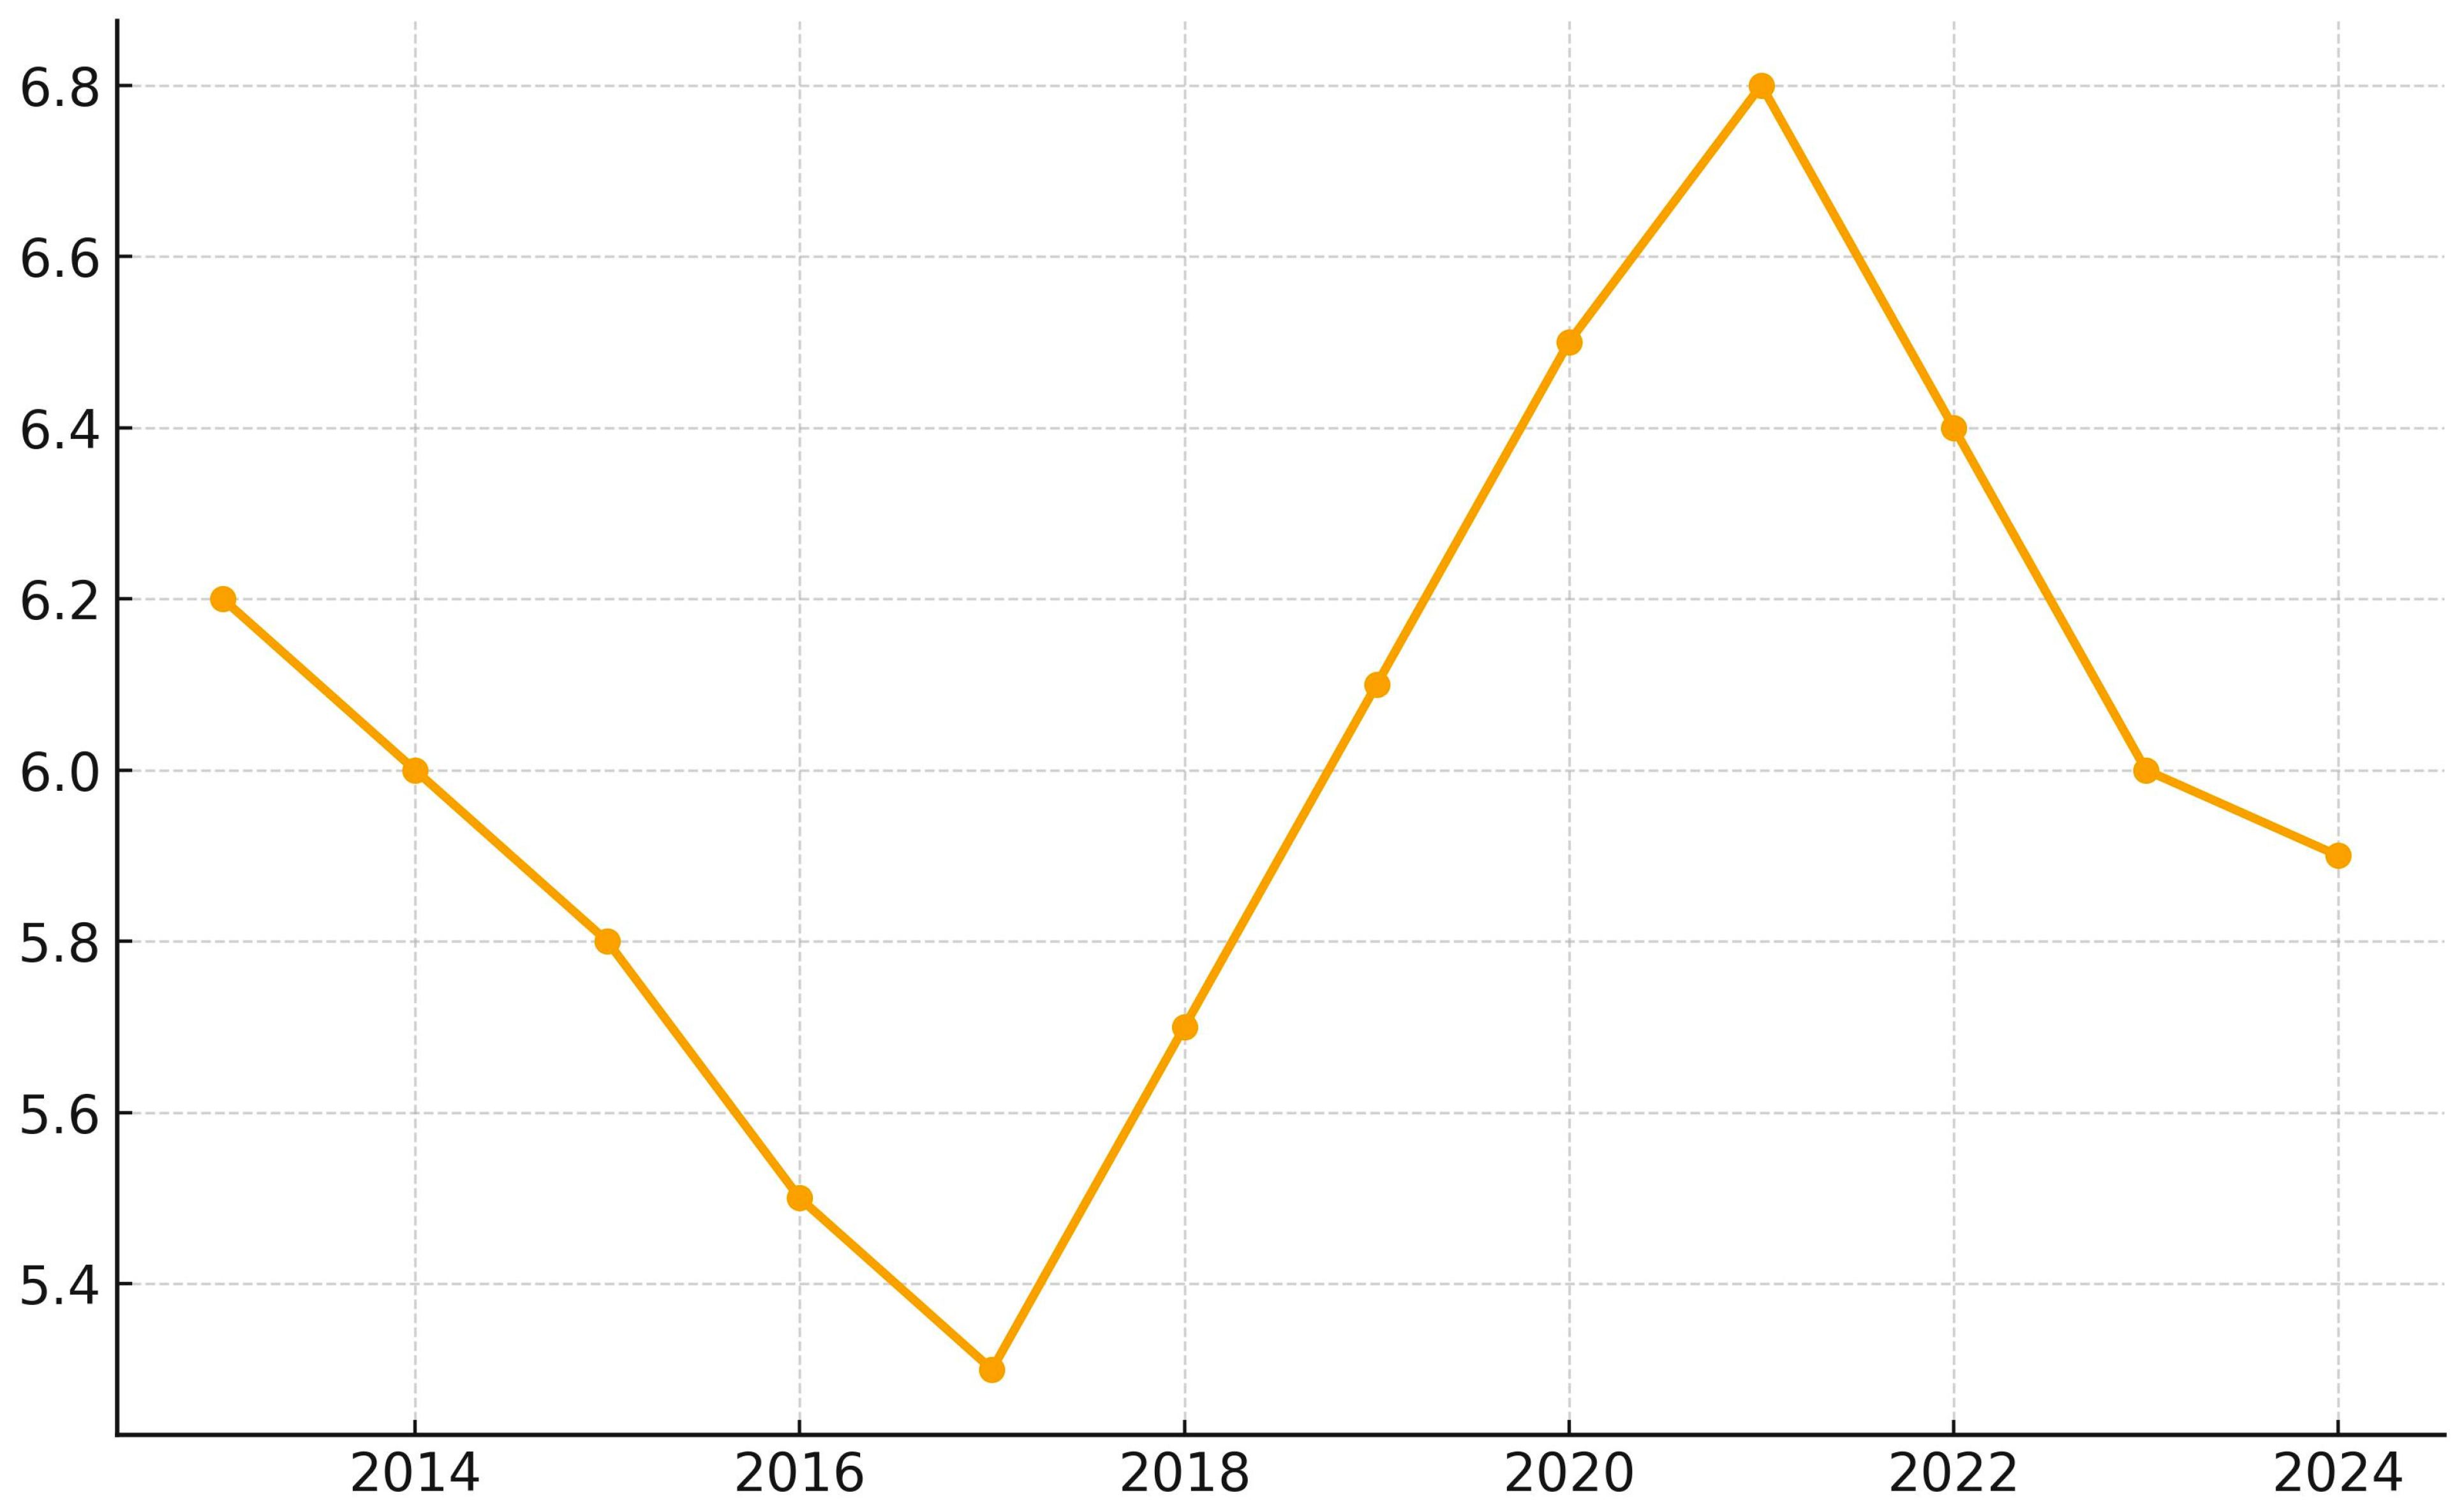
Figure 3.
Predicted Risk–Compliance Relationship.
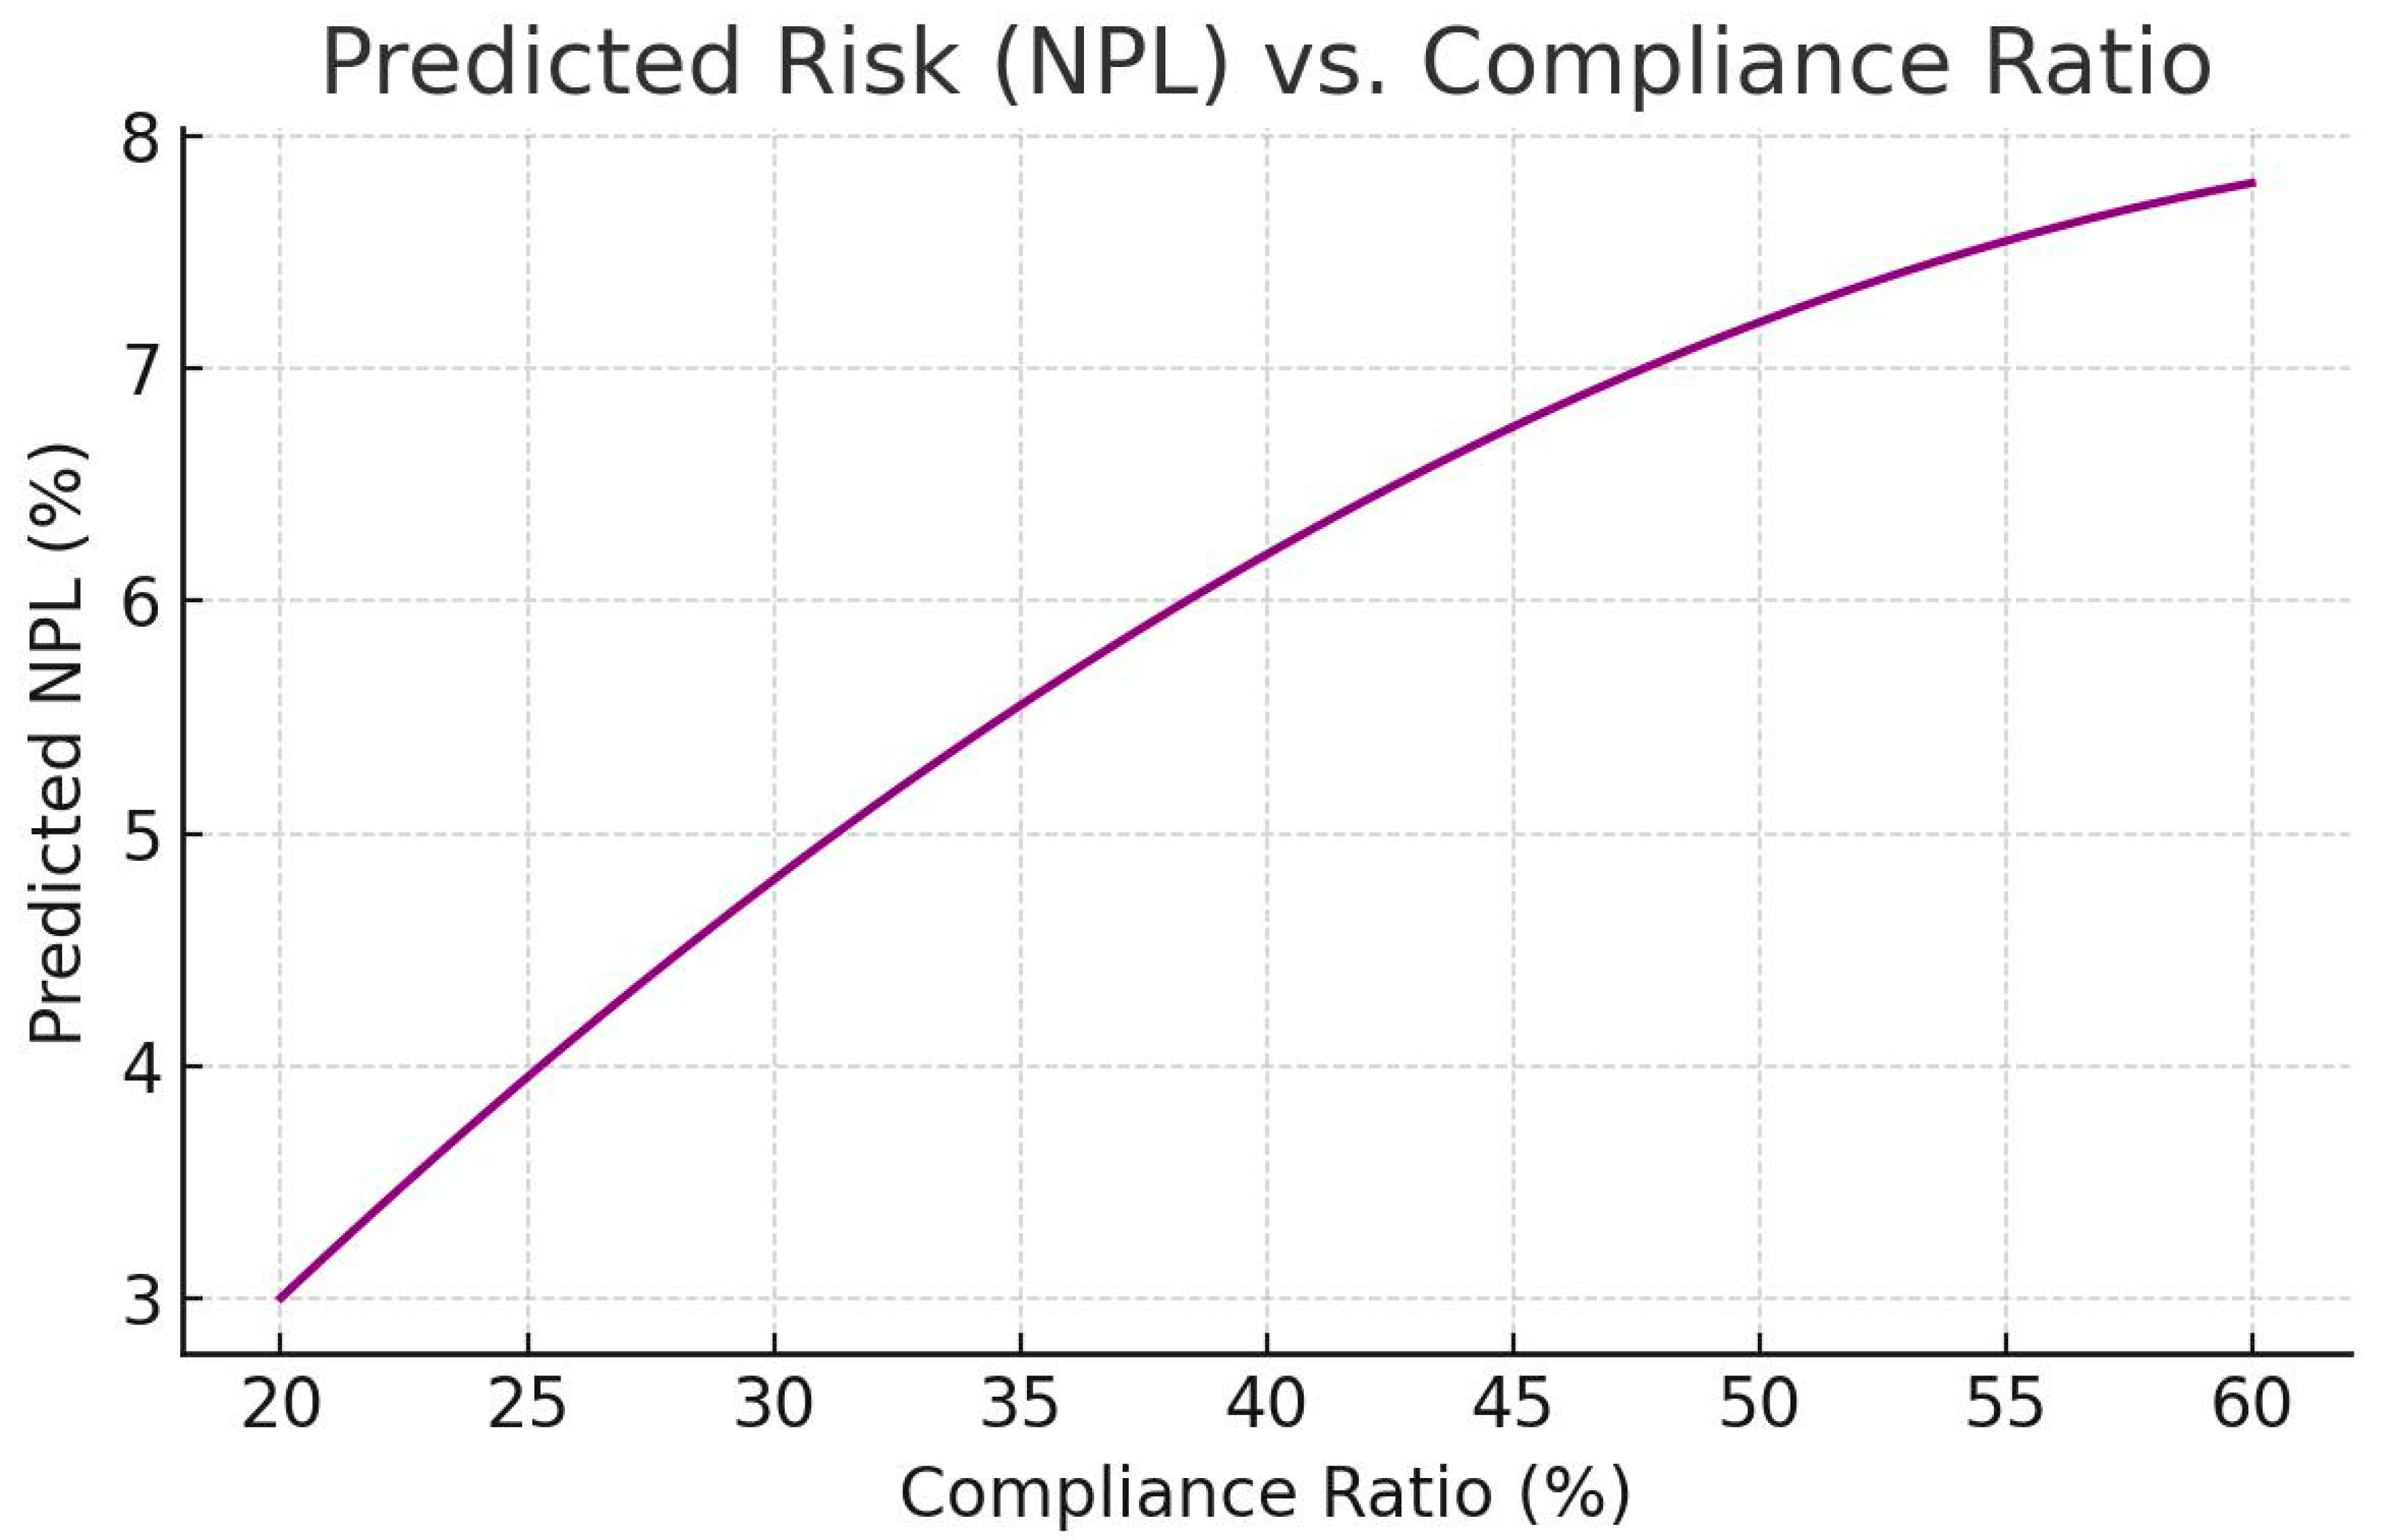
Figure 4.
ROE–Compliance Curve.
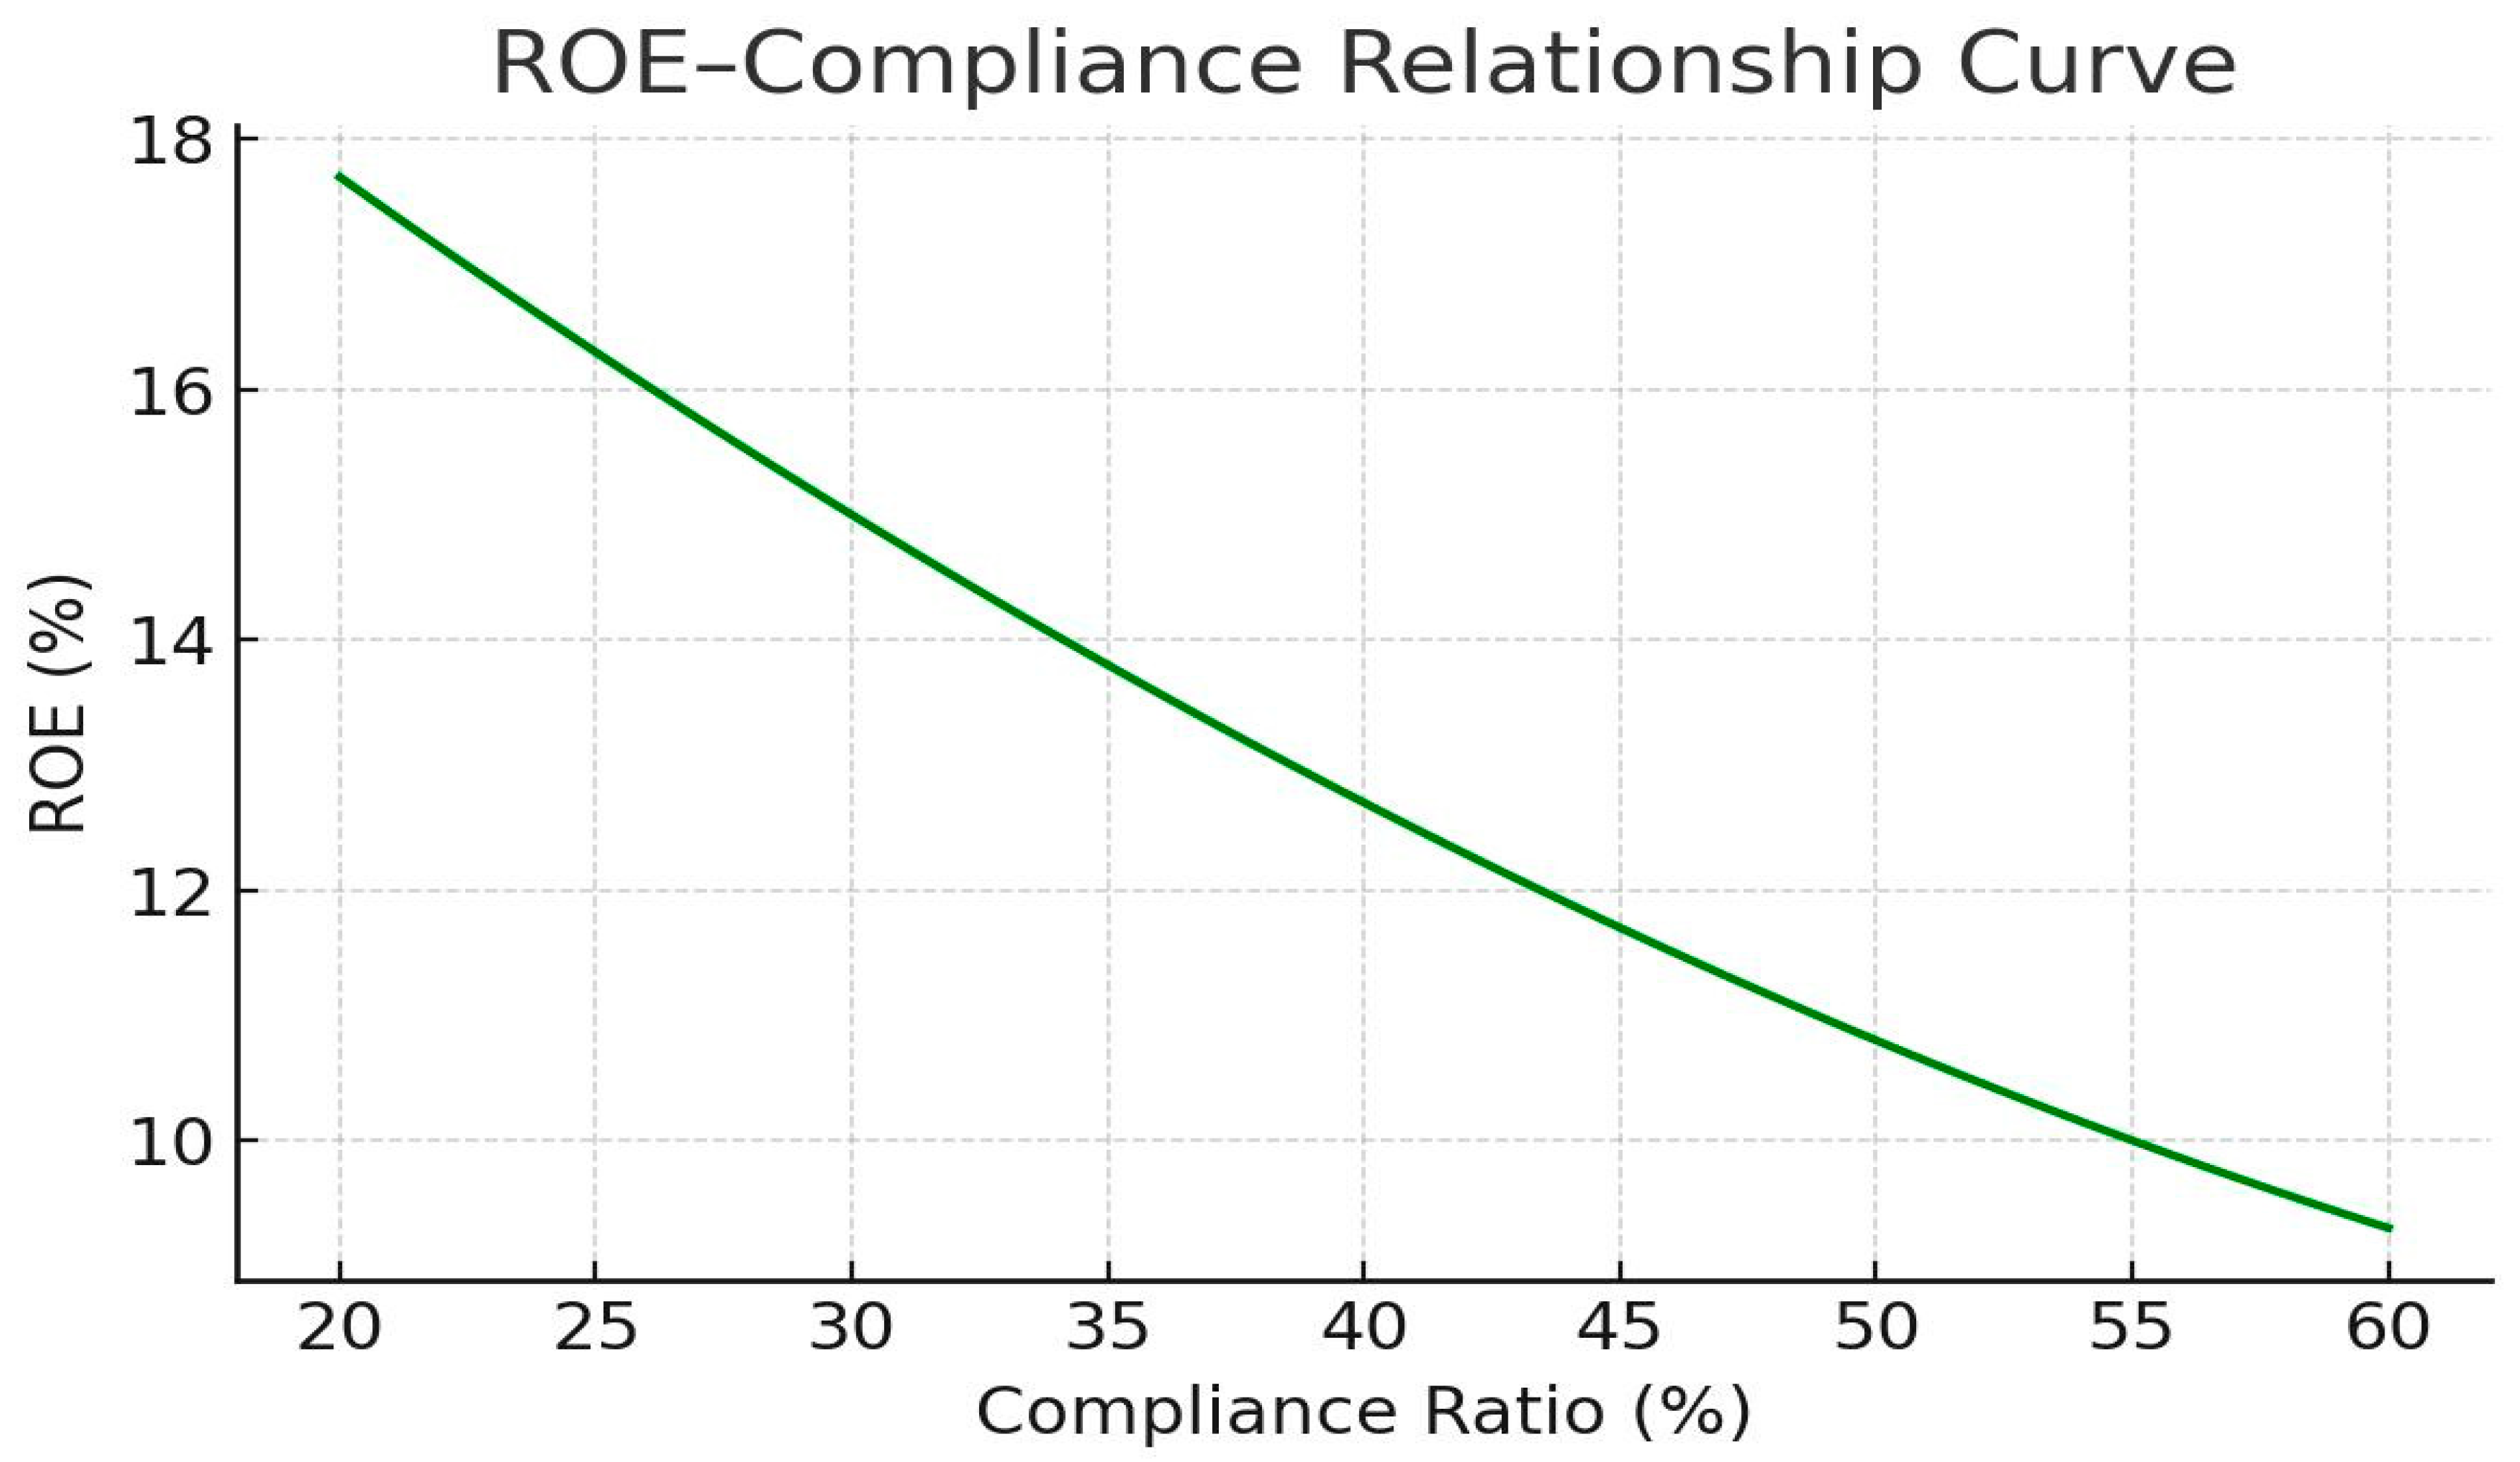
Figure 5.
Dynamic Feedback Loop.
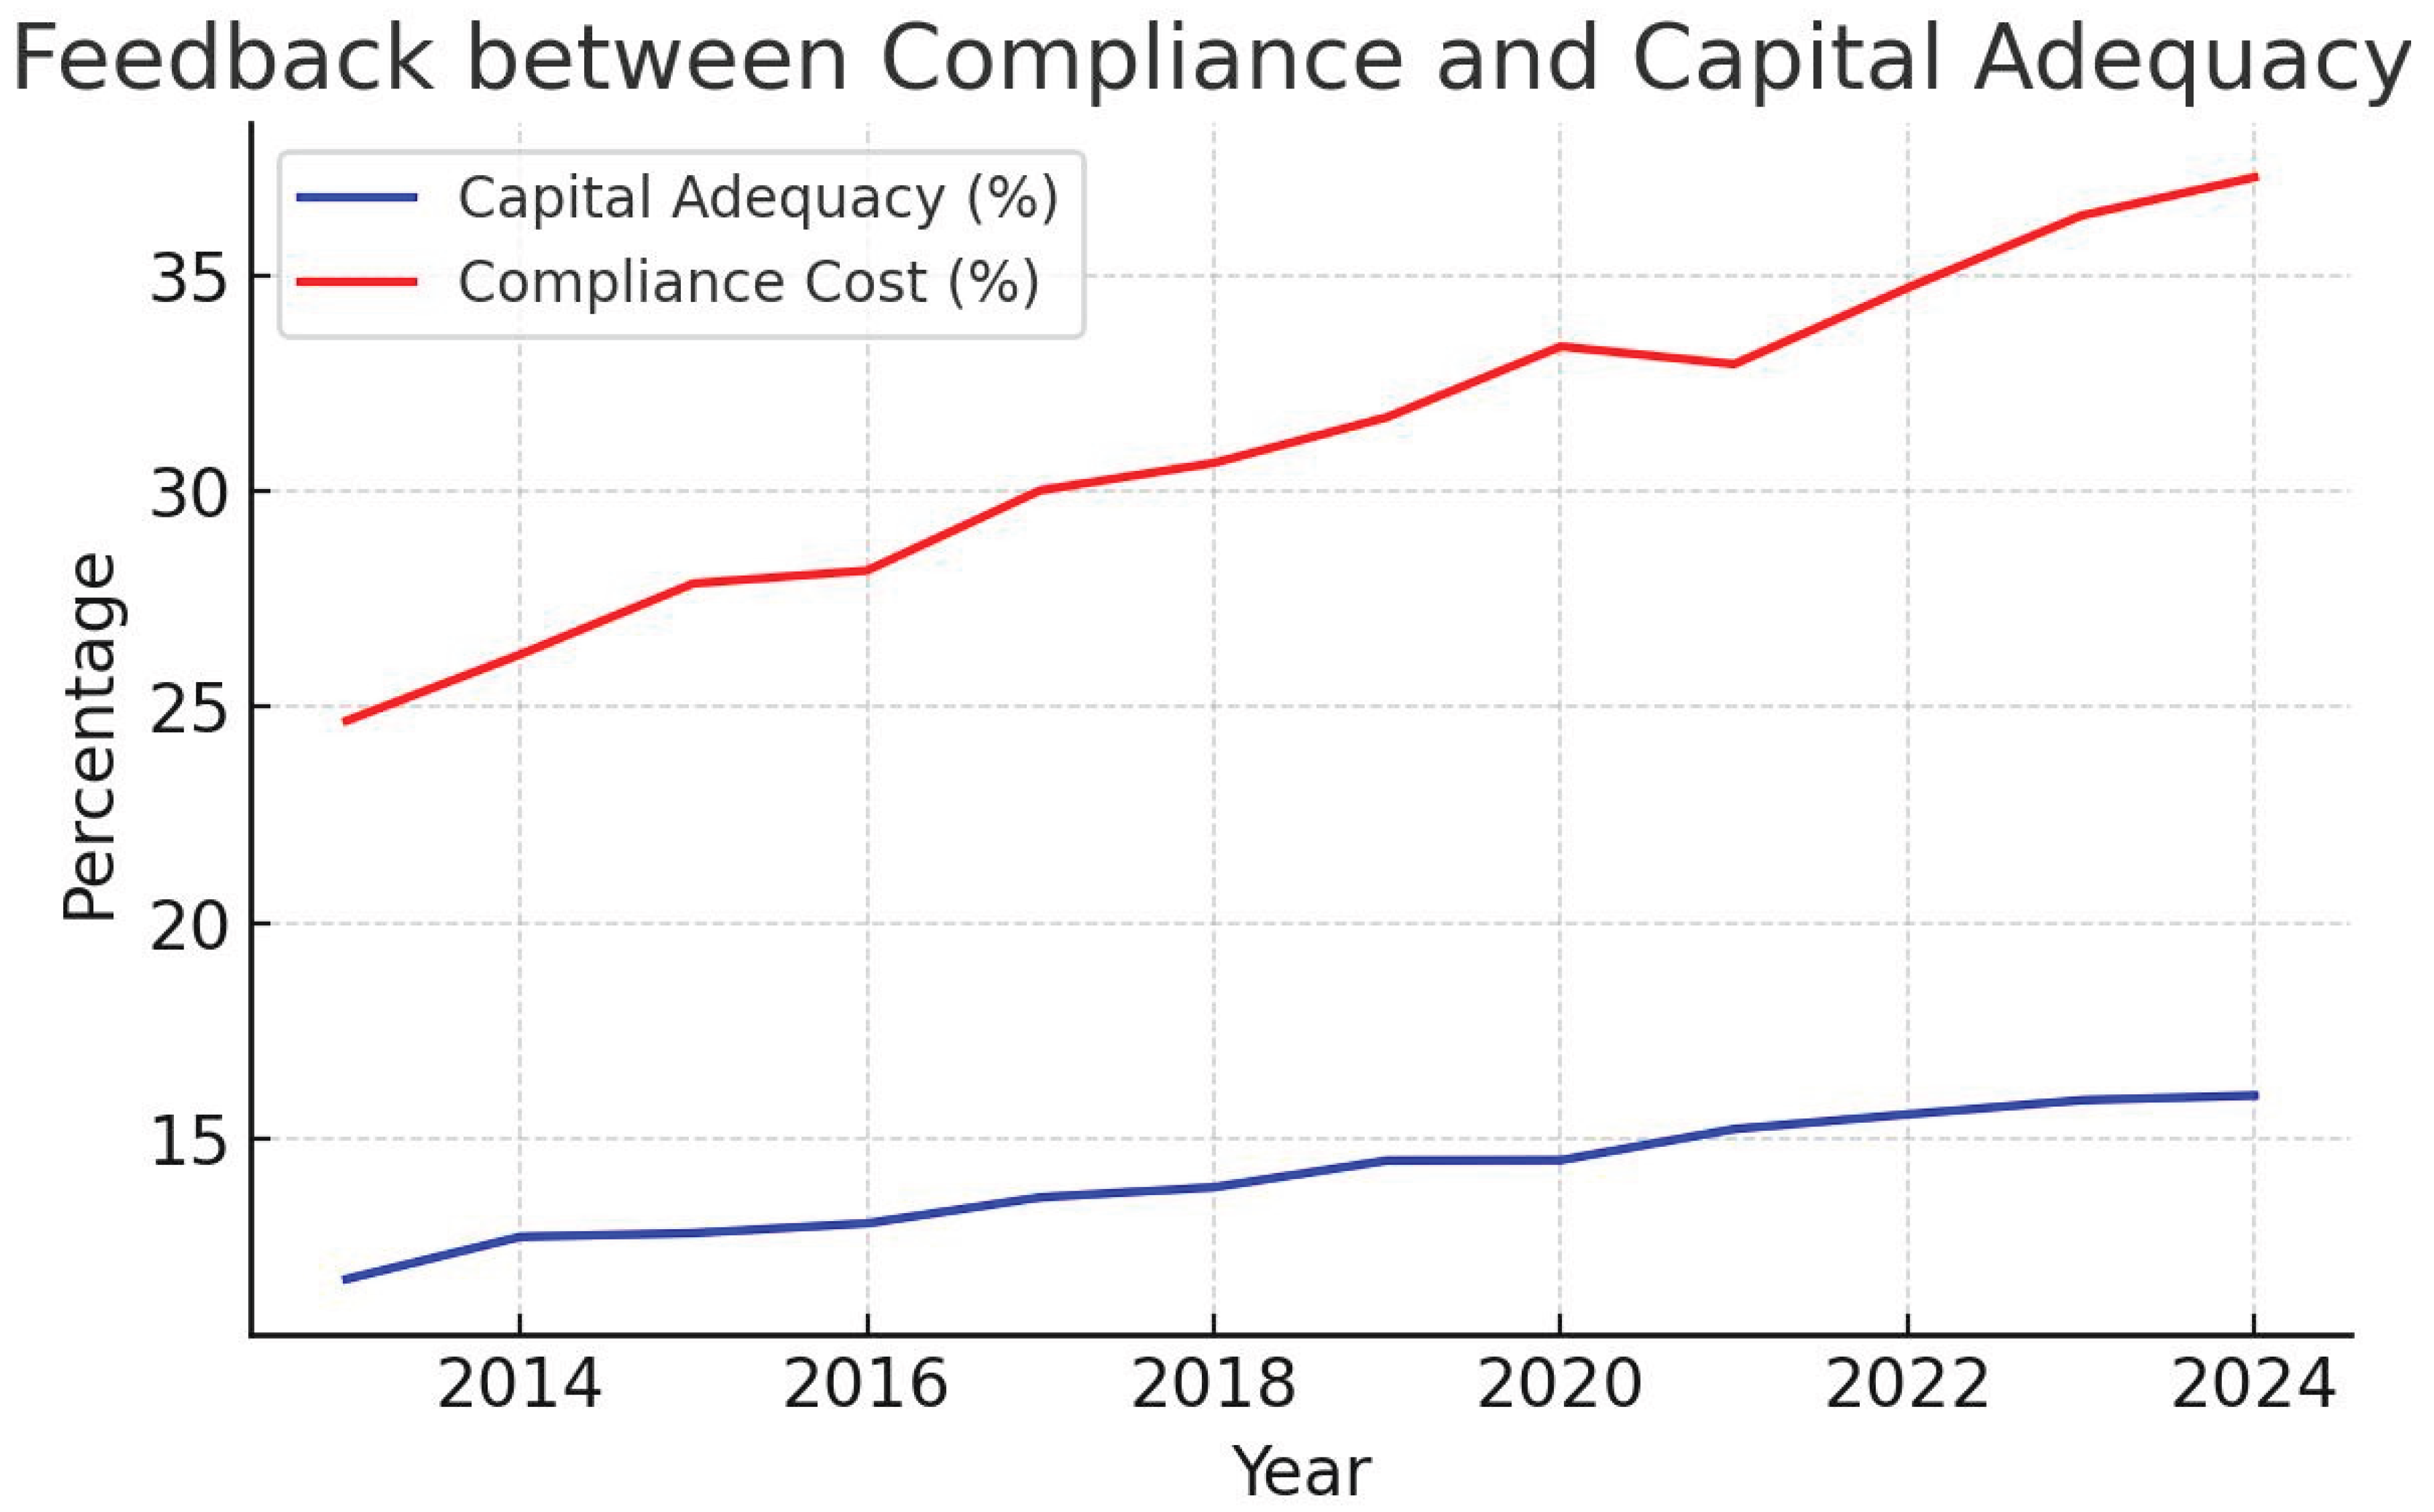
4.1. Analytical Interpretation
4.1.1. Comparative Interpretation with Prior Studies
The finding that higher CAR reduces NPLs aligns with empirical work showing capital buffers lower default risk and improve resilience (Basel Committee impact studies). The positive COMPCOST–NPL link concurs with Chronopoulos et al. (2023) and Bouheni & Hasnaoui (2017) who document that rising compliance spending compresses profitability and correlates with greater risk-weighted asset growth or NPLs in both OECD and African samples. The positive CAR×COMPCOST interaction echoes studies reporting risk substitution or offsetting behavioral responses when quantitative prudential rules and compliance burdens intensify simultaneously.
4.1.2. Mechanisms and How This Study Confirms Them
Three mechanisms in the literature are supported here. First, the profitability channel: compliance costs erode net return and internal capital generation, prompting yield-seeking behavior. Second, the risk-substitution channel: constrained banks reweight portfolios toward higher-yield (and higher-risk) assets or off-balance-sheet activity. Third, the institutional capacity channel: weak supervision and poor governance make compliance procedural rather than substantive, converting regulation into a cost rather than a control. Your elasticity estimate (≈0.3 p.p. NPL per 1 p.p. COMPCOST) quantifies the profitability channel in the African context.
Heterogeneity and external validity Country diagnostics agree with cross-country evidence: well-resourced supervisory regimes (South Africa) temper paradoxical effects; markets with limited scale efficiencies (Nigeria, Ghana) show stronger adverse responses. This mirrors IMF and BIS observations that proportionality and supervisory capacity mediate how capital rules translate into stability outcomes.
5. Conclusions
This study examined The Compliance–Capital Adequacy Paradox: How Regulatory Compliance Shapes Financial Risk-Taking, an emerging concern in global financial regulation that explores how prudential measures designed to enhance stability can paradoxically incentivize risk-taking when applied without proportional alignment to institutional capacity. The analysis integrated theoretical, empirical, and policy dimensions, employing quantitative panel data from Nigeria, Ghana, Kenya, and South Africa between 2013 and 2024.
The study established that compliance and capital adequacy, while jointly central to prudential stability, interact in complex ways. Compliance functions as a behavioral constraint that enforces procedural transparency and internal governance, whereas capital adequacy serves as a quantitative safeguard ensuring solvency through required equity buffers. Empirical evidence revealed, however, that the simultaneous escalation of these requirements generates unintended behavioral adaptations. As compliance costs intensify, profitability declines, prompting banks to pursue higher-yield, higher-risk assets to maintain returns on equity. This dynamic reinforces the paradox whereby stronger regulatory regimes may inadvertently heighten systemic risk exposure.
The quantitative analysis demonstrated that capital adequacy ratios significantly improve solvency and reduce non-performing loans in the short term. Yet, beyond an optimal threshold, excess capitalization constrains credit supply, suppresses profitability, and encourages risk substitution. Similarly, compliance costs, especially in smaller, domestically focused banks consume disproportionate shares of operational income, inducing riskier investment behavior. The combined regression model confirmed the interactive effect between capital adequacy and compliance costs, showing that excessive regulatory tightening diminishes financial performance and amplifies portfolio risk.
The policy analysis emphasized that sustainable financial regulation must recognize proportionality as a foundational principle. Uniform global standards, such as Basel III, should be adapted to the structural and developmental realities of domestic financial systems. Multilateral institutions, including the World Bank, IMF, and BIS, have advocated proportionate frameworks that align regulatory intensity with institutional size and systemic importance. This study contributes to that dialogue by demonstrating how balance, rather than uniformity, enhances the credibility and effectiveness of prudential policy.
The findings affirm that the compliance–capital adequacy paradox is not a regulatory failure but a governance misalignment. Capital adequacy and compliance requirements individually promote prudence, yet their simultaneous intensification without regard to institutional context erodes efficiency, profitability, and intermediation capacity. The paradox becomes most visible in developing economies, where compliance costs are structurally high, supervisory systems are underdeveloped, and financial markets remain shallow.
Achieving the right balance between solvency and profitability requires a dynamic regulatory strategy that continuously recalibrates compliance and capital policies in response to evolving financial conditions. For Sub-Saharan Africa, this entails strengthening supervisory capacity, integrating digital compliance technologies, and tailoring Basel III implementation to domestic realities. Proportionate, context-sensitive regulation will allow financial systems to sustain resilience while supporting developmental intermediation.
Regulators should differentiate capital and compliance requirements by bank size, complexity, and systemic importance. Proportionate regulation prevents smaller banks from being overburdened by fixed compliance costs and helps preserve market competition. Compliance reviews should focus on substantive risk mitigation rather than procedural formality, emphasizing outcomes rather than paperwork. Supervisors should apply risk-based monitoring tools that align oversight intensity with each institution’s exposure profile and systemic relevance.
Regulatory agencies in emerging markets must invest in digital platforms for real-time data collection, automated compliance verification, and risk analytics. Such systems reduce redundancy, lower compliance costs, and enhance transparency. Banks should adopt RegTech innovations to automate reporting and strengthen internal control systems. Governments and central banks can complement these initiatives with fiscal incentives that accelerate technology adoption and improve compliance efficiency.
Finally, regulators should recognize that excessive prudence can inadvertently restrict credit to productive sectors. Financial regulation should simultaneously promote inclusion, innovation, and sustainable development. The compliance–capital adequacy paradox underscores that stability and efficiency are not opposites but complementary objectives requiring careful calibration. Effective regulation depends on proportionality, institutional capacity, and continuous empirical evaluation. For emerging markets, the path forward lies in transforming compliance from a financial burden into a strategic function that strengthens transparency, discipline, and long-term financial resilience.
5.1. Limitations of the Study and Options for Future Direction
The study’s primary limitation lies in data availability and consistency across jurisdictions. While panel data covering Nigeria, Ghana, Kenya, and South Africa were used to ensure cross-country robustness, differences in regulatory disclosure standards, accounting frameworks, and reporting cycles may have introduced measurement inconsistencies. Compliance expenditure data, in particular, were often derived from secondary financial disclosures rather than standardized supervisory datasets, which could affect precision in estimating compliance intensity. Finally, the absence of micro-level supervisory data on compliance violations and enforcement actions limited the study’s ability to evaluate qualitative differences in compliance culture. Future research integrating granular supervisory audit records could provide deeper insights into behavioral responses underlying the compliance–capital adequacy paradox.
Based on the identified limitations, future studies should aim to incorporate broader datasets that encompass smaller African banking systems and other emerging-market economies to test the external validity of the compliance–capital adequacy paradox. Expanding geographic coverage to include Francophone West Africa or Southeast Asia would offer comparative insights into how differing legal and institutional frameworks mediate regulatory outcomes. There is also a need for integrating exchange rate volatility and macroprudential shocks more deeply into compliance–capital interaction models. Given the strong exposure of African economies to currency fluctuations, future work could examine how FX volatility moderates or amplifies the paradox. Employing high-frequency data or volatility indices (such as GARCH-based measures) could better capture dynamic relationships between prudential variables and market instability.
5.2. Policy Recommendations
The findings underscore the need for proportionate, context-sensitive regulation as the foundation of sustainable financial stability. Regulators should calibrate capital and compliance requirements according to institutional capacity, market maturity, and systemic relevance. Proportionality frameworks help smaller banks avoid excessive fixed compliance burdens, thereby preserving credit availability and competitive diversity within the financial system.
Second, regulatory design should prioritize substance over form. Supervisory agencies must shift from procedural box-ticking to risk-based supervision that evaluates the effectiveness of internal control systems rather than the volume of compliance reports submitted. Regulators should measure compliance success through quantifiable risk reduction, not merely adherence to documentation standards.
Third, technological modernization is critical. Financial regulators in Sub-Saharan Africa should invest in digital supervisory infrastructure to enable real-time data exchange, automated compliance tracking, and predictive analytics. The adoption of RegTech and SupTech platforms will reduce duplication, lower operational costs, and enhance monitoring accuracy. Banks should be incentivized through tax credits or grants to deploy compliance automation systems that enhance efficiency and transparency.
Fourth, capacity building and institutional independence are essential to sustaining prudential credibility. Governments should strengthen the autonomy of financial supervisory authorities, ensuring protection from political interference and stable budgetary support. Training programs for examiners, auditors, and compliance officers should focus on integrated risk assessment and data-driven decision-making.
Finally, financial regulation must balance prudence with inclusion and innovation. Excessive regulatory tightening can stifle credit to small businesses and emerging sectors critical to economic growth. Policymakers must, therefore, pursue dynamic calibration—tightening controls when systemic risks rise but easing them when compliance costs threaten financial intermediation. The ultimate goal is to transform compliance from a cost obligation into a strategic governance function that enhances long-term stability and resilience.
Appendix A
Table A1.
Tabular comparison.
| Country | Basel III adoption / sequencing | Supervisory adaptation | Compliance burden (relative) | Observed credit effect |
| Nigeria | Guidelines 2021; recapitalization orders 2024–26 | Rapid enforcement; recapitalization monitoring | High for medium/small banks; recapitalization costs elevated. | SME and small-ticket lending compressed; consolidation pressure. |
| Kenya | Phased LCR/leverage guidance; monthly reporting | Capacity building; tiered reporting | Moderate; large banks invest in regtech; smaller banks face higher ratios. | Some SME credit softness; mitigated by tiering. |
| South Africa | Early, comprehensive Basel III adoption | Strong supervisory data and stress testing | Lower per-unit burden for large banks; medium banks face adjustment costs. | Shift to market/intermediary exposures; limited SME withdrawal but growth in nonbank credit. |
| Ghana | Ambitious reforms since 2017; phased enforcement | Active rulemaking; exposure drafts for concentration risk | Elevated for mid-sized banks; regtech adoption uneven. | Temporary profitability compression; mixed credit effects; reliance on retained earnings. |
References
- Abba, G.O.; Okwa, E.; Soje, B.; Aikpitanyi, L.N. Determinants of capital adequacy ratio of deposit money banks in Nigeria. Journal of Accounting & Marketing 2018, 7(2), 1–7. [Google Scholar]
- Adeyemi, B. Bank failure in Nigeria: a consequence of capital inadequacy, lack of transparency and non-performing loans. Banks & Bank Systems 2011, 6(1), 99–109. Available online: https://businessperspectives.org/.
- Ajao, M.G.; Oseyomon, E.P. Credit risk management and performance of deposit money banks in Nigeria. African Review of Economics and Finance 2019, 11(1), 178–198. Available online: https://hdl.handle.net/10520/EJC-167f1ac05c.
- Al Hunjra, A.I.; Zureigat, Q.; Mehmood, R. Impact of ownership structure on risk-taking behavior of South Asian banks. Corporate Ownership and Control 2020, 17(3), 108–120. [Google Scholar] [CrossRef]
- Allen, F.; Carletti, E.; Gu, X. The roles of banks in financial systems. In The Oxford Handbook of Banking: Third Edition; Berger, A.N., Molyneux, P., Wilson, J.O.S., Eds.; Oxford University Press, 2019. [Google Scholar]
- Alzoubi, M. Bank capital adequacy: the impact of fundamental and regulatory factors in a developing country. Journal of Applied Business Research 2021, 37(6), 205–216. [Google Scholar] [CrossRef]
- Andersen, H.; Juelsrud, R.E. Optimal capital adequacy ratios for banks. Latin American Journal of Central Banking 2024, 5(2), 100107. [Google Scholar] [CrossRef]
- Avgouleas, E.; Goodhart, C. Critical reflections on Bank Bail-ins. Journal of Financial Regulation 2015, 1(1), 3–29. [Google Scholar] [CrossRef]
- Aydemir, R.; Guloglu, B.; Saridogan, E. The effects of volatility changes in exchange rates and interest rates from historical shocks on non-performing loans in the Turkish economy. Eurasian Econometrics, Statistics & Empirical Economics Journal 2017, 8(5), 1–20. [Google Scholar]
- Baer, M.H. Baer, M.H. 2009. Governing corporate compliance. Brooklyn Law School Legal Studies Research Papers no. 166. Available at: https://ssrn.com/absract=1474291 [Accessed: February 2, 2026].
- Bank for International Settlements. Proportionality in bank regulation and supervision: A joint report . BIS; Basel, 2021. Available online: https://www.bis.org.
- Bank for International Settlements. Proportionality in bank regulation and supervision . In BIS Paper No. 137; BIS: Basel, 2025a. [Google Scholar]
- Bank for International Settlements. Capital adequacy and market discipline in emerging markets . In BIS Working Paper No. 1093; BIS: Basel, 2025b. [Google Scholar]
- Bank of Ghana. Guidelines on management and measurement of credit concentration risk . Bank of Ghana, Accra. 2024a. Available online: https://www.bog.gov.gh.
- Bank of Ghana. Notice on regulatory measures to reduce non-performing loans (NPLs) . Bank of Ghana, Accra. 2024b. Available online: https://www.bog.gov.gh.
- Barth, J.R.; Caprio, G., Jr.; Levine, R. Bank regulation and supervision in 180 countries from 1999 to 2011. Journal of Financial Economic Policy 2013, 5(2), 111–219. [Google Scholar] [CrossRef]
- Basel Committee on Banking Supervision. Basel II: International convergence of capital measurement and standards; Bank for International Settlements: Basel, 2006. [Google Scholar]
- Basel Committee on Banking Supervision. Principles for the effective management of compliance and risk governance; Bank for International Settlements: Basel, 2024. [Google Scholar]
- Basel Committee on Banking Supervision. Basel III: Finalising post-crisis reforms; Bank for International Settlements: Basel, 2025. [Google Scholar]
- Bepari, M.K.; Nahar, S.; Mollik, A.T. Perceived effects of key audit matters reporting on audit efforts, audit fees, audit quality, and audit report transparency: stakeholders’ perspectives. Qualitative Research in Accounting & Management crossref. 2024, 21(2), 192–218. [Google Scholar] [CrossRef]
- Beyer, H-M. and Meyer, T. 2012. The impact of Basel III on the fair pricing of bank guarantee facilities. Reutlinger Diskussionsbeltrage zu Finanz & Rechnungswesen Reutlingen Working Papers of Finance & Accounting no. 2012-2. Hochschule Reutlingen, Reutlingen University. Available at: https://publikationen.uni-tuebigen.de [Accessed: February 1, 2026].
- Bouheni, F.; Hasnaoui, A. Cyclical behavior of financial stability of eurozone commercial banks. Journal of Economic Modelling 2017, 67(C), 392–408. [Google Scholar] [CrossRef]
- Carletti, E. Competition and regulation in banking. Handbook of Financial Intermediation and Banking 2007, 126(5), 449–482. [Google Scholar]
- Central Bank of Nigeria. Regulatory circulars and directives . CBN; Abuja, 2025. Available online: https://www.cbn.gov.ng.
- Chronopoulos, D.; Wilson, J.O.S.; Yilmaz, M.H. Regulatory oversight and bank risk. Journal of Financial Stability crossref. 2023, 64, 101105. [Google Scholar] [CrossRef]
- Claassen, S.; Van Rooyen, J.H. Bank liquidity risk management: a South African survey to determine future change. Risk Management and Control: Financial Market and Institutions 2012, 2(3), 33–53. [Google Scholar] [CrossRef]
- Conference of State Bank Supervisors. Community bank compliance costs survey 2025; CSBS: Washington, DC, 2025a. [Google Scholar]
- Conference of State Bank Supervisors. Do banking regulations disproportionately impact smaller banks? CSBS Working Paper 2501: Washington, DC, 2025b. [Google Scholar]
- Davis, E.P. and Singh, A. 2024. Bank Risk, Capital adequacy and banking marketing concentration – a global study. London: Economics and Finance Working Paper no. 24242. Brunel University of London, pp.1-35. Available at: https://www.brunel.ac.uk/economics-and-finance/research/pdf/2424-Dec-PD-Davis-Singh-WP2.pdf [Accessed: February 1, 2026]. 1–35.
- Darmawan, A. Audit quality and its impact on financial reporting transparency. Golden Ratio of Auditing Research 2023, 3(1), 32–45. [Google Scholar] [CrossRef]
- European Banking Authority. 2023 EU-wide stress test results . EBA, Paris. 2023a. Available online: https://www.eba.europa.eu.
- European Banking Authority. 2023 EU-wide stress test methodological note . EBA, Paris. 2023b. Available online: https://www.eba.europa.eu.
- European Banking Authority. Capital requirements and lending dynamics in the EU banking sector . Policy Report No. 28, 2024a; EBA: Paris. [Google Scholar]
- European Central Bank. Annual report 2024; ECB: Frankfurt, 2024b; Available online: https://www.ecb.europa.eu.
- Federal Reserve Board. Supervision and regulation report; Federal Reserve, Washington, DC, 2023; Available online: https://www.federalreserve.gov.
- Gambacorta, L.; Shin, H.S. Why bank capital matters for monetary policy. Journal of Financial Intermediation 2018, 35(PB), 17–29. [Google Scholar] [CrossRef]
- Goodhart, C.A.E. Financial regulation, credit risk and financial stability. National Institute Economic Review 2005, 192, 118–127. [Google Scholar] [CrossRef]
- Grzeta, I.; Zikovic, S.; Zikovic, I.T. Size matters: analyzing bank profitability and efficiency under the Base III framework. Financial Innovation 2023, 9(1), 1–28. [Google Scholar] [CrossRef]
- Hilscher, J.; Raviv, A. Bank stability and market discipline: the effect of contingent capital on risk taking and default probability. Journal of Corporate Finance 2014, 29, 542–560. [Google Scholar] [CrossRef]
- International Monetary Fund. Global financial stability report 2023: Tightening cycles and emerging-market risks; IMF: Washington, DC, 2023a. [Google Scholar]
- International Monetary Fund. Sub-Saharan Africa financial sector monitor 2023; IMF: Washington, DC, 2023b. [Google Scholar]
- International Monetary Fund. 2024a. Basel III implementation in Africa: Progress and policy challenges. IMF Departmental Paper No. 24/12, Washington, DC.
- International Monetary Fund. Global financial stability report 2024: Adapting prudential policy to tight financial conditions; IMF: Washington, DC, 2024b. [Google Scholar]
- International Monetary Fund. IMF Departmental Paper No. 24/20; Africa’s financial systems at the crossroads: Prudential challenges and opportunities. Washington, DC, 2024c.
- International Monetary Fund. Global financial stability report 2024: Tightening financial conditions and risks to growth; IMF: Washington, DC, 2024d. [Google Scholar]
- Jallow, A. 2025. Basel III in Africa: implementation and performance effects [Doctoral Dissertation, University of Wisconsin-Whitewater]. Repository of UW-Whitewater. Available at: https://minds.wisconsin.edu/bitstream/handle... [Accessed: February 3, 2026].
- Johansson, E. 2012. Basel III – a study of Basel III and whether it may protect against new banking failures [Master’s Thesis, Jonkoping International Business School, Jonkoping]. DiVA. Available at: https://diva-portal.org/smash/records.jsf?pid=diva2%3A534429&dswid=-5161 [Accessed: February 1, 2026].
- Keshtgar, N.; Pahlavani, M.; Mirjalili, S.H. The impact of exchange rate volatility on banking performance (case of Iran). Journal of Business Development Studies 2020, 12(1), 39–56. [Google Scholar]
- Kolapo, T.F.; Ayeni, R.K.; Oke, M.O. Credit risk and commercial banks’ performance in Nigeria: a panel model approach. Australian Journal of Business and Management Research 2012, 2(2), 31–38. [Google Scholar] [CrossRef]
- Korinek, A. The new economic of prudent capital controls: a research agenda. IMF Economic Review 2011, 59(3), 523–561. [Google Scholar] [CrossRef]
- Lee, H.; Lee, S.; Paluszynski, R. Capital regulation and shadow finance: a quantitative analysis. Review of Economic Studies 2023, 91(5), 3047–3084. [Google Scholar] [CrossRef]
- Mateev, M.; Tariq, M.U.; Sahyouni, A. Competition, capital growth and risk-taking in emerging markets: policy implications for banking sector stability during COVID-19 pandemic. PloS one 2021, 16(6), e0253803. [Google Scholar] [CrossRef] [PubMed]
- Merton, R.C.; Perold, A.F. Theory of Risk Capital in Financial Firms. In Corporate Risk Management; crossref; Chew, D., Ed.; Columbia University Press.: New York, Chichester, West Sussex, 2008; pp. Pp. 131–161. [Google Scholar]
- Nandan Prasad, A.; Nandan Prasad, A. Regulatory compliance and risk management. In Introduction to data governance for machine learning systems: fundamental principles, critical practices, and future trends; Apress: Berkley, CA, 2024; pp. 485–624. [Google Scholar]
- Nguyen, T.P.T.; Nghiem, S.H. The relationships among default risk, capital ratio and efficiency: evidence from Indian banks. Managerial Finance 2015, 41(5), 507–525. [Google Scholar] [CrossRef]
- Njagi, M.M.; Nzai, C. Effect of exchange rate volatility on performance of commercial banks in the East African Community. Journal of Economics 2022, 2(2), 1–12. Available online: https://edinburgjournals.org/journals/index.php/journal-of-economics/article/view/138.
- Nkwaira, C.; Kruger, J.W. Using risk-weighted assets to generate risk-weighted fees to counter the effects of Basel III on revenue generation. Journal of Finance 2018, 6(2), 48–54. [Google Scholar] [CrossRef]
- Nyambuu, U.; Bernard, L. A quantitative approach to assessing sovereign default risk in resource-rich emerging economies. Journal of Finance & Economics 2015, 20(3), 220–241. [Google Scholar]
- Osundina, C.K.; Osundina, J.A.; Jayeoba, O.O.; Olayinka, I.M. Exchange rate volatility and banks performance: evidence from Nigeria. IIARD International Journal of Economics and Business Management 2016, 2(4), 1–11. [Google Scholar]
- Ozili, P.K. Basel III in Nigeria: making it work. Bullion 2021, 45(1), 16–23. [Google Scholar]
- Pernell, K.; Jung, J. Rethinking moral hazard: governmental protection and bank risk-taking. Socio-Economic Preview 2024, 22(2), 625–653. [Google Scholar] [CrossRef]
- Reuters. Nigerian lenders submitting recapitalisation plans, central bank says. Reuters, London. 2024. Available online: https://www.reuters.com.
- Taiwo, O. and Adesola O.A. 2013. Exchange rate volatility and bank performance in Nigeria. Asian Economic and Financial Review 3(2): 178–185. Available at: https://ideas.repec.org/a/asi/aeafrj/v3y2013i2p178-185id984.html [Accessed: February 4, 2026].
- TheCable Nigeria. CBN ends forbearance measures, asks banks to provide capital restoration plans. TheCable, Lagos. 2025. Available online: https://www.thecable.ng.
- Thibaut, D., Terajima, Y. and Yang, J. 2024. Interaction of macroprudential and monetary policies: practice ahead of theory. Bank of Canada Staff Discussion Paper SDP2024-18. Available at: https://www.bankofcanada.ca. [Accessed: February 3, 2026].
- Wodi, M. 2011. Cost implications of compliance with Basel III and competitiveness of internationally active banks [Masters Thesis, University of London]. Repository of the School of Advanced Study, University of London. Available at: https://sas-space.sas.ac.uk/4747/ [Accessed: February 2, 2026].
- World Bank. Regulatory proportionality and inclusive finance in Africa. World Bank: Washington, DC, 2024a; Policy Paper No. 456.
- World Bank. Balancing financial stability and innovation in emerging markets; World Bank: Washington, DC, 2024b. [Google Scholar]
- World Bank. Regulatory policy toolkit for financial stability; World Bank: Washington, DC, 2025. [Google Scholar]
Table 1.
Descriptive Statistics (2013–2024).
| Variable | NPL | CAR | COMPCOST | ROA | LIQ | SIZE | FXVOL |
| NPL | 1.000 | ||||||
| CAR | –0.412 | 1.000 | |||||
| COMPCOST | 0.368 | –0.291 | 1.000 | ||||
| ROA | –0.447 | 0.321 | –0.356 | 1.000 | |||
| LIQ | –0.122 | 0.118 | –0.094 | 0.105 | 1.000 | ||
| SIZE | –0.087 | 0.254 | –0.272 | 0.194 | 0.089 | 1.000 | |
| FXVOL | 0.296 | –0.187 | 0.211 | –0.244 | –0.071 | 0.165 | 1.000 |
Table 4.
Fixed Effects Regression (Model 1: Capital Adequacy, Exchange Rate Volatility, and Bank Risk).
Table 4.
Fixed Effects Regression (Model 1: Capital Adequacy, Exchange Rate Volatility, and Bank Risk).
| Variable | Coefficient | Std. Error | t-Statistic | p-Value |
| CAR | -0.162 | 0.046 | -3.52 | 0.001*** |
| FXVOL | 0.137 | 0.058 | 2.36 | 0.019** |
| ROA | -0.291 | 0.070 | -4.14 | 0.000*** |
| SIZE | -0.207 | 0.082 | -2.52 | 0.013** |
| Constant | 10.431 | 1.084 | 9.62 | 0.000*** |
R² (within): 0.45. *** signifies significance at 1%, ** signifies significance at 5%.
Table 5.
Fixed Effects Regression (Model 2: Compliance Cost, Exchange Rate Volatility, and Risk).
| Variable | Coefficient | Std. Error | t-Statistic | p-Value |
| COMPCOST | 0.281 | 0.071 | 3.96 | 0.000*** |
| FXVOL | 0.119 | 0.053 | 2.25 | 0.025** |
| ROA | -0.228 | 0.068 | -3.35 | 0.001*** |
| SIZE | -0.134 | 0.078 | -1.72 | 0.086** |
| Constant | 5.037 | 1.026 | 4.91 | 0.000*** |
R² (within): 0.40 *** signifies significance at 1%, ** signifies significance at 5%.
Table 6.
Fixed Effects Regression (Model 3: Capital Adequacy, Compliance Cost, Exchange Rate Volatility, and Risk).
Table 6.
Fixed Effects Regression (Model 3: Capital Adequacy, Compliance Cost, Exchange Rate Volatility, and Risk).
| Variable | Coefficient | Std. Error | t-Statistic | p-Value |
| CAR | -0.141 | 0.048 | -2.94 | 0.004** |
| COMPCOST | 0.249 | 0.069 | 3.60 | 0.000*** |
| FXVOL | 0.127 | 0.055 | 2.31 | 0.022** |
| ROA | -0.281 | 0.066 | -4.27 | 0.000*** |
| SIZE | -0.116 | 0.080 | -1.45 | 0.148** |
| Constant | 8.104 | 1.047 | 7.74 | 0.000*** |
R² (within): 0.50 *** signifies significance at 1%, ** signifies significance at 5%.
Table 7.
Fixed Effects Regression (Model 4: Interaction of Capital Adequacy, Compliance Cost, and Exchange Rate Volatility).
Table 7.
Fixed Effects Regression (Model 4: Interaction of Capital Adequacy, Compliance Cost, and Exchange Rate Volatility).
| Variable | Coefficient | Std. Error | t-Statistic | p-Value |
| CAR | -0.169 | 0.045 | -3.76 | 0.000*** |
| COMPCOST | 0.261 | 0.070 | 3.73 | 0.000*** |
| CAR × COMPCOST | 0.011 | 0.004 | 2.92 | 0.004** |
| FXVOL | 0.118 | 0.052 | 2.27 | 0.024** |
| ROA | -0.263 | 0.065 | -4.05 | 0.000*** |
| Constant | 7.524 | 1.012 | 7.43 | 0.000*** |
R² (within): 0.55 *** signifies significance at 1%, ** signifies significance at 5%.
Table 8.
Robustness Using the Two-step System GMM Method.
| VARIABLES | Model 1 | Model 2 | Model 3 | Model 4 |
| CAR | -0.0563*** | -0.0733*** | -0.149*** | |
| (0.0070) | (0.0069) | (0.0226) | ||
| COMPCOST | 0.232*** | 0.254* | 0.440*** | |
| (0.015) | (0.134) | (0.054) | ||
| CAR*COMPCOST | 0.0822** | |||
| (0.0348) | ||||
| FXVOL | 6.939*** | 9.038*** | 8.291*** | 9.346*** |
| (1.714) | (2.045) | (2.134) | (2.304) | |
| ROA | -0.188*** | -0.0824*** | -0.129*** | -0.133*** |
| (0.025) | (0.029) | (0.027) | (0.026) | |
| SIZE | -0.245*** | -0.237*** | -0.215*** | -0.233*** |
| (0.055) | (0.043) | (0.047) | (0.049) | |
| Constant | 5.794** | 6.370* | 7.962* | 9.128* |
| (2.806) | (3.466) | (4.135) | (5.300) | |
| Observations | 440 | 440 | 440 | 440 |
| Number of bankid | 40 | 40 | 40 | 40 |
| Number of instruments | 16 | 16 | 16 | 16 |
| Prob > F | 0.0000 | 0.0000 | 0.0000 | 0.0000 |
| AR(1) | 0.000 | 0.000 | 0.000 | 0.000 |
| AR(2) | 0.189 | 0.400 | 0.337 | 0.274 |
| Sargan | 0.587 | 0.712 | 0.726 | 0.663 |
| Hansen | 0.896 | 0.925 | 0.966 | 0.95 |
Source: Author’s computation. Standard errors in parentheses. *** p<0.01, ** p<0.05, * p<0.1.
Table 9.
Robustness Test (Alternative Risk Metrics Including Exchange Rate Volatility).
| Dependent Variable | CAR | COMPCOST | FXVOL | Adj. R² |
| Z-SCORE (stability) | 0.206 *** | –0.139 ** | –0.087 ** | 0.49 |
| ROE (profitability) | 0.171 ** | –0.198 *** | –0.094 ** | 0.46 |
| NPL (risk exposure) | –0.165 *** | 0.281 *** | 0.122 ** | 0.54 |
(Significance levels: *** p < 0.01; ** p < 0.05).
Table 10.
Policy Simulation: Optimal Regulatory Balance.
| Scenario | CAR Target (%) | COMPCOST (% of Income) | Projected Risk (NPL%) | ROE (%) |
| Basel Minimum | 10.5 | 5.0 | 6.2 | 2.9 |
| Moderate Tightening | 13.0 | 6.5 | 5.5 | 2.7 |
| Excessive Regulation | 16.0 | 9.0 | 7.1 | 2.1 |
| Proportional Framework | 12.5 | 5.5 | 5.1 | 3.2 |
Disclaimer/Publisher’s Note: The statements, opinions and data contained in all publications are solely those of the individual author(s) and contributor(s) and not of MDPI and/or the editor(s). MDPI and/or the editor(s) disclaim responsibility for any injury to people or property resulting from any ideas, methods, instructions or products referred to in the content. |
© 2026 by the authors. Licensee MDPI, Basel, Switzerland. This article is an open access article distributed under the terms and conditions of the Creative Commons Attribution (CC BY) license (http://creativecommons.org/licenses/by/4.0/).
Copyright: This open access article is published under a Creative Commons CC BY 4.0 license, which permit the free download, distribution, and reuse, provided that the author and preprint are cited in any reuse.


