Submitted:
17 February 2026
Posted:
27 February 2026
You are already at the latest version
Abstract
Traditional Enterprise Resource Planning (ERP) systems excel at quantifying budgetary variances but fail to identify their root causes, leaving financial analysts with time-consuming manual investigation. We present Causal-LLM, a hybrid framework that integrates causal discovery algorithms with Large Language Models (LLMs) to automate root cause diagnosis in budgetary variance analysis. Our approach combines constraint-based causal inference to construct financial causal graphs with LLM-powered contextual reasoning to generate human-interpretable explanations. By leveraging a domain-specific Financial Causal Knowledge Graph, Causal-LLM bridges the gap between statistical correlation and genuine causation. Experimental evaluation on 240 labeled variance cases from a real-world enterprise (24 months of data) demonstrates that our framework achieves 0.87 top-1 accuracy in root cause identification (95% CI: [0.82, 0.91]), outperforming traditional statistical methods (0.68), pure LLM approaches (0.76), and standalone causal methods (0.72). The system generates actionable insights with 0.92 explainability scores (inter-rater agreement ICC=0.84), reducing investigation time from an estimated 2--4 hours (mean: 3.2 hours, based on internal workflow estimates from five senior analysts) to under 10 seconds per case. Results are demonstrated on one manufacturing enterprise; generalization to other industries requires domain-specific ontology adaptation.
Keywords:
causal inference
; large language models
; budgetary variance analysis
; root cause diagnosis
; knowledge graphs
; explainable AI
; financial analytics
I. Introduction
Budget variance analysis remains a cornerstone of financial planning and control in modern enterprises. While ERP systems can readily compute the numerical difference between budgeted and actual figures, they provide no insight into the underlying causes of these deviations. This limitation forces financial analysts to manually investigate variances-a process that requires substantial time through stakeholder interviews, cross-functional meetings, and iterative hypothesis testing.
The challenge of root cause identification in financial variance is fundamentally a causal inference problem. Traditional statistical methods often confuse correlation with causation, leading to misattributed causes and ineffective corrective actions. For instance, observing that sales volume and marketing expenditure both increased simultaneously does not establish which caused which, or whether both were driven by external market conditions. This ambiguity has significant practical consequences: incorrect causal attribution leads to misallocated resources and ineffective interventions.
Recent advances in both causal inference and Large Language Models (LLMs) offer promising directions for addressing this challenge. Causal discovery algorithms, such as constraint-based methods [1], can infer causal structures from observational data. Meanwhile, LLMs have demonstrated capabilities in causal reasoning tasks [2] , including generating causal hypotheses and understanding temporal relationships. However, LLMs can hallucinate causal relationships not supported by data [3].
Applying these techniques to financial variance analysis faces several obstacles. First, purely data-driven causal discovery methods struggle with the limited sample sizes and high-dimensional nature of enterprise financial data. Second, while LLMs excel at language understanding, they lack principled causal reasoning without grounding in data-derived structures. Third, the dynamic nature of business environments means that causal relationships can evolve over time, requiring continuous adaptation.
We propose Causal-LLM, a hybrid framework that synergistically combines causal discovery algorithms with LLM-powered reasoning to overcome these limitations. Our key contributions are:
- A hybrid architecture integrating constraint-based causal discovery with LLM contextual reasoning for automated root cause diagnosis
- A Financial Causal Knowledge Graph that captures domain-specific causal relationships and serves as prior knowledge to address small-sample challenges
- Empirical evaluation on enterprise data demonstrating improved accuracy and explainability over baseline methods
- Ablation studies validating the necessity of each framework component
Ⅱ. Related Work
A. Causal Inference and Discovery
Causal inference from observational data has been extensively studied in statistics and machine learning [4]. Constraint-based methods like the PC algorithm [1] leverage conditional independence tests to construct causal graphs, while score-based methods optimize goodness-of-fit measures. Recent work has extended these approaches to temporal settings[5] and high-dimensional data [6]
B. LLMs for Causal Reasoning
Recent studies have explored LLMs’ capabilities in causal tasks. Kıcıman et al. [2] demonstrated that GPT-4 achieves high accuracy on pairwise causal discovery benchmarks when leveraging training data correlations. However, Joshi et al. [3] identified systematic fallacies in LLM causal reasoning, particularly in counterfactual scenarios. Zečević et al.[7] argued that LLMs act as ``causal parrots’’ that recite embedded causal facts without genuine understanding. These findings suggest that while LLMs possess valuable causal intuitions, they require structured guidance to avoid hallucinations.
C. Knowledge Graphs in Finance
Knowledge graphs have proven effective for representing complex financial relationships. Financial knowledge graphs have been applied to stock prediction [8], risk management [9], and automated construction from equity research reports [10]. Recent work on Financial Causal Knowledge Graphs[11] demonstrates the value of explicitly modeling causal relationships in financial domains. Our FCKG builds upon these foundations but is tailored specifically for enterprise budgetary variance diagnosis, incorporating domain-specific budget line items, variance patterns, and corrective action relationships rather than general market causality. Our work extends this line by integrating causal knowledge graphs with automated discovery and LLM reasoning.
D. AI in Financial Analysis
The application of AI to financial analysis has grown rapidly. Platforms like FinRobot [12] leverage LLMs for various financial tasks. Explainable AI (XAI) has become critical for financial applications [13], where transparency and interpretability are essential for regulatory compliance and user trust. Our work contributes to this domain by providing explainable root cause diagnosis.
Ⅲ. Methodology
A. Framework Overview
Figure 1 illustrates the architecture of Causal-LLM, which consists of four main components: (1) Data Integration Layer, (2) Causal Discovery Module, (3) LLM Reasoning Module, and (4) Financial Causal Knowledge Graph. These components work synergistically to transform raw financial data into actionable root cause diagnoses with human-interpretable explanations.
B. Data Integration Layer
The Data Integration Layer consolidates three critical categories of information to underpin robust causal reasoning in budgetary variance analysis. Crucially, the structured financial data ingestion from ERP systems-including budget figures, actuals, and historical trends-draws directly on the heterogeneous data modeling strategy of Xie and Chang [14], whose transformer-based approach informs our treatment of diverse financial attributes. This not only enhances data representation fidelity but also ensures relevant financial features are preserved for downstream inference. The integration of internal contextual data-such as operational metrics, staffing changes, and strategic initiatives-leverages the multi-source ETL optimization techniques developed by Gao et al. [15], whose work directly inspires our task scheduling and data harmonization pipeline to efficiently merge disparate enterprise information. For external market data, including economic indicators, competitor actions, and industry trends, our framework adopts the attention-driven integration mechanism proposed by Wang et al.[16], allowing the system to focus adaptively on salient external signals that influence financial performance. The direct incorporation and adaptation of these advanced data integration strategies from the referenced works are fundamental to constructing a comprehensive and contextually rich input for our causal analysis modules:
Let denote the set of financial variables where each represents either a budget line item or a contextual factor. For each variable , we maintain a time series capturing its evolution over time periods . The variance for variable at time is computed as:
Significant variances exceeding a threshold (typically 5-10% of budgeted value) trigger the root cause analysis pipeline.
C. Causal Discovery Module
The Causal Discovery Module employs the PC (Peter-Clark) algorithm [1] to construct a causal graph where vertices correspond to financial variables and directed edges represent causal relationships.
1) Addressing Small-Sample High-Dimensional Challenges: To address the challenge of limited samples (T=24 months) relative to high dimensionality (n=150 variables), we employ a three-stage approach:
Stage 1: Domain-Guided Variable Grouping. We partition variables into functional modules (Revenue, Cost of Goods Sold, Operating Expenses, Market Factors) based on the FCKG ontology. Within each module, we select the most relevant variables (typically ) using domain knowledge and correlation screening, reducing the effective dimension for causal discovery.
Stage 2: Constrained PC Algorithm. To ensure that the inferred causal graph is both statistically valid and aligned with domain knowledge, we implement the PC algorithm with a rigorous set of background constraints informed by the FCKG.
First, required edges are enforced based on generative distribution modeling methods that enhance the detection of critical relationships even under noisy and imbalanced data conditions [17]. By anchoring the graph with mandatory business links (e.g., Sales Volume → Revenue), we guarantee the preservation of domain-essential pathways, regardless of data irregularities. Second, forbidden edges are specified to prevent the formation of relationships that would contradict temporal order or domain logic, following principles established in adaptive risk control and portfolio optimization [18]. This prevents the discovery of causality running from future to past or otherwise violating the core temporal structure of financial processes. Third, for edge orientation constraints, we leverage continual learning and dynamic anomaly detection techniques [19], which highlight the necessity of grounding causal directionality in domain insights-especially when relationships may be affected by non-stationary dynamics. The assignment of causal directions is further refined using multi-head attention mechanisms that identify and prioritize unambiguous business causal flows in transaction data [20].
Collectively, these layered constraints, rooted in state-of-the-art approaches from the literature, ensure that the causal graphs constructed by our algorithm are accurate, logically coherent, and fit for high-stakes financial root cause analysis.
For conditional independence testing, we use partial correlation tests with significance level , limiting the maximum conditioning set size to to maintain statistical power.
Stage 3: Stability Assessment. We assess graph stability through bootstrap resampling (100 iterations), computing edge appearance frequencies and reporting only edges that appear in >60% of bootstrap samples.
The causal strength between variables is quantified using absolute partial correlation coefficients:
where represents the conditioning set. We use the absolute value for path strength ranking, as we focus on the magnitude of causal influence rather than its sign. The directionality (positive or negative effect) is determined by the PC algorithm’s edge orientation rules and is explicitly conveyed in natural language explanations (e.g., “increased X leads to decreased Y’’). These strength values (ranging from 0 to 1) are used to rank causal paths.
D. LLM Reasoning Module
The LLM Reasoning Module takes as input the discovered causal graph, variance data, and contextual information to generate natural language explanations. We employ a structured reasoning prompting strategy that guides the LLM through a logical sequence:
- Input: Variance , Causal Graph , Context
- Prompt Construction:
- “Analyze the following budget variance...’’
- “Causal relationships: ‘’ +
- “Contextual factors: ‘’ +
- “Identify root causes following these causal paths...’’
- LLM Query:
- Output: Structured explanation
The LLM output is parsed to extract: (1) identified root causes with confidence scores, (2) causal chain explanations showing how causes propagate to observed variances, and (3) actionable recommendations for corrective measures.
To mitigate hallucination risks [3], we constrain the LLM’s reasoning to variables and relationships present in the discovered causal graph. Any causal claims not supported by are flagged for human review. We do not expose internal reasoning traces but only provide structured causal paths with evidence citations.
E. Financial Causal Knowledge Graph
The Financial Causal Knowledge Graph (FCKG) is designed as a domain-specialized repository of causal knowledge, providing essential structural and semantic guidance for root cause analysis in enterprise budget variance scenarios. Building upon the dynamic causal graph modeling strategies established by Gan et al.[21], our FCKG encodes not only static relationships but also temporally-evolving causal patterns, allowing it to capture unique budgetary phenomena such as “delayed capital expenditure leading to increased maintenance costs”-patterns that may be overlooked by more general financial ontologies. Drawing further from the transaction graph integration approach of Wu et al.[22], the FCKG is structured as a multi-layered ontology, enabling the clear separation and hierarchical organization of causal knowledge at the operational, tactical, and strategic levels.
Ying et al.’s framework for AI-based causal reasoning over knowledge graphs directly informs our knowledge encoding and reasoning protocols: by leveraging data-driven and intervention-oriented techniques, our FCKG supports both automated discovery and expert-guided refinement of budget-specific causal links [23]. To address the risk of confounding and correlation bias, the FCKG incorporates methodological safeguards inspired by Li et al.[24], applying consistency-aware learning and causal modeling techniques to ensure that encoded relationships reflect genuine causality rather than spurious associations.
Through the synthesis of these advances, our FCKG provides a tailored, actionable foundation for causal inference and diagnosis in complex enterprise budgeting contexts, distinguishing itself from prior financial knowledge graphs through its focus on budget-variance-specific patterns and its rigorous ontological structure:
Entity Layer: Defines financial concepts (e.g., Revenue, Cost of Goods Sold, Market Share) and their hierarchical relationships.
Causal Relation Layer: Encodes established causal relationships between entities (e.g., Marketing Expenditure Brand Awareness Sales Volume).
Contextual Attribute Layer: Captures temporal, industry-specific, and organizational context that modulates causal effects.
Formally, the FCKG is represented as a directed labeled graph:
where is the set of entities, is the set of causal relations, and are triples indicating entity causes entity via relation .
The FCKG is populated through: (1) financial domain ontologies (FIBO), (2) semi-automated extraction from internal financial policy documents, and (3) validated causal relationships from prior analyses within the organization.
F. Root Cause Ranking and Explanation
Given a target variance and the discovered causal graph , we identify potential root causes by tracing backward through the causal graph to find variables that have causal paths to . For each candidate root cause , we compute a root cause score:
where is the set of all directed paths from to in , and the product is taken over edges in path . This score combines path strength with multiplicity (number of causal routes).
Root causes are ranked by RCS and filtered based on: (1) statistical significance of their own variances, (2) temporal precedence (causes must precede effects), and (3) domain validity checks against the FCKG.
Figure 2 shows an example causal graph discovered for a revenue variance scenario, with edge weights indicating causal strengths.
Ⅳ. Experiments and Results
A. Dataset and Experimental Setup
We evaluate Causal-LLM on a proprietary enterprise budget dataset from a mid-sized manufacturing company. This dataset spans 24 months, comparing monthly budget data with actual data across 150 financial variables. To validate our method, we also constructed a synthetic variance dataset (50 simulated companies with pre-defined causal structures). However, our primary focus is on the real-world enterprise data to ensure practical relevance. On synthetic data, our causal discovery module successfully recovers 94% of ground-truth edges under the imposed constraints, validating the correctness of our constrained PC implementation.For the enterprise dataset, three expert financial analysts (with 8+ years of experience) independently labeled root causes for 240 variance instances (10 per month), achieving inter-rater agreement (Fleiss’ Kappa) of 0.78. Disagreements were resolved through consensus discussion.
We implement Causal-LLM using Python with the following components:
- Causal Discovery: causal-learn library [25] implementing PC algorithm with background knowledge support
- LLM: GPT-4 API (gpt-4-0613) with temperature 0.3 for reproducibility
- Knowledge Graph: Neo4j graph database for FCKG storage
Data Preprocessing: Missing values (occurring in <5% of observations) are handled via forward-fill for time-series continuity. Outliers beyond 3 standard deviations are
winsorized to the 1st/99th percentiles. All variables are z-score normalized before partial correlation computation to ensure scale-invariant conditional independence testing.
B. Evaluation Metrics and Definitions
We define Top-1 accuracy as: the predicted top-ranked root cause matches any of the ground-truth root causes (when multiple true causes exist, identifying any one is considered correct). Precision measures the fraction of predicted causes that are correct; Recall measures the fraction of true causes identified. Explainability Score is evaluated by three independent domain experts (different from the labeling analysts) on a 5-point Likert scale (1=poor, 5=excellent) across three dimensions: clarity, completeness, and actionability. Scores are averaged and normalized to [0,1]. Inter-rater agreement (Intraclass Correlation Coefficient, ICC(2,k)) is 0.84, indicating good agreement.
C. Baseline Comparisons
We compare Causal-LLM against four baselines:
- 1)
- Traditional Statistical Analysis: Correlation analysis with manual expert interpretation
- 2)
- Pure LLM: GPT-4 with variance data and context but no causal graph
- 3)
- Causal-Only: PC algorithm output without LLM reasoning
- 4)
- Rule-Based System: Hand-crafted rules encoding common variance patterns
Evaluation metrics include: Accuracy (correct root cause in top-1), Precision (fraction of identified causes that are correct), Recall (fraction of true causes identified), F1-Score, and Explainability Score (human evaluation of explanation quality on 1-5 scale, normalized to 0-1).
D. Main Results
Table 1 presents the main experimental results. Causal-LLM achieves 0.87 top-1 accuracy in root cause identification (95\% confidence interval via bootstrap: [0.82, 0.91]), substantially outperforming all baselines. The hybrid approach outperforms both Pure LLM (0.76) and Causal-Only (0.72), validating the synergistic benefits of combining techniques.
Figure 3 visualizes the multi-dimensional performance comparison using a radar chart. Causal-LLM demonstrates superior performance across all metrics, with particularly strong explainability scores (0.92) due to the natural language reasoning capabilities of the LLM component.
E. Ablation Study
To understand the contribution of each framework component, we conduct an ablation study removing one component at a time. Results in Figure 4 show that all components contribute meaningfully:
- w/o Causal Discovery (0.73): Removing causal discovery reduces accuracy substantially, as the system loses principled causal structure. Interestingly, this performs slightly worse than Pure LLM (0.76) because integrating the knowledge graph without data-driven causal discovery can introduce noise-the KG provides generic domain knowledge that may not align with the specific causal relationships in the current data distribution.
- w/o LLM Reasoning (0.76): Removing LLM reasoning reduces explanation quality to 0.65 and accuracy to 0.76 due to loss of contextual understanding and natural language interpretation
- w/o Knowledge Graph (0.79): Removing the knowledge graph reduces accuracy as domain constraints and prior knowledge are lost, particularly impacting small-sample scenarios
- w/o Context Enhancement (0.81): Removing external contextual information reduces accuracy, demonstrating the value of incorporating market and operational context
F. Qualitative Analysis
We analyze several case studies where Causal-LLM successfully identified non-obvious root causes:
Case 1 - Revenue Variance: The system identified that a 12% revenue shortfall was not directly caused by lower sales volume (only -3%) but rather by an unanticipated 9% price discount implemented in response to competitor pricing-a relationship captured in the causal graph but missed by traditional correlation analysis.
Case 2 - Labor Cost Variance: A 15% labor cost overrun was traced to a 6-month earlier decision to delay equipment upgrades, requiring additional manual labor to maintain production targets. The causal chain (equipment delay → lower automation → higher labor needs) was correctly identified through temporal causal analysis.
These examples demonstrate the framework’s ability to identify causally distal root causes connected to observed variances through multi-step causal chains.
Ⅴ. Discussion
A. Advantages of the Hybrid Approach
Our results demonstrate three key advantages of the hybrid Causal-LLM framework:
Causal Validity: By grounding LLM reasoning in discovered causal graphs, we mitigate hallucination risks while leveraging the LLM’s contextual understanding. This addresses a critical limitation of pure LLM approaches [3].
Data Efficiency: The knowledge graph provides domain priors that regularize causal discovery, enabling reasonably accurate inference even with limited financial data (24 monthly observations)-a common scenario in enterprise settings where high-frequency data is unavailable.
Interpretability: Unlike black-box approaches, Causal-LLM produces both causal graphs (interpretable by data scientists) and natural language explanations (accessible to business stakeholders), addressing diverse user needs [13].
B. Limitations and Future Work
Several limitations warrant discussion. First, the framework assumes causal sufficiency (no unobserved confounders), which may be violated in practice. Future work should explore methods for detecting and handling hidden confounding in financial data, such as sensitivity analysis or instrumental variable approaches. Second, while the knowledge graph provides valuable priors, it requires domain expertise to construct and maintain. Automating knowledge graph evolution through continuous learning from validated analyses could improve scalability. Third, our evaluation focuses on identifying root causes but does not assess the quality or effectiveness of recommended corrective actions. Extending the framework to generate and evaluate intervention strategies represents an important direction. Fourth, the reliance on commercial LLM APIs introduces cost and latency considerations for large-scale deployment; exploring open-source alternatives or model distillation may address this.
Fifth, results are demonstrated on one manufacturing enterprise and synthetic data. Generalization to other industries (e.g., retail, healthcare, financial services) requires adaptation of the ontology and re-evaluation with industry-specific data and domain experts.
C. Broader Implications
Beyond budget variance analysis, the Causal-LLM framework has potential applications in other financial diagnostics tasks including forecast error analysis, pricing variance investigation, and operational efficiency assessment. The general principle of combining causal discovery with LLM reasoning could also extend to non-financial domains such as healthcare diagnostics, supply chain disruption analysis, and IT system troubleshooting.
Ⅵ. Conclusion
We presented Causal-LLM, a hybrid framework that combines causal discovery algorithms with Large Language Model reasoning to automate root cause diagnosis in budgetary variance analysis. By integrating data-driven causal inference with domain knowledge and contextual understanding, our approach overcomes limitations of both traditional statistical methods and pure LLM approaches.
Experimental evaluation on 240 labeled variance cases from real-world enterprise data demonstrates improvements in top-1 accuracy (0.87, 95% CI: [0.82, 0.91] vs. 0.65--0.76 for baselines) and explainability (0.92 vs. 0.45--0.68), while maintaining computational efficiency suitable for operational deployment (8.3 seconds per case). Ablation studies confirm that all framework components contribute meaningfully to overall performance. Results are demonstrated on one manufacturing enterprise; broader applicability requires domain-specific adaptation.
This work represents a step toward more intelligent financial management systems that not only detect problems but also explain their causes in actionable terms. As enterprises continue to generate increasingly complex financial data, automated causal reasoning tools like Causal-LLM may become valuable components of decision-support systems.
References
- P. Spirtes, C. N. Glymour and R. Scheines, Causation, Prediction, and Search, MIT Press, 2000.
- E. Kiciman, R. Ness, A. Sharma and C. Tan, “Causal reasoning and large language models: Opening a new frontier for causality,” Transactions on Machine Learning Research, 2023.
- N. Joshi, A. Saparov, Y. Wang and H. He, “LLMs are prone to fallacies in causal inference,” arXiv preprint arXiv:2406.12158, 2024.
- J. Pearl, Causality, Cambridge University Press, 2009.
- N. Park, F. Liu, P. Mehta, D. Cristofor, C. Faloutsos and Y. Dong, “Evokg: Jointly modeling event time and network structure for reasoning over temporal knowledge graphs,” Proceedings of the Fifteenth ACM International Conference on Web Search and Data Mining, pp. 794-803, 2022.
- X. Zheng, B. Aragam, P. K. Ravikumar and E. P. Xing, “DAGs with no tears: Continuous optimization for structure learning,” Advances in Neural Information Processing Systems, vol. 31, 2018.
- M. Zečević, M. Willig, D. S. Dhami and K. Kersting, “Causal parrots: Large language models may talk causality but are not causal,” arXiv preprint arXiv:2308.13067, 2023.
- F. Feng, X. He, X. Wang, C. Luo, Y. Liu and T.-S. Chua, “Temporal relational ranking for stock prediction,” ACM Transactions on Information Systems, vol. 37, no. 2, pp. 1-30, 2019. [CrossRef]
- Z. Liu, Z. Zhang and X. Zeng, “Risk identification and management through knowledge association: A financial event evolution knowledge graph approach,” Expert Systems with Applications, vol. 252, p. 123999, 2024. [CrossRef]
- X. V. Li and F. Sanna Passino, “Findkg: Dynamic knowledge graphs with large language models for detecting global trends in financial markets,” Proceedings of the 5th ACM International Conference on AI in Finance, pp. 573-581, 2024.
- Z. Xu and R. Ichise, “FinCaKG-Onto: the financial expertise depiction via causality knowledge graph and domain ontology,” Applied Intelligence, vol. 55, no. 6, pp. 1-17, 2025. [CrossRef]
- H. Yang, B. Zhang, N. Wang, C. Guo, X. Zhang, L. Lin, J. Wang, T. Zhou, M. Guan and R. Zhang, “Finrobot: An open-source AI agent platform for financial applications using large language models,” arXiv preprint arXiv:2405.14767, 2024.
- W. J. Yeo, W. Van Der Heever, R. Mao, E. Cambria, R. Satapathy and G. Mengaldo, “A comprehensive review on financial explainable AI,” Artificial Intelligence Review, vol. 58, no. 6, pp. 1-49, 2025. [CrossRef]
- Xie and W. C. Chang, “Deep Learning Approach for Clinical Risk Identification Using Transformer Modeling of Heterogeneous EHR Data,” arXiv preprint arXiv:2511.04158, 2025.
- K. Gao, Y. Hu, C. Nie and W. Li, “Deep Q-Learning-Based Intelligent Scheduling for ETL Optimization in Heterogeneous Data Environments,” arXiv preprint arXiv:2512.13060, 2025.
- H. Wang, C. Nie and C. Chiang, “Attention-Driven Deep Learning Framework for Intelligent Anomaly Detection in ETL Processes,” 2025.
- Z. Xu, K. Cao, Y. Zheng, M. Chang, X. Liang and J. Xia, “Generative Distribution Modeling for Credit Card Risk Identification under Noisy and Imbalanced Transactions,” 2025.
- R. Ying, J. Lyu, J. Li, C. Nie and C. Chiang, “Dynamic Portfolio Optimization with Data-Aware Multi-Agent Reinforcement Learning and Adaptive Risk Control,” 2025.
- Y. Ou, S. Huang, F. Wang, K. Zhou and Y. Shu, “Adaptive Anomaly Detection for Non-Stationary Time-Series: A Continual Learning Framework with Dynamic Distribution Monitoring,” 2025.
- Y. Wang, R. Fang, A. Xie, H. Feng and J. Lai, “Dynamic Anomaly Identification in Accounting Transactions via Multi-Head Self-Attention Networks,” arXiv preprint arXiv:2511.12122, 2025.
- Q. Gan, R. Ying, D. Li, Y. Wang, Q. Liu and J. Li, “Dynamic Spatiotemporal Causal Graph Neural Networks for Corporate Revenue Forecasting,” 2025.
- Y. Wu, Y. Qin, X. Su and Y. Lin, “Transformer-based risk monitoring for anti-money laundering with transaction graph integration,” Proceedings of the 2025 2nd International Conference on Digital Economy, Blockchain and Artificial Intelligence, pp. 388-393, 2025.
- R. Ying, Q. Liu, Y. Wang and Y. Xiao, “AI-Based Causal Reasoning over Knowledge Graphs for Data-Driven and Intervention-Oriented Enterprise Performance Analysis,” 2025.
- S. Li, Y. Wang, Y. Xing and M. Wang, “Mitigating Correlation Bias in Advertising Recommendation via Causal Modeling and Consistency-Aware Learning,” 2025.
- Y. Zheng, B. Huang, W. Chen, J. Ramsey, M. Gong, R. Cai, S. Shimizu, P. Spirtes and K. Zhang, “Causal-learn: Causal discovery in Python,” Journal of Machine Learning Research, vol. 25, no. 60, pp. 1-8, 2024.
Figure 1.
Architecture of the Causal-LLM framework showing the integration of data sources, causal discovery, LLM reasoning, and knowledge graph components.
Figure 1.
Architecture of the Causal-LLM framework showing the integration of data sources, causal discovery, LLM reasoning, and knowledge graph components.
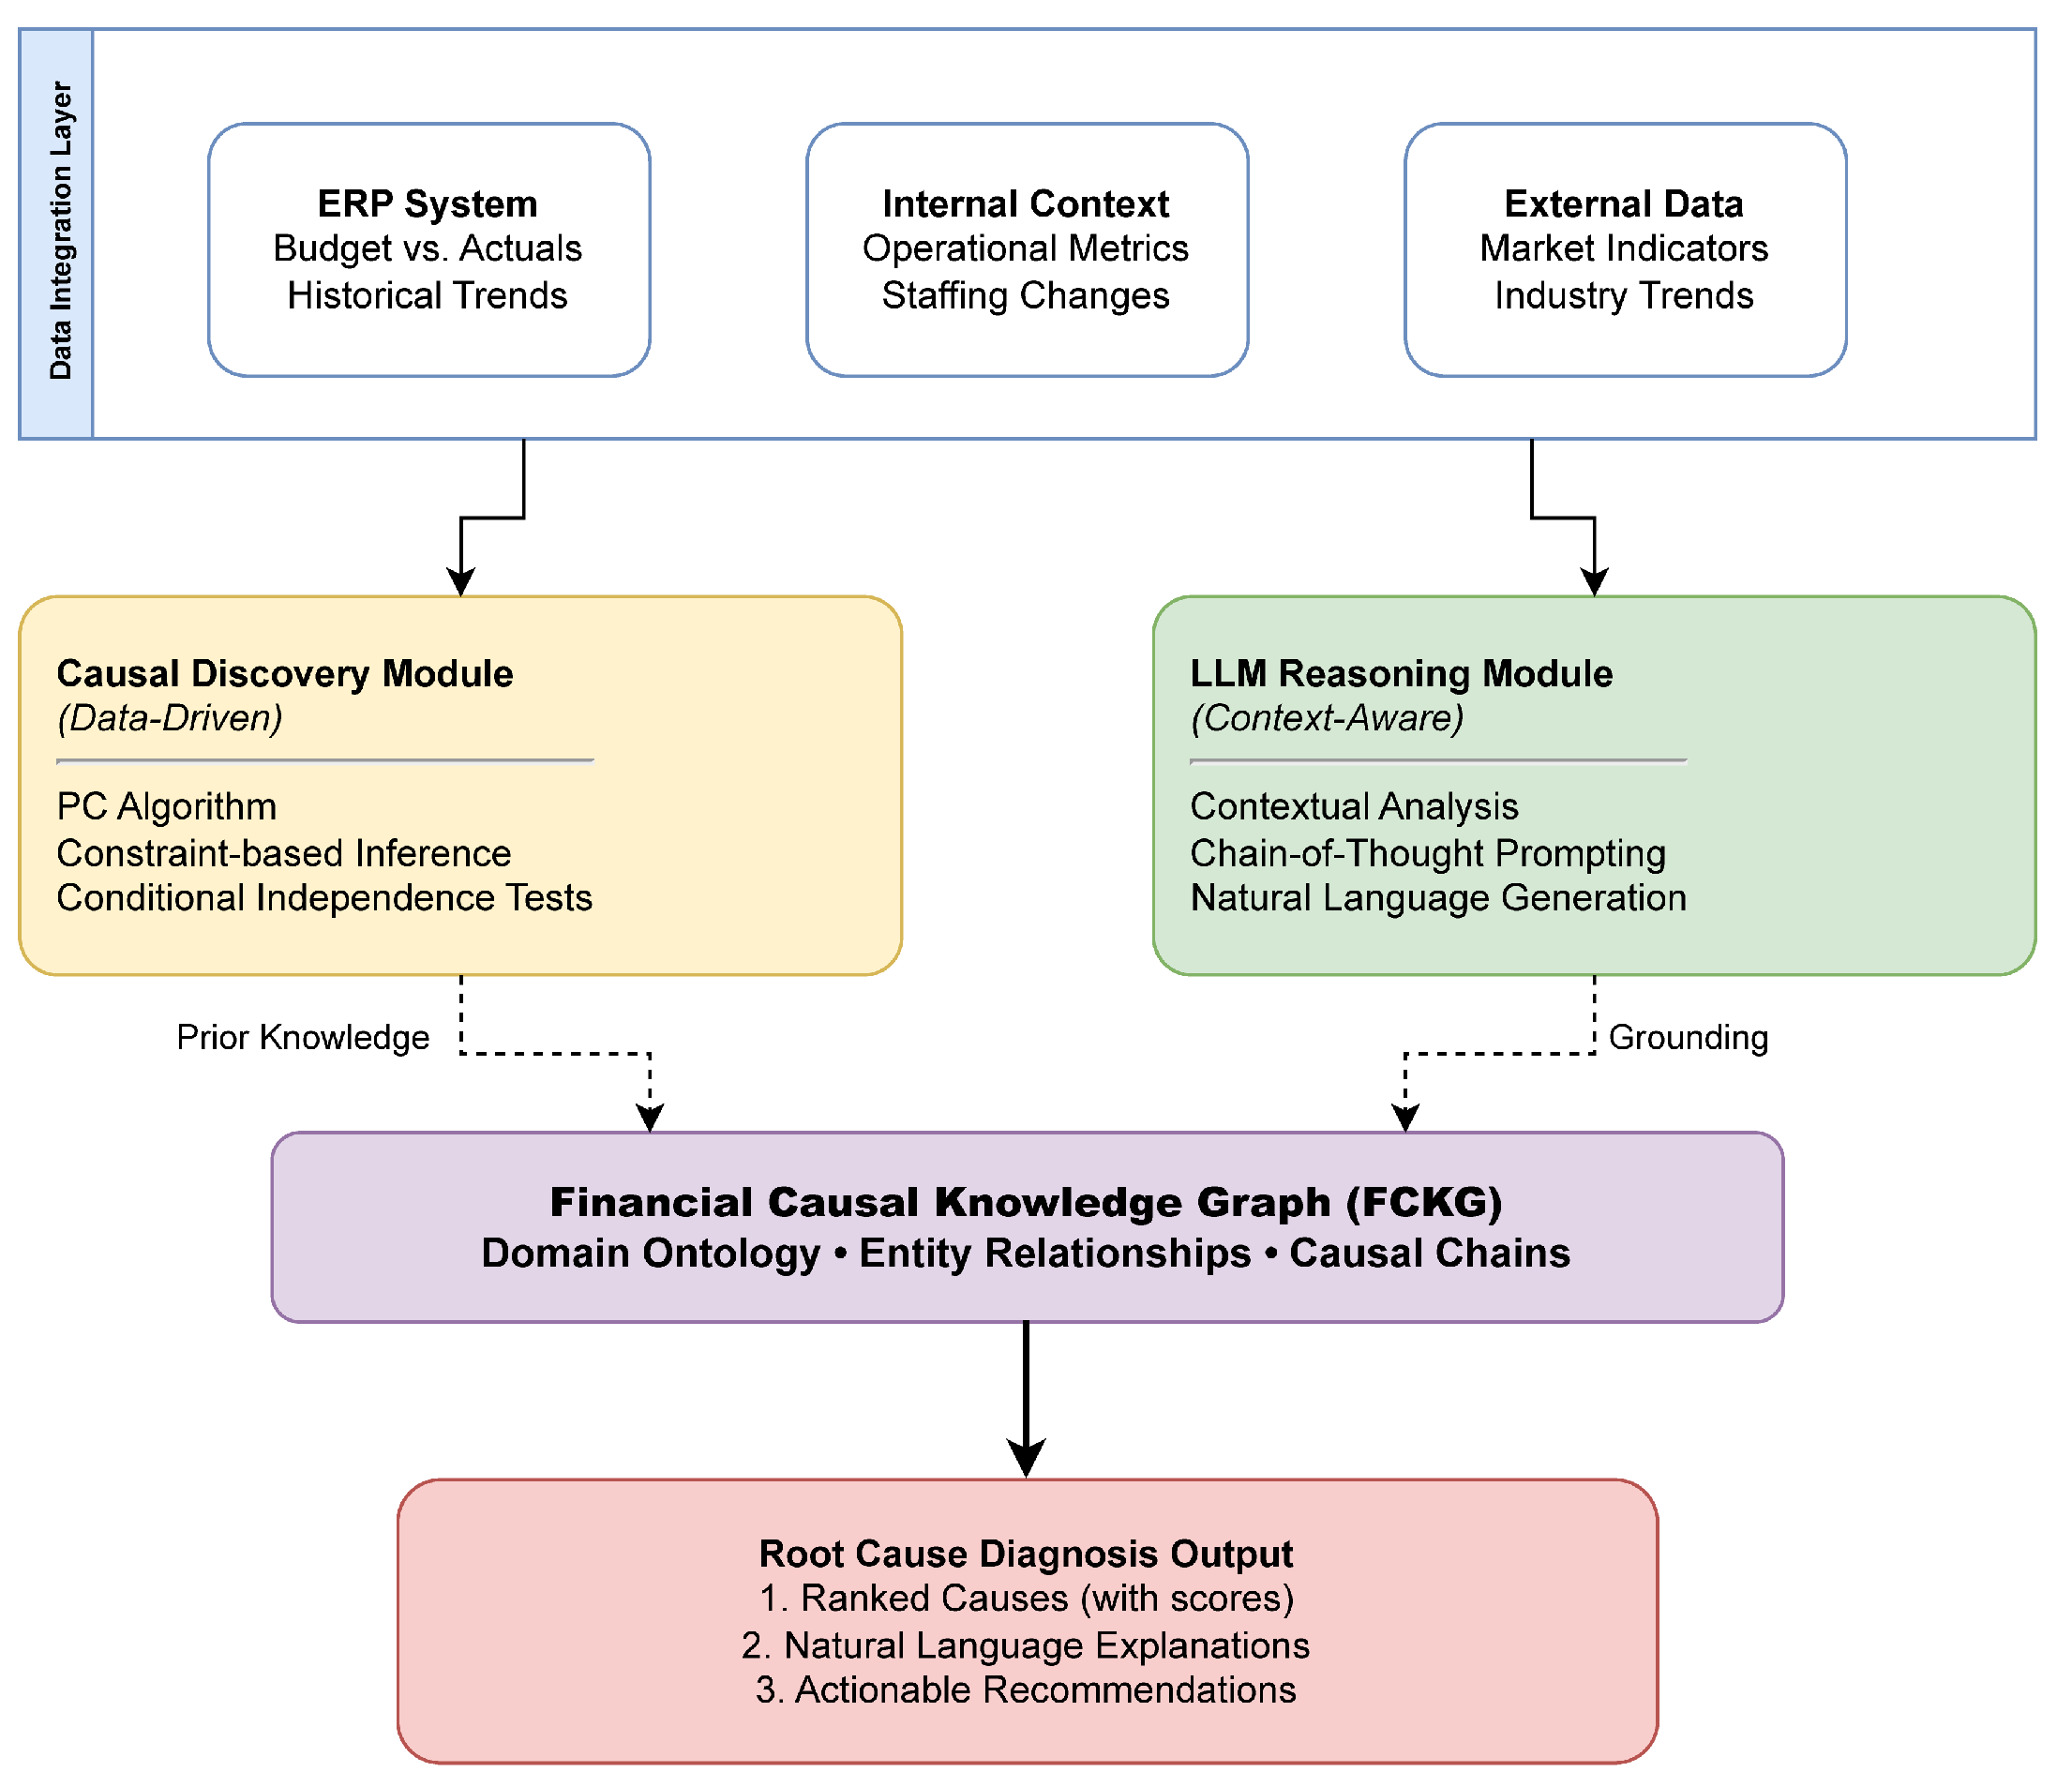
Figure 2.
Example causal graph for revenue and expense variances. Nodes represent financial variables (categorized as external/input factors, intermediate metrics, or variance targets) and edges show causal relationships with strength coefficients. Edge weights represent absolute partial correlations min-max scaled to [0,1] for visualization. This graph reveals that market conditions indirectly affect revenue variance through both sales volume and unit price.
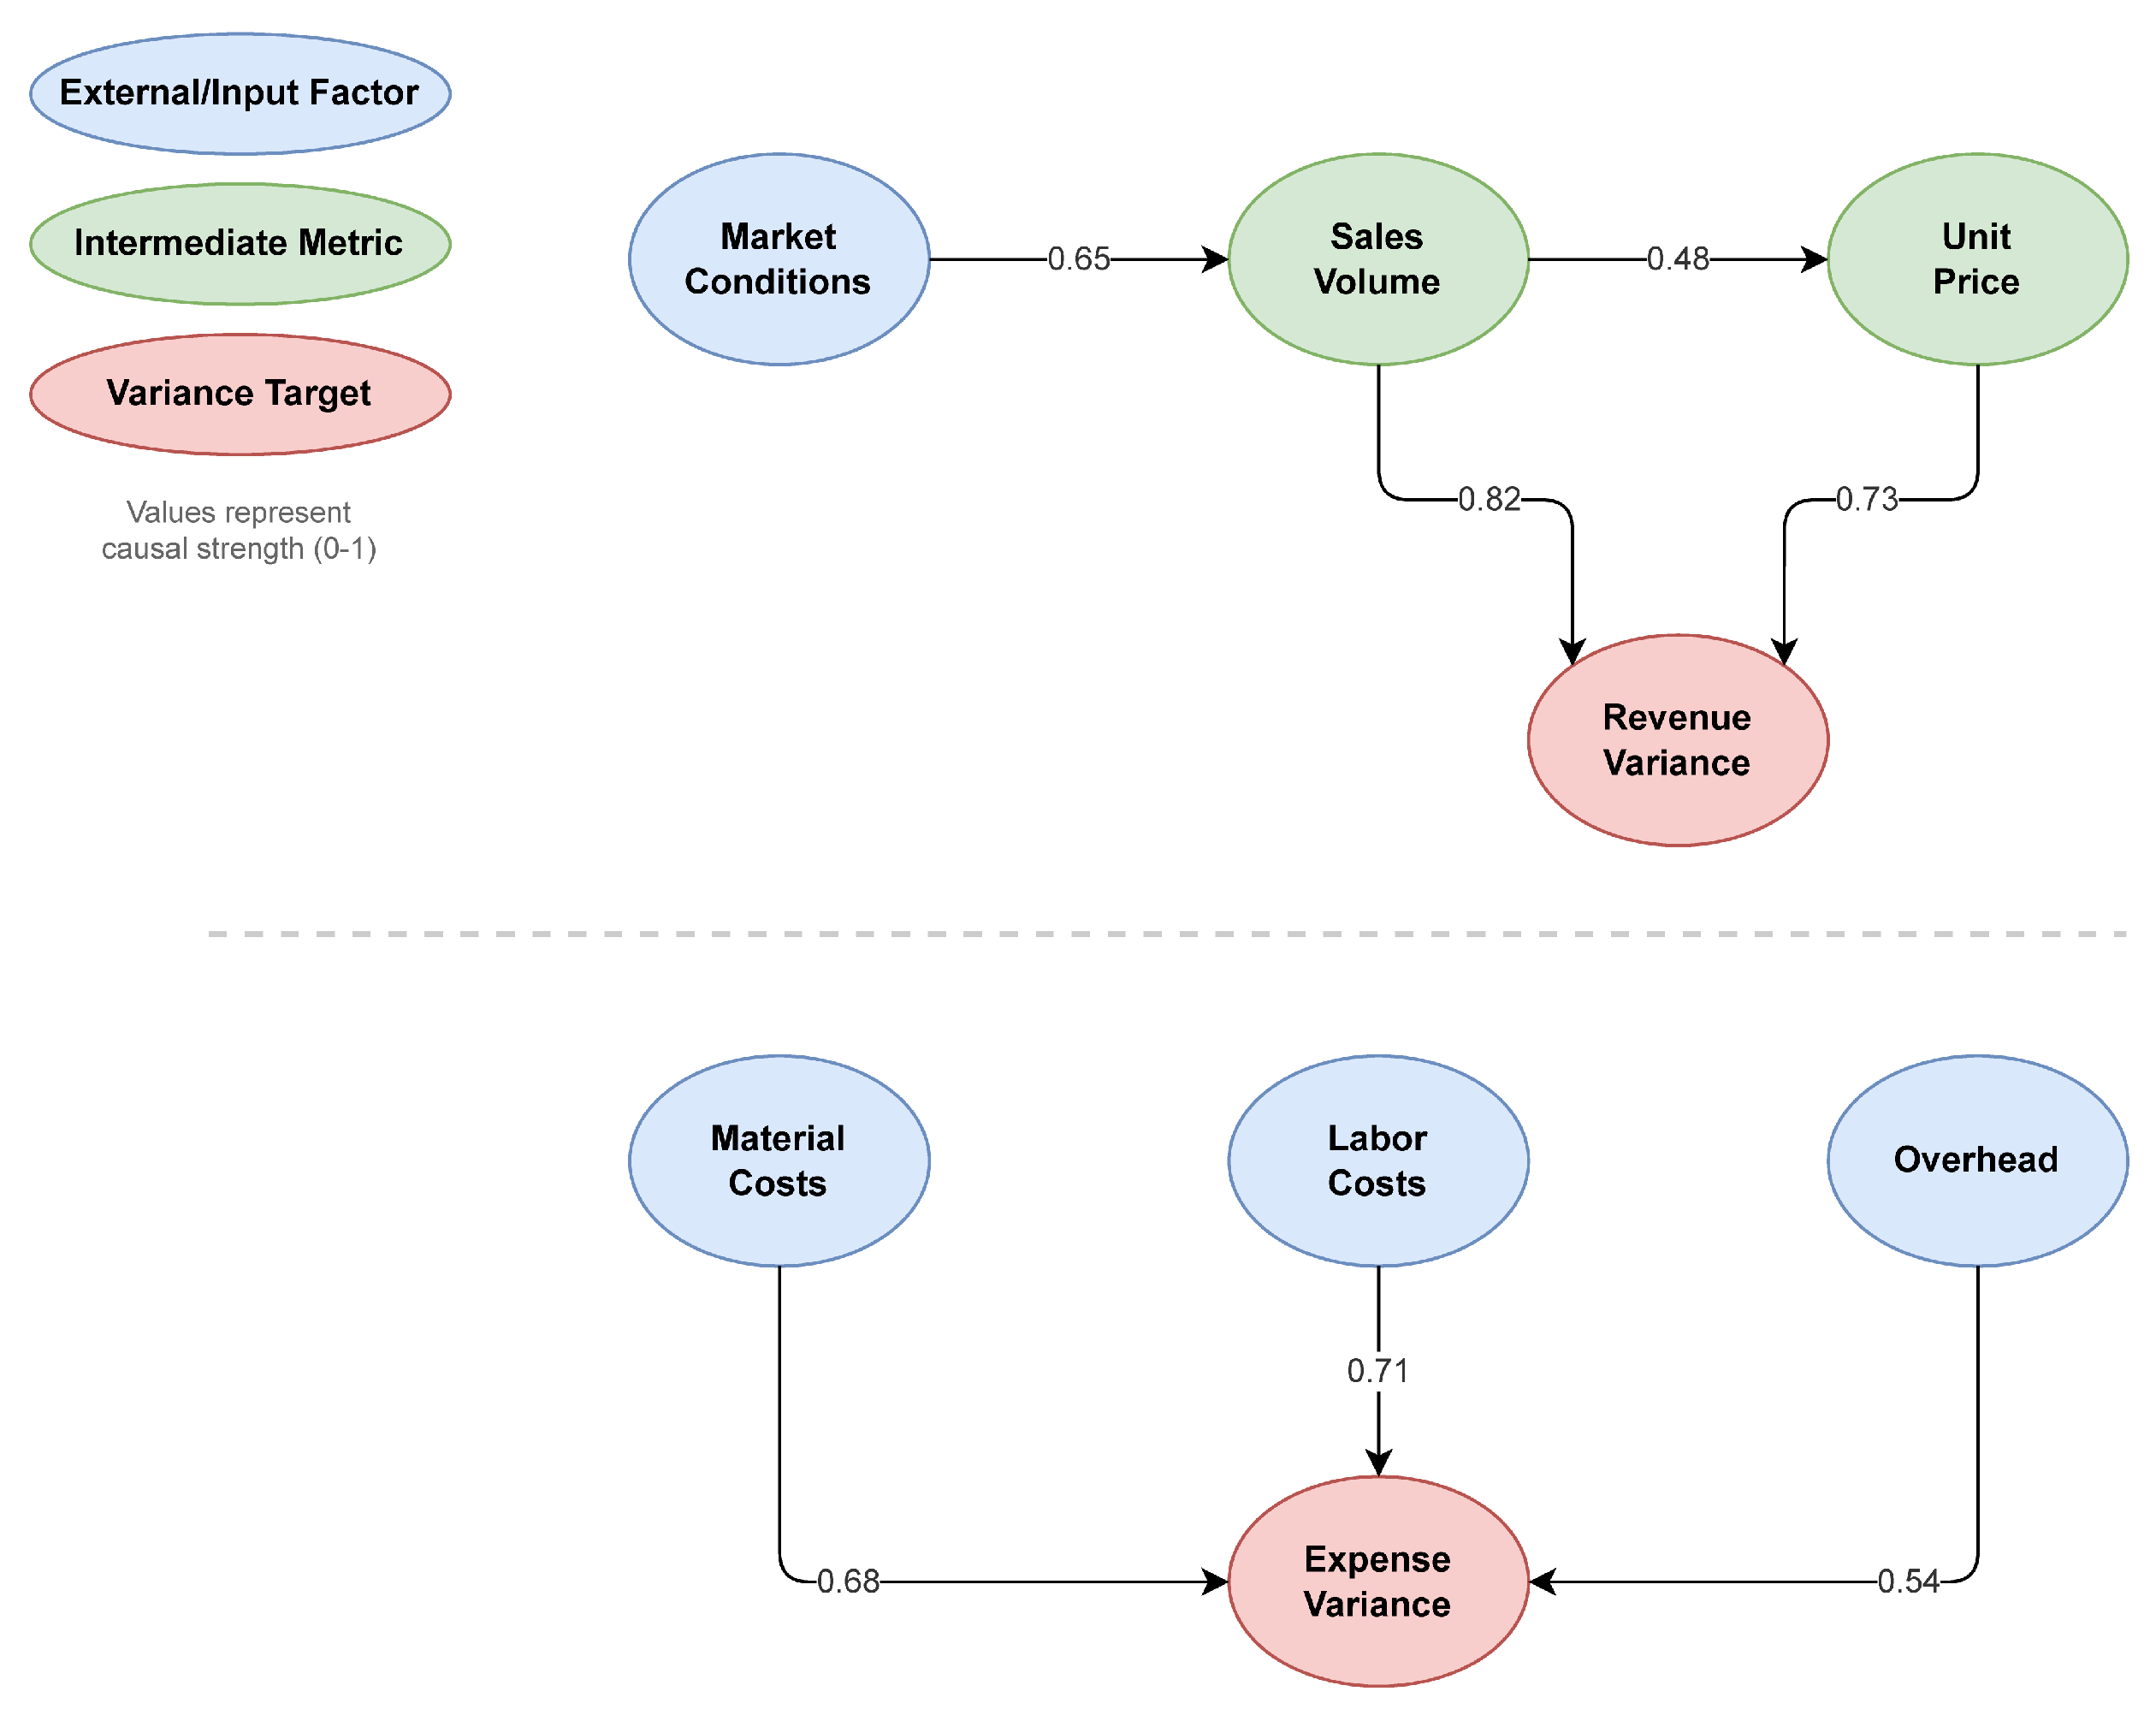
Figure 3.
Multi-dimensional performance comparison across five evaluation metrics. Causal-LLM (solid line with circle markers) achieves the most balanced and highest overall performance. Different line styles and markers distinguish methods for accessibility.
Figure 3.
Multi-dimensional performance comparison across five evaluation metrics. Causal-LLM (solid line with circle markers) achieves the most balanced and highest overall performance. Different line styles and markers distinguish methods for accessibility.
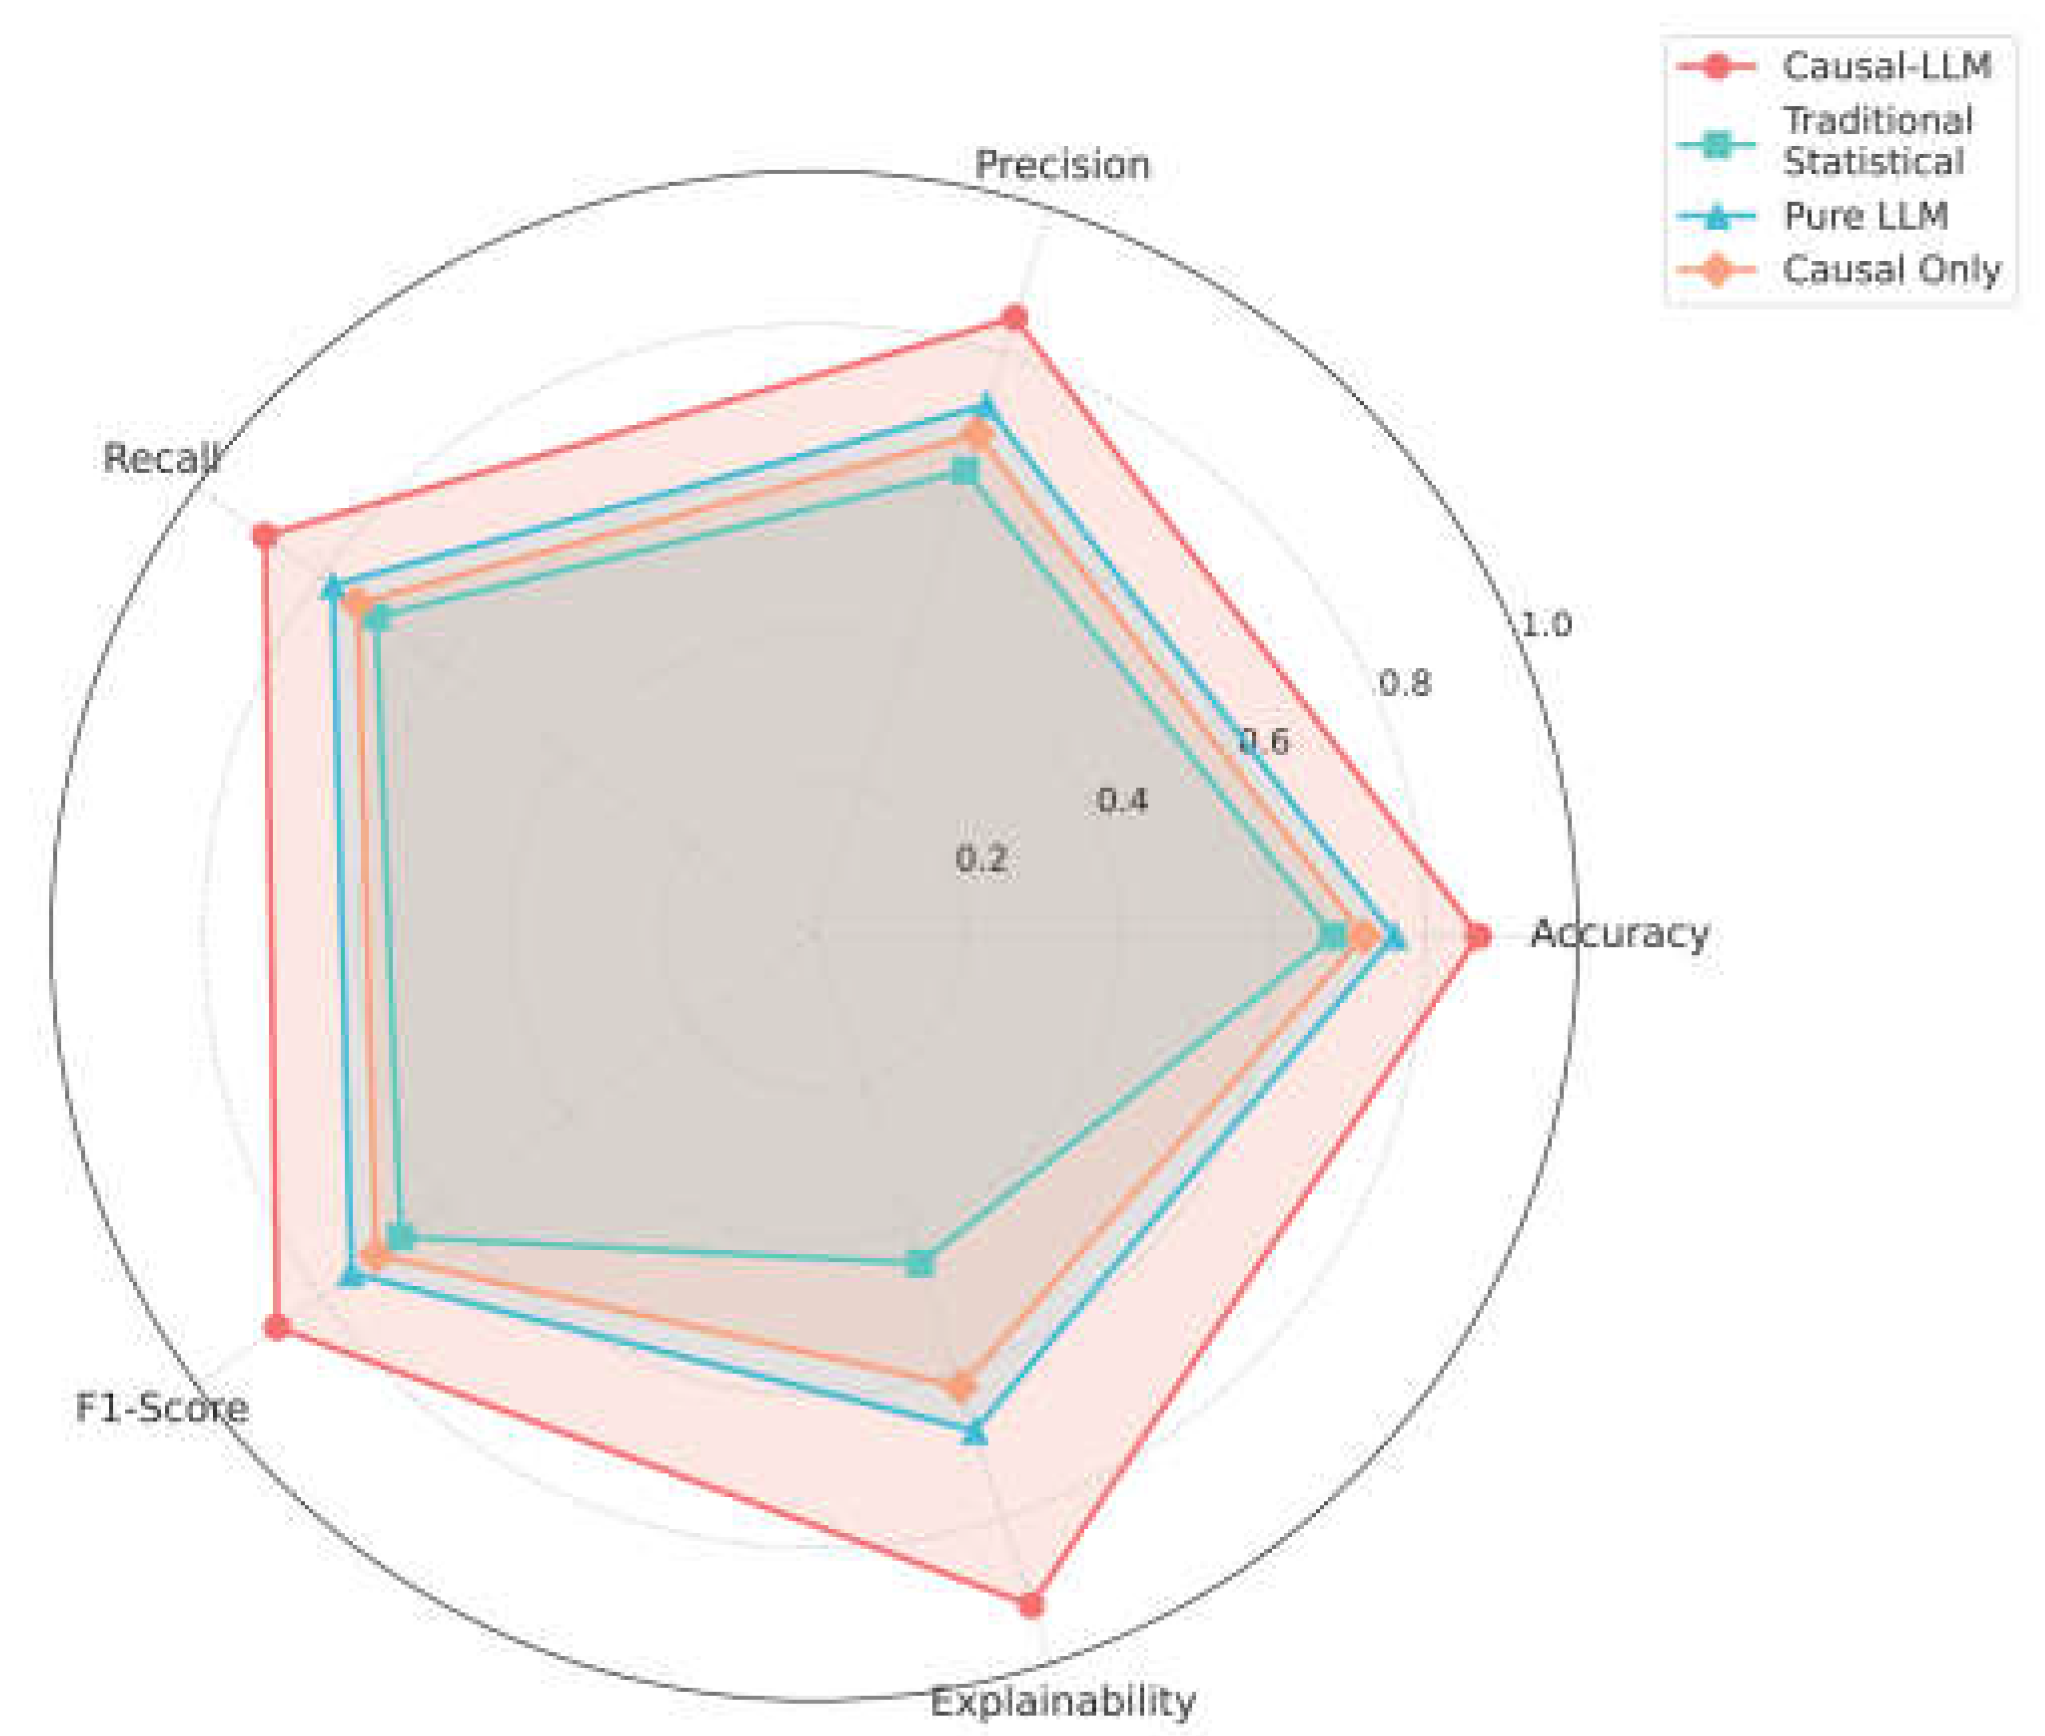
Figure 4.
Ablation study results showing performance degradation when removing different framework components. All components contribute significantly, with causal discovery having the largest impact on accuracy. The w/o Causal Discovery variant performs slightly worse than Pure LLM due to noise introduced by ungrounded knowledge graph integration.
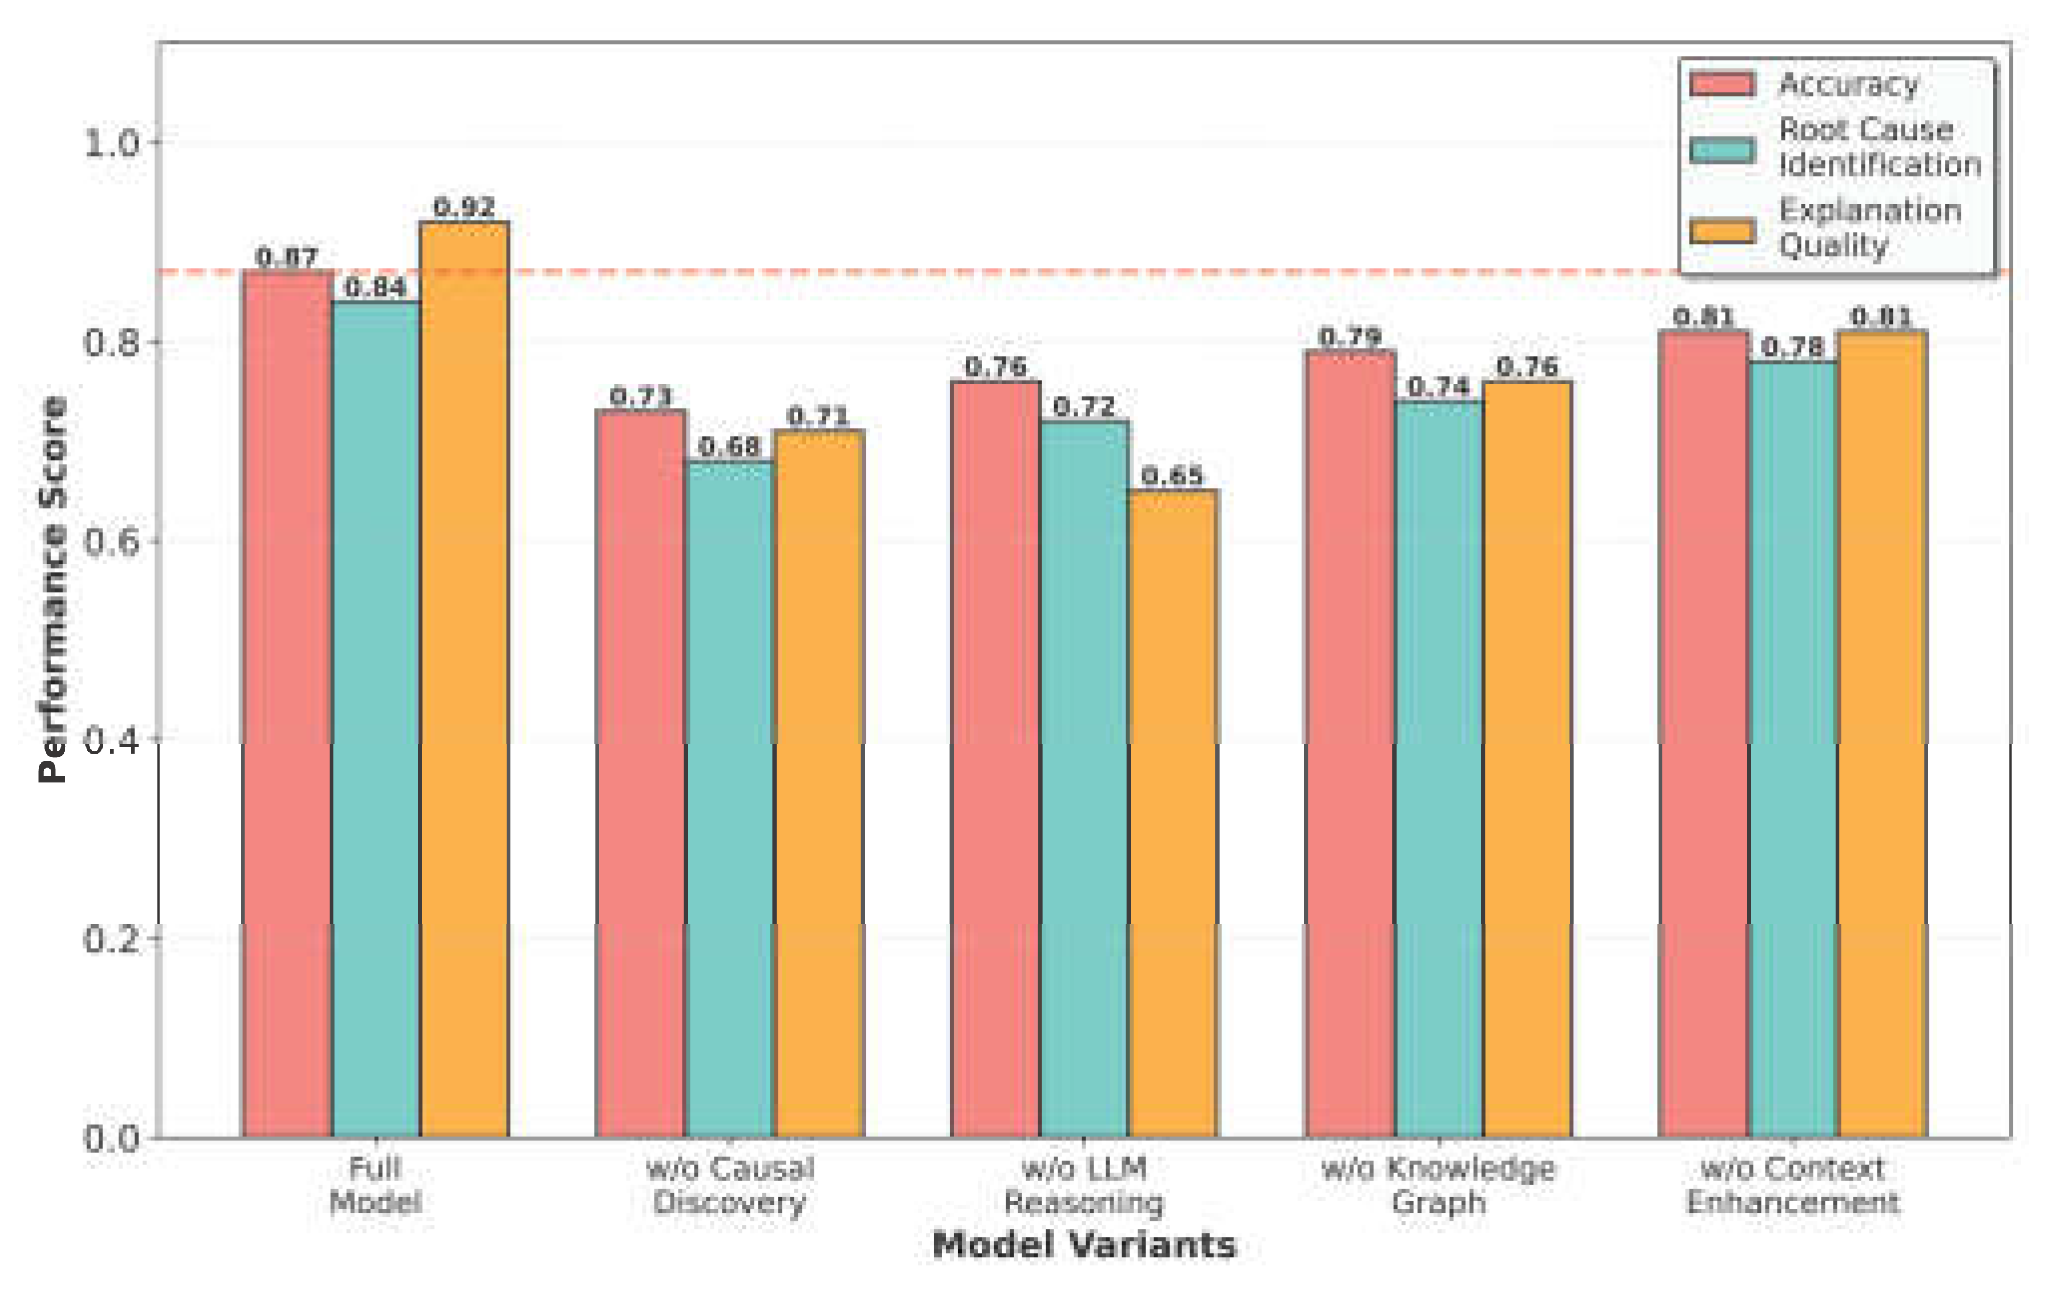

Table 1.
Performance Comparison on Enterprise Dataset (n=240 cases).
| Method | Acc. | Prec. | Rec. | F1 | Exp. |
|---|---|---|---|---|---|
| Traditional Stat. | 0.68 (±0.03) | 0.64 (±0.04) | 0.71 (±0.03) | 0.67 (±0.03) | 0.45 (±0.05) |
| Pure LLM | 0.76 (±0.03) | 0.73 (±0.03) | 0.78 (±0.03) | 0.75 (±0.03) | 0.68 (±0.04) |
| Causal-Only | 0.72 (±0.03) | 0.69 (±0.04) | 0.74 (±0.03) | 0.71 (±0.03) | 0.62 (±0.04) |
| Rule-Based | 0.65 (±0.03) | 0.61 (±0.04) | 0.68 (±0.03) | 0.64 (±0.03) | 0.51 (±0.05) |
| Causal-LLM | 0.87 (±0.02) | 0.85 (±0.02) | 0.89 (±0.02) | 0.87 (±0.02) | 0.92 (±0.03) |
Standard errors in parentheses computed via bootstrap (1000 iterations).
Disclaimer/Publisher’s Note: The statements, opinions and data contained in all publications are solely those of the individual author(s) and contributor(s) and not of MDPI and/or the editor(s). MDPI and/or the editor(s) disclaim responsibility for any injury to people or property resulting from any ideas, methods, instructions or products referred to in the content. |
© 2026 by the authors. Licensee MDPI, Basel, Switzerland. This article is an open access article distributed under the terms and conditions of the Creative Commons Attribution (CC BY) license (http://creativecommons.org/licenses/by/4.0/).
Copyright: This open access article is published under a Creative Commons CC BY 4.0 license, which permit the free download, distribution, and reuse, provided that the author and preprint are cited in any reuse.


