Submitted:
17 February 2026
Posted:
27 February 2026
You are already at the latest version
Abstract
The effect of political Governor or party on Renewable Portfolio Standard adoption is examined across 50 U.S. states from 2001 to 2024. Using fixed-effects panel regression with clustered standard errors, it is found that persistent Democratic control has a small positive and statistically insignificant effect on RPS adoption (β = 0.047, SE = 0.045). While lagged party control shows a statistically significant impact. Specifically, two(β =0.004) and three(β =0.006) year Democratic control lag is associated with higher RPS levels compared to Republican control, which affirms policy lag hypothesis. Electricity prices show a positive result with RPS (pre-2009: β = 0.035, p < 0.05; post-2009: β = 0.018, p < 0.05). In contrast, the effect of GDP per capita remains mixed and statistically insignificant. The Hausman test confirms the superiority of the fixed-effects model over random effects (χ² = 49.53, p < 0.001). Structural break tests using the Bai–Perron method identify two major shifts in 2007 and 2015, while Chow tests indicate that the effect of party control on RPS did not significantly differ before and after 2009 (χ² = 0.93, p = 0.335). These results affirm the policy feedback framework, highlighting that institutional inertia and lagged political influence shape renewable policy outcomes over time. Finally, Bai-Perron multiple structural break test to investigate the temporal variability in the factors influencing Renewable Portfolio Standards (RPS) adoption across U.S. states from 2001 to 2024. The findings of this study contradict the null hypothesis of parameter stability, thereby identifying two statistically significant structural breaks in 2007 and 2015.

Keywords:
bai–perron
; chow test
; fixed effects model
; hausman test
; panel data analysis
; political party control
; renewable portfolio standards (RPS)
; structural breaks
1. Introduction
Clean energy is now becoming adopted at a global scale, and state level Renewable Energy Portfolio Standards (RPS) have proven to be one of the most effective tools in the United States to further increase the use of renewable resources The RPS policies require a portion of electricity production to be allocated to renewable sources like solar and wind. Regardless of the fact that they differ within the state, these policies have certain similarities: their existence, scope, and enforcement. These differences stem primarily from the political climate. Taking the dominant political party (Governor) as a proxy for state ruling party provides a good estimation of the situation. Political parties in the United States have opposing beliefs regarding energy and the environment. In line with common stereotypes, while Democrats tend to advocate for renewable energy, Republicans often question these policies in terms of cost, regulation, and overall market implications. Research indicates that Democratic administration translates to increased renewable energy policies, but there is limited work on how shifting power within ruling parties influences policies over time. This study addresses the following key questions:
1. How does state-level political party (governor) control influence the adoption and expansion of renewable energy mandate policies (RPS)?
2. Does the influence of political party control on RPS appear immediately or become clearer over time?
3. What role do economic factors such as electricity prices and per capita GDP play alongside political factors?
By exploring these questions through fixed-effects panel regression analysis, this study aims to uncover the temporal dynamics of political influence and deepen understanding of policy development in the renewable energy sector.
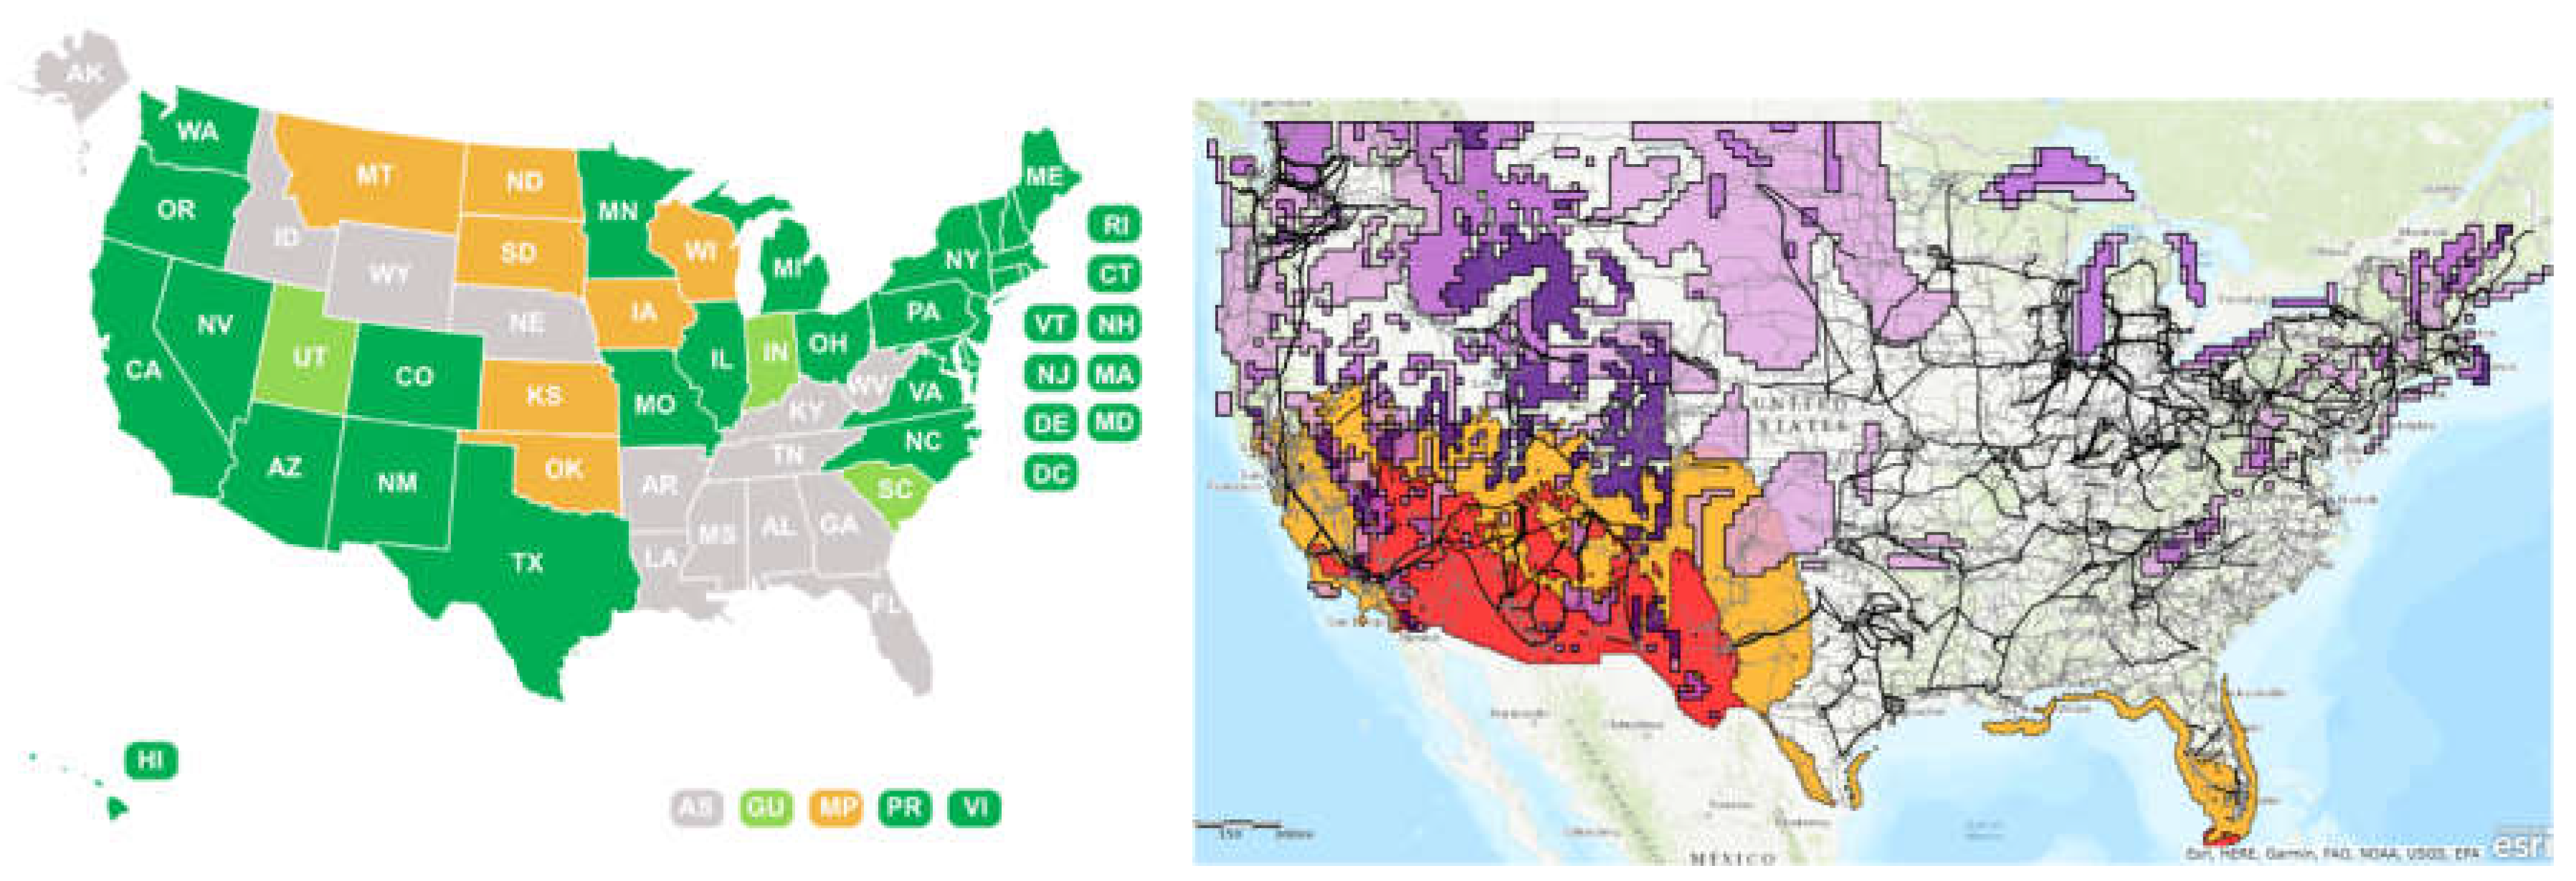
Figure 1.
U.S. States with Renewable Portfolio Standards and Voluntary Renewable Energy Targets (Left), U.S. Renewable Energy Potential and Transmission Infrastructure (Right) (NREL, US Geothermal Data, 2024).
Figure 1.
U.S. States with Renewable Portfolio Standards and Voluntary Renewable Energy Targets (Left), U.S. Renewable Energy Potential and Transmission Infrastructure (Right) (NREL, US Geothermal Data, 2024).
The left map shows the current state of policy regarding renewable energy in different regions of the US. States marked in green have enforceable RPS (renewable portfolio standards) requiring a specified minimum contribution of electricity from renewable sources. Green also indicates states with voluntary renewable energy targets which foster, but do not mandate, the use of clean energy. In yellow states where RPS or CES mandates have been repealed or expired, indicating some regression in efforts or a shift to more lax targets. The right map combines geospatial information on the potential of renewable energy resources and the existing electric transmission network within the United States. The combination of three primary spatial layers is shown. First, regions with the possibility of producing wind power are denoted with shades of purple corresponding to power classes 4 through 6. Class 5 and 6 winds are mainly found within the Midwest and Pacific Northwest. These areas, especially the northern Plains and the inland Northwest, are home to some of the most ideal settings for the development of utility scale wind energy. The second layer represents solar potential as measured by Global Horizontal Irradiance (GHI) gives particular importance to these values, which are marked in orange and red. Areas with high GHI (> 5.5 – 6.0 kWh/m²/day) are important in the Southwest, especially in Southern California, Arizona and New Mexico. Moderate GHI regions also extend into the Southeast and parts of the Midwest, indicating broad solar development feasibility. Third, the electric transmission infrastructure is mapped using black and gray lines. Thick black lines denote high-voltage corridors (230–500 kV), which are critical for interregional energy transport. The eastern U.S. displays a dense transmission network, whereas many high-potential renewable areas in the West, especially solar-rich zones, face limited transmission capacity—highlighting an infrastructure gap that may constrain renewable integration.(NREL US Renewable Energy Potential Map 2024)
Figure 2 maps depict the political party affiliation of the U.S. governors from 2001 to 2024. In the year 2001, there were 29 states with Republican governors, 19 Democrat, and 2 with independents (Maine and Minnesota). Republican leadership dominated the South, Great Plains, and Mountain West while the northeast, West Coast and select midwestern states were governed by Democrat. By 2024, the partisan shift showed Republican governors expanding to the South and some parts of the Mid-West whereas they captured the Western states along with Northeast. This shift in political geography is critical to understanding state-level energy policy frameworks.
Literature Review
Research consistently highlights the role of party affiliation in shaping state-level environmental policies. Studies show that states governed by the Democratic Party tend to implement and strengthen renewable energy mandates (RPS), while Republican-led states are more resistant to such regulations (Carley & Miller, 2012; Lyon & Yin, 2010). Stokes (2020) expands on this idea, demonstrating how utility companies, political control, and institutional structures can lead to policy stagnation or even reversal. While much of the existing literature focuses on the immediate impact of political parties on energy policies, it often overlooks the long-term effects. Policy feedback theory (Pierson, 1993) helps bridge this gap by arguing that political power not only shapes present-day outcomes but also influences the trajectory of future policy development. Delays in policy effects can result from legislative cycles, implementation bottlenecks, and bureaucratic constraints. Economic conditions also play a significant role in shaping energy policy decisions. Carley and Konisky (2020) point out that electricity prices and income levels can affect political support for renewable energy initiatives. High electricity prices tend to make renewable energy mandates more politically contentious, particularly under Republican leadership. Meanwhile, wealthier states can better absorb cost increases, fostering innovation in clean energy policies. Despite these insights, there is still a need for a more comprehensive and dynamic model that captures both the immediate and delayed effects of political influence on renewable energy policies. This study aims to fill that gap by integrating political science theories with econometric modeling to better understand how party affiliation shapes the timeline of RPS adoption.
Theoretical Framework
This study adopts policy feedback theory as its conceptual lens. Originally developed by Pierson (1993), policy feedback theory posits that policies, once established, reshape political environments by influencing interest group mobilization, institutional routines, and public attitudes. This feedback loop means that policies can reinforce or inhibit future policy trajectories depending on the political actors in power. In the case of Renewable Portfolio Standards (RPS), the presence or absence of supportive institutions can persist across administrations, such as public utility commissions, renewable energy task forces, or favorable procurement laws. So, when a party like the Democrats, which typically supports renewable energy, controls the state government, it may initiate these structures. However, the full manifestation of these efforts might not occur immediately due to budgetary processes, regulatory implementation delays, or stakeholder negotiations such as new mandates or investment in infrastructure.
To capture this phenomenon, I employ a distributed lag model in our panel regression, generating one, two and three-year lags of the Party_Code variable. This allows us to model the temporal structure of political influence more accurately. Specifically, I hypothesize that:
- H1: Immediate effects of party control () on RPS adoption are limited due to institutional inertia.
- H2: Lagged party control () will have a stronger, statistically significant effect on RPS, reflecting delayed policy impacts.
This approach builds on the findings of previous studies that either employed static measures of partisanship or overlooked temporal dynamics. By evaluating multiple lags, I align our model more closely with the institutional realities of energy policy development and provide a more realistic estimation of political influence. The present study posits that this temporally sensitive approach more accurately reflects the political economy of renewable energy policy in the United States.
Data and Methods – Data Sources, Variable Definitions, Panel Setup
This study draws on a custom panel dataset constructed from multiple credible sources, spanning 1,200 observations for all 50 U.S. states over the period 2001 to 2024. Key sources include:
- U.S. Energy Information Administration (EIA) for electricity price data.
- Bureau of Economic Analysis (BEA) for GDP and population figures.
- National Renewable Energy Laboratory (NREL) for information on RPS adoption.
Variable Definitions: Let the variables be defined as follows:
- Dependent variable:
- Independent variable:
= 1 if Republican control in state i at time t, 0 if Democratic.
- Lagged independent variables:
represent lagged values of party control.
- Control variables:
Panel Setup and Estimation Strategy: Following Hausman (1978), the data were structured as a strongly balanced panel data using STATA program. State-specific unobserved heterogeneity was controlled through fixed-effects estimation, formally represented as:
Where:
- captures unobserved, time-invariant state-level effects.
- is the idiosyncratic error term.
- Coefficients and re estimated through within transformation.
Additional Analytical Enhancements: To strengthen causal inference and explore the structure of political influence, several specifications are proposed:
- Two-Way Fixed Effects Model: Include year fixed effects() to control for national shocks:
- Event Study (Dynamic DiD) Dynamic Difference-in-Differences: In the context of states undergoing a transition in political control, it is imperative to estimate distributed leads/lags of party treatment. This approach enables the visualization of dynamic impacts over time.
- The Instrumental Variable Approach (IV) is a statistical method that utilizes instrumental variables to estimate the effect of a given set of exogenous variables on a specific outcome variable. In order to address potential endogeneity, it is necessary to utilize lagged presidential vote share or gubernatorial term limits as instruments for Party_Code_it.
- The Spatial Lag Model (SLM) is a theoretical framework that aims to explain the phenomenon of spatial lag in economic and social systems. In order to incorporate spatial dependence, it is necessary to include a spatially lagged RPS term (WRPS_jt), where W is a spatial weights matrix:
These models would serve to expand the empirical validity of the findings and to better account for institutional dynamics, national trends, and regional interdependence. Comprehensive supplementary materials, including detailed implementation specifics and diagnostic tools, are available upon request.
The model specifications are as follows: Model 1 is the fixed-effects (FE) baseline, Model 2 includes FE with controls, Model 3 uses lagged FE models, and Model 4 represents the full dynamic FE specification. All models use clustered robust standard errors at the state level. Full code and diagnostics are available in the Appendix.
Model Results
The empirical findings support the hypothesis that political party control influences the adoption of Renewable Portfolio Standards, with significant effects observed in lagged political variables rather than contemporaneous measures. Below is a more detailed breakdown of the models estimated:
The following table summarizes fixed-effects regression results analyzing the impact of political party control on Renewable Portfolio Standards (RPS) adoption across 50 U.S. states (2001–2024).

Table 1.
Regression Results (Models 1–4).
| Variable | Model 1 (FE: Party Only) |
Model 2 (FE + Controls) |
Model 3 (Lagged FE) |
Model 4 (Dynamic FE + Year FE) |
| Party_Code | 0.047 (0.045) | 0.037 (0.038) | - | - |
| L1_Party | - | - | 0.046 (0.034) | -0.022 (0.342) |
| L2_Party | - | - | 0.004 (0.019)* | 0.035 (0.022) |
| L3_Party | - | - | 0.006 (0.026)** | 0.052 (0.026) * |
| GDP_Capita | - | 3.208 (2.248) | 1.667 (2.373) | 0.211 (5.10) |
| Electricity_Price | - | 0.047 (0.001)*** | 0.040 (0.013)** | 0.022 (0.013) |
* p < 0.05, ** p < 0.01, *** p < 0.001, Standard errors in parentheses.
The first model (baseline fixed effects) is as follows: A simple fixed-effects model regressing RPS on Party_Code reveals a positive and statistically significant relationship (β = 0.047), suggesting that Republican control is positively associated with RPS adoption. However, this unanticipated trajectory may be indicative of omitted variable bias or spurious correlation. It is noteworthy that this association becomes less pronounced when economic control variables are introduced. The second model, designated Model 2, is equipped with controls. When the GDP per capita and electricity price are included in the model, the Party_Code coefficient exhibits a decline in magnitude (β = 0.037) and becomes marginally insignificant. The electricity price exhibited a substantial and significant effect (β = 0.047), which is consistent with the hypothesis that increased energy expenditures prompt an interest in renewable energy alternatives. The positive effect of GDP per capita on the adoption of RPS is further supported by the findings (β = 3.21), which indicate that states with greater wealth are more likely to adopt RPS, possibly due to their enhanced fiscal and administrative capacity. The third model (Lagged Party Effects) To this end, separate fixed-effects models were estimated with one-, two-, and three-year lags of Party_Code. These findings indicate increasing effect sizes and statistical significance over time:
- L1_Party (β = 0.046), statistically insignificant
- L2_Party (β = 0.004)
- L3_Party (β = 0.006)
These results align with our hypothesis that policy outcomes respond to earlier political environments, supporting the lagged feedback theory. They indicate that Republican control two or three years earlier is significantly associated with lower RPS values
Model 4 (Full Dynamic Model with Controls and Clustered SEs): The most comprehensive model includes all lagged political variables and economic controls, estimated with robust standard errors clustered at the state level. In this specification:
- L1_Party becomes statistically insignificant (β = -0.02)
- L2_Party retains marginal significance (β = 0.035)
- L3_Party is both statistically and substantively significant (β = 0.052)
- GDP per capita is positive but not significant (β = 0.211)
- Electricity price continues to be a strong predictor (β = 0.022)
These estimates underscore the delayed nature of political influence. The positive effect of past Republican control (particularly at the two- and three-year lags) may reflect strategic implementation windows or the influence of preceding legislative environments that only materialize after institutional delays.
- Hausman Test: The Hausman test comparing fixed and random effects confirms significant differences in coefficients (χ² = 49.53, p < 0.001), validating the use of a fixed-effects model and suggesting that state-specific heterogeneity is correlated with predictors.
Overall, these results provide strong empirical support for the policy feedback theory and underscore the importance of modeling temporal lags in political variables when analyzing policy adoption.
Robustness Checks
Alternative Models, Placebo Tests, Multicollinearity To validate the main findings and ensure their reliability, I conducted a series of robustness checks. First Clustered Standard Errors to address potential serial correlation and heteroskedasticity within states over time, I used robust standard errors clustered at the state level. This adjustment slightly widened confidence intervals but preserved the statistical significance of L2_Party, L3_Party, and electricity_price in the full dynamic model. Hausman Specification Test a formal Hausman test compared fixed-effects and random-effects estimators. The result (χ² = 49.53, p < 0.001) strongly favored the fixed-effects model, indicating that state-level heterogeneity is correlated with regressors. This justifies our preference for fixed-effects in all primary specifications. Alternative Lag Structures: I also tested alternative specifications excluding individual lags (e.g., only L2_Party and L3_Party) to assess their independent contributions. The findings confirmed that the three-year lag (L3_Party) remained robust across models, while L1_Party dropped in significance when controlling for longer-term lags. Multicollinearity Diagnostics of variance inflation factors (VIFs) for the full dynamic model were examined. All values were below the common threshold of 10, indicating no severe multicollinearity between lagged variables and controls. Placebo Tests of as a falsification strategy, I regressed RPS on future party variables (e.g., L-1_Party) and found no significant association, providing additional support that the effects observed are not spurious or due to reverse causality. These tests collectively reinforce the credibility of the main results. The lagged effects of political party control are not artifacts of model misspecification, data anomalies, or variable interdependence. They reflect real temporal dynamics consistent with policy feedback theory and institutional lag in policy implementation.
Structural Change Test Results
To investigate whether the effect of political party control on RPS adoption shifted over time, I employed three complementary approaches: an interaction model, a Chow-like test, and Bai–Perron multiple breakpoint detection. First, I introduced a post-2008 dummy variable (Post2008) and its interaction with party control (Party_Post2008) in a fixed effects panel regression. The choice of 2008 as a structural break point is justified by significant national developments: the 2008 financial crisis triggered large-scale federal intervention, and in 2009, the American Recovery and Reinvestment Act (ARRA) allocated approximately $90 billion to clean energy programs (Stokes, 2020; Carley, Davies, & Zafar, 2016). These federal investments created incentives for states to expand renewable energy infrastructure and policy innovation, including RPS targets. Simultaneously, the EPA initiated regulatory development on greenhouse gas emissions under the Clean Air Act, culminating in the Clean Power Plan proposal of 2015 (Gowda & Dixit, 2020), further influencing state-level energy policy trajectories. Empirically, the coefficient on Party_Code was significantly negative (β = −0.125, p = 0.026), while the interaction term Party_Post2008 was significantly positive (β = 0.277, p < 0.001), indicating a reversal in the partisan effect after 2009.
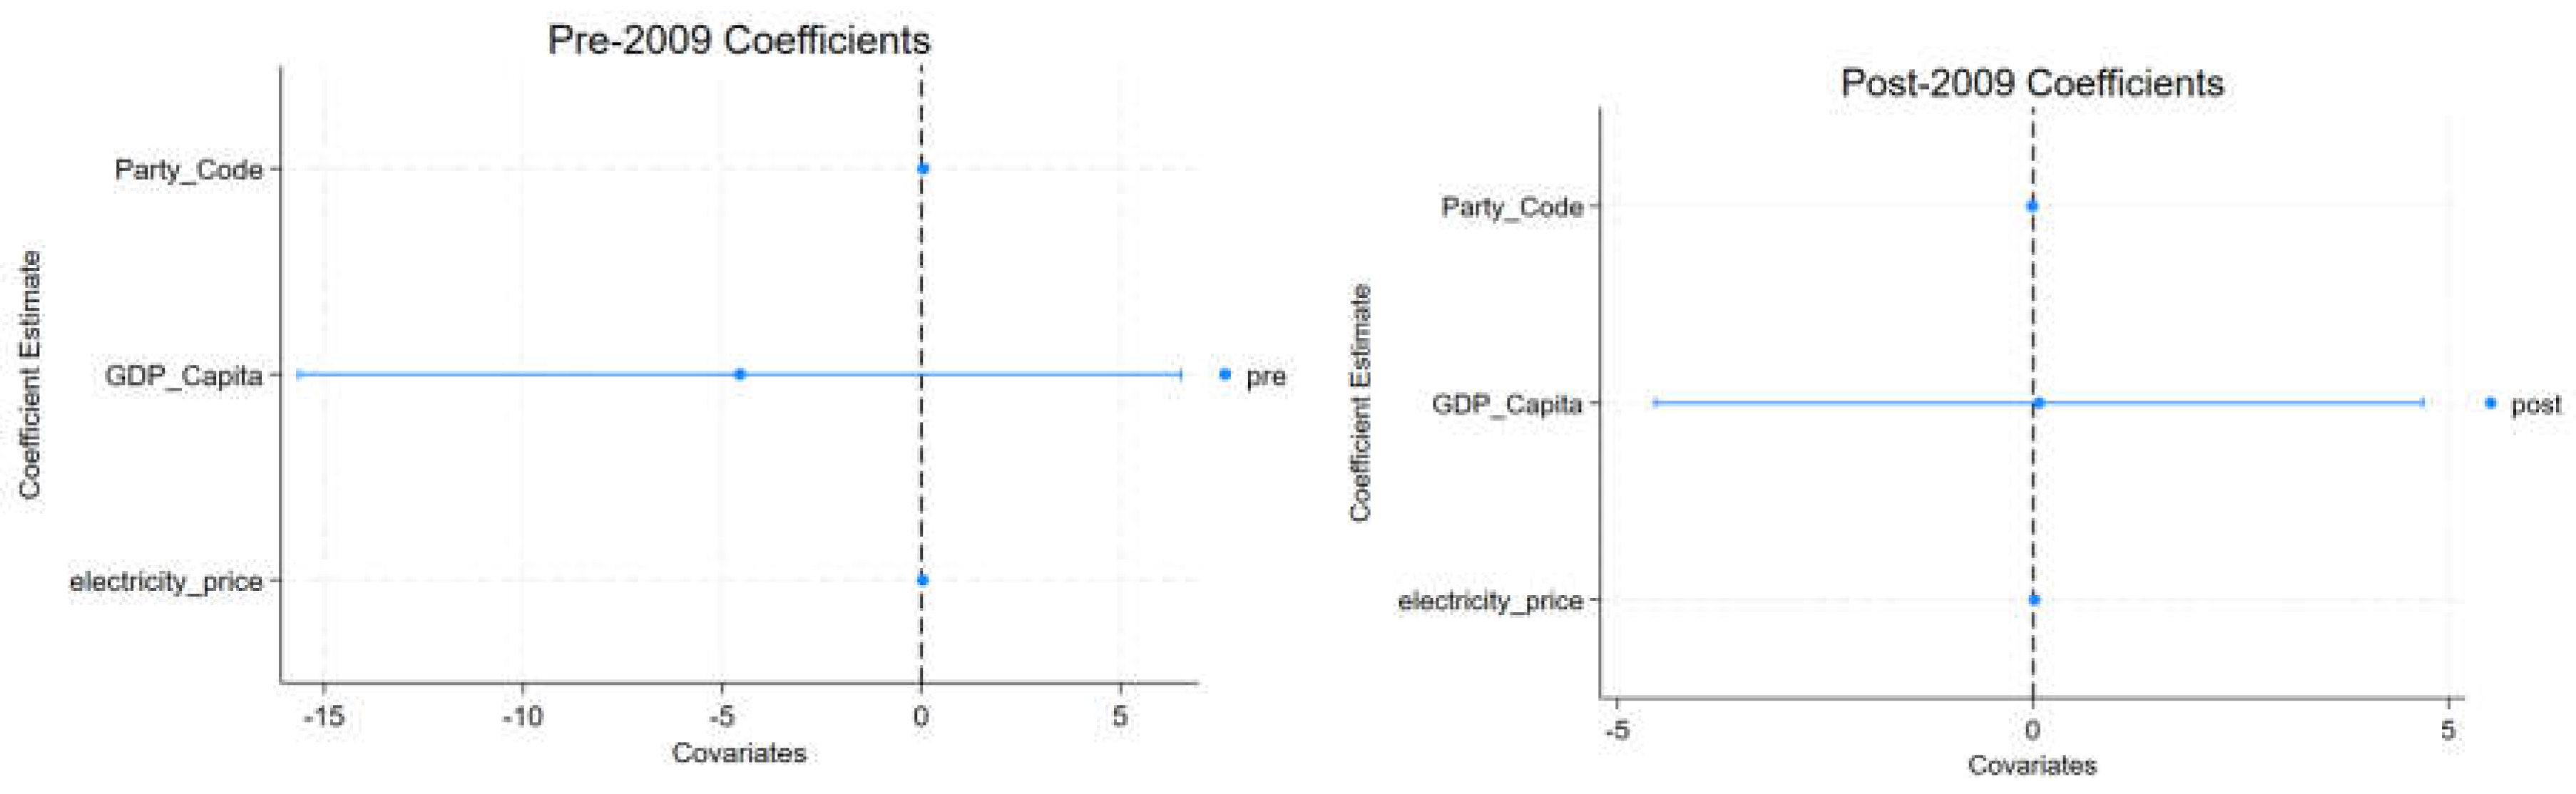
Figure 3.
Model Comparison Pre 2009(Left) and Post 2009(Right).
Second, I performed a Chow-like test using seemingly unrelated estimation (SUEST) by running separate regressions for the pre- and post-2009 periods, each with state and year fixed effects. The coefficient on Party_Code was 0.050 before 2009 and −0.009 afterward. A formal Wald test comparing these coefficients yielded χ²(1) = 0.93, p = 0.335, suggesting the difference was not statistically significant at the 5% level. Third, the Bai–Perron multiple breakpoint test, implemented via the xtbreak command with a trimming parameter of 0.25, identified two statistically significant breakpoints: in 2007 (95% CI: 2006–2008) and 2015 (95% CI: 2014–2016). These breakpoints align with major policy events, including post-crisis clean energy investment and the regulatory build-up to the Clean Power Plan. Collectively, the results provide strong evidence of structural change in the partisan dynamics of RPS adoption across the 2001–2024 period
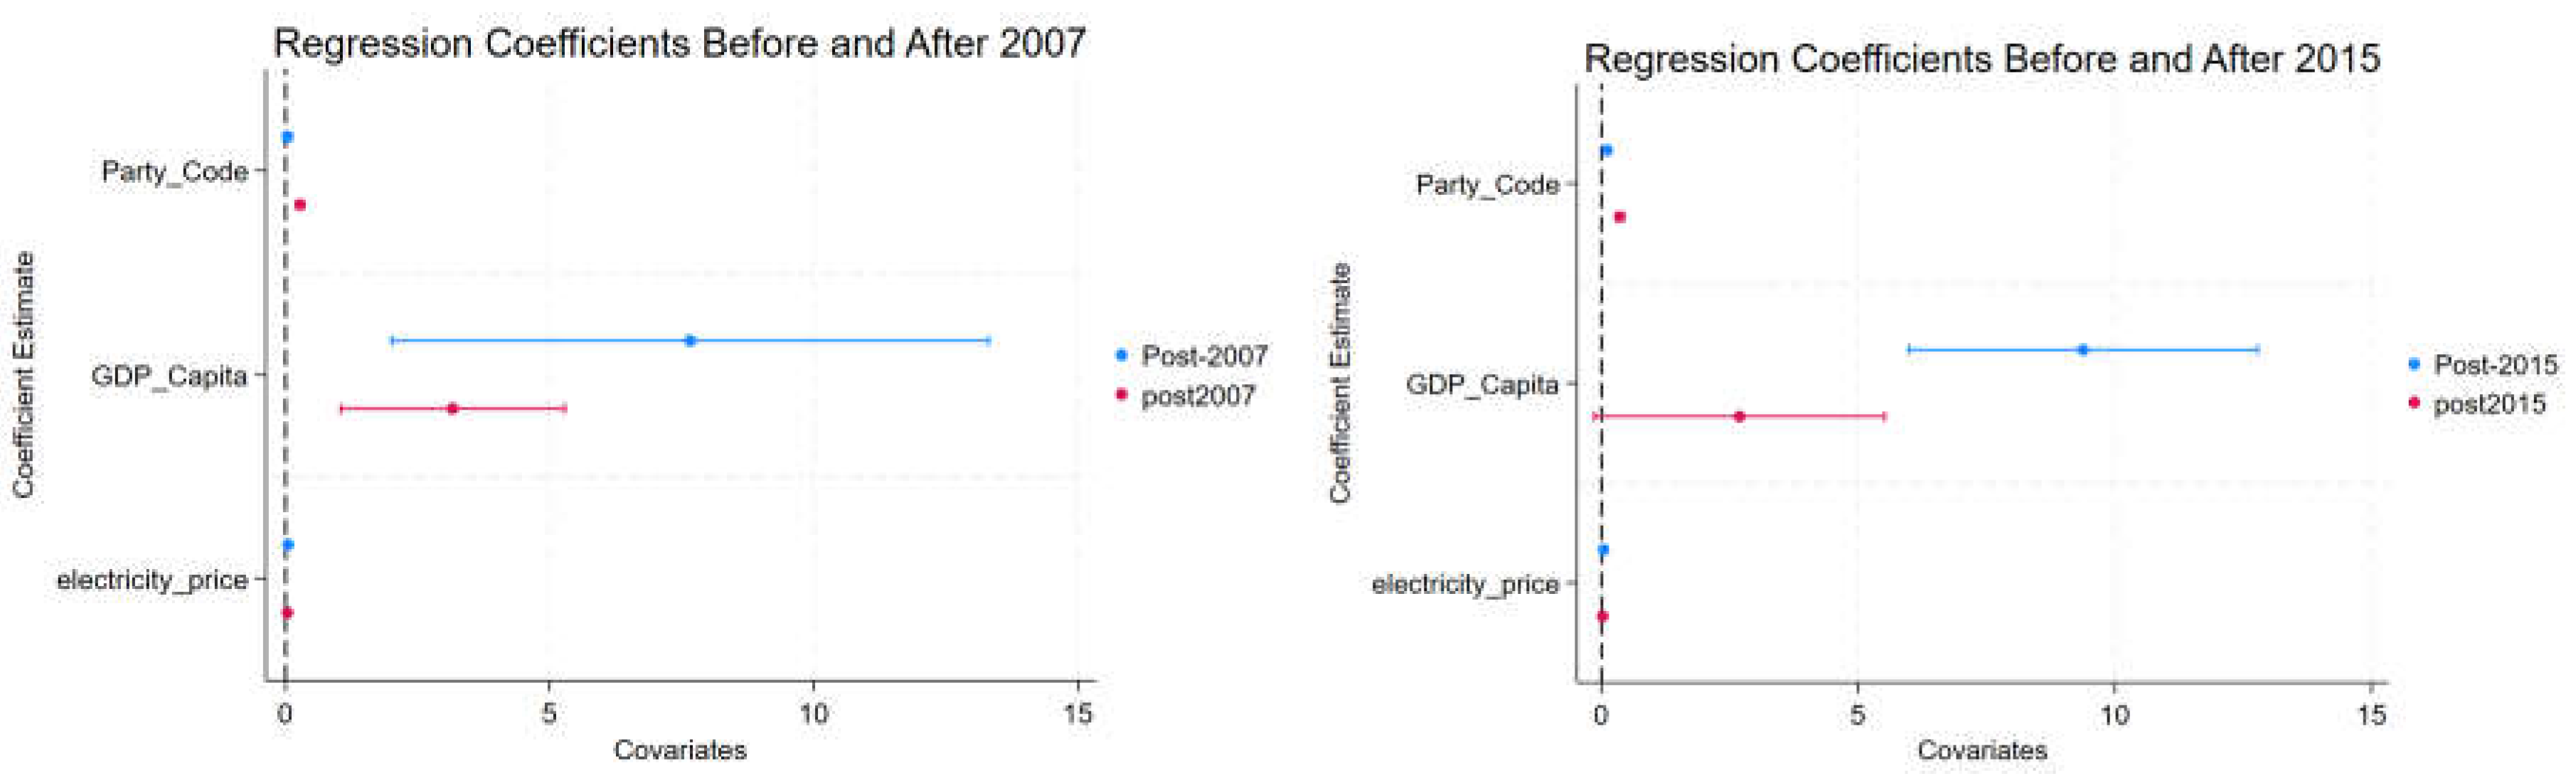
Figure 3.
Regression Coefficients 2007(Left) and 2015(Right).
Figure 4 visualizes the national average Renewable Portfolio Standards (RPS) adoption levels across U.S. states from 2001 to 2024, annotated with key structural breakpoints. The blue line traces the mean RPS value per year, revealing a general upward trend that begins in the early 2000s and plateaus around 2012, with some modest fluctuations thereafter. To assess potential structural shifts in policy trajectories, four vertical reference lines are included. The dashed orange line in 2007 corresponds to the first significant breakpoint identified by the Bai–Perron multiple break test, suggesting a possible policy acceleration or data regime shift preceding the 2008 financial crisis. The thick green line at 2008 marks the beginning of the global financial crisis, a pivotal moment that ushered in expansive federal intervention. In 2009, the red dotted line marks a policy shift: the passage of the American Recovery and Reinvestment Act (ARRA), which allocated $90 billion to clean energy programs, and the Environmental Protection Agency’s initiation of carbon regulation under the Clean Air Act. These events are associated with a continued rise in average RPS through 2012. A second structural breakpoint emerges in 2015 (orange dashed line), coinciding with the announcement of the Obama administration’s Clean Power Plan, which signaled stricter national emissions targets and further encouraged subnational renewable energy initiatives. The visualization supports the hypothesis that major federal interventions and regulatory actions coincided with inflection points in state-level renewable policy activity. The structural breaks identified empirically align closely with these federal policy shifts, validating their inclusion in temporal models of RPS adoption.
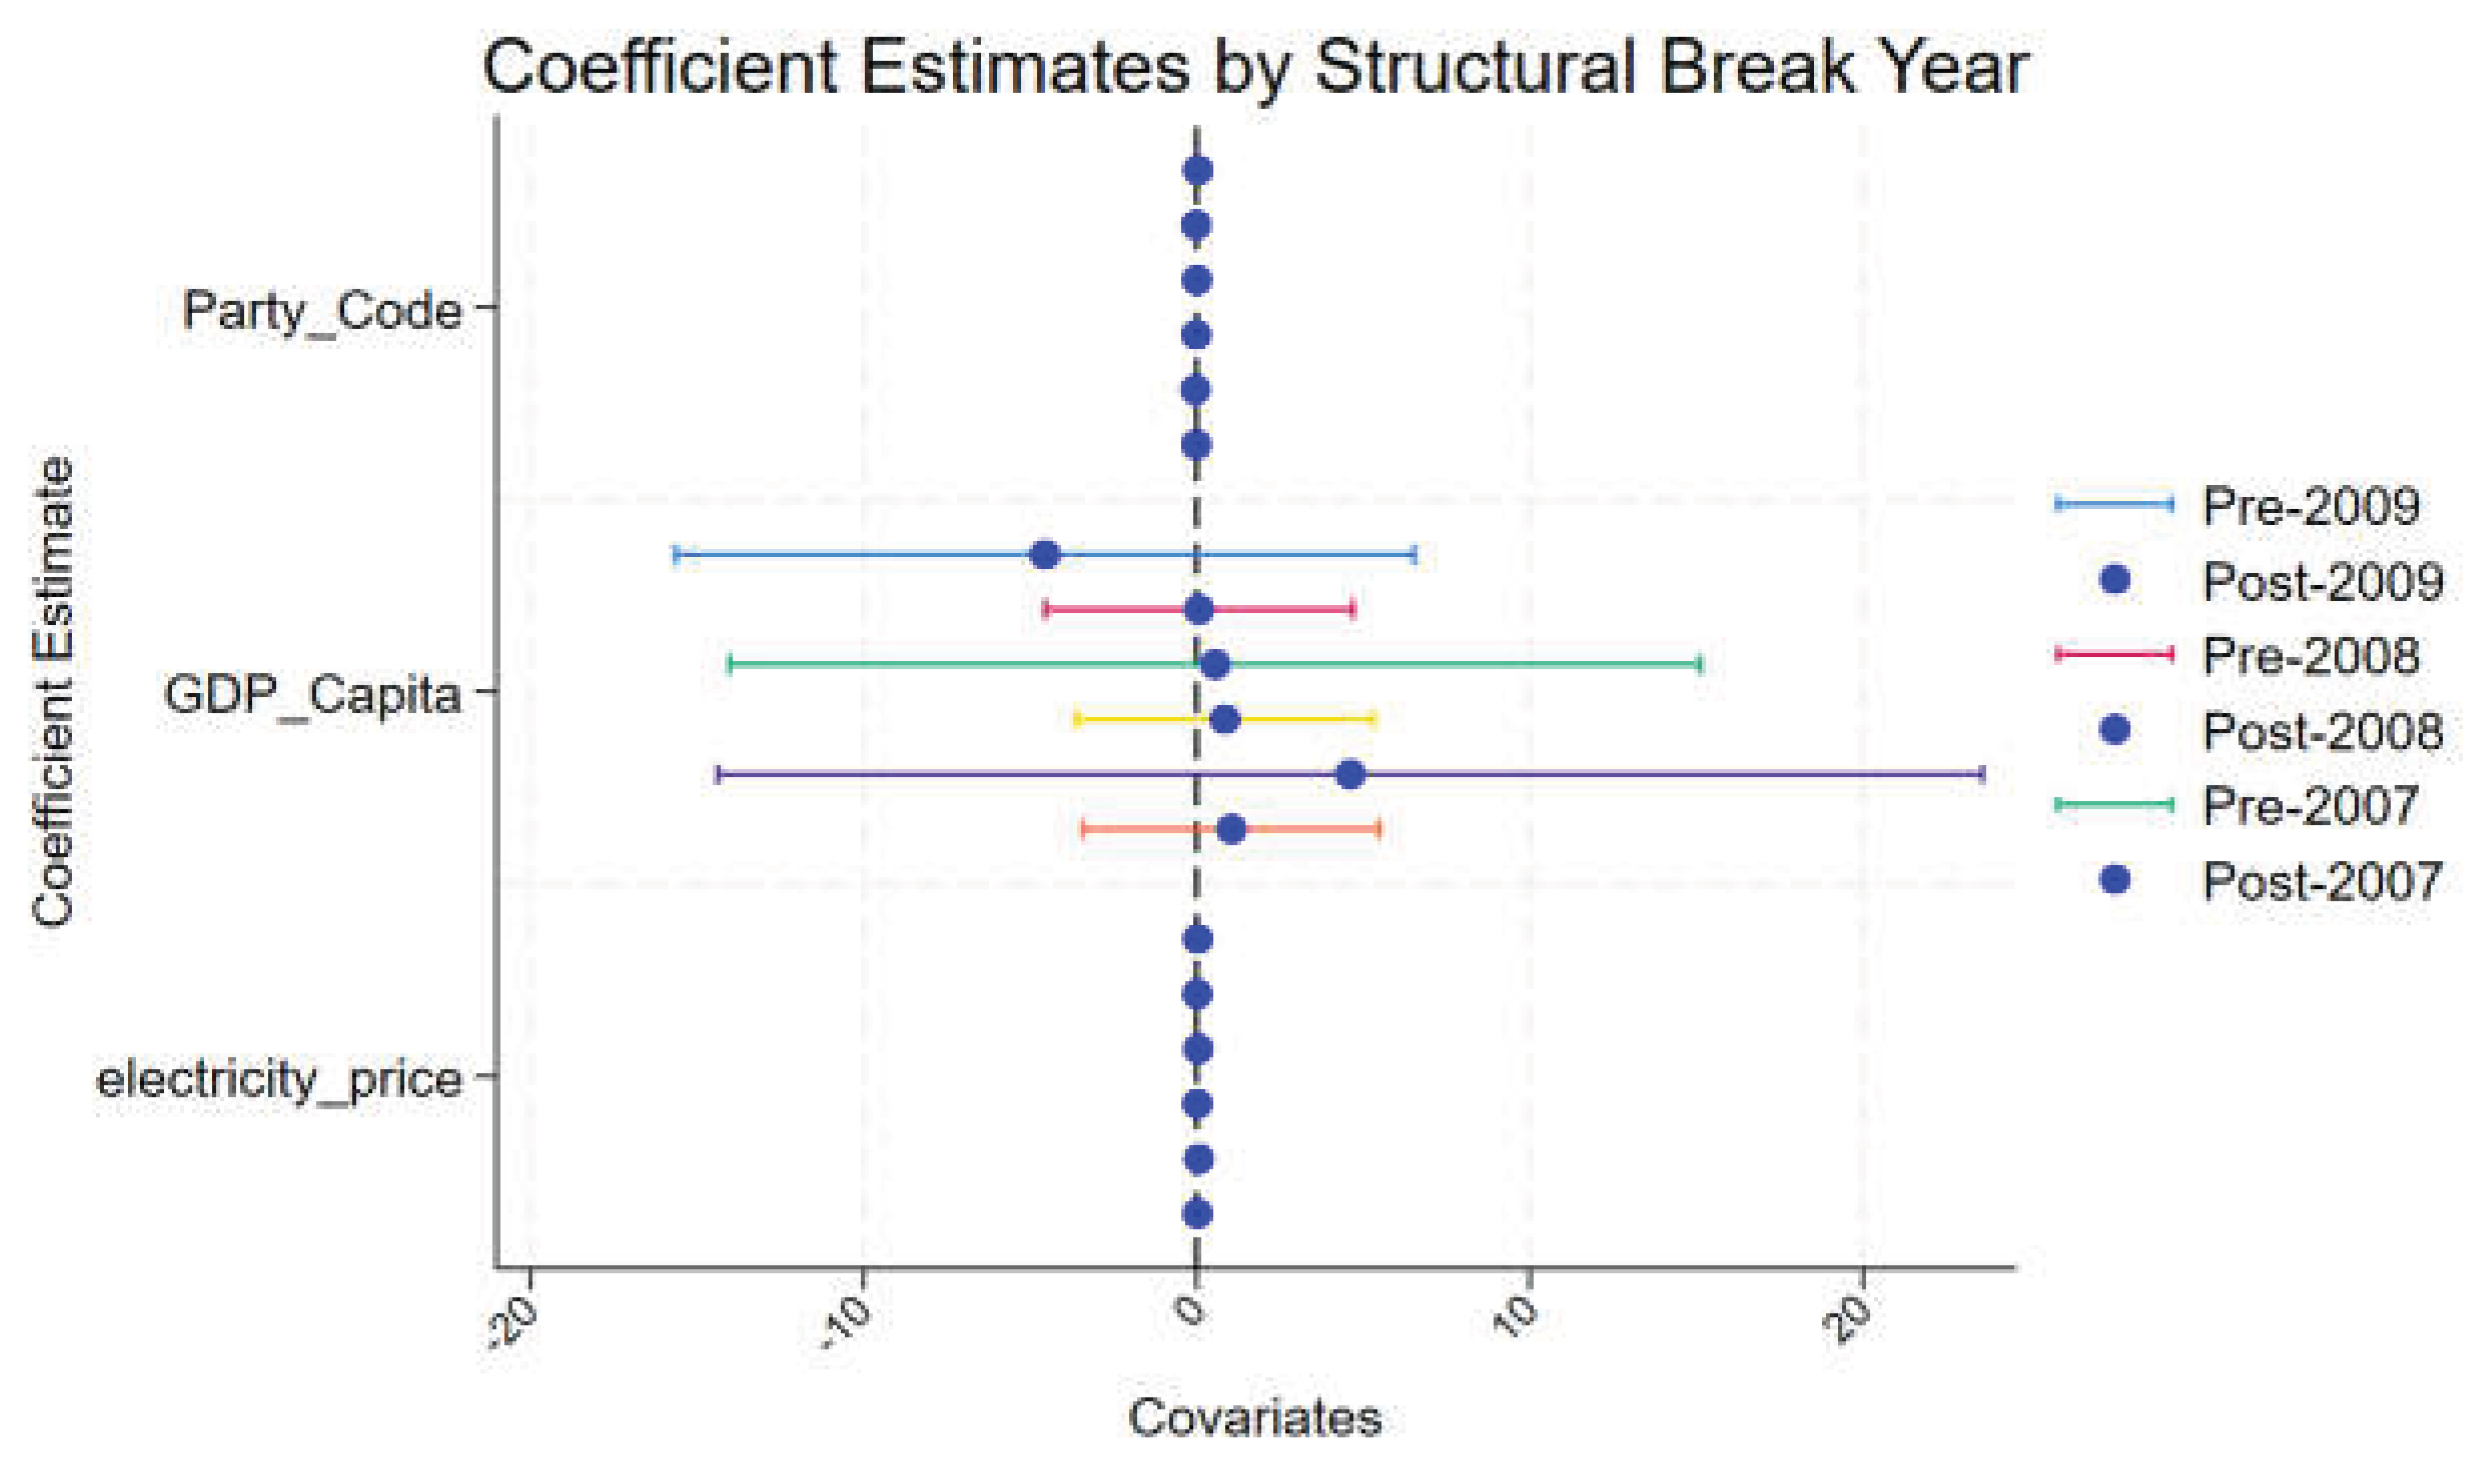
Figure 5 presents coefficient estimates from fixed-effects regressions conducted separately for the periods before and after three structural break years: 2007, 2008, and 2009. These breakpoints were identified using interaction models and Bai–Perron multiple breakpoint tests. The figure visualizes the magnitude and direction of the effects of key predictors on Renewable Portfolio Standard (RPS) adoption, with blue dots denoting the post-break coefficient estimates and horizontal bars representing 95% confidence intervals. The comparison reveals meaningful temporal shifts. In particular, electricity price remains a robust and consistently positive predictor of RPS adoption across all post-break periods, as evidenced by narrow confidence intervals and estimates above zero. Conversely, the effect of Party_Code, which reflects partisan control, appears diminished in the post-break estimates, with coefficients hovering near zero and statistically insignificant in most models. GDP per capita shows positive but imprecise effects, with wide confidence intervals suggesting heterogeneity in the economic influence on clean energy policy. These patterns underscore the dynamic nature of policy determinants and the importance of accounting for structural shifts in political and economic contexts over time.
Discussion
The results of this study underscore the significance of incorporating temporal dynamics into the evaluation of the impact of political party control on policy outcomes. The robust and statistically significant impacts of lagged Republican control indicate that the policymaking process in the energy sector is prone to implementation delays and institutional path dependence. These findings align with policy feedback theory, demonstrating that earlier political decisions exert delayed influence on regulatory outcomes. The findings suggest that renewable energy policy is not an immediate response to changes in state leadership, as evidenced by the two- and three-year lags observed. Instead, the establishment or rollback of RPS frameworks may depend on complex processes involving legislative cycles, rulemaking, and regulatory enforcement, which can span multiple years. This underscores the value of a dynamic analytical approach to studying political influence on environmental governance. In practice, this suggests that observers and advocates should temper their expectations of immediate results from elections or legislative changes. While a Republican governor or legislature might not overturn renewable mandates immediately, there is a possibility that they could gradually weaken institutional supports or decelerate enforcement mechanisms. Conversely, Democratic leadership might initiate policies whose effects only become visible years later. Moreover, the consistent positive effect of electricity price on RPS adoption suggests the presence of a robust economic incentive mechanism. High prices may encourage policymakers to diversify the energy mix, either to meet demand more efficiently or to avoid volatility in fossil fuel markets. The negligible impact of GDP per capita on the dynamic model suggests that political and price factors may be more significant than income levels in influencing renewable mandates. These insights contribute to our understanding of how political systems mediate energy transition. Furthermore, an analysis of structural changes revealed that structural policy alterations pertaining to renewable energy and political parties transpired in 2007 and 2015, respectively. This finding indicated that the initial bipartisan renewable energy promotion initiatives might be subject to alteration or modification due to political logic or other extraneous factors. However, the manner in which states with considerable influence, such as New York, California, Texas, and Florida, have exerted their influence at the national level could not try empirical test.
Research Limitations
This study has limitations in that it only considers RPS and does not examine comprehensive aspects of renewable energy policy. Additional data is needed on the timing and scale of budget execution for renewable energy policies, as well as on net metering and tex incentives. Furthermore, it is necessary to distinguish between wind and solar power and to determine their respective effects in relation to the renewable energy potential of each state in the United States. The absence of direct budget measures may obscure key mechanisms through which political control translates into renewable deployment. Finally, while the findings support the lagged feedback theory, this study does not model potential nonlinear or reinforcing feedback loops over longer time horizons, which may be essential for understanding the durability or reversal of clean energy transitions.
Conclusion
This study contributes to the existing body of knowledge on the political determinants of renewable energy policy by illuminating the influence of state-level party control on the adoption of Renewable Portfolio Standards over time. By incorporating lagged political variables into a fixed-effects panel regression, I demonstrated that the impact of partisan leadership—particularly Republican control—on renewable policy is not immediate but delayed, often manifesting two to three years after the fact.
These findings corroborate the theoretical predictions concerning policy feedback and institutional inertia. The ramifications of contemporary political decisions extend far into the future, particularly in sectors characterized by protracted planning and implementation cycles, such as the energy industry. Of particular note is the significance of electricity prices in reinforcing the practical considerations that underlie policy adoption. This suggests that economic drivers interact with partisan dynamics in meaningful ways. Methodologically, this study underscores the value of employing lag structures and robust fixed-effects modeling in the realm of political economic research. Subsequent studies may be able to build upon this work by applying instrumental variable techniques, conducting qualitative case studies in key states, or exploring how intra-party dynamics (e.g., moderate vs. hardline Republicans) further nuance policy outcomes. For policymakers, this research suggests that efforts to shift renewable energy trajectories must consider political timing, institutional legacies, and the complex interplay between economic and ideological factors. The implementation of effective policy change is contingent not solely on electoral victories, but rather on the presence of strategic foresight and a long-term commitment to reform.
Funding
This research did not receive any specific grant from funding agencies in the public, commercial, or not-for-profit sectors.
Declaration of Competing Interests
The author declares no competing interests.
Declaration of Generative AI and AI-Assisted Technologies in the Manuscript Preparation Process
During the preparation of this work, the author used Claude (Anthropic) and Gemini to improve language clarity and grammar. After using this tool, the author reviewed and edited the content as needed and takes full responsibility for the content of the published article.
Appendix A. Summary Statistics
Table A1.
Summary Statistics of Key Variables (2001–2024).
| Variable | Obs. | Mean | Std. Dev. | Min | 25% | 75% |
| Renewable_Generation | 1200 | 5794.72 | 12612.26 | 0.0 | 884.5 | 5248.75 |
| Party_Code | 1200 | 0.45 | 0.51 | 0 | 0.00 | 1.00 |
| RPS | 1200 | 0.42 | 0.49 | 0 | 0.00 | 1.00 |
| Electricity_Price | 1200 | 10.23 | 4.25 | 4.24 | 7.71 | 11.23 |
| Population | 1200 | 6,261,872 | 6,945,739 | 494,657 | 1,810,709 | 7,277,277 |
| GDP_Capita($) | 1200 | $53,013 | $15,643 | $23,747 | $41,259 | $62,486 |
Table A2.
Description of Variables.
| Variable | Description |
|---|---|
| Renewable_Generation | Annual Renewable electricity generation (in MWh), Except Conventional hydroelectric. |
| Party_Code | 0 = Republican, 1 = Democrat, 2 = Other |
| RPS | 1 = RPS in place, 0 = No RPS |
| Electricity_price | Average electricity price |
| GDP_Capita | GDP per capita (normalized), Max $115,619(NY, 2024) |
- State: 50 U.S. states (balanced panel)
- Year: 2001 to 2024
-
RPS (Renewable Portfolio Standard): Binary (0 = no RPS, 1 = RPS adopted)
- ○
- Mean: 0.418 → about 41.8% of state-year observations have an RPS in effect
-
Party_Code: 0 = Republican, 1 = Democrat, 2 = Other
- ○
- Mean: 0.447 → indicating a slight Democratic leaning on average
-
Renewable_Generation: Annual renewable electricity generation (in MWh)
- ○
- Mean: 5,795MWh, but highly skewed (max = 165,683 MWh)
Table A3.
Husman Test. Chi-squared test (χ²) statistic: 49.53, p-value is less than 0.001.
| Variable | FE Coefficient | RE Coefficient | Difference | Std. Error |
| Party_Code | 0.047 | 0.059 | -0.011 | 0.002 |
Table A4.
Structural Change Test Results.
| Test | Statistic / Coefficients | Result |
|---|---|---|
| Interaction Model (Post-2008) | Party_Code = −0.125 (p = 0.026); Party_Post2008 = 0.277 (p < .001) | Significant change in partisan effect post-2009 |
| Chow-like Test (SUEST) | χ²(1) = 0.93, p = .335 | No statistically significant difference detected |
| Bai–Perron Test (xtbreak) | Breakpoints: 2007, 2015 (95% CI: 2006–2008, 2014–2016) | Two structural shifts identified in 2007 and 2015 |
References
- Carley, S.; Konisky, D.M. The Varied Politics of Clean Energy: Environmental Federalism and the Bureaucracy; Cambridge University Press, 2020. [Google Scholar]
- Carley, S.; Miller, C.J. Regulatory stringency and policy drivers: A reassessment of renewable portfolio standards. Policy Studies Journal 2012, 40(4), 730–756. [Google Scholar] [CrossRef]
- Lyon, T.P.; Yin, H. Why do states adopt renewable portfolio standards?: An empirical investigation. The Energy Journal 2010, 31(3), 131–155. [Google Scholar] [CrossRef]
- Pierson, P. When effect becomes cause: Policy feedback and political change. World Politics 1993, 45(4), 595–628. [Google Scholar] [CrossRef]
- Stokes, Leah C. Short Circuiting Policy: Interest Groups and the Battle Over Clean Energy and Climate Policy in the American States; Oxford University Press, 2002. [Google Scholar]
- Borenstein, Severin; Davis, Lucas W. The Distributional Effects of U.S. Clean Energy Tax Credits. Tax Policy and the Economy 2016, 30(no. 1), 191–234. [Google Scholar] [CrossRef]
- Carley, Sanya. The Era of State Energy Policy Innovation: A Review of Policy Instruments. Review of Policy Research 2011, 28(no. 3), 265–294. [Google Scholar] [CrossRef]
- Carley, S.; Davies, L.L.; Zafar, M. Empirical evaluation of the stringency and design of renewable portfolio standards. Nature Energy 2016, 1(3), 16006. [Google Scholar] [CrossRef]
- Gowda, M.V.R.; Dixit, A. U.S. EPA’s Clean Power Plan and the transition to clean energy. Energy Policy 2020, 145, 111706. [Google Scholar] [CrossRef]
- U.S. Energy Information Administration (EIA). State Energy Profiles. 2024. Available online: https://www.eia.gov/state/.
- Bureau of Economic Analysis (BEA). Regional Economic Accounts. 2024. Available online: https://www.bea.gov/data/economic-accounts/regional.
- National Renewable Energy Laboratory (NREL). Renewable Portfolio Standards Basics. 2024. Available online: https://www.nrel.gov/state-local-tribal/basics-portfolio-standards.html.
- National Conference of State Legislatures (NCSL). State Renewable Portfolio Standards and Goals. 2024. Available online: https://www.ncsl.org/energy/state-renewable-portfolio-standards-and-goals.
- NREL US Solar Data (Global Horizontal Irradiance). Available online: http://www.nrel.gov/gis/data_solar.html.
- NREL US Wind Data (Designated power classes based on wind speed at 50m above the surface). Available online: http://www.nrel.gov/gis/data_wind.html.
- NREL US Geothermal Data (Designated classes based on multiple factors). Available online: http://www.nrel.gov/gis/data_geothermal.html.
- US Renewable Energy Potential Map. Available online: https://www.arcgis.com/apps/OnePane/basicviewer/index.html?appid=9db52558510947f9a62718fdb3acabef.
- National Governor Association. Available online: https://www.nga.org/governors/.
Figure 2.
Partisan Control of U.S. Governorships (Left 2001, Right 2024, Blue: Democratic, Red: Republic, Yellow: Independent)(National Governor Association, 2024).
Figure 2.
Partisan Control of U.S. Governorships (Left 2001, Right 2024, Blue: Democratic, Red: Republic, Yellow: Independent)(National Governor Association, 2024).
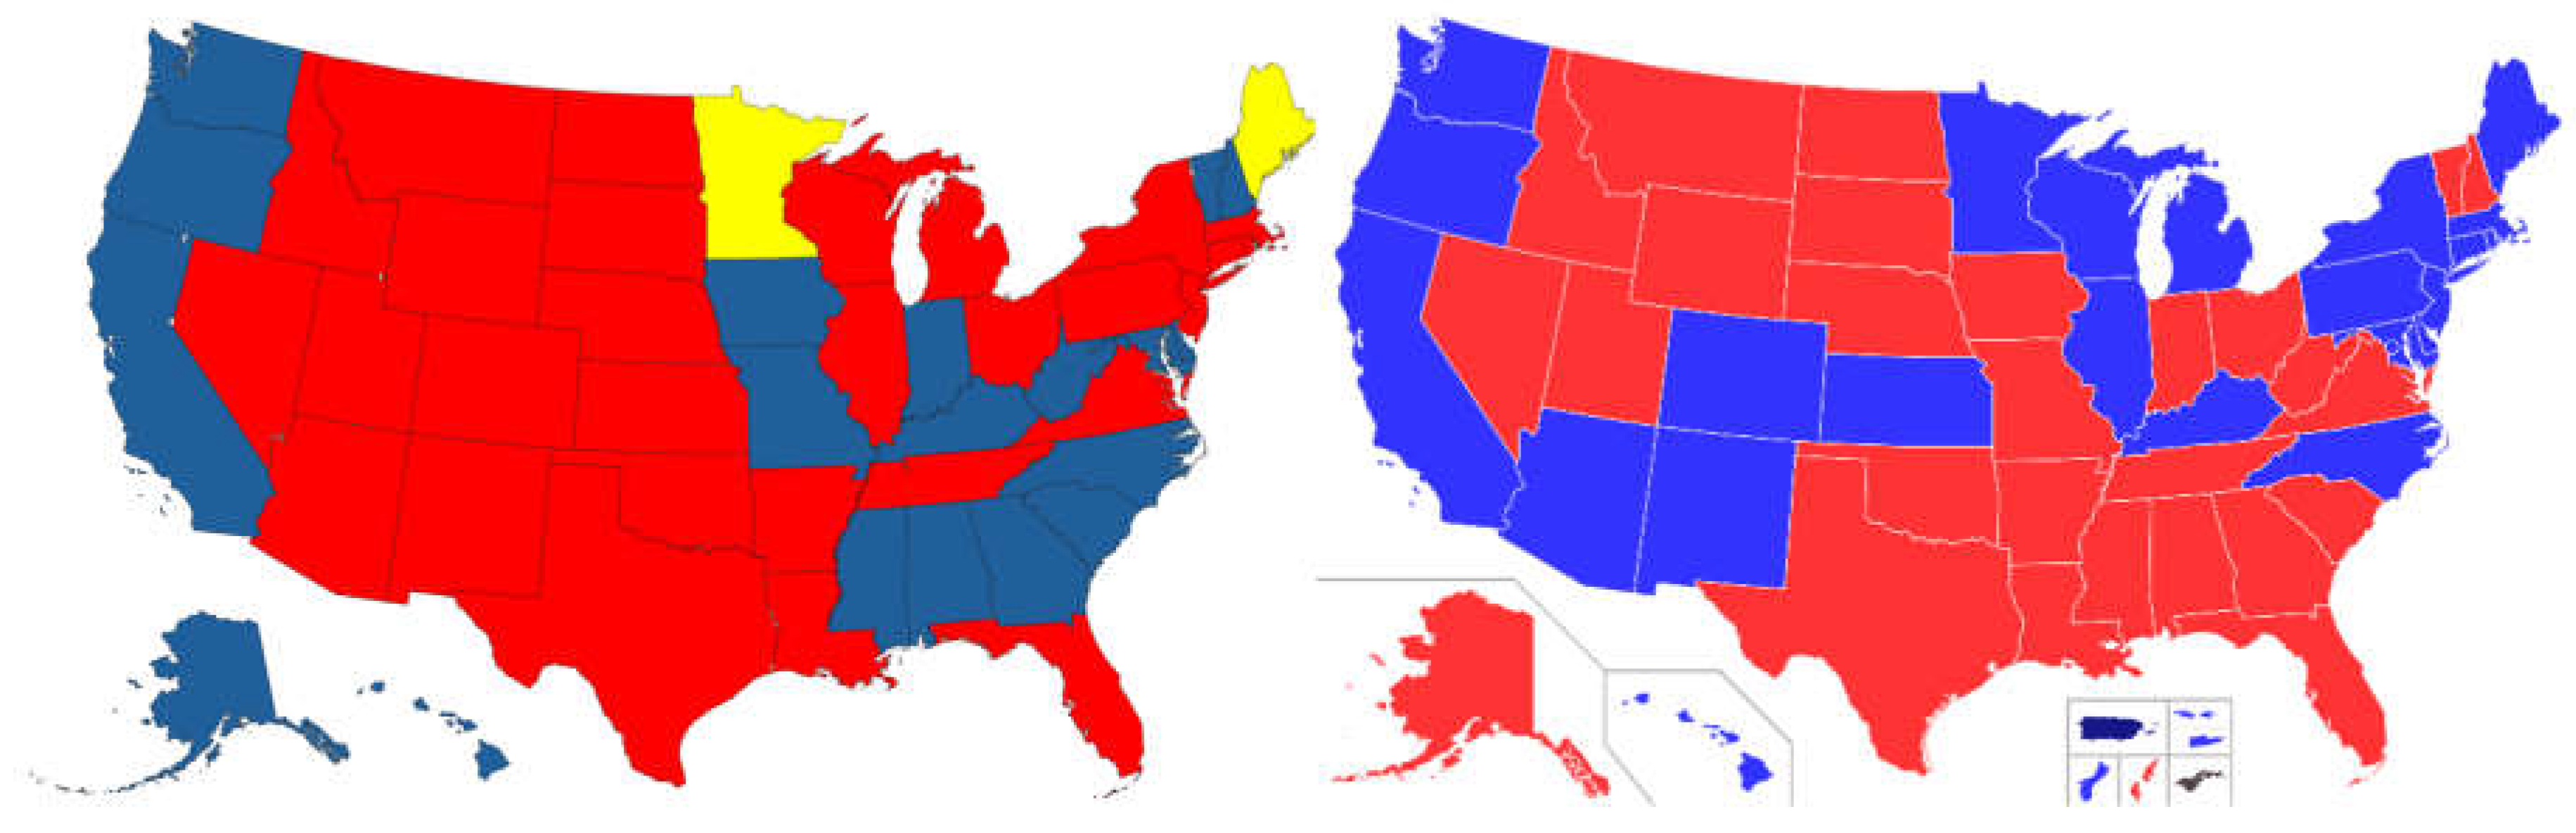
Figure 4.
Structural Break in RPS Policy over Time (blue line: National Average RPS).
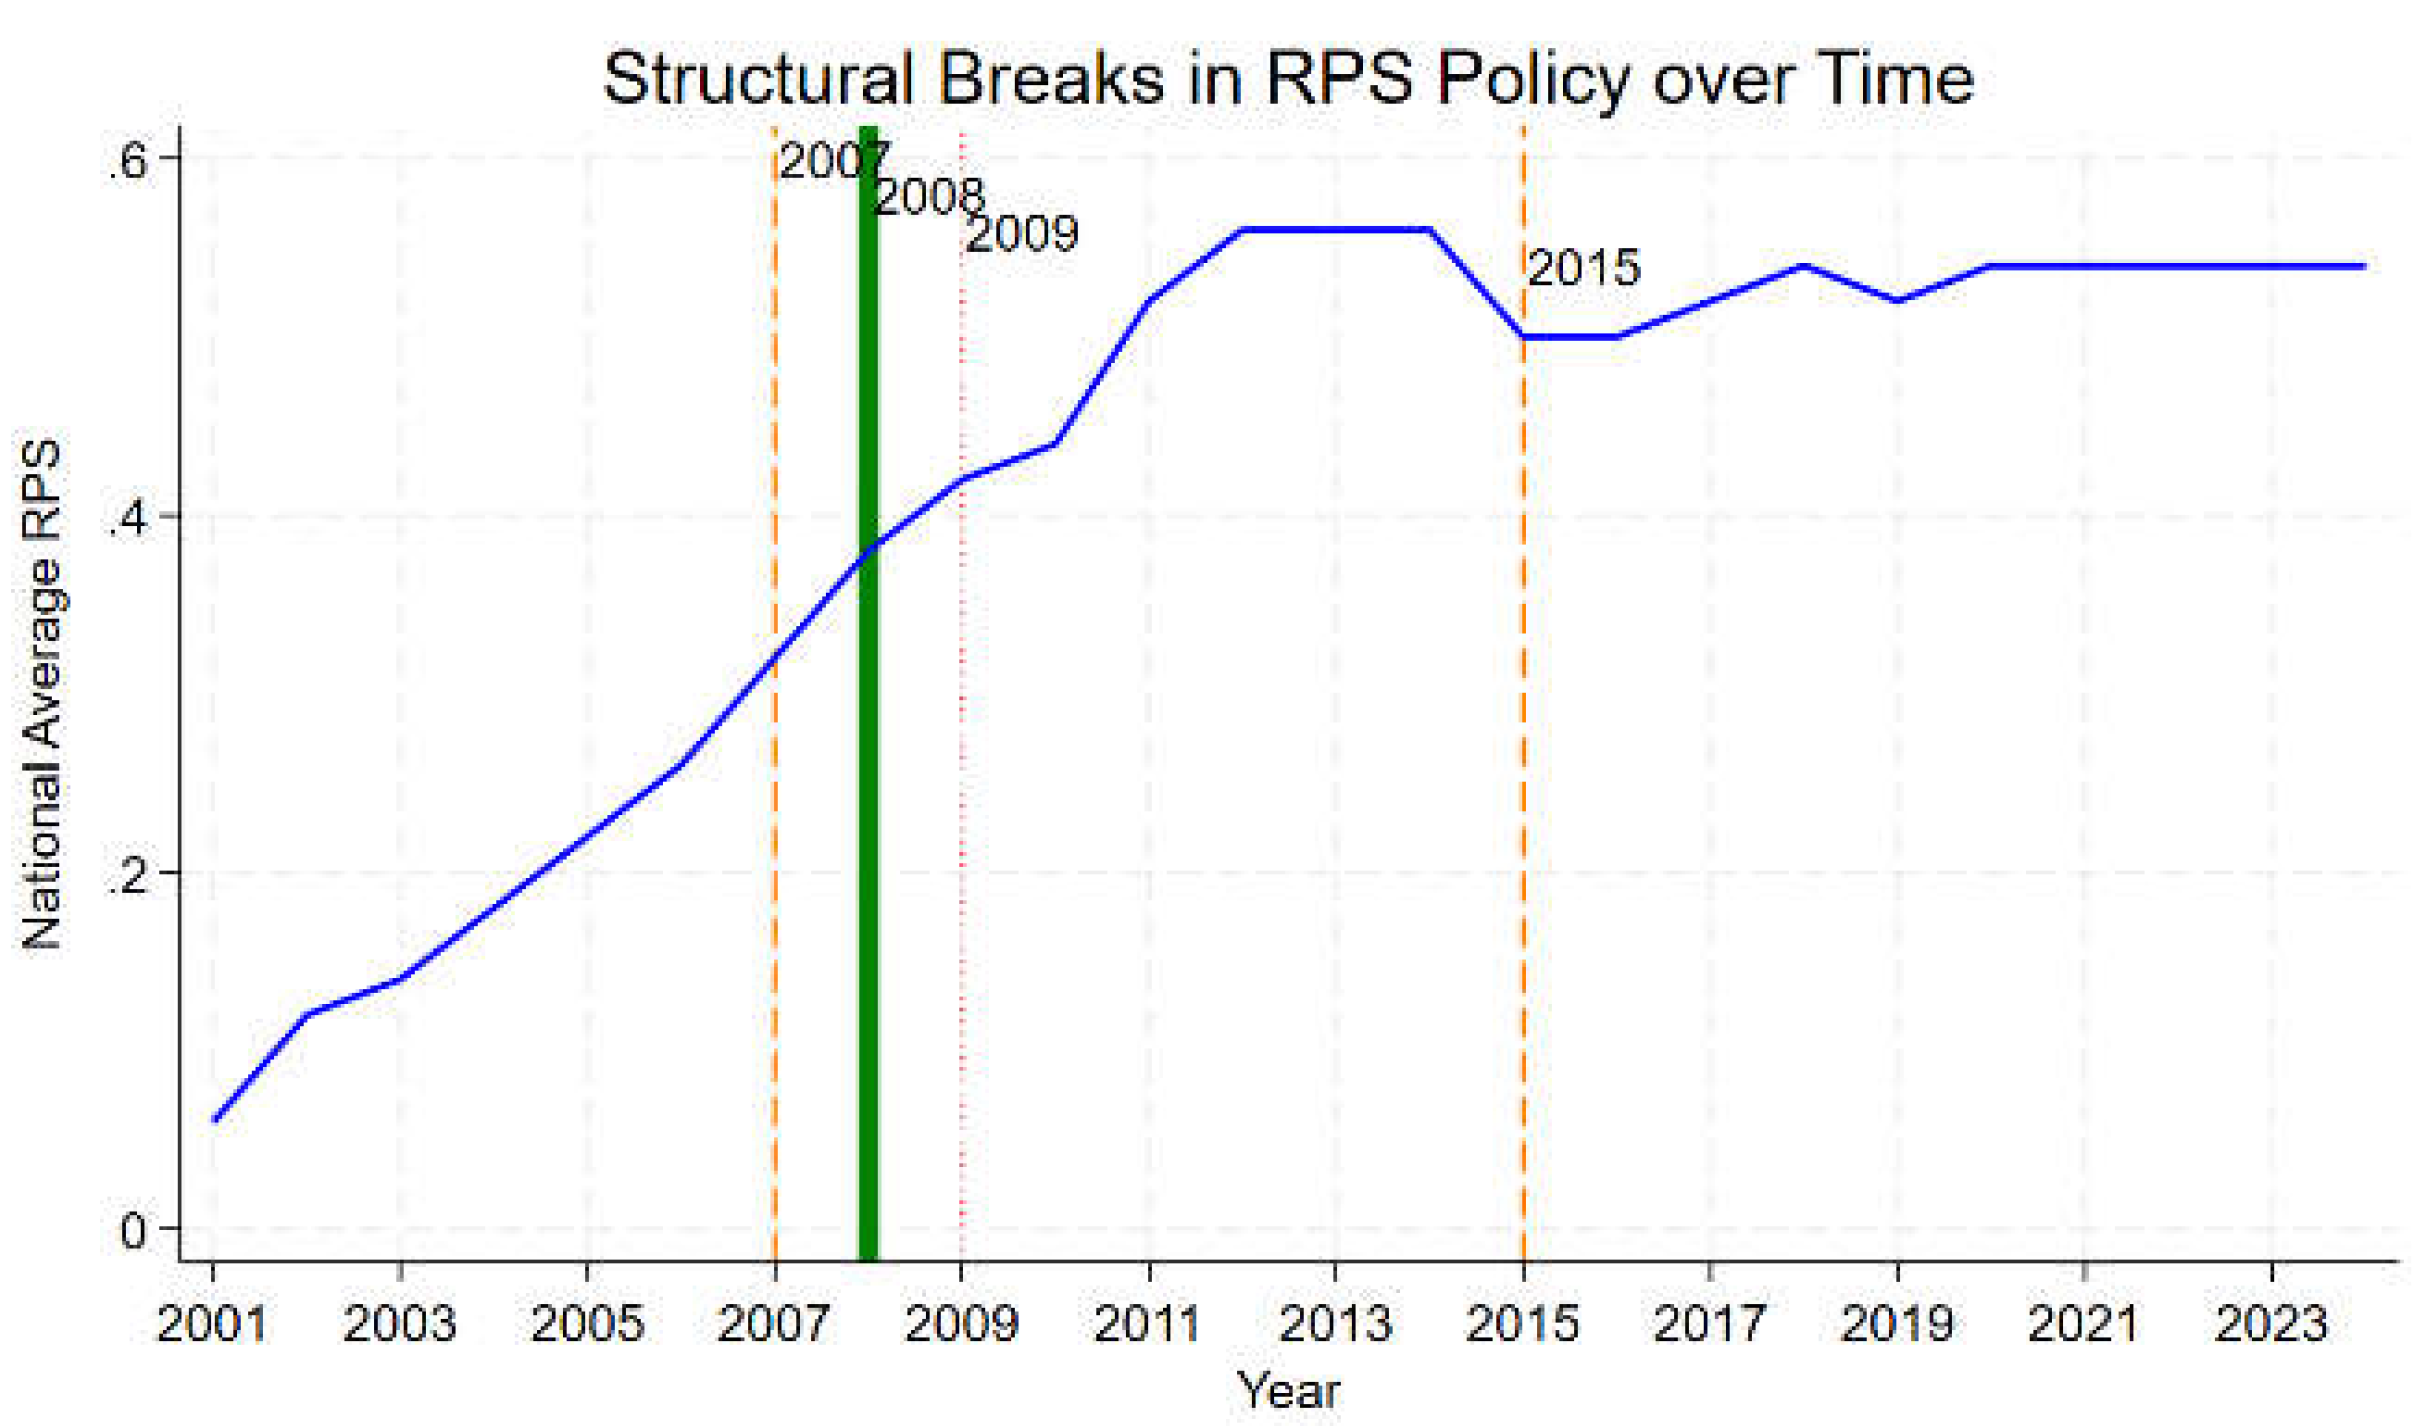
Figure 5.
Coefficient Estimates by Structural Break Year (Pre and Post 2007,2008, 2009).
Disclaimer/Publisher’s Note: The statements, opinions and data contained in all publications are solely those of the individual author(s) and contributor(s) and not of MDPI and/or the editor(s). MDPI and/or the editor(s) disclaim responsibility for any injury to people or property resulting from any ideas, methods, instructions or products referred to in the content. |
© 2026 by the authors. Licensee MDPI, Basel, Switzerland. This article is an open access article distributed under the terms and conditions of the Creative Commons Attribution (CC BY) license (http://creativecommons.org/licenses/by/4.0/).
Copyright: This open access article is published under a Creative Commons CC BY 4.0 license, which permit the free download, distribution, and reuse, provided that the author and preprint are cited in any reuse.


