
Submitted:
24 February 2026
Posted:
26 February 2026
You are already at the latest version
Abstract
Mobile health units (MHUs) offer an attractive means to reach people facing barriers that limit engagement with traditional primary care providers, but evidence on utilization as-sociated factors is sparse. This ecological study leveraged data from Wayne State University/Wayne Health MHU encounters with adult patients from 07/2021-09/2025 to address the knowledge gap. We fit negative binomial regression models with a log link and log(population) offset to test the a priori hypothesis that the density of MHU encounters is increased in designated versus undesignated Primary Care Health Professional Shortage Area census tracts established by the U.S. Health Resources and Services Administration. Sensitivity analyses examined whether the association varied by socioeconomic status vulnerability index score quartiles established by the US Centers for Disease Control and Prevention. One quarter of the five-county metropolitan Detroit, Michigan, catchment area census tracts were designated healthcare shortage areas. There were 13,852 encounters with 10,924 unique patients living in 924 of the total 1,305 census tracts in the catchment. The MHU encounter rate per adult population was significantly increased by severalfold comparing designated versus undesignated healthcare shortage areas; the estimated magnitude of association strengthened with increasing socioeconomic vulnerability index score quartile (interaction p-value, 0.0006). Continued efforts to scale and evaluate the capacity for mobile health units to help address projected healthcare shortages appears warranted, particularly in areas with heightened socioeconomic vulnerability.
Keywords:
population health
; health services research
; ecological study
; social vulnerability
1. Introduction
Mobile health units (MHUs) offer an attractive means of reaching people facing barriers that limit engagement with traditional primary care providers operating clinics in fixed ‘brick and mortar’ locations. Use of MHUs increased rapidly in the United States over the past 15 years, with multiple programs serving vulnerable populations (e.g., people who are uninsured or unhoused) [1,2]. Mobile health outreach is often described in the context of “health care deserts” [3], isolated rural populations [4] and underserved communities that typically lack further definition [5,6]. We were unable to identify prior studies that leveraged data on formal geographic designations of healthcare shortage areas to evaluate MHU uptake. This ecological study fills the knowledge gap by testing the a priori hypothesis that the density of MHU encounters is increased among residential areas designated as Primary Care Health Professional Shortage Areas by the U.S. Health Resources and Services Administration (HRSA).
2. Materials and Methods
Study Design
The Institutional Review Board of Wayne State University approved this study, determining that it met criteria for a waiver of informed consent per applicable federal regulations (45 CFR 46.116).
Clinical data were provided by the Wayne State University/Wayne Health MHU program that is described in detail elsewhere [7,8,9]. Briefly, a fleet of five-to-seven MHUs are deployed five-to-six days per week to site locations that are prioritized using our interactive map web application (the PHOENIX [10] Prevalence Profiler [11]) based on high social vulnerability index scores [7] and high rates of hypertension, diabetes, and high cholesterol estimated by the Centers for Disease Control and Prevention [12]. After intake, a focused medical history is performed by staff including community health workers, nurses, and research assistants following standardized questionnaires. Patients can then opt to undergo blood pressure (BP) evaluation and/or laboratory testing for cardiometabolic disorder risk factors (e.g., non-fasting lipoprotein measurements and glycated hemoglobin (HbA1c) assessment). BP screening and venous blood draws are performed onsite and biological samples are shipped within 24-hours to one of our partner clinical laboratories for analyses (https://www.questdiagnostics.com/; https://www.labcorp.com/). Clinical histories and BP measurements are entered into Wayne Health’s electronic medical record (EMR) system onsite, while laboratory results are automatically imported into the EMR approximately 1-3 days later.
This ecological study leverages deidentified data extracted from Wayne Health’s EMR for adult patient encounters that included BP evaluation or laboratory testing from 07/2021 to 09/2025. The focus on encounters with BP or laboratory measurements was intended to limit potential bias associated with pandemic era COVID-19 testing activities. We further restricted the analysis to encounters with patients living in Detroit, Michigan USA, or surrounding counties (Wayne, Macomb, Oakland, Washtenaw, Monroe).
Geocoding
Residential street addresses were geocoded to identify census tract Federal Information Processing Standards (FIPS) codes using a three-stage process. First, column names were standardized to the US Census Bureau requirements (Street, City, State, ZIP) and basic filtration was applied to remove empty/duplicate rows before processing. Second, batches of up to 6,000 distinct addresses were sent directly to the US Census Bureau Batch Geocoder API. Third, unmatched addresses were screened for typos, formatting errors, or missing elements and the corrected addresses were submitted to the US Census Bureau Batch Geocoder API to retrieve the 11-digit FIPS code for each street address. The residential street address was chosen because we hypothesized that MHU encounters would be increased among people living in neighborhoods designated as healthcare shortage areas.
Census Tract Characteristics
Primary Care Health Professional Shortage Area (pcHPSA) designation data were provided by HRSA. We used the most recent designation for each area based on the date the record was last updated as of August 28th, 2025, when the data were downloaded. The pcHPSA designated census tracts were compared to undesignated areas. We also classified census tracts by shortage severity using information from a Healthcare Professional Shortage Area score that ranges from 1 to 26 with higher scores indicating greater need. Undesignated census tracts were compared to those designated as mild shortage (bottom quartile HPSA score <12), moderate shortage (middle quartile HPSA score 12-<19) or severe shortage areas (top quartile HPSA score ≥ 19).
Based on prior knowledge of association with healthcare utilization, we also included information from an index of census tract vulnerability related to socioeconomic status (SES)[i.e., poverty, low income, unemployment, below high school education] provided by the latest available CDC Social Vulnerability Index (SVI) dataset from 2022 [13]. The SES SVI score was classified by quartile to represent low, moderate and high vulnerability. Additional information about adult population size was provided by the 2018-2022 American Community Survey 5-year estimate.
Statistical Analysis
First, we summarized patient characteristics by calculating frequencies and percentages for categorical data and calculating medians and interquartile range (IQR) boundaries (i.e., 25th and 75th percentiles) for interval data. Next, we aggregated the total number of MHU encounters by patients’ home address census tract to test the a priori hypothesis that density would be increased in designated versus undesignated healthcare shortage areas. Magnitudes of association with 95% confidence intervals (CI) were estimated using negative binomial regression with a log link to account for overdispersion and a log(adult population) offset to estimate per-capita rates. The adjusted model was specified as follows:
Log(Expected [encountersi]/adult population) = β0 + β1 (pcHPSA categoryi) + β2 (SES SVI categoryi)
We also conducted sensitivity analyses by adding an interaction term -- β1 (pcHPSA categoryi) X β2 (SES SVI categoryi)-- to test whether the magnitude of association varied by the SES SVI score quartile. Analyses were performed using SAS v9.4 (Raleigh, NC), and statistical significance was defined using two-sided tests with α = 0.05.
3. Results
The home address was successfully geocoded to census tract FIPS codes for 98% of the 14,486 MHU encounters with BP or laboratory measurements during the study period; n=507 (3.6%) addresses required cleansing. After excluding information from out-of-state (n=132) and out-of-county (n=162) residents, information from 13,852 encounters with 10,924 unique patients living in 924 unique census tracts was included. The majority of patients identified as Black or African American (71%), 61% were female and the median(IQR) age at first encounter was 57(41-67) years. Most patients had a single encounter (85%), 10% had one repeat visit, and 5% had ≥3 encounters.
There were no encounters with patients who lived in 29% of the 1,305 catchment area census tracts; among the remaining 924 tracts, the median(IQR) number was 6 (2-18) and 5% had ≥ 48 encounters. Approximately one quarter of the census tracts were designated pcHPSA (n=336, 26%). Figure 1 maps the density of MHU encounters by pcHPSA score category.
The MHU encounter rate per adult population was significantly increased by ninefold comparing pcHPSA designated versus undesignated census tracts (Table 1). Adjustment for vulnerability related to socio-economic status reduced the estimated magnitude by 25%, but the association remained statistically significant (Rate Ratio [95%CI]: 6.6 [5.4-8]). Subclassification of the pcHPSA designation revealed no appreciable differences comparing mild, moderate and severe shortage areas versus undesignated census tracts.
Sensitivity analyses showed that the estimated magnitude of association between pcHPSA designation and the density of MHU encounters varied by SES SVI category (interaction p-value, 0.0006). Shortage areas were significantly associated with increased encounter density in areas with low, middle or top quartile SES SVI scores, but the magnitude strengthened with increasing socioeconomic vulnerability.
4. Discussion
Our group uses information from the CDC Social Vulnerability Index and PLACES datasets to guide mobile health deployment to areas in need of services including blood pressure testing and lipid panel evaluation [7]. We conducted this ecological study to test for differences in the number of visits among communities facing specific healthcare shortages. Our main finding is that the density of mobile health unit encounters was increased by severalfold in our sample of census tracts among Primary Care Health Professional Shortage Areas designated by the US Health Resources and Services Administration. Moreover, the strength of association increased linearly among areas with low, middle and top quartile socioeconomic vulnerability scores. To our knowledge this is the first report of an association between primary healthcare provider shortage areas and an increased density of MHU encounters.
The results of our study prompt us to infer that areas facing primary care shortages might be particularly receptive to mobile health programming. This possibility warrants further investigation considering that HRSA and the Association of American Medical Colleges (AAMC) project national shortages of 20,000-to-70,000 primary care providers in the US over the coming decade [14]. Indeed, evidence from previous studies is consistent with positive returns on investment (ROI) in mobile healthcare [1,15,16]. However, additional research is necessary as mobile healthcare ROI estimates are typically derived from small non-randomized studies and rely heavily on extrapolation from intermediate clinical markers and modeled counterfactuals that are difficult to empirically validate.
We were unable to identify prior ecological studies leveraging formal geographic designations of healthcare shortage areas to investigate factors associated with mobile healthcare utilization. At least one person-level cohort study associated repeat mobile medical clinic visits with chronic illnesses and comorbidities but found no association with health insurance status after adjusting for demographic factors and medical history [17].
It is important to recognize that mobile healthcare programs are typically designed to complement traditional primary care, not replace it. Patients have reported that MHUs help them navigate complexities of the larger healthcare system and connect with local medical and social services [18,19]. However, key challenges limiting further scaling of mobile health program implementation includes financial instability, unique physical infrastructure costs (e.g., vehicle and ongoing maintenance fees), limitations related to environmental conditions (e.g., reduced encounters in poor weather), and care fragmentation without broader health system integration and data sharing infrastructure [20].
Strengths and Limitations
A key strength of this study is the incorporation of formally designated primary care shortage area data, rather than reliance on anecdotal evidence or proxy measures to identify medically underserved areas. Despite a rather large sample size of more than ten thousand mobile health patients, our study is nevertheless limited by a small number of encounters per census tract. Consequently, the estimated magnitudes of associations may be inflated. It is also possible that some patients visited other mobile health clinics, however we are unaware of other programs offering blood pressure and metabolic testing in the catchment area. Additional limitations are that we were unable to include information about linkages to primary care or mobile health site characteristics, but both topics will be addressed in planned future studies. Nor can we rule out the possibility of ecological bias and like all observational studies, ours is unable to distinguish between associations and causation.
5. Conclusions
Mobile health units encounters in our sample of metropolitan Detroit, Michigan USA, census tracts were increased in designated versus undesignated Primary Care Health Professional Shortage Areas.
Author Contributions
Conceptualization, SJK; methodology, SJK; formal analysis, SJK ; investigation, PDL, MJT, BF, PK, BR, AS, JLY, RDB and SJK; resources, PDL; data curation, ML, NNS, BR and SJK; writing—original draft preparation, SJK; writing—review and editing, PDL, MJT, BF, ML, NNS, PK, BR, AS, JLY, RDB and SJK; visualization, ML and SJK; supervision, PDL and SJK; project administration, PDL, BF, AS, RDB and SJK; funding acquisition, PDL, BF, RDB and SJK. All authors have read and agreed to the published version of the manuscript.
Funding
Research reported in this publication was supported by the National Institute On Minority Health And Health Disparities of the National Institutes of Health under Award Number P50MD017351-01; the American Heart Association, Health Equity Research Network on the Prevention of Hypertension (AHA 878605); and the Michigan Department of Health and Human Services. The content is solely the responsibility of the authors and does not necessarily represent the official views of the National Institutes of Health.
Institutional Review Board Statement
The study was conducted in accordance with the Declaration of Helsinki and was approved by the Institutional Review Board (IRB) of Wayne State University.
Informed Consent Statement
Wayne State University’s Institutional Review Board determined that the study met the criteria for a waiver of informed consent in accordance with applicable federal regulations (45 CFR 46.116), as the research involved minimal risk to participants and could not practicably be carried out without the waiver.
Data Availability Statement
The data presented in this study are available upon reasonable request to the corresponding authors and are not publicly available due to privacy protections.
Acknowledgments
The authors wish to thank the various research assistants and community health workers involved in this project. The authors have reviewed and edited the manuscript and take full responsibility for the content of this publication.
Conflicts of Interest
The authors declare no conflicts of interest. The funders had no role in the design of the study; in the collection, analyses, or interpretation of data; in the writing of the manuscript; or in the decision to publish the results.
Abbreviations
The following abbreviations are used in this manuscript:
| MHUs | Mobile health Units |
| HRSA | U.S. Health Resources and Services Administration |
| BP | Blood Pressure |
| HbA1c | Non-fasting lipoprotein measurements and glycated hemoglobin |
| EMR | Electronic Health Record |
| FIPS | Federal Information Processing Standards |
| API | Application Programming Interface |
| pcHPSA | Primary Care Health Professional Shortage Area |
| SES | Socioeconomic Status |
| SVI | Social Vulnerability Index |
| IQR | Interquartile Range |
| CI | Confidence Intervals |
| AAMC | Association of American Medical Colleges |
References
- The 2025 Mobile Clinics Landscape Report. 2026, Mobile Health Map-- A Program of Harvard Medical School. p. 36.
- Sabo, K., et al., Exploring Mobile Health Clinics: A Scoping Review. J Health Care Poor Underserved, 2025. 36(1): p. 1-20. [CrossRef] [PubMed]
- Sieck, C., et al., Developing a nurse-led reproductive health mobile health unit in rural Illinois: Opportunity to promote faculty practice and student training. J Am Assoc Nurse Pract, 2025. 37(10): p. 569-572. [CrossRef] [PubMed]
- Higgins, A., M. Tilghman, and T.K. Lin, Mobile health clinics in a rural setting: a cost analysis and time motion study of La Clínica in Oregon, United States. BMC Health Serv Res, 2025. 25(1): p. 97. [CrossRef] [PubMed]
- Attipoe-Dorcoo, S., et al., Mobile health clinic model in the COVID-19 pandemic: lessons learned and opportunities for policy changes and innovation. Int J Equity Health, 2020. 19(1): p. 73. [CrossRef] [PubMed]
- Gupta, P.S., et al., Mobile Health Services for COVID-19: Counseling, Testing, and Vaccination for Medically Underserved Populations. Am J Public Health, 2022. 112(11): p. 1556-1559. [CrossRef] [PubMed]
- Levy, P., et al., From pandemic response to portable population health: A formative evaluation of the Detroit mobile health unit program. PLoS One, 2021. 16(11): p. e0256908. [CrossRef] [PubMed]
- Twiner, M.J., et al., Origins of a novel mobile health unit program to prevent cardiovascular disease in vulnerable communities. J Clin Hypertens (Greenwich), 2024. 26(4): p. 448-450. [CrossRef] [PubMed]
- Brook, R.D., et al., Utilizing Mobile Health Units for Mass Hypertension Screening in Socially Vulnerable Communities Across Detroit. Hypertension, 2022. 79(6): p. e106-e108. [CrossRef] [PubMed]
- Korzeniewski, S.J., et al., The Population Health OutcomEs aNd Information EXchange (PHOENIX) Program - A Transformative Approach to Reduce the Burden of Chronic Disease. Online J Public Health Inform, 2020. 12(1): p. e3. [CrossRef] [PubMed]
- Wayne State University PHOENIX Prevalence Profiler. 2026 [cited 2026 1-30-26]. Available from: https://phoenix-data.wayne.edu.
- Greenlund, K.J., et al., PLACES: Local Data for Better Health. Prev Chronic Dis, 2022. 19: p. E31. [CrossRef] [PubMed]
- Khan, S.U., et al., Social Vulnerability and Premature Cardiovascular Mortality Among US Counties, 2014 to 2018. Circulation, 2021. 144(16): p. 1272-1279. [CrossRef] [PubMed]
- Adashi, E.Y., D.P. O’Mahony, and P.A. Gruppuso, The National Physician Shortage: Disconcerting HRSA and AAMC Reports. J Gen Intern Med, 2025. 40(14): p. 3469-3472. [CrossRef] [PubMed]
- Oriol, N.E., et al., Calculating the return on investment of mobile healthcare. BMC Medicine, 2009. 7(1): p. 27. [CrossRef] [PubMed]
- Song, Z., et al., Mobile clinic in Massachusetts associated with cost savings from lowering blood pressure and emergency department use. Health Aff (Millwood), 2013. 32(1): p. 36-44. [CrossRef] [PubMed]
- Coaston, A., et al., Factors associated with mobile medical clinic use: a retrospective cohort study. Int J Equity Health, 2023. 22(1): p. 195. [CrossRef] [PubMed]
- Rodriguez, K.L., et al., African American Veterans’ Experiences with Mobile Geriatric Care. Journal of Health Care for the Poor and Underserved, 2007. 18(1): p. 44-53. [CrossRef] [PubMed]
- O’Neill, M., et al., Implementation and evaluation of a novel community-based urban mobile health clinic in Toronto, Ontario. Can J Public Health, 2025. 116(3): p. 484-492. [CrossRef] [PubMed]
- Yu, S.W.Y., et al., The scope and impact of mobile health clinics in the United States: a literature review. International Journal for Equity in Health, 2017. 16(1): p. 178. [CrossRef] [PubMed]
Figure 1.
Density of Mobile Health Unit Encounters per 1K Adult Population by Primary Care Health Professional Shortage Area (HPSA) Score.
Figure 1.
Density of Mobile Health Unit Encounters per 1K Adult Population by Primary Care Health Professional Shortage Area (HPSA) Score.
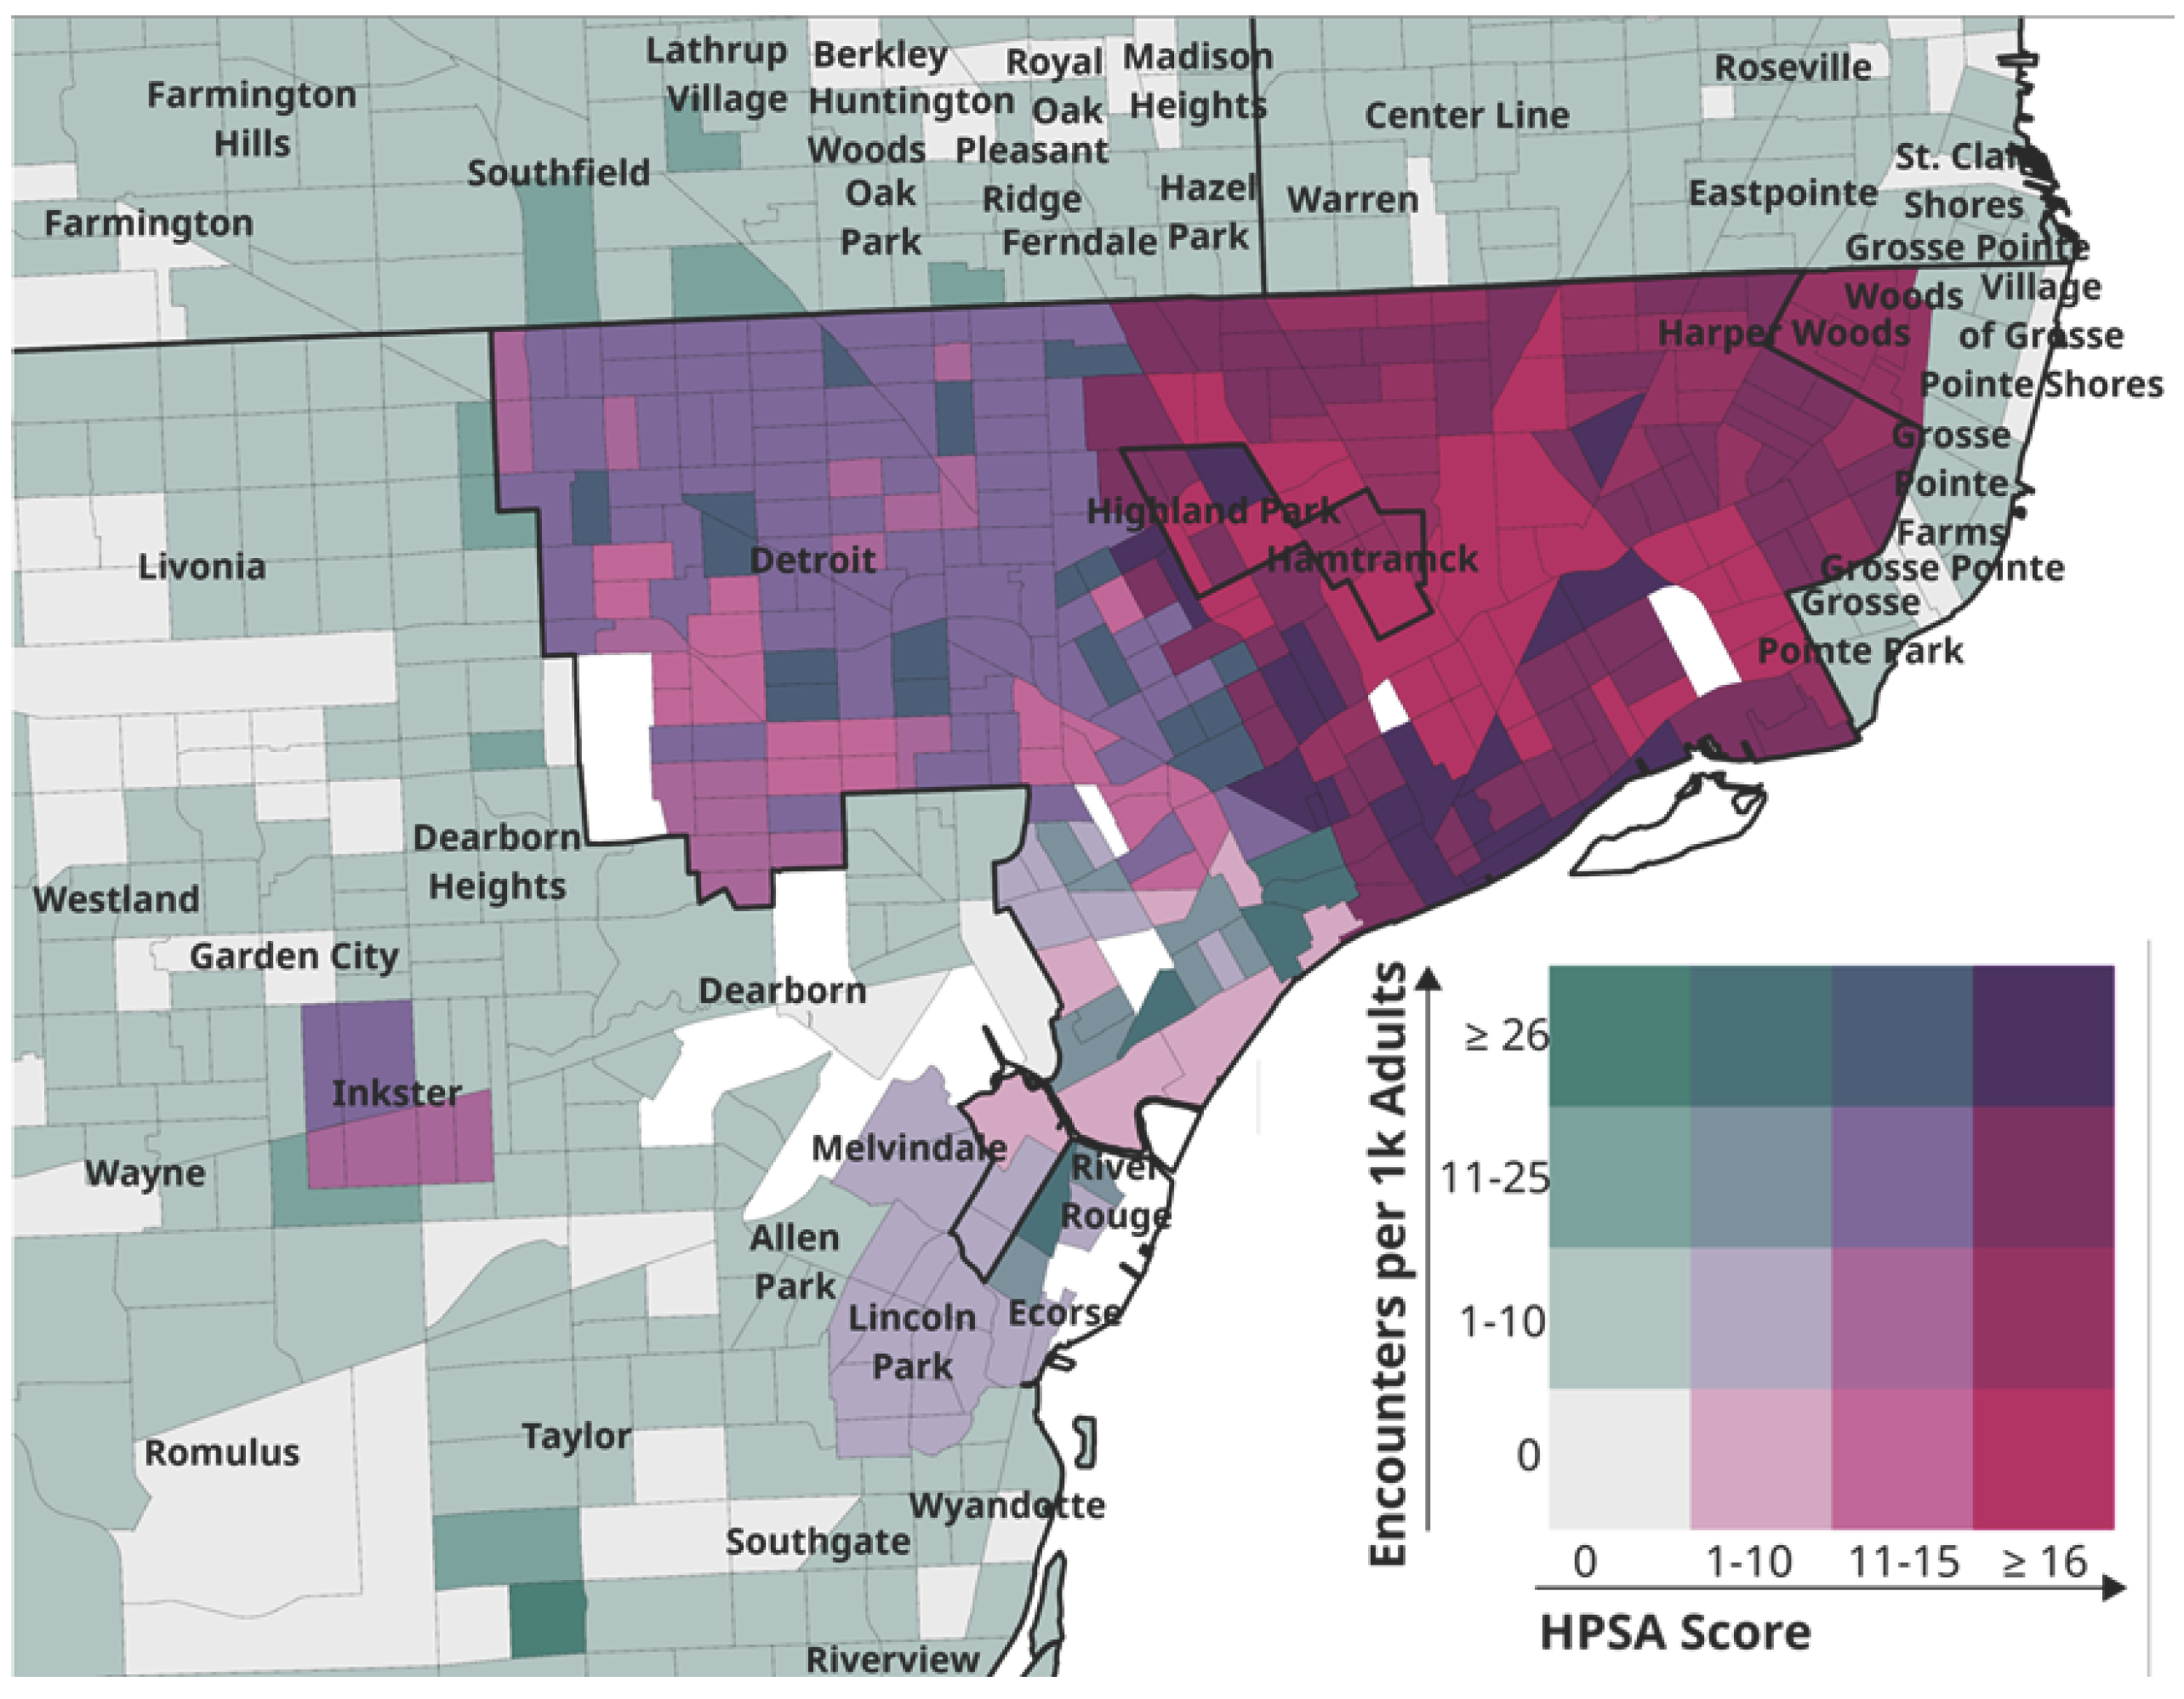

Table 1.
Magnitudes of Association Between Primary Care Health Professional Shortage Areas and Mobile Health Unit Encounters.
Table 1.
Magnitudes of Association Between Primary Care Health Professional Shortage Areas and Mobile Health Unit Encounters.
| Census Tract Classifications | Unadjusted | Adjusted | ||||
| RR | 95% LCL | UCL | RR | 95% LCL | UCL | |
| Binary HPSA Classification | ||||||
| Designated Primary Care Health Professional Shortage Area | 8.8 | 8.5 | 9.1 | 6.6 | 5.4 | 8.0 |
| Undesignated | 1 | 1 | ||||
| Social Vulnerability related to Socioeconomic Status (SES SVI) | ||||||
| Top SES SVI Quartile | - | - | - | 2.3 | 1.9 | 2.8 |
| Middle SES SVI Quartile | - | - | - | 2.8 | 2.3 | 3.6 |
| Bottom SES SVI Quartile | 1 | |||||
| Categorical HPSA Classification | ||||||
| Mild shortage (bottom quartile HPSA score <12) | 7.6 | 5.0 | 11.5 | 5.0 | 3.3 | 7.6 |
| Moderate shortage (middle quartile HPSA score 12-<19) | 9.6 | 7.5 | 12.3 | 6.9 | 5.4 | 9.0 |
| Severe shortage (top quartile HPSA score ≥ 19) | 9.8 | 7.7 | 12.4 | 6.7 | 5.2 | 8.6 |
| Undesignated | 1 | 1 | ||||
| Social Vulnerability related to Socioeconomic Status (SES SVI) | ||||||
| Top SES SVI Quartile | - | - | - | 2.3 | 1.9 | 2.8 |
| Middle SES SVI Quartile | - | - | - | 2.9 | 2.3 | 3.6 |
| Bottom SES SVI Quartile | 1 | |||||
Note: HPSA, Health Professional Shortage Area; RR, Rate Ratio; LCL, lower 95% confidence limit; UCL, upper 95% confidence limit; SVI, social vulnerability index.
Disclaimer/Publisher’s Note: The statements, opinions and data contained in all publications are solely those of the individual author(s) and contributor(s) and not of MDPI and/or the editor(s). MDPI and/or the editor(s) disclaim responsibility for any injury to people or property resulting from any ideas, methods, instructions or products referred to in the content. |
© 2026 by the authors. Licensee MDPI, Basel, Switzerland. This article is an open access article distributed under the terms and conditions of the Creative Commons Attribution (CC BY) license (http://creativecommons.org/licenses/by/4.0/).
Copyright: This open access article is published under a Creative Commons CC BY 4.0 license, which permit the free download, distribution, and reuse, provided that the author and preprint are cited in any reuse.


