

Submitted:
20 February 2026
Posted:
27 February 2026
You are already at the latest version
Abstract
Flow channels on the snow surface are a common phenomenon frequently reported by field observers. The interpretation of those field observations and an understanding of the underlying physical processes are important for forecasting routines and models of avalanche warning, hydrological, or meteorological services. Flow channels on the snow surface are typically associated with rain-on-snow (ROS) events and are often interpreted as an indicator of the approximate snowfall level. However, recent field observations of flow channels on the snow surface without significant liquid precipitation in the Austrian Alps challenge the assumption that ROS events are the sole cause of flow channel formation. In this study, we quantitatively compare liquid water input into the snowpack from melt processes to the amount of rain during a documented flow channel formation event. Using a combination of field observations, energy balance calculations and model simulations, we demonstrate that, in our case study, meltwater was the predominant driver of flow channel formation. Our results indicate that more than 97 % of the total liquid water input originated from melt, while rain contributed only roughly 2 %. These findings highlight the need for a revised interpretation of flow channel formation, suggesting that meltwater-driven flow channels may be more significant than previously assumed.
Keywords:
snow
; flow channels
; rain-on-snow
; snowmelt
; wet-snow
; snow-dimples
; rill marks
1. Introduction
Visual observations of snow cover features reported to avalanche warning, hydrological, or meteorological services by field observers are essential for snow cover assessment, avalanche forecasting, or verification of weather forecasts. These observations provide real-time information on snowpack and meteorological conditions unavailable from automated measurements alone. Importantly, observational data can be communicated to avalanche warning, hydrological, or meteorological services by individuals with varying levels of expertise, including non-experts or less trained personnel, thereby adding to the overall information available. To accurately interpret field observations and assess the consequences of the observations for snowpack stability, water availability, or weather conditions as well as their spatial variability, a profound understanding of the underlying physical processes is essential. The understanding of the processes is an important precondition for the correct integration of observations into forecasting routines and models.
Flow channels on the snow surface (Figure 1) are among the surface features frequently reported from the field. As described by La Chapelle (2001), flow channels result from the percolation of liquid water through the snowpack, which subsequently concentrates in subsurface flow channels [1]. Those flow channels (or "snow dimples") were already described by Nohguchi (1984) in Nagaoka, Japan, where the formation of a "dimple pattern" can be observed several times every winter [2,3]. In situ observation of the formation of snow dimples on artificial snow layers were performed by Shimada et al. (2017), who found that the "dimples" form due to a concentration of water movement within the snow, depending on the amount of liquid water and the original properties ot the dry snow [4]. The international classification for seasonal snow on the ground [5] shortly mention roughness elements of the snow surface attributed to deposition, ablation, rain, melt, or sublimation processes.
The formation of flow channels on the snow surface is commonly attributed mainly to rain-on-snow (ROS) events [6]. Tremper (2008) states that flow channels on the snow surface are usually taken as an indicator that it rained on the snow surface, "Prolonged or hard rain on new snow forms drainage channels (also called "rill marks") down in fall line and makes a corrugated pattern in the surface snow" [7], p. 124, while Harvey et al. (2012) show a photo of a "typical snow surface with flow channel after a period of rain" [8], p. 49.
The origin of the water causing the flow-channels is important for the spatial distribution of wet-snow. In case of rain on snow, all slopes below the elevation where snow turns to rain are effected [9]. Whereas when water infiltration is due to melting, wet-snow is expected to be more pronounced for sunny slopes (higher solar radiation) and lower elevations (higher air temperature).
Thus, in particular for avalanche forecasting, the flow channels are used as indicators for several key factors: the elevation of the snowfall level (altitude above sea level at which precipitation falls as snow which is deposited on the ground), wet-snow [10] or glide-snow [11] avalanche conditions, the formation of crusts within the snowpack, crust-related weak layers within the snowpack, and generally the overall stability of the snowpack. In short, knowing the source of the liquid water forming the observed flow channels is important for drawing the right conclusions for forecasting routines and modeling.
Within this paper we study a wide-spread flow channel formation event in the Austrian Alps in December 2023. We compare the liquid water input from melt processes with that from rain during the formation of the flow channels. By combining field observations, measurements as well as model simulations, we seek to enhance the understanding of the processes driving surface flow-channel development.
2. Materials and Methods
2.1. Field Site Overview and Meteorological Data
A map of Austria with an overview of all observation and measurement sites is shown in Figure 2. As a basis for the calculations and the modeling within this study, meteorological data from Automatic Weather Stations (AWS) in the Präbichl and Brunnalm/Hohe Veitsch skiing areas (Figure 3) were utilized. To complement these observations with snow cover and meteorological measurements from the broader region, precipitation and temperature data from the AWSs at Rudolfshütte and Obertauern is also shown (Figure 4).
The AWS Präbichl and Hohe Veitsch are situated along the main Alpine divide in the Eastern Austrian Alps, approximately 40 km apart in a straight-line distance, sharing similar topographic settings and elevation ranges. Meteorologically, both sites are characterized by their susceptibility to northerly to north-westerly orographic precipitation events, which frequently impact the region during winter. Their proximity suggests that meteorological conditions at the two AWS are likely to be broadly similar, making them a suitable pair for further analysis of the atmospheric conditions preceding flow channel formation in the Eastern Austrian Apls. The Rudolfsütte is located at 2317 m and approximately 250 km to the West of Präbichl, providing data from the westernmost part of our observation areas. Observational data from the AWS Obertauern Pass located at 1772 m in the Central Austrian Alps is used to close the gap between Eastern and Western Austrian Alps. The temporal resolution of observational data on weather stations was 10 min. The meteorological data spans the early winter period up to 31 December 2023, allowing for a comprehensive review of meteorological conditions leading up to the observed phenomena.
At Präbichl, the dense AWS network provides a range of measurements across different elevations, from which the following were utilized in this study:
- precipitation and air pressure at 1214 m
- snow height, air temperature, relative humidity, incoming short-wave radiation, snow surface temperature and wind measurements at 1731 m
- wind measurements at 1907 m
AWS Hohe Veitsch contributed the following data:
- snow height, air temperature, relative humidity, snow surface temperature and net radiation at 1323 m
- wind measurements at 1973 m
and AWS Obertauern and Rudolfshütte contributed:
- precipitation and air temperature at 1772 m and 2317 m, respectively.
2.2. Weather Conditions
Following initial snowfall events at alpine elevations (> 2000 m) in early November, a continuous snow cover formed above mid-elevations (around 1500 m) from mid-November onward. Variable weather conditions, characterized by repeated precipitation and occasional ROS events at alpine elevations, followed by cold periods with snowfall and wind, resulted in a rather heterogeneous early-winter snowpack structure.
From mid-December onward (Figure 3), the onset of a pronounced Azores High brought several days of mild and sunny weather to the Eastern Alps, with temperatures reaching up to +8 °C at 2000 m (Figure 3 uppermost panel – air temperatures at 1323 m at AWS Veitsch reached a maximum of 15 °C on 18 and 19 December 2023. This warm period caused the snowpack to settle and by 21 December 2023 a compact snow base had developed, primarily composed of multiple melt-freeze crusts interspersed with various stages of partly moist decomposed or fragmented particles.
Beginning on 22 December 2023, a shift to a stormy north-west weather pattern led to significant snowfall, particularly along the northern flanks of the Alps where orographic precipitation frequently contributes to large precipitation amounts. We see measured snowfall accumulations of 60 cm to 100 cm within approximately 48 h (22 to 24 December 2023, Figure 3 lowermost panel). The snowfall occurred at relatively high temperatures, around or slightly above 0 °C resulting in a warm layer of fresh snow (Figure 3, uppermost panel). The snowstorm ended on 24 December 2023 and was immediately followed by an influx of warm air masses into the Eastern Alps. Due to the warm conditions, the new snow stabilized rapidly, becoming compact and free of significant weak layers, even at higher elevations.
2.3. Snow Cover Observations
Manually observed snow profiles from the latter half of December 2023 (see Figure 5 and Figure 6) provide information on snowpack stratigraphy at this time. Both profiles feature a thick basal layer of compact and hard melt forms or melt-freeze crusts. Above this layer, differences in the middle snowpack structure are evident, that can be attributed to differences in elevation and local conditions. The two sites are separated by approximately 400 m in elevation, which likely marked the boundary between rain and snow during repeated early winter precipitation events. The profile from Radmer (Figure 5) shows alternating melt-freeze crusts and degrading faceted crystals, whereas the profile at Vordernberger Griesmauer (Figure 6) reveals a relatively uniform layer of compact rounded grains. Additionally, the snow depth at the Vordernberger Griesmauer site was approximately twice as high, suggesting frequent loading with wind-transported snow. The south-facing orientation of this site leading to increased solar radiation likely resulted in lower temperature gradients, reduced constructive metamorphism and enhanced snowpack settling, explaining the presence of the compact layer of rounded grains. The top layers of both profiles reflect the fresh snow from the snowfall event between 22 and 24 December 2023. On 23 December 2023, the Radmer profile shows loose new snow particles in the upper layers. However, slightly moist conditions were already observed within these fresh snow layers, likely due to air temperatures near 0 °C during the snowfall. By the morning of 25 December 2023, the Griesmauer profile indicated that the uppermost layers had already transitioned to moist or wet snow, with crystals transforming into melt forms or fragmented new snow particles. These observations highlight the significant changes experienced by the snowpack’s upper layers within this short period.
2.4. Field Observations of Flow Channels
Wide-spread flow channels on the snow surface were observed by avalanche forecasters from the Styrian and Lower Austrian Avalanche Warning Services during a field campaign near the Präbichl skiing area on 25 December 2023 [12]. To evaluate the extent of the flow channels on a larger scale, additional sources of snow observations, including webcam imagery, were analyzed. The observations and webcam images revealed widespread flow channel development across the Austrian Alps, spanning from regions such as Göller (Figure 1) and Veitsch (Figure 7), along the main Alpine divide towards the west, including Obertauern (Figure 8) and extending as far as the western Hohe Tauern, such as Wildgerlostal (Figure 9). The spacial distribution covers approximately 263 km in straight-line distance.
2.5. Surface Energy Balance Calculations
To determine the factors influencing the formation of the observed flow channels, we calculated the available energy for snow-melt per unit area based on the surface energy balance of the snowpack. Assuming the snow surface behaves as an infinitesimally thin layer with no heat capacity, the principle of energy conservation dictates that the energy fluxes into the surface must balance those leaving it. Following Wallace and Hobbs (2006) [13], the surface energy flux is therefore expressed as:
where:
|
=energy flux at the snow surface =net long-wave radiative flux (measured) =net short-wave radiative flux (measured) E=latent heat flux H=sensible heat flux =advective heat flux (e.g., by rain) |
The ground heat flux is neglected in this surface energy balance approach, assuming that the snowpack provides sufficient thermal insulation to decouple the snow surface from the underlying ground. is determined by
where:
| = | rain mass flux per unit area (measured) | |
| = | specific heat capacity of water = 4186 | |
| = temperatures of the rain (assumed equal to air temperature) | ||
| and the snow surface (measured) | ||
Applying the bulk aerodynamic approach [13] the sensible heat flux H and the latent heat flux E can be calculated by
where:
| = | density of the air, assumed constant = 1.225 | |
| = | specific heat capacity of air = 1004 | |
| = | latent heat of sublimation = | |
| = | wind velocity (measured) | |
| = | dimensionless bulk transfer coefficients for heat and water vapor | |
| = | temperatures of the air and the snow surface (measured) | |
| = | specific humidities of air and the snow surface | |
We used conservative and for heat and water vapor transfer, respectively, as suggested in literature, assuming a flat snow surface under statically neutral conditions [13,14]. is the specific humidity of the snow surface (uppermost layer), for which we assume saturation. This means that the relative humidity at the surface is RH=1 and the vapor pressure at the snow surface equals the saturation vapor pressure over ice, i.e., , where is calculated using the surface temperature measured at the AWS (Equation 7).
Specific humidities are determined by
where:
where:
and the air pressure is calculated by the barometric equation:
where:
| p | = | air pressure |
| e | = | water vapor pressure using the water vapor pressure |
| = | saturated vapor pressure | |
| = | relative humidity (measured) . is determined via | |
| p | = | air pressure at Veitsch and Präbichl |
| = | air temperature at Veitsch resp. Präbichl (measured) | |
| g | = | gravitational acceleration = 9.81 |
| R | = | specific gas constant for dry air = 287.05 |
| L | = | temperature lapse rate = |
Ultimately, (Equation 2) represents a 10 min averaged energy flux per unit area, based on the 10 min measurements of the AWS. To determine the total energy available over a 10 min period, the mean flux is integrated over the averaging period (in this case 10 min):
where represents the total energy available per unit area over a 10-minute interval.
2.6. Estimation of Potential Meltwater Production
The potential meltwater production based on the surface energy balance was then estimated by
where:
| = | potential amount of meltwater per time interval (10 min) | |
| = | energy available for snowmelt per unit area | |
| = | latent heat of fusion | |
The energy per unit area available for snowmelt is determined by
where the energy needed to heat the upper 1 cm of the snow to the melting point 0 °C, , is estimated by:
with:
| = | heat energy per unit area | |
| = | specific heat capacity of ice and snow | |
| = | mass of snow to heat to 0 °C | |
| = | snow surface temperature | |
with the snow volume and the assumed density of the fresh snow layer.
The energy available for snow-melt is strongly influenced by . In this study, we assume that only the uppermost 1 cm of snow is heated to the melting point within each 10-minute interval, with no energy lost to other processes. To minimize the impact of this assumption, calculations have been restricted to periods when the snow surface temperature was generally at 0 °C. However, a minor effect remains for periods when the measured snow surface temperature temporarily drops below 0 °C.
Data used for this study was quality-controlled and preprocessed to remove erroneous values and fill data gaps. Additionally, corrections for sensor biases and inconsistencies were applied to ensure the reliability of the dataset.
2.7. SNOWPACK Modeling
We conducted snow cover simulations using the physically-based SNOWPACK model [15,16], driven by meteorological measurements from AWS Präbichl (1731 m). As a water transport scheme we used the traditional bucket model [15]. Our simulations provide detailed insights into the evolution of snowpack stratigraphy, as well as the presence and transport of liquid water within the snowpack.
3. Results
On the morning of 25 December 2023, avalanche forecasters from the Styrian Avalanche Warning Service reported extensive formation of flow channels, observed at least up to 1900 m. Hourly webcam imagery from Brunnalm/Hohe Veitsch, covering elevation ranges between 1400 m and 1700 m (Figure 7), as well as from the Obertauern skiing area further west, corroborates this observation and documents the overnight formation of flow channels despite minimal liquid precipitation (Figure 4). The following section presents the results of the investigation conducted in this study to address this phenomenon.
3.1. Surface Energy Balance Calculations
Surface energy balance components, along with estimated snowmelt and measured precipitation rates for the period from 24 December 2023, 12 CET, to 25 December 2023, 12 CET, are presented in Figure 10. To compensate for missing wind measurements caused by frozen instruments, wind data from AWS Veitsch were supplemented with measurements from AWS Präbichl to obtain these results.
Figure 3 shows that the main phase of precipitation concluded around midnight on 23 December 2023. Thereafter, only 1.3 mm of precipitation was recorded between 24 December 2023 at noon and midnight, as presented by the precipitation rates in Figure 10. During this period, air temperatures at the AWS locations (1731 m and 1323 m) had already risen to or slightly above 0 °C, suggesting that precipitation likely occurred in liquid or mixed form (Figure 3, upper panel), resulting in an initial but minor liquid water input into the fresh snow. However, in the subsequent hours, potential meltwater production was estimated and modeled to be roughly two orders of magnitude greater than the recorded liquid precipitation in the afternoon of 24 December 2023 (Table 1). Based on this calculation, the measured precipitation accounted for only about 1.7 % of the total liquid water input (precipitation plus potential snowmelt), underscoring the dominant role of melt processes in the formation of surface flow channels rather than direct liquid precipitation input.
3.2. SNOWPACK Modeling Results
Figure 11 shows the results of the SNOWPACK modeling. Simulated snow grain types indicate that the fresh snow from the main snowfall event accumulated on an older, well-compacted snowpack, primarily composed of rounded grains and melt-freeze crusts, as corroborated by manual snow profiles presented earlier. The freshly deposited snow consisted predominantly of defragmented particles, likely resulting from wind transport and mechanical fragmentation of new snow. These particles rapidly underwent sintering and settling processes, transitioning toward rounded grains.
Regarding snow temperature evolution, prior to the precipitation event, the upper approximately 50 cm of the snowpack exhibited a pronounced diurnal temperature gradient, leading to cooling during clear nights and subsequent warming during the day, although temperatures mostly remained below the melting point. In contrast, the fresh snow layer following the snowfall event was rather "warm" in terms of snow temperatures and therefore had a significantly lower cold reserve.
In terms of snow density, the fresh snow was substantially less dense than the pre-existing, well-settled snowpack, particularly when compared to the dense melt-freeze crust at the old snow surface. This difference in density and structural characteristics likely played a role in controlling the rate of water percolation.
The model results further indicate that snowpack wetting began during the afternoon and evening of 24 December 2023, coinciding with the onset of liquid precipitation, as simulated by SNOWPACK and measured at our automatic weather stations. However, despite the presence of liquid precipitation, full percolation of liquid water beyond the uppermost snow layers did not occur immediately but progressed gradually throughout the night. Notably, even in the absence of additional precipitation, SNOWPACK simulations indicate a continuous increase in liquid water content within the snowpack, suggesting that meltwater production from surface energy fluxes played a significant role in enhancing water infiltration and redistribution.
Consistent with observational data, the model results indicate that precipitation accounted for only approximately 2.5% of the total liquid water input, with meltwater production contributing the remaining fraction. By the night and morning of 25 December 2023, the snowpack had become fully isothermal, coinciding with liquid water percolation throughout the entire snow column.
4. Discussion
4.1. Choice of Data
This study primarily utilizes data from the automatic weather stations at Präbichl, which are located near the original observation site of the flow channels and provide measurements from relevant elevation ranges. These observations are complemented by surface energy balance data from AWS Veitsch. While this approach introduces some limitations compared to a fully localized dataset, the proximity of the stations and the similarity of their meteorological conditions ensure that these limitations remain minimal relative to the benefits of the combined dataset.
Surface energy balance calculations were primarily based on data from AWS Veitsch. However, due to sensor freezing, wind measurements at Veitsch were unavailable from 22 to 24 December 2023, necessitating the use of wind data from AWS Präbichl to fill this gap. Wind speeds at Präbichl were measured at two locations, both providing continuous and consistent recordings, with values generally slightly lower than those recorded at AWS Veitsch. Consequently, the calculated snowmelt rates based on Präbichl wind data were lower compared to those derived from Veitsch wind data.
Generally, it is important to acknowledge that wind measurement stations are typically positioned in exposed locations, where wind speeds tend to be higher than in more sheltered areas. As a result, these measurements may not fully represent conditions at the snow height and radiation balance measurement site at AWS Veitsch (1323 m), which is more sheltered. This discrepancy can influence the estimation of turbulent fluxes and energy balance calculations, potentially leading to an overestimation of wind-driven processes such as turbulent heat exchange and sublimation.
4.2. Energy Used for Warming vs. Snowmelt
To simplify the analysis, it was assumed that all available energy was used exclusively for snowmelt. However, Harpold and Brooks (2018) demonstrated that the actual partitioning of energy between snowmelt and sublimation is strongly influenced by atmospheric conditions [17]. Under very dry conditions, particularly those characterized by low relative humidity, a larger proportion of the available energy is allocated to sublimation rather than melting. This effect is especially pronounced during Föhn storm events in the Alps, where warm and dry air is advected over the snow surface. In such cases, a significant fraction of the available energy is expended on sublimation, leading to notably reduced snowmelt and liquid water percolation. Such a situation was evident on the morning of 25 December 2023, when cloud cover diminished and relative humidity dropped. However, the effect of energy partitioning between snowmelt and sublimation is not explicitly considered in our calculations, as all available energy is assumed to be used for snowmelt, leading to a potential overestimation. In contrast, the model simulations accounted for evaporation, resulting in lower snowmelt estimates.
The calculation is further based on the assumption that only the uppermost 1 cm of the snow cover is raised to 0 °C before meltwater production starts, which strongly influences the amount of energy available for melting. The penetration depth of radiation into snow depends on multiple factors, including the wavelength of incoming radiation, the physical properties of the snow and the duration of radiation exposure. Snow behaves approximately as a black body in the long-wave spectrum, absorbing most of the radiation at the surface, which is then conducted downward over time [18]. In contrast, a significant portion of short-wave radiation is reflected at the surface due to the high albedo of snow, while the remaining portion is refracted and absorbed within the of the snowpack [19]. Given our 10 min calculation steps, we assume that energy losses to deeper snow layers are minimal and that most of the available energy remains confined within the uppermost 1 cm of snow.
To minimize the effect of this assumption, we confined our calculation periods to times, when the measured snow surface temperature was already at 0 °C. Consequently, only a small amount of energy was required to raise the snowpack temperature to 0 °C if it had temporarily fallen below this threshold. Once this initial energy input was met, any additional available energy was directed toward melting.
4.3. Energy-Driven Snow-Melt and Snowpack Response to Atmospheric Conditions
The estimated potential meltwater production during the morning of 25 December 2023 was significantly greater than the accumulated liquid water from rainfall during the evening of 24 December 2023. While only 1.3 mm of rain was recorded, the estimated potential snowmelt from the positive surface energy balance reached 75.2 mm in the calculations and 50.8 mm in the SNOWPACK model. This indicates that energy-driven snow-melt was the predominant source of liquid water input into the snowpack during this period, far exceeding the contribution from direct precipitation. It underscores the crucial role of snow cover properties and atmospheric conditions in determining whether meltwater production or direct precipitation serves as the dominant source of liquid water input into the snowpack. Key factors such as snow density and temperature, as well as air temperature, relative humidity and net radiation, influence the availability and transport of liquid water, ultimately controlling the extent and dynamics of water infiltration within the snowpack.
The modeled snow temperatures suggest that the fresh snow had minimal cold content, allowing the snowpack to quickly respond to energy input, leading to accelerated warming and subsequent wetting. In contrast, prior to the snowfall event, the hard snow surface was able to accumulate a substantial cold reserve during cloudless nights with low relative humidity, which slowed or even prevented the formation of meltwater. Additionally, low relative humidity during the earlier period likely enhanced sublimation losses, further reducing the available liquid water [17,20].
Overall, the modeled and calculated snow-melt correspond well to the observed snow height reductions measured at the stations during this period. In Figure 3, both stations show a snow height reduction of over 50 cm between 24 and 25 December 2023. For fresh snow at moderate temperatures, a common rule of thumb is that 1 mm of precipitation corresponds to approximately 1 cm of snow accumulation. Applying this in reverse, melting 50 cm of fresh snow would yield approximately 50 mm of snow water equivalent. For more densely packed snow, an even higher snow water equivalent would be expected. The calculated and modeled values fall within this range, indicating plausible magnitudes of snowmelt.
5. Conclusions
Our study challenges the widely held assumption that flow channels are formed exclusively by rain-on-snow (ROS) events, revealing that meltwater generated from a positive surface energy balance can also lead to the development of flow channels. By analyzing snowpack characteristics, meteorological data, energy balance calculations, and model simulations, we demonstrate that energy-driven snow-melt can exceed liquid precipitation input and dominate liquid water production. Specifically, during the morning of 25 December 2023 in Styria, Austria, estimated meltwater production reached 75.2 mm based on energy balance calculations, while SNOWPACK simulations indicated 50.8 mm of total snow-melt. In contrast, measured precipitation during the preceding evening amounted to only 1.3 mm, contributing just roughly 2 % of the total liquid water input in the energy balance and SNOWPACK simulations, respectively. This highlights the significant role of a positive energy balance in generating a significant amount of meltwater, which can lead to flow channel formation even in the absence of substantial rainfall. Our findings underscore the importance of considering both ROS events and energy-driven snow-melt in interpreting meltwater channel formation. Atmospheric and snowpack conditions are pivotal in this process, challenging the traditional view that ROS events are the sole contributors.
Despite the conservative approach and assumptions taken in our analysis, the findings clearly indicate that liquid water generated from a positive energy balance, rather than solely from liquid precipitation, plays a crucial role in the formation of these channels. The SNOWPACK simulations further corroborate this conclusion, demonstrating that liquid water content within the snowpack increased continuously even in the absence of additional precipitation.
Our case study therefore highlights the necessity of accounting for multiple sources of liquid water in the analysis of flow channel formation, emphasizing that a comprehensive understanding requires consideration of both ROS events and energy-driven meltwater production.
Author Contributions
Conceptualization, V.H., A.G.; methodology, all authors; software, V.H.; validation, all authors; formal analysis, all authors; investigation, all authors; resources, all authors; data curation, V.H.; writing—original draft preparation, V.H.; writing—review and editing, all authors; visualization, V.H. All authors have read and agreed to the published version of the manuscript.
Funding
This research received no external funding.
Acknowledgments
We thank our colleagues from the avalanche warning services as well as the avalanche observers and mountain guides who shared and discussed their field observations with us.
Conflicts of Interest
The authors declare no conflicts of interest.
References
- LaChapelle, E.R. Secrets of the Snow: Visual Clues to Avalanche and Ski Conditions; University of Washington Press: Seattle, 2001.
- Nohguchi, Y. Formation of Dimple-Pattern on Snow I. Research report, Institute of Snow and Ice Studies, National Research Center for Disaster Prevention, Nagaoka, Japan, 1984. [CrossRef]
- Nohguchi, Y. Formation of Dimple-Pattern on Snow II. Research report, Institute of Snow and Ice Studies, National Research Center for Disaster Prevention, Nagaoka, Japan, 1984. [CrossRef]
- Shimada, W.; Motegi, T.; Yamaguchi, S.; Kosugi, K.; Abe, O. In-situ observation of the formation of snow dimples on artificial snow layers. Snow and Ice 2017, 79, 539–548. [CrossRef]
- Fierz, C.; Armstrong, R.L.; Durand, Y.; Etchevers, P.; Greene, E.; McClung, D.M.; Nishimura, K.; Satyawali, P.K.; Sokratov, S.A. The International Classification for Seasonal Snow on the Ground. Technical report, IACS Contribution No. 1, prepared by the ICSI–UCCS–IACS Working Group on Snow Classification, 2009.
- International Association of Hydrological Sciences. International Commission on Snow and Ice: Avalanche Atlas: Illustrated International Avalanche Classification; UNESCO: Paris, 1981. 265 pp.
- Tremper, B. Staying Alive in Avalanche Terrain, 2nd ed.; Mountaineers Books: Seattle, WA, 2008.
- Harvey, S.; Rhyner, H.; Schweizer, J. Lawinenkunde: Praxiswissen für Einsteiger und Profis zu Gefahren, Risiken und Strategien; Outdoor-Praxis, Bruckmann: München, 2012; p. 192.
- European Avalanche Warning Services (EAWS). Avalanche Problems, Approved by General Assembly of EAWS, Davos, 2022. https://www.avalanches.org/standards/avalanche-problems/, 2022. Typical avalanche problems – the five types of avalanche problems as defined by EAWS.
- Baggi, S.; Schweizer, J. Characteristics of wet-snow avalanche activity: 20 years of observations from a high alpine valley (Dischma, Switzerland). Natural Hazards 2009, 50, 97–108. [CrossRef]
- Reiweger, I.; Eberl, A.; Kindermann, E.; Gobiet, A. Glide-Snow Avalanche Monitoring and Development of a Site-Specific Glide-Snow Avalanche Warning Model at Planneralm in Styria, Austria. Applied Sciences 2026, 16, 1426. [CrossRef]
- Hatvan, V.; Gobiet, A.; Riegler, A.; Reiweger, I. Unraveling Unexpected Snowmelt Channels: A Case Study in the Austrian Alps. In Proceedings of the Proceedings of the International Snow Science Workshop ISSW, Tromsø, Norway, 23–29 September 2024, 2024; pp. 635–642.
- Wallace, J.M.; Hobbs, P.V. Atmospheric Science: An Introductory Survey; Elsevier, 2006. 507 pp.
- Kondo, J.; Yamazawa, H. Bulk Transfer Coefficient over a Snow Surface. Boundary-Layer Meteorology 1986, 34, 123–135. [CrossRef]
- Bartelt, P.; Lehning, M. A Physical SNOWPACK Model for the Swiss Avalanche Warning. Part I: Numerical Model. Cold Regions Science and Technology 2002, 35, 123–145. [CrossRef]
- Hirashima, H.; Yamaguchi, S.; Sato, A.; Lehning, M. Numerical Modeling of Liquid Water Movement through Layered Snow Based on New Measurements of the Water Retention Curve. Cold Regions Science and Technology 2010, 64, 94–103.
- Harpold, A.A.; Brooks, P.D. Humidity Determines Snowpack Ablation under a Warming Climate. Proceedings of the National Academy of Sciences of the United States of America 2018, 115, 1215–1220. [CrossRef]
- Sturm, M.; Holmgren, J.; König, M.; Morris, K. The thermal conductivity of seasonal snow. Journal of Glaciology 1997, 43, 26–41. [CrossRef]
- O’Neill, A.D.J.; Gray, D.M. Solar Radiation Penetration through Snow. In Proceedings of the The Role of Snow and Ice in Hydrology: Proceedings of the Banff Symposia, 1973, pp. 227–241.
- Stoy, P.C.; Peitzsch, E.; Wood, D.; Rottinghaus, D.; Wohlfahrt, G.; Goulden, M.; Ward, H. On the exchange of sensible and latent heat between the atmosphere and melting snow. Agricultural and Forest Meteorology 2018, 252, 167–174.
Figure 1.
Flow channels on Mount Göller (1766 m) in Lower Austria on 27 December 2023. Photo: GeoSphere Austria, 2023.
Figure 1.
Flow channels on Mount Göller (1766 m) in Lower Austria on 27 December 2023. Photo: GeoSphere Austria, 2023.
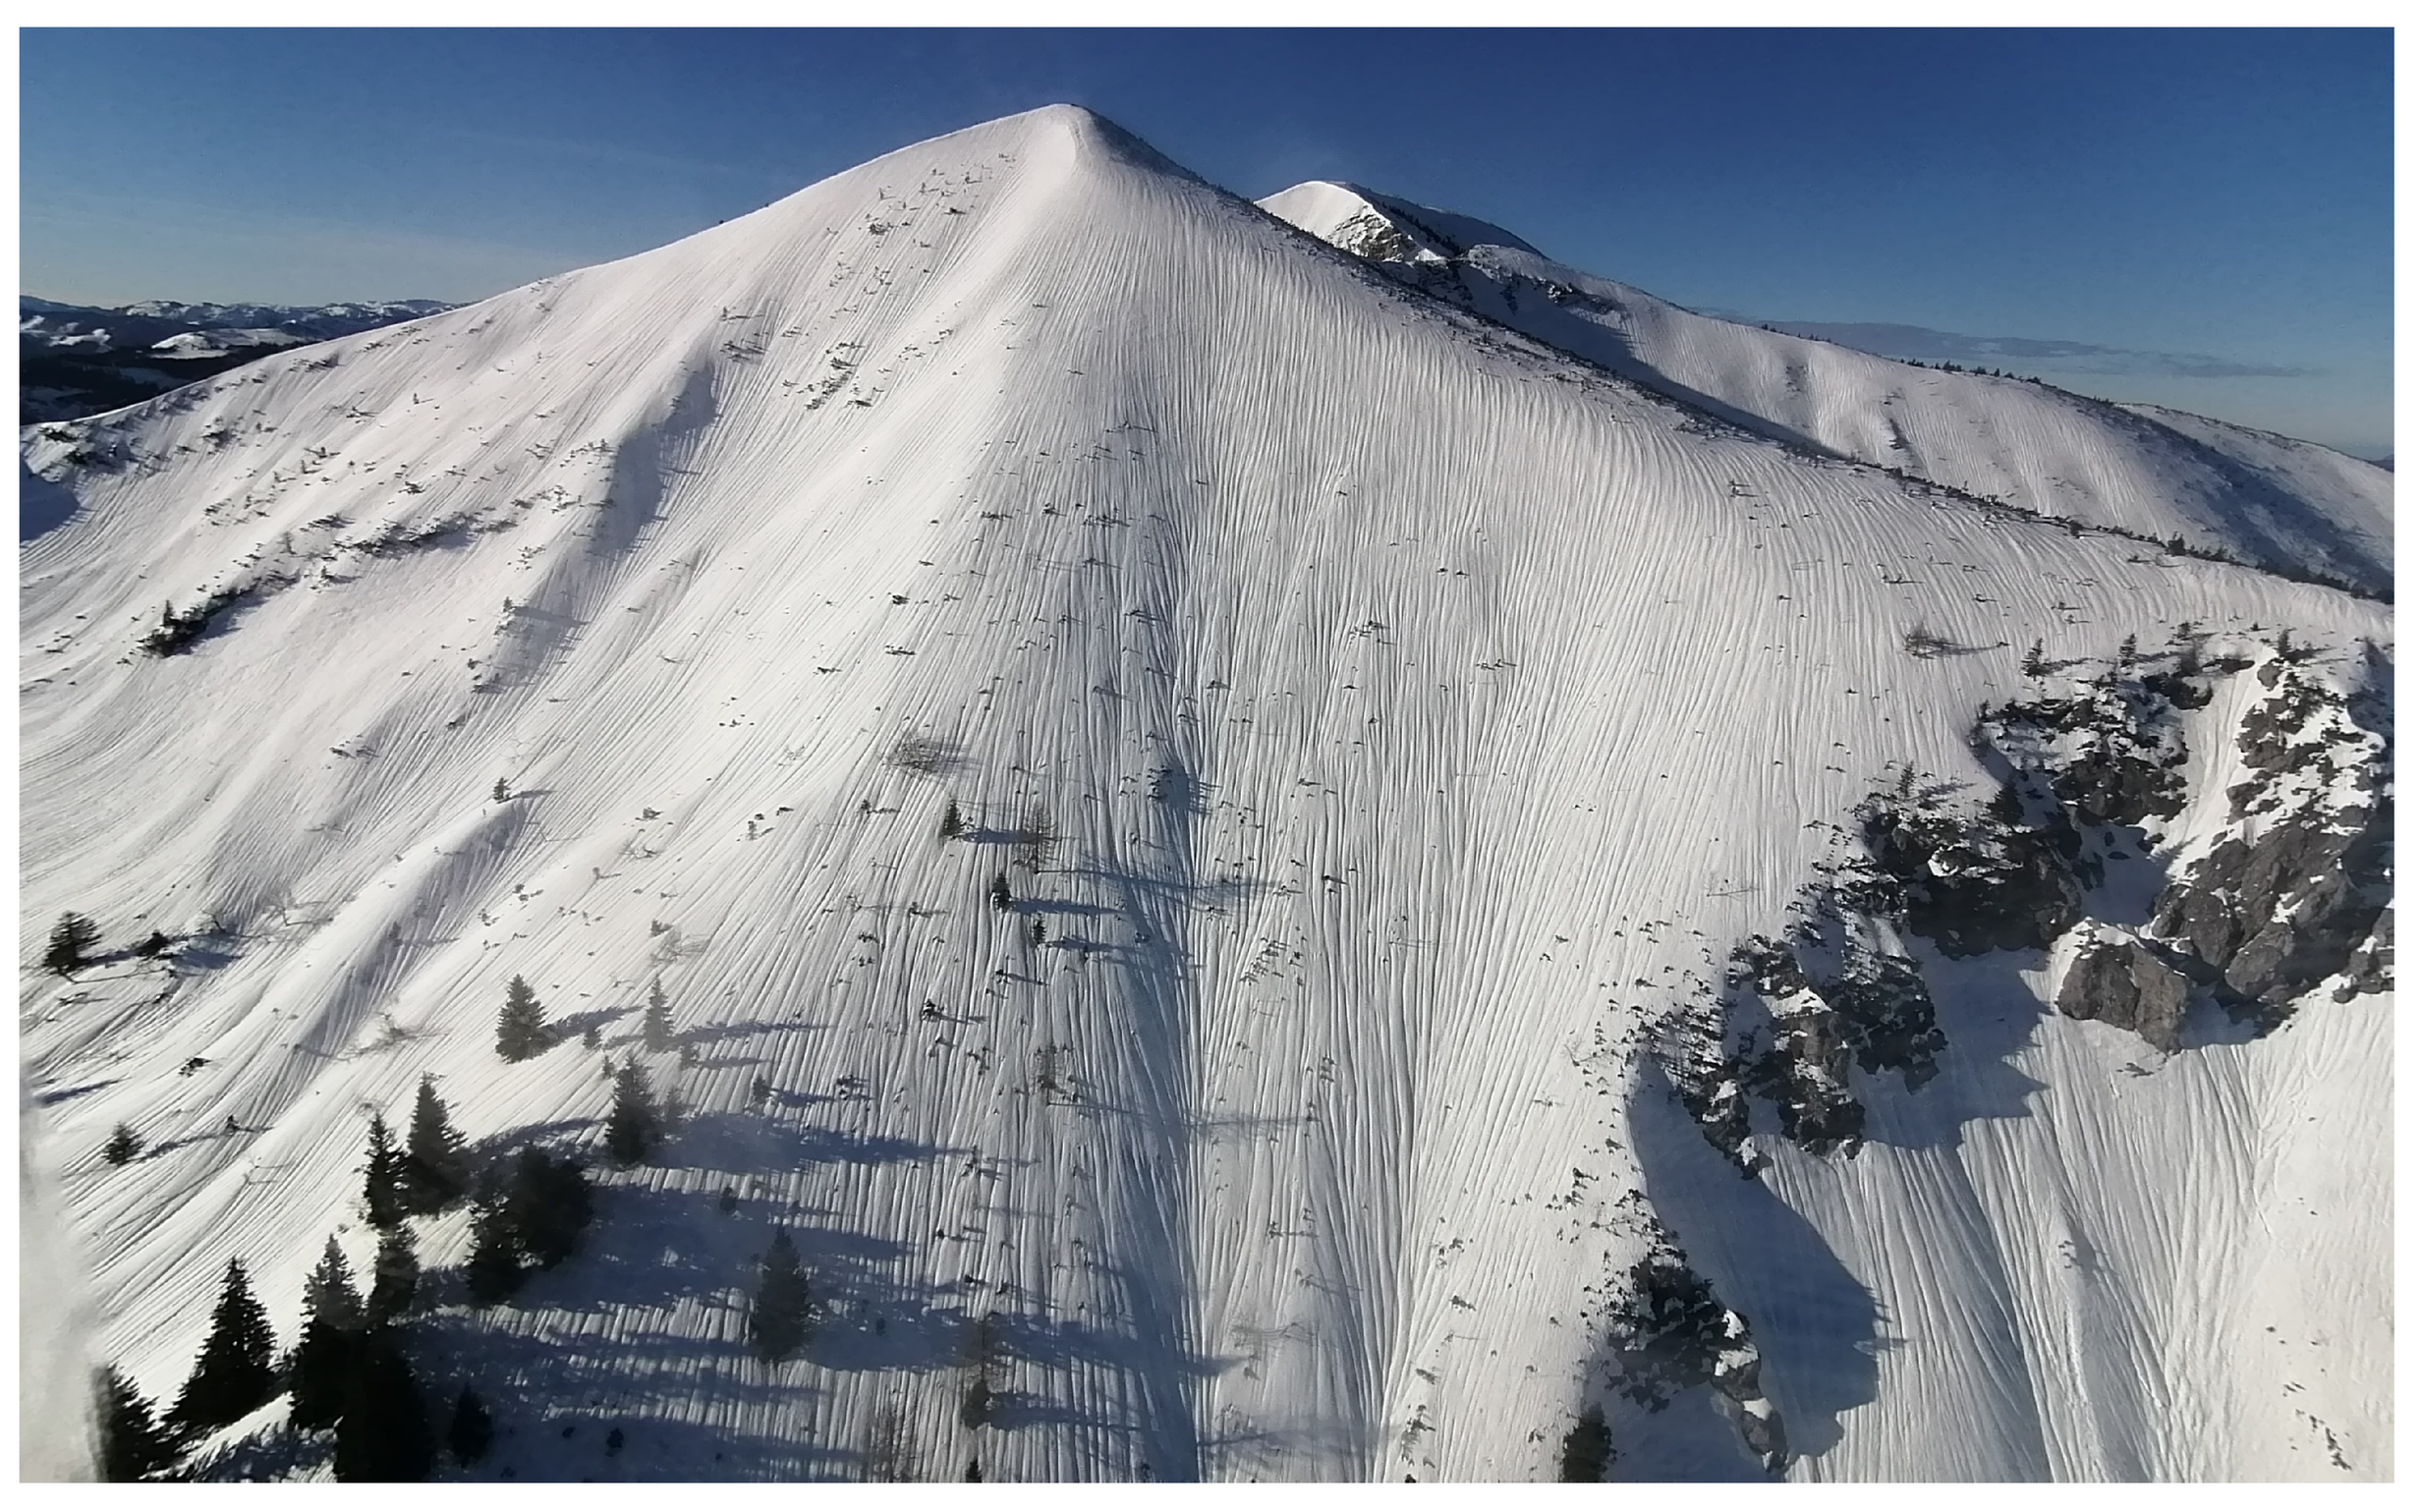
Figure 2.
Overview of observation and measurement sites. Blue triangles mark locations of webcam or third party observations of flow channels, the green star highlights the original observation site of flow channels at Präbichl skiing area by the Avalanche Warning Service Styria, and the red circles mark locations of automatic weather stations (AWS).
Figure 2.
Overview of observation and measurement sites. Blue triangles mark locations of webcam or third party observations of flow channels, the green star highlights the original observation site of flow channels at Präbichl skiing area by the Avalanche Warning Service Styria, and the red circles mark locations of automatic weather stations (AWS).
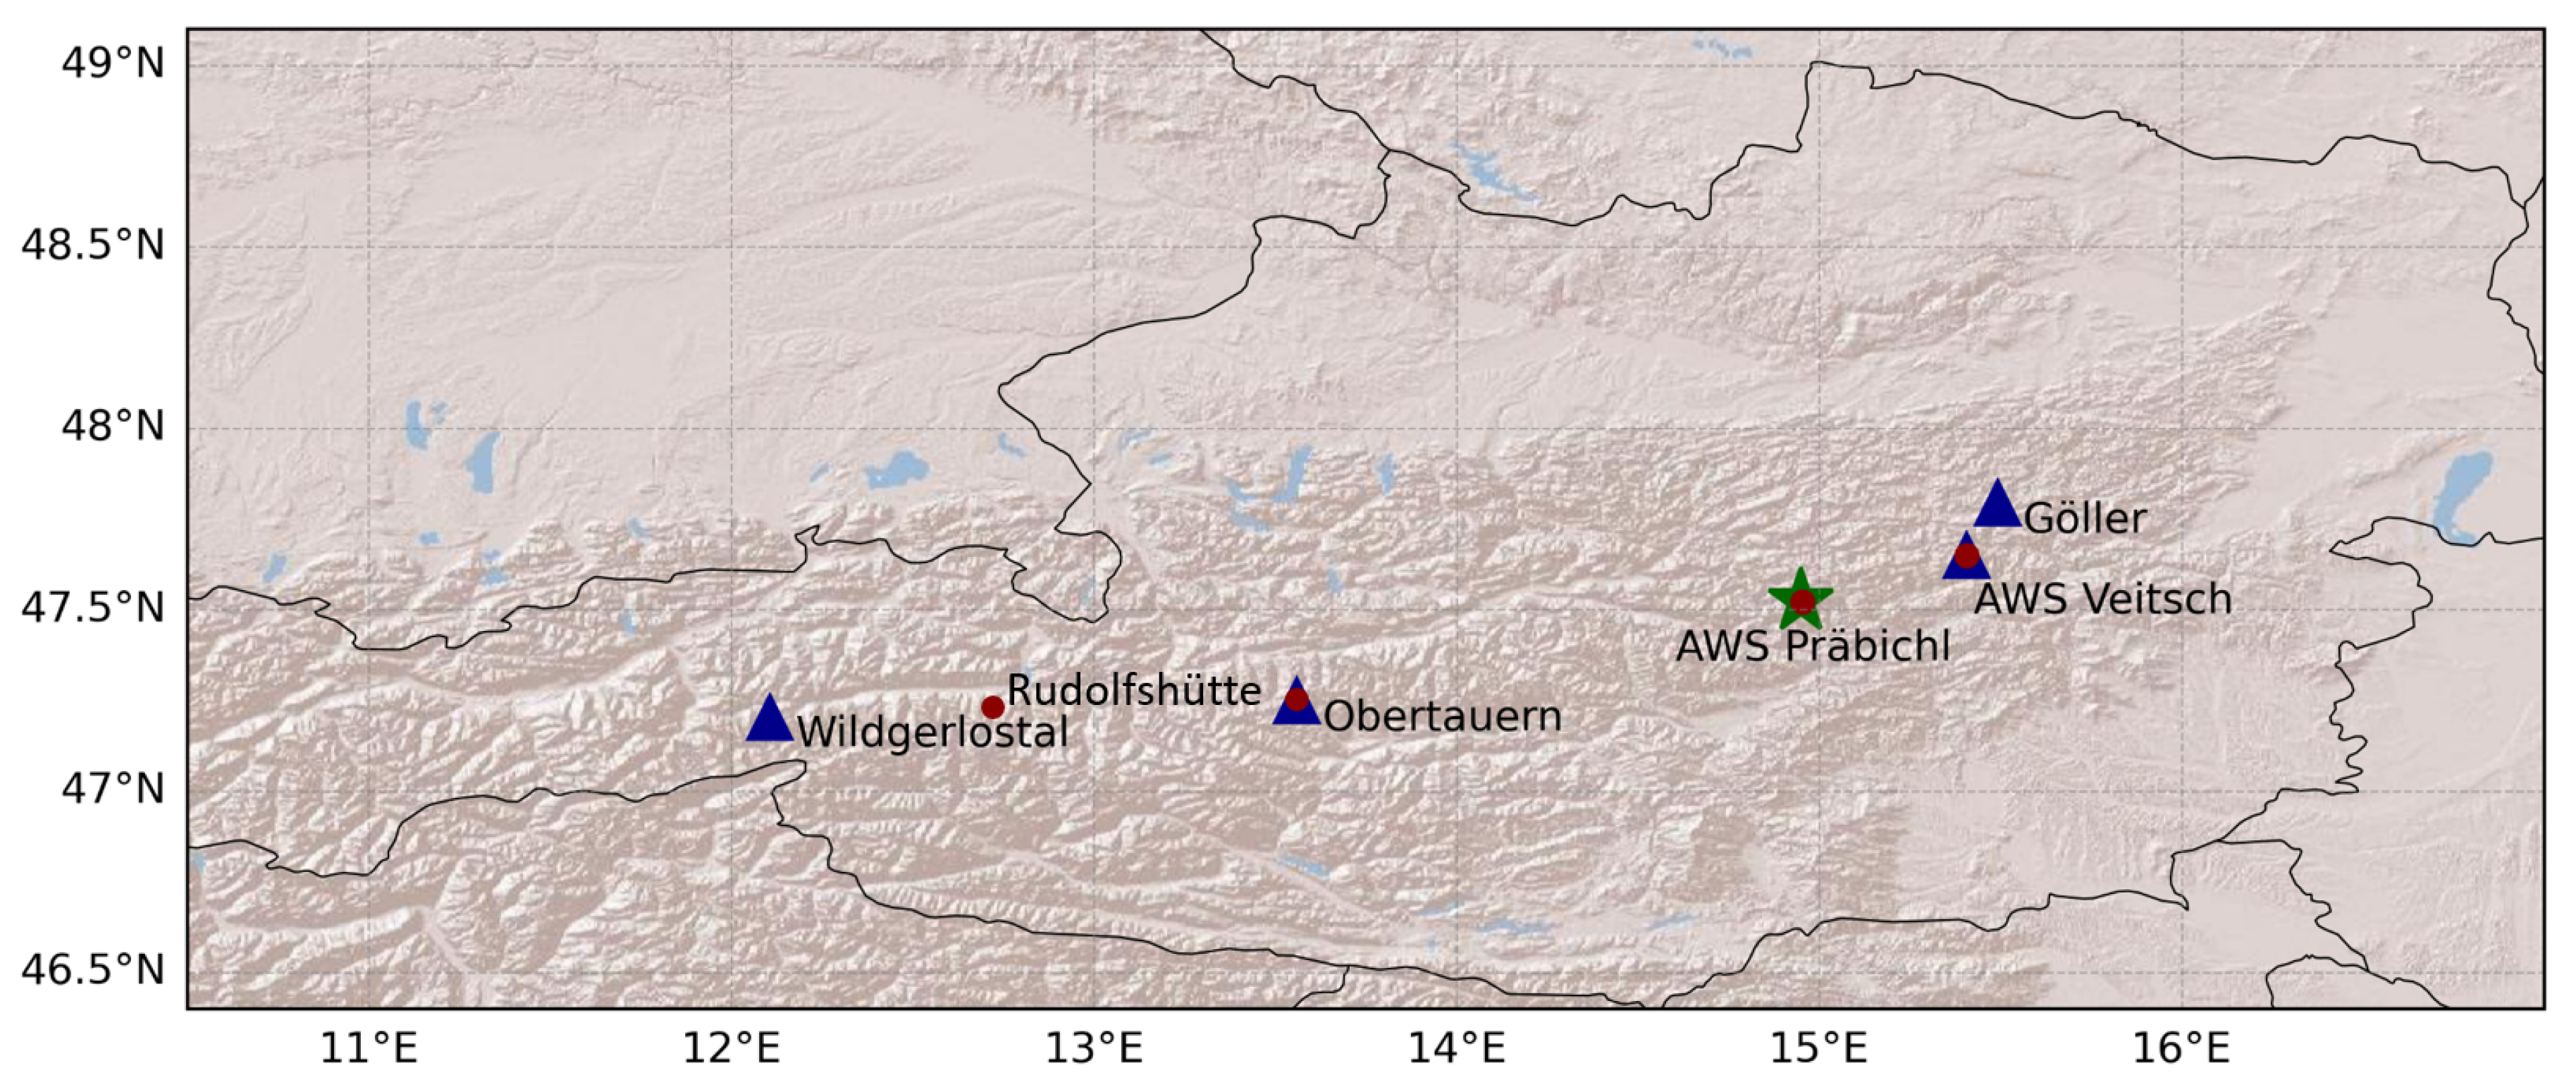
Figure 3.
Meteorological observations from AWS Hohe Veitsch and AWS Präbichl. All meteorological measurements represent the conditions at the snow stations at 1323 m and 1731 m, respectively. Only the wind measurements were recorded at higher elevations, as described in the data description (Section 2.1). The shaded region highlights the specific period analyzed in this case study. The lowermost panel compares measured precipitation (mm), recorded at 1214 m with measured snow height (cm).
Figure 3.
Meteorological observations from AWS Hohe Veitsch and AWS Präbichl. All meteorological measurements represent the conditions at the snow stations at 1323 m and 1731 m, respectively. Only the wind measurements were recorded at higher elevations, as described in the data description (Section 2.1). The shaded region highlights the specific period analyzed in this case study. The lowermost panel compares measured precipitation (mm), recorded at 1214 m with measured snow height (cm).
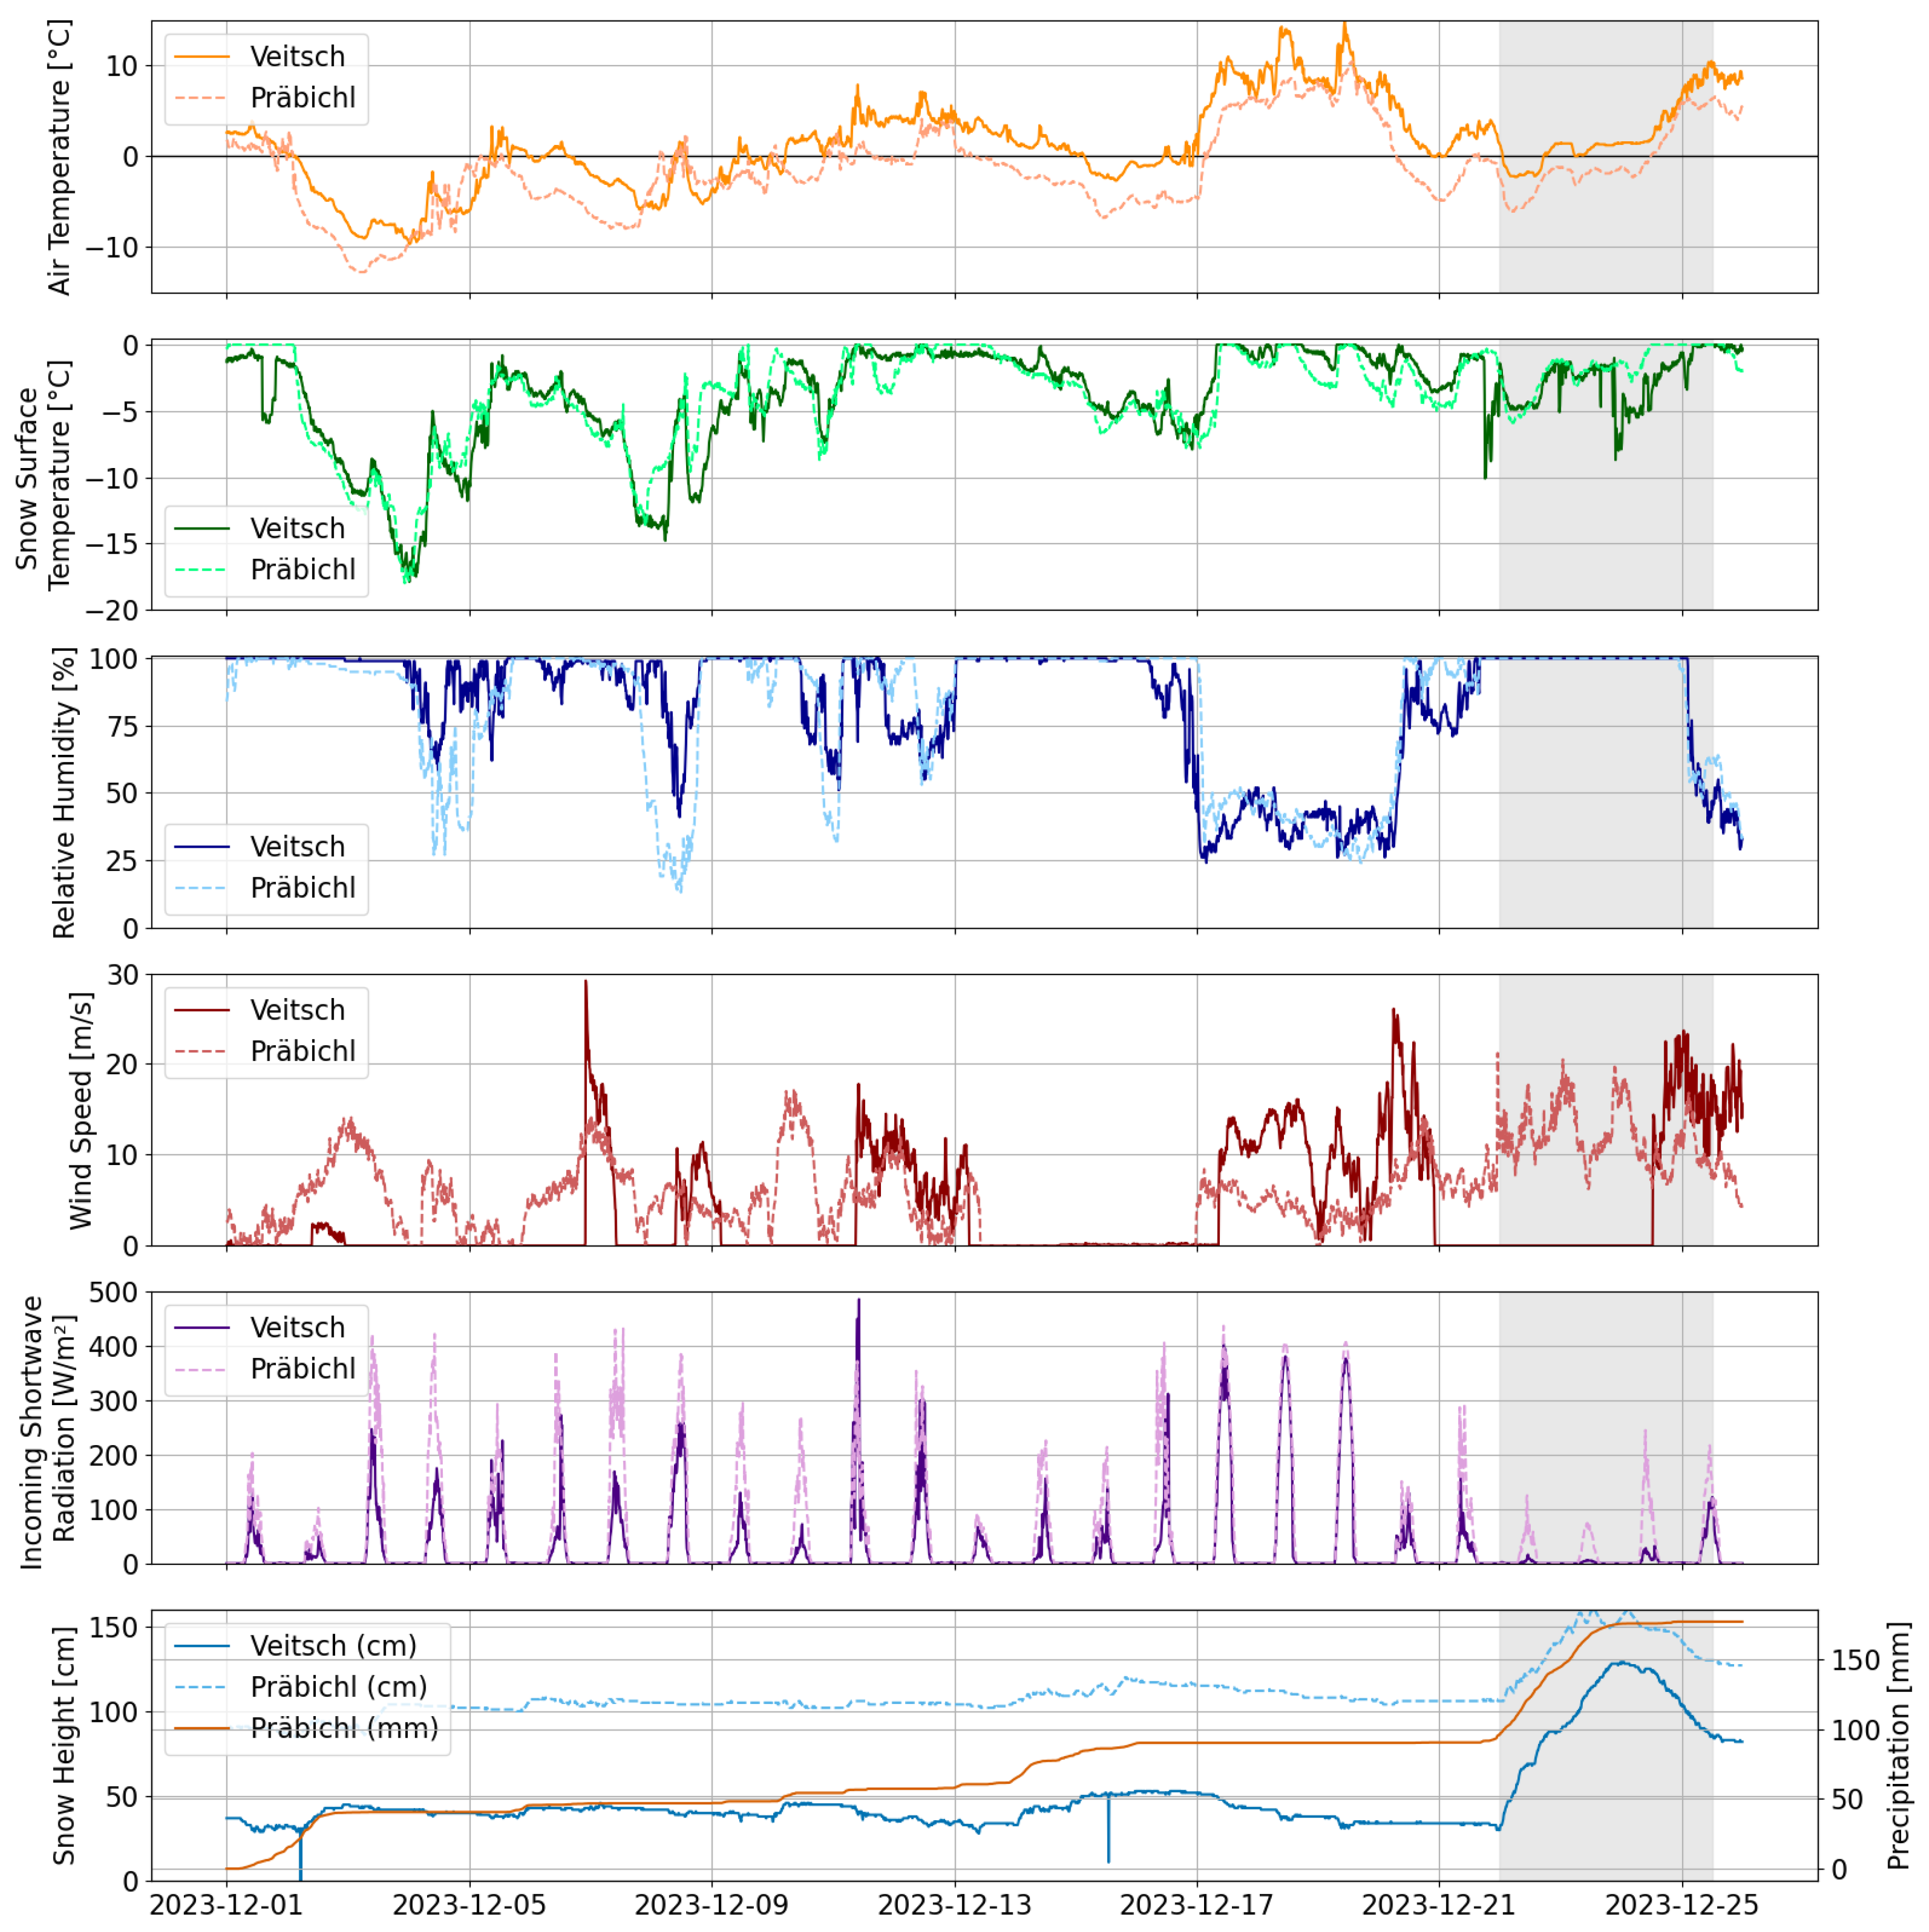
Figure 4.
Overview of air temperature and precipitation measurements from west (Rudolfshütte) to east (Präbichl). The main snowfall event occurred between 22 December 2023 and 23 December 2023, with a snowfall level at approximately 1500 m. From 24 December 2023 onward, air temperatures began to rise with the inflow of warm air masses, while only a few millimeters of precipitation were recorded during this warmer period.
Figure 4.
Overview of air temperature and precipitation measurements from west (Rudolfshütte) to east (Präbichl). The main snowfall event occurred between 22 December 2023 and 23 December 2023, with a snowfall level at approximately 1500 m. From 24 December 2023 onward, air temperatures began to rise with the inflow of warm air masses, while only a few millimeters of precipitation were recorded during this warmer period.
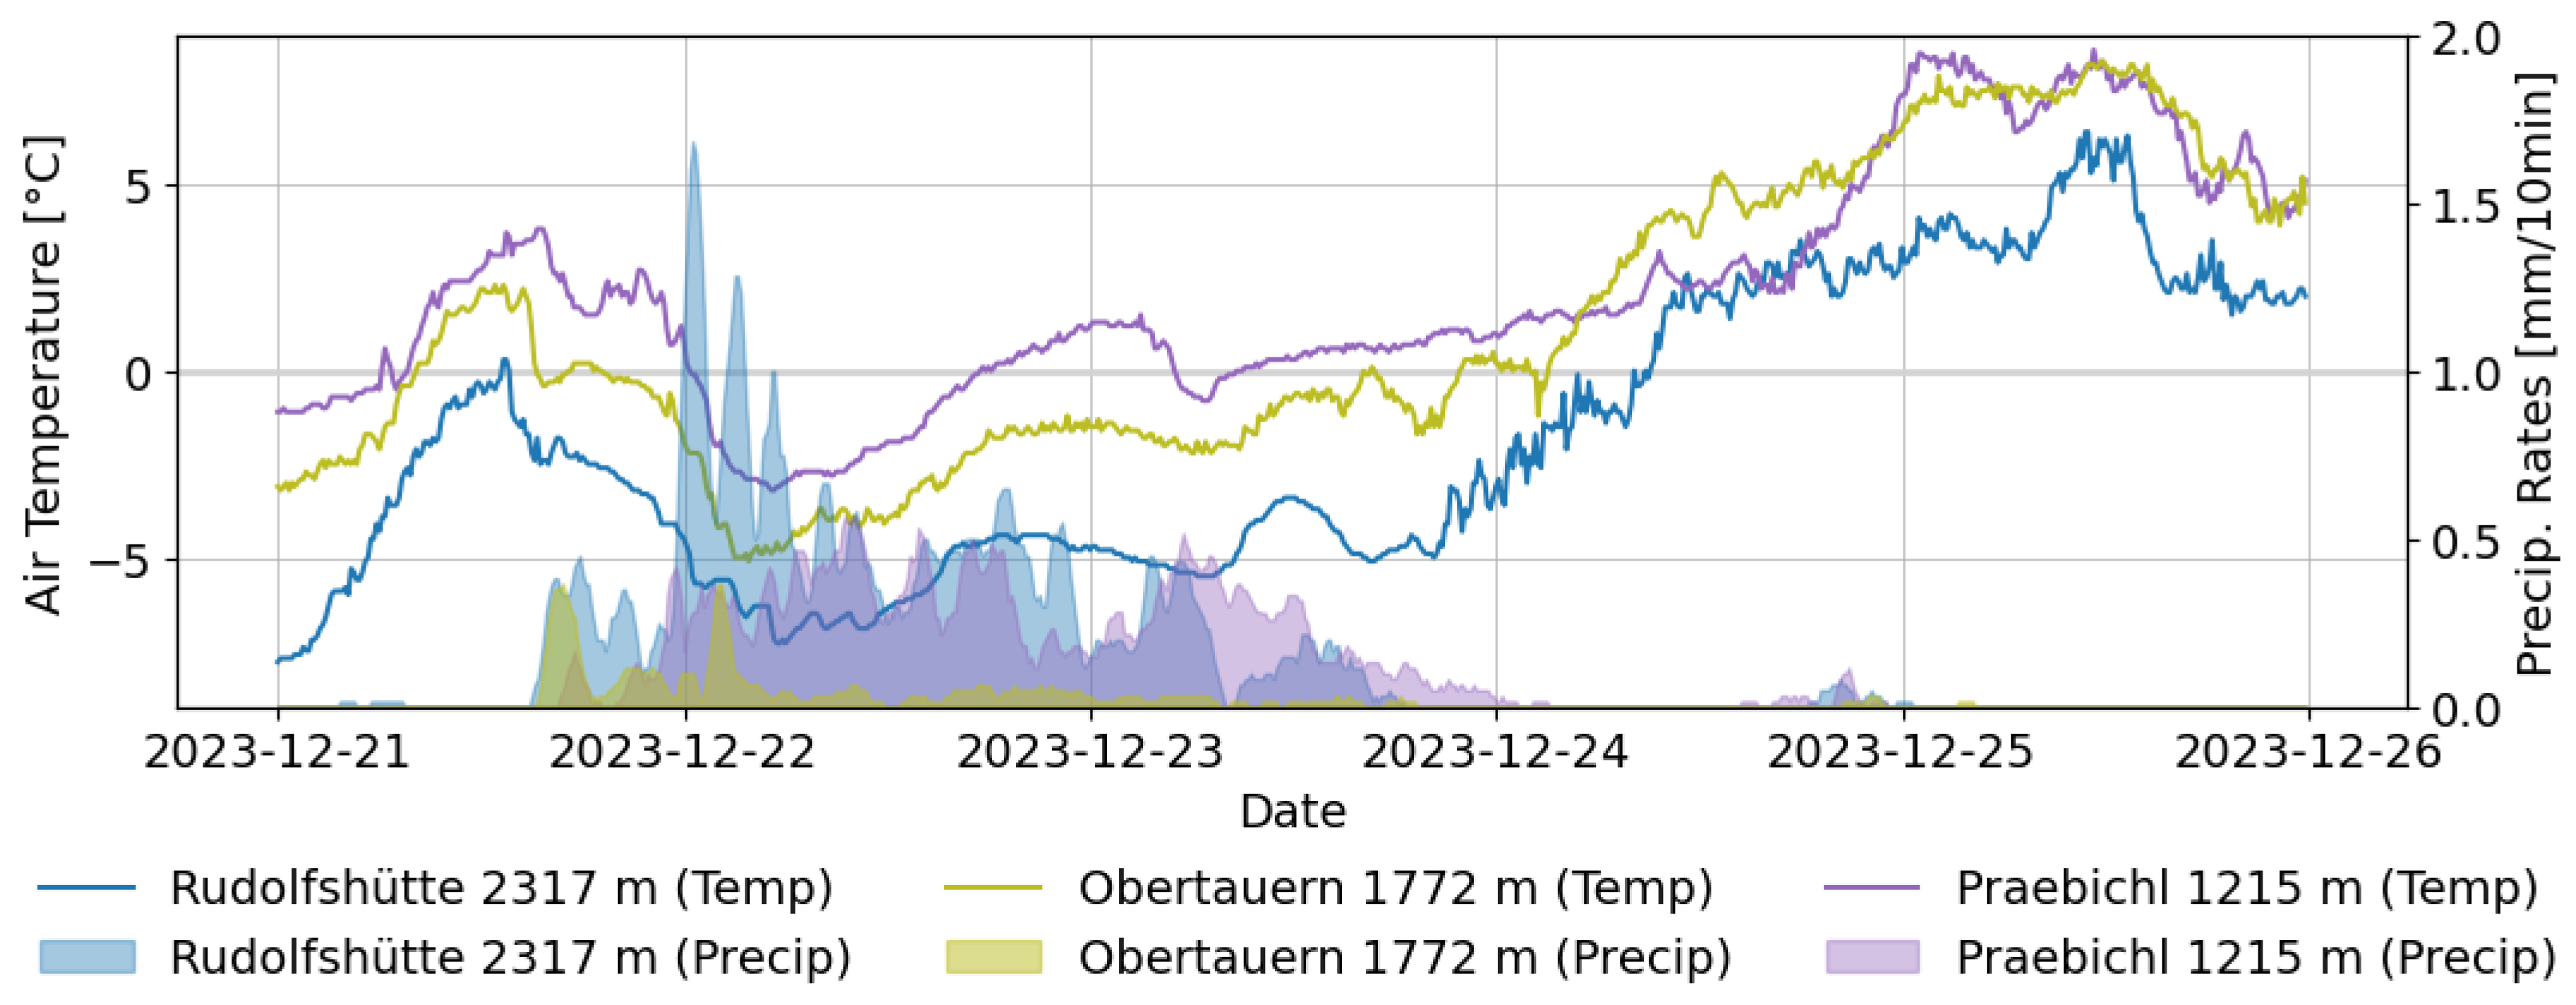
Figure 5.
A manually observed snow profile, recorded on 23 December 2023 by a local avalanche commissioner in a side valley (Radmer) near the Präbichl ski resort at 1324 m on an easterly slope with a slope angle, reveals a compact basal snow layer characterized by a hard layer of melt forms and melt-freeze crust. Above this base, multiple layers consist of alternating melt-freeze crusts and degrading faceted crystals. The uppermost layer comprises approximately 50 cm of new snow, deposited since 22 December 2023. Moisture levels range from slightly moist to moist across the various layers.
Figure 5.
A manually observed snow profile, recorded on 23 December 2023 by a local avalanche commissioner in a side valley (Radmer) near the Präbichl ski resort at 1324 m on an easterly slope with a slope angle, reveals a compact basal snow layer characterized by a hard layer of melt forms and melt-freeze crust. Above this base, multiple layers consist of alternating melt-freeze crusts and degrading faceted crystals. The uppermost layer comprises approximately 50 cm of new snow, deposited since 22 December 2023. Moisture levels range from slightly moist to moist across the various layers.
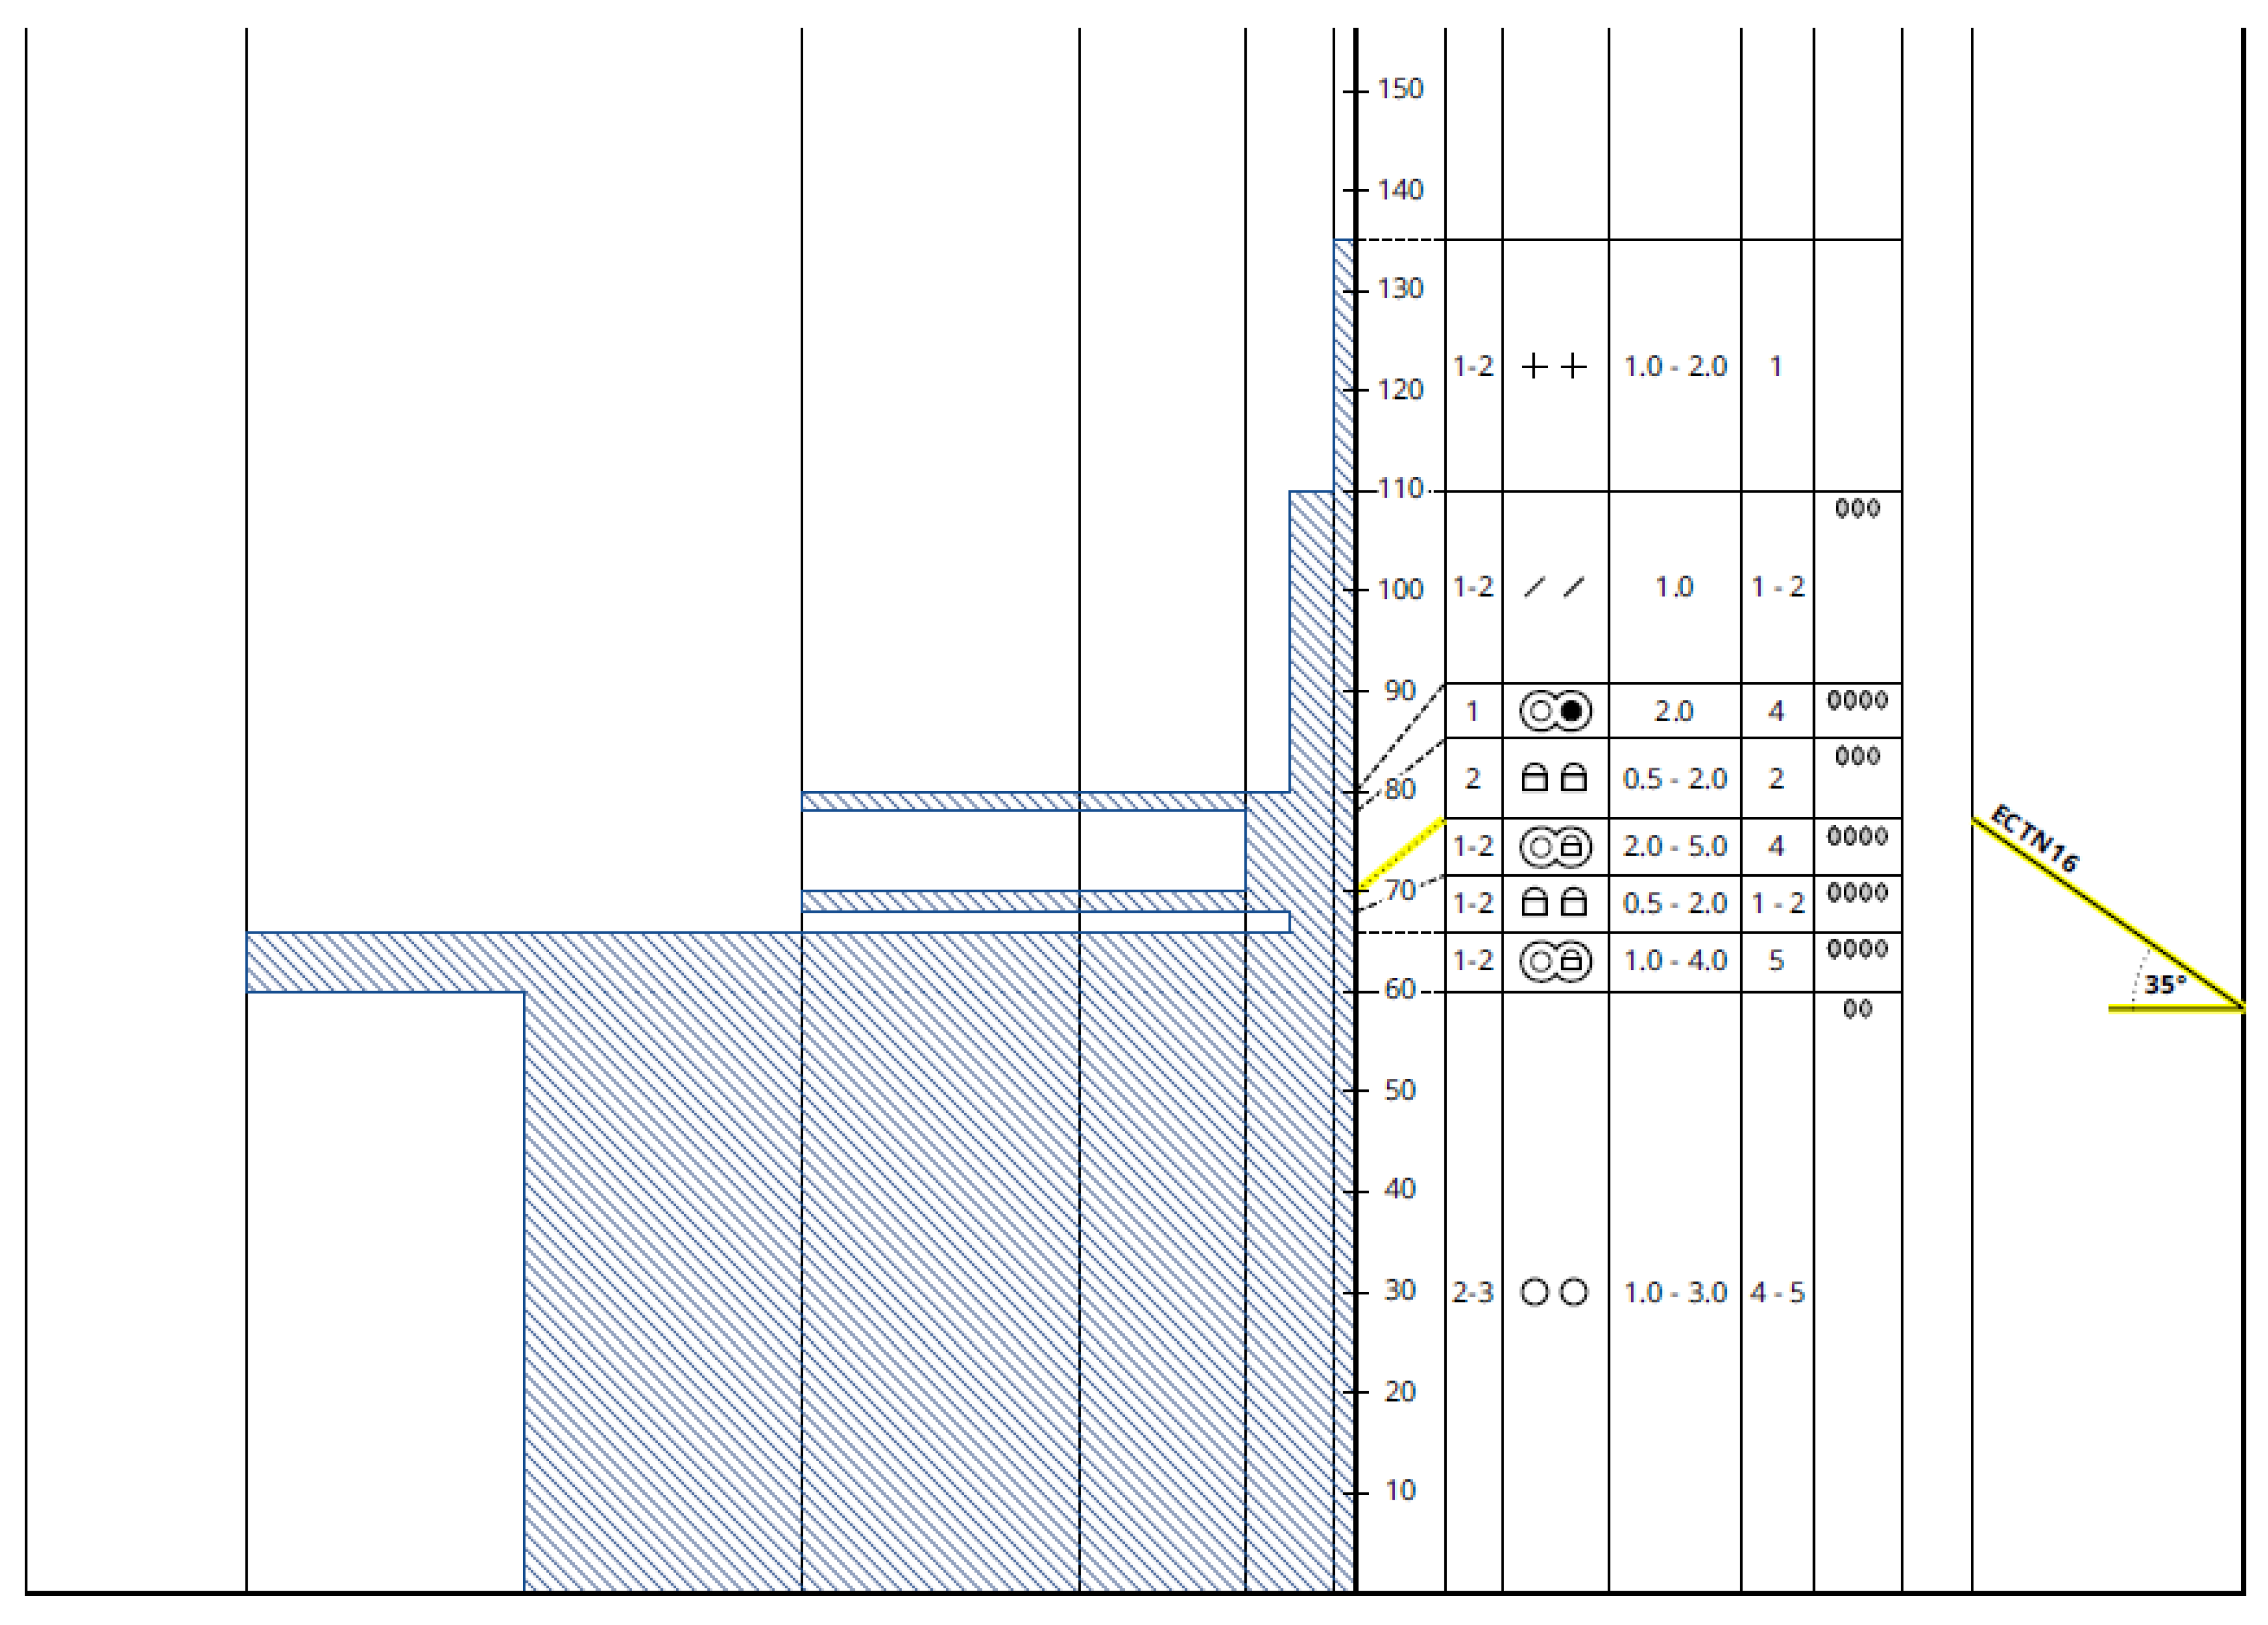
Figure 6.
A manually observed snow profile, recorded on 25.12.2023 on Vordernberger Griesmauer near the Präbichl ski resort at an elevation of 1720 m on a southerly slope with an angle, reveals a compact basal layer consisting of melt-freeze crust. Above this base lies a thick, layer of compact rounded grains, with reserves of cold content. Overlying this is approx. 40 cm of recently fallen snow, deposited from 22 December 2023 onwards. The fresh snow has already become moist or partially transformed into melt forms. Overnight, a thin melt-freeze crust formed on the snow surface.
Figure 6.
A manually observed snow profile, recorded on 25.12.2023 on Vordernberger Griesmauer near the Präbichl ski resort at an elevation of 1720 m on a southerly slope with an angle, reveals a compact basal layer consisting of melt-freeze crust. Above this base lies a thick, layer of compact rounded grains, with reserves of cold content. Overlying this is approx. 40 cm of recently fallen snow, deposited from 22 December 2023 onwards. The fresh snow has already become moist or partially transformed into melt forms. Overnight, a thin melt-freeze crust formed on the snow surface.
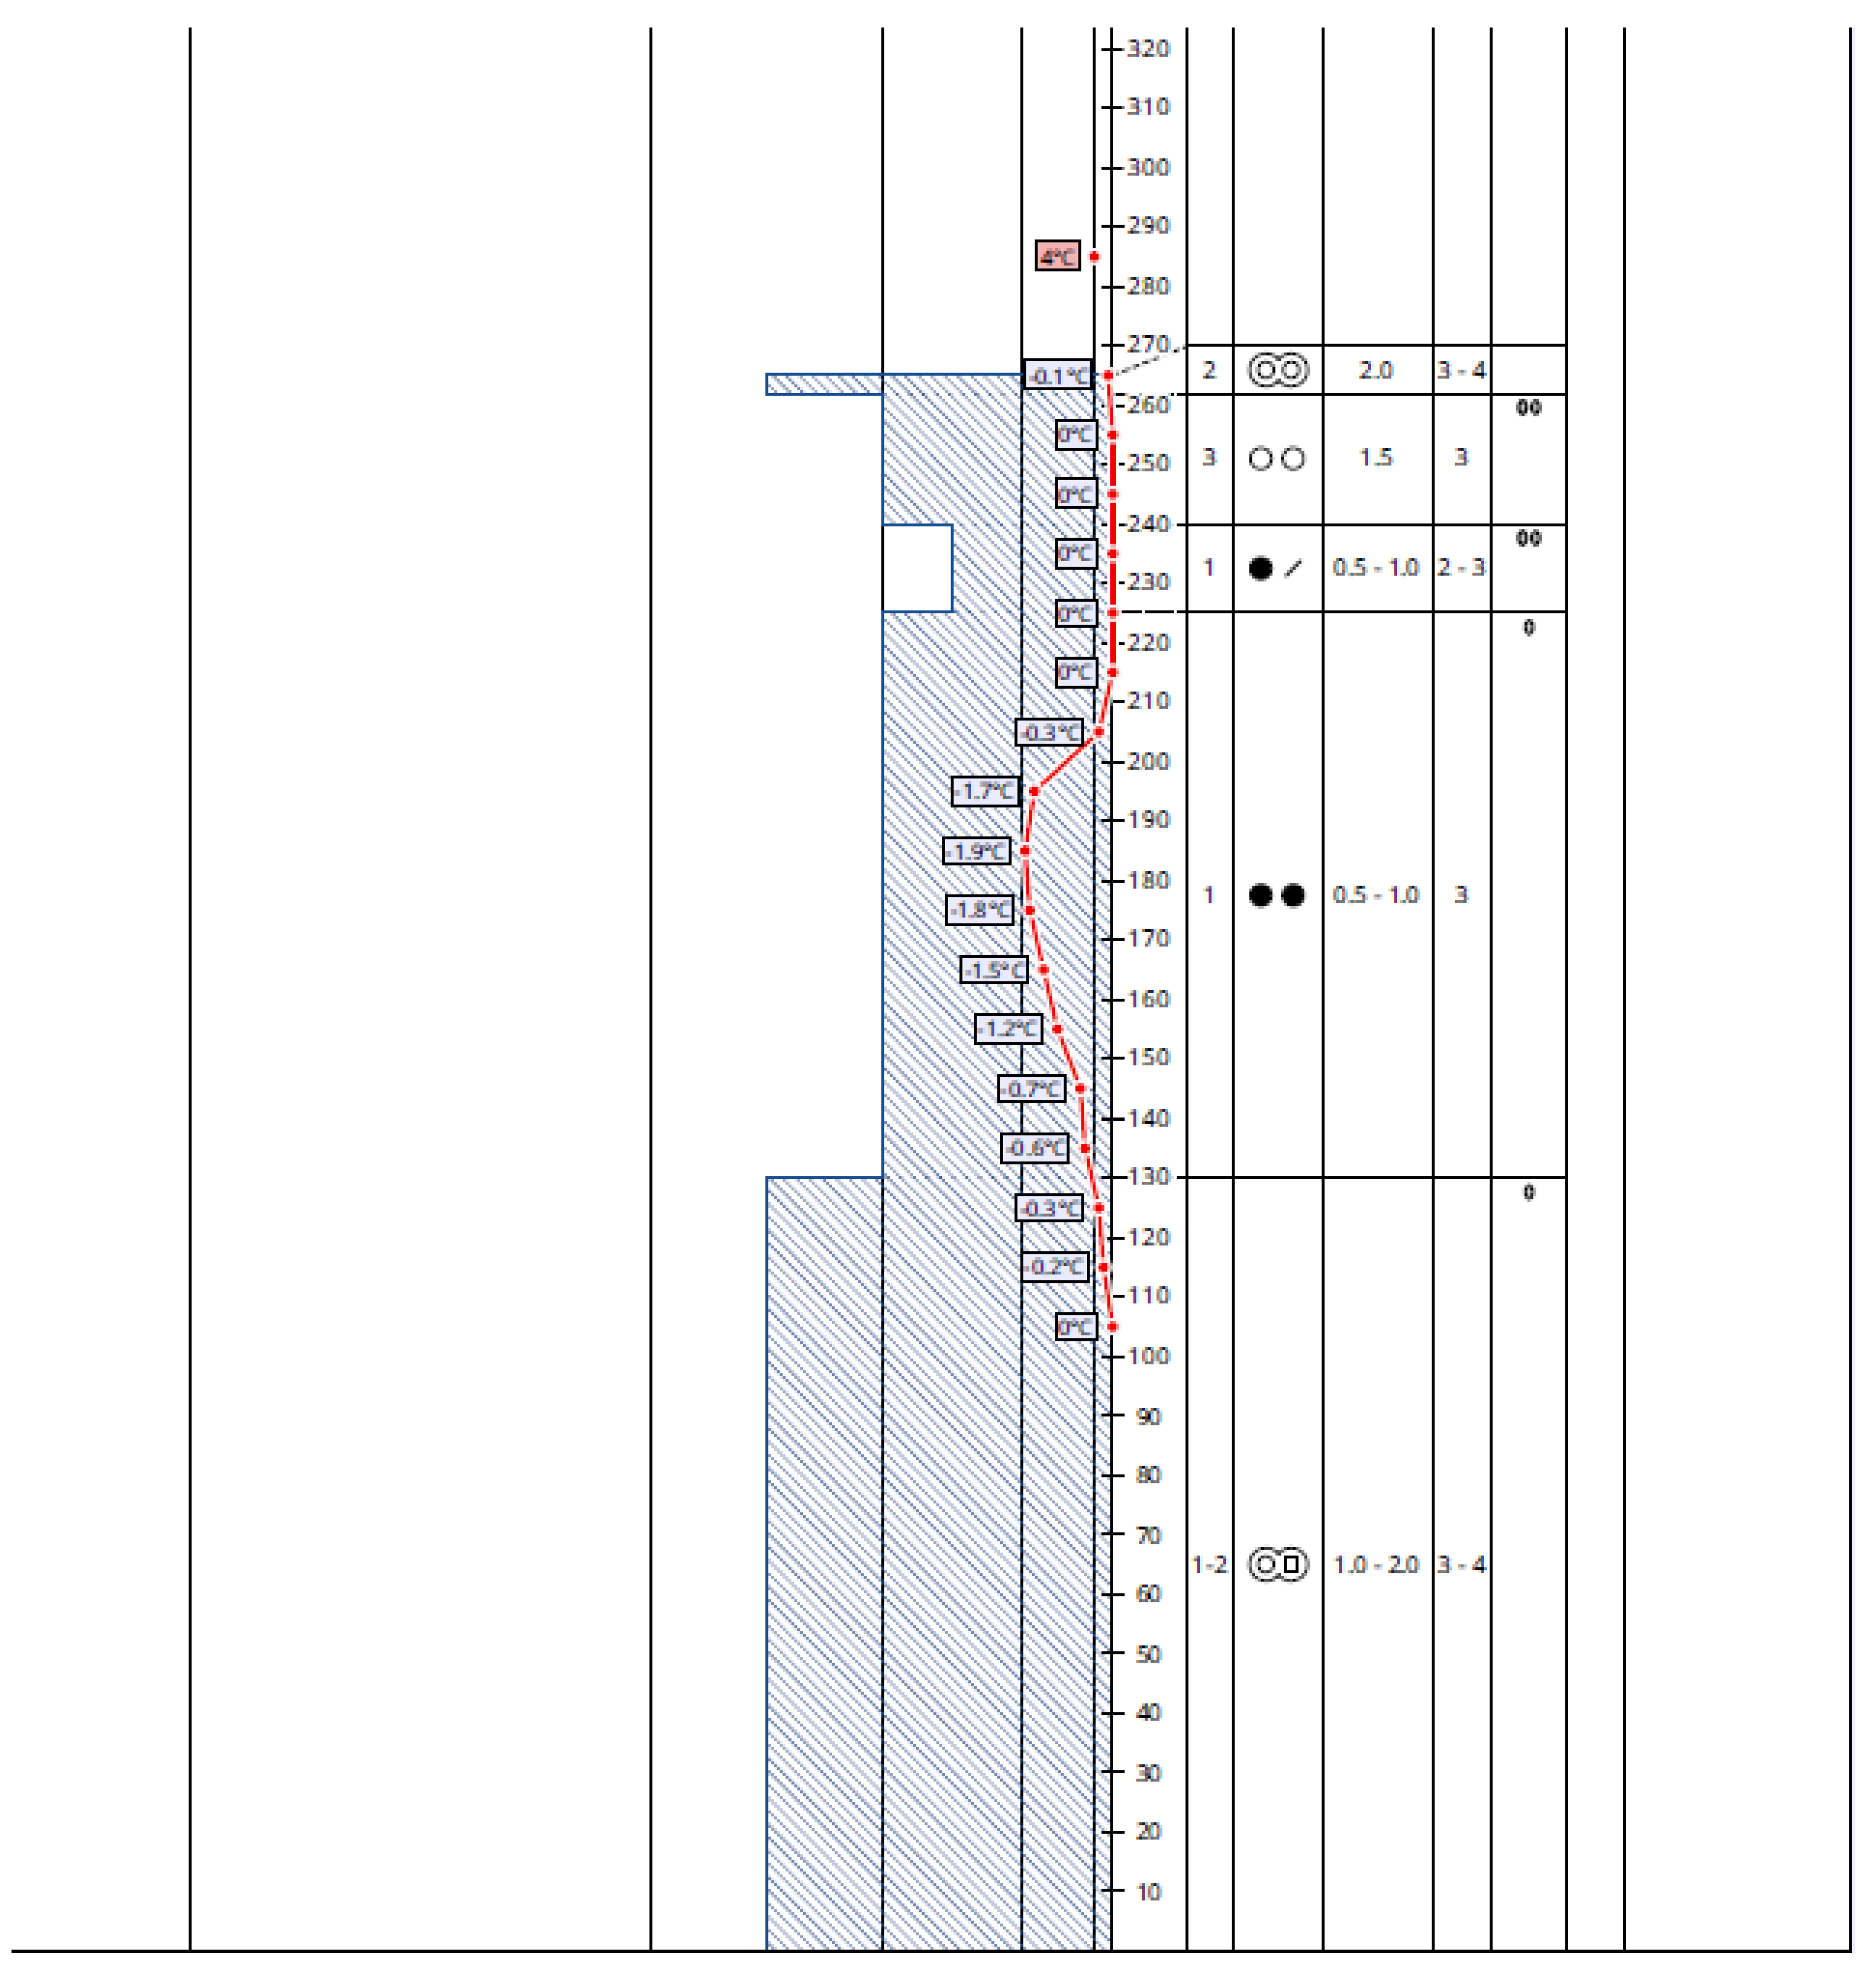
Figure 7.
Webcam imagery from the Brunnalm/Hohe Veitsch skiing area, capturing terrain at elevations ranging from approximately 1600 m to 1700 m. The upper panel displays a webcam image from 24 December 2023 at 10:00 CET, showing an undisturbed, evenly distributed fresh snow surface following the snowfall event that concluded during the previous night. The lower panel shows a webcam image from 25 December 2023 at 09:00 CET, revealing the development of well-defined flow channels on the snow surface. Images with friendly permission form the skiing area Brunnalm/Hohe Veitsch, 2023.
Figure 7.
Webcam imagery from the Brunnalm/Hohe Veitsch skiing area, capturing terrain at elevations ranging from approximately 1600 m to 1700 m. The upper panel displays a webcam image from 24 December 2023 at 10:00 CET, showing an undisturbed, evenly distributed fresh snow surface following the snowfall event that concluded during the previous night. The lower panel shows a webcam image from 25 December 2023 at 09:00 CET, revealing the development of well-defined flow channels on the snow surface. Images with friendly permission form the skiing area Brunnalm/Hohe Veitsch, 2023.
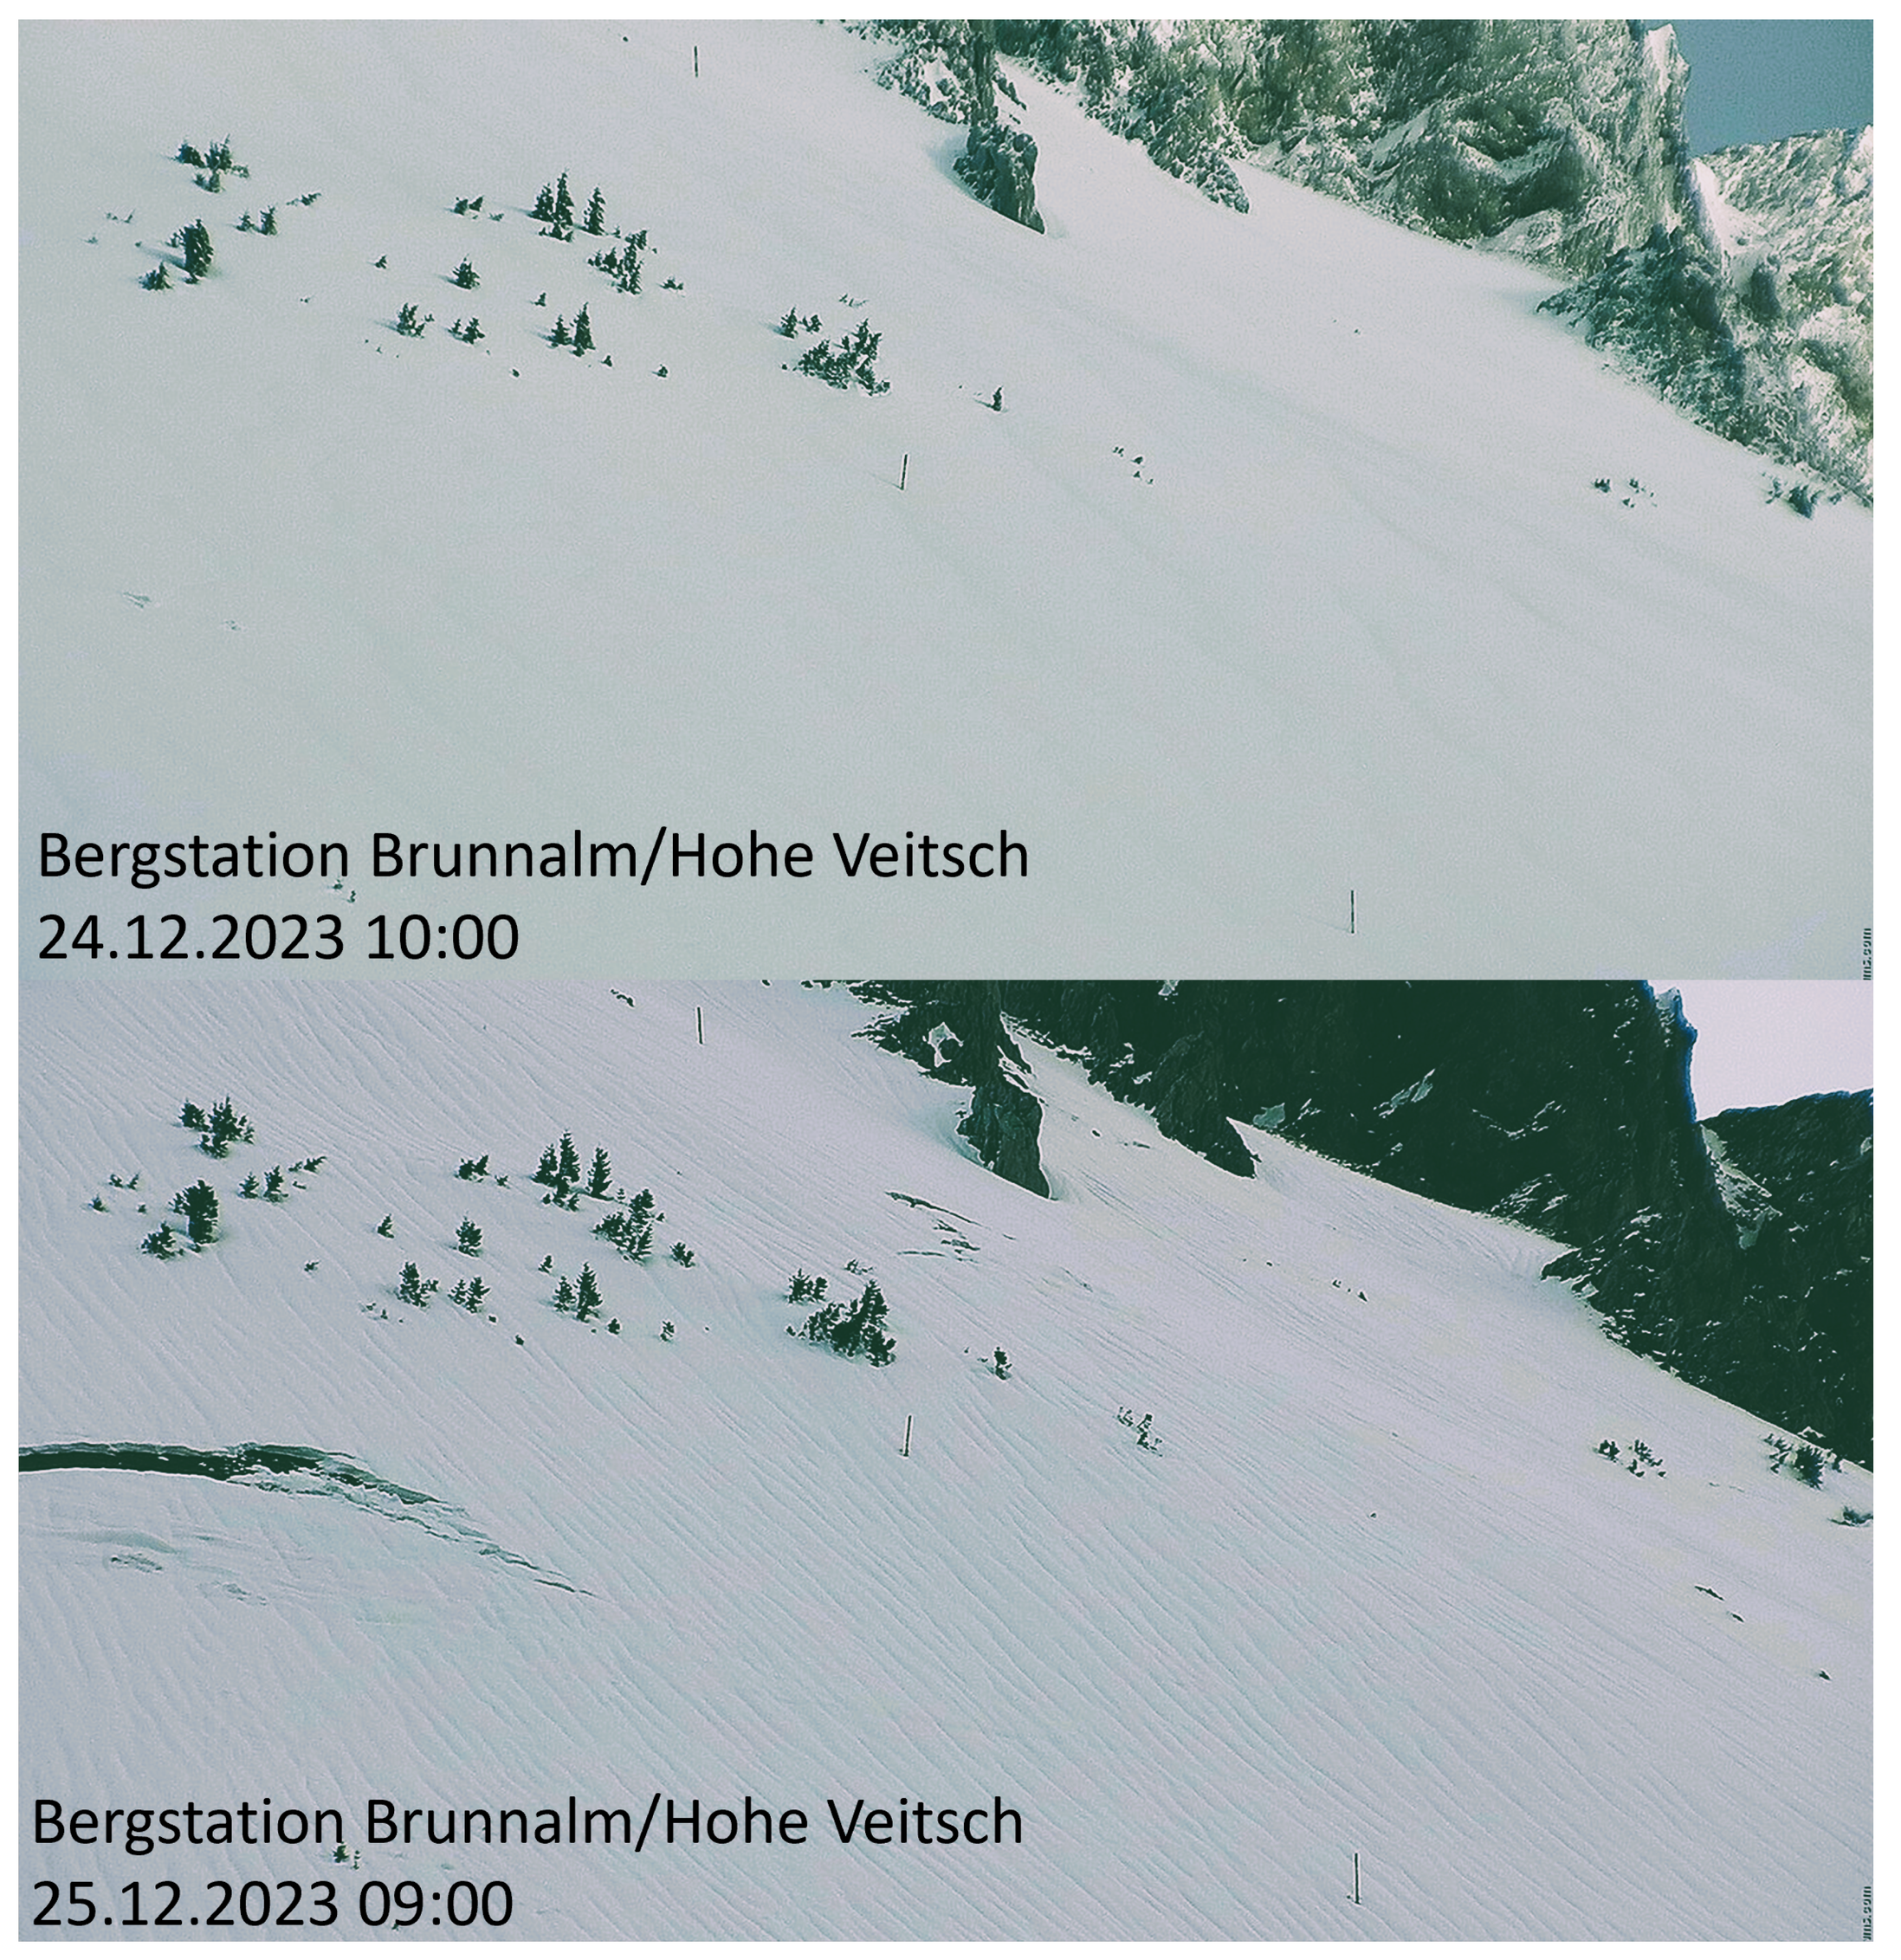
Figure 8.
Webcam imagery from the Obertauern skiing area, capturing terrain at elevations ranging from approximately 1800 m to 2000 m. The upper panel displays a webcam image from 24 December 2023 at 10:10 CET, showing an undisturbed, evenly distributed fresh snow surface on the side of the ski slope following the snowfall event of the previous night. The lower panel presents a webcam image taken 24 hours later, revealing the development of pronounced flow channels on the snow surface adjacent to the ski slope, extending up to the peak. Images with friendly permission from https://www.foto-webcam.eu/webcam/obertauern3/, 2023.
Figure 8.
Webcam imagery from the Obertauern skiing area, capturing terrain at elevations ranging from approximately 1800 m to 2000 m. The upper panel displays a webcam image from 24 December 2023 at 10:10 CET, showing an undisturbed, evenly distributed fresh snow surface on the side of the ski slope following the snowfall event of the previous night. The lower panel presents a webcam image taken 24 hours later, revealing the development of pronounced flow channels on the snow surface adjacent to the ski slope, extending up to the peak. Images with friendly permission from https://www.foto-webcam.eu/webcam/obertauern3/, 2023.
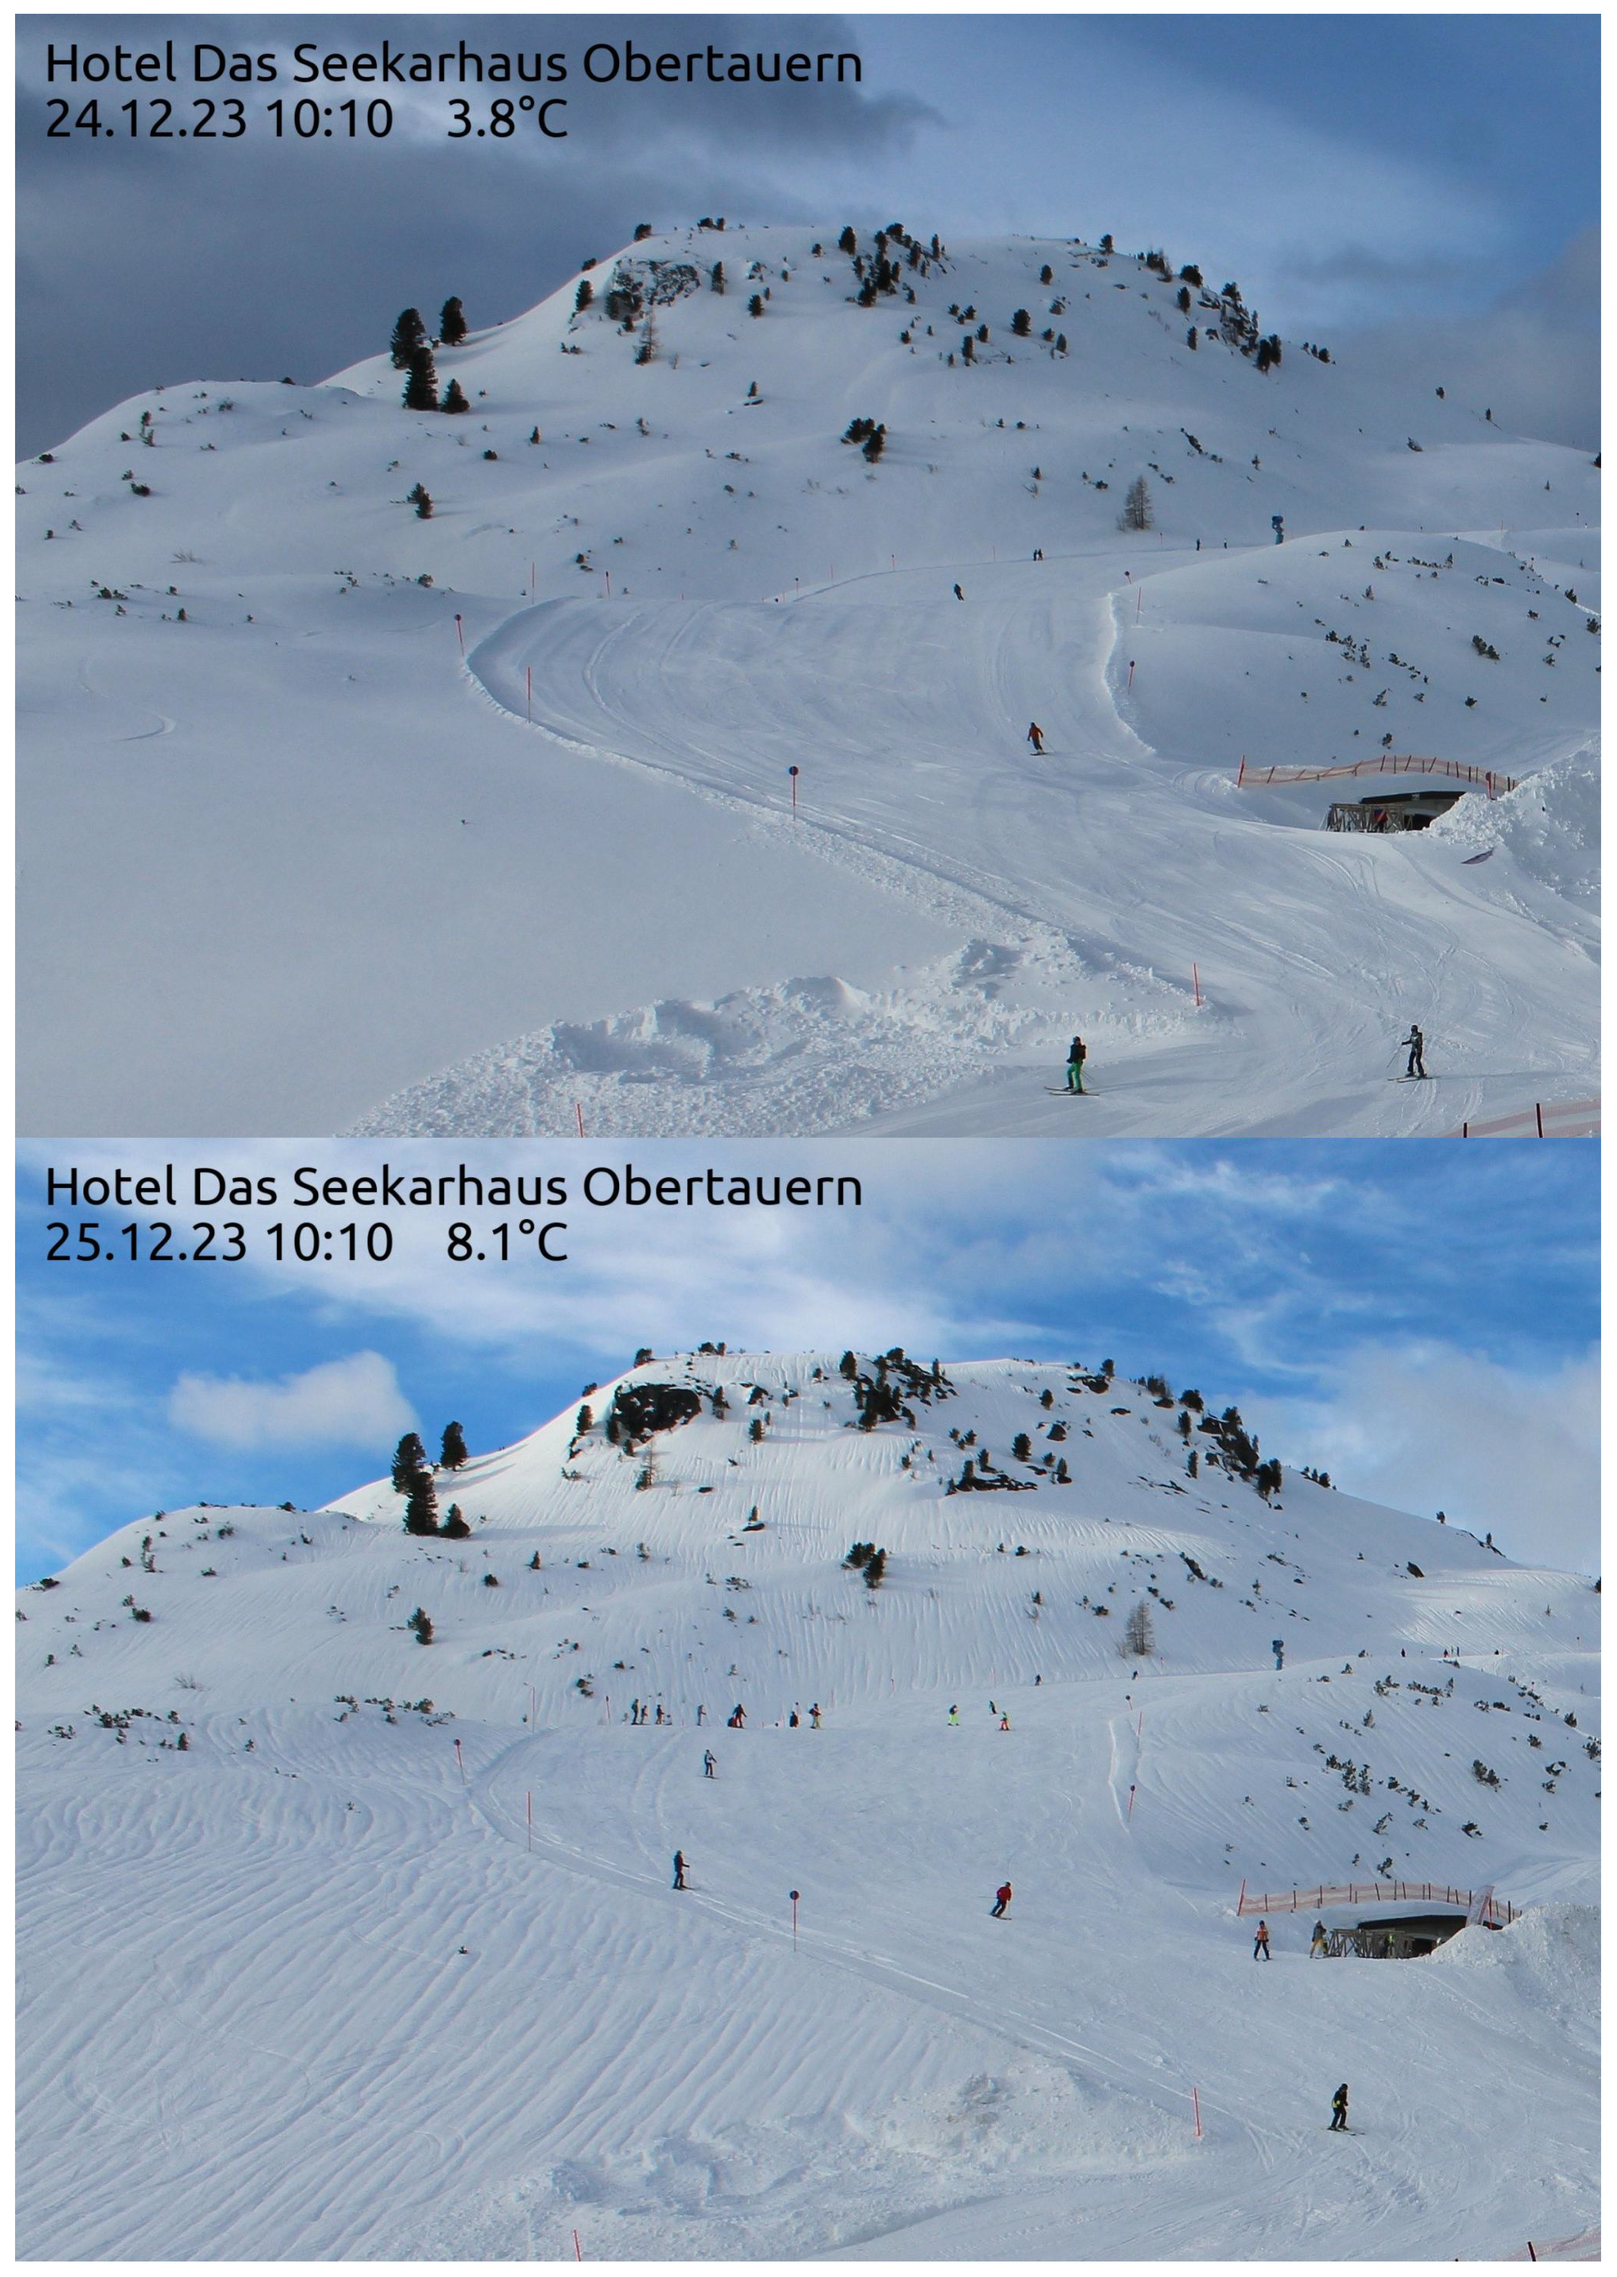
Figure 9.
Flow channels in Wildgerlostal, documented on 26 December 2023 by the Avalanche Warning Service of Salzburg following the recent snowfall event. Photo: GeoSphere Austria, 2023.
Figure 9.
Flow channels in Wildgerlostal, documented on 26 December 2023 by the Avalanche Warning Service of Salzburg following the recent snowfall event. Photo: GeoSphere Austria, 2023.
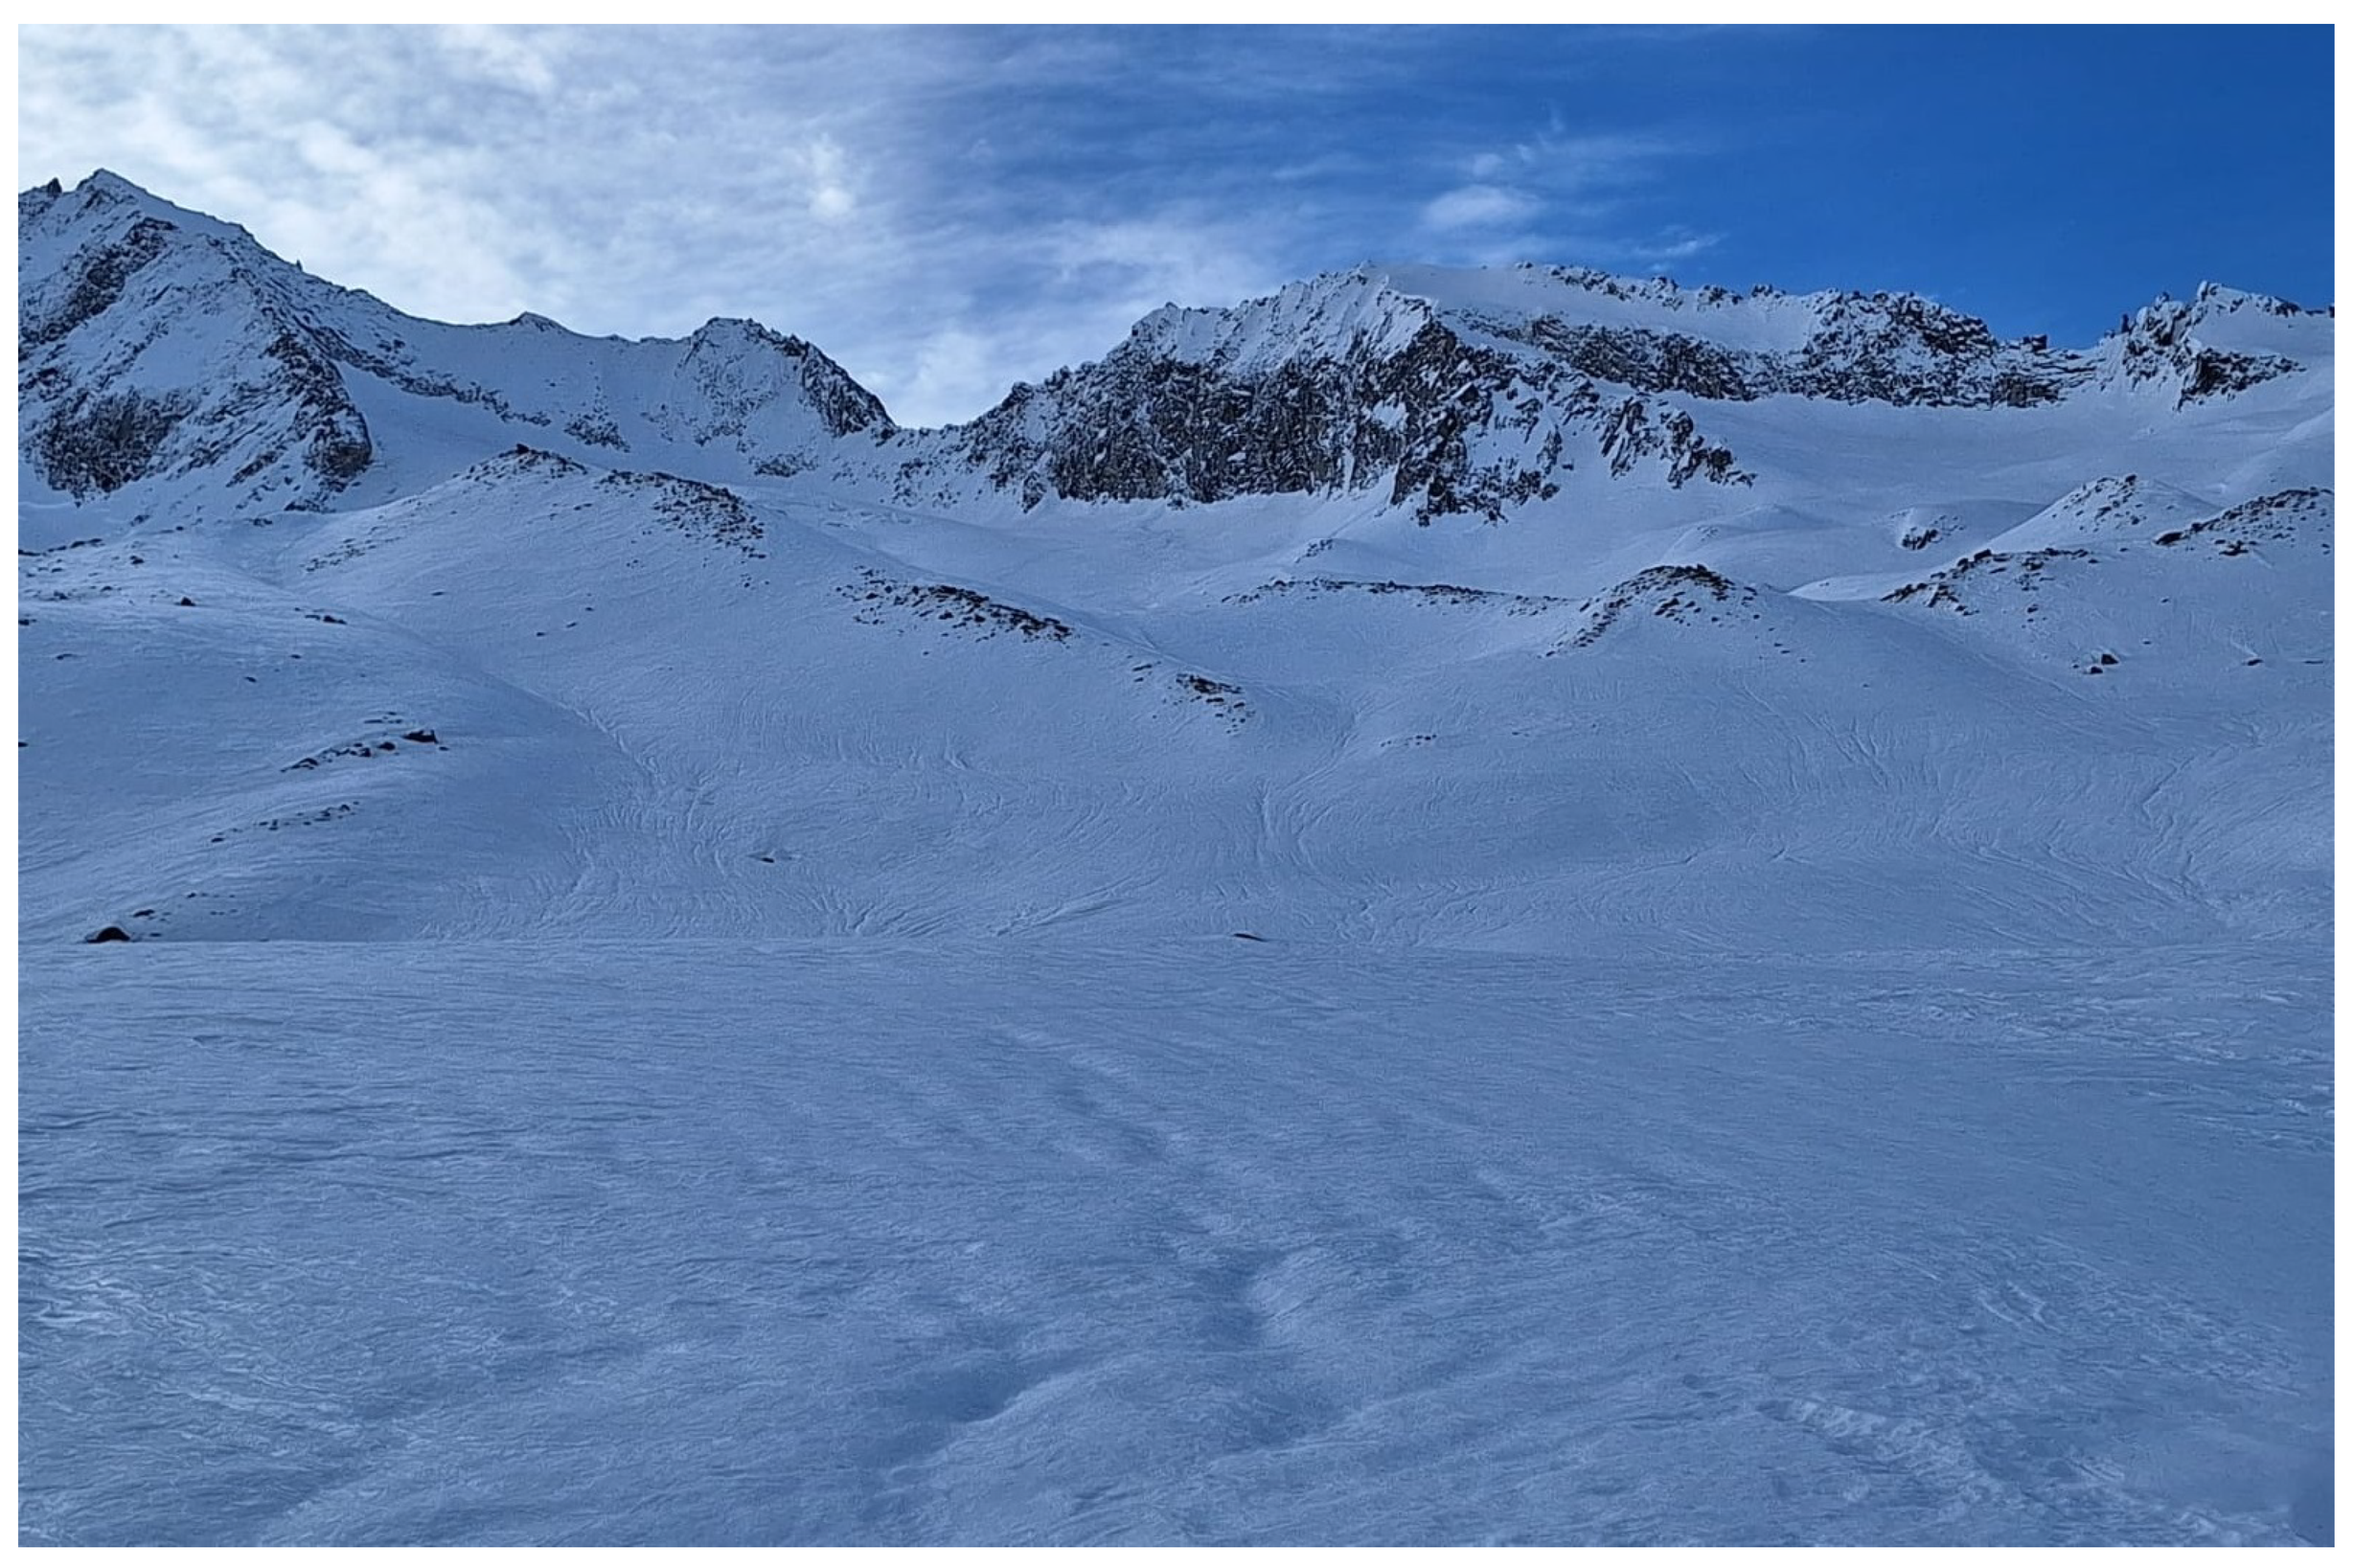
Figure 10.
Surface energy balance terms and calculated snow-melt rates are compared to the measured liquid precipitation rates.
Figure 10.
Surface energy balance terms and calculated snow-melt rates are compared to the measured liquid precipitation rates.
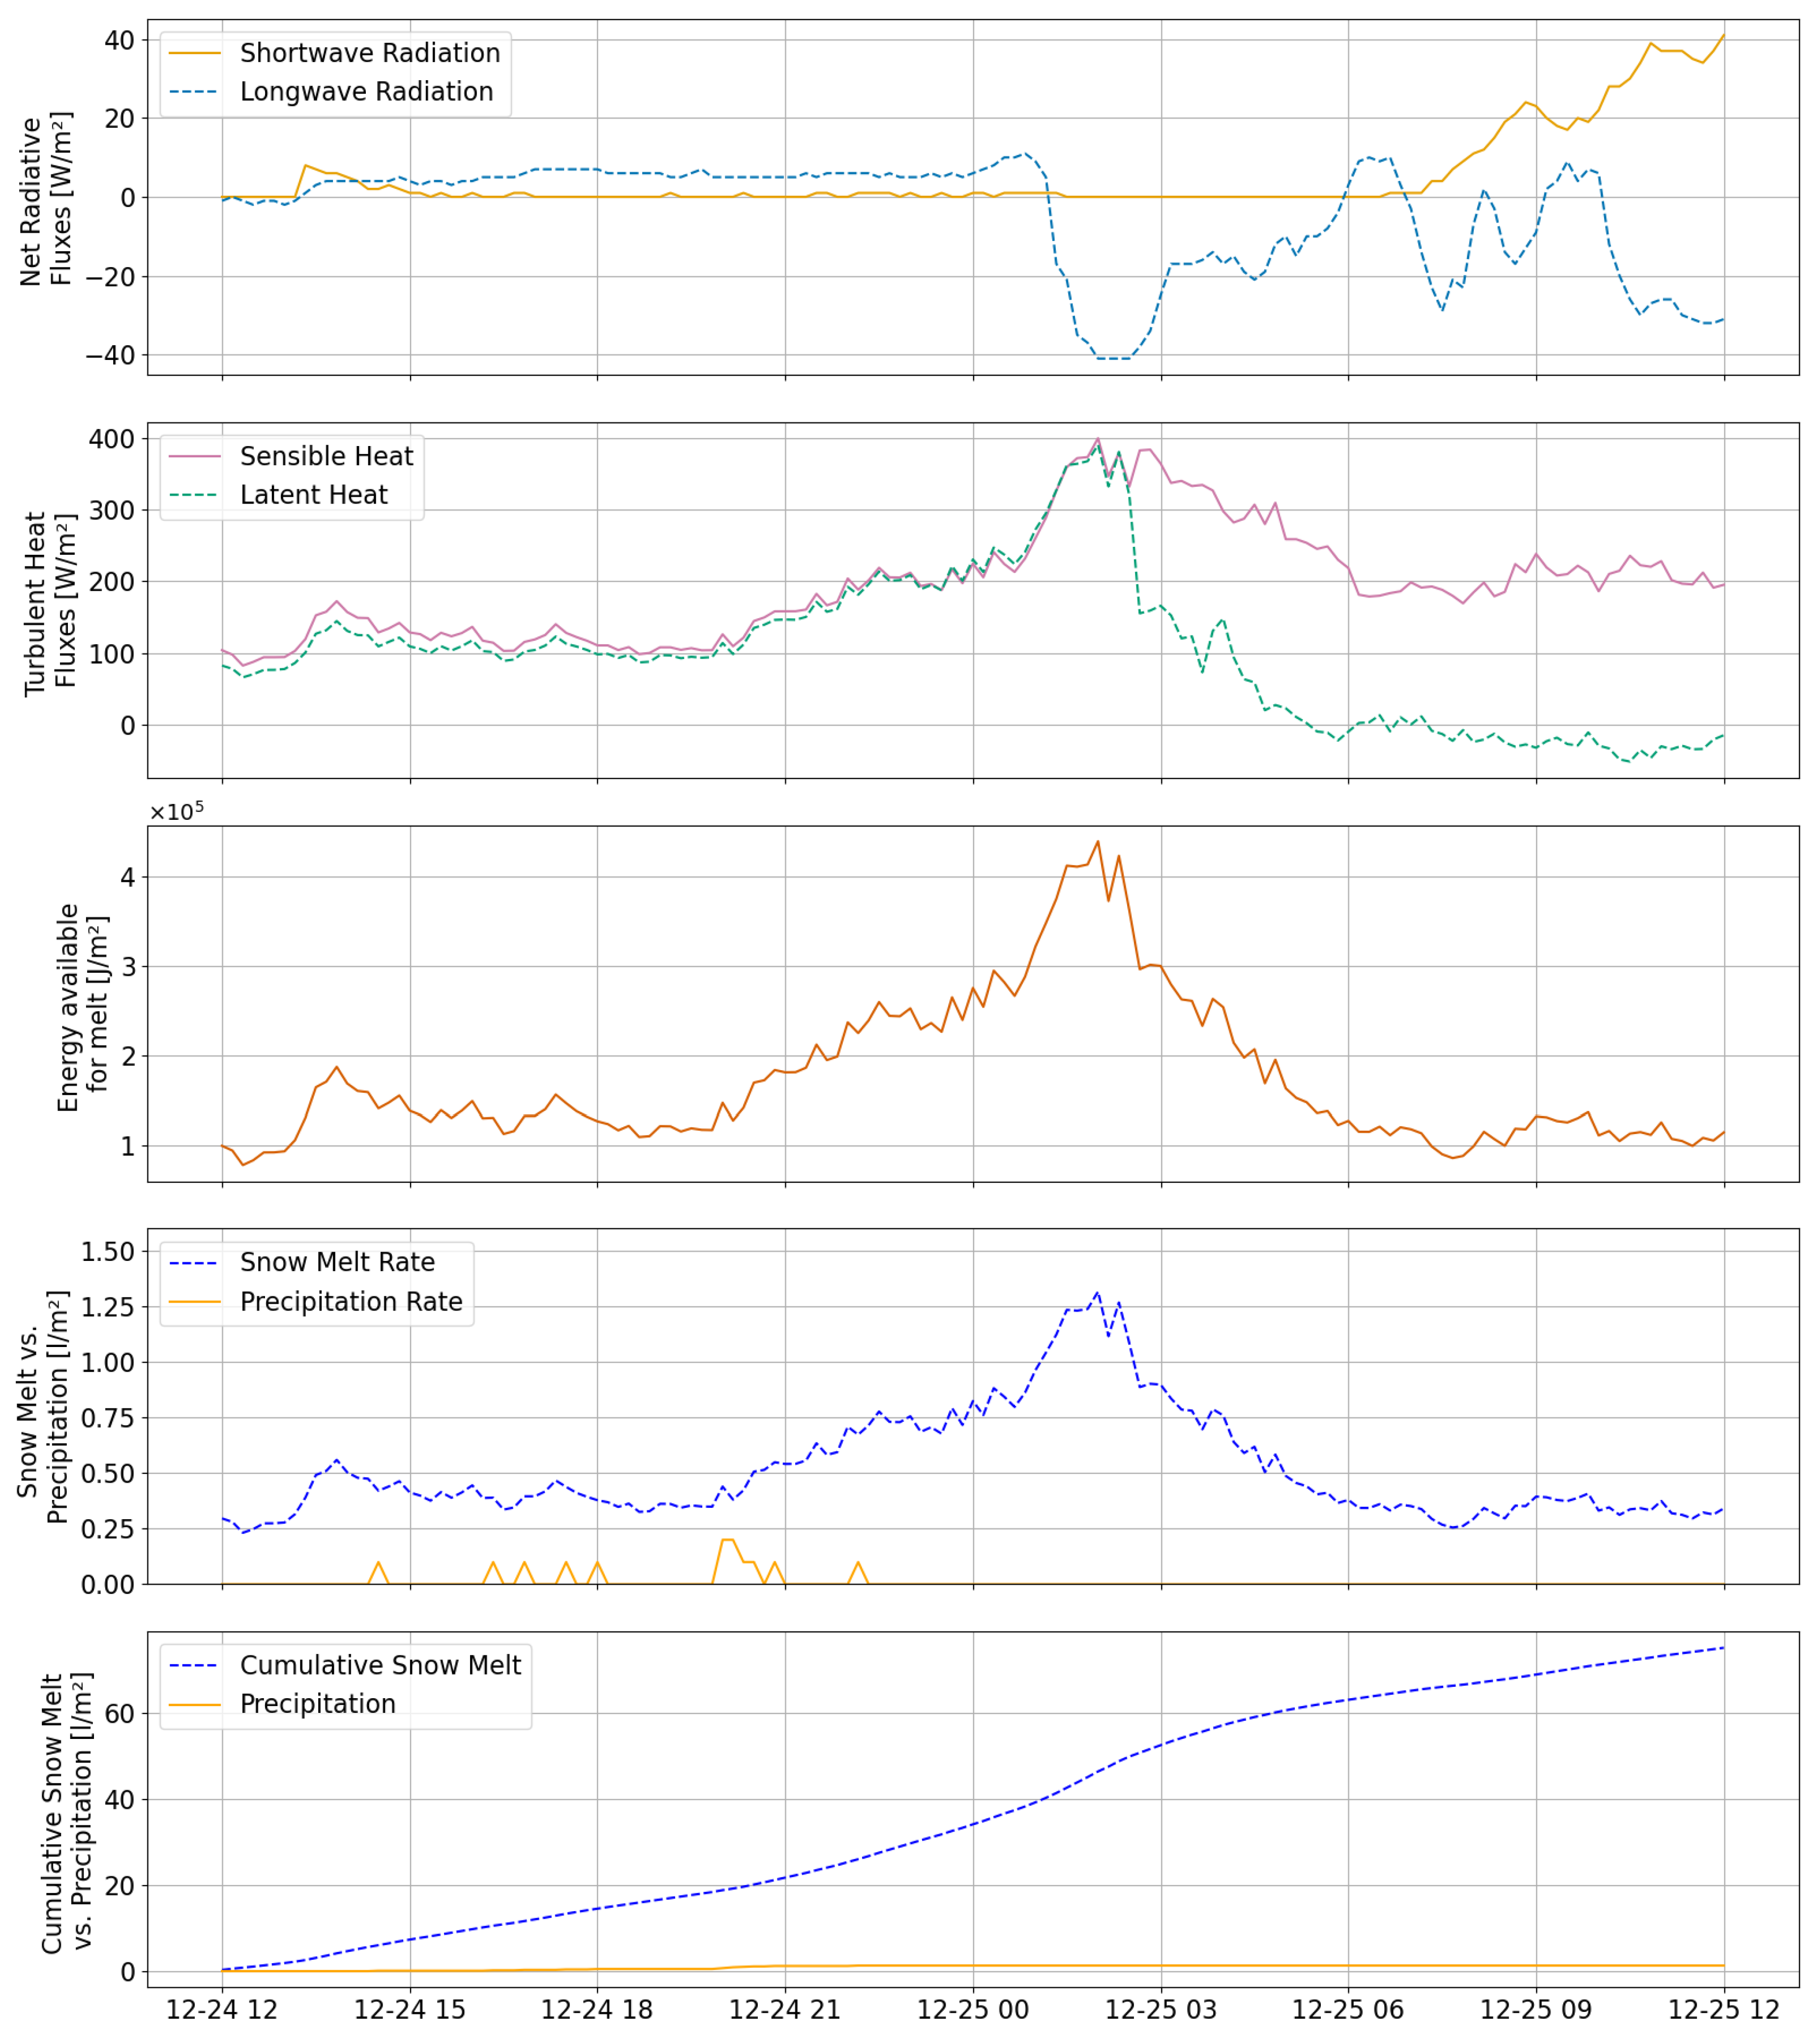
Figure 11.
SNOWPACK modeling results for the period between 19 and 25 December 2023.
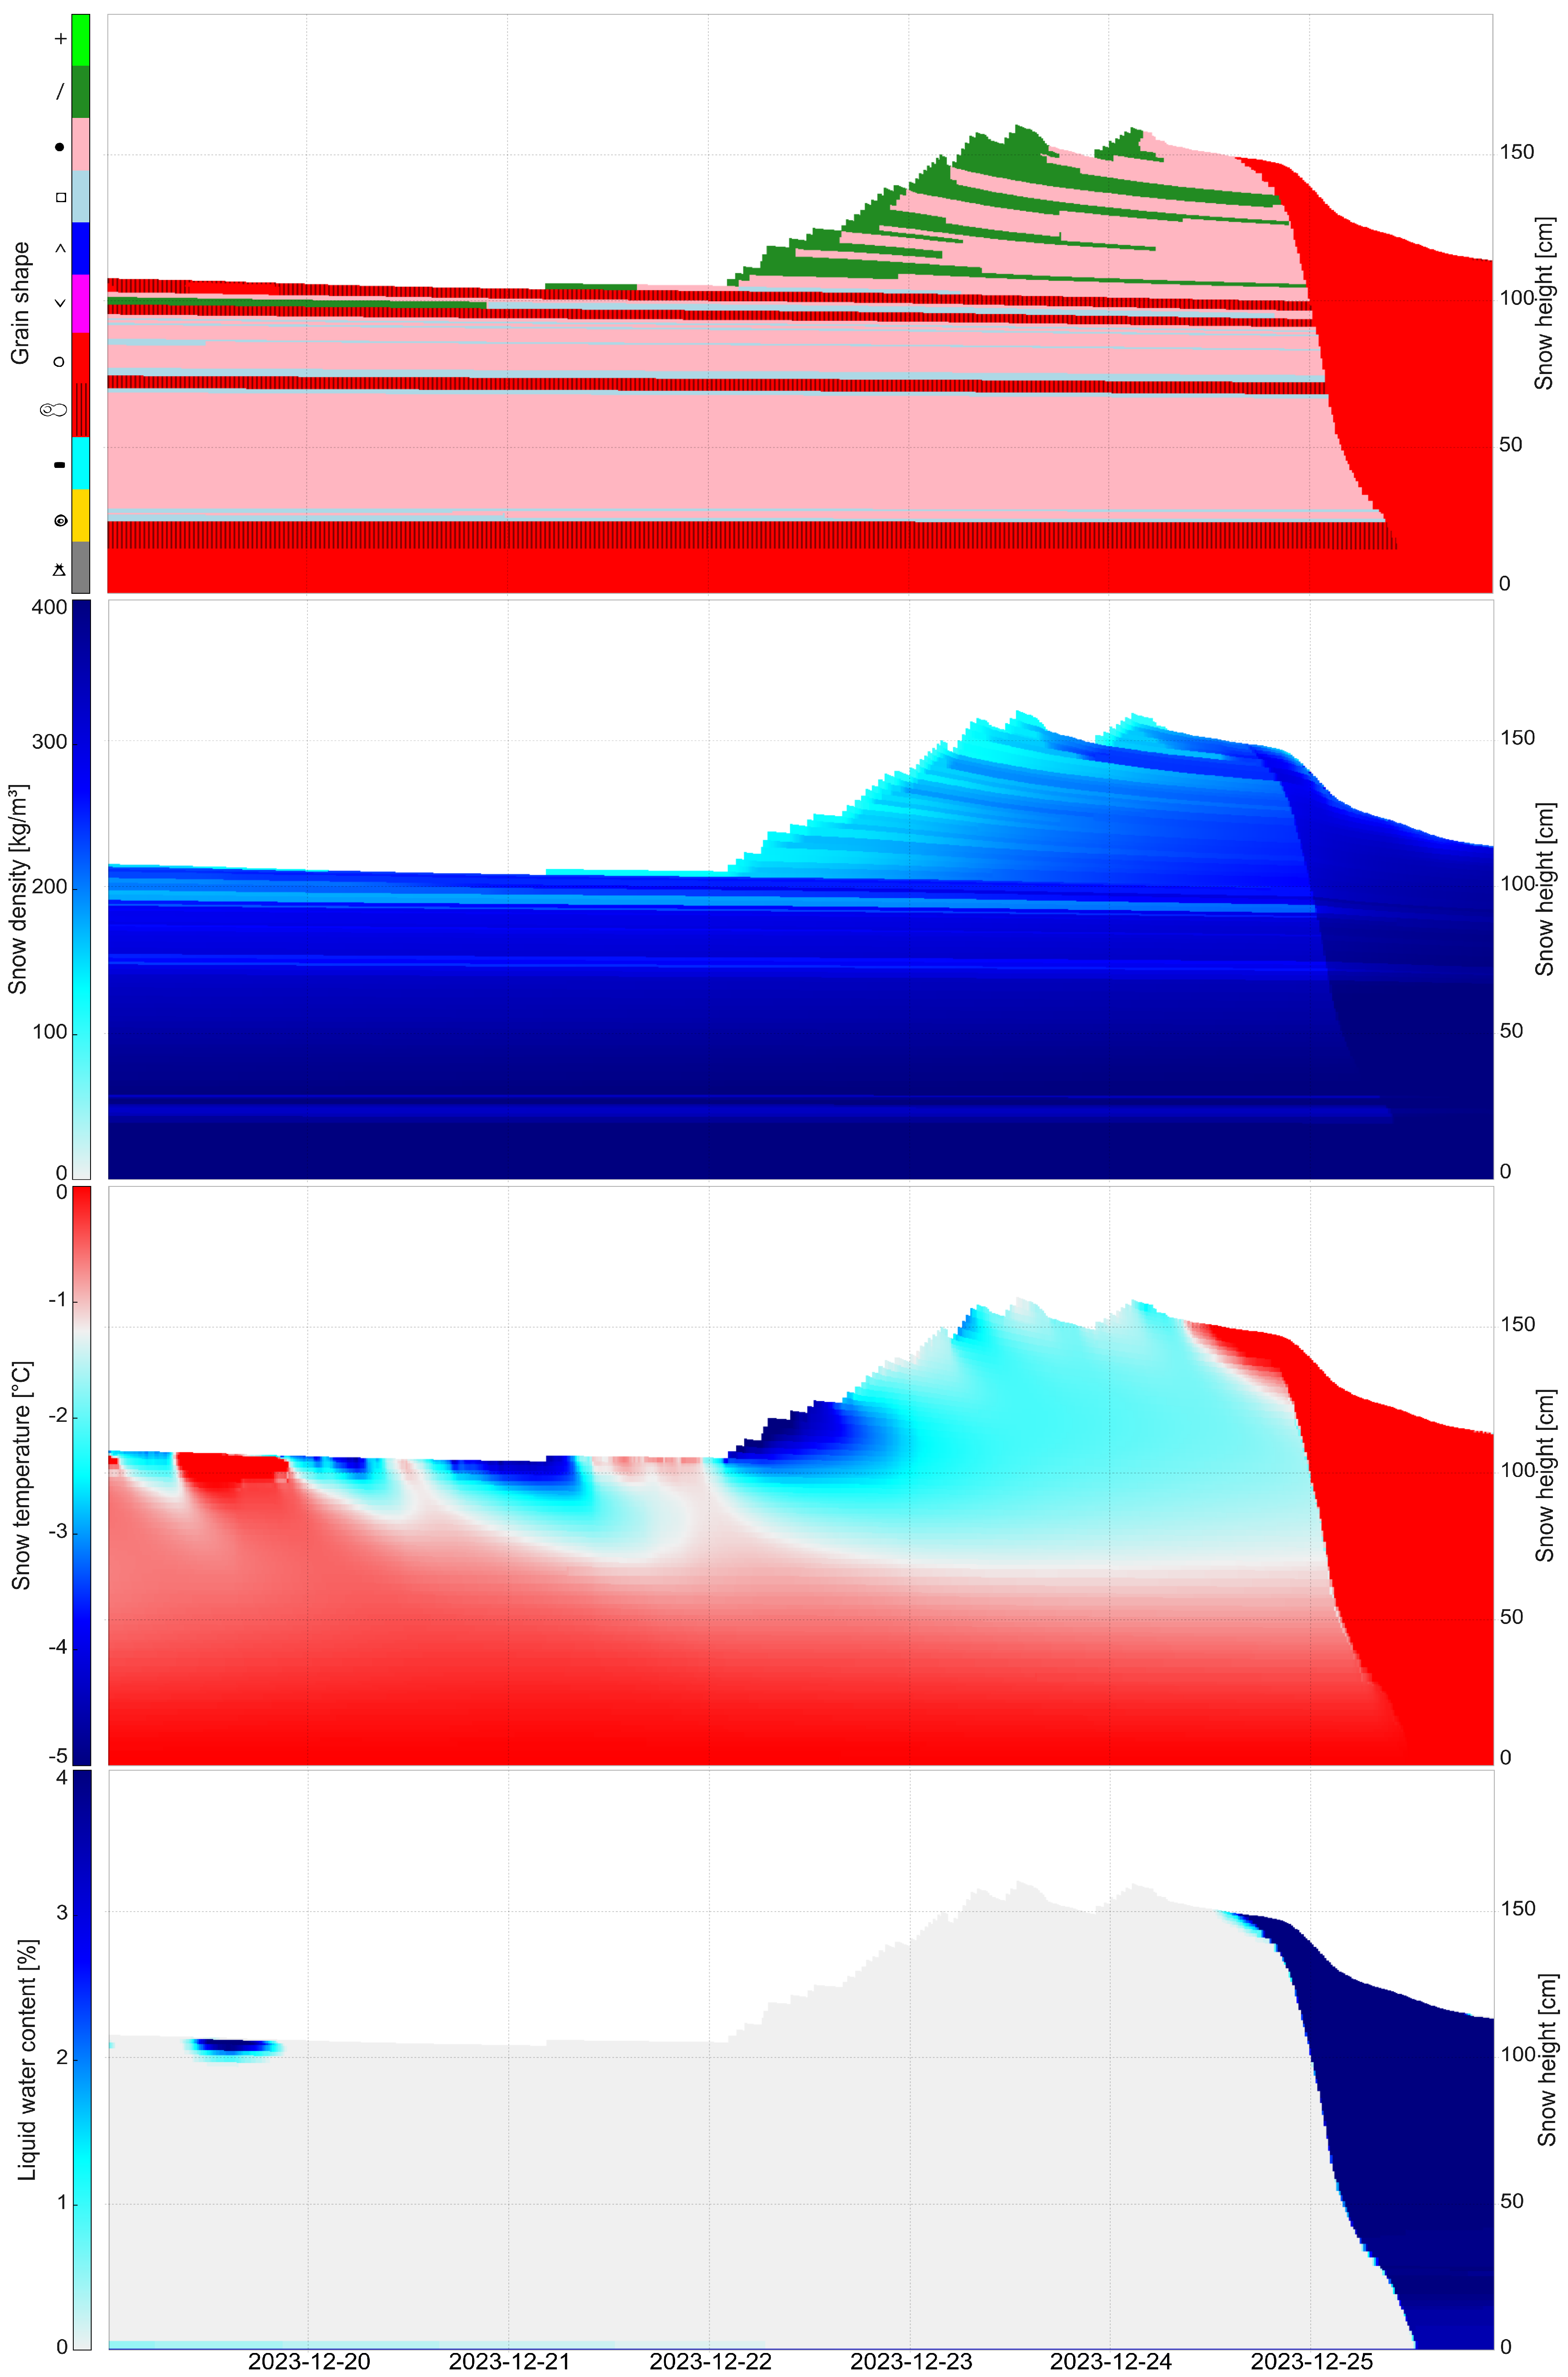

Table 1.
Comparison of measured precipitation and modelled/calculated snowmelt for the period from 24 December 2023, 12 CET, to 25 December 2023, 12 CET.
Table 1.
Comparison of measured precipitation and modelled/calculated snowmelt for the period from 24 December 2023, 12 CET, to 25 December 2023, 12 CET.
| Measured Precipitation |
Calculated Snowmelt |
Modeled Snowmelt |
|---|---|---|
| 1.3 mm | 75.2 mm | 50.8 mm |
Disclaimer/Publisher’s Note: The statements, opinions and data contained in all publications are solely those of the individual author(s) and contributor(s) and not of MDPI and/or the editor(s). MDPI and/or the editor(s) disclaim responsibility for any injury to people or property resulting from any ideas, methods, instructions or products referred to in the content. |
© 2026 by the authors. Licensee MDPI, Basel, Switzerland. This article is an open access article distributed under the terms and conditions of the Creative Commons Attribution (CC BY) license (http://creativecommons.org/licenses/by/4.0/).
Copyright: This open access article is published under a Creative Commons CC BY 4.0 license, which permit the free download, distribution, and reuse, provided that the author and preprint are cited in any reuse.


