
Submitted:
18 February 2026
Posted:
26 February 2026
You are already at the latest version
Abstract
The 3-nitropropionic acid (NPA) promotes neurological alterations in the striatum, hippocampus and vicinal motor and pre-motor cortical areas, and in the cerebellum. The neurological alterations induced by systemic NPA administration resemble those found in Huntington’s disease. In previous works, we have shown that intraperitoneal (i.p.) administration of kaempferol can efficiently protect against striatum degeneration and against motor neurological dysfunctions induced by NPA. In this work, we show that i.p. administration of kaempferol also protects against the increase of pro-inflammatory cytokines that potentiate the activation of complement C3 protein (a biomarker of A1-type reactive astrocytes generation) and overproduction of neurotoxic amyloid β (Aβ) peptides in the cerebellum of rats treated with acute i.p. administration of NPA. In NPA-treated rats, large multipolar neurons of cerebellar nuclei and Purkinje neurons of the cerebellar cortex are the cells most intensely stained by anti-C3 and by anti-Aβ antibodies. In addition, we found that kaempferol also protects against the NPA-induced increase of phospho-tau 217 and phospho-tau 181 in the cerebellum, and our results pointed out that the NPA-induced phospho-tau 217 colocalizes with Aβ(1-42) more closely than phospho-tau 181, both in dentate nucleus and cerebellar cortex. Also, our results unveil another novel brain protection action of i.p. kaempferol co-administration, namely, its ability to prevent microhemorrhages induced in the cerebellar nuclei area by acute NPA administration. In conclusion, our results lend strong support to its use in the therapeutic treatment of NPA intoxication and related β-amyloidopathies and tauopathies.
Keywords:
3-nitropropionic acid
; kaempferol
; cerebellum
; A1-type astrocytes
; amyloid β
; phosphorylated tau
; antihemorrhagic action
1. Introduction
The chemical 3-nitropropionic acid (NPA), produced by some fungi that infest plants [1,2,3], is an irreversible inhibitor of mitochondrial succinate dehydrogenase [4]. In rodents and non-human primates, the strong striatum degeneration and neurological alterations elicited by systemic NPA administration resemble those found in Huntington’s disease (HD) [4,5]. The fact that systemic NPA administration also produced memory impairment in rodents [6] pointed out that this neurotoxin affects other brain areas. Also, cognitive dysfunction, visuospatial deficits, memory loss, and difficulty in learning new skills have been reported in pre-motor stages of HD [7,8]. Indeed, NPA administration has been shown to promote neurological alterations in the hippocampus and vicinal motor and pre-motor cortical areas, and in the cerebellum [9,10,11,12]. It is worth-noting here that striatum and motor and premotor brain cortex establish functional connections with cerebellar nuclei, in particular with the dentate nucleus [13,14,15]. Albeit the striatum is the brain structure more extensively damaged at shorter times after NPA administration [4,5,10], NPA-induced activation of neuroinflammatory microglia [16,17,18] likely contributes to spreading neurodegeneration to other brain areas. NF-κB activation mediates the neurodegeneration induced by NPA [12,16,17,18]. This leads to enhanced secretion of the pro-inflammatory cytokines [16,17,18], and the subsequent rise of reactive oxygen species and nitric oxide production in the brain [19], which has been also shown to mediate NPA-induced brain neurodegeneration [4,10,20,21]. Indeed, in a previous work [10], we showed that i.p. administration of NPA produces a large drop of reduced glutathione and elevation of protein nitrotyrosines in the striatum in adult Wistar rats.
Kaempferol, a flavonol present in vegetables and fruits used in human nutrition, is a natural antioxidant which also inhibits the production of proinflammatory cytokines, inducible nitric oxide synthase (iNOS) and cyclooxygenase-2 (COX-2) in the brain through inhibition of NF-κB activation [22,23]. In previous works, we have shown that intraperitoneal (i.p.) administration of kaempferol can efficiently protect against striatum degeneration and, also, against motor neurological dysfunctions induced by acute i.p. administration of NPA [10,12,24]. Furthermore, we also found that intravenous administration of kaempferol affords an efficient protection against damage of the striatum, as well as a large attenuation of protein nitrotyrosines production in brain lesion areas, elicited by transient focal cerebral ischemia [25]. Because of kaempferol’s low toxicity to humans, this compound seems to be a good candidate for its therapeutic use in the treatment of NPA intoxications. It is worth noting here that therapeutic applications of kaempferol with particular emphasis on its anti-inflammatory effects have already been suggested [23,26,27].
Interleukin-1α (IL-1α), tumor necrosis factor α (TNFα), and complement component 1q (C1q), cytokines which are secreted by activated microglia, acting together are necessary and sufficient to induce the generation of the highly neurotoxic reactive A1-type astrocytes [28]. In particular, complement C3 protein gene expression is highly upregulated in reactive A1 astrocytes, being proposed C3 protein expression used as a specific biomarker of reactive A1 astrocytes generation [28]. We have shown that chronic systemic administration of NPA induces the generation of reactive A1-type astrocytes in the striatum, hippocampus, and cerebellum of rat brains, which express complement C3 protein [11]. Moreover, we have shown that reactive A1 astrocytes is an early event in the neurodegeneration induced by chronic i.p. NPA administration, which precedes the brain damage leading to motor neurological dysfunctions [11]. Furthermore, immunohistochemistry of cerebellum slices from chronic NPA-treated rats revealed an intense immunostaining with anti-TNFα, anti-IL-1α and anti-C1q of neuronal soma of the dentate nucleus, and of the granular layer and Purkinje cells of the cerebellar cortex [11]. Of note, in post-mortem samples of HD abundant reactive A1 astrocytes have been identified [28], as well as cerebellar cortex damage with extensive Purkinje cells loss [29]. More recently, we showed that kaempferol i.p. administration prevented the proteolytic activation of complement C3 protein induced by acute systemic administration of NPA in the striatum and hippocampus [12]. This action of kaempferol fits well with the reported inhibition of the complement system activation by flavonoids extracted from medicinal plants [30]. Since kaempferol i.p. administration also blocked the NPA-induced increase of cytokines IL-1α, TNFα, and C1q in the striatum and hippocampus, we concluded that kaempferol afforded an efficient blockade of the generation of reactive A1 astrocytes induced by acute NPA administration in these brain structures [12].
Several pro-inflammatory cytokines upregulate the expression of amyloid β precursor protein (APP) in human neuroblastoma cells and non-neuronal cells like human astrocytes in culture, and, also, in the mouse brain [31]. Indeed, it is now recognized the capacity of reactive astrocytes to produce neurotoxic amyloid β (Aβ) peptides [31,32]. Furthermore, A1-like astrocytes derived from U251 human astroglioma cells by treatment with a cocktail of the above mentioned cytokines TNFα, IL-1α and C1q show increased production of APP and Aβ peptides [33]. In addition, interleukin-1β (IL-1β) exerts costimulatory effects with other cytokines, such as TNFα and interferon-γ, in the upregulation of the expression of APP, stimulation of the amyloidogenic APP processing and secretion of neurotoxic Aβ peptides in human astrocytes and in the U373MG human astrocytoma cell line [34,35,36]. In a previous work [12], we found that i.p. acute NPA administration potentiates the production of neurotoxic Aβ peptides in the more severely affected rat brain structures, namely, in the striatum and in the hippocampus, and that kaempferol coadministration fully prevented this effect of NPA. These results is of a particular relevance taking into account that NPA induces tau pathology in tangle-mouse model and in wild type-mice [37], and that the neurotoxic Aβ(1-42) peptide has been reported to form complexes with tau, promoting self-aggregation and potentiating tau phosphorylation [38]. Therefore, the possibility that kaempferol coadministration can help to prevent the potentiation of the production of neurotoxic Aβ peptides and phosphorylated tau by NPA deserves to be studied. To this end, the rat cerebellum constitutes a better choice than the striatum and hippocampus, because of the high tissue damage induced by acute NPA administration in the latter brain structures.
In this work, we have experimentally assessed the effect of acute i.p. NPA-administration in adult Wistar rats cerebellum, following the criteria and protocols established in our previous publications. Our results show that the systemic co-treatment with kaempferol affords an effective protection against the increase of pro-inflammatory cytokines that potentiate the overproduction and activation of complement C3 protein and neurotoxic Aβ peptides observed in the cerebellum of NPA-treated rats, and against the rise of phosphorylated tau species that are detected in the early stages of a well-established brain tauopathy. In order to reach this major aim, we have also identified the cerebellar structures that display the highest increase in these biomarkers of NPA-induced degeneration and the colocalization of these biomarkers in these cerebellar structures.
2. Results
2.1. Kaempferol i.p. co-Administration Affords an Efficient Protection Against NPA-Induced Damage in the Cerebellum
We have shown previously that the i.p. co-administration of kaempferol + NPA (KNPA) afford an efficient protection against the damage induced by acute i.p. administration of NPA in the striatum, hippocampus and vicinal cortical motor areas of the rat brain [10,12]. In this work we now demonstrate a wide cerebellar damage induced by acute i.p. administration of NPA in the nuclei of cerebellum as well as in the cerebellar cortex. Significantly, we observe an efficient protection of kaempferol against these damaged areas of cerebellum.
Our results reveal that the co-administration of KNPA afforded a nearly complete protection against NPA-induced damage in the cerebellum, illustrated by means of TTC, Nissl, H&E, and immune-synaptophysin staining (Figure 1 and Supplementary Figure S1). As shown in Figure 1a, samples monitored by TTC staining reveal that NPA induced a significant damage of cerebellar nuclei, including fastigial and mainly in the interposed and dentate nucleus. Significantly, TTC and H&E staining showed an efficient protection of kaempferol against these damaged areas. Indeed, the images of NPA-treated rats pointed out the occurrence of microhemorrhages in this region of the cerebellum and that these were not seen in the images of KNPA rats (Figure 1a and Supplementary Figure S1). On the other hand, Nissl staining, which labels the endoplasmic reticulum, mainly associated with somas in neurons [39], decreased less than 20% of intensity in NPA treated group (Figure 1b). By using higher magnification (Figure. 1c), Nissl staining of the dentate nucleus revealed around 50% decrease of the neuronal somas of large multipolar neurons, which is completely prevented by kaempferol co-treatment. Moreover, the staining with anti-synaptophysin antibody which is specifically associated with synapses linked to vesicle secretion [40], showed a more significant decrease of intensity in NPA-treated rats with respect to control rats, particularly in the dentate nucleus, and that kaempferol completely protected against the decrease of the NPA-induced intensity of anti-synaptophysin immunostaining (Figure 1d). Additionally, the quantitative analysis of the higher magnification images of the dentate nucleus (Figure 1e) yielded a decrease of around 35% of the intensity of staining with respect to control rats. These results pointed out that the NPA-treatment produced a significant loss of neuronal connections in this neuronal structure of the cerebellum. Therefore, all these results together indicate that the co-treatment with kaempferol affords an almost complete protection against NPA-induced neuronal damage in these areas rich in large multipolar neurons that play a major role in the control and tuning of cerebellar nuclei that modulate motor activities.
2.2. Kaempferol i.p. co-Administration Prevents the Increase of Proinflammatory Cytokines Levels and the Generation of Reactive A1 Astrocytes Induced by NPA in the Cerebellum
It is well known that the brain inflammation caused by proinflammatory cytokines mediates the neurodegenerative process induced by NPA. To this end, we evaluate in this work the levels of specific proinflammatory cytokines in cerebellar slices of control rats, NPA and KNPA, by using staining the specific antibodies (Figure 2). Thus, we selected TNFα, IL-1α and C1q, which are the cytokines that elicits the generation of A1-type neurotoxic reactive astrocytes [11,28], as well as IL-1β, which has been shown to foster neurotoxic Aβ peptides production [35,36]. Our results show the overall increase induced by NPA of these cytokines levels in the cerebellar nuclei, and, also, that this increase is largely attenuated by the i.p. co-treatment with kaempferol (Figure 2a). Using Image J software, we evaluated the staining intensity after the subtraction of the background (Figure 2b). These results pointed out that NPA induced between two and three-fold increase of TNFα, IL-1β, IL-1α and C1q, and, also, that the co-treatment with kaempferol almost completely prevented the increase of the expression level of these cytokines. The images shown in Figure 2c revealed that the somas of large multipolar neurons of dentate nucleus account for most of the NPA-induced increase in staining intensity with the antibodies against these specific cytokines. In addition, as anti-IL-1α and anti-C1q antibodies also stain small blood vessels [41,42], the images of the NPA-group of the Figure 2c also indicate NPA-induced thickening of small blood vessels, suggesting microvasculature inflammation or angiogenesis in this region of the cerebellum.
Furthermore, analyzing the cerebellar cortex (Figure 2d), we have observed that the Purkinje cells layer is the most heavily stained with these specific cytokines antibodies in NPA rats. Additionally, we observed that there are significant differences between the pattern of the rise induced by NPA of these cytokines in the cerebellar cortex, i.e. the NPA-induced increase of TNFα and IL-1β in the granular cells layer is much higher than the NPA-induced increase of the other two cytokines, namely, IL-1α and C1q. Overall, the results of the KNPA group revealed the strong protection afforded by kaempferol co-treatment against the increase of the expression level of these cytokines in the cerebellar cortex as well.
Next, we experimentally evaluated in the cerebellum of the three groups of rats the level of the activated complement C3 protein, a specific marker used in neurodegenerative disorders [11,43,44]. The results are shown in the Figure 3. As can be observed in Figure 3a, Western blots demonstrate that the level active C3 complement protein fragments C3α (the strong protein band), C3α fragment iC3b and C3α fragment 2 significantly increase in NPA-treated rats relative to control rats, and that co-treatment with kaempferol almost completely prevents the NPA-induced increase of these active C3 complement protein fragments. The quantification of the C3α protein band of the Western blot yielded a 2.1-fold increase with respect to control rats. Thus, these results point out the activation of the complement C3 protein in NPA-treated rats. In addition, the quantification of the Western blot lane of co-treatment with kaempferol and NPA allows to conclude that kaempferol afforded a complete protection against the NPA-induced activation of the complement C3 protein.
We also experimentally assessed the expression level of active C3 complement protein fragments in the nuclei of cerebellum and cerebellar cortex by using immunohistochemistry (Figure 3b-e). We observed in NPA cerebellum slices the highest intensity of staining in the whole cerebellar nuclei region (Figure 3b), monitored by the intensity quantification analysis obtained from the staining of this region (Figure 3c). These results demonstrate that NPA induces an increase of active C3 complement protein in this cerebellar nuclei region and that this increase is more than 90% attenuated by kaempferol co-treatment, in good agreement with the results obtained by using Western blotting. The higher NPA-induced increase of active C3 complement protein levels obtained from immunohistochemistry images, 4.6-fold versus 2.1-fold in Western blotting, suggests a stronger activation of the C3 complement protein in cerebellar nuclei than in other areas of the cerebellum. Of note, the highest level of anti-C3 staining are displayed in large multipolar neurons of dentate nucleus (Figure 3d) and Purkinje cell layer of the cerebellar cortex (Figure 3e).
Besides the activation of C3 protein, which is a reactive A1 astrocytes marker [11,28], gliosis appears during NPA-induced brain neurodegeneration [10]. Therefore, we also experimentally assessed that the NPA treatment induces gliosis in the cerebellar regions studied herein using immunohistochemistry with anti-GFAP (Supplementary Figure S1). The results showed a nearly two-fold increase of the anti-GFAP staining intensity in NPA-treated rats compared with control rats. It should be noted as well that co-treatment with kaempferol affords more than 90% attenuation of the increase of staining with anti-GFAP induced by NPA.
Taking this into account, we performed double immunochemistry experiments with anti-C3 and anti-GFAP (Figure 4). Immunostaining with anti-C3α and anti-GFAP is revealed by red and blue colors, respectively. Our results show, again, the C3 complement protein location in large neurons of cerebellar nuclei and Purkinje cells of cerebellar cortex, while double labeling show overlap on the staining with both antibodies in vicinal large-sized astrocytes surrounding the somas of large multipolar neurons of cerebellar nuclei and glial cells located around the Purkinje’s cells soma. This is further highlighted by the analysis of selected microscopy images of large cells present in the dentate nucleus and cerebellar cortex with the split channel tool of Image J (Supplementary Figure S2). Note that colocation of C3 complement protein and GFAP cannot be observed in the microscopy images of the KNPA-group nor in those of the control rats, supporting that kaempferol also protects against reactive A1 astrocytes induction in cerebellum.
2.3. Kaempferol i.p. co-Administration Prevents the Increase of the Aβ(1-42) Levels Induced by NPA in the Cerebellum
Reactive A1 astrocytes can produce Aβ(1-42) [33,36] and, also, it has been shown that IL-1β potentiates the production of neurotoxic Aβ peptides through the amyloidogenic pathway [35,36]. Since our results revealed in NPA rats the increase of both the reactive A1 astrocytes and the proinflammatory cytokine IL-1β, we have experimentally evaluated the levels of Aβ(1-42) using immunohistochemistry (Figure 5). Staining of cerebellum slices revealed that Aβ(1-42) levels increased around 3.5-fold in the cerebellar nuclei region of NPA treated rats with respect to control rats (Figure 5a,b). Interestingly, the co-administration of kaempferol reduced more than 80% the NPA-induced increase of Aβ(1-42) levels in the cerebellar nuclei. The anti-Aβ(1-42) immunohistochemistry images obtained with higher resolution (Figure 5c,d) allow to conclude that large multipolar neurons of the dentate nucleus and Purkinje cells layer of the cerebellar cortex display the highest level of anti-Aβ(1-42) staining. Also, the images of the cerebellar cortex point out an approximately two-fold rise of the intensity of anti-Aβ(1-42) staining in the granular cells layer in NPA-treated rats relative to control rats, which is fully prevented by co-administration of kaempferol (Figure 5d). To further assess these results, we performed Congo Red staining of cerebellar slices (Supplementary Figure S3), a qualitative histological method used for the identification of amyloid plaques and tangles [45]. These results give additional support to the conclusions attained above from the analysis of anti-Aβ(1-42) immunohistochemistry results.
Since our results revealed that complement C3 increase in NPA rats both in neuronal somas and reactive A1 astrocytes, by means of double immunohistochemistry we analyzed the staining pattern with anti- Aβ(1-42) and anti-C3 in cerebellum slices. We observed an overlap on the staining with both antibodies in cerebellar nuclei and Purkinje cells layer of the cerebellar cortex (Figure 6). This is further highlighted by the analysis with the split channel tool of Image J of the selected microscopy images. These results highlight a close spatial and temporal relationship between the activation of complement C3 protein and the enhanced production of Aβ(1-42) in the cerebellum of NPA-treated rats.
2.4. Kaempferol i.p. co-Administration Prevents the Increase of the Aβ(1-42) Levels Induced by NPA in the Cerebellum
It is known that neurotoxic Aβ(1-42) peptide forms complexes with tau, enhancing tau phosphorylation [38]. Furthermore, phospho-tau 217 and phospho-tau 181 have been proposed as biomarkers of tau hyperphosphorylation, detected at the early stages of brain degeneration in Alzheimer’s disease, a well-established tauopathy [46]. It has also been reported that NPA induce a tau pathology both in tangle-mouse model and in wild type-mice [37]. On these grounds, by using immunohistochemistry staining with specific antibodies, we experimentally evaluated tau, as well as phospho-tau 217 and phospho-tau 181 levels in cerebellum slices. Our results revealed increased levels of these markers in rats of the NPA-group (Figure 7). There are large differences of the staining pattern observed with phospho-tau 217 and phospho-tau 181 antibodies in the areas of the cerebellum of NPA-treated rats. In the case of dentate nucleus (Figure 7a), anti-phospho-tau 217 stains more intensely the soma of large multipolar neurons, while anti-phospho-tau 181 stains more intensely the thick neuronal extensions, likely monitoring NPA-induced axonal degeneration. In the cerebellar cortex (Figure 7b), anti-phospho-tau 217 stains more intensely the soma of Purkinje cells and the thick dendritic extensions likely protruding from these cells, while anti-phospho-tau 181 stains more intensely the Bergmann glial cells that colocalize around the Purkinje cells soma. Also, the staining pattern with anti-tau antibody points out that the NPA treatment induces significant structural alterations of the cellular morphology in the dentate nucleus and cortex of the cerebellum, in good agreement with the results above showed with anti-synaptophysin staining. Notably, co-administration of kaempferol (rats of the KNPA-group, Figure 7) almost completely prevents the rise of phospho-tau 217 and phospho-tau 181.
In order to further assess the contribution of glial cells staining, we performed in the cerebellum slices double labelling immunohistochemistry, by using anti-GFAP with anti-phospho-tau 217, as well as anti-GFAP with anti-phospho-tau-181 (Figure 8). Our results show an intense labeling with anti-phospho-tau 217 (red color) in the neuronal soma of large multipolar neurons of the dentate nucleus and of Purkinje neurons of the cerebellar cortex (Figure 8a), which is clearly segregated from the labeling with anti-GFAP (blue color). In contrast (Figure 8b), the labeling with anti-phospho-tau 181 shows a more diffuse pattern between extensions of large multipolar neurons (red color) and glial cells labeled with anti-GFAP (blue color). Of note, the overlap between anti-phospho-tau 181 and anti-GFAP staining is particularly strong in the intensely stained Bergmann glial cells that colocalize around the Purkinje cells soma (Figure 8b).
Due to the relevance of the interactions between Aβ(1-42) and hyperphosphorylated tau for seeding and potentiation of the formation of neurofibrillary tangles [38,47], we performed double labelling immunohistochemistry of the cerebellum slices with anti-Aβ/anti-phospho-tau 217 and anti-Aβ/anti-phospho-tau 181 (Figure 9). Our observations revealed a clear overlap of the labeling with anti-Aβ (blue color) and anti-phospho-tau 217 (red color) in the intensely stained neuronal soma of large multipolar neurons of the dentate nucleus and of Purkinje cells soma of the cerebellar cortex (Figure 9a). In contrast (Figure 9b), the labeling with anti-phospho-tau 181 (red color) shows a pattern more segregated with that of anti-Aβ (blue color), albeit overlap between the labeling with both antibodies is clear in the soma of large multipolar neurons of the dentate nucleus. In the cerebellar cortex an extensive overlap between anti-Aβ and anti-phospho-tau 181 labeling can be observed in the Bergmann glial cells which lies close to the Purkinje cells soma.
3. Discussion
The results of this work demonstrate that i.p. co-administration of kaempferol efficiently prevents in rat cerebellum the rise of proinflammatory cytokines TNFα, IL-1α, C1q and IL-1β induced by acute i.p. administration of NPA. These cytokines that have been shown to foster A1-type reactive astrocytes generation [28] and neurotoxic Aβ peptides overproduction [33,35,36]. The almost complete blockade by kaempferol of the NPA-induced rise of active C3 complement protein (a biomarker of A1-type reactive astrocytes [28], bears a special relevance because C3 complement protein activation has been shown to be required for neurodegeneration in mouse models of amyloidosis and tauopathy [48]. Since it has been shown that A1-type astrocytes can also contribute to the production of Aβ(1-42) [33,36], our results support that the protection of kaempferol against overproduction of neurotoxic Aβ peptides is likely the cumulative effect of attenuation and eventually blockade of NPA-induced increase of proinflammatory cytokines, and of A1-type reactive astrocytes generation in the cerebellum. Our results point out that protective effects of kaempferol are particularly strong in the large neuronal somas of the cerebellar nuclei and in the Purkinje cells layer of the cerebellar cortex. This bears a special relevance due to the major role of large multipolar neurons of the cerebellar nuclei in the control and coordination of motor movements, which are impaired in NPA-treated rats, as supported by our previous works [10,11,12]. In this regard, it is worth recalling here that the dentate nucleus has important neuronal functional connections with motor and premotor brain neocortex, cortical areas that undergo a larger damage in the NPA-induced brain degeneration [10,11]. Of note, while acute i.p. administration of NPA induce a large damage in the rat brain areas of the striatum and hippocampus (with noticeable tissue disaggregation and extensive cell loss [10,12], the tissue damage in the cerebellum is, yet, less severe, i.e., small microhemorrhages and thickening of microvascular vessels can be seen in the cerebellar nuclei area of NPA-treated rats. Indeed, in NPA-treated rats blood vessels of the cerebellar nuclei are heavily stained by anti-C3 antibody and, also, by anti-Aβ(1-42) antibody (supplementary Figure S5). It should be recalled here that cerebral amyloid angiopathy is characterized by the deposition of Aβ in blood vessels [49]. In contrast, no indications of microhemorrhages nor of capillaries thickening are seen neither in the control nor in the kaempferol + NPA treated rats. Therefore, these results unveil another novel brain protection action of i.p. kaempferol co-administration, namely, its beneficial antihemorrhagic action. Indeed, kaempferol has been reported to inhibit vascular endothelial inflammation and to exert other protective effects on the vascular endothelium [26]. Inhibition of vascular endothelial inflammation is a target point in the treatment of many vascular diseases, because an excess of inflammatory mediators production may cause irreversible vascular damage leading to insufficient tissue perfusion, organ dysfunction and death [50].
Besides the pathophysiological relevance of the functional impairment of the cerebellar nuclei above mentioned in the neurological dysfunctions induced by acute NPA intoxication, it should be remarked that the extent of tissue damage in this brain area is clearly lower than that produced in the striatum and hippocampus by the same treatment with NPA, analyzed in detail in our previous works [10,12]. Nevertheless, it must be noted that Nissl staining and the immunohistochemistry with anti-synaptophysin and with tau reveal significant neuronal and structural alterations, as well as loss of synaptic connections in the cerebellar nuclei, particularly in the dentate nucleus. Therefore, the results shown in this work point out that cerebellum degeneration induced by acute i.p. administration of NPA is somewhat delayed with respect to that of the striatum, hippocampus and vicinal motor and premotor areas of the brain cortex. In spite that the degeneration of the cerebellum induced by acute i.p. administration of NPA is, yet, at an initial stage relative to that of the striatum and hippocampus, NPA induced the rise of proinflammatory cytokines, gliosis and activation of C3 complement protein in the cerebellum. This gives further experimental support to our previous conclusion that the generation of A1-type reactive astrocytes is an early event in the neurotoxicity induced by chronic administration of NPA [11]. Recently, it has been shown that the astrocyte leaflets enwrap many neuron synapses in clusters, integrating synaptic activity at a circuit functional level [51]. Since the disruption of astrocyte leaflets may foster neurological degeneration, the progressive degeneration and loss of functional axonal connections between the cerebellar nuclei and the above mentioned brain areas could play a significant role to potentiate the onset of NPA-induced degeneration in the cerebellar nuclei. Also, it has been noted that pro-inflammatory mediators secreted by reactive astrocytes can induce disruption of tight junctions, finally leading to blood-brain barrier integrity breakdown and brain edema [52,53]. Interestingly, several works have shown beneficial actions of kaempferol to preserve the blood-brain barrier integrity [54,55,56]. Furthermore, in a cerebral ischemia-reperfusion rat middle cerebral artery occlusion model, it has been shown that kaempferol not only preserved the blood-brain barrier integrity, but also inhibits neutrophils activation, aggregation and infiltration into the brain [57]. Let us recall here that disruption of the blood-brain barrier potentiates the infiltration of neutrophils from the blood circulation into the brain, worsening brain injury outcome because this increases morbidity and mortality in cerebral ischemia-reperfusion [58]. Infiltrating neutrophils produce pro-inflammatory cytokines, matrix metalloproteinases, nitric oxide, reactive oxygen species and other cytotoxic molecules that accelerate brain damage in the ischemic brain [59].
Our microscopy images of NPA-induced increase of the different cytokines studied in this work highlighted that the most intensely stained cells are the large neuronal somas of the cerebellar nuclei and the Purkinje cells layer of the cerebellar cortex. Interestingly, the same conclusions are reached from the double immunohistochemistry microscopy images stained with anti-C3 and anti-Aβ(1-42) antibodies. It should be recalled here that the gene encoding for the amyloid precursor protein displays a widespread transcription in rat brain neurons, with high transcription levels in several brain areas, in particular in Purkinje cells and cerebellar granule cells [60]. Later, it has been remarked that intracellular Aβ(1-42) is significantly higher in Purkinje neurons of rats cerebellum than in granule neurons of the cerebellar cortex [61]. Our microscopy images stained with anti-GFAP and anti-C3 pointed out an extensive overlap between the staining afforded with both antibodies, strongly supporting that A1-type astrocytes are the main responsible for the increase of C3 levels. Since the double immunohistochemistry microscopy images stained with anti-Aβ(1-42) and anti-C3 also showed an extensive overlap between the staining afforded with both antibodies, our results strongly suggest that activation of the C3 complement protein produced by A1-type astrocytes are the responsible for most of the increase of Aβ levels induced by NPA in the cerebellum. This conclusion is supported by the fact that i.p. coadministration of kaempferol elicits a nearly complete blockade of NPA-induced activation of C3 complement protein in the cerebellum (an accepted biomarker of A1-type astrocytes generation [28], and more than 80% attenuation of the increase of neurotoxic Aβ peptides. It is worthy to mention herein that herbal extracts of Persicaria lapathifolia containing kaempferol glycosides inhibit the classical pathway of C3 complement protein activation [62]. Nevertheless, it should be noted that the microscopy images of the cerebellar cortex stained with anti-Aβ(1-42) showed that NPA induced also a significant widespread increase of Aβ in the granular cells layer, an increase which is not observed in the microscopy images of the cerebellar cortex stained with anti-C3. In contrast, the spatial pattern of the NPA-induced increase of the staining intensity of the granular cells layer with TNFα and IL-1β looks similar to the spatial pattern of the increase observed with anti-Aβ(1-42). As these cytokines have been shown to foster the amyloidogenic processing of the amyloid β precursor protein [35,36], it seems plausible that this can account, at least in part, for the observed NPA-induced increase of neurotoxic Aβ peptides in the granular cells layer of the cerebellum.
The results of this work highlight that kaempferol i.p. administration has a strong protective effect against the NPA-induced overproduction of neurotoxic Aβ peptides in the rat cerebellum. It is worth-noting here that the neurotoxic Aβ(1-42) peptide has been reported to form complexes with tau, promoting self-aggregation and potentiating tau phosphorylation [38,47] and that NPA induces a tau pathology in tangle-mouse model and in wild type-mice [37]. Our results show that kaempferol co-administration elicits almost complete attenuation of the NPA-induced increase of phospho-tau 217 and phospho-tau 181, which are phospho-tau species that have been reported to be detected at the early stages of brain degeneration in Alzheimer’s disease, a well-established tauopathy [46,63,64]. Therefore, we conclude that kaempferol i.p. administration can also be useful to protect against NPA-induced tauopathy. In this regard, it should be noted that our results pointed out that the NPA-induced phospho-tau 217 colocalizes with Aβ(1-42), both in dentate nucleus and cerebellar cortex, more closely than phospho-tau 181. Note that the double immunohistochemistry microscopy images show a clear segregation between the labeling with anti-phospho-tau 217 and with anti-GFAP, while there is significant overlap between the labeling with anti-phospho-tau 181 and glial cells stained with anti-GFAP. Indeed, anti-phospho-tau 217 heavily stains the large neuronal somas of the dentate nucleus and the somas of Purkinje neurons, in excellent agreement with the results obtained with anti-Aβ(1-42) antibody staining. In contrast, the microscopy images obtained with anti-phospho-tau 181 show that this antibody stains more heavily thick axonal extensions in the dentate nucleus and Bergmann glial cells surrounding the soma of Purkinje neurons in the cerebellar cortex. Also, it has been previously reported that p-tau 217 detects Alzheimer’s disease slightly earlier than p-tau 181 during the preclinical period, whereas plasma p-tau 181 levels gradually increase from the preclinical stage of Alzheimer’s disease to mild cognitive impairment and dementia [65]. Thus, our results suggest that phospho-tau 217 could be a better biomarker than phospho-tau 181 for early neurotoxic amyloid production in the cerebellum of NPA-treated rats.
In summary, our results reveal that kaempferol i.p. administration efficiently protects the rat cerebellum against NPA-induced microhemorrhages, overproduction of proinflammatory cytokines, activation of C3 complement protein, overproduction of neurotoxic Aβ(1-42) peptides and tau phosphorylation at 217 and 181 amino acids residues. Owing to the low toxicity of kaempferol for humans, our results lend strong support to its use in the therapeutic treatment of NPA intoxication and related β-amyloidopathies and tauopathies.
4. Materials and Methods
4.1. Chemicals
Kaempferol and NPA were supplied by Sigma-Aldrich Spain (Sigma-Aldrich, St. Louis, MO, USA). Glycerol and paraformaldehyde were purchased from Panreac (Barcelona, Spain). Ketamine was from Pfizer (Madrid, Spain). Diazepam and atropine were obtained from B. Braun (Rubí-Barcelona, Spain). All other products were obtained from Sigma- Aldrich or Merck (Darmstadt, Germany) unless specified otherwise.
4.2. Animals and Treatments
We followed protocols previously established in our laboratory for the systemic administration of NPA and kaempferol, [10,12]. Due to this, these protocols are briefly summarized below.
Male Wistar rats, 9–10 weeks old, weighing 290–340 g, were housed in a 12 h light/dark cycle and allowed free access to food and water during the experiment. The experimental procedures followed the animal care guidelines of the European Union Council Directive 86/609/EEC. The protocols were approved by the Ethics Committee for Animal Research of the local government.
The rats were divided into three experimental groups: KNPA, NPA, and Control. The KNPA-group (n = 6) received the first injection of kaempferol solution, at a dose of 21 mg/kg, 48 h before initiation of NPA treatment. From day 0–5 of treatment, a dose of 25 mg of NPA/kg body weight (b.w.) was administered i.p. every 12 h. Daily, 30 min before the morning NPA injection, another 21 mg/kg dose of kaempferol was injected into the rats. Rats from NPA-group (n = 6) were treated with 25 mg NPA/kg b.w. every 12 h during 5 days and, instead of kaempferol, received 1-mL injections with 2.4% v/v dimethyl sulfoxide (DMSO) in saline 48 h before NPA-treatment and every day 30 min before the morning NPA injection. Control-group (n = 6) received 1 mL 2.4% v/v DMSO in saline (kaempferol vehicle) and 0.4 mL saline solution (NPA vehicle), with the same time schedule of treatment groups. Systemic administration of NPA at a dose of 25 mg/kg b.w. every 12h caused marked behavioral alterations in the rats, as reported in previous works [10,12].
All the experimental animals were evaluated for motor impairment throughout the experiment. This task was performed as in previous work in this laboratory [10]. The animals were observed twice a day, just before the i.p. injections of NPA, and rated for the presence and severity of a variety of motor deficits using the quantitative scale described in [66]. To avoid a further loss of animals on the fifth day of treatment, the rats in this group with severe pathological symptoms (motor deficit ≥6 or weight loss ≥15%) were sacrificed at the end of day 4. The rats from the KNPA-group, as well as Control-group, were all treated until day 5 and sacrificed at this time.
At the end of the treatments, the animals were anesthetized with ketamine (50 μg/g), diazepam (2.5 μg/g), and atropine (0.05 μg/g). The brains were immediately removed from the skull and washed in cold phosphate-buffered saline (PBS) pH 7.4, and then cut with a tissue slicer. Cerebellar slices were used for 2,3,5-triphenyl tetrazolium chloride (TTC) staining, hematoxylin–eosin staining (H&E), Nissl staining, Congo Red staining, immunohistochemistry and Western blots shown in this work.
4.3. Cerebellum Damage Monitored with TTC, H-E, Nissl and Congo Red Staining
Coronal 1.5 mm-thick slices of cerebellum were taken from each of the three experimental groups (KNPA, NPA, and Control), immersed in a 2% solution of TTC in PBS for 15 min at 37ᵒC, and observed under a Leica MZ APO stereomicroscope.
For histological staining cerebellum were fixed in paraformaldehyde 4%, dehydrated, embedded in paraffin wax and sectioned in coronal sections at 7 μm. Vicinal sections were counter-stained with hematoxylin–eosin (H&E), Nissl (0.1 % cresyl violet in 0.25 % acetic acid) or Congo Red (Sarkar et al. 2020).
Sections were digitally photographed in Nikon digital light DS-F1 and Zeiss Axio imager 2 microscope, with camera attached to a dedicated computer compatible with Image-Pro Plus software (Media Cybernetics, Warrendale, PA, USA).
4.4. Cerebellum Samples Homogenization and Western Blotting of C3
Cerebellum samples were immediately frozen in liquid nitrogen and kept at -80 °C until use. Samples homogenization and Western blotting were performed as described in detail in a previous publication (Lopez-Sanchez et al. 2020). Briefly, weighed brain sections were homogenized at 0.14 g per mL in the following ice-cold buffer: 25 mM tris–(hydroxymethyl) aminomethane hydrochloride (Tris-HCl) at pH 7.4, 150 mM NaCl, 5 mM ethylenediaminetetraacetic acid, 50 mM NaF, 5 mM NaVO3 and 4-(1,1, 3,3-Tetramethylbutyl)phenyl-polyethylene glycol (Triton X-100) 0.25%, supplemented with the protease inhibitor cocktail SIGMAFAST S8820 (Sigma-Aldrich). After homogenization with a glass homogenizer, 1–1.5 mL aliquots of samples were transferred to an Eppendorf-type plastic vial and sonicated with 30–40 pulses of 100 w of 1 s each using a titanium-tip sonicator in an ice-cold recipient. Afterward, the samples were centrifuged at 2000×g for 5 min at 4ᵒC to remove tissue debris and nuclei, supernatants were collected and their protein concentration was determined with Bradford’s method using bovine serum albumin (BSA) as the protein standard. Supernatants were later supplemented with 40% glycerol and conserved at -80ᵒC until used for Western blotting. Sodium dodecyl sulfate-polyacrylamide gel electrophoresis (SDS-PAGE) have been performed in a BIO-RAD mini-Protean Tetra cell following a standard protocol with 7.5% acrylamide. Samples were loaded with around 20 μg protein per lane after heat-denaturation of homogenate samples in 95 mM Tris-HCl buffer (pH 6.8), 3% sodium dodecyl sulfate (SDS), 1.5% v/v β-mercaptoethanol, 13% glycerol, and 0.005% bromophenol blue. After SDS-PAGE, the gel was transferred to a polyvinylidene difluoride (PVDF) membrane of 0.2 μm average pore size in standard transfer medium (Trans-BloT TransferMedium, BioRad). Later, PVDF membranes were blocked with 3% BSA, washed 6 times with Tris-buffered saline (TBS) supplemented with 0.05% Triton X-100 (TBST), incubated with the primary antibody against the protein target for 1h at room temperature with shaking. The membranes were washed 6 times with TBST and incubated with the appropriate secondary antibody conjugated with horseradish peroxidase for 1h at room temperature with shaking, washed 6 times with TBST, and treated with Clarity TM Western ECL Substrate, BIO-RAD. Western blots were revealed with Bio-Rad ChemiDocTM XRS+. Primary antibodies used in this work: anti-C3 antibody (Abcam ab200999 –rabbit monoclonal, dilution 1:2.000). After the acquisition of the PVDF membranes images stained with the primary and corresponding secondary antibodies, membranes were washed with deionized water, stripped, blocked with 3% BSA, and treated to quantify β-actin to monitor protein load as indicated above. To this end, we have used mouse monoclonal anti-β-actin antibody (Sigma-Aldrich A1978, dilution 1:5.000) or polyclonal anti-β-actin antibody produced in rabbit (Sigma-Aldrich A5060, dilution 1:500) as primary antibody, and anti-mouse or anti-rabbit IgG-Horseradish peroxidase (Sigma-Aldrich A0944 and A0545, respectively, dilution of 1:5.000–1:10.000). Of note, we confirmed that after stripping the signal of the staining with the primary antibodies against target proteins C3 were largely removed and contributed less than 5% to the intensity of the β-actin band.
All the results were confirmed with Western blots of n = 6 different samples of each experimental condition. Statistical analysis: results of Western blots are expressed as means ± standard error of the mean (SEM). Statistical analysis was carried out by Mann–Whitney non- parametric test. A significant difference was accepted at the p < 0.05 level.
4.5. Glial Fibrillary Acidic Protein (GFAP), TNFα, IL-1α, IL-1β, C1q and Component C3, β-Amyloid, Tau, p-Tau-217, and pTau-181 Immunohistochemistry
Vicinal coronal sections of cerebellum embedded in paraffin wax and cut 7 μm thick were selected to identify and localize different cells populations by means of immunohistochemistry. We carried out the following immunohistochemistry procedures.
4.5.1. Glial fibrillary Acidic Protein (GFAP), IL-1α, C1q, β-amyloid and Tau
After blocking with 1% BSA for 30 min and incubation with 5% normal goat serum in 1% BSA and 0.1% Triton X-100 for 2h, tissue sections were incubated with primary antibodies: dilution 1:400 for mouse anti-GFAP antibody (Sigma: G3893), dilution 1:100 for both mouse anti-β-amyloid(1-42) antibody (Sigma: A8354) and mouse anti-Tau antibody (T46, ThermoFisher Scientific 13-6400), and dilution 1:50 for both mouse anti-IL-1α antibody (Santa Cruz Biotechnology: sc-9983) and mouse anti-C1q-C antibody (Santa Cruz Biotechnology: sc-365301).
Then, a secondary antibody (dilution 1:200) was added, a goat anti- mouse immunoglobulin G conjugated with alkaline phosphatase (IgG-AP), Santa Cruz Biotechnology: sc-3698. Finally, it was revealed with nitro blue tetrazolium/5-bromo-4-chloro-3-indolyl phosphate (NBT/BCIP) supplied by Roche (catalog nº 1681451).
4.5.2. Complement Component 3 (C3), TNFα, IL-1β, pTau-217 and pTau-181
Tissue sections were blocked with endogenous avidin/biotin blocking kit (Abcam ab 64212) and incubated with primary antibodies: dilution 1:2000 for rabbit anti-C3 antibody (Abcam ab225539, a PBS-buffered version of ab200999, containing no BSA or sodium azide), dilution 1:250 for rabbit anti-IL-1β antibody (Abcam ab9722), dilution 1:100 for both rabbit anti-TNFα antibody (Abcam ab6671) and rabbit anti-pTau-181 antibody (Invitrogen: 701530), and dilution 1:50 for rabbit anti-pTau-217 antibody (Invitrogen: 44-744). Sections were incubated with avidin-biotinylated horseradish peroxidase complex (Vectastain ABC Kit PK6101). Chromogen development was performed with peroxidase substrate solution (Vector VIP substrate, SK-4600).
4.5.3. Double Immunohistochemistry (GFAP + C3; GFAP + pTau-217; GFAP + pTau-181; β-amyloid+C3; β-amyloid+pTau217; β-amyloid+pTau-181)
For double immunohistochemistry, primary antibody mouse anti-GFAP was applied together with rabbit anti-C3 or rabbit anti-pTau-217, or rabbit anti-pTau-181. Also, primary antibody mouse anti-β-amyloid was applied together with rabbit anti-C3 or rabbit anti-pTau-217, or rabbit anti-pTau-181. Secondary antibodies, goat anti-mouse conjugated with alkaline phosphatase and biotinylated goat anti-rabbit Vectastain ABC Kit, were applied together. The chromogen development was performed sequentially as follows: first, anti-GFAP or anti-β-amyloid and secondary antibody conjugated with alkaline phosphatase (blue) and, thereafter, the red color was developed with anti-C3 or anti-pTau-217 or anti-pTau-181 and a biotinylated secondary antibody conjugated with peroxidase.
Sections were digitally photographed in Nikon digital light DS-F1 and Zeiss Axio imager 2 microscope, with the camera controlled with a computer software compatible with Image-Pro Plus software (Media Cybernetics, Warrendale,PA, USA).
4.6. Image Analysis
Quantitative analysis of microscopy images was performed using the Image J® software. All microscopy images used for quantitative intensity analysis were acquired with the same microscope exposure time and brightness/contrast. The lowest intensity pixels in each one of the fields selected for analysis were used as background intensity, and background intensity was subtracted from the mean intensity of each field.
4.7. Statistical Analysis
All data were obtained in at least three independent experiments with replicates of three or more for each condition. Results are expressed as means ±standard error (S.E.). Statistical analysis was carried out by Mann–Whitney non-parametric test. Significant difference was accepted at the P< 0.05 level.
Supplementary Materials
The following supporting information can be downloaded at the website of this paper posted on Preprints.org.
Author Contributions
Conceptualization: [C.L.-S:; V.G.-M.; C.G.-M.]; Methodology: [V.G.-L.; C.L.-S; J.P.]; Formal analysis and investigation: [V.G.-L.; C.L.-S.; J.P.; R.L.; D.M.-S; V.G.-M.; C.G.-M.]; Writing - original draft preparation: [V.G.-L.; C.L.-S; V.G.-M.; C.G.-M.]; Writing - review and editing: [V.G.-L.; C.L.-S.; J.P.; R.L.; D.M.-S; V.G.-M.; C.G.-M.]; Funding acquisition: [C.L.-S; R.L.; D.M.-S]; Resources: [C.L.-S; V.G.-M.; C.G.-M.]; Supervision: [C.L.-S; V.G.-M.; C.G.-M.].
Funding
This work has been financed in part with research grants GR24140 (CTS005) from the Junta de Extremadura, with FEDER co-financing (to C.L.-S.) and by LSRE-LCM and ALiCE centers, supported by Fundação para a Ciência e a Tecnologia, I.P. /MCTES through Portugal national funds: UID/50020/2025 (DOI: 10.54499/UID/50020/2025) and LA/P/0045/2020 (DOI: 10.54499/LA/P/0045/2020) (to R.L., D.M.-S).
Institutional Review Board Statement
Not applicable.
Informed Consent Statement
Not applicable.
Data Availability Statement
Not applicable.
Conflicts of Interest
The authors declare no conflict of interest.
Abbreviations
Aβ, Amyloid β peptides;
APP, Amyloid β precursor protein;
BSA, Bovine serum albumin;
C1q, Complement protein component 1q;
C3, Complement protein component 3;
DMSO, Dimethyl sulfoxide;
GFAP, Glial fibrillary acidic protein;
HD, Huntington’s Disease;
H&E, Hematoxylin–eosin staining;
IL-1α, Interleukin 1 alpha;
IL-1β, Interleukin 1 beta;
i.p., Intraperitoneal;
KNPA-rats, rats treated with i.p. co-administration of kaempferol and NPA;
NF-κB, Nuclear Factor kappa B;
NPA, 3-Nitropropionic Acid;
NPA-rats, rats treated with i.p. administration of NPA;
PBS, Phosphate-buffered saline;
pTau217, Phospho-tau (Thr217);
pTau181, Phospho-tau (Thr181);
PVDF, Polyvinylidene difluoride;
SDS-PAGE, Sodium dodecyl sulfate-polyacrylamide gel electrophoresis;
TBST, Tris-buffered saline (TBS) supplemented with 0.05% Triton X-100;
TNFα, Tumor Necrosis Factor-alpha;
TTC, 2,3,5-Triphenyl tetrazolium chloride
References
- Ludolph AC, He F, Spencer PS, Hammerstad J, Sabri M (1991) 3-Nitropropionic acid – exogenous animal neurotoxin and possible human striatal toxin. Can J Neurol Sci 18:492-498. [CrossRef]
- He F, Zhang S, Qian F, Zhang C (1995) Delayed dystonia with striatal CT lucencies induced by a mycotoxin (3-nitropropionic acid). Neurology 45:2178-2183. [CrossRef]
- Bendiksen Skogvold H, Yazdani M, Sandås EM, Østeby Vassli A, Kristensen E, Haarr D, Rootwelt H, Elgstøen KBP. (2022). A pioneer study on human 3-nitropropionic acid intoxication: Contributions from metabolomics. J Appl Toxicol 42: 818–829. [CrossRef]
- Brouillet E, Jacquard C, Bizat N, Blum D (2005) 3-Nitropropionic acid: a mitochondrial toxin to uncover physiopathological mechanisms underlying striatal degeneration in Huntington’s disease. J Neurochem 95:1521-1540. [CrossRef]
- Brouillet E, Conde F, Beal MF, Hantraye P (1999) Replicating Huntington’s disease phenotype in experimental animals. Prog Neurobiol 59:427-468. [CrossRef]
- Browne SE, Ferrante RJ, Beal MF (1999) Oxidative stress in Huntington’s disease. Brain Pathol 9:147-163. [CrossRef]
- Ho AK, Sahakian BJ, Brown RG, Barker RA, Hodges JR, Ané MN, Snowden J, Thompson J, Esmonde T, Gentry R, Moore JW, Bodner T (2003) Profile of cognitive progression in early Huntington’s disease. Neurology 61:1702-1706. [CrossRef]
- Phillips W, Shannon KM, Barker RA (2008) The current clinical management of Huntington’s disease. Mov Disord 23:1491–1504. [CrossRef]
- Tsang TM, Haselden JN, Holmes E (2009) Metabolomic characterization of the 3-nitropropionic acid rat model of Huntington’s disease. Neurochem Res 34:1261–1271. [CrossRef]
- Lagoa R, Lopez-Sanchez C, Samhan-Arias AK, Gañan CM, Garcia-Martinez V, Gutierrez-Merino C (2009) Kaempferol protects against rat striatal degeneration induced by 3-nitropropionic acid. J. Neurochem 111:473-487. [CrossRef]
- Lopez-Sanchez C, Garcia-Martinez V, Poejo J, Garcia-Lopez V, Salazar J, Gutierrez-Merino C (2020) Early reactive A1 astrocytes induction by the neurotoxin 3-nitropropionic acid in rat brain. Int J Mol Sci 21:3609. [CrossRef]
- Lopez-Sanchez C, Poejo J, Garcia-Lopez V, Salazar J, Garcia-Martinez V, Gutierrez-Merino C (2022) Kaempferol prevents the activation of complement C3 protein and the generation of reactive A1 astrocytes that mediate rat brain degeneration induced by 3-nitropropionic acid. Food Chem. Toxicol 164, 113017. [CrossRef]
- Bostan AC, Dum RP, Strick PL (2013) Cerebellar networks with the cerebral cortex and basal ganglia. Trends Cogn Sci 17:241-54. [CrossRef]
- Kishore A, Meunier S, Popa T (2014) Cerebellar influence on motor cortex plasticity: behavioral implications for Parkinson's disease. Front Neurol 5:68. [CrossRef]
- Contreras-López R, Alatriste-León H, Díaz-Hernández, E, Ramírez-Jarquín JO, Tecuapetla F (2023) The deep cerebellar nuclei to striatum disynaptic connection contributes to skilled forelimb movement. Cell Rep 42:112000. [CrossRef]
- Ryu JK, Nagai A, Kim J, Lee MC, McLarnon JG, Kim SU (2003) Microglial activation and cell death induced by the mitochondrial toxin 3-nitropropionic acid: In vitro and in vivo studies. Neurobiol Dis 12:121- 132. [CrossRef]
- Chakraborty J, Singh R, Dutta D, Naskar A, Rajamma U, Mohanakumar KP (2014) Quercetin improves behavioral deficiencies, restores astrocytes and microglia, and reduces serotonin metabolism in 3-nitropropionic acid-induced rat model of Huntington’s disease. CNS Neurosci Ther 20:10-19. [CrossRef]
- Jin X, Riew TR, Kim HL, Choi JH, Lee MY (2018) Morphological characterization of NG2 glia and their association with neuroglial cells in the 3-nitropropionic acid–lesioned striatum of rat. Sci Rep 8:5942. [CrossRef]
- Liu B, Gao HM, Wang JY, Jeohn GH, Cooper CL, Hong JS (2002) Role of nitric oxide in inflammation-mediated neurodegeneration. Ann N Y Acad Sci 962:318-331. [CrossRef]
- Nasr P, Gursahani HI, Pang Z, Bondada V, Lee J, Hadley RW, Geddes JW (2003) Influence of cytosolic and mitochondrial Ca2+, ATP, mitochondrial membrane potential, and calpain activity on the mechanism of neuron death induced by 3-nitropropionic acid. Neurochem Int 43:89-99. [CrossRef]
- Rosenstock TR, Carvalho AC, Jurkiewicz A, Frussa-Filho R, Smaili SS (2004) Mitochondrial calcium, oxidative stress and apoptosis in a neurodegenerative disease model induced by 3-nitropropionic acid. J Neurochem 88:1220-1228. [CrossRef]
- Gutierrez-Merino C, Lopez-Sanchez C, Lagoa R, Samhan-Arias AK, Bueno C, Garcia-Martinez V (2011) Neuroprotective actions of flavonoids. Curr Med Chem 18:1195-1212. [CrossRef]
- Nezhad Salari AM, Rasoulizadeh Z, Shabgah AG, Vakili-Ghartavol R, Sargazi G, Gholizadeh Navashenaq J (2024) Exploring the mechanisms of kaempferol in neuroprotection: Implications for neurological disorders. Cell Biochem Funct 42:e3964. [CrossRef]
- López-Sánchez C, Lagoa R, Poejo J, García-López V, García-Martínez V, Gutierrez-Merino C (2024) An Update of Kaempferol Protection against Brain Damage Induced by Ischemia-Reperfusion and by 3-Nitropropionic Acid. Molecules 29:776. [CrossRef]
- López-Sánchez C, Martín-Romero FJ, Sun F, Luis L, Samhan-Arias AK, García-Martínez V, Gutiérrez-Merino C (2007) Blood micromolar concentrations of kaempferol afford protection against ischemia/reperfusion induced damage in rat brain. Brain Res 1182:123-137. [CrossRef]
- Ren J, Lu Y, Qian Y, Chen B, Wu T, Ji G (2019) Recent progress regarding kaempferol for the treatment of various diseases. Exp Ther Med 18:2759-2776. [CrossRef]
- Silva Dos Santos J, Gonçalves Cirino JP, de Oliveira Carvalho P, Ortega MM (2021) The pharmacological action of kaempferol in central nervous system diseases: a review. Front Pharmacol 11:565700. [CrossRef]
- Liddelow SA, Guttenplan KA, Clarke LE, Bennett FC, Bohlen CJ, Schirmer L, Bennett ML, Münch AE, Chung WS, Peterson TC, Wilton DK, Frouin A, Napier BA, Panicker N, Kumar M, Buckwalter MS, Rowitch DH, Dawson VL, Dawson TM, Stevens B, Barres BA (2017) Neurotoxic reactive astrocytes are induced by activated microglia. Nature 541:481-487. [CrossRef]
- Singh-Bains MK, Mehrabi NF, Sehji T, Austria MDR, Tan AYS, Tippett LJ, Dragunow M, Waldvogel HJ, Faull RLM (2019) Cerebellar degeneration correlates with motor symptoms in Huntington disease. Ann Neurol 85:396-405. [CrossRef]
- Kulkarni AP, Kellaway LA, Kotwal GJ (2005) Herbal complement inhibitors in the treatment of neuroinflammation: future strategy for neuroprotection. Ann N Y Acad Sci 1056:413-429. [CrossRef]
- Frost GR, Li YM (2017) The role of astrocytes in amyloid production and Alzheimer’s disease. Open Biol 7:170228. [CrossRef]
- Nadler Y, Alexandrovich A, Grigoriadis N, Hartmann T, Rao KS, Shohami E, Stein R (2008) Increased expression of the gamma-secretase components presenilin-1 and nicastrin in activated astrocytes and microglia following traumatic brain injury. Glia 56:552–567. [CrossRef]
- Poejo J, Berrocal M, Saez L, Gutierrez-Merino C, Mata AM (2023) Store-Operated Calcium Entry Inhibition and Plasma Membrane Calcium Pump Upregulation Contribute to the Maintenance of Resting Cytosolic Calcium Concentration in A1-like Astrocytes. Molecules 28:5363. [CrossRef]
- Machein U, Lieb K, Hüll M, Fiebich BL (1995) L-1 beta and TNF alpha, but not IL-6, induce alpha 1-antichymotrypsin expression in the human astrocytoma cell line U373 MG. Neuroreport 6:2283-2286. [CrossRef]
- Blasko I, Veerhuis R, Stampfer-Kountchev M, Saurwein-Teissl M, Eikelenboom P, Grubeck-Loebenstein B (2000) Costimulatory effects of interferon-γ and interleukin-1β or tumor necrosis factor α on the synthesis of Aβ1–40 and Aβ1–42 by human astrocytes. Neurobiol Dis 7: 682–689. [CrossRef]
- Zhao J, O'Connor T, Vassar R (2011) The contribution of activated astrocytes to Aβ production: implications for Alzheimer’s disease pathogenesis. J Neuroinflammation 8:150. [CrossRef]
- Lahiani-Cohen I, Touloumi O, Lagoudaki R, Grigoriadis N, Rosenmann H (2020) Exposure to 3-nitropropionic acid mitochondrial toxin induces tau pathology in tangle-mouse model and in wild type-mice. Front Cell Dev Biol 7:321. [CrossRef]
- Guo JP, Arai T, Miklossy J, McGeer PL (2006) Aβ and tau form soluble complexes that may promote self-aggregation of both into the insoluble forms observed in Alzheimer’s disease. Proc Natl Acad Sci USA 103:1953-1958. [CrossRef]
- Pilati N, Barker M, Panteleimonitis S, Donga R, Hamann M (2008) A rapid method combining Golgi and Nissl staining to study neuronal morphology and cytoarchitecture. J Histochem Cytochem 56:539–550. [CrossRef]
- Fujita M, Kadota T, Sato T (1996) Developmental profiles of synaptophysin in granule cells of rat cerebellum: an immunohistocytochemical study. J Electron Microsc 45:185-194. [CrossRef]
- Bossi F, Tripodo C, Rizzi L, Bulla R, Agostinis C, Guarnotta C, Munaut C, Baldassarre G, Papa G, Zorzet S, Ghebrehiwet B, Ling GS, Botto M, Tedesco F (2014) C1q as a unique player in angiogenesis with therapeutic implication in wound healing. Proc Natl Acad Sci U S A 111:4209-4214. [CrossRef]
- Cavalli G, Colafrancesco S, Emmi G, Imazio M, Lopalco G, Maggio MC, Sota J, Dinarello CA (2021) Interleukin 1α: a comprehensive review on the role of IL-1α in the pathogenesis and treatment of autoimmune and inflammatory diseases. Autoimmun Rev 20:102763. [CrossRef]
- Morita H, Suzuki K, Mori N, Yasuhara, O (2006) Occurrence of complement protein C3 in dying pyramidal neurons in rat hippocampus after systemic administration of kainic acid. Neurosci Lett 409:35-40. [CrossRef]
- Hernandez-Encinas E, Aguilar-Morante D, Morales-Garcia JA, Gine E, Sanz-SanCristobal M, Santos A, Perez-Castillo A (2016) Complement component 3 (C3) expression in the hippocampus after excitotoxic injury: role of C/EBPβ. J Neuroinflammation 13:276. [CrossRef]
- Sarkar S, Raymick J, Cuevas E, Rosas-Hernandez H, Hanig J (2020) Modification of methods to use Congo-red stain to simultaneously visualize amyloid plaques and tangles in human and rodent brain tissue sections. Metab Brain Dis 35:1371-1383. [CrossRef]
- Pérez M, Hernández F, Avila J (2020) Protein Biomarkers for the Diagnosis of Alzheimer’s Disease at Different Stages of Neurodegeneration. Int J Mol Sci 21: 6749. [CrossRef]
- Luan K, Rosales JL, Lee KY (2013) Viewpoint: crosstalks between neurofibrillary tangles and amyloid plaque formation. Ageing Res Rev 12:174-181. [CrossRef]
- Wu T, Dejanovic B, Gandham VD, Gogineni A, Edmonds R, Schauer S, Srinivasan K, Huntley MA, Wang Y, Wang TM, Hedehus M, Barck KH, Stark M, Ngu H, Foreman O, Meilandt WJ, Elstrott J, Chang MC, Hansen DV, Carano RAD, Sheng M, Hanson JE (2019) Complement C3 Is Activated in Human AD Brain and Is Required for Neurodegeneration in Mouse Models of Amyloidosis and Tauopathy. Cell Rep 28:2111-2123.e6. [CrossRef]
- Milani R, Mazzeo LA, Vismara D, Salemi I, Dainese E, Maderna E, Pellencin E, Catania M, Campanella N, Di Fede G, Giaccone G, Salmaggi A (2023) Spontaneous intracerebral haemorrhage associated with early-onset cerebral amyloid angiopathy and Alzheimer's disease neuropathological changes five decades after cadaveric dura mater graft. Acta Neuropathol Commun 11:30. [CrossRef]
- Fisher M (2008) Injuries to the vascular endothelium: vascular wall and endothelial dysfunction. Rev Neurol Dis 5 (Suppl 1): S4-S11.
- Benoit L, Hristovska I, Liaudet N, Jouneau PH, Fertin A, de Ceglia R, Litvin DG, Di Castro MA, Jevtic M, Zalachoras I, Kikuchi T, Telley L, Bergami M, Usson Y, Hisatsune C, Mikoshiba K, Pernet-Gallay K, Volterra A (2025) Astrocytes functionally integrate multiple synapses via specialized leaflet domains. Cell 188:6453-6472.e16. [CrossRef]
- Farina C, Aloisi F, Meinl E (2007) Astrocytes are active players in cerebral innate immunity. Trends Immunol 28:138-145. [CrossRef]
- Lee KM, MacLean AG (2015) New advances on glial activation in health and disease. World J Virol 4:42-55. [CrossRef]
- Yu L, Chen C, Wang LF, Kuang X, Liu K, Zhang H, Du JR (2013) Neuroprotective effect of kaempferol glycosides against brain injury and neuroinflammation, inhibiting the activation of NF-κB and STAT3 in transient focal stroke. PLoS ONE 8:e55839. [CrossRef]
- Yu L, Chen C, Wang LF, Kuang X, Liu K, Zhang H, Du JR (2025) Correction: Neuroprotective effect of Kaempferol Glycosides against brain injury and Neuroinflammation by inhibiting the activation of NF-κB and STAT3 in transient focal stroke. PLoS One 20:e0320685. [CrossRef]
- Li WH, Cheng X, Yang YL, Liu M, Zhang SS, Wang YH, Du GH (2019) Kaempferol attenuates neuroinflammation and blood brain barrier dysfunction to improve neurological deficits in cerebral ischemia/reperfusion rats. Brain Res 1722:146361. [CrossRef]
- Zhang SS, Liu M, Liu DN, Shang YF, Du GH, Wang YH (2022) Network pharmacology analysis and experimental validation of kaempferol in the treatment of ischemic stroke by inhibiting apoptosis and regulating neuroinflammation involving neutrophils. Int J Mol Sci 23:12694. [CrossRef]
- Li F, Zhao H, Li G, Zhang S, Wang R, Tao Z, Zheng Y, Han Z, Liu P, Ma Q, Luo Y (2020) Intravenous antagomiR-494 lessens brain-infiltrating neutrophils by increasing HDAC2-mediated repression of multiple MMPs in experimental stroke. FASEB J 34:6934-6949. [CrossRef]
- Kim SW, Lee H, Lee HK, Kim ID, Lee JK (2019) Neutrophil extracellular trap induced by HMGB1 exacerbates damages in the ischemic brain. Acta Neuropathol Commun 7:94. [CrossRef]
- Mita S, Schon EA, Herbert J (1989) Widespread expression of amyloid beta-protein precursor gene in rat brain. Am J Pathol 134:1253-1261. PMID: 2502926; PMCID: PMC1879949.
- Kobro-Flatmoen A, Hormann TM, Gouras G (2023) Intracellular Amyloid-β in the Normal Rat Brain and Human Subjects and Its relevance for Alzheimer's Disease. J Alzheimers Dis 95:719-733. [CrossRef]
- Park SH, Oh SR, Jung KY, Lee IS, Ahn KS, Kim JH, Kim YS, Lee JJ, Lee HK (1999) Acylated flavonol glycosides with anti-complement activity from Persicaria lapathifolia. Chem Pharm Bull 47:1484–1486. [CrossRef]
- Suárez-Calvet M, Karikari TK, Ashton NJ, Lantero Rodríguez J, Milà-Alomà M, Gispert JD, Salvadó G, Minguillon C, Fauria K, Shekari M, Grau-Rivera O, Arenaza-Urquijo EM, Sala-Vila A, Sánchez-Benavides G, González-de-Echávarri JM, Kollmorgen G, Stoops E, Vanmechelen E, Zetterberg H, Blennow K, Molinuevo JL (2020) ALFA Study. Novel tau biomarkers phosphorylated at T181, T217 or T231 rise in the initial stages of the preclinical Alzheimer's continuum when only subtle changes in Aβ pathology are detected. EMBO Mol Med 12:e12921. [CrossRef]
- Wennström M, Janelidze S, Nilsson KPR; Netherlands Brain Bank; Serrano GE, Beach TG, Dage JL, Hansson O (2022) Cellular localization of p-tau217 in brain and its association with p-tau217 plasma levels. Acta Neuropathol Commun 10:3. [CrossRef]
- Hirota Y, Sakakibara Y, Ibaraki K, Takei K, Iijima KM, Sekiya M (2022) Distinct brain pathologies associated with Alzheimer's disease biomarker-related phospho-tau 181 and phospho-tau 217 in App knock-in mouse models of amyloid-β amyloidosis. Brain Commun 4:fcac286. [CrossRef]
- Ouary S, Bizat N, Altairac S, Ménétrat H, Mittoux V, Condé F, Hantraye P, Brouillet E (2000) Major strain differences in response to chronic systemic administration of the mitochondrial toxin 3-nitropropionic acid in rats: implications for neuroprotection studies. Neuroscience 97:521–530. [CrossRef]
- Sun F, Lopez-Sanchez C, Martin-Romero FJ, Luis L, Gutierrez-Merino C, Garcia-Martinez V (2005) Transfemoral selective "intraluminal wiring" technique for transient middle cerebral artery occlusion in rats. J Neurosci Methods 149:82-89. [CrossRef]
Figure 1.
Kaempferol protects against NPA-induced damage to the cerebellum. Representative coronal sections of the cerebellum of the Control-, NPA- and KNPA-groups after staining with 2,3,5-triphenyltetrazolium chloride (TTC), Nissl staining and immunohistochemistry with anti-synaptophysin (SYP). Panel a illustrates with TTC staining the white areas and microhemorrhages (yellow arrows) induced by NPA treatment detected in the cerebellar nuclei (NPA-group). The damaged tissue is undetectable in rats treated with kaempferol (KNPA-group), showing a TTC staining intensity similar to the Control-group. The yellow square mark indicates the area of the cerebellum showed in panels b-e. Note in panel b the decreased Nissl staining in the soma of cerebellar nuclei neurons in the NPA-group compared with the Control- and KNPA-groups. Higher magnification images of Nissl staining (c) show the decrease in large multipolar neurons (red arrows) in the dentate nucleus (DN), which is completely prevented by concomitant treatment with kaempferol. Comparative immunostaining with anti-SYP (d, e) shows synaptic destruction in the cerebellar nuclei after treatment with NPA and their preservation with kaempferol co-administration. Note in the high magnification images (e) the decrease in synaptic vesicles in the dentate nucleus neurons (green arrows) of the NPA-group. BS: brain stem; IP: interposed nucleus; 4V: fourth ventricle. White scale bar: 2 mm. Red scale bar: 200 μm. Yellow scale bar: 25 μm.
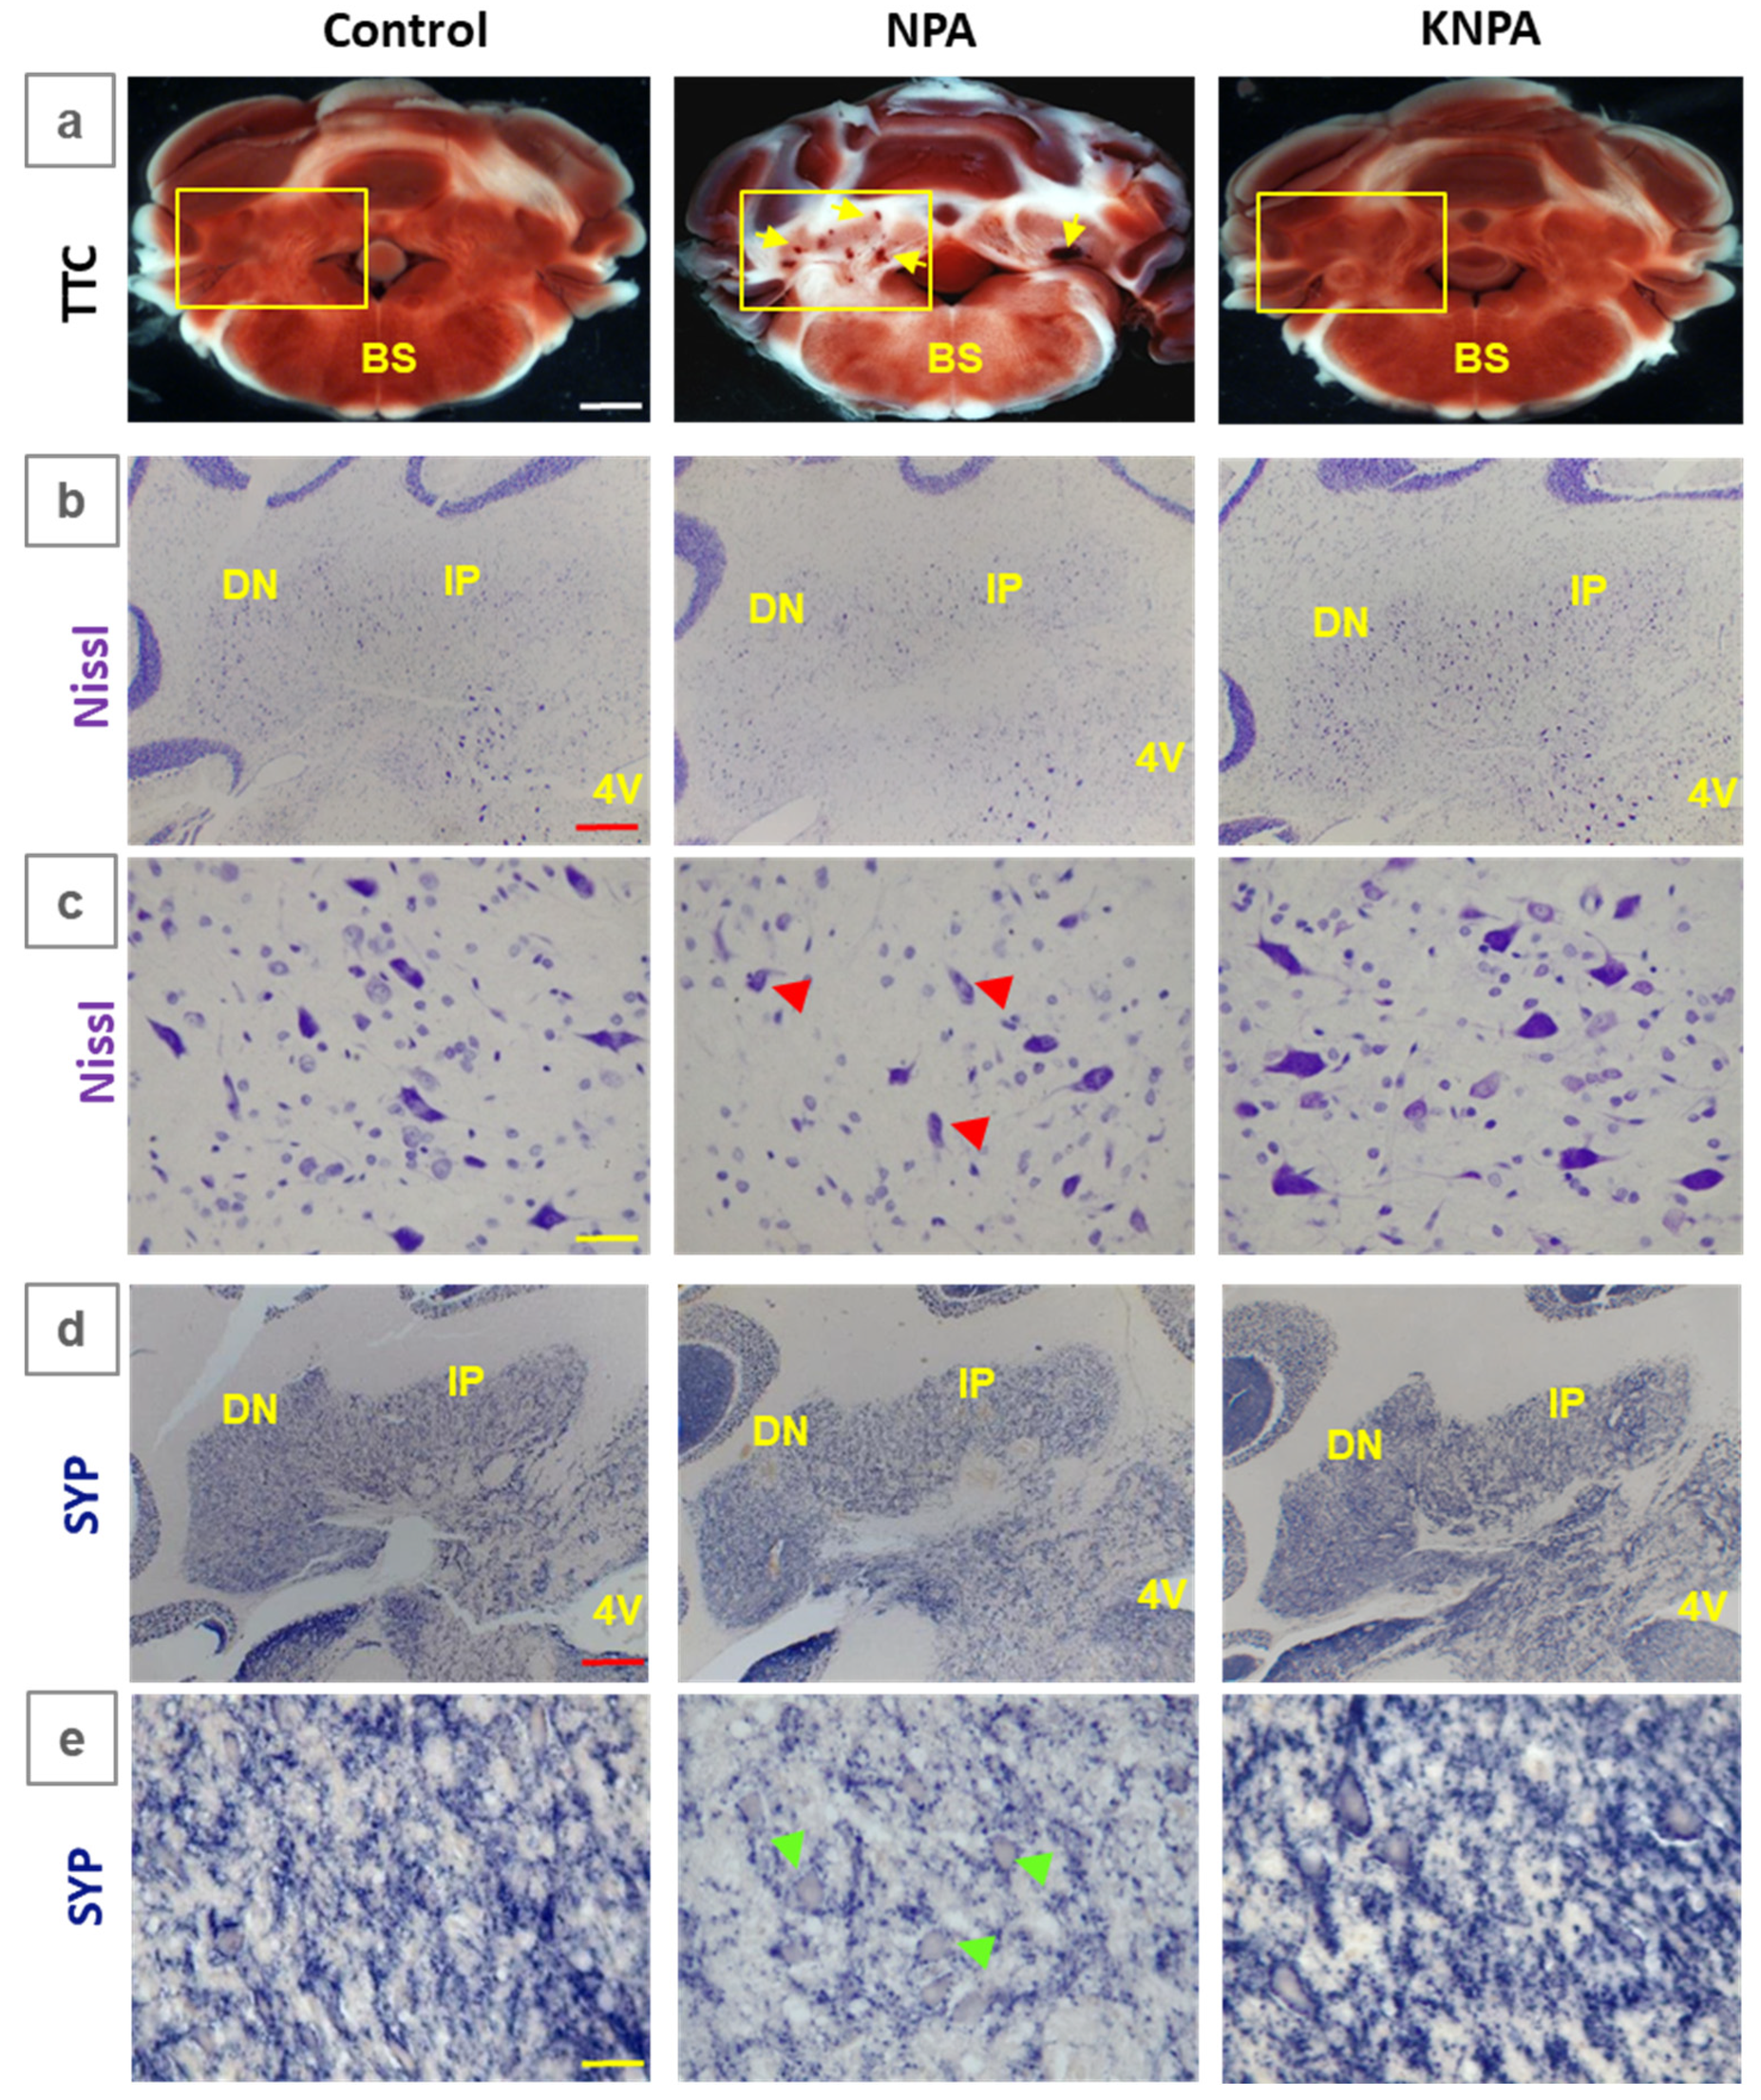
Figure 2.
Kaempferol prevents an increase of proinflammatory cytokines TNFα, IL-1β, IL-1α and complement C1q in the cerebellum of NPA-treated rats. (a) Representative coronal sections of cerebellar nuclei after immunohistochemistry with anti-TNFα, anti-IL-1β, anti-IL-1α and anti-C1q corresponding to Control-, NPA- and KNPA-groups. NPA-group shows intense immunoreactivity of these cytokines, both in the interposed (IP) and dentate nuclei (DN). (b) Histograms of the intensity of positive pixels in TNFα, IL-1β, IL-1α, and C1q staining images, from n = 3 different rats in each group, obtained with Image J® software. The intensity of positive pixels is higher in the NPA-group with (*) p < 0.05, compared to the Control-group. Cerebellar nuclei sections of rats treated with kaempferol (KNPA-group) show a low immunoreactivity, similar to the Control-group. Higher magnification images of the dentate nucleus (c) and cerebellar cortex (d) show somas of large multipolar neurons of the dentate nucleus and Purkinje cells stained with all four cytokines in the NPA-group. No staining in the cellular soma is observed in Control- and KNPA-groups. Note that the images of the dentate nucleus stained with anti-IL-1α and anti-C1q antibodies (c), which also stain small blood vessels, reveals NPA-induced thickening of microvasculature in this region of the cerebellum. 4V: fourth ventricle; pcl: Purkinje cell layer; ml: molecular layer; gl: granular layer. Red scale bar: 200 μm. Yellow scale bar: 25 μm.
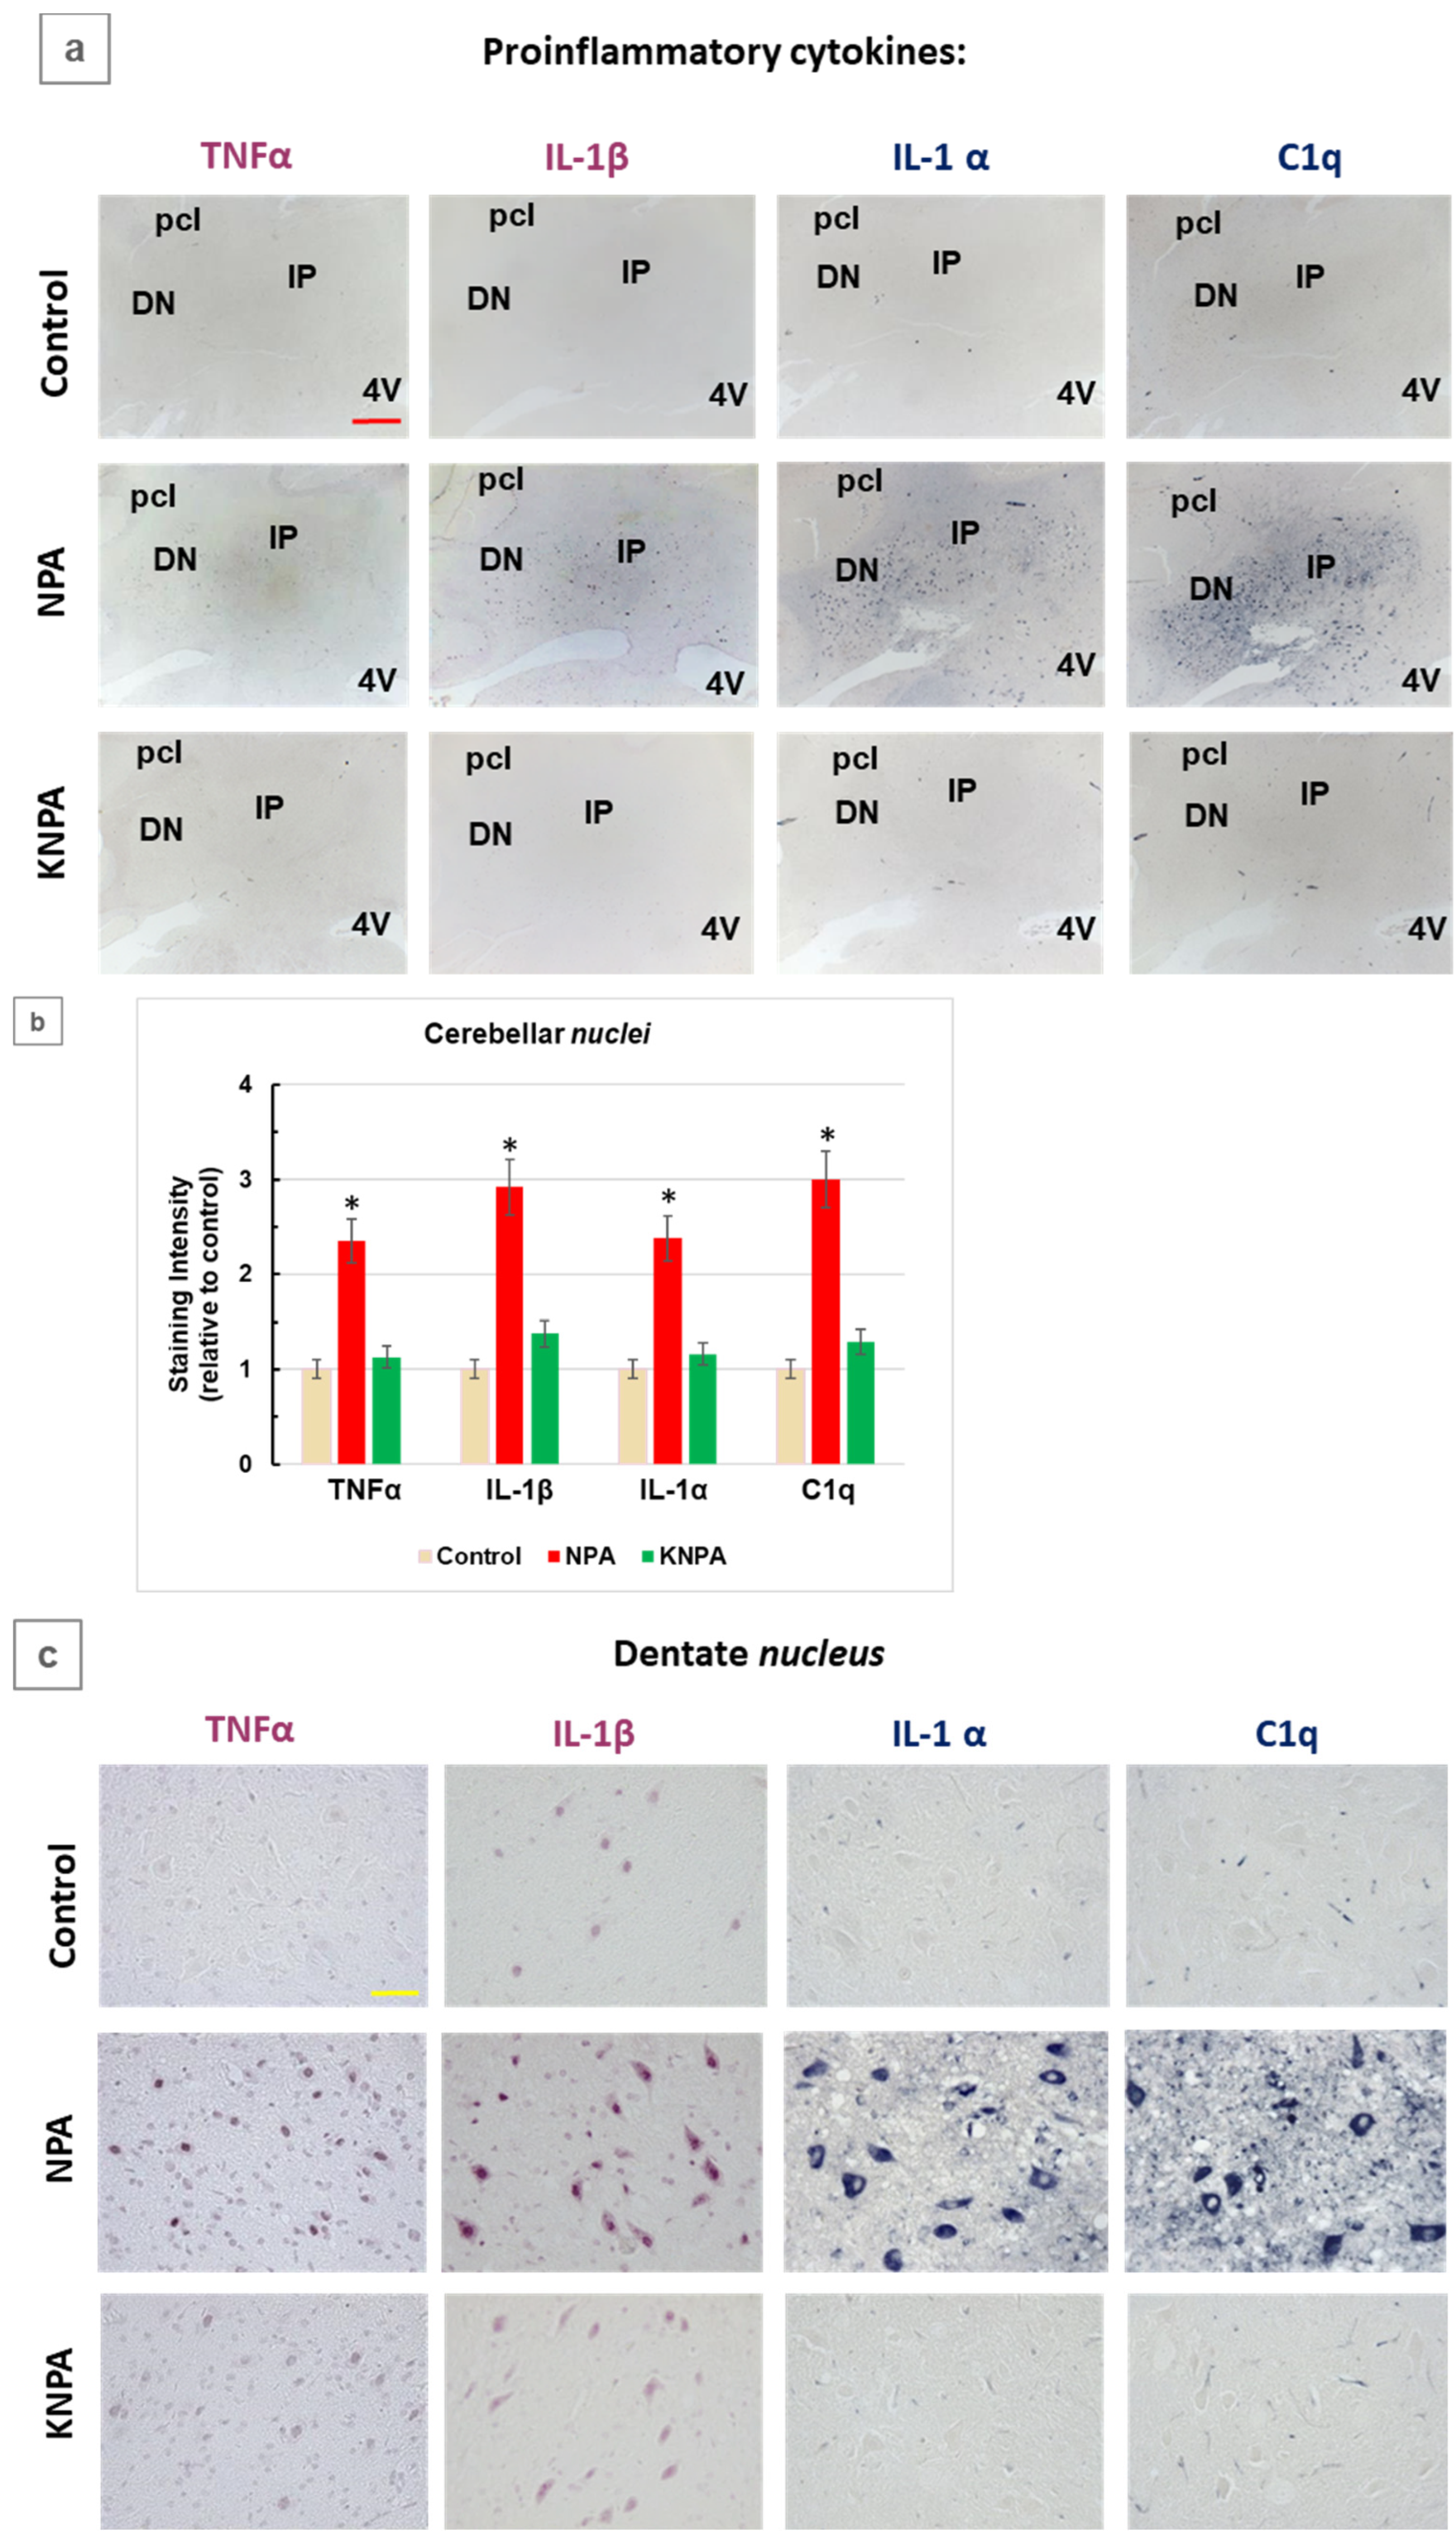
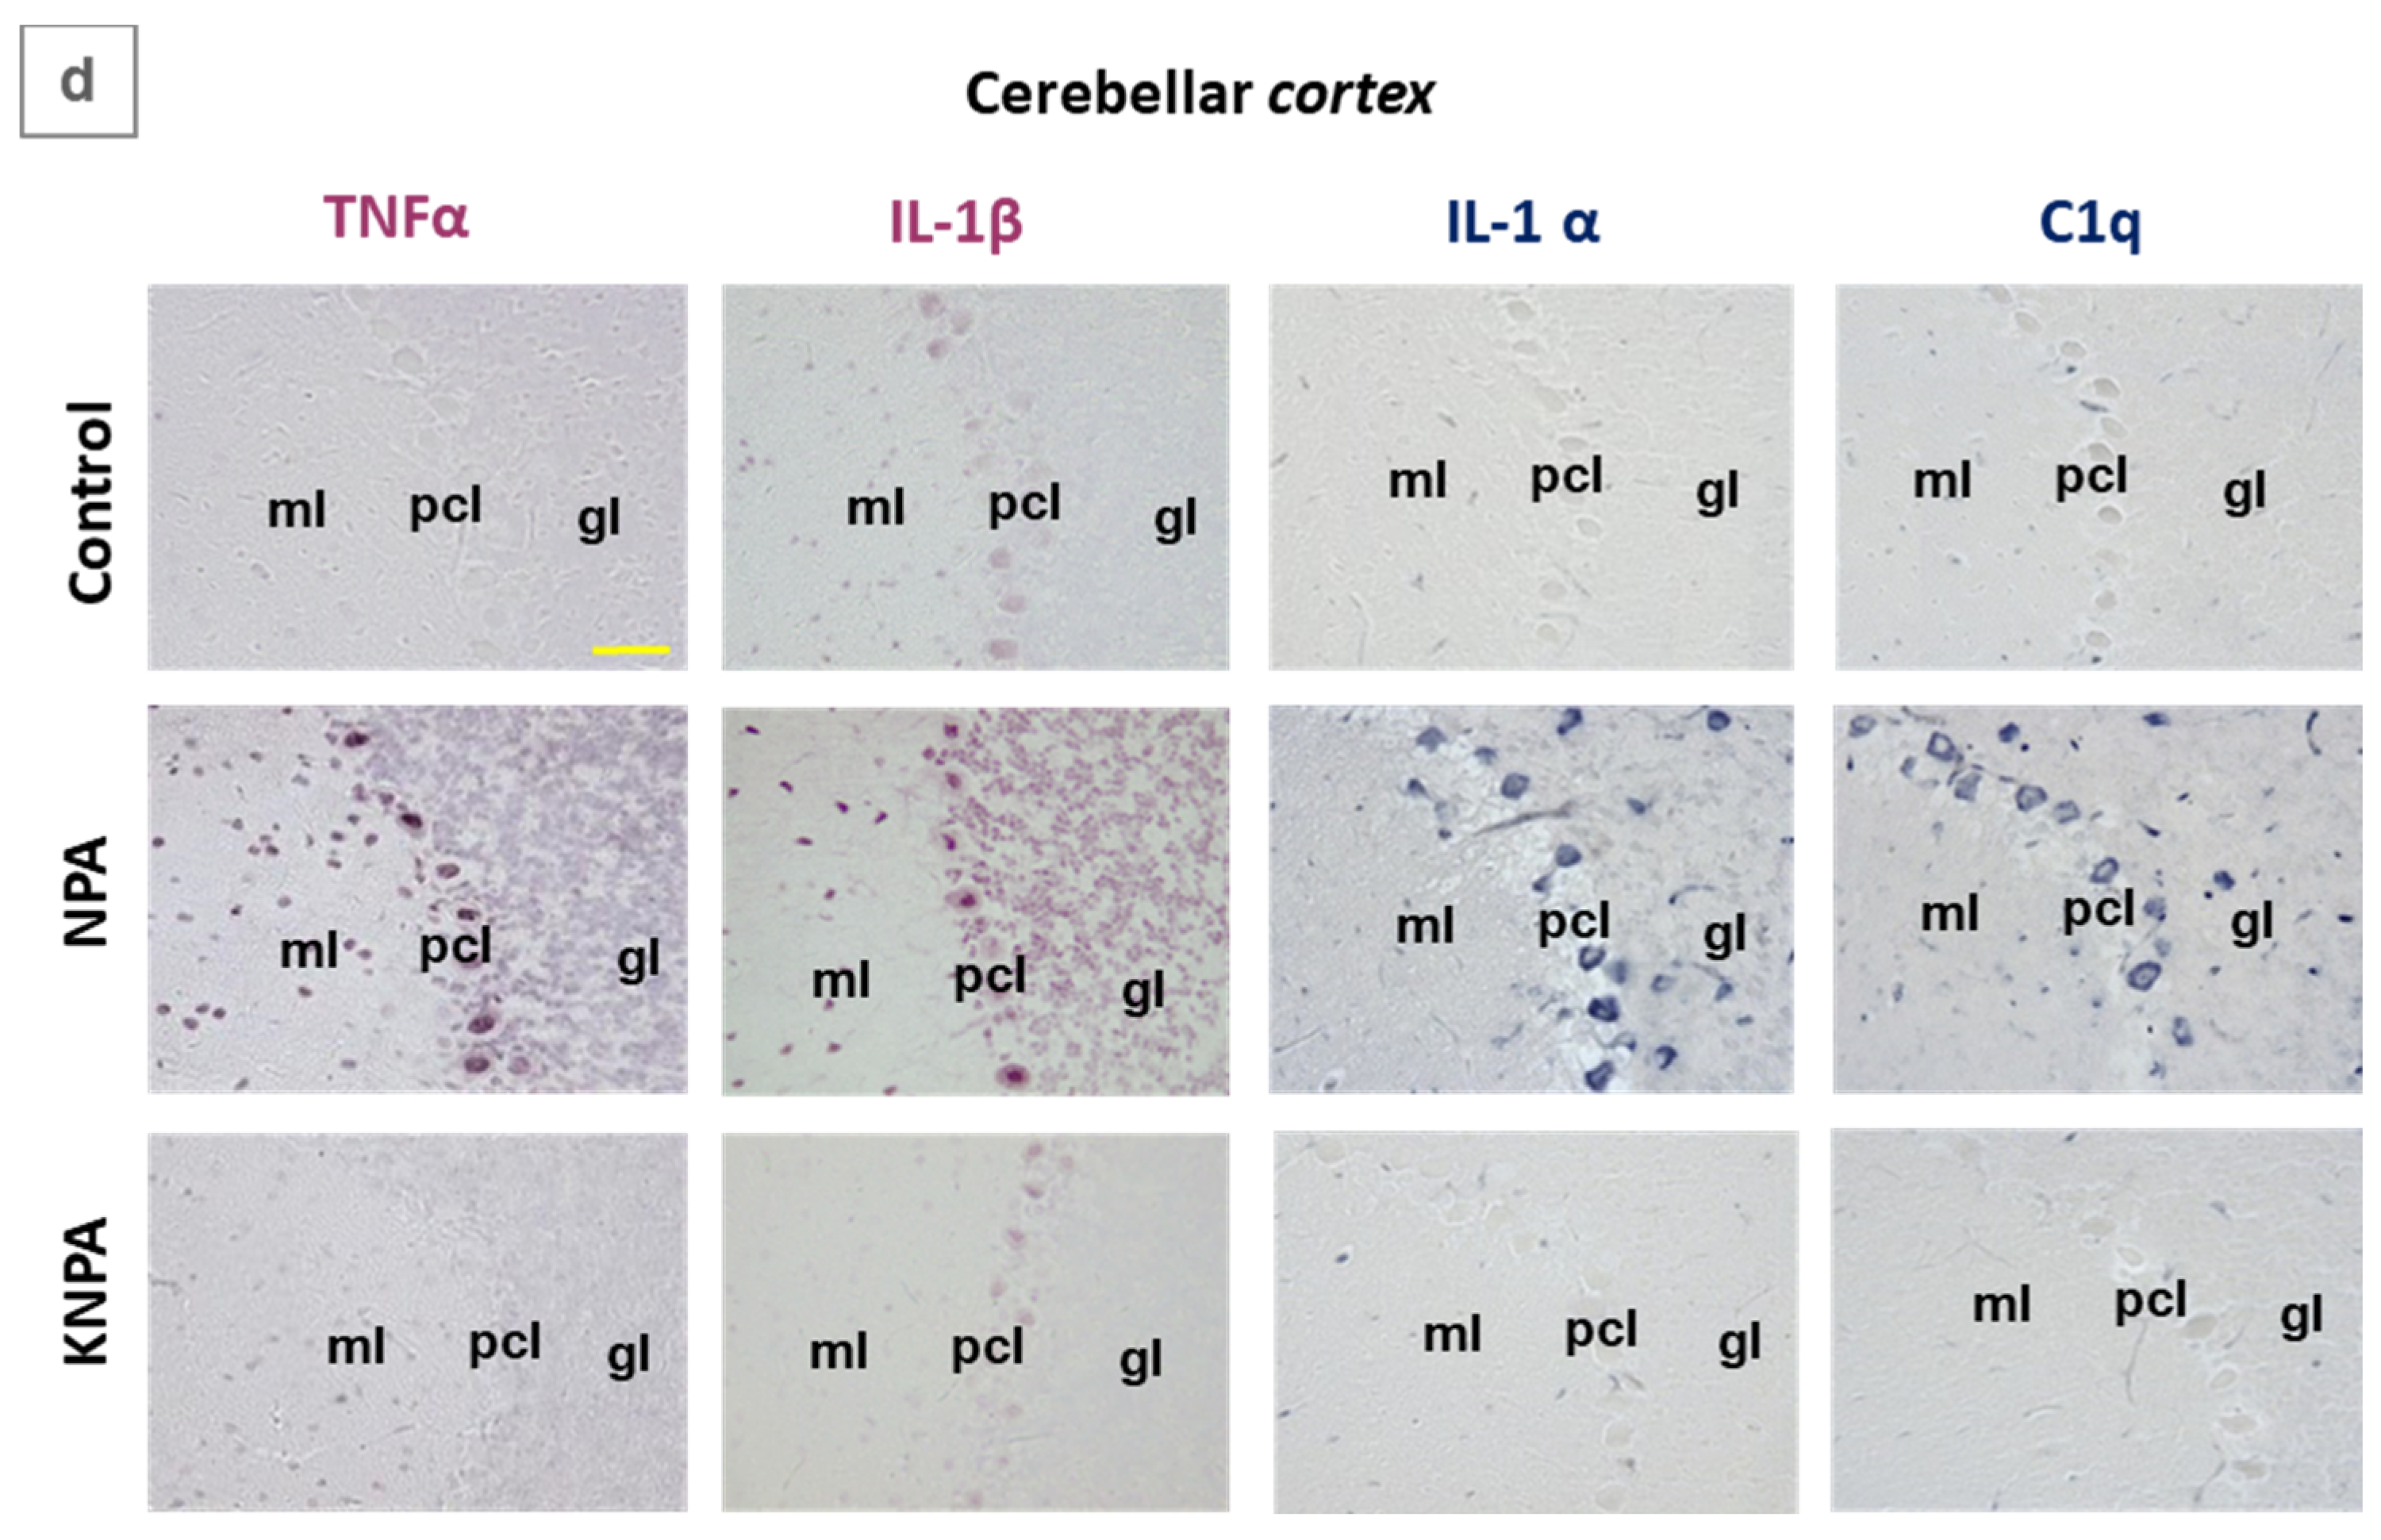
Figure 3.
Kaempferol protects against NPA-induced complement C3 activation in the cerebellum. (a) Representative Western blots of C3 protein and β-actin of cerebellum homogenates of rats of Control-group (CT), NPA-group (NPA) and KNPA-group (KNPA). After acquisition of images of the Western blot with anti-C3, the PVDF membrane was stripped and processed for the Western blot of anti-β-actin. Kaempferol protects against the increase of C3α and C3α proteolytic fragments induced by administration of NPA in the cerebellum with respect to rats of the CT. (b) Representative coronal sections after immunohistochemistry with anti-C3 corresponding to the cerebellar nuclei of the Control-, NPA- and KNPA-groups. Rats treated with NPA (NPA-group) show intense C3 immunoreactivity in both the interposed (IP) and dentate nuclei (DN). (c) Histograms of the intensity of positive pixels of the images of C3 staining, from n =3 different rats of each group obtained with Image J® software. The intensity of C3-immunostaining is higher in the NPA group with (*) p < 0.05 compared to the control group. Rat cerebellum sections treated with kaempferol (KNPA-group) show a low immunoreactivity, which is not significantly different to the Control-group. Higher magnification images of the dentate nucleus (d) and cerebellar cortex (e) show that in the NPA-group the somas of large multipolar neurons of the dentate nucleus and Purkinje cells layer are the most intensely stained with anti-C3 antibody. A significant characteristic of anti-C3 antibody is that it also stains small blood vessels in the cerebellar slices, which are marked with yellow arrows in the three groups. 4V: fourth ventricle; pcl: Purkinje cell layer; ml: molecular layer; gl: granular layer. Red scale bar: 200 μm. Yellow scale bar: 25 μm.
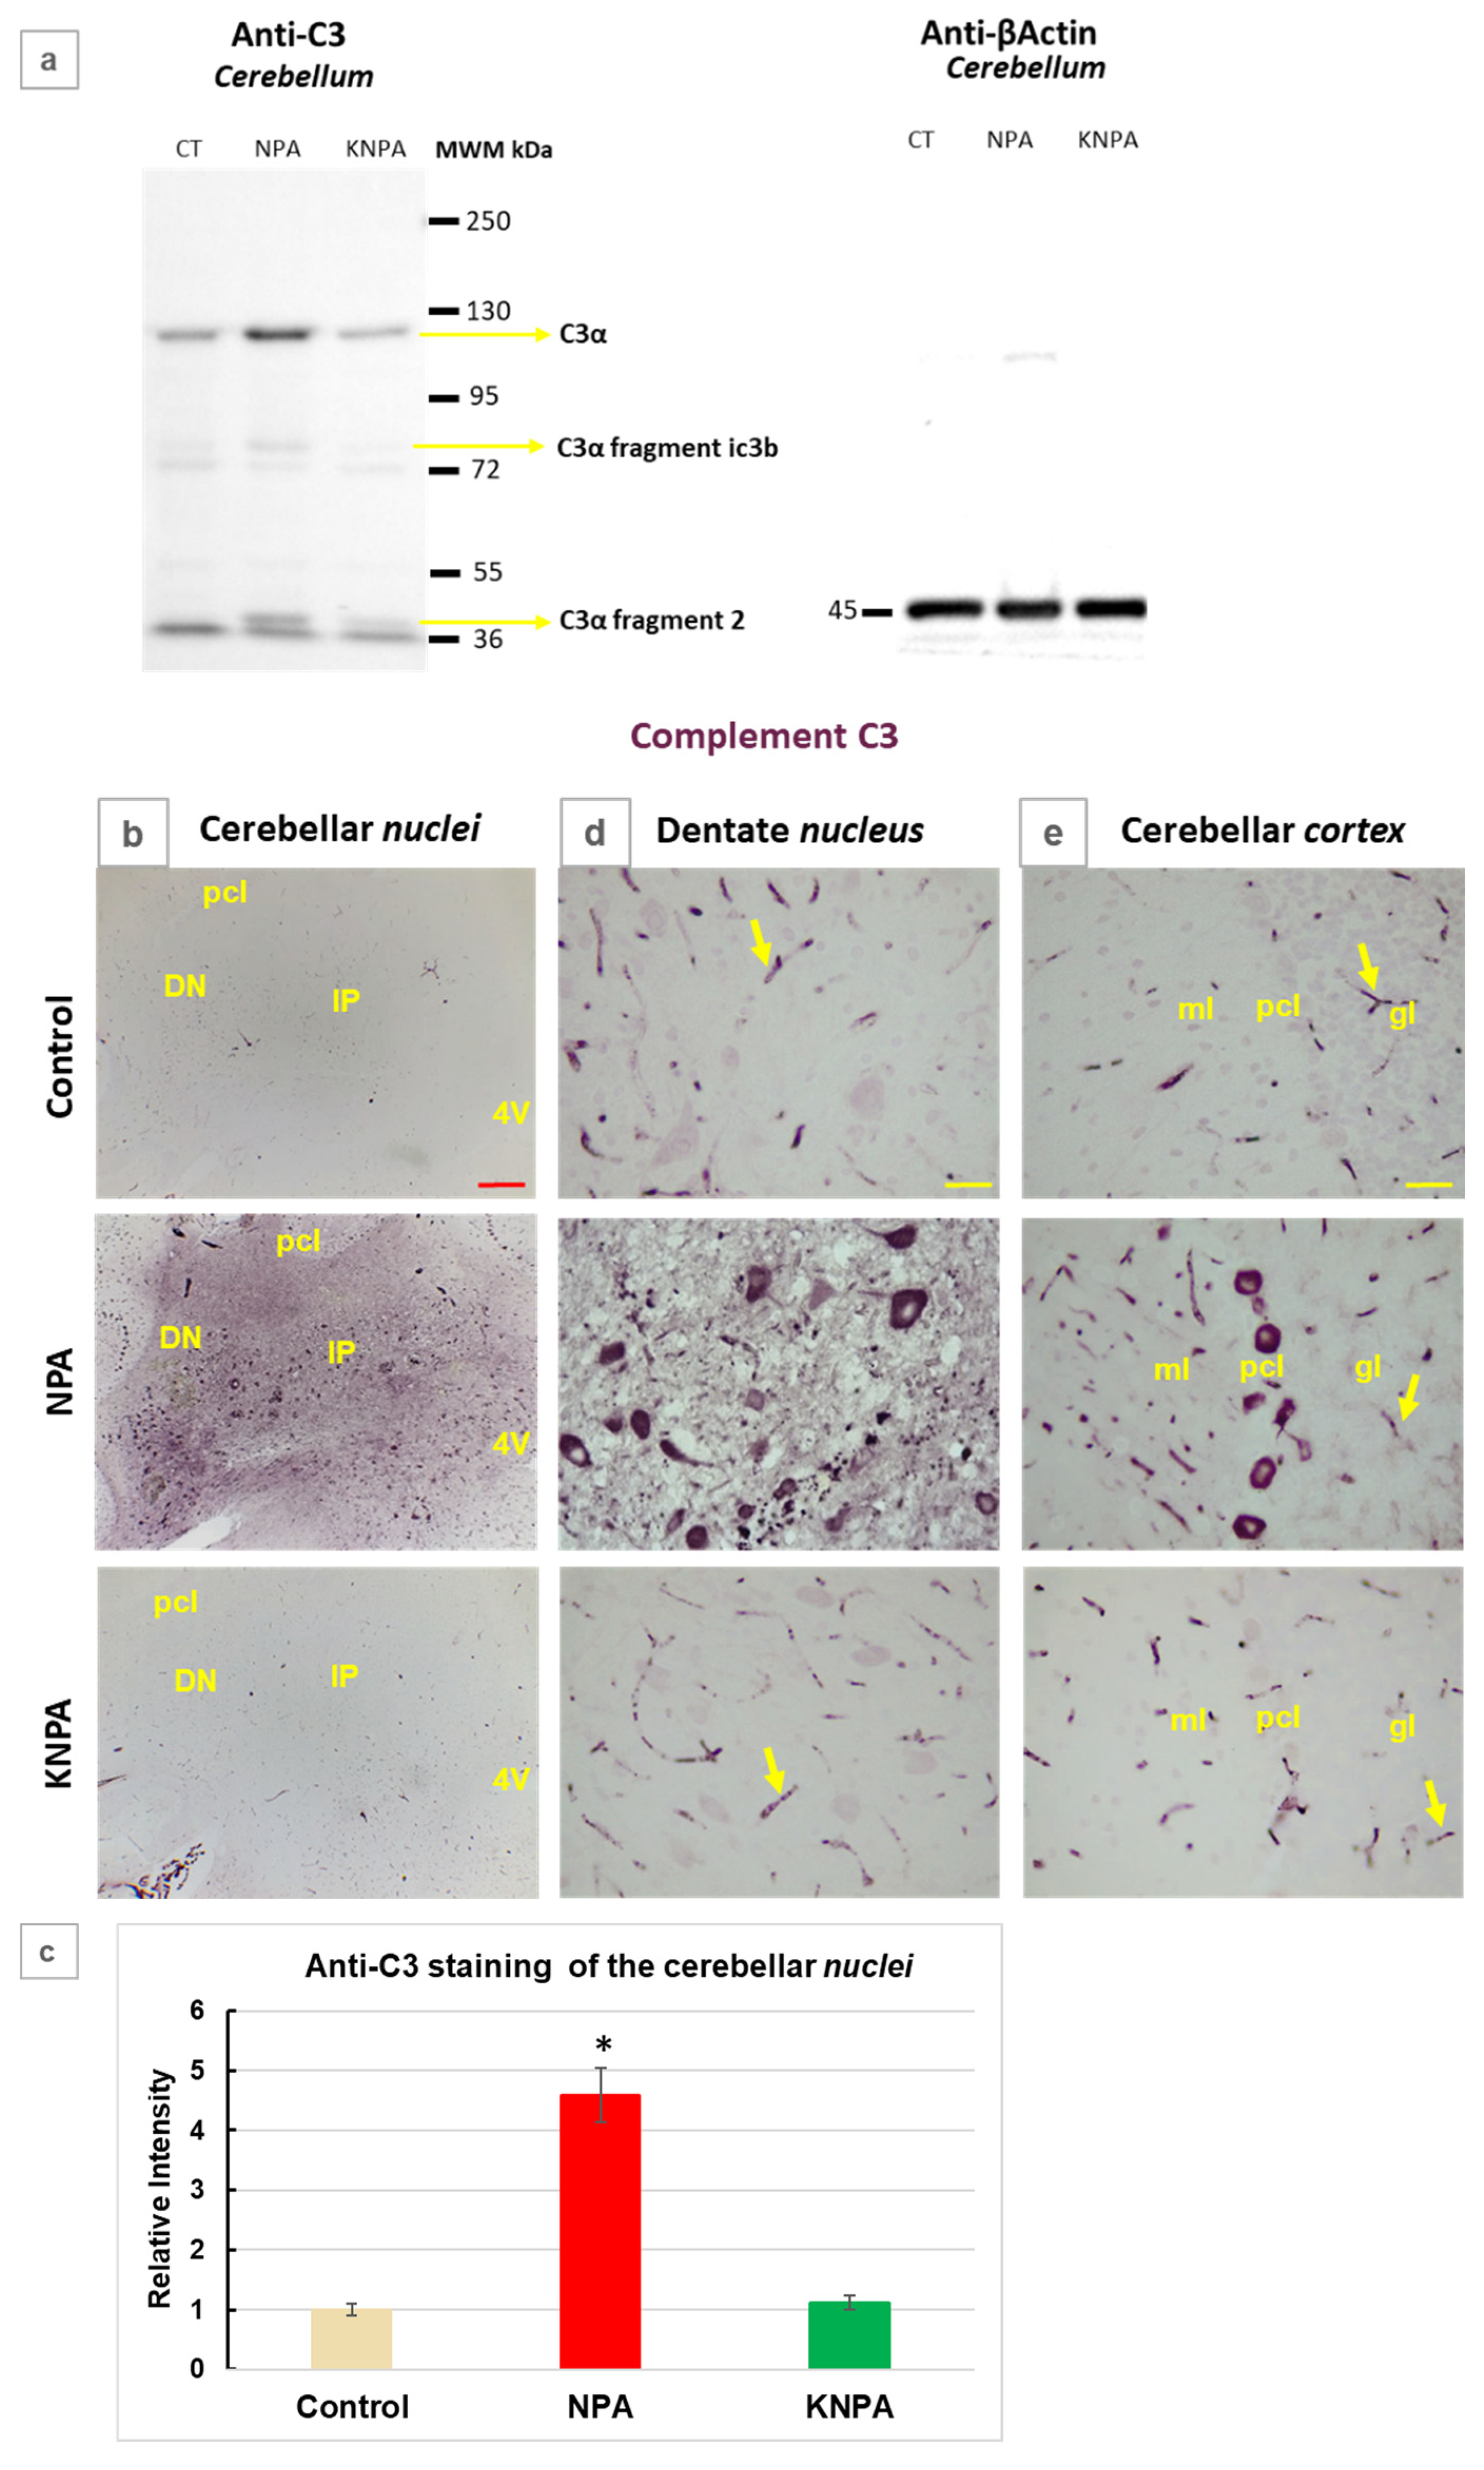
Figure 4.
Kaempferol prevents the generation of reactive A1 astrocytes induced by NPA in the cerebellum. Double immunohistochemistry with anti-GFAP (in blue) and anti-C3 (in red) in coronal sections of cerebellar nuclei prepared from the Control-, NPA- and KNPA-groups. In the NPA-group, higher magnification images of the dentate nucleus (DN) and cerebellar cortex show large somas of multipolar neurons (n) of the dentate nucleus and Purkinje cells, stained with C3, and co-location of GFAP and complement C3 protein in ameboid-shaped reactive A1 astrocyte (red arrowheads). C3 staining or co-location of GFAP and complement C3 protein is not observed in Control- and KNPA-groups. Of note, small blood vessels intensely stained with the anti-C3 antibody are marked in the three groups with yellow arrows. 4V: fourth ventricle; pcl: Purkinje cell layer; ml: molecular layer; gl: granular layer. Red scale bar: 200 μm. Green scale bar: 10 μm.
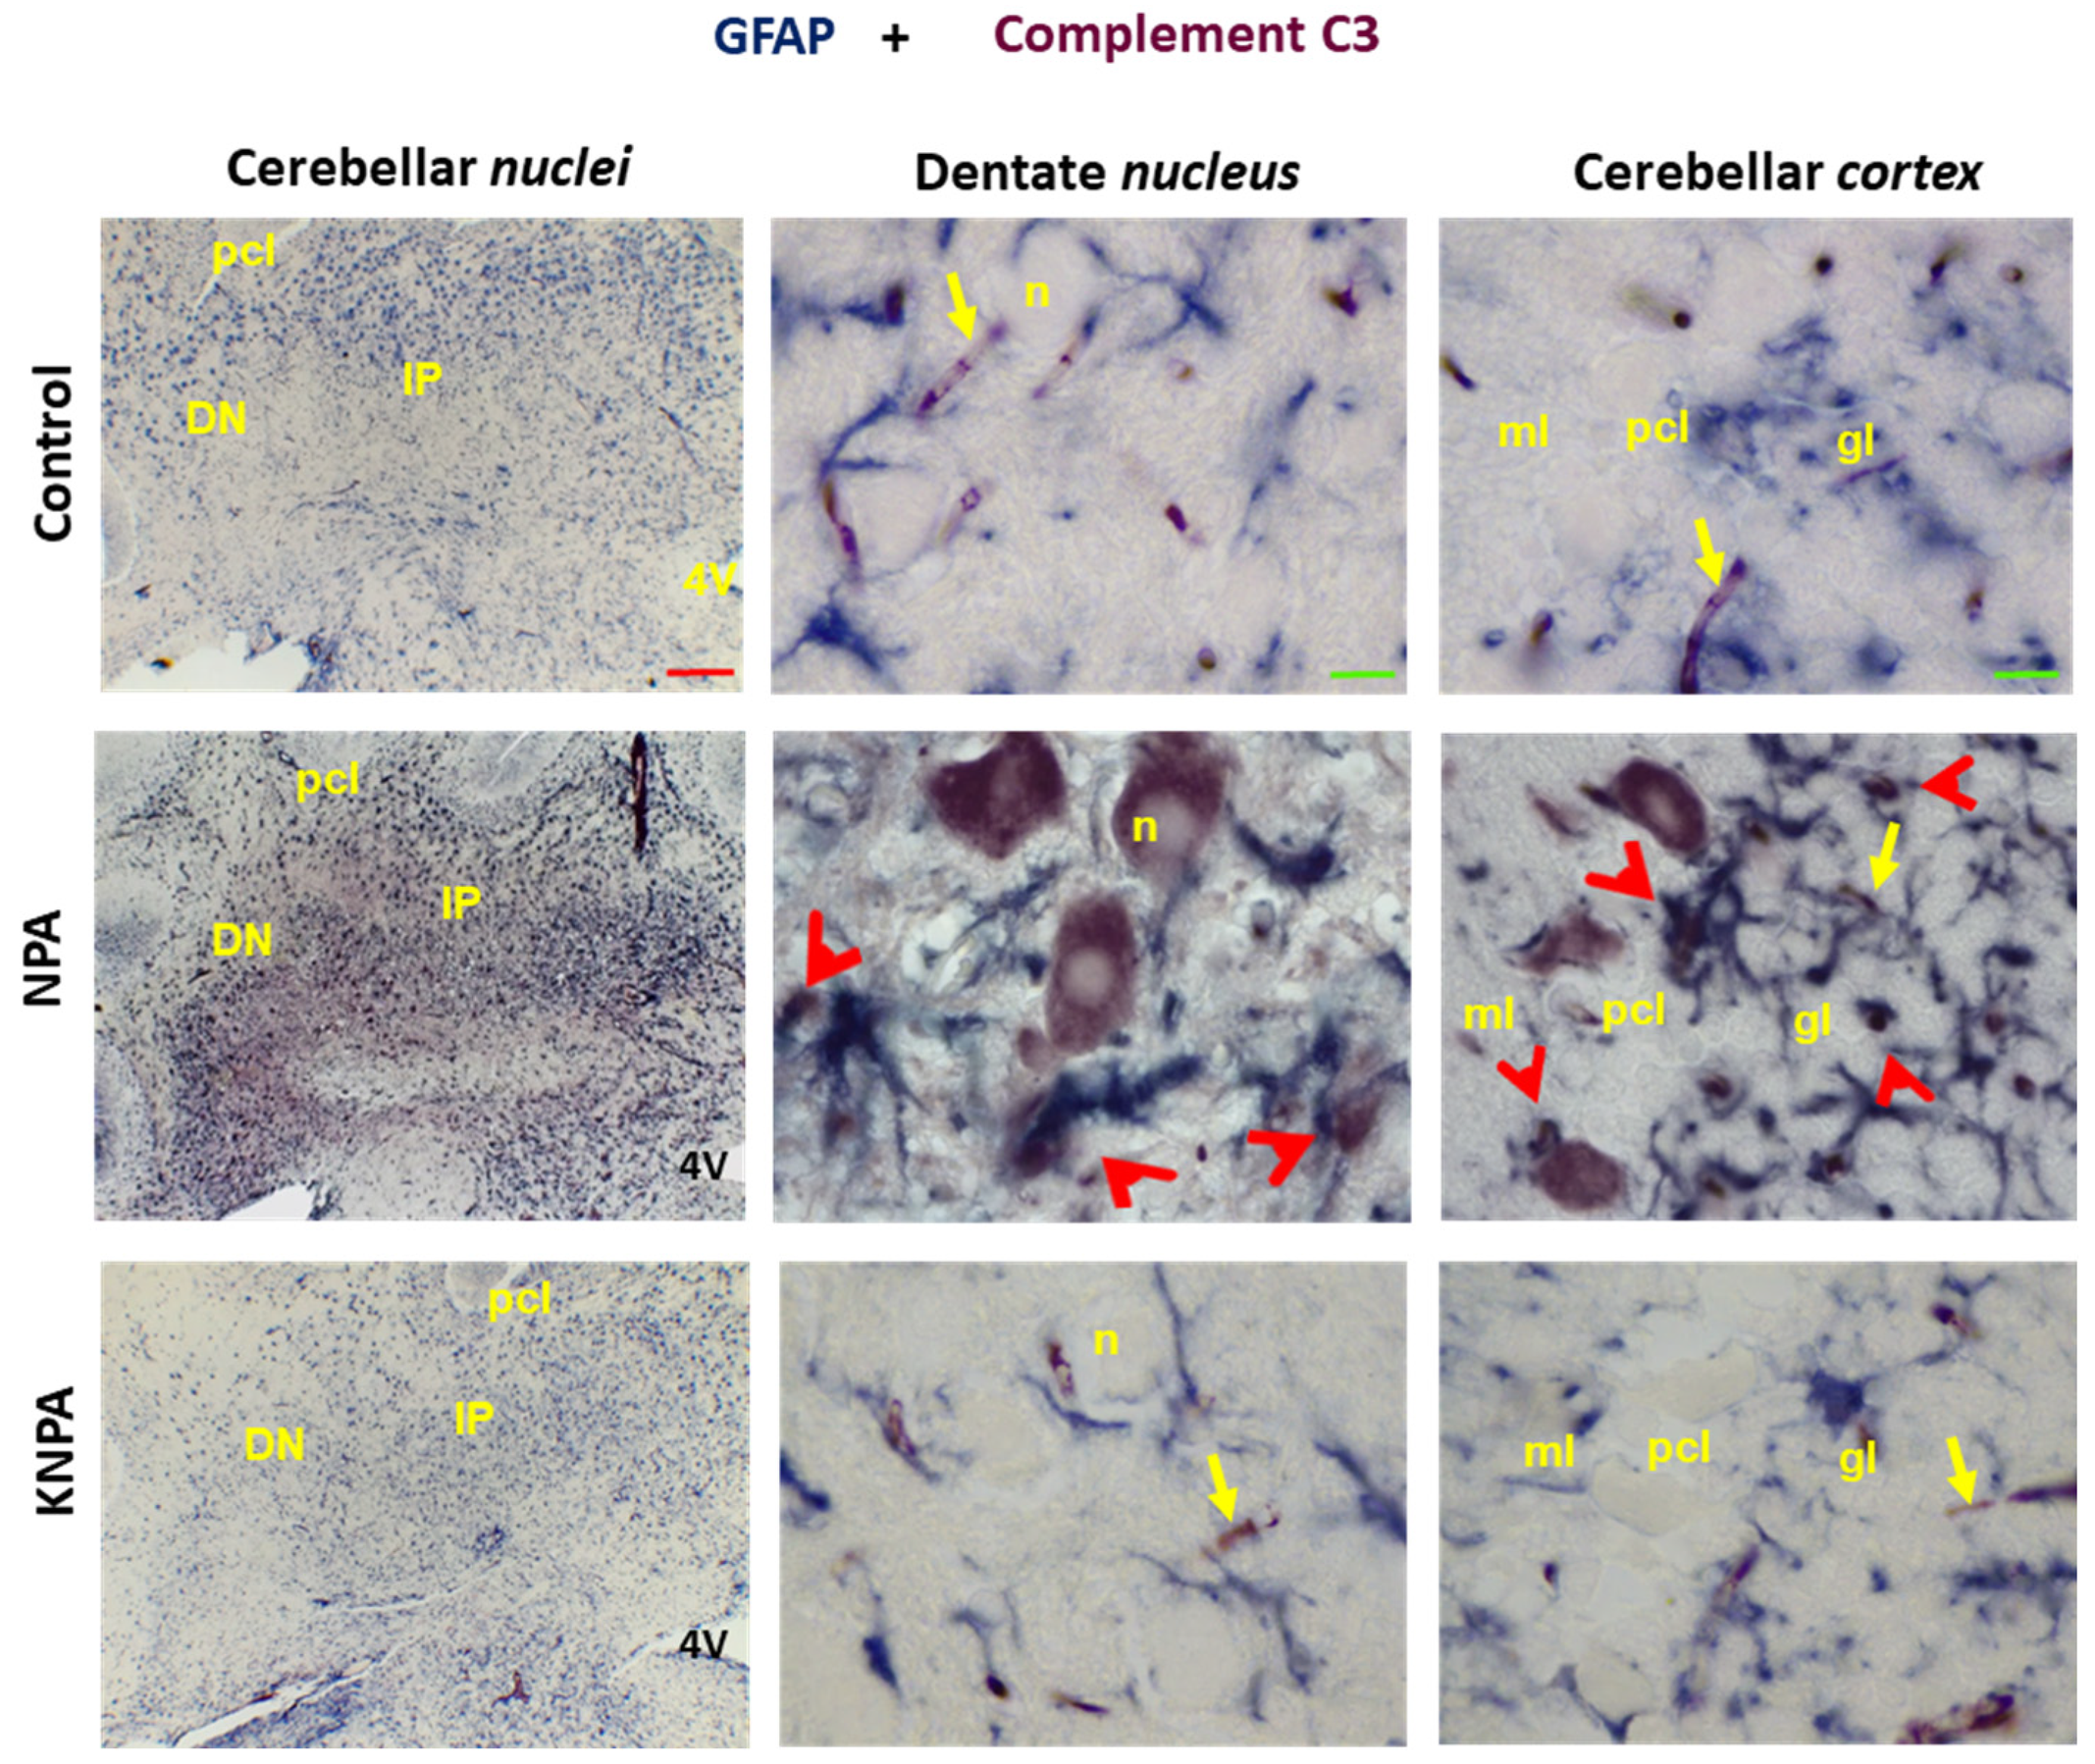
Figure 5.
Kaempferol prevents the increase of the Aβ(1-42) levels induced by NPA in the cerebellum. (a) Representative coronal sections after immunohistochemistry with anti-beta amyloid Aβ(1-42) corresponding to the cerebellar nuclei of the Control-, NPA- and KNPA-groups. Rats treated with NPA (NPA-group) show intense Aβ(1-42) immunoreactivity in both the interposed (IP) and dentate nuclei (DN). (b) Histograms of the intensity of positive pixels of the images of Aβ(1-42) staining, from n =3 different rats of each group obtained with Image J® software. The intensity of Aβ(1-42) immunostaining is higher in the NPA-group with (*) p < 0.05 compared to the Control-group. Rat cerebellum sections treated with kaempferol (KNPA-group) show a low immunoreactivity, which is not significantly different to that found for the Control-group. Higher magnification images of the dentate nucleus (c) and cerebellar cortex (d) show large somas of multipolar neurons of the dentate nucleus as well as the Purkinje and granular layers strongly stained with Aβ(1-42 in the NPA-group. A significant characteristic of anti-Aβ(1-42) antibody staining of cerebellar slices is that it intensely stains small blood vessels (marked in the three groups with yellow arrows). 4V: fourth ventricle; pcl: Purkinje cell layer; ml: molecular layer; gl: granular layer. Red scale bar: 200 μm. Yellow scale bar: 25 μm.
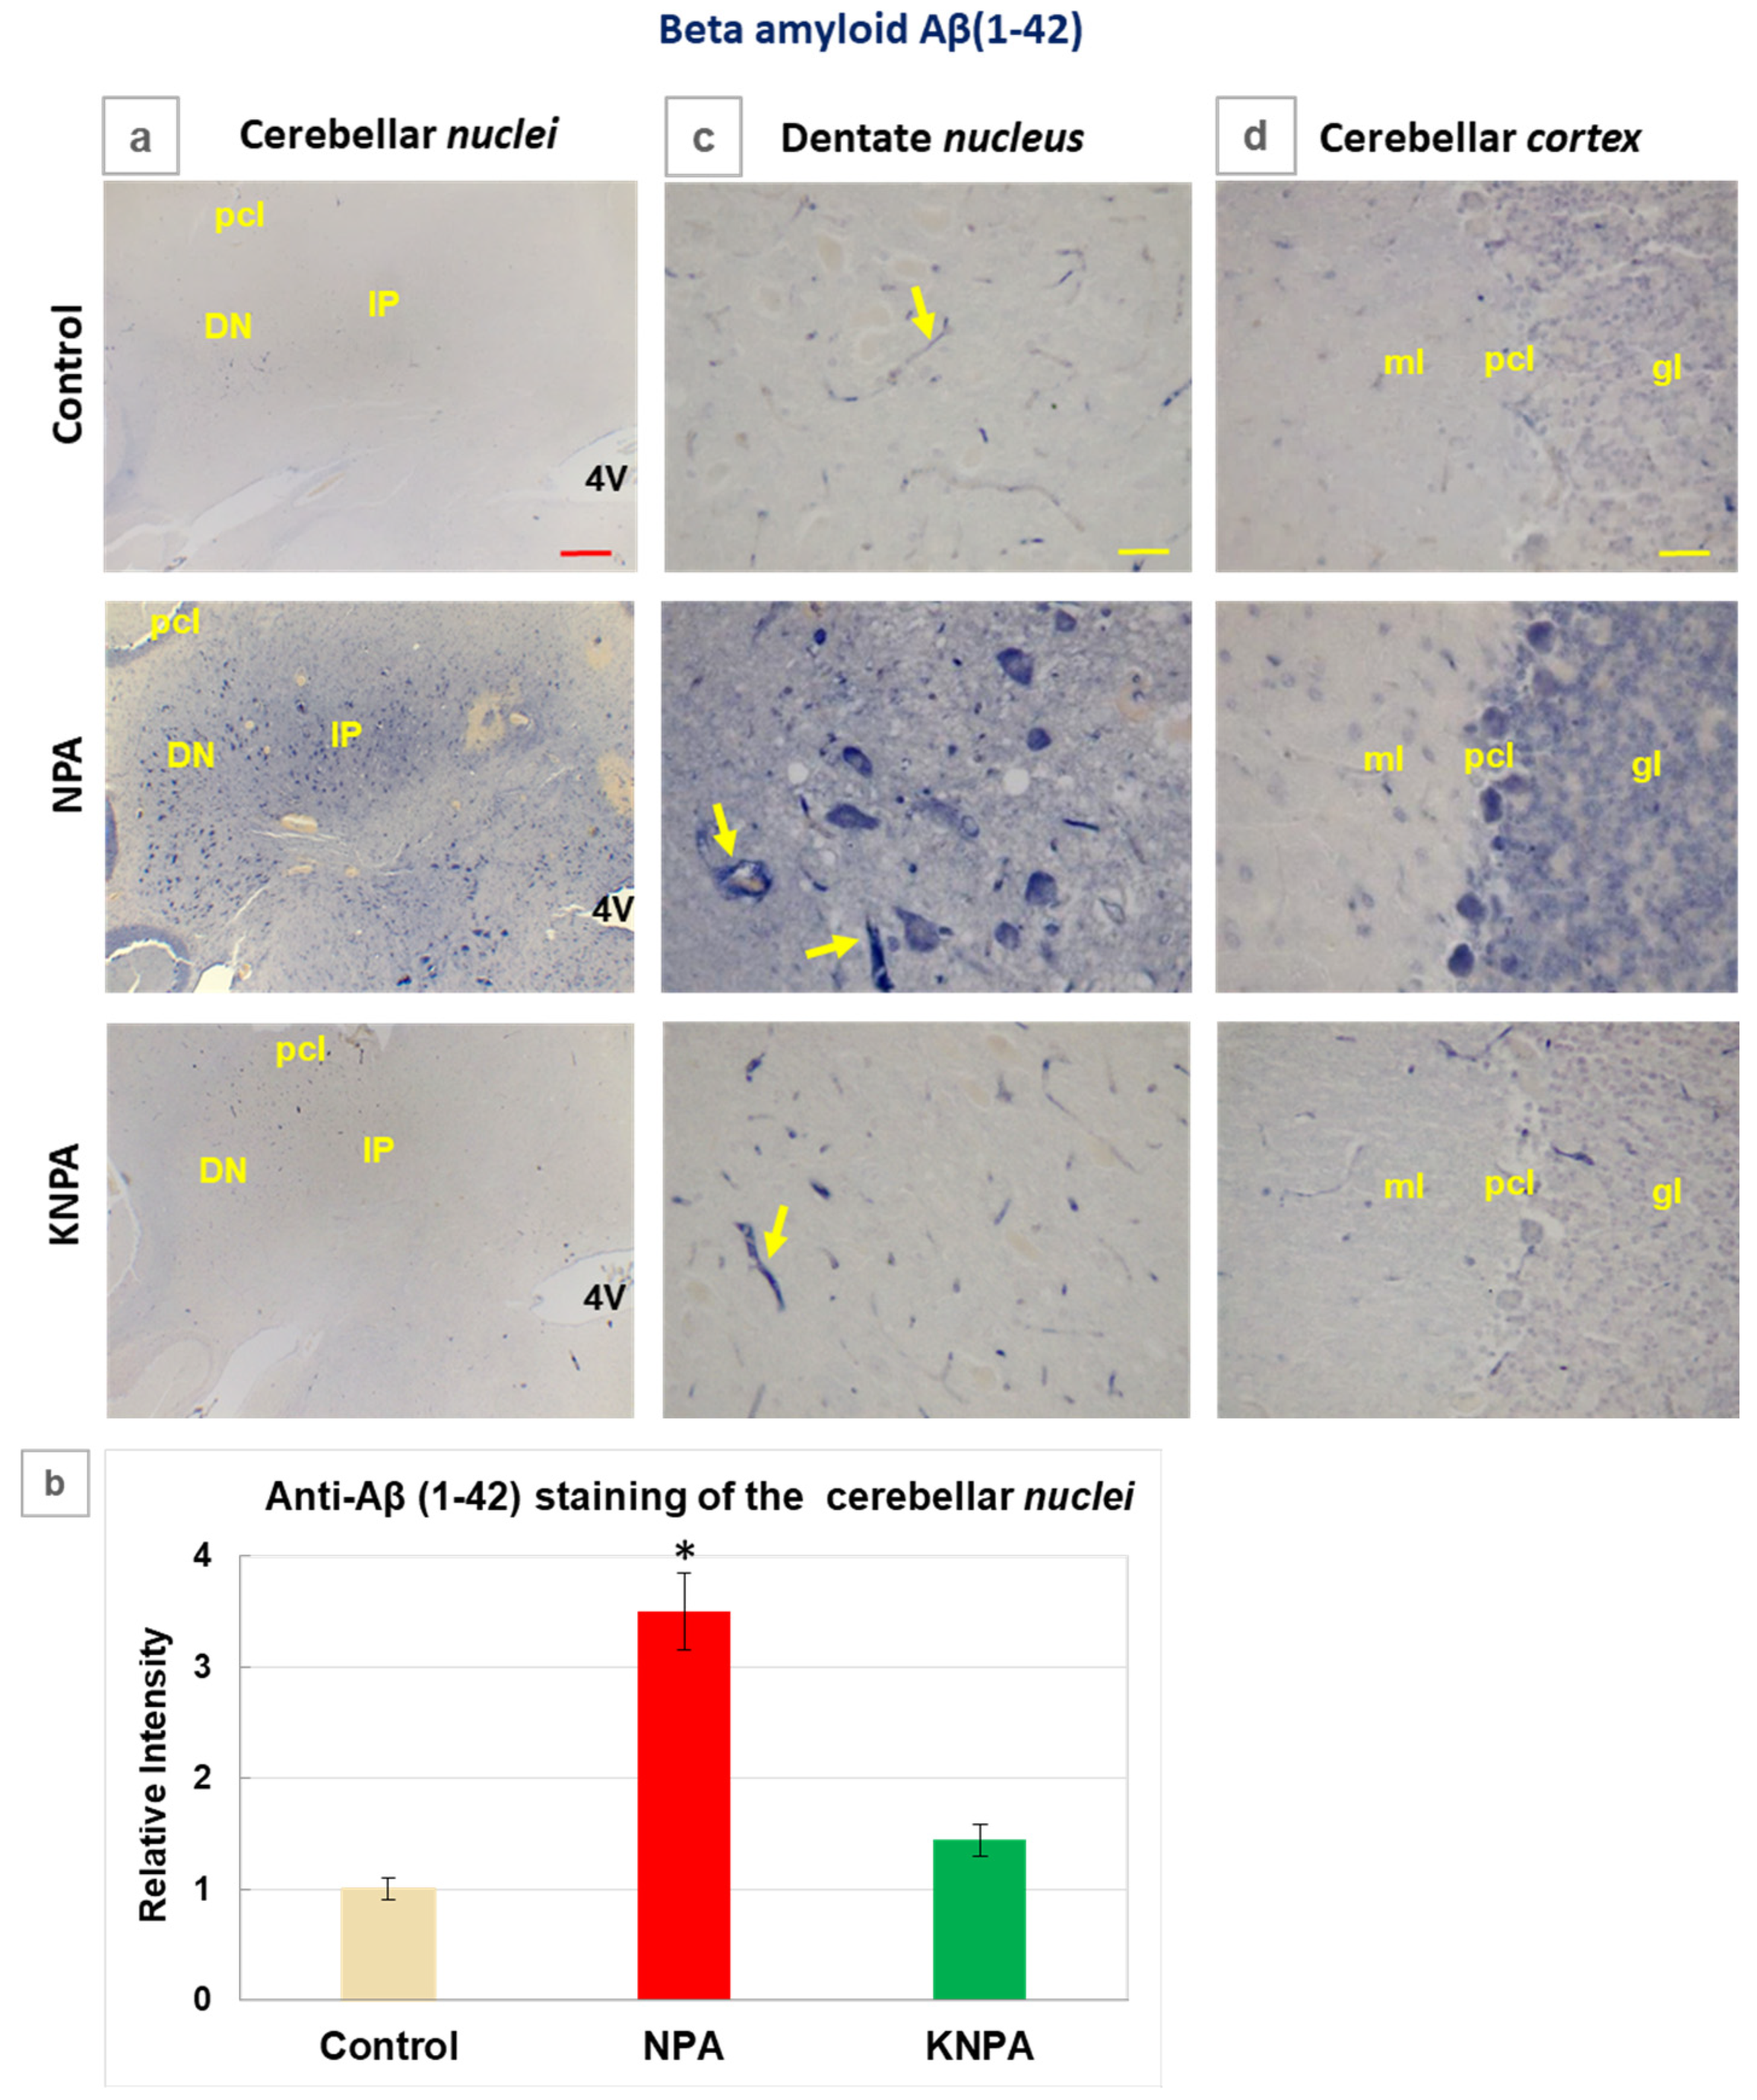
Figure 6.
Co-localization of Aβ(1-42) and complement C3 in the cerebellum of the NPA group. Double immunohistochemistry with anti-Aβ(1-42) (in blue) and anti-C3 (in red) in coronal sections of cerebellar nuclei prepared from the NPA-group. Higher magnification images of the dentate nucleus and cerebellar cortex show co-localization of Aβ(1-42) and complement C3 protein in large somas of multipolar neurons of the dentate nucleus and in the Purkinje cell layer (pcl). As shown by the analysis of the selected microscopy images with the split channel tool of Image J® software there is an extensive co-localization of anti-Aβ(1-42) and anti-C3 staining. 4V: fourth ventricle; ml: molecular layer; gl: granular layer. Red scale bar: 200 μm. Green scale bar: 10 μm.
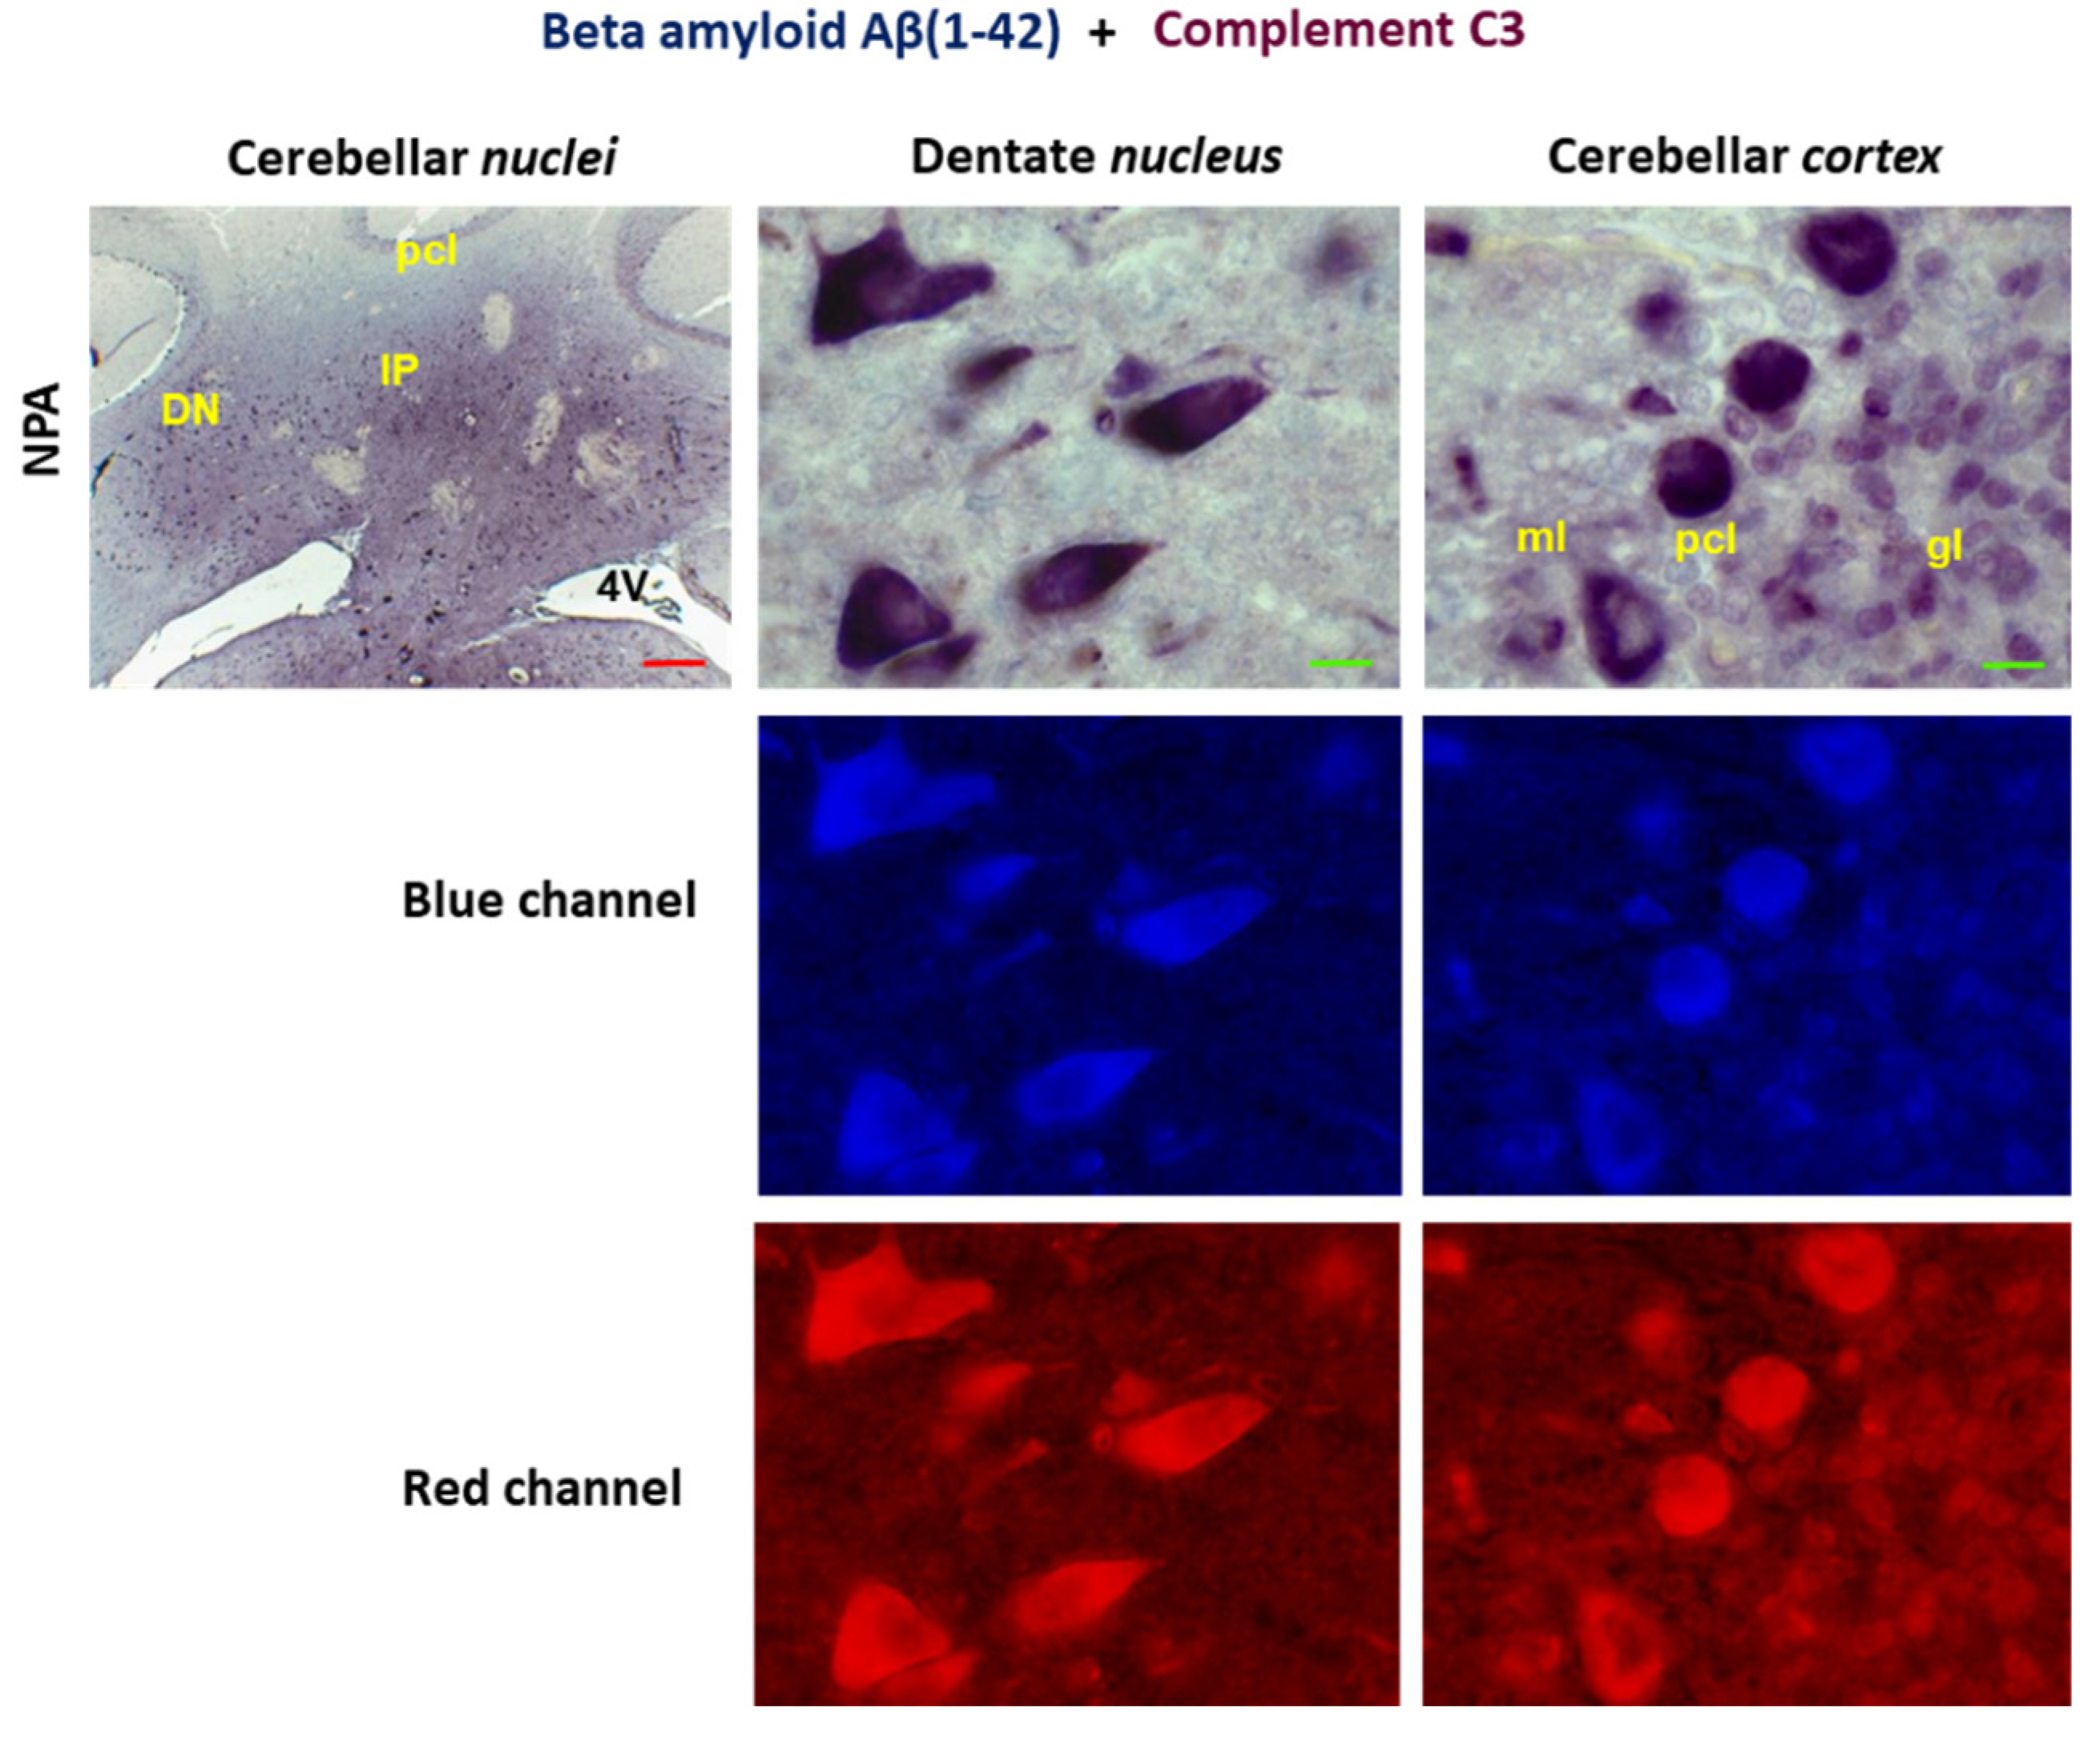
Figure 7.
Kaempferol prevents the increases of tau phosphorylation in the cerebellum of NPA-treated rats. Representative coronal sections of dentate nucleus (a) and cerebellar cortex (b) after immunohistochemistry with anti-Tau, anti-phospho-Tau Thr217 (pTau217) and anti-phospho-Tau Thr181 (pTau181) corresponding to Control-, NPA- and KNPA-groups. The NPA group shows increased levels of these markers. In panels a and b, coadministration of kaempferol shows that it almost completely prevents both structural alterations in cell morphology and the increased staining of Tau, pTau217 and pTau181 antibodies, displaying an intensity of staining not significantly different to that of the Control-group. Note the marked differences in the staining pattern observed with pTau217 and pTau181 antibodies in the cerebellar areas of NPA treated rats: pTau217 intensely stains the large neuronal cell bodies of the dentate nucleus (a) and the cell bodies of Purkinje neurons (b), whereas pTau181 stains more intensely both the large somas of multipolar neurons of the dentate nucleus and the processes (yellow arrows) extending from the reactive A1 astrocyte (a), as well as in the processes of Bergmann glial cells surrounding the soma of Purkinje cells in the cerebellar cortex (b). pcl: Purkinje cell layer; ml: molecular layer; gl: granular layer. Yellow scale bar: 25 μm.
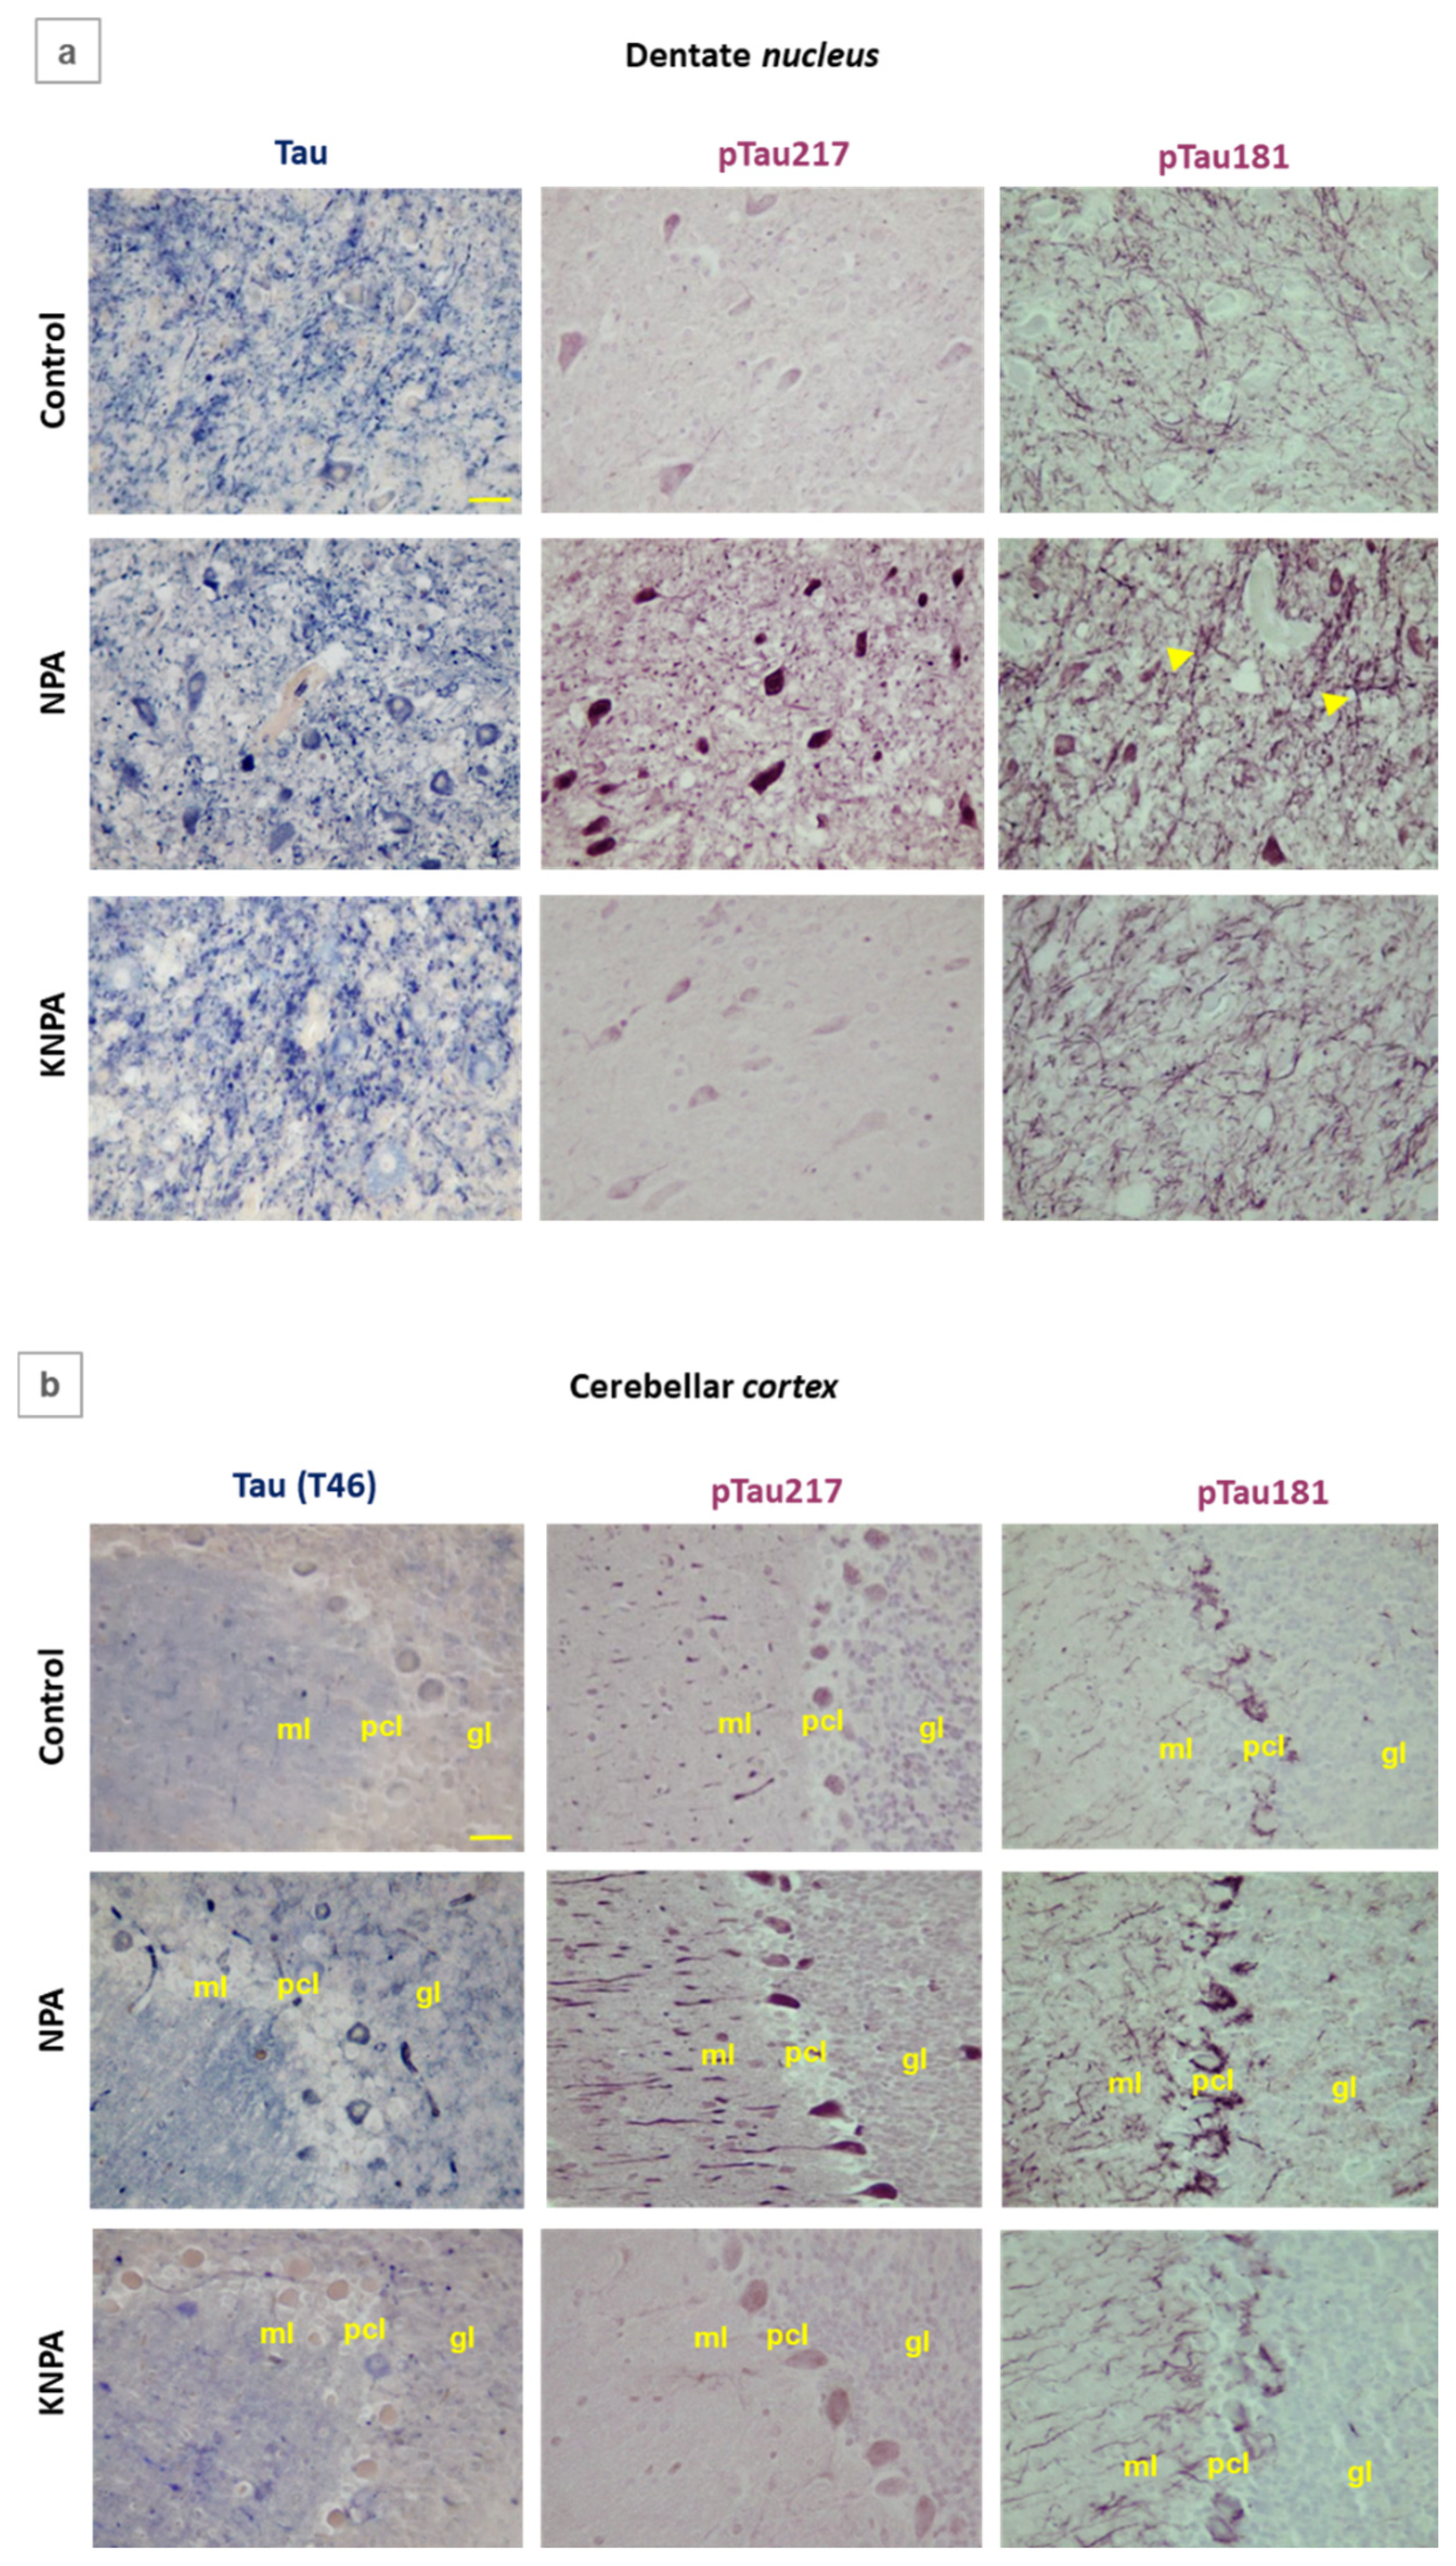
Figure 8.
Comparative colocalization of GFAP with pTau217 and GFAP with pTau181 in the cerebellum of the NPA-group. Selected microscopy images corresponding to the NPA-group of large cells present in the dentate nucleus and cerebellar cortex after double labelling immunohistochemistry using anti-GFAP with anti-pTau217 (a), as well as anti-GFAP with anti-pTau181 (b). Panel a shows an intense labeling with anti-pTau217 (red color) in the neuronal soma of large multipolar neurons (n) of the dentate nucleus and of Purkinje neurons of the cerebellar cortex, which is clearly segregated from the labeling with anti-GFAP. Note the colocalization of GFAP and pTau217 in ameboid-shaped reactive A1 astrocytes (red arrowheads). Panel b illustrates the overlap between pTau181 (red color) and GFAP (blue color) staining in processes extending from reactive A1 astrocytes (yellow arrows) and in the processes of Bergmann glial cells surrounding the soma of Purkinje cells in the cerebellar cortex (green arrows). pcl: Purkinje cell layer; ml: molecular layer; gl: granular layer. Green scale bar: 10 μm.
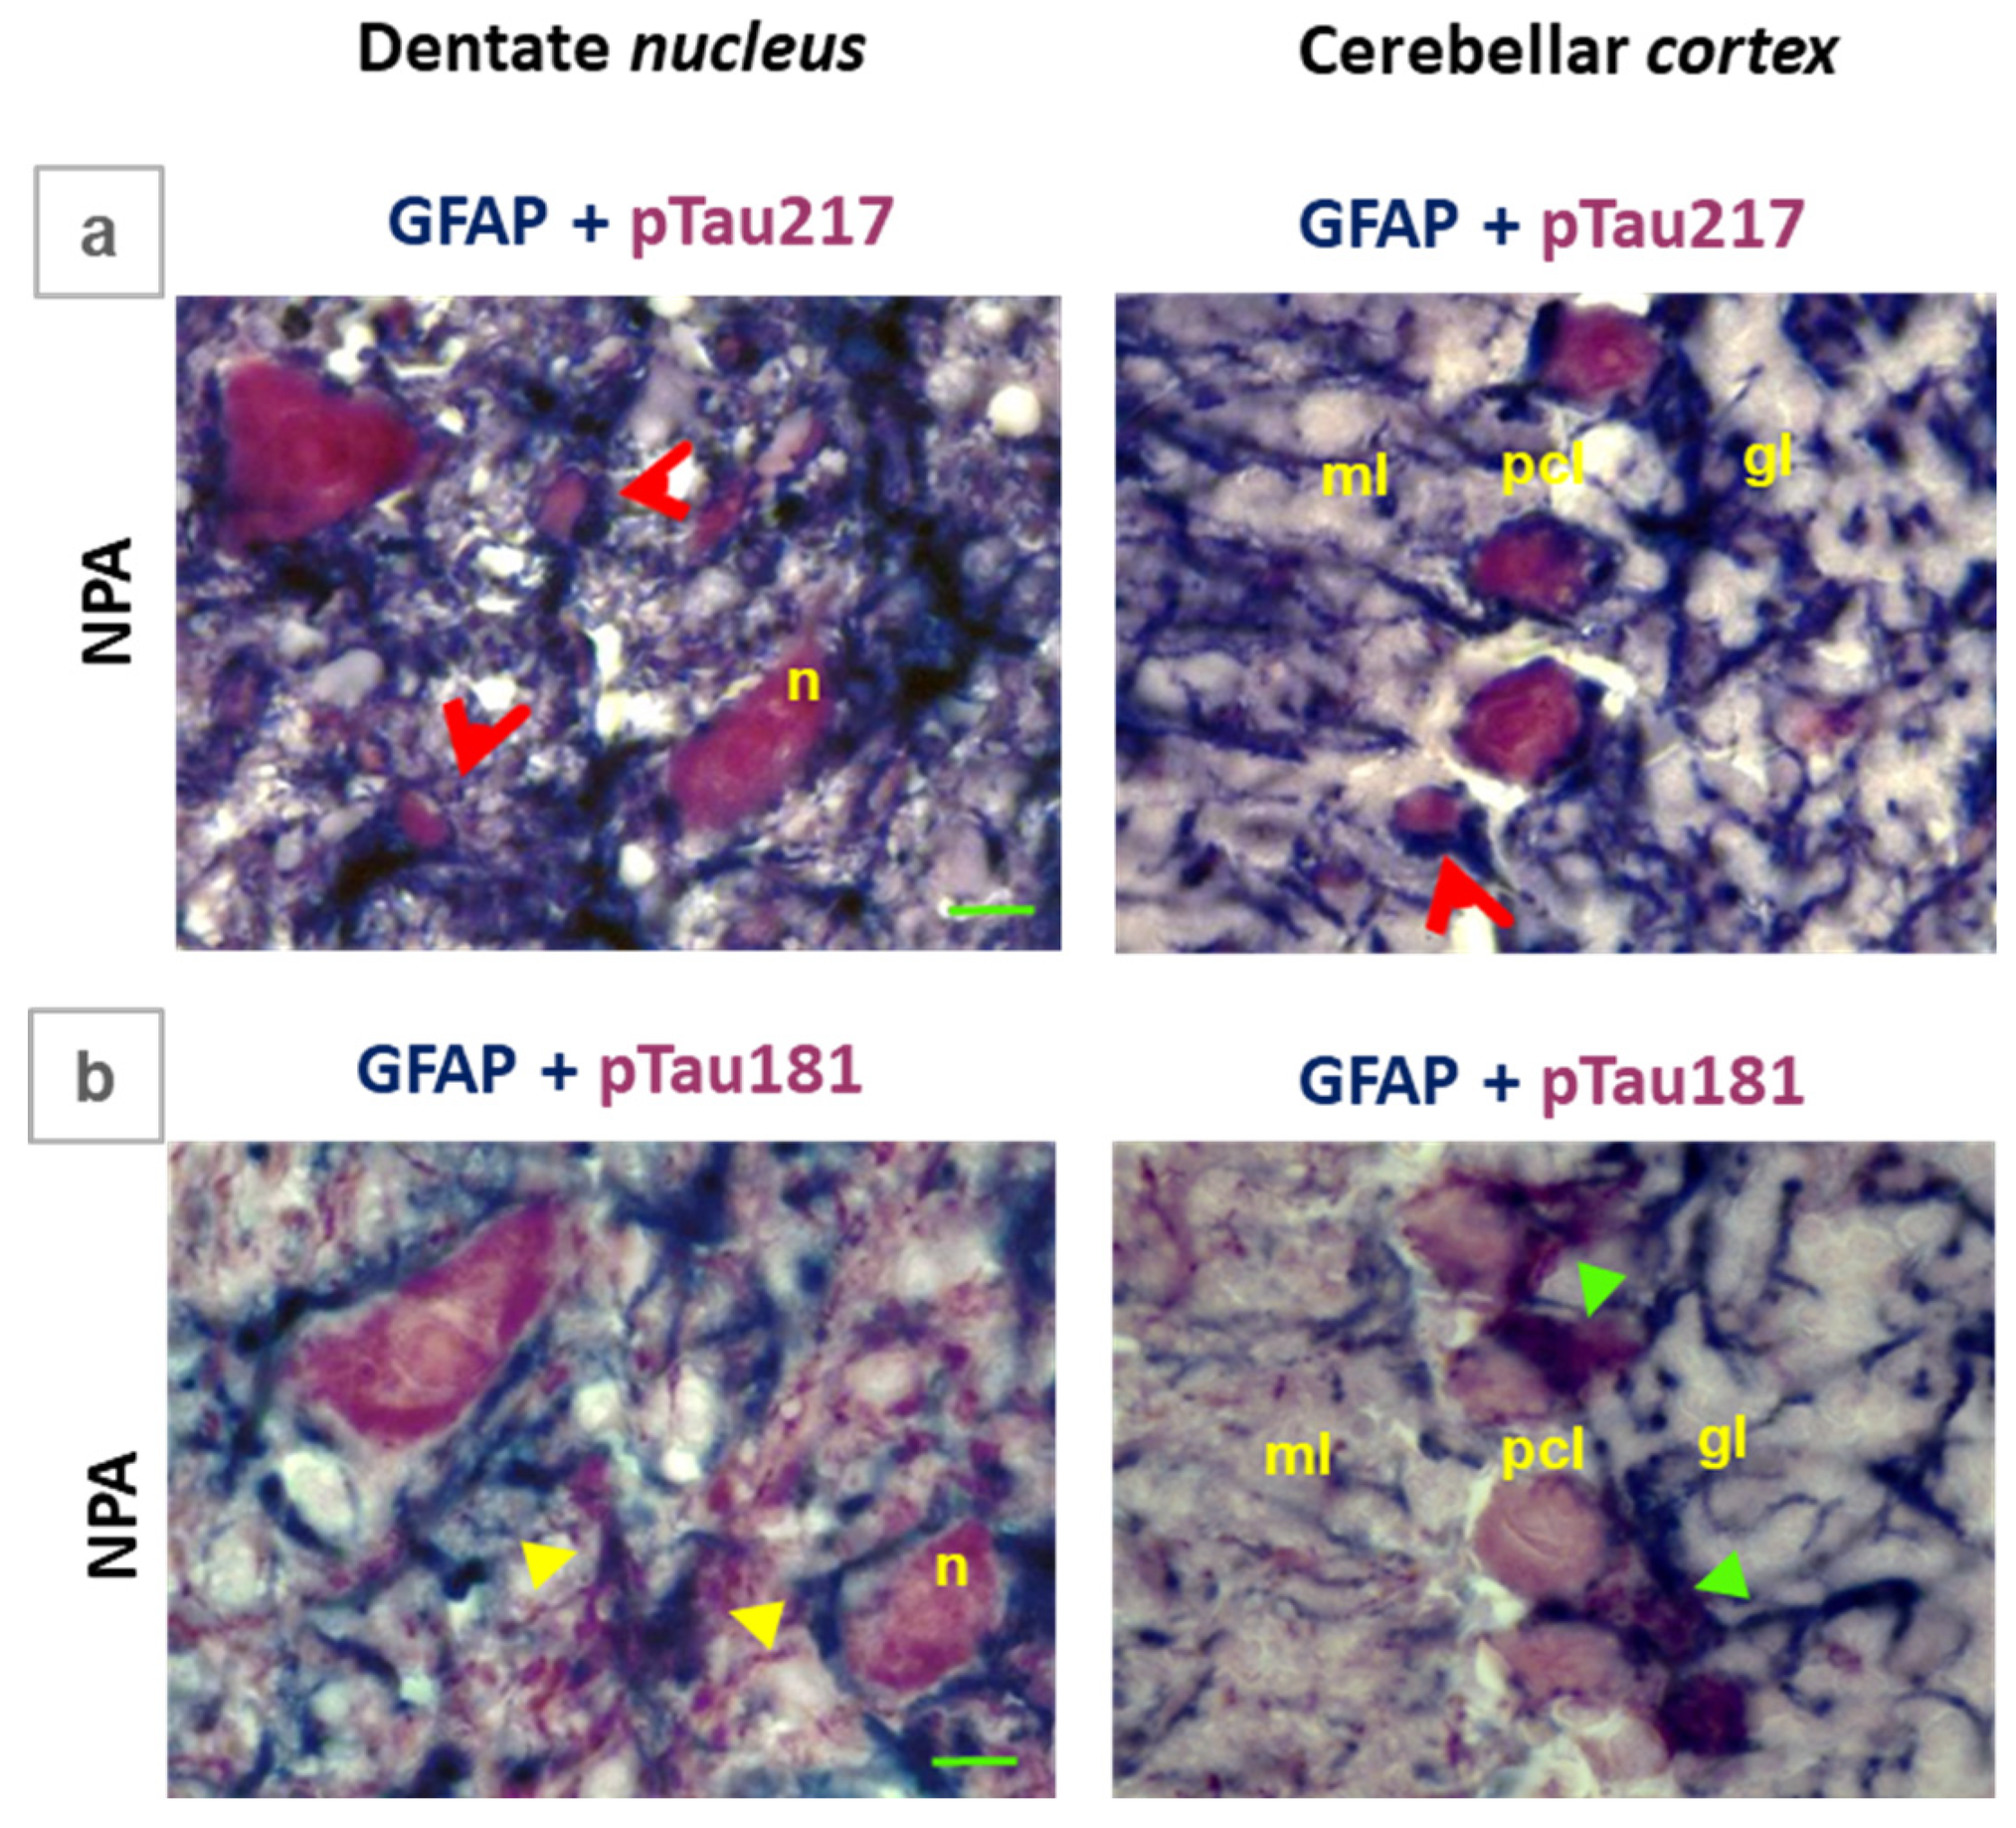
Figure 9.
Comparative colocalization of Aβ(1-42) with pTau217 and Aβ(1-42) with pTau181 in the cerebellum of the NPA-group. Selected microscopy images corresponding to the NPA-group of large cells present in the dentate nucleus and cerebellar cortex after double labelling immunohistochemistry using anti-Aβ(1-42) with anti-pTau217 (a), as well as anti-Aβ(1-42) with anti-pTau181 (b). Note that pTau217 colocalizes with Aβ(1-42), both in dentate nucleus and cerebellar cortex, more closely than pTau181. Panel a shows a clear overlap of anti-Aβ (blue) and anti-pTau217 (red) staining in the neuronal soma of large multipolar neurons (n) in the dentate nucleus and the soma of Purkinje cells in the cerebellar cortex. Panel b shows a more segregated staining pattern between anti-pTau181 (red) and anti-Aβ (blue). Note in the cerebellar cortex a clear segregation between anti-Aβ, which stains the Purkinje cell soma, and anti-pTau181, which exclusively stains the processes of Bergmann glial cells (green arrows) surrounding the Purkinje cell soma. In the dentate nucleus, the overlap between the staining with both antibodies is only evident in the soma of large multipolar neurons. pcl: Purkinje cell layer; ml: molecular layer; gl: granular layer. Green scale bar: 10 μm.
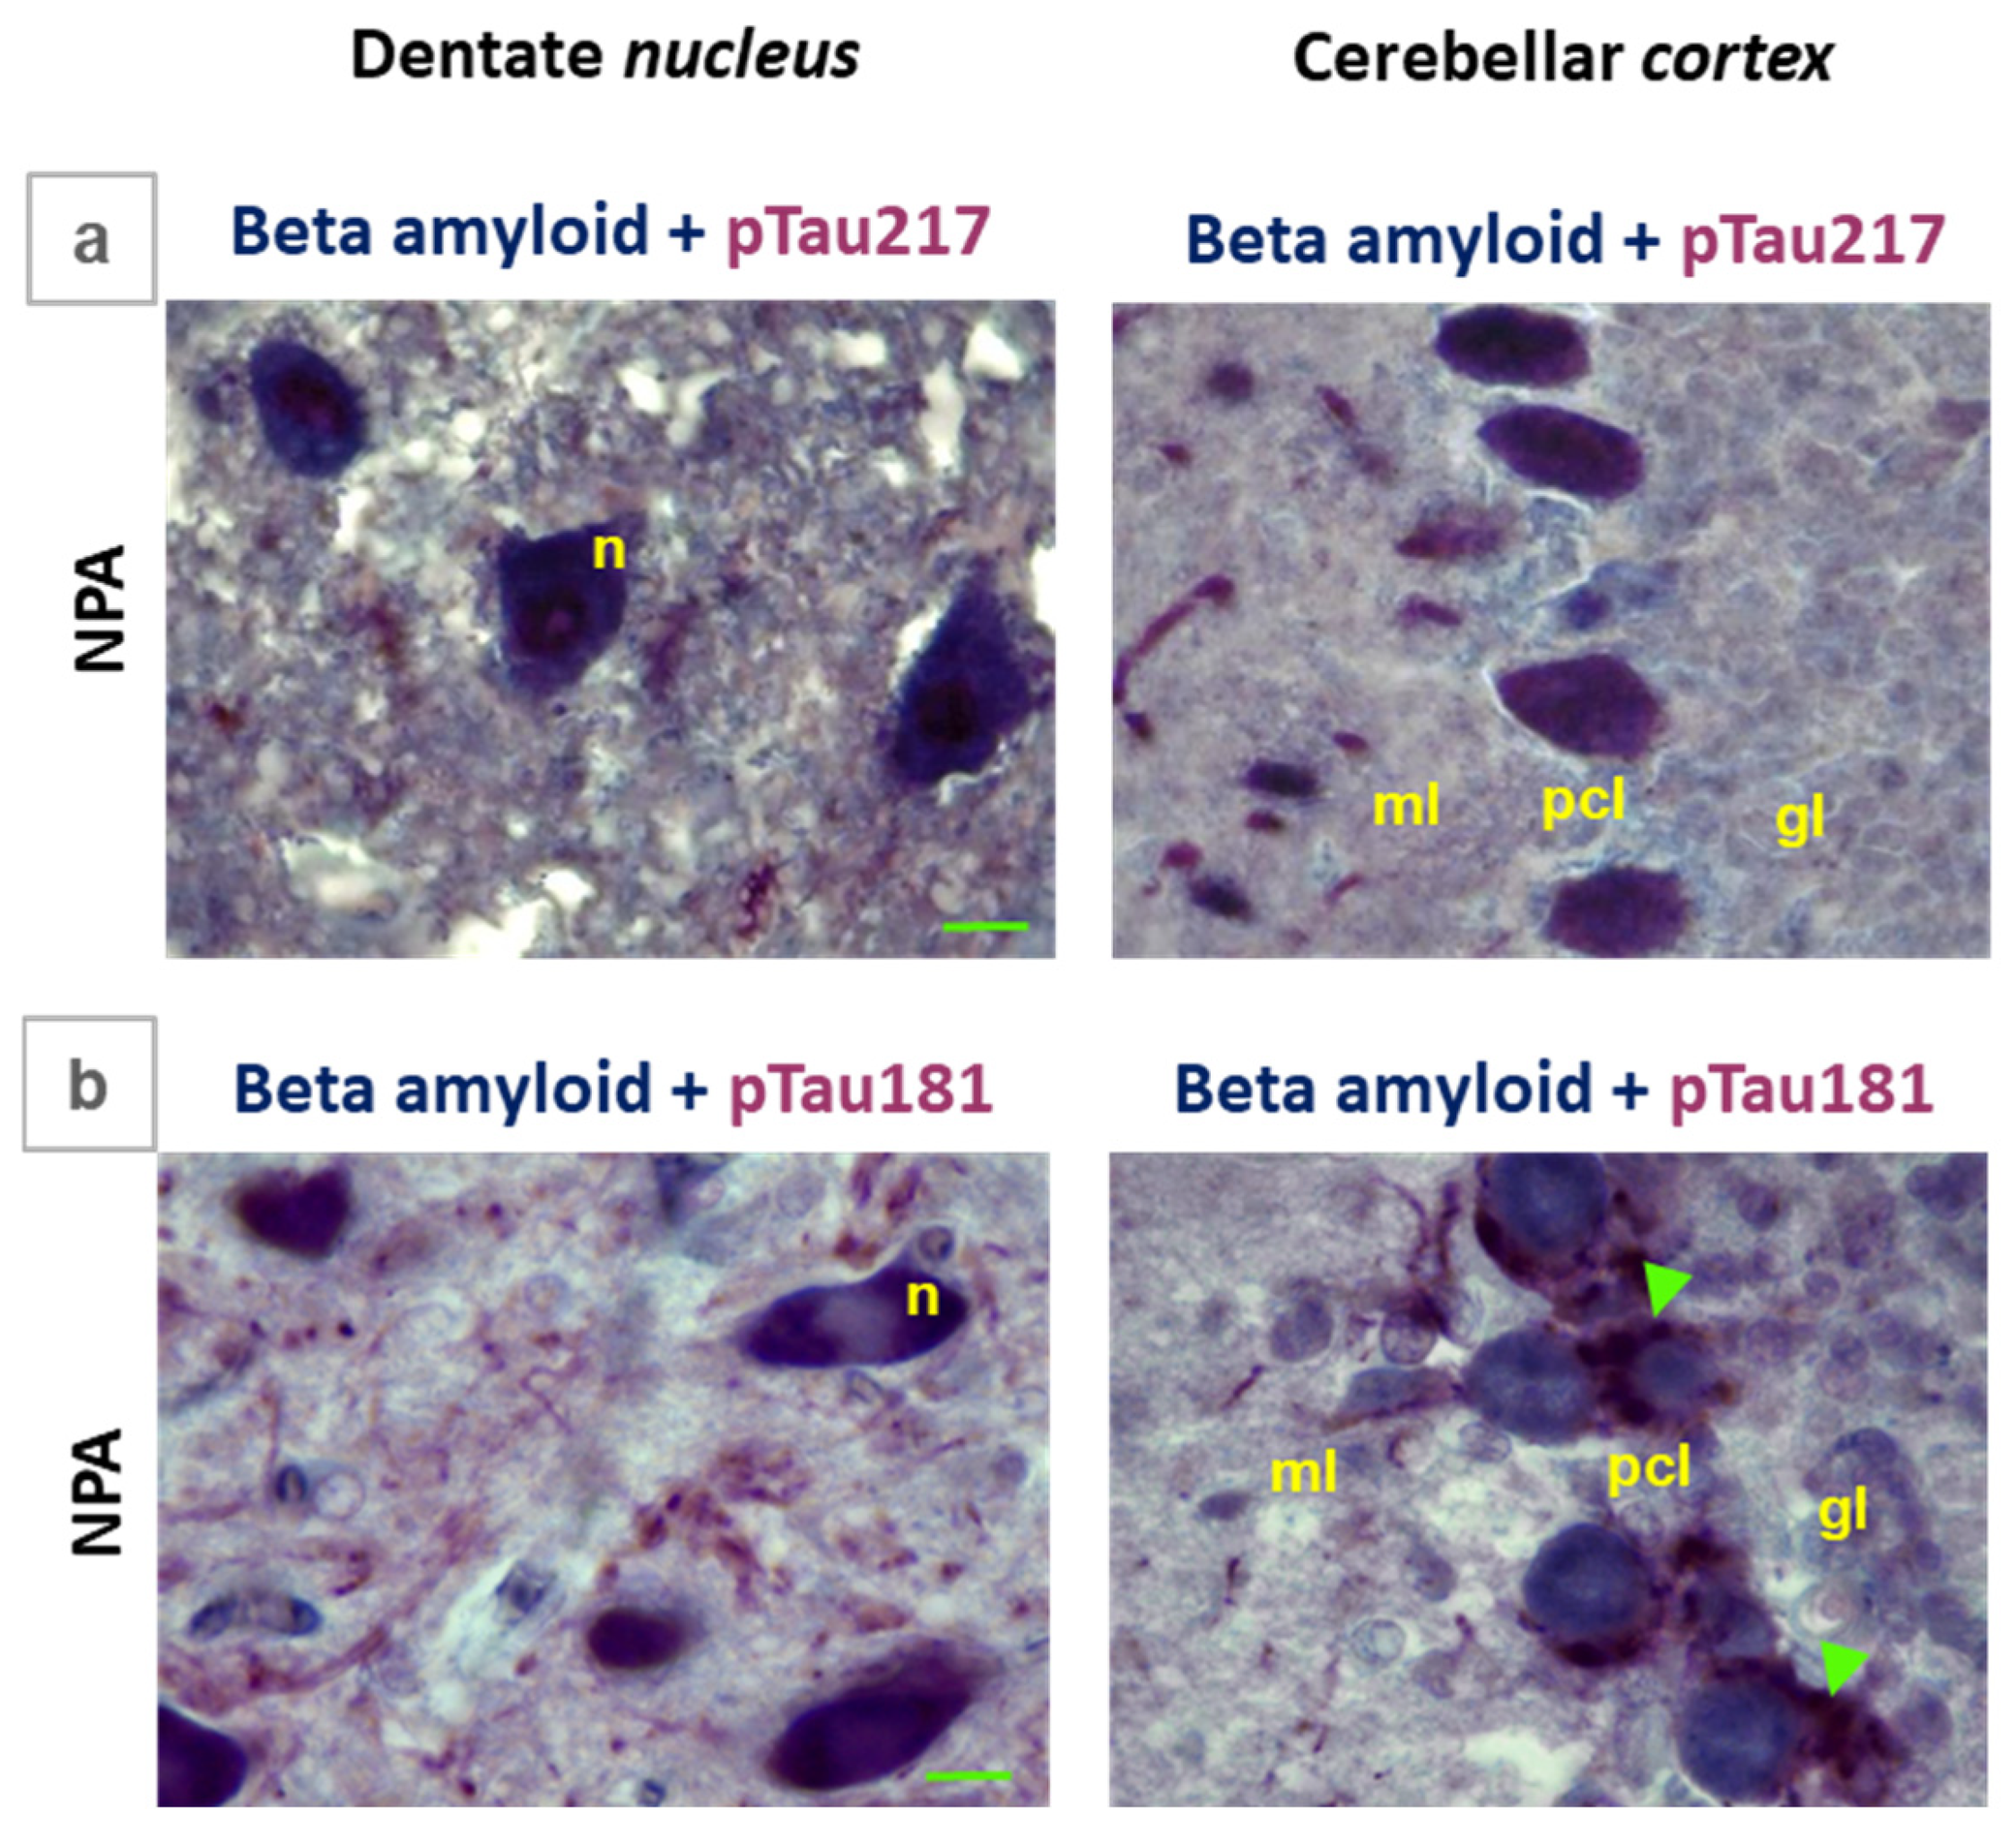
Disclaimer/Publisher’s Note: The statements, opinions and data contained in all publications are solely those of the individual author(s) and contributor(s) and not of MDPI and/or the editor(s). MDPI and/or the editor(s) disclaim responsibility for any injury to people or property resulting from any ideas, methods, instructions or products referred to in the content. |
© 2026 by the authors. Licensee MDPI, Basel, Switzerland. This article is an open access article distributed under the terms and conditions of the Creative Commons Attribution (CC BY) license (http://creativecommons.org/licenses/by/4.0/).
Copyright: This open access article is published under a Creative Commons CC BY 4.0 license, which permit the free download, distribution, and reuse, provided that the author and preprint are cited in any reuse.


