Submitted:
18 February 2026
Posted:
25 February 2026
You are already at the latest version
Abstract
Mobile edge computing (MEC) enables resource-constrained mobile devices to execute delay-sensitive and compute-intensive applications by offloading tasks to nearby edge servers. However, task orchestration in MEC is challenged by the highly dynamic system conditions, unreliable networks, and the distributed edge environments. Moreover, as the number of users, tasks, and resources increases, the offloading decision-making problem becomes increasingly complex due to the exponential growth of the search space. To address these challenges, this paper proposes a Multi-Criteria Hierarchical Clustering-based Task Orchestrator (MCHC-TO), a novel framework that integrates multi-criteria decision making with divisive hierarchical clustering for preference-aware and adaptive workload orchestration. Edge servers are first evaluated using multiple decision criteria, and the resulting preference rankings are exploited to form hierarchical preference-based clusters. Incoming tasks are then assigned to the most suitable cluster based on task requirements, enabling efficient resource utilization and dynamic decision making. Extensive simulations conducted using an edge computing simulator demonstrate that the proposed MCHC-TO framework consistently outperforms benchmark approaches, achieving reductions in average service delay and task failure rate of up to 48\% and 92\%, respectively. These results highlight the effectiveness of combining multi-criteria evaluation with hierarchical clustering for robust and dynamic task orchestration in MEC environments.
Keywords:
mobile edge computing
; task offloading
; edge orchestration
; hierarchical clustering
; multi-criteria decision making
1. Introduction
Edge Computing (MEC) is an emerging paradigm that brings processing and storage capabilities closer to end-users at the network edge, enabling real-time, low-latency, and scalable services. A key enabler of MEC is computation offloading, whereby tasks are transferred from resource-constrained devices, such as smartphones, to more powerful edge servers. This can reduce response time, conserve device energy, and alleviate core network congestion [1]. However, effective offloading is a complex, multi-level decision-making process that involves selecting which tasks to offload, determining where and when to execute them, allocating computing resources, and selecting efficient network paths [2]. Within this process, task orchestration plays a central role in coordinating offloading decisions and ensuring efficient task placement across distributed layers.
Task orchestration in MEC faces several challenges, including highly dynamic workload patterns, system stochasticity, and resource heterogeneity. Moreover, as the numbers of users, tasks, and resources increase, the orchestration problem becomes more complex due to the rapid growth of the decision space. To mitigate this complexity, clustering can be integrated into MEC to reduce the search space for real-time decision making [3]. By forming effective clusters of edge servers, an orchestrator can avoid system-wide searches during task placement, enabling faster decisions and improved efficiency. However, achieving such clustering requires balancing multiple, often conflicting criteria, such as user mobility, server CPU utilization, network conditions, and task characteristics (e.g., computational demand and delay sensitivity). Traditional clustering algorithms are not well suited to this setting because they typically form homogeneous clusters based on distance-like similarity measures only. In other words, these methods quantify similarity between objects without explicitly modeling preference or priority relationships [4], which limits their effectiveness for dynamic task orchestration.
Although clustering has been investigated in several MEC studies, most existing works rely on classical techniques and focus on clustering tasks [5,6,7], end devices [3,8,9,10], network sensors [11], or base stations [12]. Only a limited number of studies, such as [13], consider clustering edge servers, despite their central role in MEC orchestration. To address the limitations of classical clustering in this context, this study leverages multi-criteria decision-making (MCDM) methods [14] to develop a relational clustering approach. This approach is built on a multi-criteria framework and incorporates the decision-maker’s preferences, thus supporting complex decision-making processes.
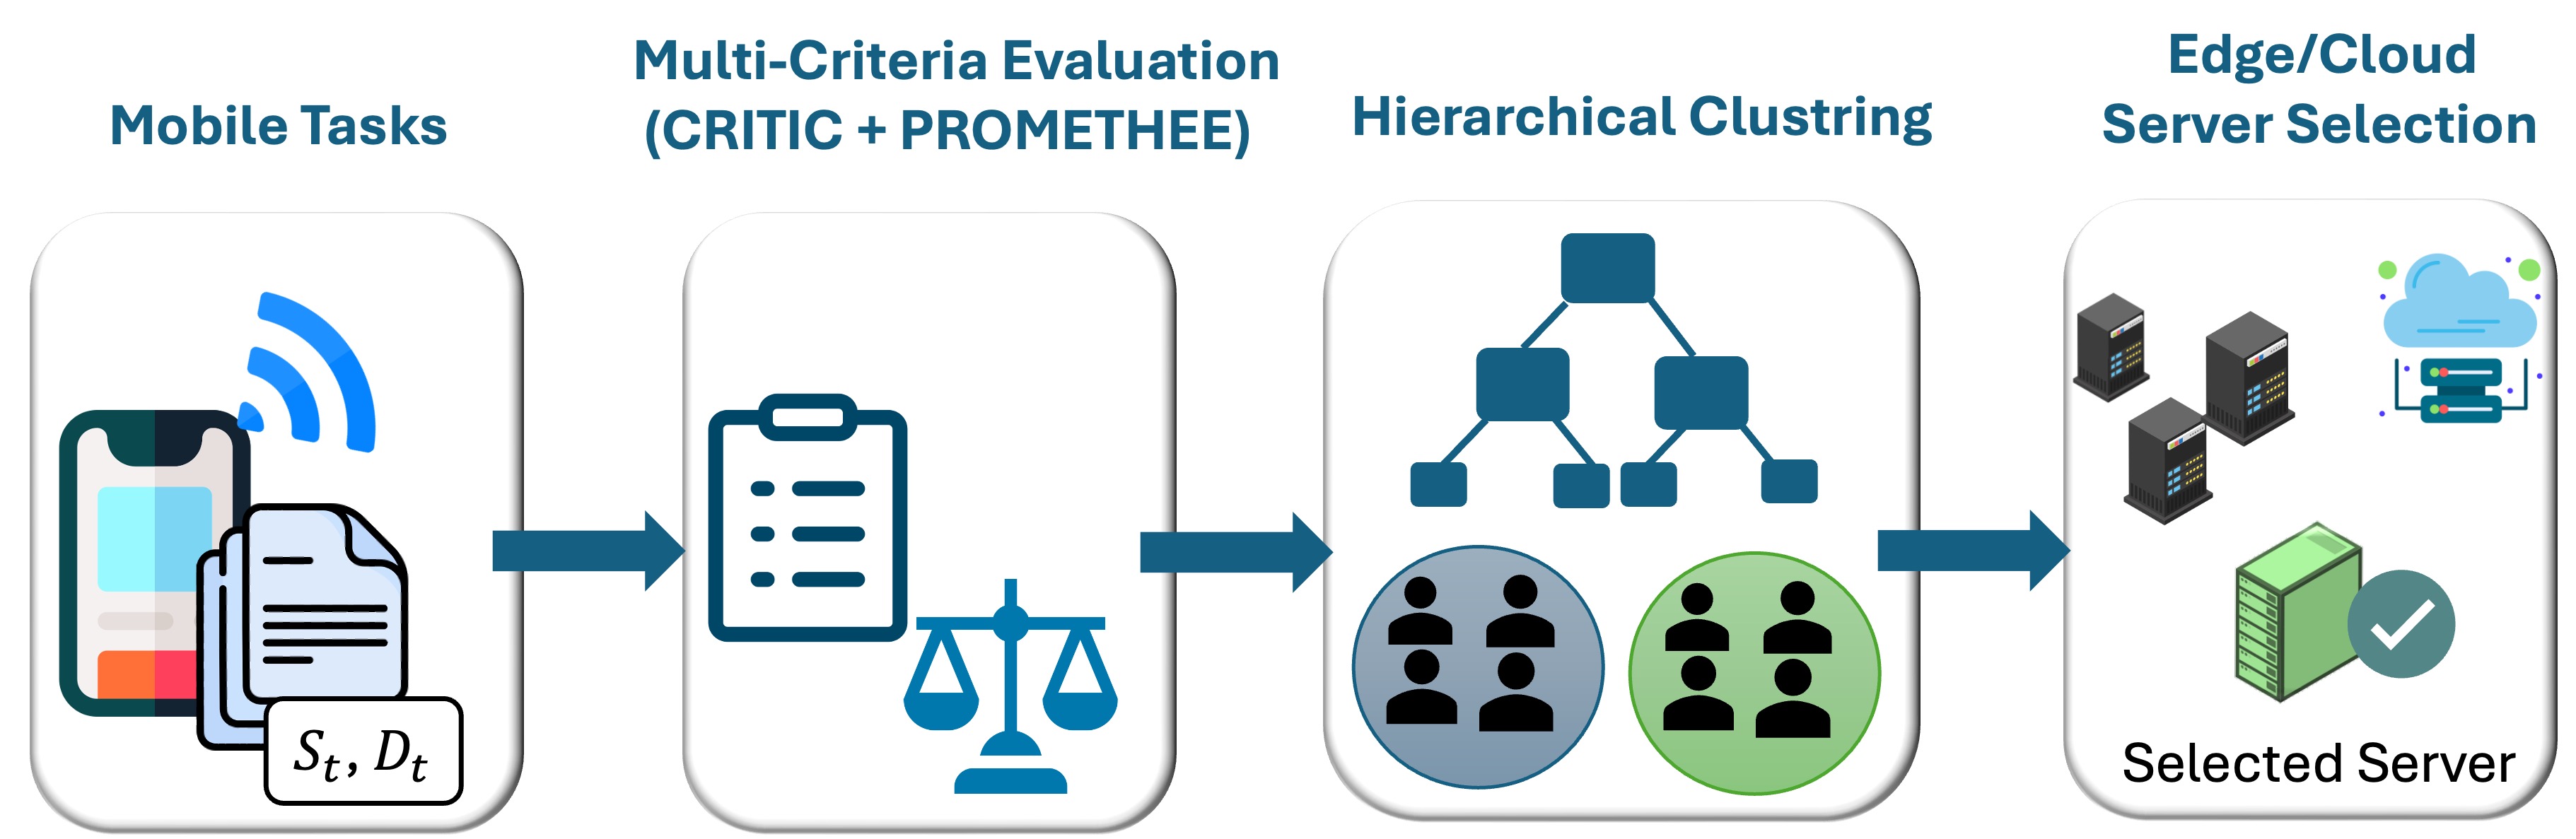
Accordingly, this paper proposes the Multi-Criteria Hierarchical Clustering-based Task Orchestrator (MCHC-TO), a framework that dynamically allocates tasks to the most suitable servers using divisive hierarchical clustering guided by multi-criteria evaluations. The central hypothesis tested in this work is that integrating multi-criteria preference evaluation with hierarchical server clustering can (i) reduce service delay and task failures and (ii) improve load balancing compared with classical clustering and representative orchestration baselines under diverse workload conditions. Extensive simulation results support this hypothesis and show that MCHC-TO consistently improves key performance metrics.
This work introduces a new perspective by formulating MEC task orchestration as a multi-criteria relational clustering problem. The main contributions of are as follows:
- The MEC task orchestration problem is formulated as a dynamic divisive hierarchical clustering problem guided by multi-criteria evaluations, where relational grouping of edge servers captures trade-offs among multiple criteria (e.g., server capacity and proximity) under varying system loads.
- Based on this formulation, a preference-aware hierarchical clustering framework for MEC is proposed to reduce average service delay and task failure rate while maintaining balanced utilization of edge resources.
- The effectiveness of MCHC-TO is demonstrated through extensive simulations and comparisons with orchestration methods from the literature, as well as a specifically developed single-criterion clustering baseline. The results indicate that MCHC-TO reduces service delay, decreases task failure rates, and improves load distribution across edge resources.
The remainder of this paper is organized as follows. Section 2 reviews task orchestration in MEC, with a focus on clustering-based solutions. Section 3 presents MCHC-TO, including its architecture and operational phases. Section 4 reports the performance evaluation, and Section 5 concludes the paper.
2. Related Work
Recent research has extensively investigated task orchestration, offloading, and resource allocation in MEC. This study focuses on decision-making approaches that explicitly determine the execution location of tasks across available computing layers. In the literature, this execution-location decision is described using different terms. Some studies refer to it as task orchestration [15,16,17,18], while others describe it as task offloading or resource allocation [19,20]. Additionally, several works formulate the problem as a scheduling or task assignment [13,21,22]. These terminological differences are reflected in Table 1, which compares existing approaches based on their decision scope, execution location, and algorithmic methodology.
Early approaches to MEC orchestration relied on rule-based techniques. Sonmez et al. [15] proposed a two-stage fuzzy logic-based orchestrator that considered task requirements, edge server capabilities, and network conditions to define a set of fuzzy rules used to select the execution location. Similarly, Jamil et al. [16] introduced a two-stage Belief Rule-Based (BRB) orchestrator that distinguished between delay-sensitive and delay-tolerant applications using conjunctive and disjunctive belief rules. Their approach achieved higher success rates than the fuzzy-based method by better capturing application requirements and execution environments. While rule-based approaches can be effective, they require manual rule design and tuning, which becomes increasingly complex and less scalable as MEC systems grow and evolve [21].
To overcome these limitations, many recent studies have adopted machine learning (ML) and reinforcement learning (RL) techniques to automate orchestration decisions. For instance, the authors of [17] proposed a two-stage model combining a multilayer perceptron (MLP)–based classification and regression to predict offloading success and service time in vehicular edge computing, achieving improved Quality of Experience (QoE). Yamansavascilar et al. [18] introduced DeepEdge, a Double Deep Q-Network (DDQN)-based orchestrator designed to select execution locations across edge and cloud servers in order to reduce task failure rates and improve edge resource utilization. In addition, Alfakih et al. [19] addressed offloading problem using a state–action–reward–state–action (SARSA)-based RL algorithm to minimize energy consumption and processing delay, outperforming Q-learning in their experiments. Similarly, Zheng et al. [21] developed a Deep Q-Network (DQN)-based orchestration framework that selects execution locations among local edge servers, multiple nearby edge servers, and the cloud. Their approach outperformed Proximal Policy Optimization (PPO) and Deep Deterministic Policy Gradient (DDPG) models in terms of latency, resource utilization, and task success rate. More recently, Wu et al. [20] proposed a Deep Reinforcement Learning (DRL)-based online scheduler in an Internet of Things (IoT)–MEC–cloud framework that jointly considered performance and security trade-offs, achieving lower latency than offline baselines. Hsieh et al. [22] investigated task assignment in cooperative MEC systems using Markov decision process (MDP) and DRL models. Specifically, they developed and compared value-based Double Deep Q-Network (DDQN), policy-based Policy Gradient (PG), and hybrid Actor–Critic (AC) approaches to optimize execution delay and energy consumption under dynamic conditions. Similarly, Liu et al. [23] proposed a Multi-agent reinforcement learning (MARL) framework in which edge nodes collaboratively learn resource allocation and scheduling policies through decentralized DQN-based training.
Although learning-driven approaches can adapt to changing network conditions and often achieve significant performance gains, they typically require extensive training, careful parameter tuning, and considerable computational overhead. These requirements can limit their practicality in large-scale or resource-constrained MEC environments. As a result, alternative solutions that reduce computational complexity while maintaining adaptability remain of interest.
Clustering-based methods offer a training-free and interpretable alternative by reducing the search space for orchestration decisions. Shooshtarian et al. [24] proposed a two-stage hierarchical clustering approach for resource allocation in fog computing, in which fog nodes were grouped based on resource characteristics and tasks were assigned to the nearest fog layer to minimize latency. However, the proximity-based layer selection strategy may have overlooked better resource options in other layers, limiting its adaptability. Hao et al. [13] introduced an energy-aware clustering approach in MEC, where edge nodes were clustered using attenuation-based distance metrics and a heuristic scheduler managed intra- and inter-cluster allocations. Since clustering was performed only once during system initialization, the approach was not well-suited to dynamic workloads. Moreover, classical distance-based clustering methods often suffer from scalability and dimensionality challenges as system complexity increases [25].
To address these limitations, some studies have integrated clustering with MCDM. De Smet et al. [26] extended K-means to a preference-based clustering approach, in which binary relations were used to define similarity instead of conventional distance measures. Subsequent works proposed divisive hierarchical clustering approaches based on the Preference Ranking Organization Method for Enrichment Evaluation (PROMETHEE), which provides preference-based rankings to guide cluster formation [27]. Later studies further extended this approach by incorporating uncertainty modeling techniques, such as Stochastic Multiobjective Acceptability Analysis (SMAA), to explicitly handle uncertainty in preference modeling [4]. While these methods offer flexible, preference-driven clustering, their applications have largely been limited to financial and decision analysis domains, rather than MEC or task orchestration.
In the existing MEC orchestration literature, most approaches either rely on learning-based models that incur significant training overhead or apply clustering techniques based on static or single-metric criteria. In contrast, the MCHC-TO framework proposed in this work adopts a dynamic, preference-driven orchestration approach that integrates MCDM, specifically PROMETHEE, with hierarchical clustering to group edge servers based on multiple criteria, such as capacity, proximity, and load. This design enables adaptive task offloading while avoiding training overhead. To the best of our knowledge, this is the first study to combine MCDM-based preference evaluation and hierarchical clustering specifically for task orchestration in MEC. A comparative overview of existing approaches is provided in Table 1, highlighting the methodological gaps addressed by MCHC-TO.

Table 1.
Comparison of this study’s work with existing related works.
| Ref | Decision Scope | Execution Location | Method | Algorithm |
|---|---|---|---|---|
| [15] | Orchestration | Edge/Cloud | Rule-based | Fuzzy logic |
| [16] | Orchestration | Edge/Cloud | Rule-based | BRB |
| [17] | Orchestration | Edge/Cloud | Supervised ML | MLP classification + regression |
| [18] | Orchestration | Edge/Cloud | DRL | DDQN |
| [19] | Offloading | MD/Edge/Cloud | RL | SARSA |
| [21] | Orchestration | Edge/Cloud | DRL | DQN |
| [20] | Scheduling | MD/Edge/Cloud | DRL | DQN |
| [22] | Offloading | Edge/Cloud | DRL | DDQN, PG, AC |
| [23] | Scheduling | Edge | MARL | DQN |
| [24] | Application Placement | Fog | Classical clustering | AHC |
| [13] | Scheduling | Edge | Classical clustering | Custom distance-based clustering |
| [26] | – | N/A | MCDM-based clustering | Extended K-means |
| [27] | – | N/A | MCDM-based clustering | DHC (PROMETHEE) |
| [4] | – | N/A | MCDM-based clustering | DHC (SMAA–PROMETHEE) |
| This paper | Orchestration | Edge/Cloud | MCDM-based clustering | DHC (CRITIC–PROMETHEE) |
DHC: Divisive Hierarchical Clustering, AHC: Agglomerative Hierarchical Clustering.
3. Multi-Criteria Hierarchical Cluster-Based Task Orchestration
The goal of this paper is to enhance task execution efficiency in MEC environments by intelligently selecting the most suitable servers. To achieve this, we integrate MCDM with a hierarchical clustering strategy, enabling the formation of high-ranking clusters of edge servers for task execution at the edge layer. This section presents the proposed Multi-Criteria Hierarchical Clustering-based Task Orchestrator (MCHC-TO) framework. First, the system architecture and key assumptions are described. Then, the multi-criteria evaluation process, preference-driven hierarchical clustering, and task allocation mechanism are detailed. Table 2 summarizes the main symbols and notations used throughout this section.
3.1. System Architecture
A three-tier MEC architecture, comprising end-user, edge, and cloud layers, is utilized to support the deployment of edge computing solutions, as illustrated in Figure 1. The system is heterogeneous in terms of different computing resource capabilities and different network ranges, such as wireless local area networks (WLAN), metropolitan area networks (MAN), and wide area networks (WAN). The model consists of several components organized into three layers, as follows:
3.1.1. End-Users Layer
A layer in which users generate several tasks using their mobile devices (MDs), such as smartphones, tablets, sensors, and IoT devices, during their movement between different Radio Access Networks (RANs). The MD generates tasks from several applications that vary in terms of complexity and requirements. A task can be characterized by two parameters: , where denotes the task size, expressed as the number of instructions (in Million Instructions, MI). This parameter determines the execution time of the task on an edge or cloud server, depending on the processing capability of its Virtual Machines (VMs), which is typically measured in Million or Giga Instructions Per Second (MIPS/GIPS). denotes the delay sensitivity, which reflects how sensitive the task is to the increased latency caused by the network conditions or server utilization. The tasks are assumed to arrive independently at the servers, and each task must be executed at a single location.
3.1.2. Edge Layer
A layer comprises edge servers (ESs), denoted by , each of which is connected to a base station (BS) to share power. The MDs within the range of a BS can access the associated ESs via WLAN. The BS and ES are linked through high-speed connections such as fibre optics, making the transmission delay negligible [28]. Each ES hosts multiple CPU cores and VMs to support concurrent task execution. The proximity of an ES to an MD influences communication latency. ESs may therefore be classified as on-site or off-site. On-site ESs reside within the same Radio Access Network (RAN) as the MD, whereas off-site ESs belong to different RANs. Offloading to an off-site ES requires routing through the WLAN and the MAN; however, MAN latency is not affected by the physical distance between servers [15]. In addition, server capacity reflects the availability of computational resources, typically represented by the proportion of available VMs. Servers with low resource availability may become congested, increasing the likelihood of task failures. Consequently, balanced utilization across ESs is essential to maintain reliable system performance.
The Edge Orchestrator (ER), which is located within the edge layer and is connected to all ESs via a MAN, acts as the system’s decision-maker. It monitors resources and selects the optimal offloading destinations based on the orchestration policy.
3.1.3. Cloud Layer
The cloud layer consists of servers with high processing power and large storage capacity, accessible via WAN. It can assist the edge layer by executing tasks, particularly delay-tolerant tasks, to enhance the overall system performance.
The proposed solution is structured into three main stages, which are detailed in the subsequent subsections and illustrated in Figure 2.
3.2. MCDM-Based Multi-Criteria Evaluation
The first stage of the proposed MCHC-TO framework evaluated ESs based on multiple criteria, in order to identify the most suitable candidates for task offloading. One widely used family of MCDM methods is the Preference Ranking and Organization Method for Enrichment Evaluation (PROMETHEE), which facilitates systematic and transparent decision-making by ranking alternatives, such as ESs, based on multiple and sometimes conflicting criteria [29]. With PROMETHEE, preference functions and pairwise comparisons are utilized to generate a net flow score for each alternative, enabling decision-makers to identify the most suitable option based on their preferences and priorities.
This section presents the aspects of PROMETHEE that are relevant to the proposed algorithm and describes how they are incorporated into MEC to achieve targeted objectives. For a detailed exploration of the PROMETHEE family of methods and their applications, interested readers are referred to [30]. Algorithm 1 summarizes the PROMETHEE-based multi-criteria evaluation step of the proposed framework. The evaluation is performed through the following sequential stages.
3.2.1. Evaluation Criteria
The first step in PROMETHEE is to define the evaluation criteria, their associated weights, and preference thresholds, as these directly influence the final offloading decision. The steps of this phase are illustrated in Algorithm 1 and are represented visually in the blue box of Figure 2.
Consider the following multi-criteria problem:
where denotes the set of evaluation criteria, and A represents the set of ESs considered as alternatives. The selection of evaluation criteria in MCHC-TO is guided by the primary optimization objective, which is minimizing task service time. In the proposed system, service time is mainly composed of transmission delay and processing delay. Transmission delay is directly determined by the network type through which the task is offloaded (WLAN or MAN), which in turn is dictated by the location of the selected server. Processing delay, on the other hand, depends on the available computational capacity of the server, represented by its CPU resources and current VM load. Accordingly, the proposed solution considers two dominant criteria in ES evaluation as follows:
- : the server capacity, defined as the proportion of available virtual machines;
- : the server location, representing the proximity of the ES to the mobile device.
These criteria directly influence the two fundamental components of service time and therefore capture the primary performance drivers relevant to the considered optimization goal.
3.2.2. Criteria Weighting Using CRITIC
Each criterion is assigned a weight , representing its relative importance, subject to the constraint:
PROMETHEE does not provide an inherent mechanism for determining criterion weights, which poses a challenge for objective decision-making [31]. To address this issue, the CRITIC (Criteria Importance Through Intercriteria Correlation) method is adopted to derive objective, data-driven criterion weights [32]. CRITIC evaluates the importance of each criterion based on its informational content, which is quantified through two components: (i) contrast intensity, measured by the standard deviation of criterion values, and (ii) inter-criteria conflict, captured through correlation coefficients.
For each criterion , let denote its standard deviation computed over all alternatives, and let denote the Pearson correlation coefficient between criteria and . Following the CRITIC method, the informational importance of criterion j is defined as [33]:
and the corresponding objective weight is defined as:
]
The CRITIC equations are applied to the decision matrix, in which alternatives A are represented by rows and criteria values , are represented by columns. This process ensures that the resulting weights for both criteria reflect their inherent variability and redundancy across all ESs. The obtained weights serve as an objective baseline for comparison with experimentally evaluated weight combinations.
3.2.3. Preference Functions
In PROMETHEE, the comparison between alternatives is performed by transforming the difference in their evaluations under each criterion into a preference degree. For a given pair of alternatives and , the deviation with respect to criterion j is defined as:
This deviation is then mapped to a preference degree using a preference function :
where represents the degree to which alternative is preferred over with respect to criterion j. As defined in (1), both criteria are to be maximized; therefore, a positive deviation results in a non-zero preference degree.
In this paper, a widely adopted piecewise linear preference function is employed [31]:
where is the indifference threshold, representing the maximum deviation considered negligible, indicating that two alternatives are nearly equivalent within this range. Conversely, is the preference threshold, defining the minimum deviation required to establish a clear preference for one alternative over another.
3.2.4. Pairwise Comparisons
Using the preference degrees obtained for each criterion, the overall preference of alternative over is computed by aggregating criterion-level preferences across all criteria:
3.2.5. Net Flow Computation
To evaluate each alternative with respect to all other alternatives, PROMETHEE computes two preference flow scores. The positive (outgoing) flow reflects how much an alternative is preferred over the others:
while the negative (incoming) flow captures how much the alternative is outranked by the others:
The net flow score, which provides a unique overall preference value for each alternative, is then obtained as:
where . This process yields a set of net flow scores for all ESs:
The resulting net flow scores quantify the overall dominance of each ES relative to the others and are subsequently used to guide the hierarchical clustering process for task orchestration decisions.
In the next stage, a preference-driven clustering algorithm groups ESs based on their net flow values, enabling scalable and adaptive task assignment, as detailed in Algorithm 2.
3.3. Preference-Driven Divisive Hierarchical Clustering
In MCHC-TO, a customized divisive hierarchical clustering technique is adopted to address the multi-criteria nature of task orchestration in MEC. The proposed clustering strategy combines DIvisive ANAlysis (DIANA)-inspired divisive cluster selection with a preference-guided K-medoids splitting mechanism, both of which are detailed in the following subsubsections.
| Algorithm 1 Multi-Criteria Evaluation using CRITIC-PROMETHEE |
Input: Set of edge servers A, evaluation criteria , decision matrix , preference thresholds , . Output: Net flow scores .
|
The process starts by placing all ESs into a single root cluster and iteratively splits clusters into smaller, preference-informed groups to identify the most suitable servers for task execution. At each iteration, the clustering process is guided by the PROMETHEE-derived net flow scores . Initially, ESs with positive net flow values () are assigned to a target cluster , while ESs with negative net flow values form its complementary cluster . PROMETHEE theory establishes that alternatives with positive net flow values exhibit a higher global preference than those with negative net flows. As established in prior PROMETHEE-based work [27], this property enables the identification of a subset that maximizes the preference difference between the subset and its complement. Accordingly, assigning ESs with to ensures the selection of a preferred subset of servers with respect to the global preference relation.
Formally, the preferred subset is defined by:
where is the complement of the cluster within the set A. As a result, the cluster dominates its complement in terms of aggregated preference, effectively reducing the solution space by excluding less competitive ESs from further consideration.
3.3.1. Cluster Selection and Termination
Following DIANA’s greedy divisive strategy [34], only one cluster is selected for further division at each iteration. In the proposed method, this cluster is chosen as the non-singleton cluster containing the ES with the highest net flow value . This strategy ensures that computation focuses on the most promising subset while reducing unnecessary processing of less competitive groups. The process continues until all clusters become singletons, yielding a preference-refined hierarchical structure for task allocation.
The net flow scores are fixed; thus, once the PROMETHEE preference matrix is computed, each splitting step operates on deterministic and well-defined preference values. Consequently, the hierarchical clustering process always terminates after a finite number of splits, producing a valid partition of the ES set.
3.3.2. Preference-Guided Cluster Splitting
Once the preferred cluster is identified, MCHC-TO applies a modified K-medoids splitting procedure to partition the cluster into two sub-clusters. The medoids are selected deterministically as the ESs with the highest and lowest net flow values within the cluster, ensuring maximal preference divergence between the resulting sub-clusters. Each ES is then assigned to the closest medoid based on the absolute difference in net flow values, , which serves as a preference-based similarity measure.
Unlike classical DIANA, which relies on full pairwise dissimilarity matrices and repeated distance updates, the proposed approach computes similarity only with respect to the two extreme medoids at each level. This design significantly reduces computational overhead while preserving preference discrimination. By combining DIANA-inspired cluster selection with preference-guided K-medoids splitting, the proposed clustering strategy remains lightweight, scalable, and well-suited for dynamic MEC environments.
3.4. Task Allocation
The final stage of the proposed MCHC-TO framework is the task allocation, which integrates the outputs of the multi-criteria evaluation and the preference-driven hierarchical clustering stages to select the most suitable execution server for the incoming task. Algorithm 3 summarizes the complete decision process.
Before any action is performed, the algorithm first initializes the required inputs and system parameters (see Algorithm 3, lines 1-3). First, the sensitivity and delay thresholds are loaded. Then, the set A of candidate ESs is constructed. For the incoming task t, the task descriptor , is formed to capture its size and delay sensitivity while the server descriptor stores the location and available capacity of each candidate ES. This initialization ensures that both the multi-criteria evaluation and the hierarchical clustering stages operate on a consistent and up-to-date view of the task requirements and server states.
This algorithm distributes tasks intelligently, considering both task complexity and latency constraints. Specifically, it offloads the complex and delay-tolerant tasks to the cloud, (see Algorithm 3, lines 4-5), thereby preserving the edge resources for latency-sensitive workloads. In particular, tasks that exceed the computational threshold and fall below the delay-sensitivity threshold are directed to the cloud (Figure 2, step 3). When the edge layer is selected for execution, the algorithm identifies the most suitable execution cluster using PROMETHEE-based net flow scores and a divisive hierarchical clustering algorithm. The task is then assigned to the server within the optimal cluster (Algorithm 3, line 10). Although the simulation assumes a static set of ESs, the hierarchical structure allows the method to adapt to server unavailability by redirecting tasks to alternative servers within higher-level clusters, thereby maintaining service continuity.
| Algorithm 2 Preference-Driven Divisive Hierarchical Clustering |
|
Input: Net flow scores from Algorithm 1 Output: Hierarchical clusters and the final selected singleton cluster
|
3.5. Computational Time Complexity
The computational complexity of the proposed MCHC-TO framework is determined by its two main components: the PROMETHEE-based multi-criteria evaluation (Algorithm 1) and the preference-driven divisive hierarchical clustering stage (Algorithm 2).
In the first stage, PROMETHEE computes net flow scores for all n ESs, through pairwise comparisons across g criteria. This involves computing performance deviations, evaluating preference functions, and aggregating weighted preferences. Consequently, the time complexity of this stage is . This evaluation is performed once per task and provides a global preference ordering of ESs. Before the PROMETHEE evaluation, the CRITIC method is applied to compute objective criterion weights based on standard deviation and inter-criteria correlation. This step has a computational complexity of , where g denotes the number of criteria. Since g is small and fixed in MEC orchestration scenarios, the CRITIC-based weighting introduces only a negligible preprocessing overhead and does not affect the overall asymptotic complexity of the proposed framework.
| Algorithm 3 The Proposed MCHC-TO Orchestrator |
|
Input: task features ; server information ; thresholds Output: selected execution location (server): ES () or cloud
|
In the second stage, the divisive clustering procedure is applied only to the subset of m servers with positive net flow values (), where . Unlike classical divisive clustering or K-medoids-based approaches that rely on full pairwise dissimilarity matrices and repeated cluster-wide updates, the proposed method selects two extreme medoids at each level based on the maximum and minimum net flow values. Each server is assigned by computing its distance only to these two medoids, resulting in operations per split. Since only one cluster is divided at each level and the process continues until singleton clusters are obtained, the total number of splitting levels is . Therefore, the overall computational complexity of the clustering stage is . Combining both stages, the total time complexity of the proposed MCHC-TO framework is given by:
where n is the total number of ESs, g is the number of criteria, and is the number of servers with positive net-flow values. Since and g is typically small, the overall complexity is upper-bounded by:
It is important to note that this bound represents the theoretical worst-case scenario. In practice, the PROMETHEE-based filtering step consistently reduces the effective number of servers considered during clustering.
Empirical results under heavy workload scenarios demonstrate that the number of servers with positive net flow values remains significantly smaller than the total number of ESs. In this setting, out of servers, typically only servers exhibit positive net flow values. This behavior is illustrated by the boxplot in Figure 3, which shows that the distribution of positive net flow counts is tightly concentrated around a small median value. As a result, the clustering stage operates on a reduced solution space, resulting in lower effective computational costs in typical MEC deployments. While outranking-based multi-criteria decision methods can be computationally demanding for problems with large numbers of alternatives [35], this limitation is less critical in MEC environments, where deployment constraints naturally bound the number of ESs.
3.6. Illustrative Example of Edge Server Allocation
For simplicity, to illustrate the MCHC-TO workflow, we consider an example set consisting of six edge servers (ESs), each evaluated using two criteria, as reported in Table 3. The first criterion represents the available computational capacity of an ES, normalized in the range . For example, the capacity value for indicates that approximately of its resources are currently utilized, while remain available. The second criterion corresponds to the server location relative to the MD submitting the task. Two location categories are considered: on-site and off-site. This criterion is modeled using binary values, where 1 denotes on-site ESs and 0 denotes off-site ESs. This modeling assumption implies that all off-site servers experience identical transmission characteristics, involving a WLAN hop from the MD to the ER, followed by a MAN hop from the ER to the ES. In this illustrative example, strict preference thresholds are assumed by setting , such that any non-zero deviation between ESs leads to a strict preference. Using the CRITIC-derived weights, the PROMETHEE method is then applied to compute the net flow scores for all ESs, as reported in Table 3.
Before applying PROMETHEE, the relative importance of the two criteria is determined objectively using the CRITIC method. CRITIC computes criterion weights based on their variability and inter-criteria correlation. Table 4 reports the standard deviations, correlation coefficient, CRITIC importance values, and the resulting weights for both criteria. As shown in the table, the location criterion receives a higher weight due to its larger contrast intensity and lower redundancy with the capacity criterion. The resulting CRITIC weights are for capacity and for location.
Figure 4 visually summarizes the evaluation, clustering and selection process described in this scenario. Based on the resulting net flow scores, MCHC-TO applies the preference-driven divisive hierarchical clustering process as follows:
- 1.
- Step 1: Based on the net flow scores in Table 3, the set of ESs A is initially divided into two sub-clusters: a preferred cluster , containing servers with positive values, a and a complementary cluster containing servers with negative values. As illustrated in Figure 4, the preferred cluster is shaded in green, while is shaded in grey.
- 2.
- Step 2: The preferred cluster , which contains the highest net flow value, is selected for further division using the preference-guided K-medoids splitting procedure ( in this case). The medoids are chosen as (highest ) and (lowest ). The remaining server is assigned to the nearest medoid, yielding two sub-clusters and .
- 3.
- Step 3: The cluster , which still contained multiple servers, is divided further. New medoids were selected as and , resulting in two singleton clusters and . The recursive clustering process continues until all clusters contain exactly one ES.
Based on the requirements of the incoming task and the outcomes of the above clustering process, if the task is assigned to the edge layer, the ER selects cluster , which corresponds to the ES with the highest net flow score. (add sentence of generalization...
4. Performance Evaluation and Discussion
This section evaluates the performance of the proposed MCHC-TO solution in the MEC platform. This analysis employed the EdgeCloudSim simulator [36], a widely used simulation tool developed specifically to evaluate edge computing environments and their applications.
4.1. Simulation Setup
In order to simulate realistic edge computing environments, EdgeCloudSim integrates four representative application types: augmented reality (AR), infotainment (Info), health monitoring (HM), and compute-intensive (CI) applications [15]. Table 5 illustrates the key simulation parameters related to tasks. The usage percentage reflects the proportion of MDs associated with each application type, and the task inter-arrival time follows an exponential distribution to simulate task generation rates. Task generation follows an active/idle pattern, in which MDs produce tasks only during active periods. Each task is characterized by its length (in million/Giga instructions MI/GI) unit, determining the required CPU resources, with the execution time calculated based on the VM capabilities in GIPS. The delay-sensitivity scores reflect the importance of latency for a task, with higher values indicating greater real-time demands. The upload and download data sizes represent the volume of data exchanged with the servers during the task execution. Finally, the VM utilization denotes the proportion of CPU resources consumed when running tasks, which is essential to ensure the server can accommodate the task without failure.
The simulation environment included 14 ESs, each running four VMs with a processing capacity of 10 GIPS per VM, and one cloud server hosting four VMs, each providing 100 GIPS. The network parameters, including the bandwidth and delay, were modelled empirically based on real-world observations, as proposed in [15]. The WAN propagation delay was set to 100 ms, while the LAN internal delay was set to 5 ms. A nomadic mobility model governed the movement of 200 to 2400 MDs across three location types, with equal transition probabilities and dwell times of 2, 5, and 8 minutes, representing varying levels of location attractiveness [36]. This configuration resulted in approximately to tasks generated during the simulation runs.
4.2. Comparison Algorithms
In order to evaluate the proposed solution, we implemented three task orchestrators as comparators within the same simulation environment: single-criteria clustering, Fuzzy Logic-based Task Orchestrator (FL-TO) [15] and DRL-based algorithm (DeepEdge) [18]. In our evaluation, we have developed two versions of the K-medoids-based single-criterion clustering algorithms to compare them against the proposed multi-criteria clustering approach: location-based clustering for task orchestration (LOC-TO) [37], and server capacity-based algorithm for task orchestration (CAP-TO).
4.3. Simulation Results
In order to illustrate the effectiveness of the proposed MCHC-TO, we compared its performance against the comparison algorithms using the following evaluation metrics: (i) average service time, (ii) average failed tasks rate, and (iii) average CPU utilization. Before presenting the full comparison, we first examined the impact of different weight combinations for the defined PROMETHEE criteria on the system performance outcomes. These are presented in the following section.
4.3.1. Weight Determination and Sensitivity Analysis
To establish an objective baseline for the relative importance of the capacity and location criteria, denoted by and , respectively, we first applied the CRITIC method to the simulation-generated decision matrix, as described in Section 3.2.2. The resulting CRITIC-derived weights across different workload levels are illustrated in Figure 5, where the normalized workload level represents the ratio of the current workload to the maximum workload considered in the simulations. The figure indicates that the location criterion consistently receives a higher weight than the capacity criterion. Therefore, the location contributes more strongly to distinguishing among candidate servers in the considered MEC environment. As the workload increases, the weight assigned to capacity gradually rises while the weight of location decreases, reflecting the growing relevance of resource availability under higher system load. This transition reveals an optimal region between and , where balanced consideration of proximity and resource availability yields the most effective performance. Notably, both weights remain within a relatively narrow range across all workloads, indicating a smooth, workload-aware shift rather than sudden or unbounded changes.
While CRITIC provides an objective, data-driven estimate of criterion importance, it does not directly optimize system-level performance metrics. Therefore, to validate and refine the weight selection, we conducted a sensitivity analysis by evaluating several representative weight combinations under varying system loads. The performance of each combination was assessed using two key metrics: average service time and average task failure rate. To visualize the impact of different weight combinations across varying workload levels, Figure 6 presents heatmaps of average service time and task failure rate. In each heatmap, rows correspond to different workload levels, while columns represent the evaluated weight combinations. The row-separated layout enables clear comparison of performance trends across workloads.
Figure 6 (a) illustrates that the weight combination minimizing service time varies with the workload level and does not follow a single monotonic trend. Under light workloads ( MDs), the minimum service delay is achieved by different weight combinations across rows; however, all of them are location-dominant, such as , , , and . The results suggest that when edge resources are underutilized, prioritizing proximity reduces service times effectively.
As the workload increases to moderate levels ( devices), the optimal region stabilizes around . Strongly location-dominant combinations begin to incur higher delays due to local edge server saturation, while capacity-dominant configurations suffer from increased offloading to remote edge servers or the cloud. This highlights the need to balance proximity with resource availability once contention emerges. Under the heaviest workload (2400 devices), the overall service delay increases substantially for all weight combinations, reflecting system-wide congestion. Although a location-dominant configuration again yields the lowest delay in this extreme case, the differences among weight combinations become less noticeable as congestion dominates system behavior. Importantly, across all workload regimes, the weight combination consistently remains near-optimal and never incurs severe performance degradation. This robustness motivates its selection as the default setting in the proposed MCHC-TO framework, providing stable performance across diverse and dynamically changing load conditions.
Figure 6 (b) complements the service-time analysis by illustrating how task failure rate evolves under different weight combinations and workload levels. Under light workloads (400–1200 devices), failure rates remain uniformly low across all configurations. As the workload increases, strongly location-dominant combinations experience a noticeable rise in failure rate due to on-site server overload. This increase in failure rate is consistent with the service-time behavior shown in Figure 6(a), where strong location dominance leads to on-site ES saturation and subsequent task redirection to the cloud. In contrast, balanced configurations such as maintain lower failure rates and more stable service performance. Together, the service-time and failure-rate heatmaps demonstrate that robust task orchestration in MEC is workload-dependent and requires balancing proximity-driven latency reduction against failure-induced delay amplification, particularly under moderate to heavy workloads.
This experimental finding is further supported by the CRITIC-derived objective baseline, which assigns higher importance to the location criterion under light workloads and gradually increases the relative weight of capacity as the system load grows. The close alignment between the CRITIC-based weighting trend and the empirically observed balance point around confirms that the selected weight configuration captures the intrinsic workload-dependent trade-off between latency reduction and failure avoidance, rather than reflecting arbitrary parameter tuning.
4.3.2. Average Service Time
Service time is one of the most significant performance metrics, specifically for delay-sensitive applications. In our simulation, the service time of a task is defined as the total time elapsed from task submission to the reception of the execution result at the MD. Formally, the service time of task , denoted by , is computed as:
where represents the task offloading delay over WLAN, MAN, or WAN, denotes the execution time on the selected ES or cloud server based on the allocated VM processing capacity, and corresponds to the result transmission delay back to the MD. The average service time is calculated over all successfully completed tasks as:
where denotes the total number of successfully completed tasks during the simulation.
As shown in Figure 7, the average service time (combining both edge and cloud delays) increases as the number of MDs rises from 200 to 2400. The proposed MCHC-TO consistently outperformed the other algorithms, maintaining the lowest service time across all of the device counts. This demonstrated its ability to efficiently manage both the computational and network resources efficiently, while balancing the load between the edge and cloud layers. Beyond 1800 devices, FL-TO and DeepEdge exhibited sharp increases in service time, eventually exceeding LOC-TO. This indicated that DeepEdge and FL-TO consumed edge resources over cloud resources excessively, particularly when the system was overloaded. Meanwhile, CAP-TO achieved relatively low service delays because it formed clusters based on server capacity, consistently targeting the least-loaded servers in task allocation. In contrast, LOC-TO often overlooked the off-site servers that may had available capacity and focused primarily on the on-site servers, reducing the overall resource efficiency.
4.3.3. Average Failed Task Rate
The task failure rate was another critical performance indicator. In our simulation, a task may fail for one of three main reasons, each determined by specific system conditions during execution: (i) Mobility-related failure occurs when the MD moves out of the coverage range of the serving access point before task completion and the MD receives the task response. (ii) Insufficient ES capacity is triggered when the selected ES lacks the available VM resources (i.e., MIPS) required to execute the task at the time of allocation. (iii) Network-capacity failure arises when the WLAN, MAN, or WAN cannot provide the necessary bandwidth for task offloading or result retrieval, typically due to congestion in the corresponding network segment.
The task failure rate is defined as:
where is the number of failed tasks due to mobility, insufficient server capacity, or network limitations, and denotes the number of successfully completed tasks.
As shown in Figure 8, all of the approaches employed maintained failure rates of below at the start of the simulation, but experienced significant increases as the system became overloaded. The proposed algorithm, MCHC-TO, consistently achieved the lowest task failure rate across all of the device counts, highlighting its adaptability in dynamic and congested environments (only under 2400 MDs generating approximately tasks).
In contrast, CAP-TO exhibited the highest failure rate, exceeding at peak load, indicating that its capacity-focused clustering strategy struggled to handle growing demand effectively. In addition, LOC-TO also exhibited noticeable increases in failure rate under a high load ( around ), whereas FL-TO and DeepEdge maintained significantly lower failure rates ( and , respectively), demonstrating their stronger scalability and more balanced task distribution. Overall, it was possible to conclude that single-criteria clustering-based task orchestration engendered a high number of failed tasks as the load increased, primarily due to the inability to balance and trade off among critical criteria.
Figure 9 details the failure rate by application type for each algorithm at peak load (2400 MDs) on the edge and cloud layers. MCHC-TO, LOC-TO and FL-TO demonstrated the highest failure rates for CI applications. These CI applications are delay-tolerant and involve large tasks that require CPU utilization on edge VMs and only CPU utilization on cloud VMs. Consequently, these orchestrators tend to offload such applications to the cloud, which increases WAN bandwidth consumption, as shown in Figure 9 (b). Similarly, DeepEdge also exhibited a high task failure rate for the same application type, but primarily at the edge layer, as it attempted to allocate such large tasks on the edge layer’s limited resources (see Figure 9 (a)). In addition, CAP-TO showed a high failure rate with the HM app, which generates delay-sensitive, small-sized tasks that consume only CPU utilization on edge servers, but are produced at a high rate (every three seconds). This makes the edge layer the preferred choice for executing these tasks. However, these factors create a bottleneck and increase failure rates when the algorithm fails to balance the load effectively, as shown in Figure 9 (a).
The distribution of task failure reasons for all of the algorithms at the highest system load (2400 devices) is illustrated in Figure 10. For MCHC-TO, the most dominant cause for the failed tasks () was WAN-related delay, which accounted for over half of the total task failures. This indicated that, under extreme load, some tasks were still offloaded to the cloud due to limited edge capacity, resulting in higher latency. In contrast, CAP-TO suffered almost entirely from MAN delay, while LOC-TO also primarily encountered MAN and WAN delays, and DeepEdge was dominated by capacity-related failures that were likely due to overloaded edge servers, caused by aggressive edge-level task placement. Finally, FL-TO exhibited a mixed failure profile, with most failures due to capacity and MAN delays.
4.3.4. Average CPU Utilization
The average CPU utilization reflects how intensively the available VM resources are used across the edge layer. In our simulations, all compared algorithms employ the same number and configuration of VMs per edge server. Therefore, average CPU utilization primarily reflects the overall loading of the edge layer rather than differences in resource availability. Lower utilization accompanied by reduced service delay and failure rate indicates more balanced task allocation and alleviated congestion across edge servers. In contrast, high utilization values may imply either effective resource exploitation or server overload, depending on the resulting system performance.
Formally, the average CPU utilization across the edge layer is computed as:
where A denotes the set of edge servers, and and represent the utilized and available processing capacity of server a, respectively.
Figure 11 illustrates the average CPU utilization of VMs across all the ESs as the number of MDs increased. For all algorithms (except CAP-TO), the average CPU utilization increased with the number of MDs, indicating higher resource demand. In the case of CAP-TO, the utilization initially rises for a load up to 1600 MDs and then declines for higher loads.
This reduction is attributed to the high task failure rate caused by MAN-related delays, as shown in Figure 8, which results in fewer tasks being successfully executed at the edge layer. In contrast, the proposed MCHC-TO maintains a stable average VM utilization across all load levels, indicating effective resource management and the avoidance of server overload. This behavior is enabled by continuously evaluating both VM capacity and server location for each incoming task, allowing the system to adapt its offloading decisions accordingly. When interpreted jointly with the service delay and failure rate results, this stable utilization pattern suggests a more effective distribution of workload across edge servers.
Overall, the results confirm the effectiveness of the proposed MCHC-TO framework in handling diverse workload levels, as it consistently achieves favorable performance in service time, task failure rate, and resource utilization relative to existing methods.
5. Conclusion and Future Directions
In this paper, we developed MCHC-TO, a task orchestrator based on a multi-criteria relational clustering approach for efficient task allocation in dynamic MEC environments. Given the complexity of evaluating multiple conflicting factors, MCHC-TO leveraged PROMETHEE-based ranking and hierarchical divisive clustering to identify the most suitable edge server for execution. The simulation results using EdgeCloudSim showed that MCHC-TO outperformed the existing approaches by reducing the average service latency, task failure rates, and edge server overload, thereby enhancing system performance under varying workloads. To the best of our knowledge, this is the first task orchestration model in MEC to employ multi-criteria clustering based on PROMETHEE net flow scores.
The study focuses on two primary evaluation criteria: server location and capacity. However, real-world MEC environments are influenced by a broader range of factors. In future works, we will extend the decision mode to include additional criteria, such as MD density per ES, uplink/downlink bandwidth availability, and instantaneous server queue length. By integrating these extra factors, the framework will better manage congestion, reflect MAN In addition, we intend to incorporate Stochastic Multi-Criteria Acceptability Analysis (SMAA) method to address the uncertainty in criteria weights and thresholds.
Author Contributions
Conceptualization, M.A., A.A. and A.C.; methodology, M.A., A.A. and A.C.; software, M.A.; formal analysis, M.A., A.A. and A.C.; investigation, M.A., A.A. and A.C.; data curation, M.A.; writing—original draft preparation, M.A.; writing—review and editing, M.A., A.A. and A.C.; visualization, M.A.; supervision, A.A. and A.C.; project administration, A.A.; All authors have read and agreed to the published version of the manuscript.
Funding
This research received no external funding.
Institutional Review Board Statement
Not applicable.
Informed Consent Statement
Not applicable.
Data Availability Statement
Data were generated through simulation using EdgeCloudSim and are available from the corresponding author upon reasonable request.
Acknowledgments
The project was funded by KAU Endowment (WAQF) at King Abdulaziz University, Jeddah, Saudi Arabia. The authors, therefore, acknowledge with thanks WAQF and the Deanship of Scientific Research (DSR) for technical and financial support.
Conflicts of Interest
The authors declare no conflicts of interest.
Abbreviations
The following abbreviations are used in this manuscript:
| MEC | Mobile Edge Computing |
| MD | Mobile Device |
| ES | Edge Server |
| MCDM | Multi-Criteria Decision Making |
| CRITIC | Criteria Importance Through Intercriteria Correlation |
| PROMETHEE | Preference Ranking Organization Method for Enrichment Evaluation |
| DHC | Divisive Hierarchical Clustering |
| AHC | Agglomerative Hierarchical Clustering |
| DRL | Deep Reinforcement Learning |
References
- Mahapatra, A.; Mishra, K.; Pradhan, R.; Majhi, S.K. Next generation task offloading techniques in evolving computing paradigms: Comparative analysis, current challenges, and future research perspectives. Archives of Computational Methods in Engineering 2024, 31, 1405–1474. [Google Scholar] [CrossRef]
- Abdulazeez, D.H.; Askar, S.K. Offloading Mechanisms Based on Reinforcement Learning and Deep Learning Algorithms in the Fog Computing Environment. IEEE Access 2023, 11, 12555–12586. [Google Scholar] [CrossRef]
- Zhang, Z.; Li, H.; Tang, Z.; Gu, D.; Zhang, J. A Clustering Offloading Decision Method for Edge Computing Tasks Based on Deep Reinforcement Learning. New Generation Computing 2023, 41, 85–108. [Google Scholar] [CrossRef]
- Ishizaka, A.; Lokman, B.; Tasiou, M. A stochastic multi-criteria divisive hierarchical clustering algorithm. Omega 2021, 103, 102370. [Google Scholar] [CrossRef]
- Fang, J.; Hu, J.; Wei, J.; Liu, T.; Wang, B. An efficient resource allocation strategy for edge-computing based environmental monitoring system. Sensors 2020, 20, 6125. [Google Scholar] [CrossRef] [PubMed]
- Yadav, S.; Mohan, R.; Yadav, P.K. Task Allocation Model for Optimal System Cost Using Fuzzy C-Means Clustering Technique in Distributed System. Ingénierie des Systèmes d’Information 2020, 25. [Google Scholar] [CrossRef]
- Yadav, S.; Narang, K.; Singh, A. Task allocation for optimal system cost using hierarchical clustering in distributed system. In Proceedings of the AIP Conference Proceedings; AIP Publishing LLC, 2024; Vol. 3087, p. 180001. [Google Scholar]
- Jamil, S.U.; Khan, M.A.; Rehman, S.U. Resource allocation and task off-loading for 6G enabled smart edge environments. IEEE Access 2022, 10, 93542–93563. [Google Scholar] [CrossRef]
- Liu, X.; Yu, J.; Wang, J.; Gao, Y. Resource allocation with edge computing in IoT networks via machine learning. IEEE Internet of Things Journal 2020, 7, 3415–3426. [Google Scholar] [CrossRef]
- Li, W.; Chen, J.; Li, Y.; Wen, Z.; Peng, J.; Wu, X. Mobile edge server deployment towards task offloading in mobile edge computing: A clustering approach. Mobile Networks and Applications 2022, 27, 1476–1489. [Google Scholar] [CrossRef]
- Liu, Y.; Yan, J.; Zhao, X. Deep-reinforcement-learning-based optimal transmission policies for opportunistic UAV-aided wireless sensor network. IEEE Internet of Things Journal 2022, 9, 13823–13836. [Google Scholar] [CrossRef]
- Qin, L.; Lu, H.; Lu, Y.; Zhang, C.; Wu, F. Joint Optimization of Base Station Clustering and Service Caching in User-Centric MEC. IEEE Transactions on Mobile Computing, 2023. [Google Scholar]
- Hao, Y.; Cao, J.; Wang, Q.; Du, J. Energy-aware scheduling in edge computing with a clustering method. Future Generation Computer Systems 2021, 117, 259–272. [Google Scholar] [CrossRef]
- Thakkar, J.J. Multi-criteria decision making; Springer, 2021; Vol. 336. [Google Scholar]
- Sonmez, C.; Ozgovde, A.; Ersoy, C. Fuzzy Workload Orchestration for Edge Computing. IEEE Transactions on Network and Service Management 2019, 16, 769–782. [Google Scholar] [CrossRef]
- Jamil, M.N.; Hossain, M.S.; Islam, R.U.; Andersson, K. Workload Orchestration in Multi-Access Edge Computing Using Belief Rule-Based Approach. IEEE Access, 2023. [Google Scholar]
- Sonmez, C.; Tunca, C.; Ozgovde, A.; Ersoy, C. Machine Learning-Based Workload Orchestrator for Vehicular Edge Computing. IEEE Transactions on Intelligent Transportation Systems 2021, 22, 2239–2251. [Google Scholar] [CrossRef]
- Yamansavascilar, B.; Baktir, A.C.; Sonmez, C.; Ozgovde, A.; Ersoy, C. DeepEdge: A Deep Reinforcement Learning Based Task Orchestrator for Edge Computing. IEEE Transactions on Network Science and Engineering 2023, 10, 538–552. [Google Scholar] [CrossRef]
- Alfakih, T.; Hassan, M.M.; Gumaei, A.; Savaglio, C.; Fortino, G. Task offloading and resource allocation for mobile edge computing by deep reinforcement learning based on SARSA. Ieee Access 2020, 8, 54074–54084. [Google Scholar] [CrossRef]
- Wu, H.; Geng, J.; Bai, X.; Jin, S. Deep reinforcement learning-based online task offloading in mobile edge computing networks. Information Sciences 2024, 654, 119849. [Google Scholar] [CrossRef]
- Zheng, T.; Wan, J.; Zhang, J.; Jiang, C. Deep reinforcement learning-based workload scheduling for edge computing. Journal of Cloud Computing 2022, 11, 3. [Google Scholar] [CrossRef]
- Hsieh, L.T.; Liu, H.; Guo, Y.; Gazda, R. Deep reinforcement learning-based task assignment for cooperative mobile edge computing. IEEE Transactions on Mobile Computing 2023, 23, 3156–3171. [Google Scholar] [CrossRef]
- Liu, Q.; Yang, J.; Yan, Z. Dynamic resource orchestration in edge computing environments using multi-agent reinforcement learning. Knowledge and Information Systems 2025, 1–21. [Google Scholar] [CrossRef]
- Shooshtarian, L.; Lan, D.; Taherkordi, A. A clustering-based approach to efficient resource allocation in fog computing. In Proceedings of the Pervasive Systems, Algorithms and Networks: 16th International Symposium, I-SPAN 2019, Naples, Italy, September 16-20, 2019, Proceedings 16; Springer, 2019; pp. 207–224. [Google Scholar]
- Ros, F.; Riad, R.; Guillaume, S. Deep clustering framework review using multicriteria evaluation. Knowledge-Based Systems 2024, 285, 111315. [Google Scholar] [CrossRef]
- De Smet, Y.; Guzmán, L.M. Towards multicriteria clustering: An extension of the k-means algorithm. European Journal of Operational Research 2004, 158, 390–398. [Google Scholar] [CrossRef]
- De Smet, Y. An extension of PROMETHEE to divisive hierarchical multicriteria clustering. In Proceedings of the 2014 IEEE International Conference on Industrial Engineering and Engineering Management. IEEE, 2014; pp. 555–558. [Google Scholar]
- Huang, L.; Feng, X.; Feng, A.; Huang, Y.; Qian, L.P. Distributed deep learning-based offloading for mobile edge computing networks. Mobile networks and applications 2018, 1–8. [Google Scholar] [CrossRef]
- Behzadian, M.; Kazemzadeh, R.B.; Albadvi, A.; Aghdasi, M. PROMETHEE: A comprehensive literature review on methodologies and applications. European journal of Operational research 2010, 200, 198–215. [Google Scholar]
- Brans, J.P.; De Smet, Y.; PROMETHEE Methods. Multiple Criteria Decision Analysis: State of the Art Surveys; Greco, S., Ehrgott, M., Figueira, J.R., Eds.; Springer New York: New York, NY, 2016; pp. 187–219. [Google Scholar] [CrossRef]
- Taherdoost, H.; Madanchian, M. Using PROMETHEE method for multi-criteria decision making: Applications and procedures. Iris Journal of Economics & Business Management 2023, 1. [Google Scholar] [CrossRef]
- Krishnan, A.R.; Kasim, M.M.; Hamid, R.; Ghazali, M.F. A modified CRITIC method to estimate the objective weights of decision criteria. Symmetry 2021, 13, 973. [Google Scholar] [CrossRef]
- Zhang, Q.; Fan, J.; Gao, C. CRITID: enhancing CRITIC with advanced independence testing for robust multi-criteria decision-making. Scientific Reports 2024, 14, 25094. [Google Scholar] [CrossRef] [PubMed]
- Giordani, P.; Ferraro, M.B.; Martella, F.; Giordani, P.; Ferraro, M.B.; Martella, F. Introduction to clustering; Springer, 2020. [Google Scholar]
- Pereira, J.M.; Duckstein, L. A multiple criteria decision-making approach to GIS-based land suitability evaluation. International journal of geographical Information science 1993, 7, 407–424. [Google Scholar] [CrossRef]
- Sonmez, C.; Ozgovde, A.; Ersoy, C. EdgeCloudSim: An environment for performance evaluation of Edge Computing systems. In Proceedings of the 2017 Second International Conference on Fog and Mobile Edge Computing (FMEC), 2017; pp. 39–44. [Google Scholar] [CrossRef]
- Alghamdi, M.; Alam, A.; Nallanathan, A.; Cherif, A. Dynamic Clustering-based Task Orchestrator in Mobile Edge Computing. In Proceedings of the 2024 International Wireless Communications and Mobile Computing (IWCMC); IEEE, 2024; pp. 1613–1618. [Google Scholar]
Figure 1.
High-level overview of a multi-tier MEC architecture.
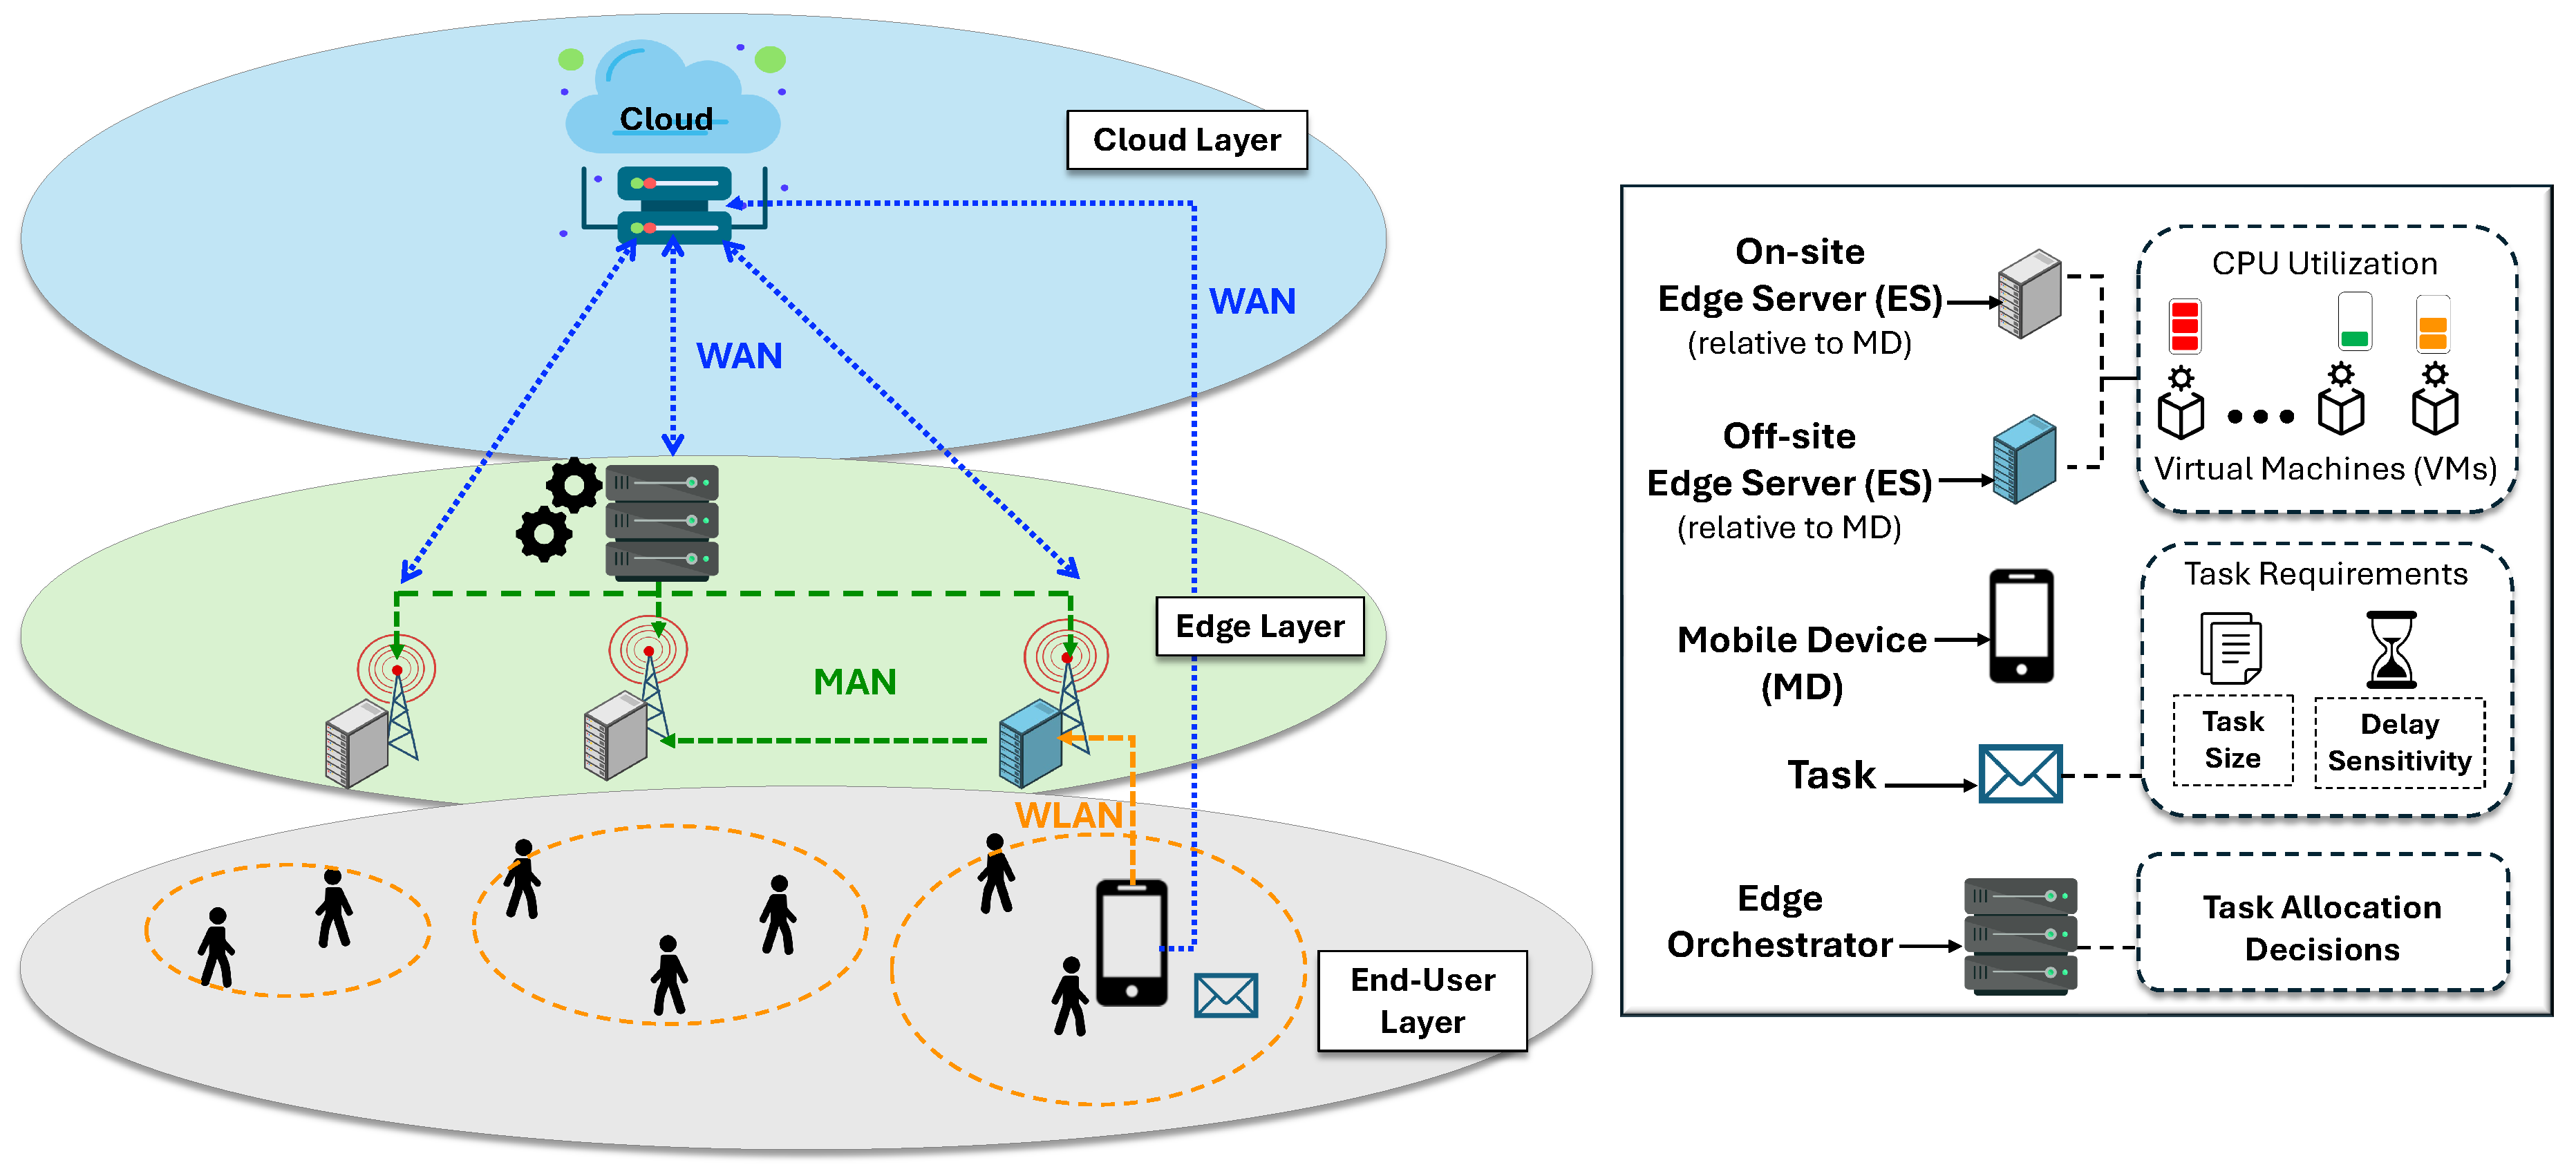
Figure 2.
Overview of the proposed MCHC-TO methodology, illustrating CRITIC-weighted PROMETHEE evaluation, preference-driven divisive hierarchical clustering, and task allocation.
Figure 2.
Overview of the proposed MCHC-TO methodology, illustrating CRITIC-weighted PROMETHEE evaluation, preference-driven divisive hierarchical clustering, and task allocation.
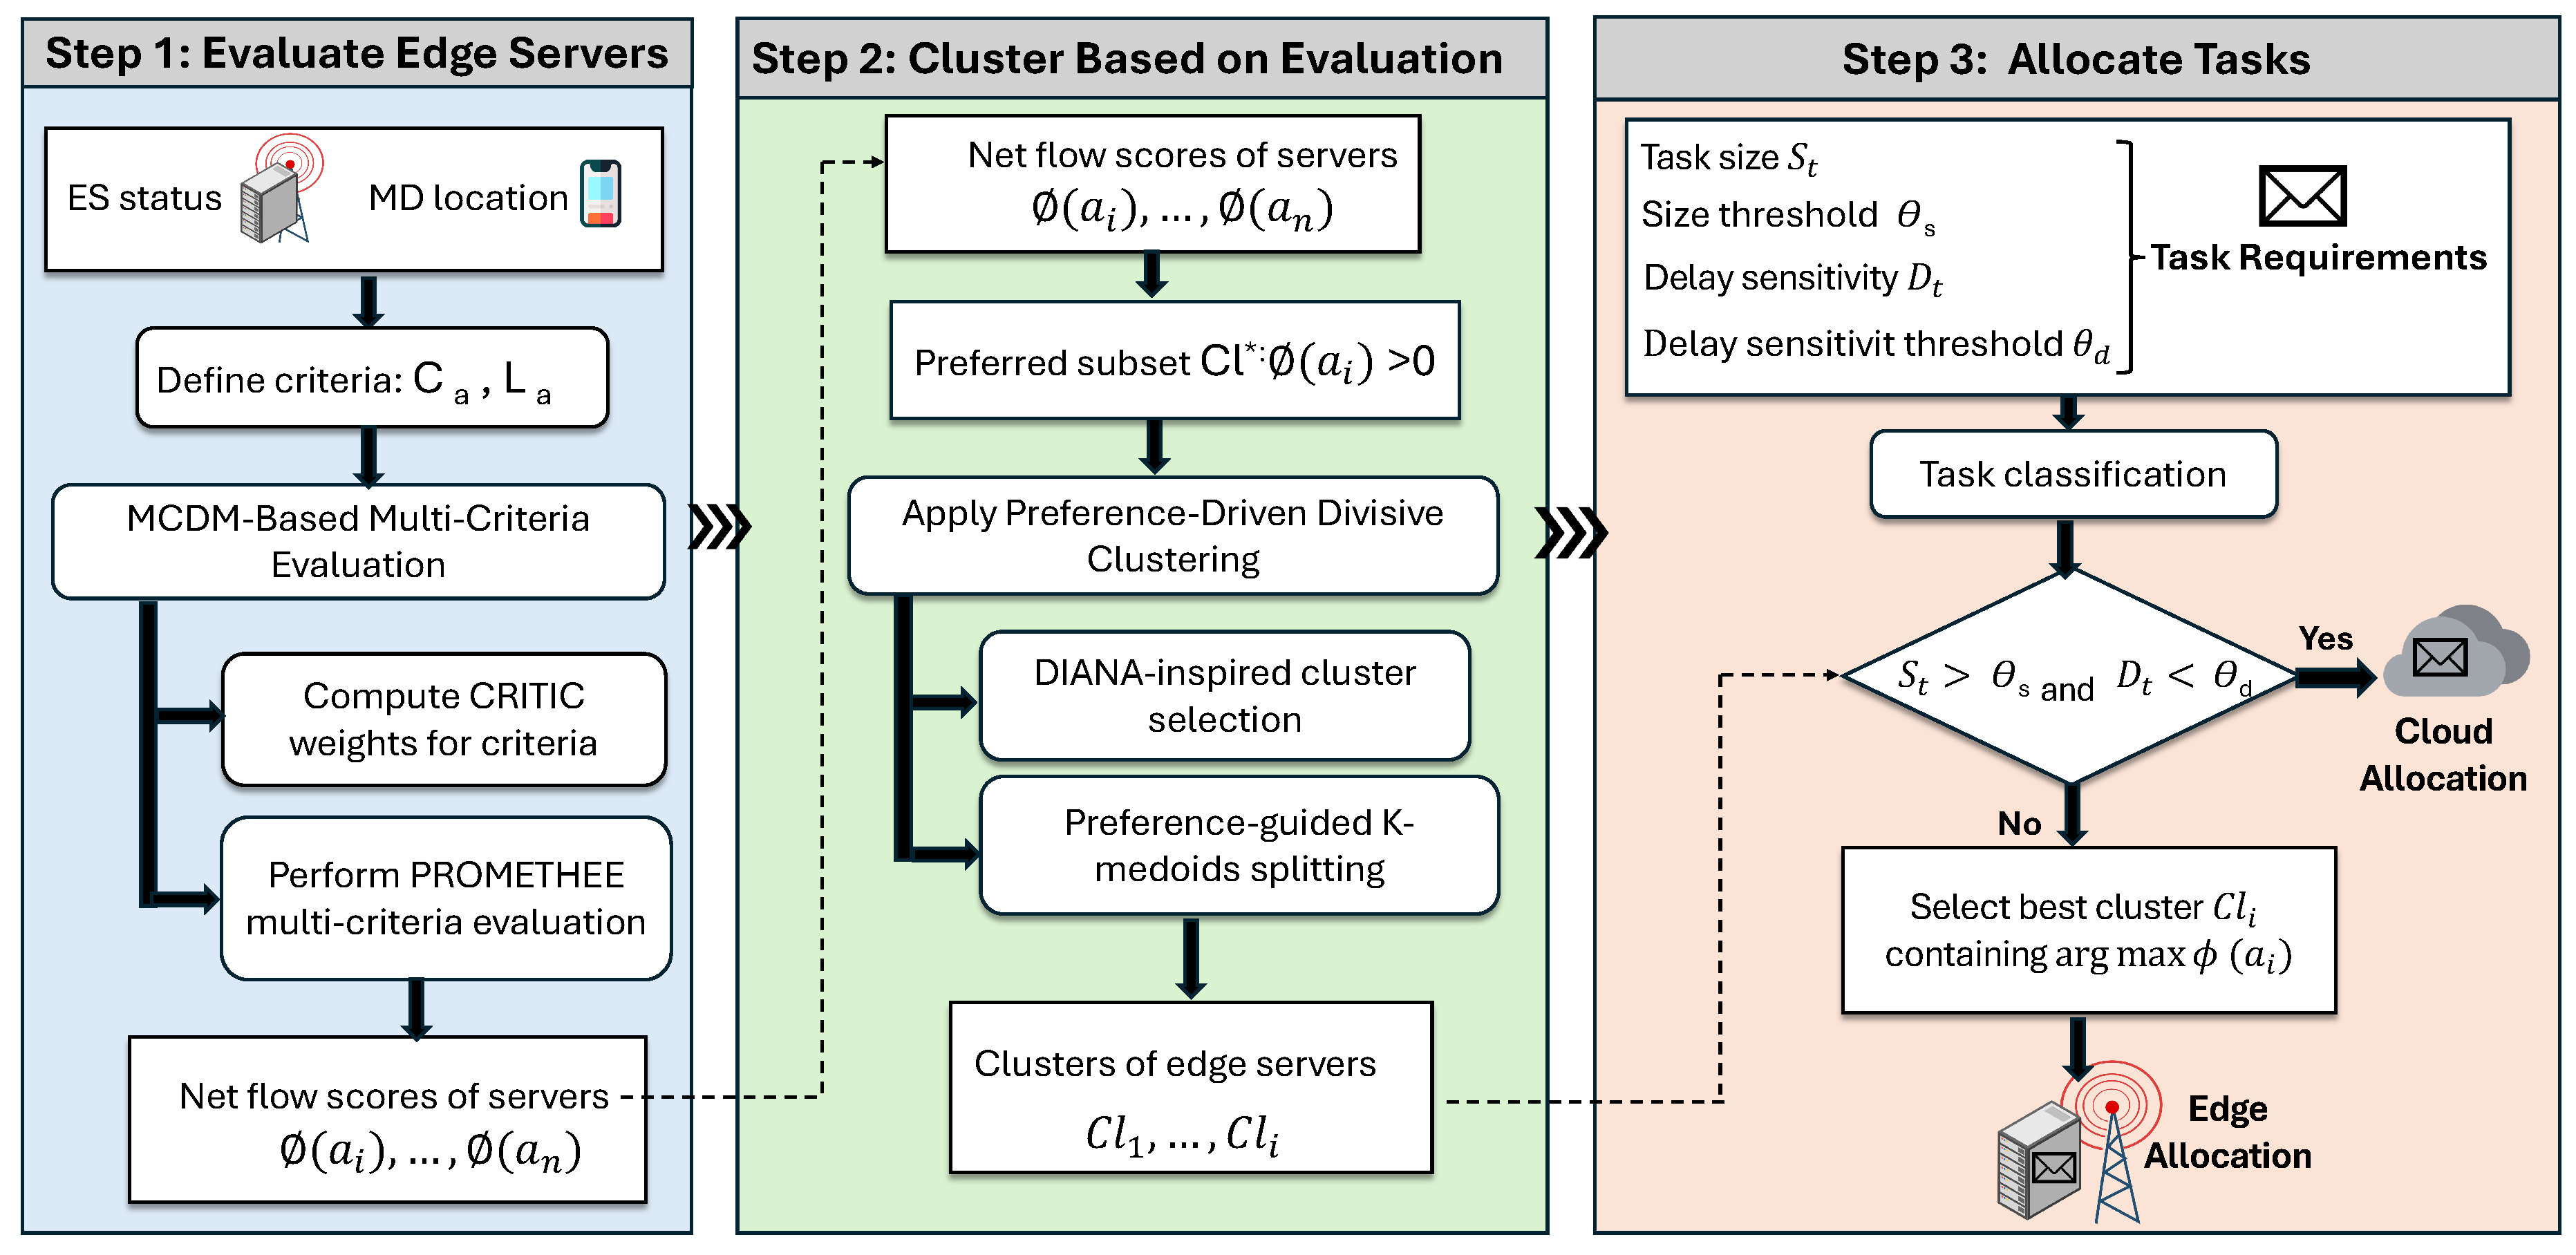
Figure 3.
Distribution of the number of edge servers with positive net flow values under the heaviest load scenario.
Figure 3.
Distribution of the number of edge servers with positive net flow values under the heaviest load scenario.
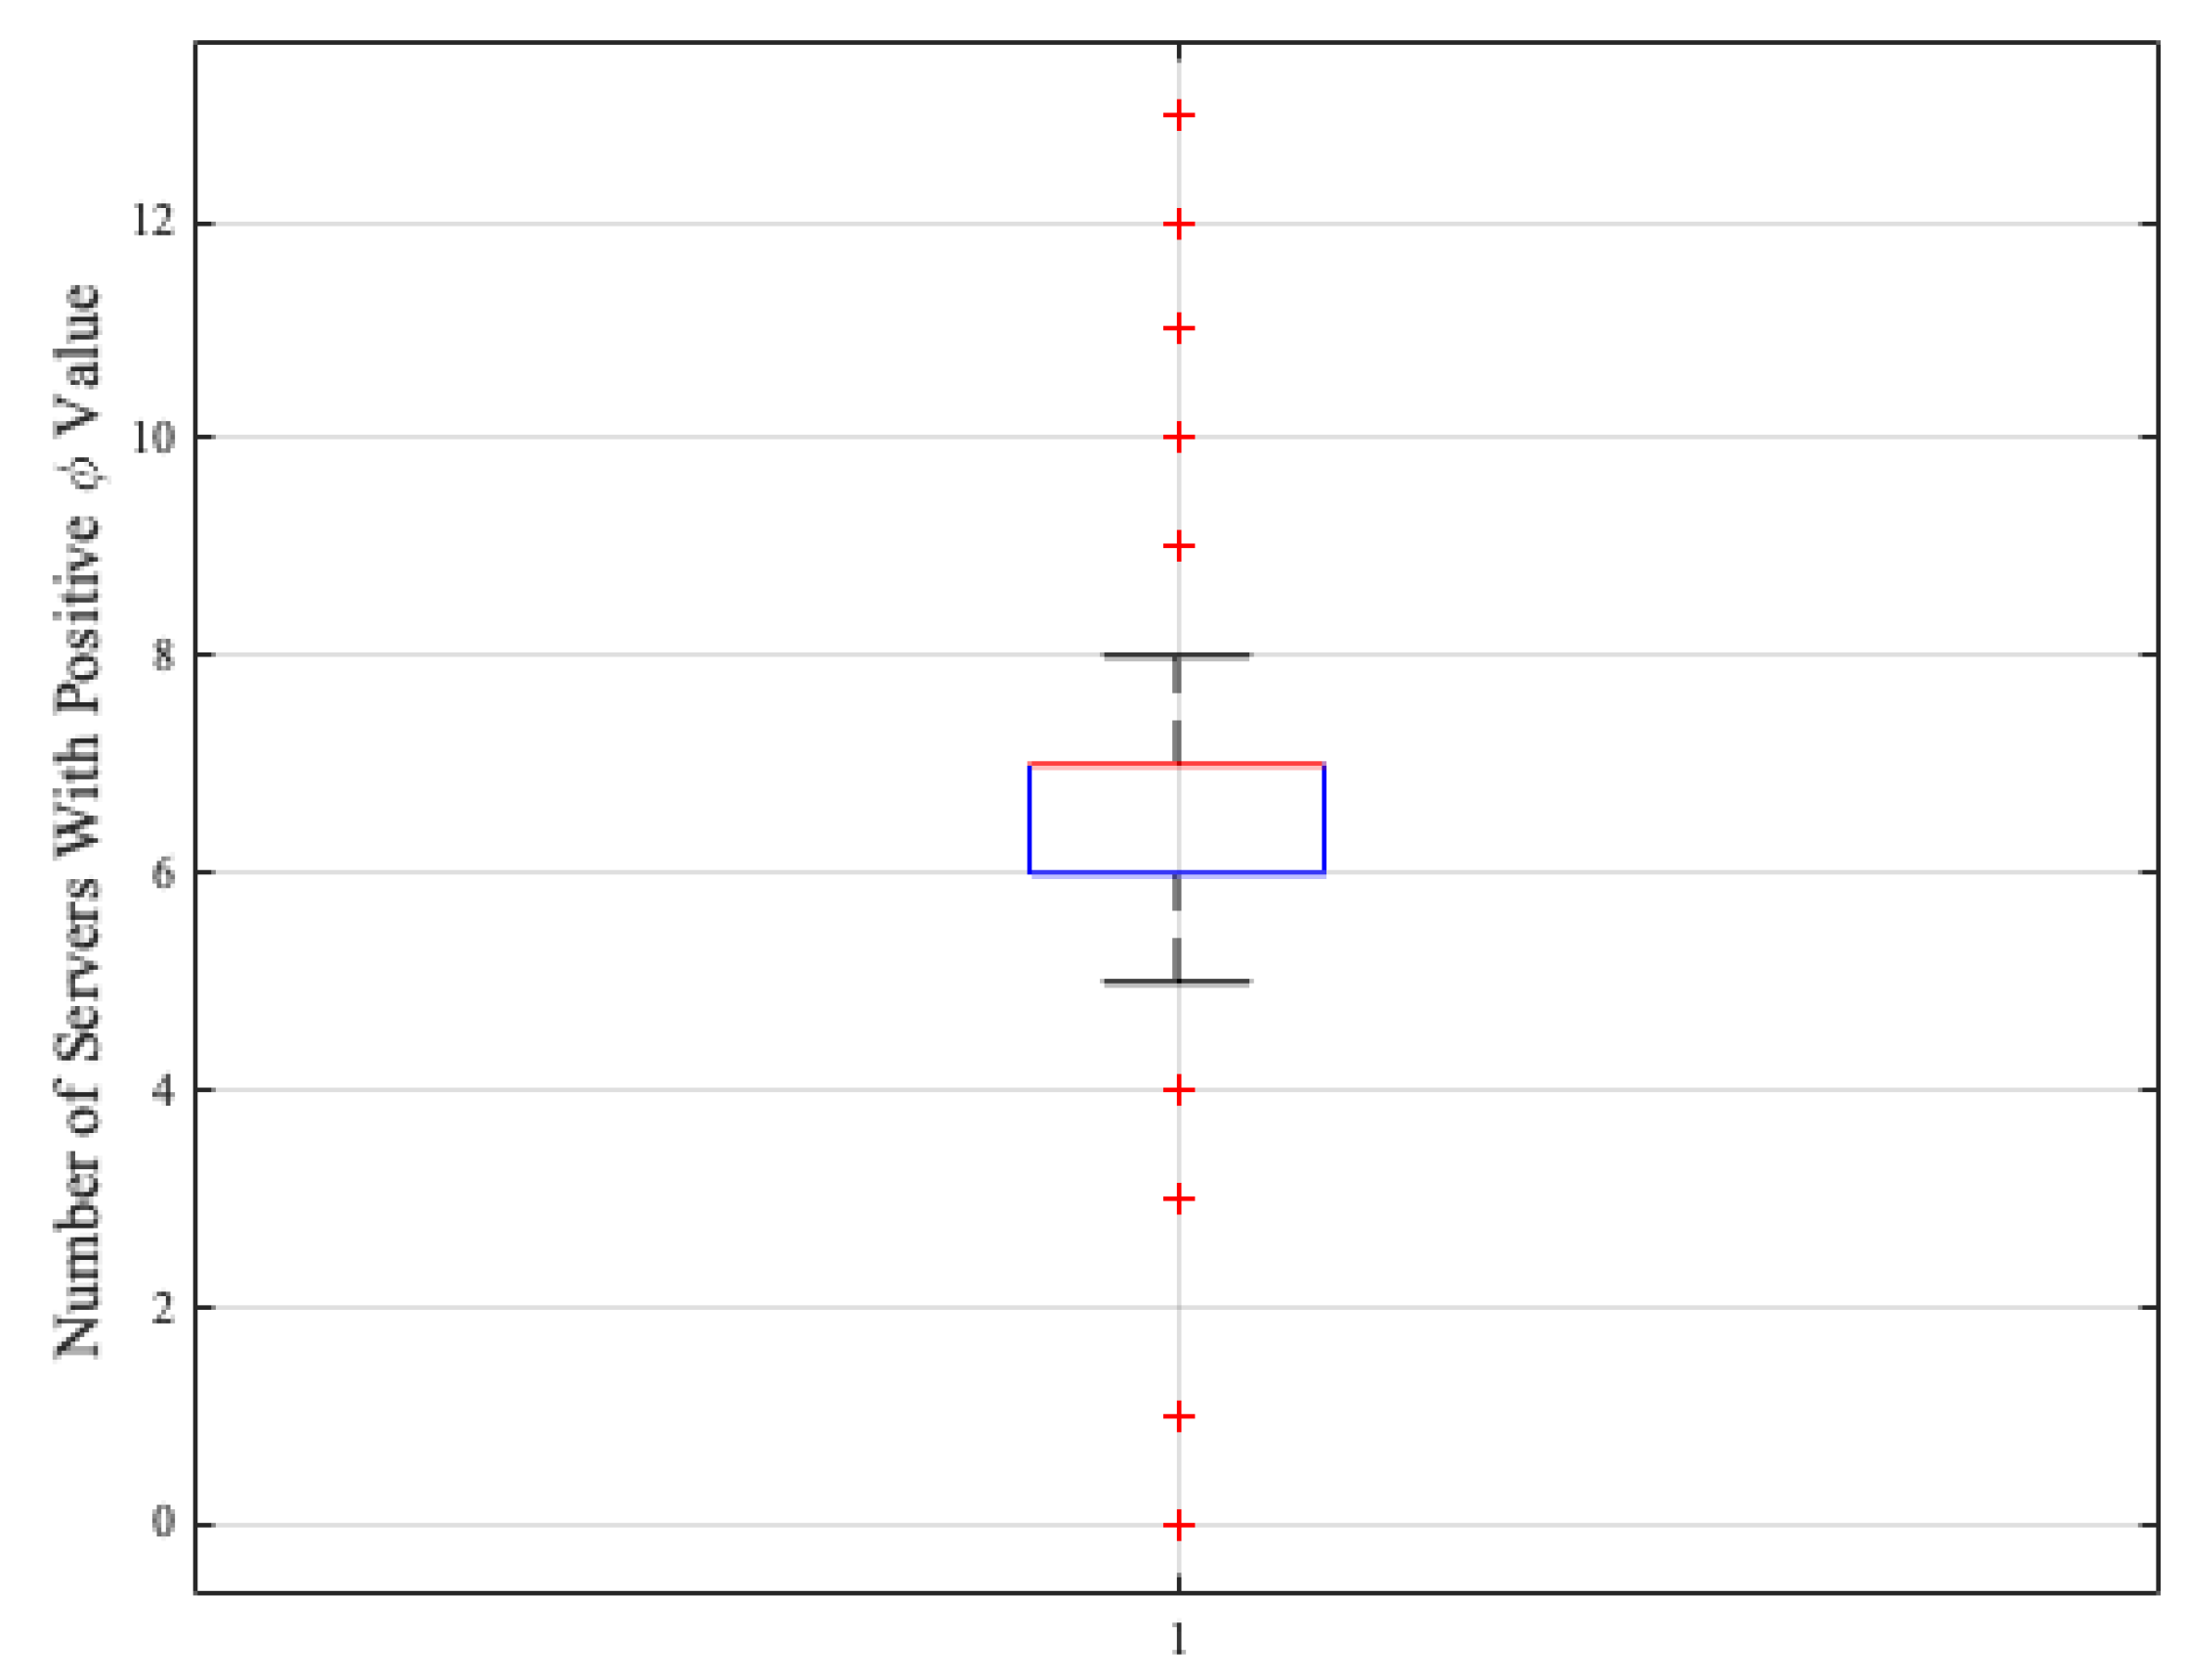
Figure 4.
Illustrative example of CRITIC-weighted PROMETHEE net flow evaluation and preference-driven divisive hierarchical clustering for edge server allocation.
Figure 4.
Illustrative example of CRITIC-weighted PROMETHEE net flow evaluation and preference-driven divisive hierarchical clustering for edge server allocation.
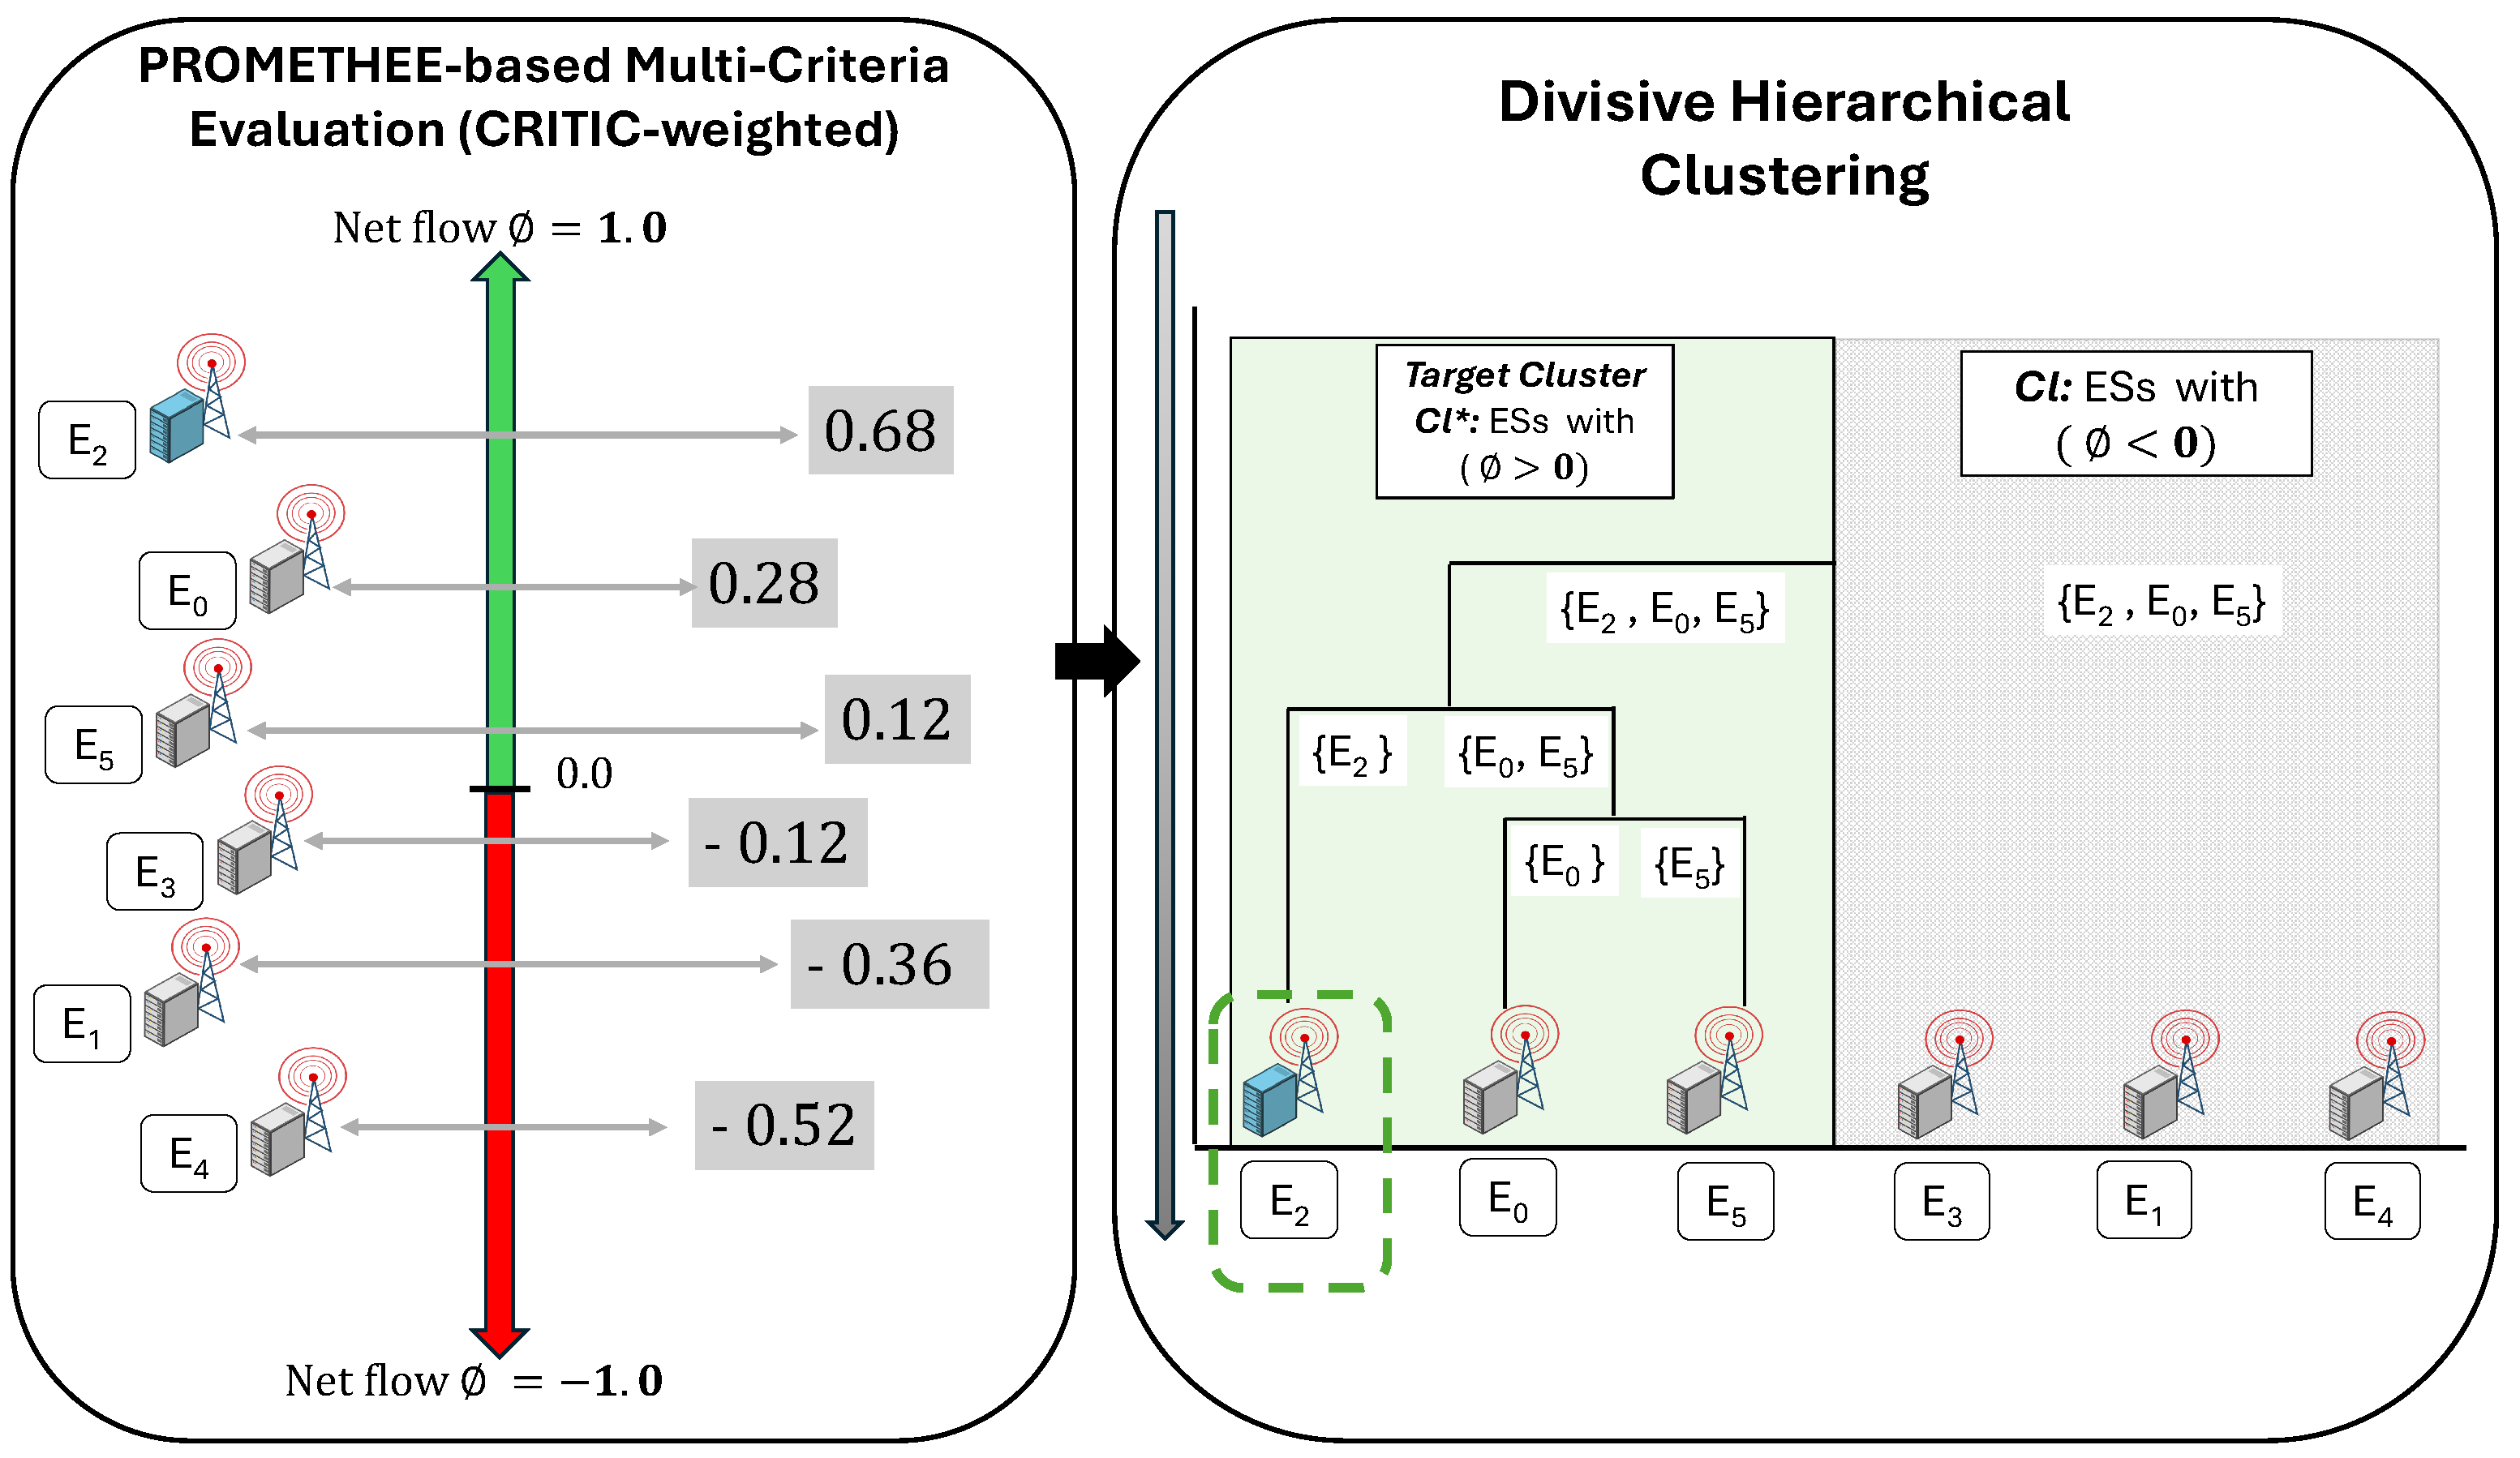
Figure 5.
CRITIC-derived weights of capacity and location criteria under increasing workload.
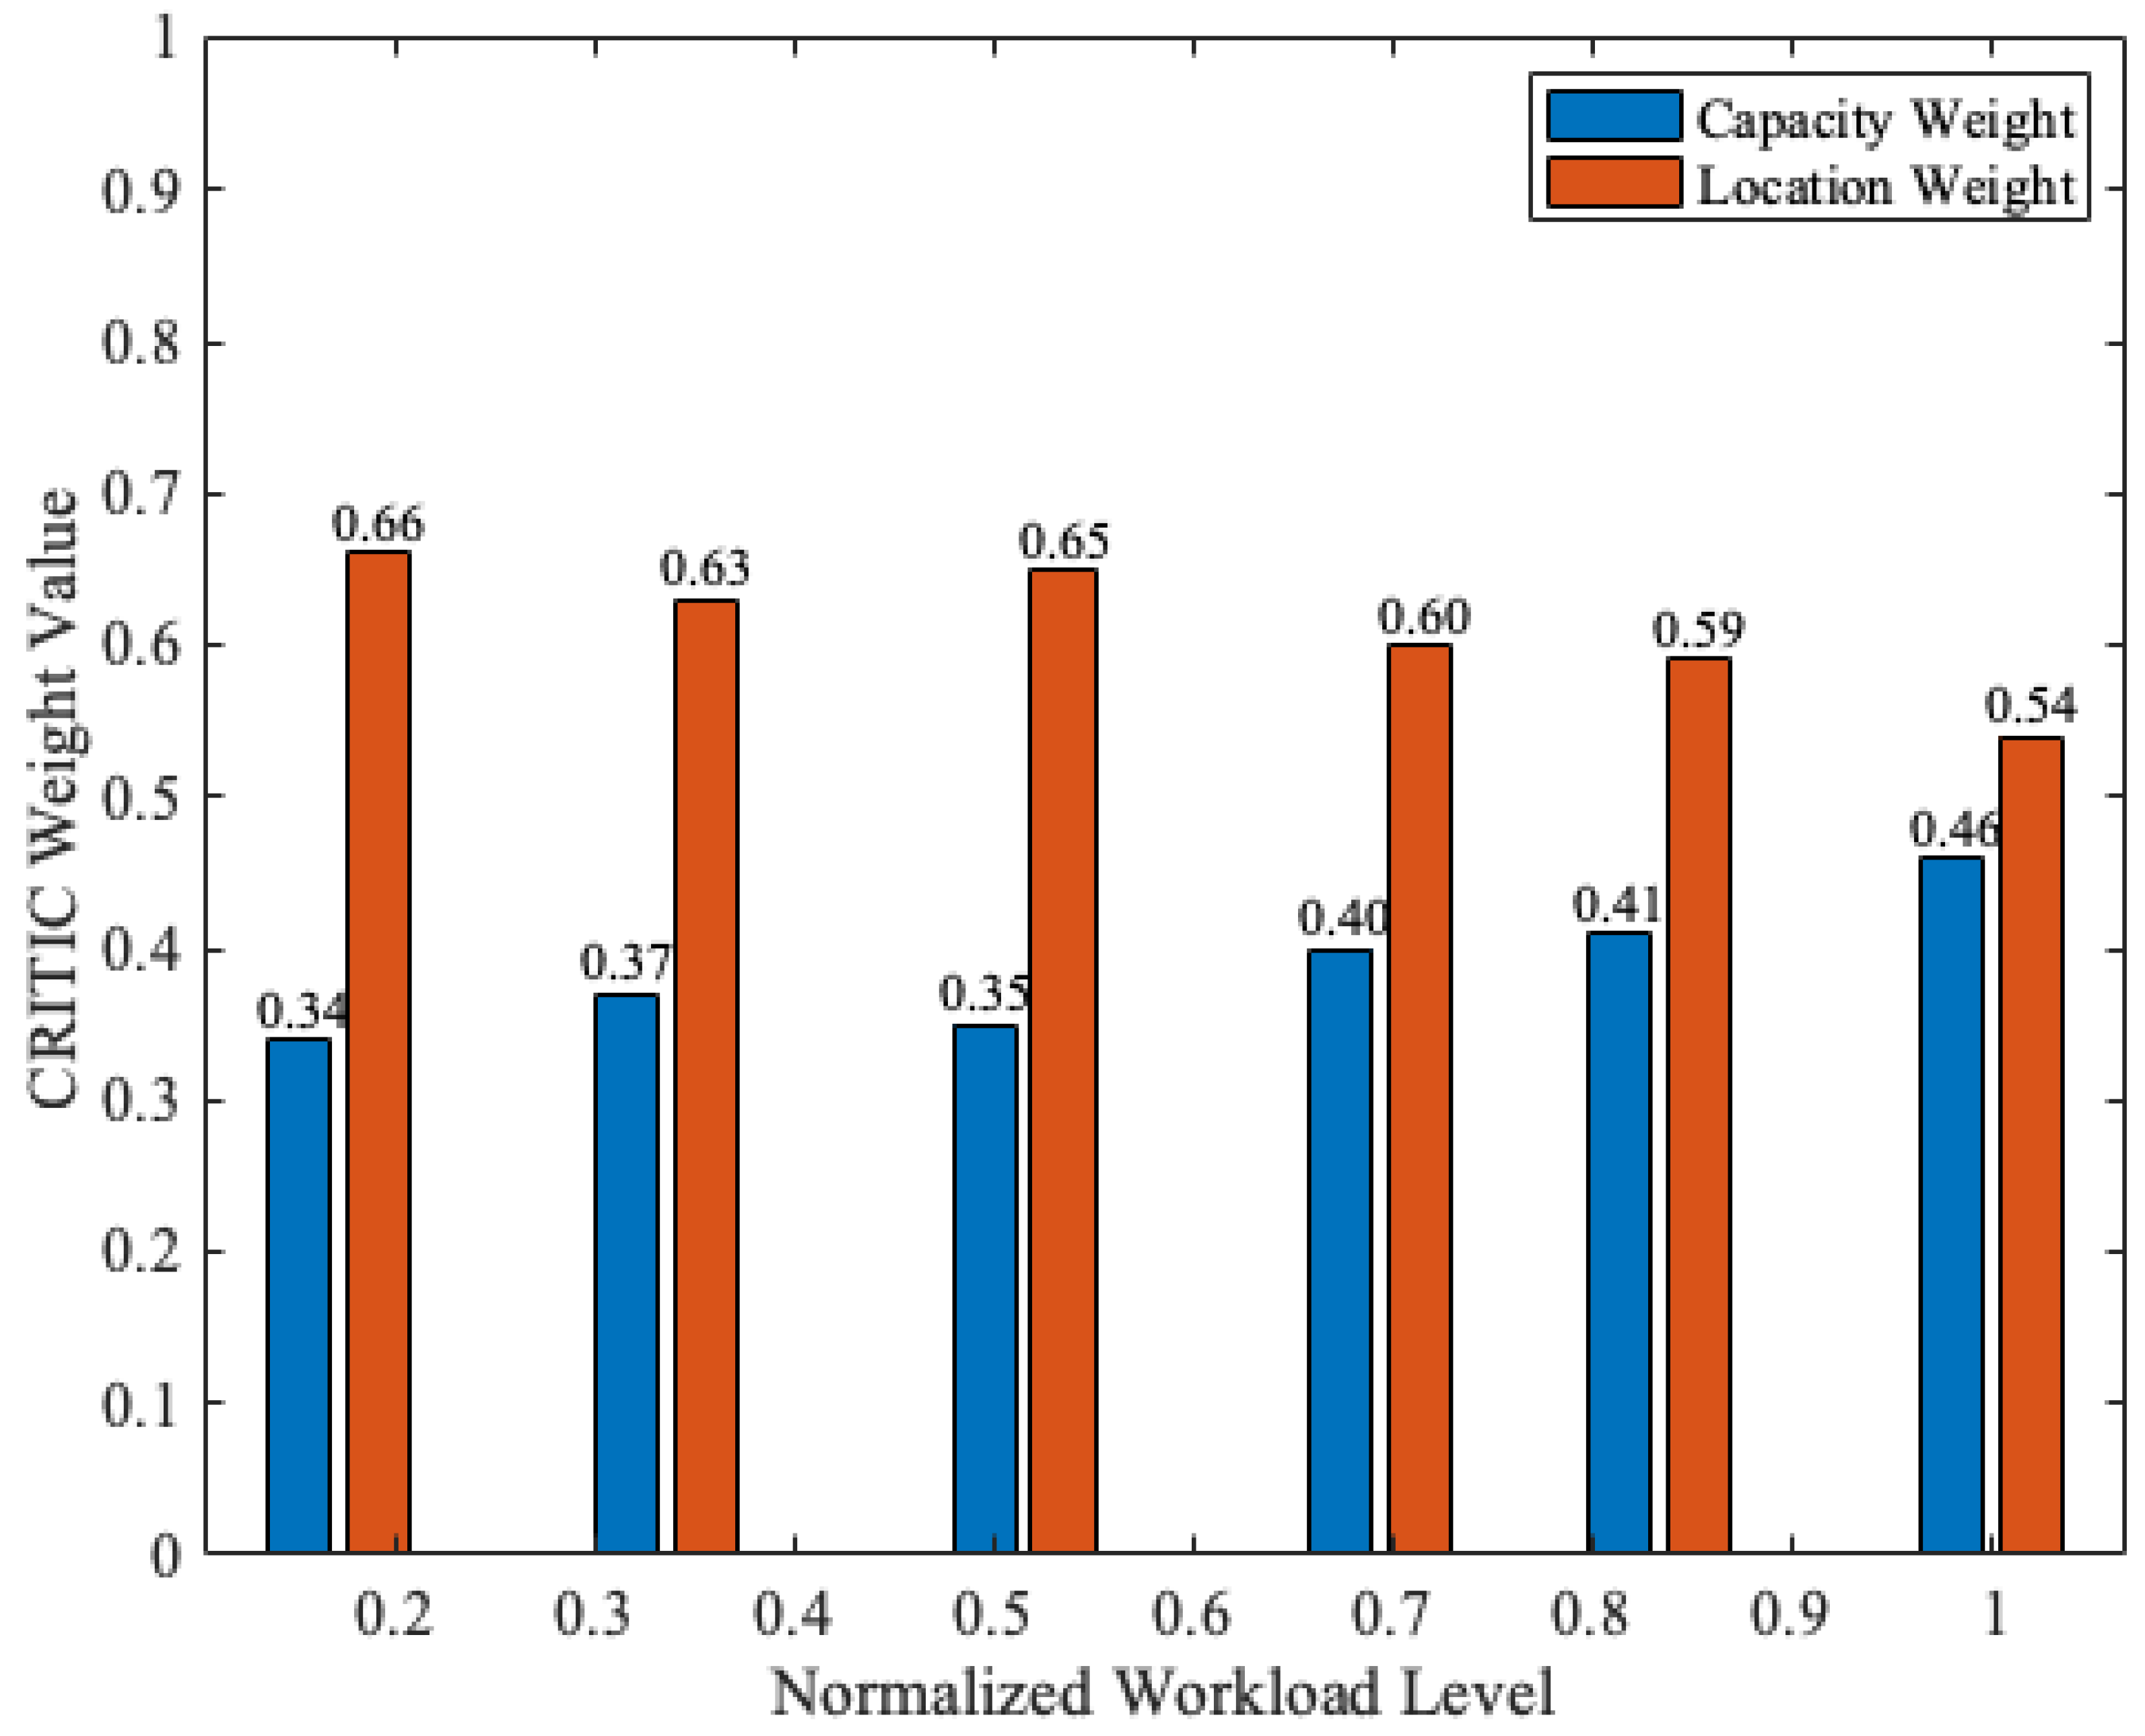
Figure 6.
Effect of weight combinations on (a) average service time and (b) average task failure rate, shown as row-separated heatmaps, where each row corresponds to a fixed workload level.
Figure 6.
Effect of weight combinations on (a) average service time and (b) average task failure rate, shown as row-separated heatmaps, where each row corresponds to a fixed workload level.
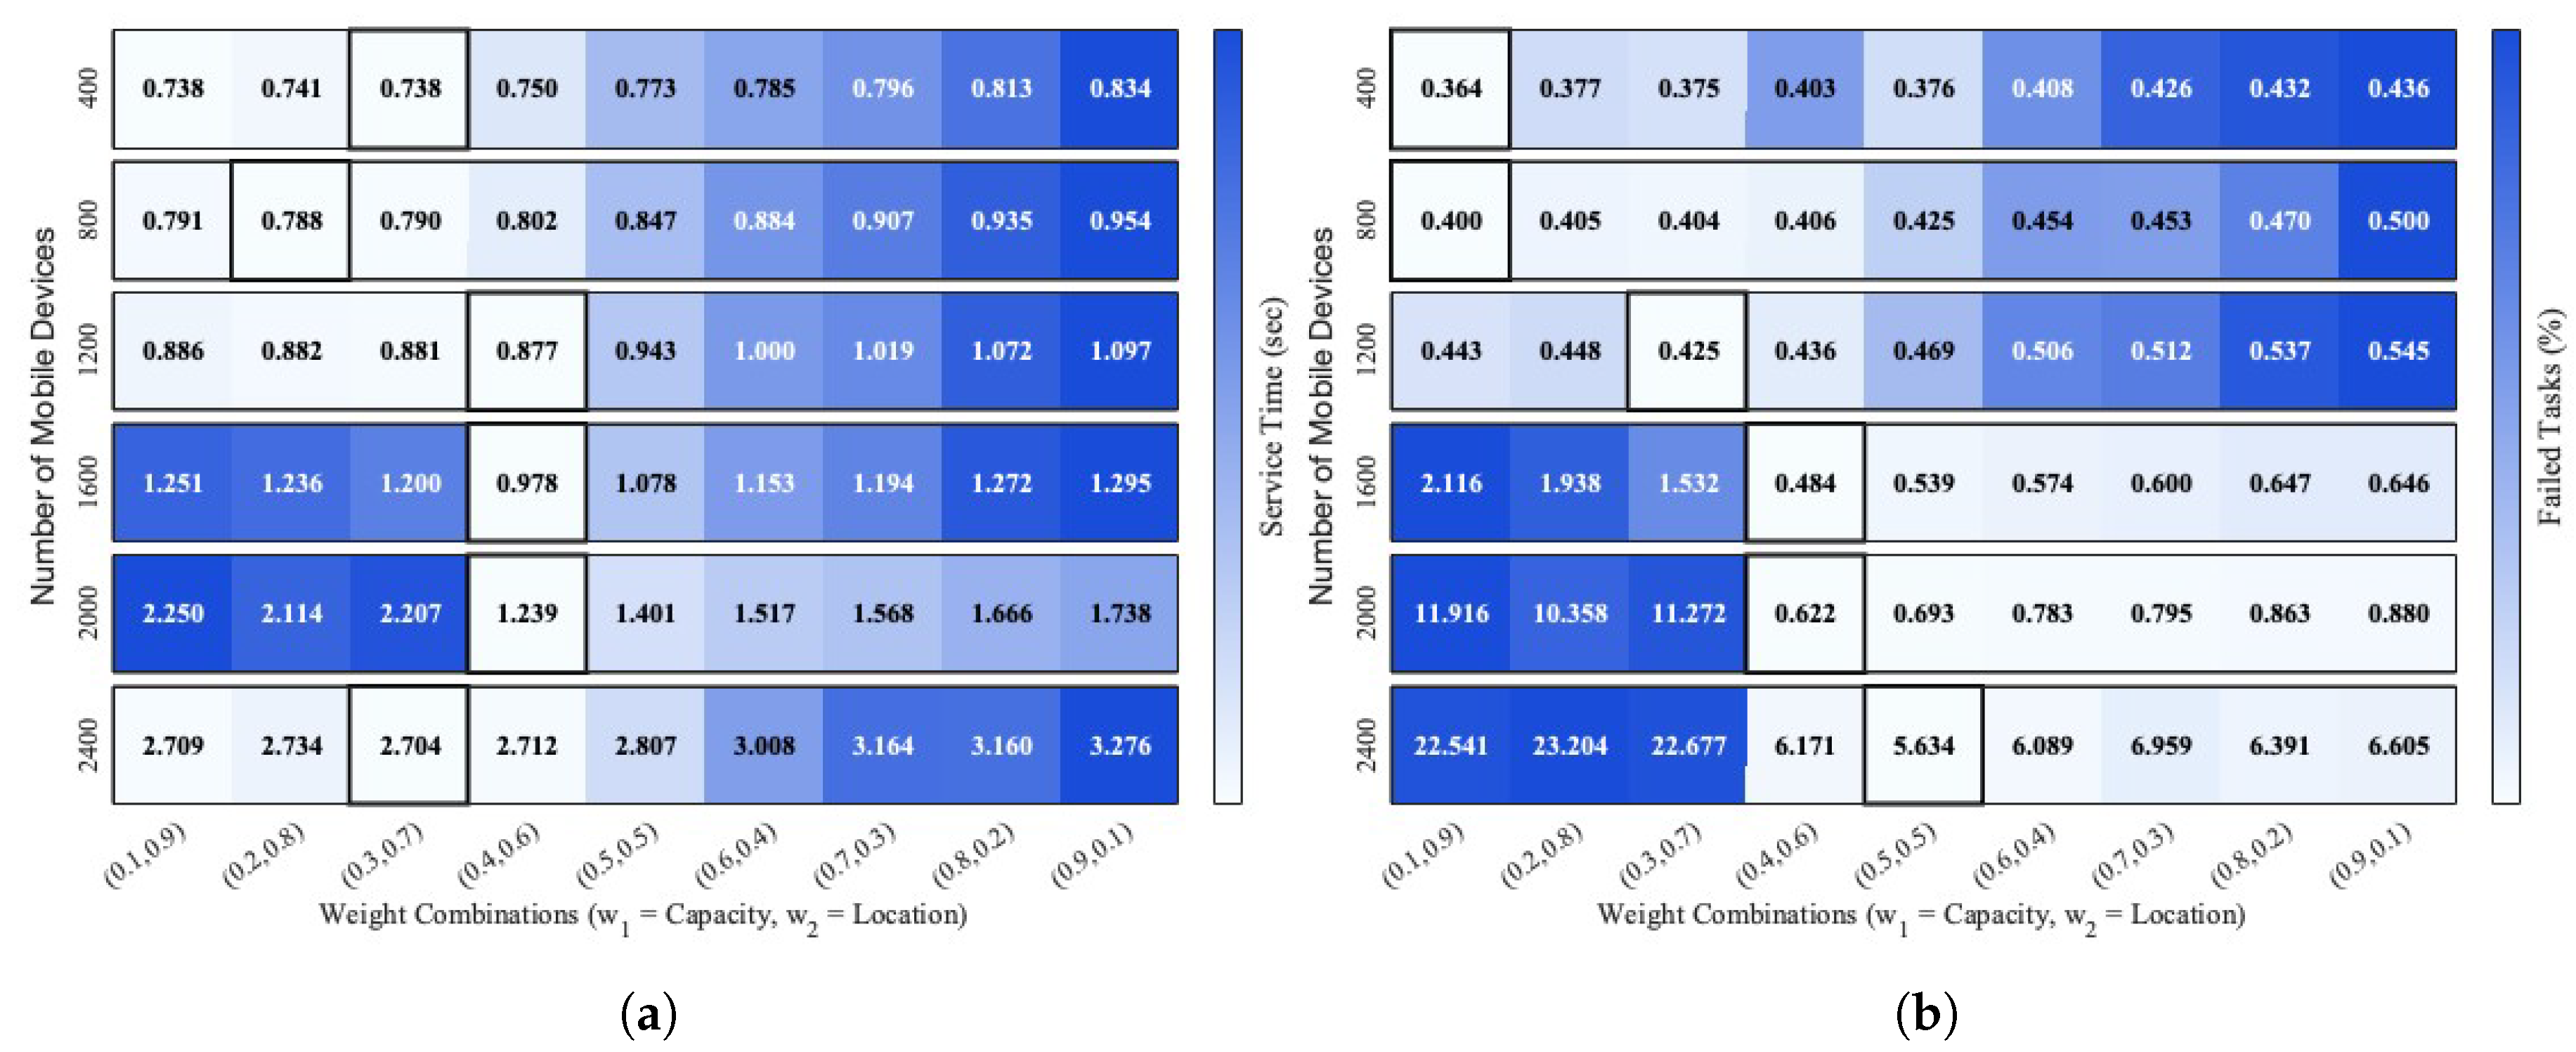
Figure 7.
Comparative evaluation of average service time achieved by MCHC-TO and existing task orchestration methods under different workload levels.
Figure 7.
Comparative evaluation of average service time achieved by MCHC-TO and existing task orchestration methods under different workload levels.
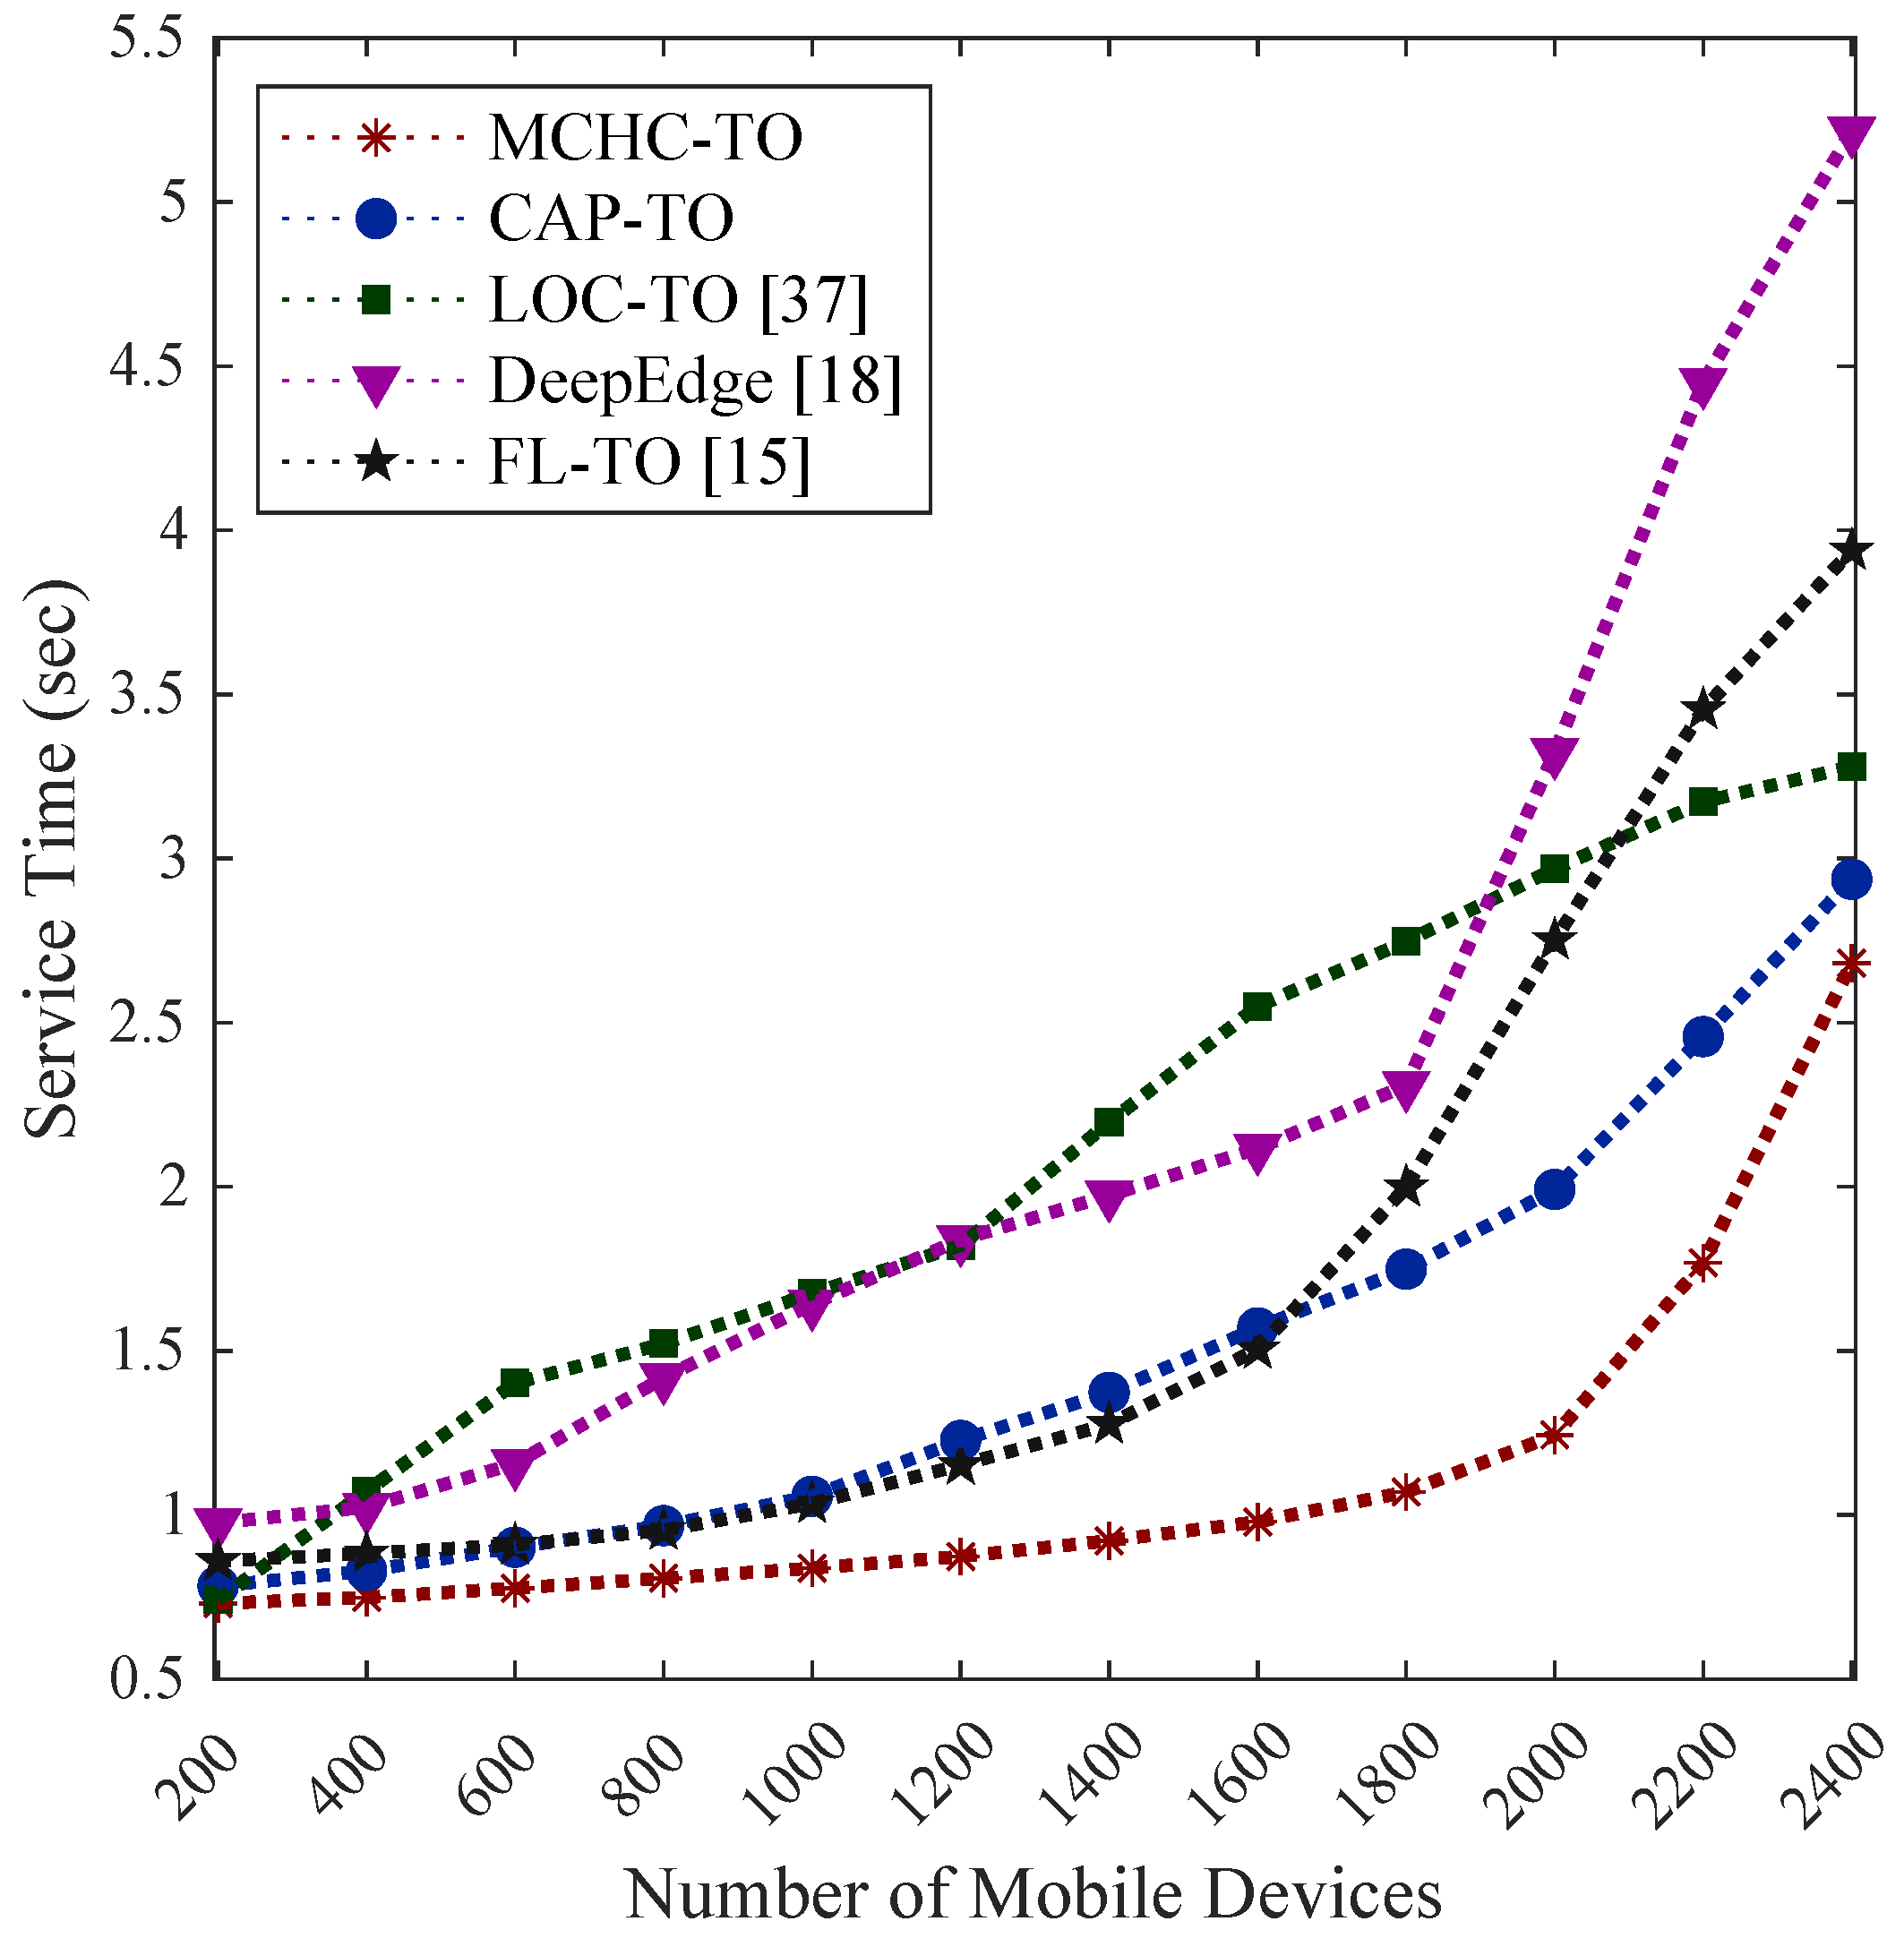
Figure 8.
Comparative evaluation of average failed tasks achieved by MCHC-TO and existing task orchestration methods under different workload levels.
Figure 8.
Comparative evaluation of average failed tasks achieved by MCHC-TO and existing task orchestration methods under different workload levels.
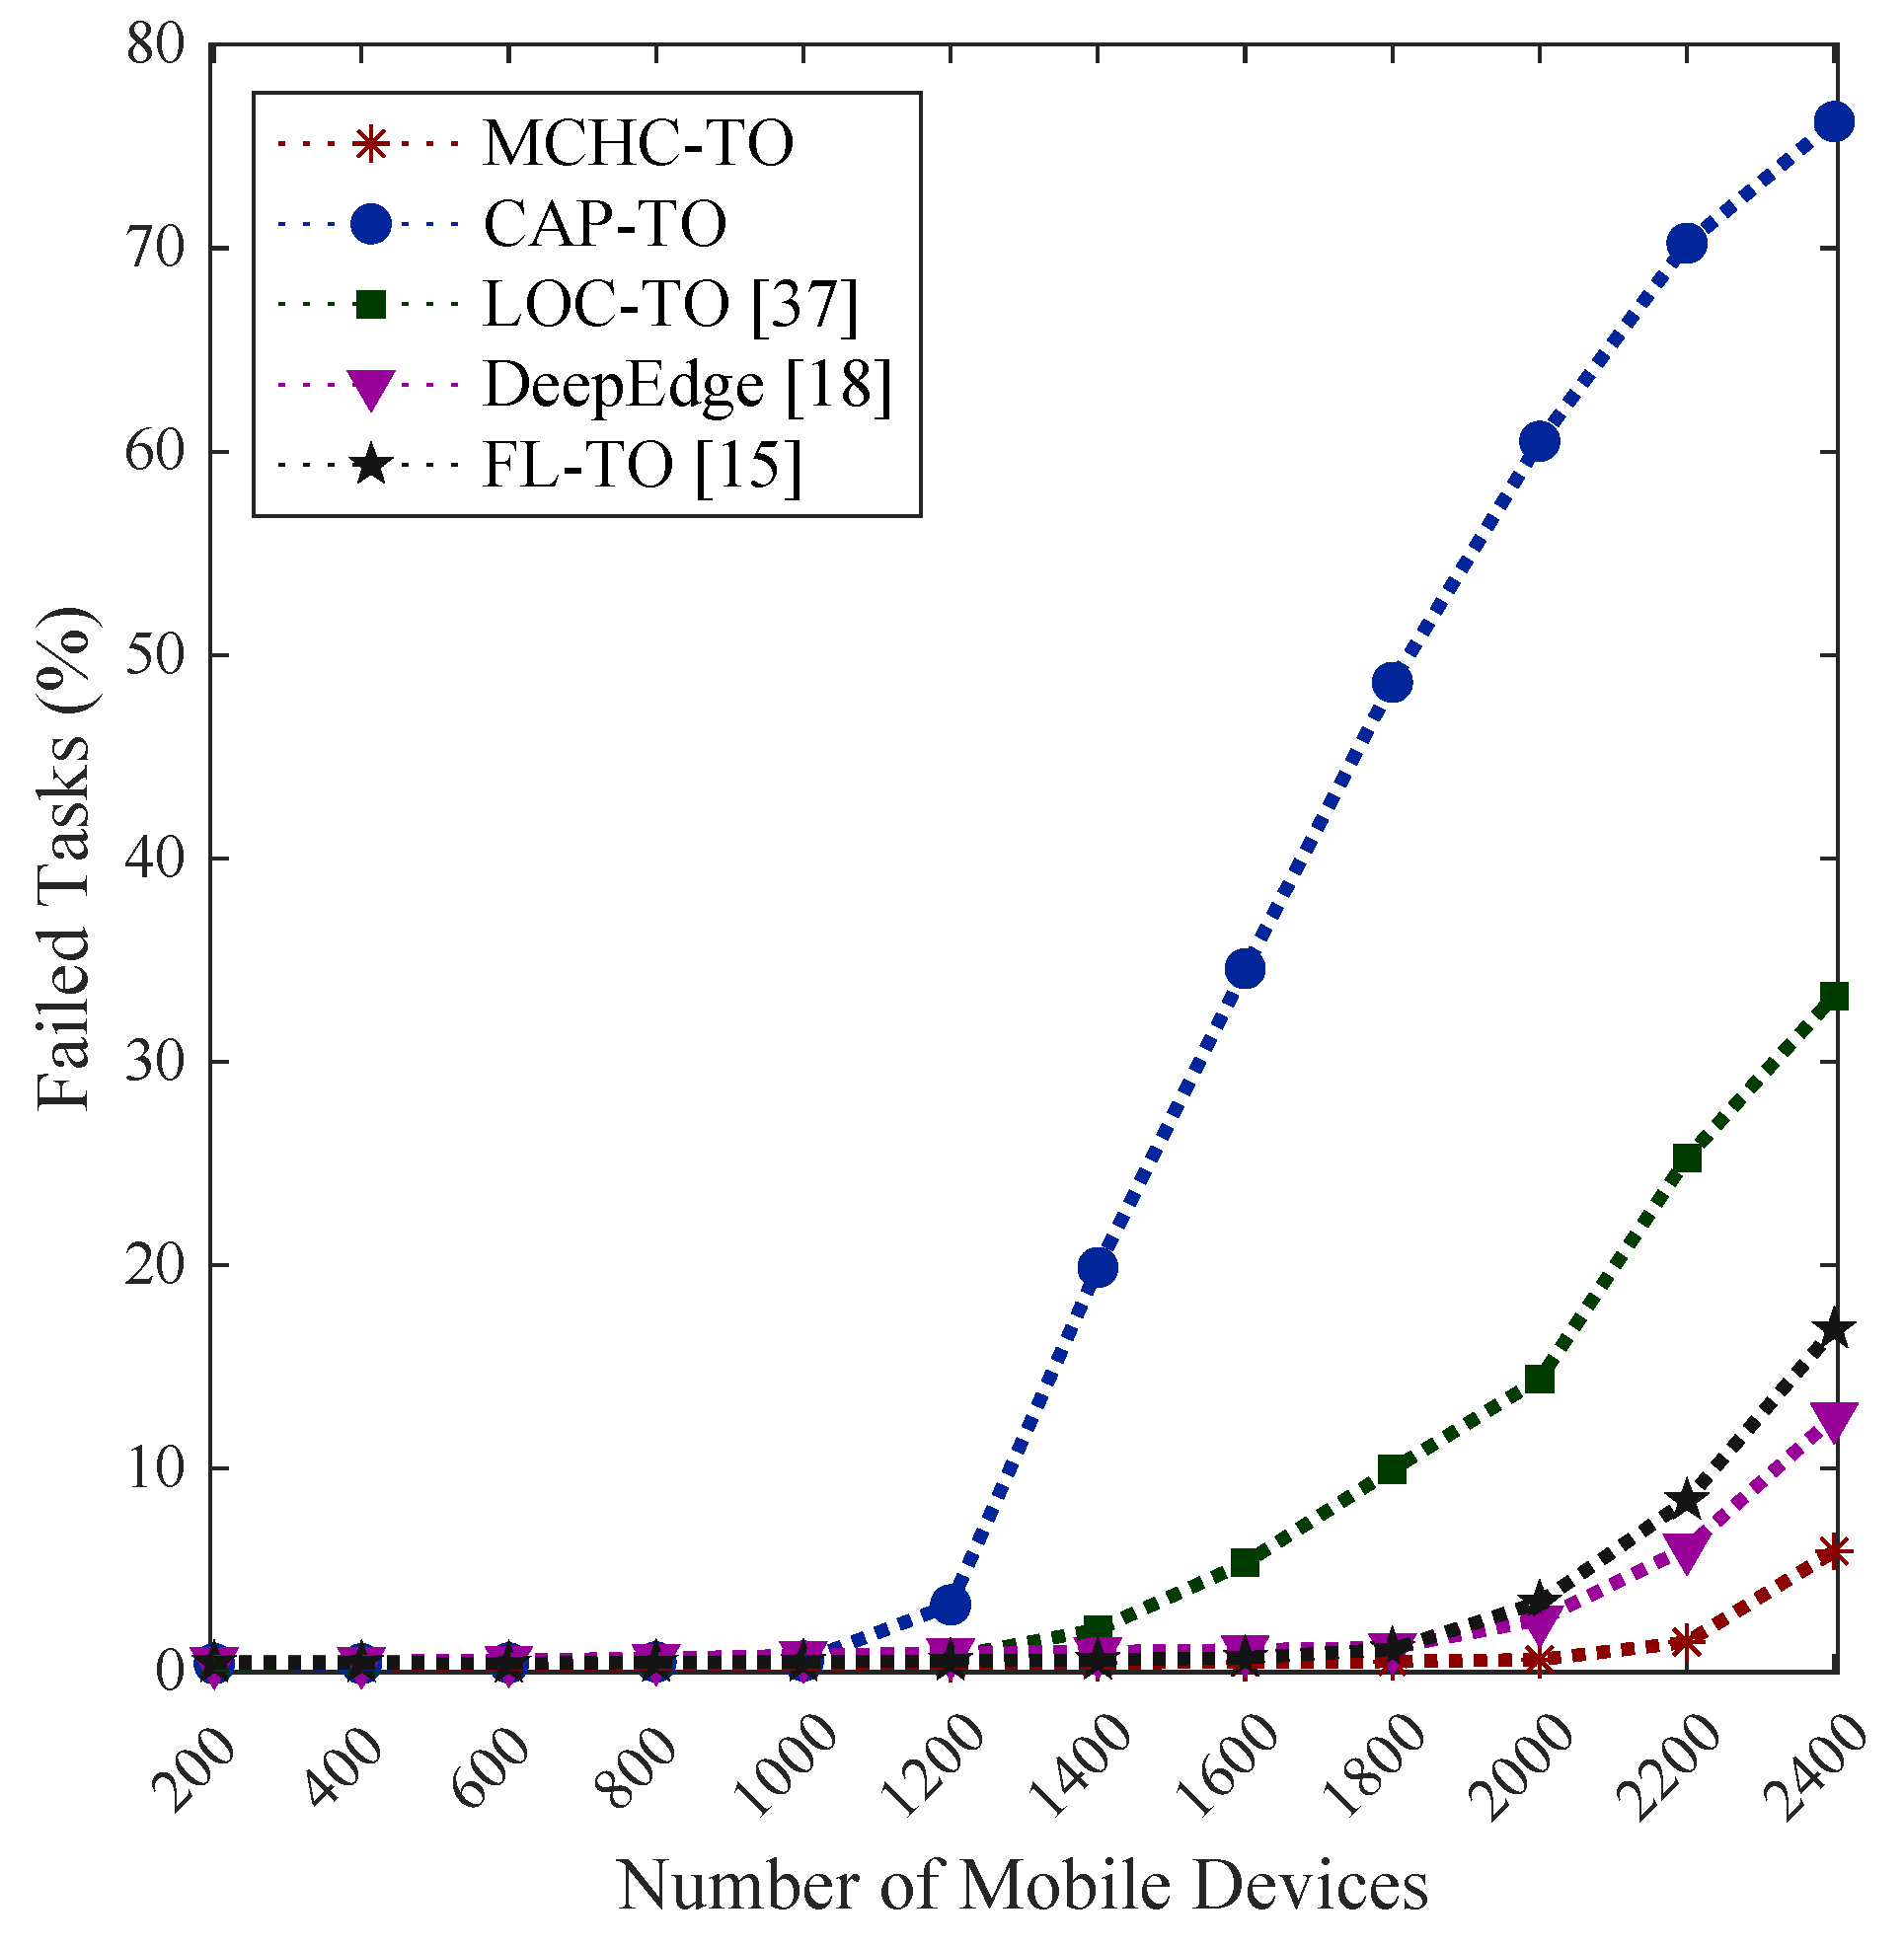
Figure 9.
Average failure rate of MCHC-TO across different application types at: (a) edge layer, and (b) cloud layer.
Figure 9.
Average failure rate of MCHC-TO across different application types at: (a) edge layer, and (b) cloud layer.
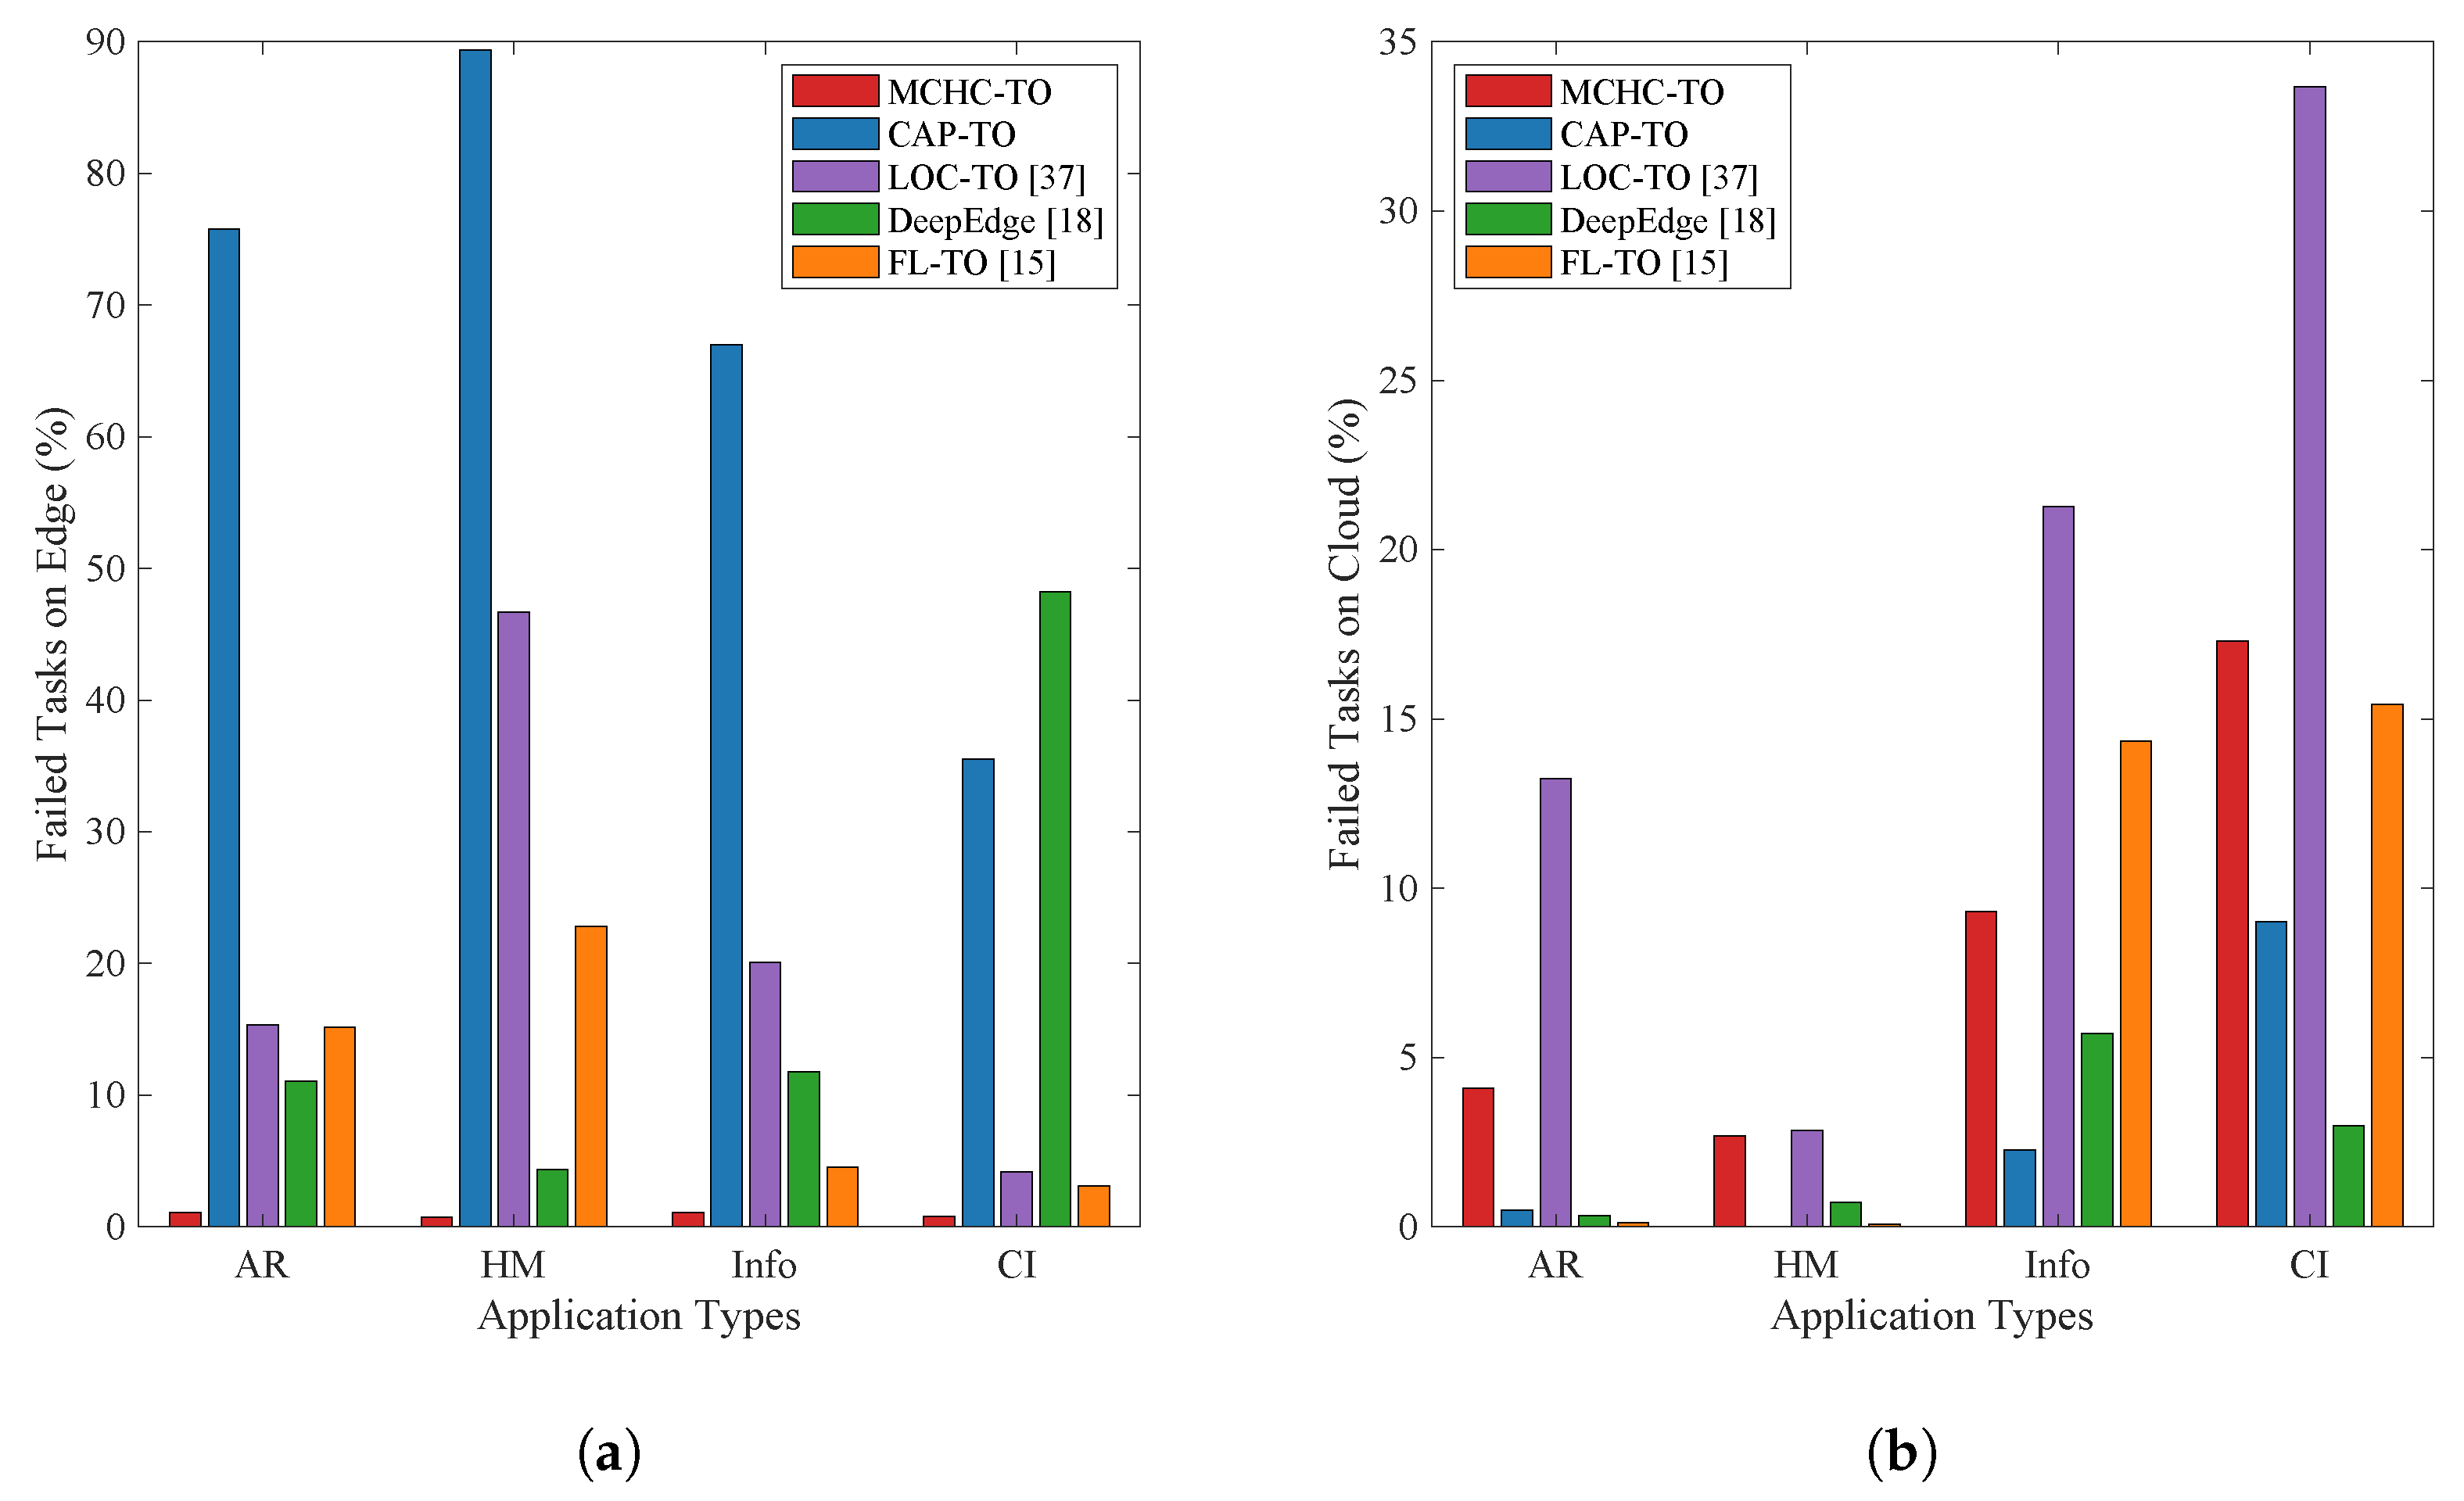
Figure 10.
Distribution of failure reasons of the proposed solution MCHC-TO.
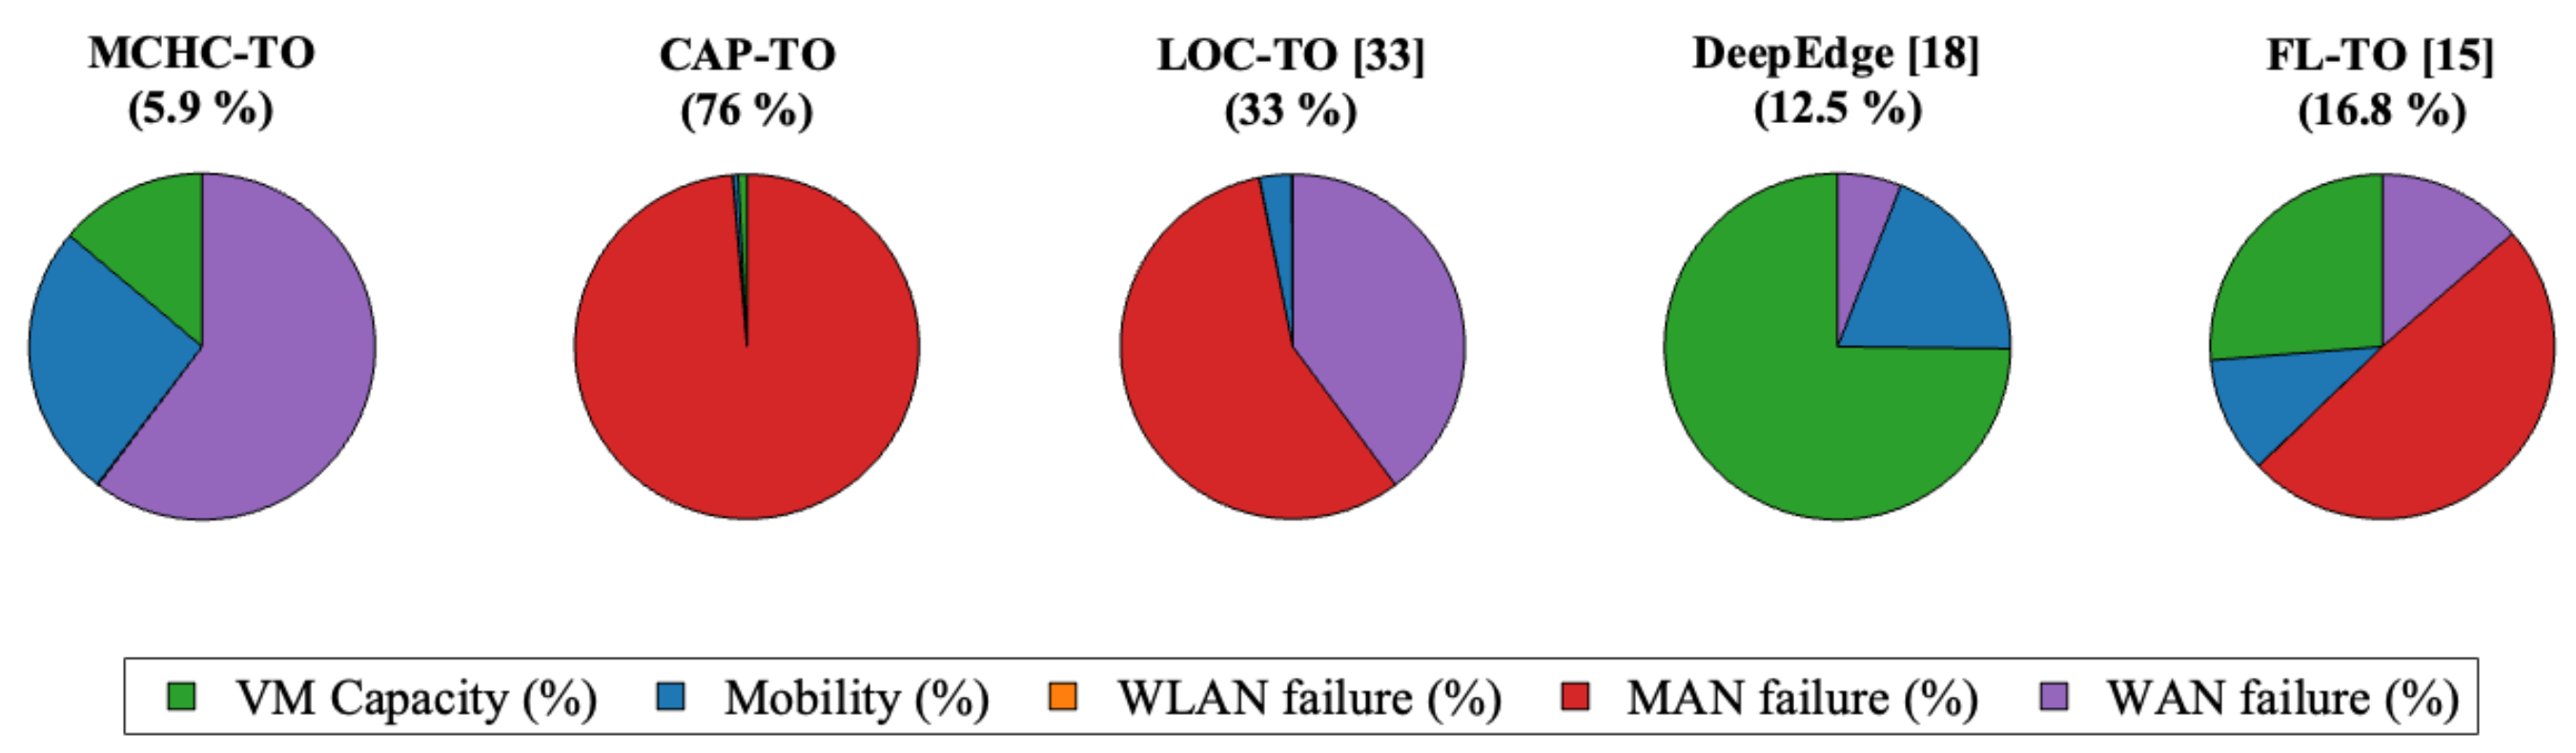
Figure 11.
Comparative evaluation of average VM utilization achieved by MCHC-TO and existing task orchestration methods under different workload levels.
Figure 11.
Comparative evaluation of average VM utilization achieved by MCHC-TO and existing task orchestration methods under different workload levels.
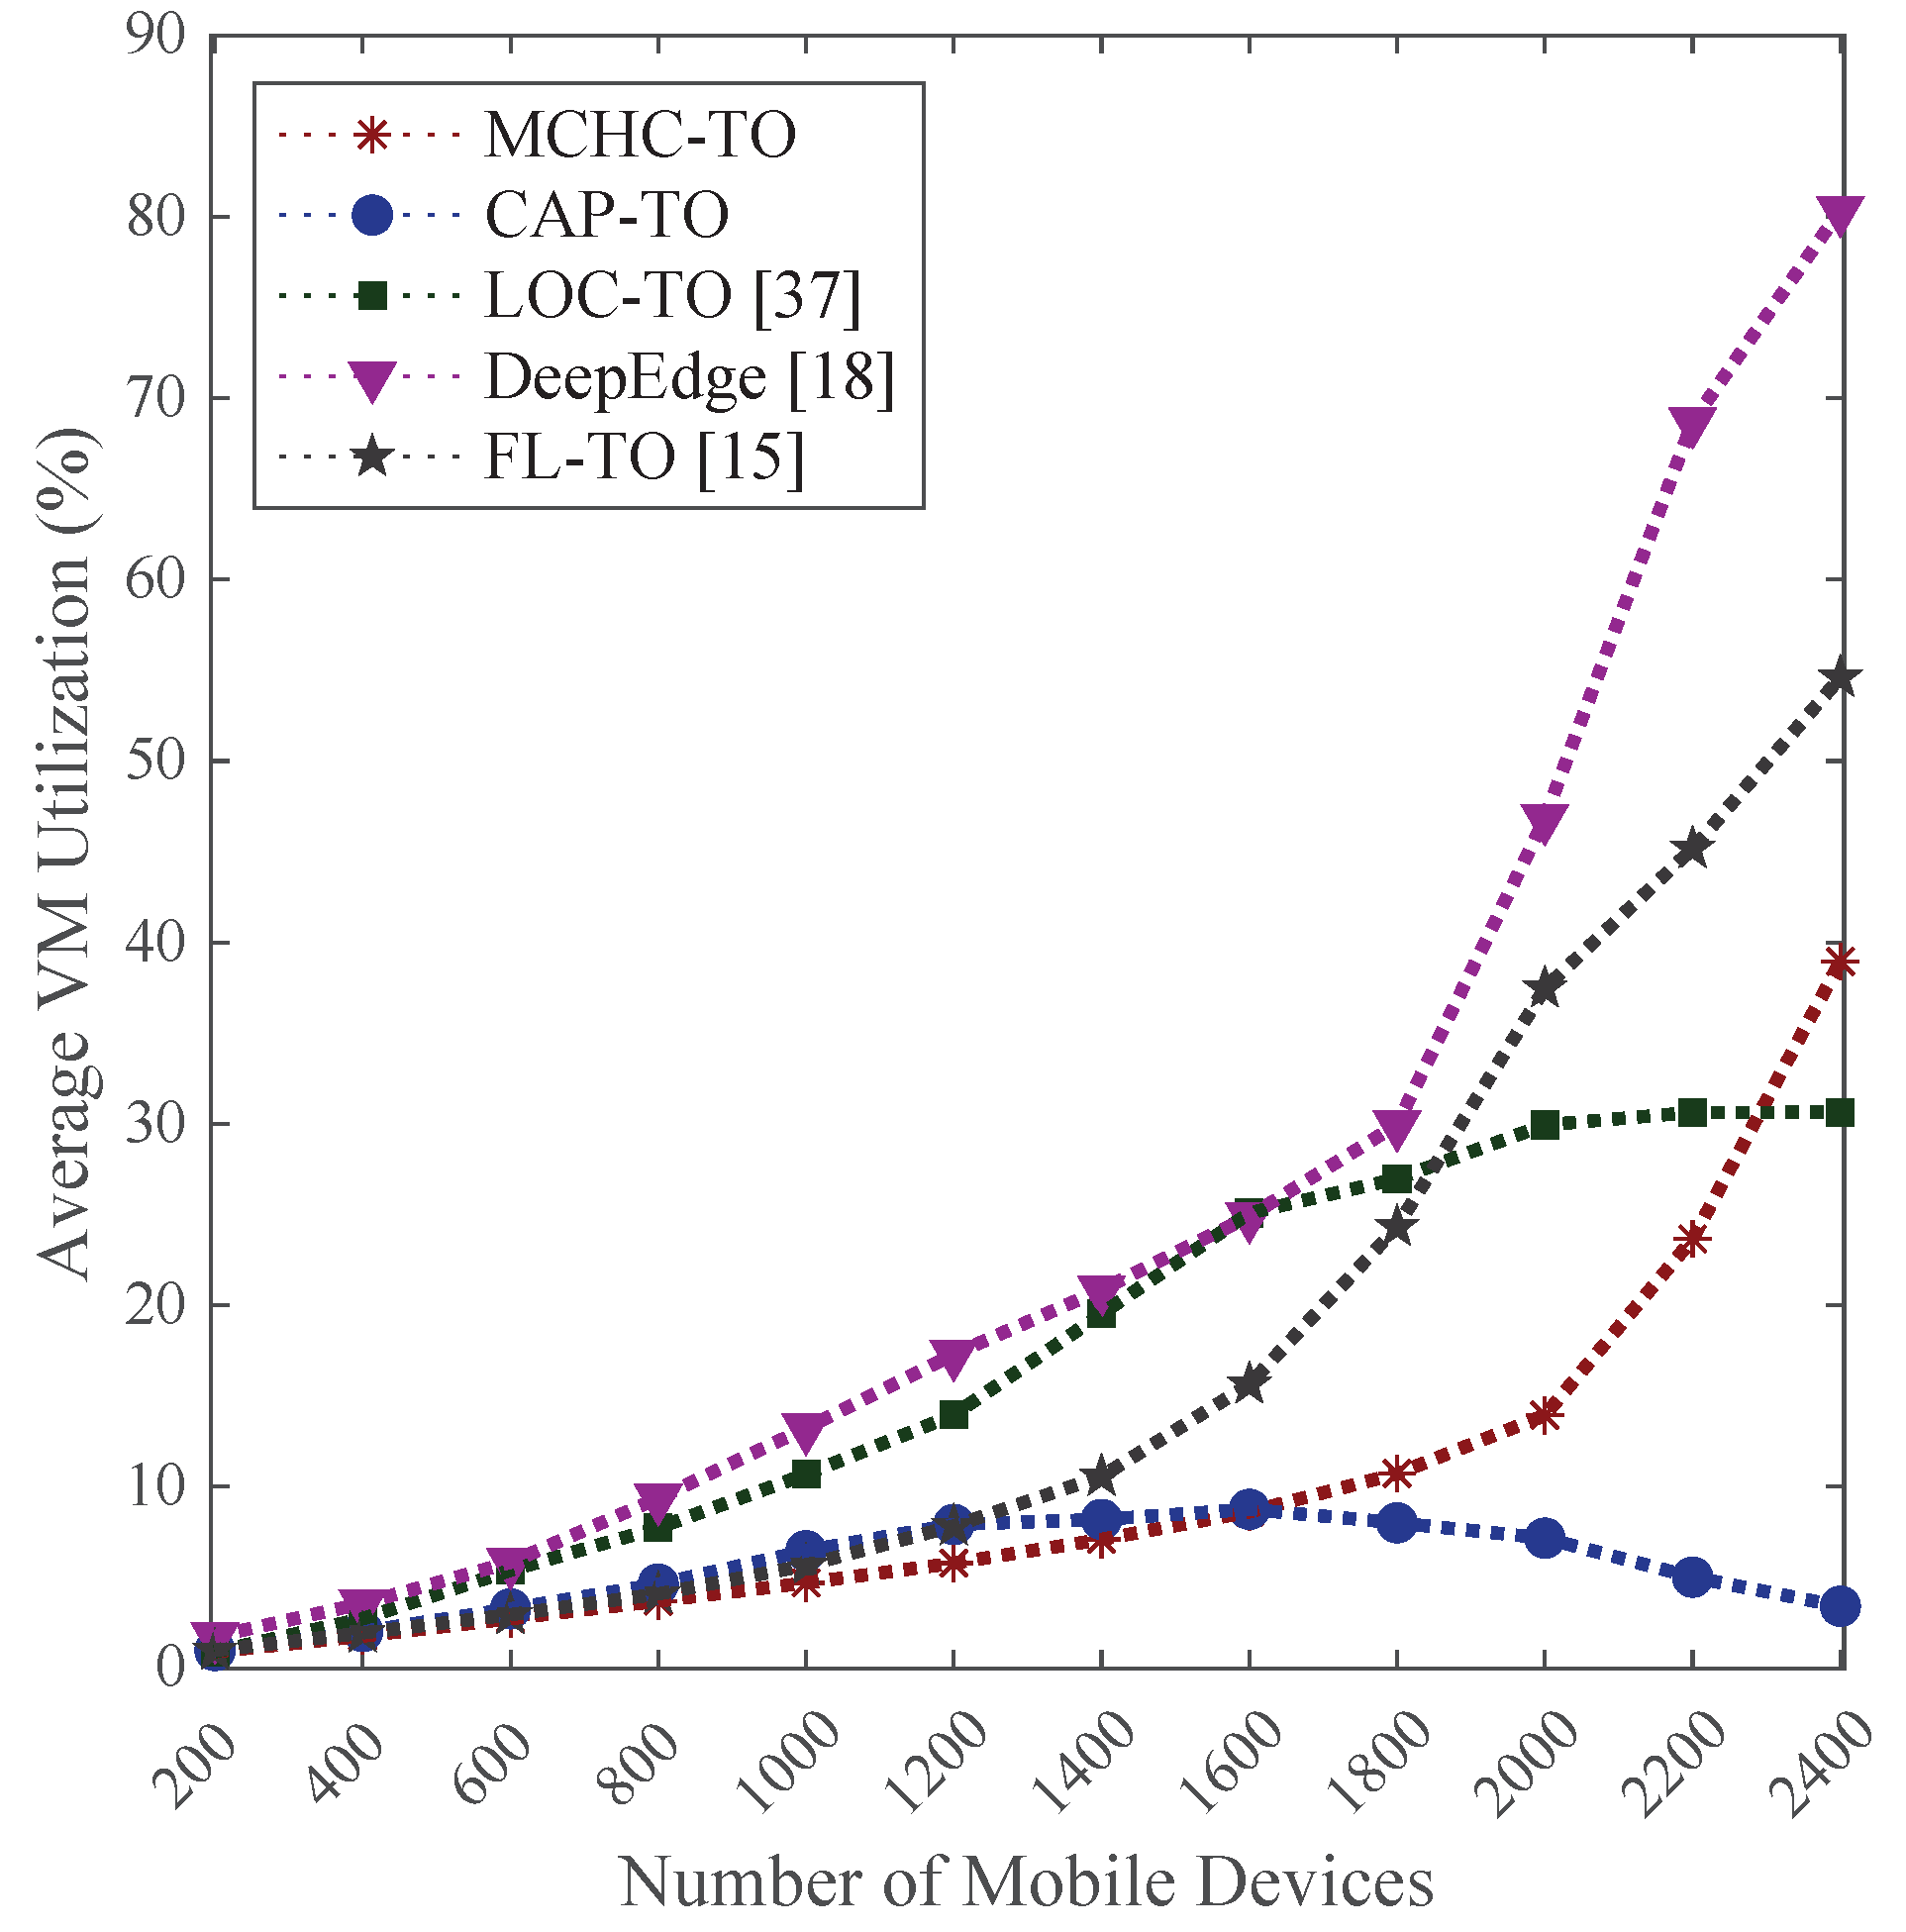
Table 2.
Notation and Symbols Used in the Proposed MCHC-TO Framework.
| Notation | Meaning |
|---|---|
| System Architecture | |
| Mobile device | |
| Edge server | |
| A | Set of edge servers |
| i-th edge server | |
| Location of edge server a | |
| Available computational capacity of edge server a | |
| Edge orchestrator | |
| Virtual machine | |
| Million Instructions Per Second | |
| Giga Instructions Per Second | |
| PROMETHEE-Based Evaluation | |
| G | Set of evaluation criteria |
| j-th evaluation criterion | |
| Evaluation of server under criterion j | |
| Weight of criterion j | |
| Standard deviation of criterion j | |
| Correlation between criteria j and k | |
| CRITIC importance of criterion j | |
| Indifference threshold | |
| Preference threshold | |
| Deviation under criterion j | |
| Preference of over | |
| Positive flow of | |
| Negative flow of | |
| Net flow of | |
| Hierarchical Clustering | |
| A | Set of candidate edge servers |
| n | Number of edge servers |
| Dissimilarity between servers and | |
| Preferred cluster () | |
| Complementary cluster () | |
| Preferred cluster at hierarchy level i | |
| Task Allocation | |
| T | Set of generated tasks |
| n-th task | |
| Task size (number of instructions) | |
| Delay sensitivity of a task | |
| Million Instructions | |
| Delay threshold | |
| Sensitivity threshold | |
Table 3.
Illustrative example of edge servers, criteria and net flows.
| Edge servers | Criterion 1 ’Capacity ’ | Criterion 2 ’Location ’ | Net flow |
|---|---|---|---|
| 0.99 | 0 | 0.28 | |
| 0.63 | 0 | -0.36 | |
| 0.89 | 1 | 0.68 | |
| 0.93 | 0 | -0.12 | |
| 0.56 | 0 | -0.52 | |
| 0.72 | 0 | 0.12 |
Table 4.
CRITIC computation results for the illustrative example.
| Metric | Capacity () | Location () |
|---|---|---|
| Standard deviation () | 0.15965 | 0.37268 |
| Correlation () | 0.28945 | |
| CRITIC importance () | 0.1134 | 0.2648 |
| CRITIC weight () | 0.2999 | 0.7001 |
Table 5.
Requirements of different tupes of applications.
| !lCCCC Characteristics | AR | HM | CI | Info |
|---|---|---|---|---|
| Usage percentage | 30 | 20 | 20 | 30 |
| Task inter-arrival (sec) | 2 | 3 | 20 | 7 |
| Task inter-arrival (sec) | 2 | 3 | 20 | 7 |
| Sensitivity to delay (sec) | 0.9 | 0.7 | 0.1 | 0.3 |
| Data size of upload (KB) | 1500 | 20 | 2500 | 25 |
| Data size of download (KB) | 25 | 1250 | 200 | 1000 |
| Task length (MI) | 9 | 3 | 45 | 15 |
| Edge/cloud VM utilization (%) | 6/0.6 | 2/0.2 | 30/3 | 10/1 |
Disclaimer/Publisher’s Note: The statements, opinions and data contained in all publications are solely those of the individual author(s) and contributor(s) and not of MDPI and/or the editor(s). MDPI and/or the editor(s) disclaim responsibility for any injury to people or property resulting from any ideas, methods, instructions or products referred to in the content. |
© 2026 by the authors. Licensee MDPI, Basel, Switzerland. This article is an open access article distributed under the terms and conditions of the Creative Commons Attribution (CC BY) license (http://creativecommons.org/licenses/by/4.0/).
Copyright: This open access article is published under a Creative Commons CC BY 4.0 license, which permit the free download, distribution, and reuse, provided that the author and preprint are cited in any reuse.


