
Submitted:
15 February 2026
Posted:
26 February 2026
You are already at the latest version
Abstract
This paper proposes an impulsive SIRQ model for the analysis of computer network resilience against malware propagation and distributed denial-of-service (DDoS) attacks. The model extends classical epidemic frameworks by combining continuous-time dynamics of malicious object spreading with discrete control actions corresponding to mass updates, node isolation, and access control policies. A qualitative analysis of the resulting system of impulsive differential equations is performed. The basic reproduction number R0 identified as a threshold parameter characterizing the intensity of attack propagation, and sufficient conditions for the global asymptotic stability of the infection-free regime are established. It is shown that, under periodic impulsive control, the infection-free state can be stabilized with respect to the target population coordinates even when R0< 1. An exponential decay estimate for the total active threat is derived, guaranteeing the asymptotic extinction of the infected and quarantined node populations. The proposed approach provides quantitative criteria for the effectiveness of impulsive cyber-defense strategies and offers a theoretical foundation for the design of adaptive multi-layer protection systems for critical information infrastructures.
Keywords:
impulsive systems
; periodic solutions
; functional stability
; nonlinear dynamics
; SIR model
; control
; stable dynamics
; adaptive strategies counter
MSC: 34A37; 93C27; 68M25; 62M20
1. Introduction
Over recent years, cyberattacks against critical infrastructure have assumed a systemic character and evolved from isolated incidents into an integral component of hybrid threats. Energy systems, transportation networks, the banking sector, communication systems, and water and heat supply facilities are increasingly becoming targets of well-organized and technically sophisticated adversaries. Of particular concern are distributed denial-of-service (DDoS) attacks [1,2], which are capable of paralyzing the operation of critically important services within minutes, causing significant economic losses and large-scale social consequences.
Unlike traditional cyberattacks, which are typically aimed at data theft or unauthorized access, DDoS attacks primarily seek to disrupt service availability [3]. For critical infrastructure facilities, this entails the risk of halting production processes, losing control over technological systems, and experiencing disruptions in the supply of electricity, water, or heat, and in some cases poses a direct threat to human life and health. Consequently, cybersecurity in this domain acquires strategic importance and is no longer viewed solely as a technical issue, but rather as a transnational security challenge [4,5].
Modern attacks on critical infrastructure are characterized by a high degree of automation, the use of botnets comprising hundreds of thousands of compromised devices, and sophisticated techniques for masquerading as legitimate traffic [2]. This significantly complicates their timely detection by conventional filtering and monitoring mechanisms. Under these conditions, mathematical models are gaining increasing importance, as they make it possible not only to describe the dynamics of attack propagation within a network, but also to forecast its evolution and to assess the effectiveness of various defense strategies [6]
At present, the modeling of malicious object propagation in computer networks is increasingly carried out using methodologies borrowed from classical epidemiological models [7]. The spread of computer viruses, botnets, or DDoS agents exhibits a pronounced structural analogy with the dynamics of biological epidemics [8], which makes compartmental approaches – particularly SIR and SIRQ models – an effective tool for analysis and forecasting [6].
In the cybersecurity context, the variables (Susceptible), (Infected), (Removed/Recovered), and (Quarantined) are interpreted as components of a network: in particular, represents bots actively attacking a server, denotes potential new bots, corresponds to blocked IP addresses, network segments, or VLANs, and refers to cleaned and patched devices. Such a representation makes it possible to estimate the rate of malicious code propagation, identify critical thresholds (analogous to the epidemiological threshold ), and forecast cyberattack development scenarios in real time [9].
However, the practical operation of a network is characterized by the presence of sudden and irregular influences that cannot be adequately captured within the framework of classical continuous models. Such influences include mass antivirus updates, forced reboots, the enforcement of isolation policies, traffic throttling, or other instantaneous mitigation measures. These effects are naturally described by so-called impulsive systems [10], which make it possible to model discrete control actions embedded within the continuous dynamics of threat propagation.
The application of impulsive approaches in SIR-type models enables the formulation of realistic cyberattack response scenarios. In particular, periodically or quasi-periodically acting impulses allow one to represent situations in which preventive or protective measures are applied irregularly but within certain constraints – for example, in the case of unscheduled updates, nonuniform security checks, or automated responses to traffic anomalies. The analysis of the existence and asymptotic stability of infection-free periodic or quasi-periodic solutions of such systems reflects the conditions under which a network can maintain functional stability [11,12] and return to a secure state after sudden impulsive perturbations. This constitutes an important component that qualitatively distinguishes the controllability of complex systems described by classical models with well-studied mathematical formalisms [13,14,15,16].
The use of such models is critically important for the development of adaptive cyberattack mitigation strategies and for forecasting their evolution [6]. They make it possible to:
- Assess network infection rates as a function of network topology and the security level of individual nodes;
- Evaluate the effectiveness of different types of impulsive control, ranging from mass updates to the isolation of individual segments;
- Develop resilience scenarios for critical infrastructure under conditions of repeated attacks;
- Model the behavior of malicious botnets and substantiate optimal intervention points;
- Forecast the consequences of large-scale DDoS campaigns in environments with varying densities of vulnerable IoT devices;
- Design multi-layered cyber defense systems based on principles of controllability and asymptotic stability.
Thus, extending epidemic models to incorporate impulsive periodic effects enhances their applied value and enables the development of realistic tools for risk forecasting and control in the field of cybersecurity. This approach combines the mathematical rigor of classical stability theory with the practical demands of modern complex telecommunication and information systems, and can be effectively employed in tasks related to planning, threat analysis, and the design of adaptive protection strategies for both epidemiological and cyber applications.
In this paper, we investigate an electronic epidemic model of a DDoS attack on target resources in a computer network. Particular attention is devoted to a detailed analysis of the stability conditions of periodic regimes in the corresponding impulsive system.
2. Motivation and Problem Statement
In the proposed model, the entire set of network nodes is divided into two populations: an attacking population and a targeted population. It is natural to assume that the primary objective of an adversary is to identify as many vulnerable nodes as possible within the attacking population and subsequently exploit them to carry out an attack against a specified targeted population. In practice, the total size of the targeted population can be assumed to be constant. Accordingly, the loss of any infected nodes as a result of a DDoS attack is considered to be compensated through their recovery, cleansing from compromise (“infection”) in a quarantine mode, and subsequent return to the class of recovered target nodes [9]. This assumption ensures the constancy of the targeted population size throughout the entire modeling process.
Vulnerable nodes operate according to a dual scheme: on the one hand, they are used to discover new nodes for the subsequent propagation of the attack, and on the other hand, they are directly involved in attacks on target resources (Figure 1). At the same time, vulnerable nodes do not enter a state of permanent recovery and, after completing the corresponding stages, return to the susceptible class.
Since attacks on critical infrastructure facilities are typically extremely intensive and destructive, the target network resources must therefore be equipped with significantly more powerful protection and response mechanisms compared to conventional information systems.
In the model presented in Figure 1, the following system of variables and parameters is employed. The symbol S denotes the class of susceptible attacking nodes, i.e., nodes of the attacking population that have not yet been involved in the attack but may be compromised. The class corresponds to infected attacking nodes that actively participate in the generation of malicious traffic and the execution of DDoS attacks.
The quantity characterizes the number of susceptible target nodes that are in a normal operational state but may be affected by an attack. The variable corresponds to infected target nodes whose functioning is disrupted as a result of a DDoS attack. The notation denotes target nodes that have been placed in a quarantine mode in order to localize the attack and carry out recovery measures. The class describes recovered target nodes that, after cleansing and technical maintenance, have returned to normal operating conditions [9].
The parameter is the infection contact rate and determines the intensity of attack propagation in the network, proportional to the product of the numbers of susceptible and infected nodes. The parameter characterizes the natural rate of removal and admission of attacking nodes in the network, corresponding to node failures due to technical reasons and the appearance of new nodes, respectively. The parameter defines the rate at which infected attacking nodes return to the susceptible class, while the parameter describes the rate of immunity loss of recovered target nodes and their subsequent transition back to the susceptible class.
The intensity of transferring infected nodes into quarantine is determined by the parameter . The parameter characterizes the rate at which quarantined nodes, after undergoing recovery procedures, return to the class of recovered target nodes.
Note that the coefficients , , , , , and are positive.
3. Impulsive SIRQ Model
Accordingly, the model can be mathematically represented by a system of differential equations of the form:
Here is
Here is Eliminating from systems (1) and (2) and we obtain
Let’s put
An important indicator characterizing the epidemic threshold is – , the value of which is determined by the ratio
Theorem 1 [9]. For any initial data , the solution of system (3) exists on the interval and satisfies for all .
If , then there exists a unique equilibrium point (infection-free) in the set ,
which is globally asymptotically stable in .
If , an avalanche-like propagation of the attack occurs. In this case, is unstable and another equilibrium point
with positive components (endemic equilibrium) emerges in , which is globally asymptotically stable in .
By modeling the processes of updating the corresponding antivirus software of the target node population as abrupt reductions in the number of vulnerable nodes at prescribed time instants, we arrive at an impulsive problem
where are the given values and moments of impulse disturbances, respectively.
We assume that the presence of the immunizing perturbation (4) can fundamentally alter the linear behavior of the solutions of system (3) described in Theorem 1.
In particular, when and under certain conditions on the sequences and , system (3), (4) admits an infection-free periodic solution that is asymptotically stable with respect to the subset of coordinates corresponding to the target nodes.
Let us consider the following problem (4):
Theorem 2. Under conditions (5), problem (3) admits a -periodic impulsive solution, which is infection-free. Moreover,
Proof of Theorem 2. Let us find as a -periodic impulse solution of the problem
System (7) is obtained from (3) for , , . For convenience, we denote , . On the interval of continuity
Therefore
where .
Next, we calculate , , etc. At the -th step, we obtain
where .
Therefore
Then the initial data for the -periodic solution is determined in the following way:
At the same time, from (8)
which means that when . Then from (7) we deduce that
for .
Hence we have (6). □
Corollary 1.
In problem (7), the-periodic solutionis asymptotically stable; that is, for any, the corresponding solutionof problem (7) satisfies:
It is easy to see that for the equilibrium position of the fourth equation of system (3) is unstable. Moreover, for
Thus, it is fundamentally impossible to achieve asymptotic stability of with respect to all coordinates. However, from the standpoint of the original model, this is not required. It is essential to achieve asymptotic stability of the infection-free impulsive solution with respect to the first three coordinates, which correspond to the state of the target node population.
Definition 1.
The solutionof problems (3), (4) is said to be asymptotically stable with respect to the variables if for anythere existssuch that
is true
Theorem 3. Suppose that in problems (5), (6) the impulsive perturbation satisfies condition (5), and let be the corresponding infection-free impulsive periodic solution. Then there existssuch that for, the solutionis asymptotically stable with respect to the variablesin the sense of Definition 1.
Proof of Theorem 3. For fixed functions , , and , consider the impulsive problem associated with the first equation of system (3).
Since , , , then
where is the solution to (7), , and therefore, according to Corollary 1 of Theorem 2
Now, with fixed , , let us consider the second and third equations of system (3)
Since system (13) is cooperative, then by Kamke’s theorem
where is the solution of the system
where satisfies (12).
Then for sufficiently large
where , if is chosen so that for
Thus,
where is some constant.
Then from (11), (12), (17) we have the desired result. □
4. Discussion
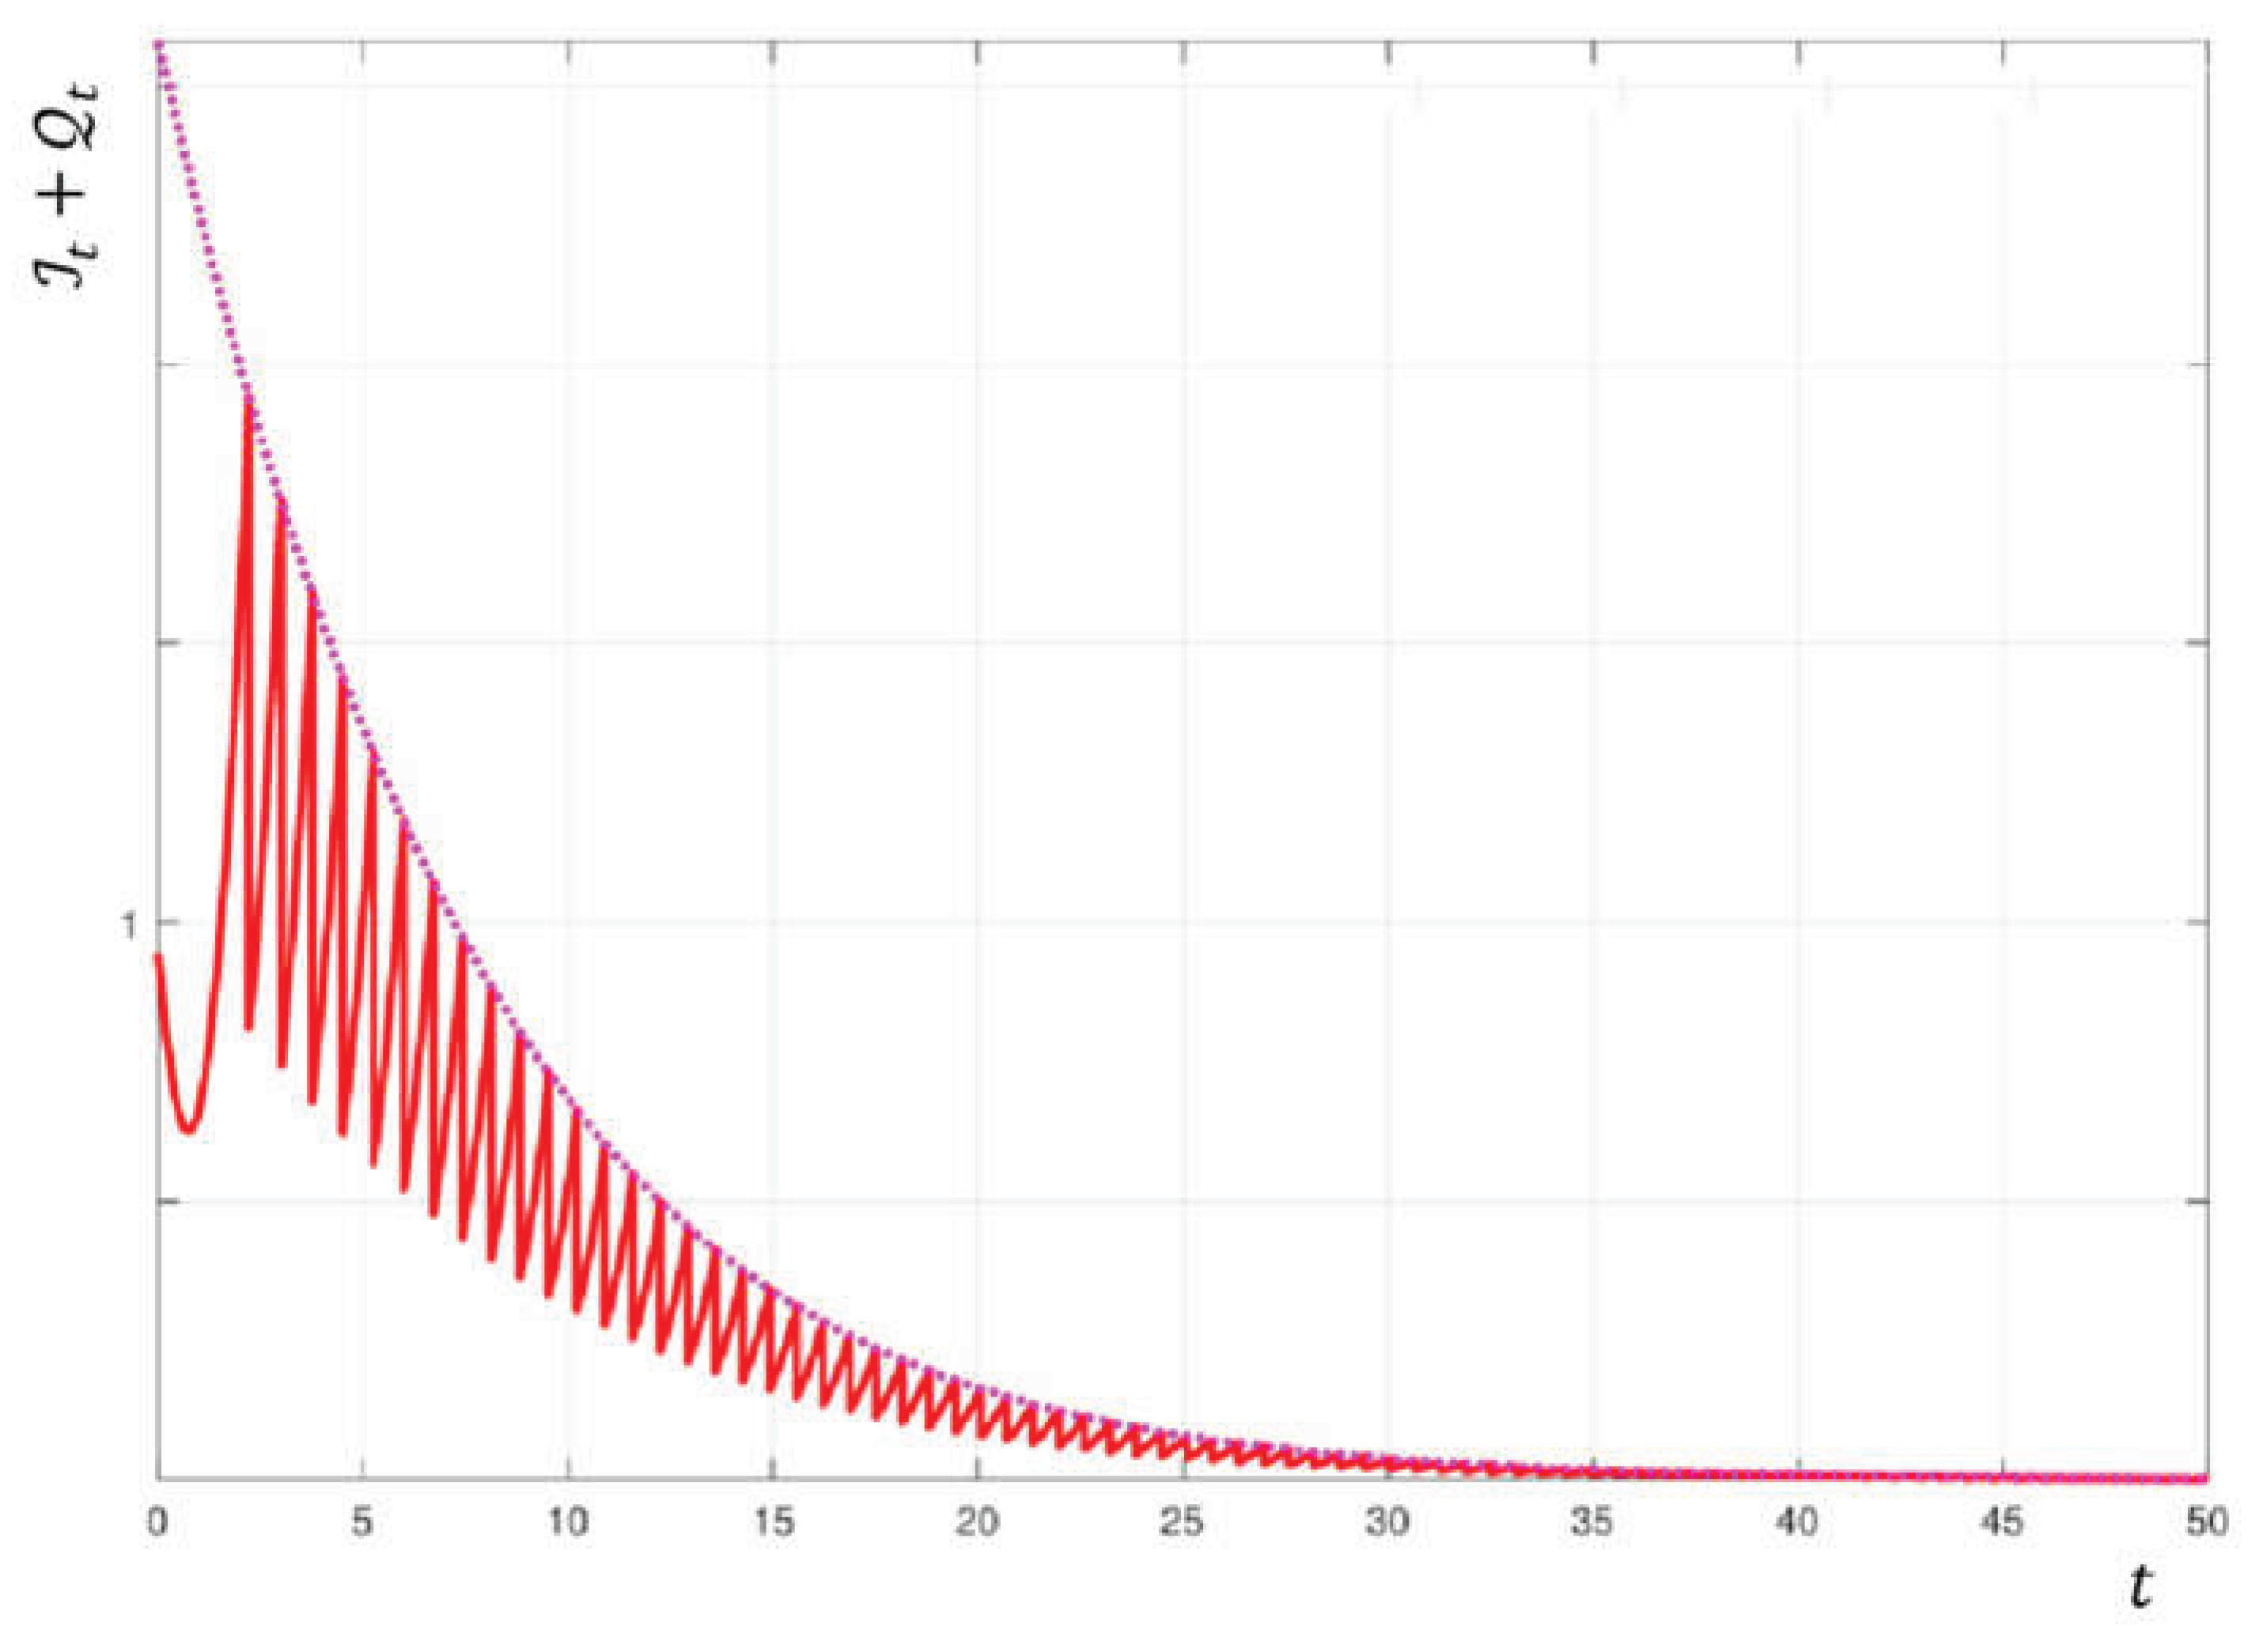
It should be noted that estimate (17) formalizes the requirement of functional resilience of an information system subjected to aggressive adversarial interference. Even for (which corresponds to a natural tendency toward avalanche-like growth of a botnet), properly organized periodic impulses (updates, blocking, and segmentation) ensure exponential reduction of the active component of the attack within the target population (Figure 2).
The left-hand side of inequality (17), , describes the total “active threat” to the target network, comprising active bots and isolated but not yet recovered nodes . The factor guarantees that, under appropriately selected impulsive control (mass updates or node isolation applied with period ), the active threat decays at an exponential rate.
The parameter reflects the “bottleneck” in the defense mechanism:
- If is small, the network is characterized by slow isolation processes (IDS/IPS/IDPS and SOC respond sluggishly);
- If is small, rapid loss of immunity is observed (outdated patches, policies, etc.).
The constant aggregates the initial conditions and the comparison inequalities (Kamke conditions); in practical terms, it represents the model’s safety margin.
In Figure 2, the red dashed line depicts the “teeth,” corresponding to the moments of impulsive intervention , when software updates or isolation measures lead to an abrupt reduction in the number of infected nodes. The pink dashed line visualizes estimate (17). It demonstrates that, provided the impulse frequency is sufficiently high (), the attack is guaranteed to decay, regardless of any attempts by adversaries to propagate it. Overall, Figure 2 shows that over time the system converges to an infection-free state (the values tend toward zero), which constitutes the objective of protection.
In this way, estimate (17) provides a quantitative guarantee of exponential suppression of the active phase of a DDoS attack in the target network under properly configured impulsive control, which directly corresponds to the engineering requirements for the resilience of critical infrastructure services. Moreover, estimate (17) establishes a necessary condition for ensuring the functional resilience of a critical infrastructure information system and for designing multi-layered defense systems for it.
5. Conclusions
This paper proposes an impulsive SIRQ model that generalizes classical epidemic approaches to the analysis of cyberattacks and consistently integrates the continuous dynamics of malware propagation in a network with discrete control actions representing mass updates, node isolation, and the enforcement of access policies. Such an approach provides an adequate mathematical description of real-world response mechanisms to large-scale viral and DDoS attacks.
The fundamental role of the basic reproduction number is established as a threshold parameter determining the attack dynamics: for , the infection-free equilibrium is globally asymptotically stable, whereas for the system admits an endemic regime with a nonzero fraction of infected nodes.
It is shown that the application of periodic impulsive control actions enables stabilization of the infection-free regime with respect to the target population even when the threshold value is exceeded. Such stabilization constitutes a practically sufficient condition for ensuring the availability of critical services and maintaining the functional resilience of network infrastructure under large-scale attacks.
The derived estimate (17) establishes exponential decay of the total active threat with rate , which admits a clear applied interpretation in terms of the isolation rate of infected nodes and the level of immunity retention in recovered systems. This estimate provides a quantitative guarantee of the effectiveness of impulsive cyber defense strategies.
The proposed model forms a theoretical foundation for the design of adaptive cybersecurity systems, the determination of optimal frequency and intensity of preventive impulses, the forecasting of the consequences of large-scale DDoS campaigns, and the development of multi-layered defense strategies for critical information infrastructure.
Author Contributions
Conceptualization, and methodology, V.Sob.; formal analysis, and writing—original draft preparation, V.Sav.; software, validation, and data curation, B.S.; supervision, and writing—review and editing, H.H. All authors have read and agreed to the published version of the manuscript.
Funding
This research was carried out under partial sub-grant of the Research Project No. 24BF038-01 «Asymptotic behavior, stability and controllability in infinite-dimensional evolutionary systems with deterministic and random perturbations».
Informed Consent Statement
Not applicable.
Data Availability Statement
The research reported in this article did not involve the use of any data.
Conflicts of Interest
The authors state that they have no financial or personal relationships that could have inappropriately affected or influenced the content of this article.
Abbreviations
The following abbreviations are used in this manuscript:
| DDoS | Distributed Denial-of-Service |
| IDPS | Intrusion Detection and Prevention System |
| IDS | Intrusion Detection System |
| IoT | Internet of Things |
| IP | Internet Protocol |
| IPS | Intrusion Prevention System |
| SIR | Susceptible (S), Infective (I), and Recovered (R) |
| SIRQ | Susceptible (S), Infective (I), Recovered (R) and Quarantined (Q) |
| SOC | Security Operations Center |
| VLAN | Virtual Local Area Network |
References
- Mishra, B.K.; Keshri, A.K.; Mallick, D.K.; Mishra, B.K. A mathematical model on DDoS attack in IoT network. Nonlinear Eng. 2019, 8, 486–495. [Google Scholar] [CrossRef]
- Sobchuk, V.; Pykhnivskyi, R.; Barabash, O. Sequential IDS for Zero-Trust Cyber Defence of IoT/IIoT Networks. Adv. Inf. Syst. 2024, 8, 92–99. [Google Scholar] [CrossRef]
- Balarezo, J.F.; Wang, S.; Chavez, K.G.; Al-Hourani, A.; Kandeepan, S. A survey on DoS/DDoS attacks mathematical modelling for traditional, SDN and virtual networks. Eng. Sci. Technol. Int. J. 2022, 31, 101065. [Google Scholar] [CrossRef]
- Yevseiev, S.; Khokhlachova, Yu.; Ostapov, S.; Laptiev, O. Models of socio-cyber-physical systems security; РС Тесhnology Сеntеr, Ukraine: Kharkiv, 2023; p. 184. [Google Scholar] [CrossRef]
- Kyrychok, R.; Laptiev, O.; Lisnevsky, R.; Kozlovsky, V.; Klobukov, V. Development of a method for checking vulnerabilities of a corporate network using bernstein transformations. East.-Eur. J. Enterp. Technol. 2022, 1(9), 93–101. [Google Scholar] [CrossRef]
- Savchenko, V.A.; Stepanchenko, B.S. Development of the concept of predicting the time of the onset of a DDoS attack based on the study of the dynamics of the behavior of evolutionary equations. Telecommun. Inf. Technol. 2024, 1, 26–44. [Google Scholar] [CrossRef]
- Rodriguez, H.S. Application of SIR Epidemiological Model: New Trends. Int. J. Appl. Math. and Inf. 2016, 10, 76–82. [Google Scholar] [CrossRef]
- Hethcote, H.W. Three Basic Epidemiological Models. In Applied Mathematical Ecology. Biomathematics; Levin, S.A., Hallam, T.G., Gross, L.J., Eds.; Springer: Berlin, Heidelberg, 1989; p. 18. [Google Scholar] [CrossRef]
- Rao, Y.S.; Kesri, A.K.; Mishra, B.K.; Panda, Z.C. Distributed denial of service attack on target resources in a computer network for critical infrastructure: a differential-equation model. Phys. Stat. Mech. Appl. 2020, 540, 123240. [Google Scholar] [CrossRef]
- Samoilenko, A.M.; Perestyuk, N.A. Impulsive Differential Equations. In World Scientific Series on Nonlinear Science Series A; World Scientific: Singapore, 1995; Volume 14, p. 472 p. [Google Scholar] [CrossRef]
- Pichkur, V.; Sobchuk, V.; Cherniy, D; Ryzhov, A. Functional Stability of Production Processes as Control Problem of Discrete Systems with Change of State Vector Dimension. Bull. Taras Shevchenko Natl. Univ. Kyiv. Phys. Math. Sci. 2024, 1, 105–110. [Google Scholar] [CrossRef]
- Barabash, O.; Sobchuk, V.; Sobchuk, A.; Musienko, A.; Laptiev, O. Algorithms for Synthesis of Functionally Stable Wireless Sensor Network. Adv. Inf. Syst. 2025, 9, 70–79. [Google Scholar] [CrossRef]
- Nosenko, T.V.; Stanzhyts’kyi, O.M. Averaging method in some problems of optimal control. Nonlinear Oscill 2008, 11, 539–547. [Google Scholar] [CrossRef]
- Lavrova, O.; Mogylova, V.; Stanzhytskyi, O.; Misiats, O. Approximation of the Optimal Control Problem on an Interval with a Family of Optimization Problems on Time Scales. Nonlinear Dyn. Syst. Theory 2017, 17, 303–314. [Google Scholar]
- Zhuk, T.; Kasimova, N.; Ryzhov, A. Application of the Averaging Method to the Optimal Control Problem of Non-Linear Differential Inclusions on the Finite Interval. Axioms 2022, 11, 653. [Google Scholar] [CrossRef]
- Kasimova, N.; Zhuk, T.; Tsyganivska, I. Approximate solution of the optimal control problem for non-linear differential inclusion on the semi-axes. Georgian Math. J. 2023, 30, 883–889. [Google Scholar] [CrossRef]
Figure 1.
Schematic representation of the model.
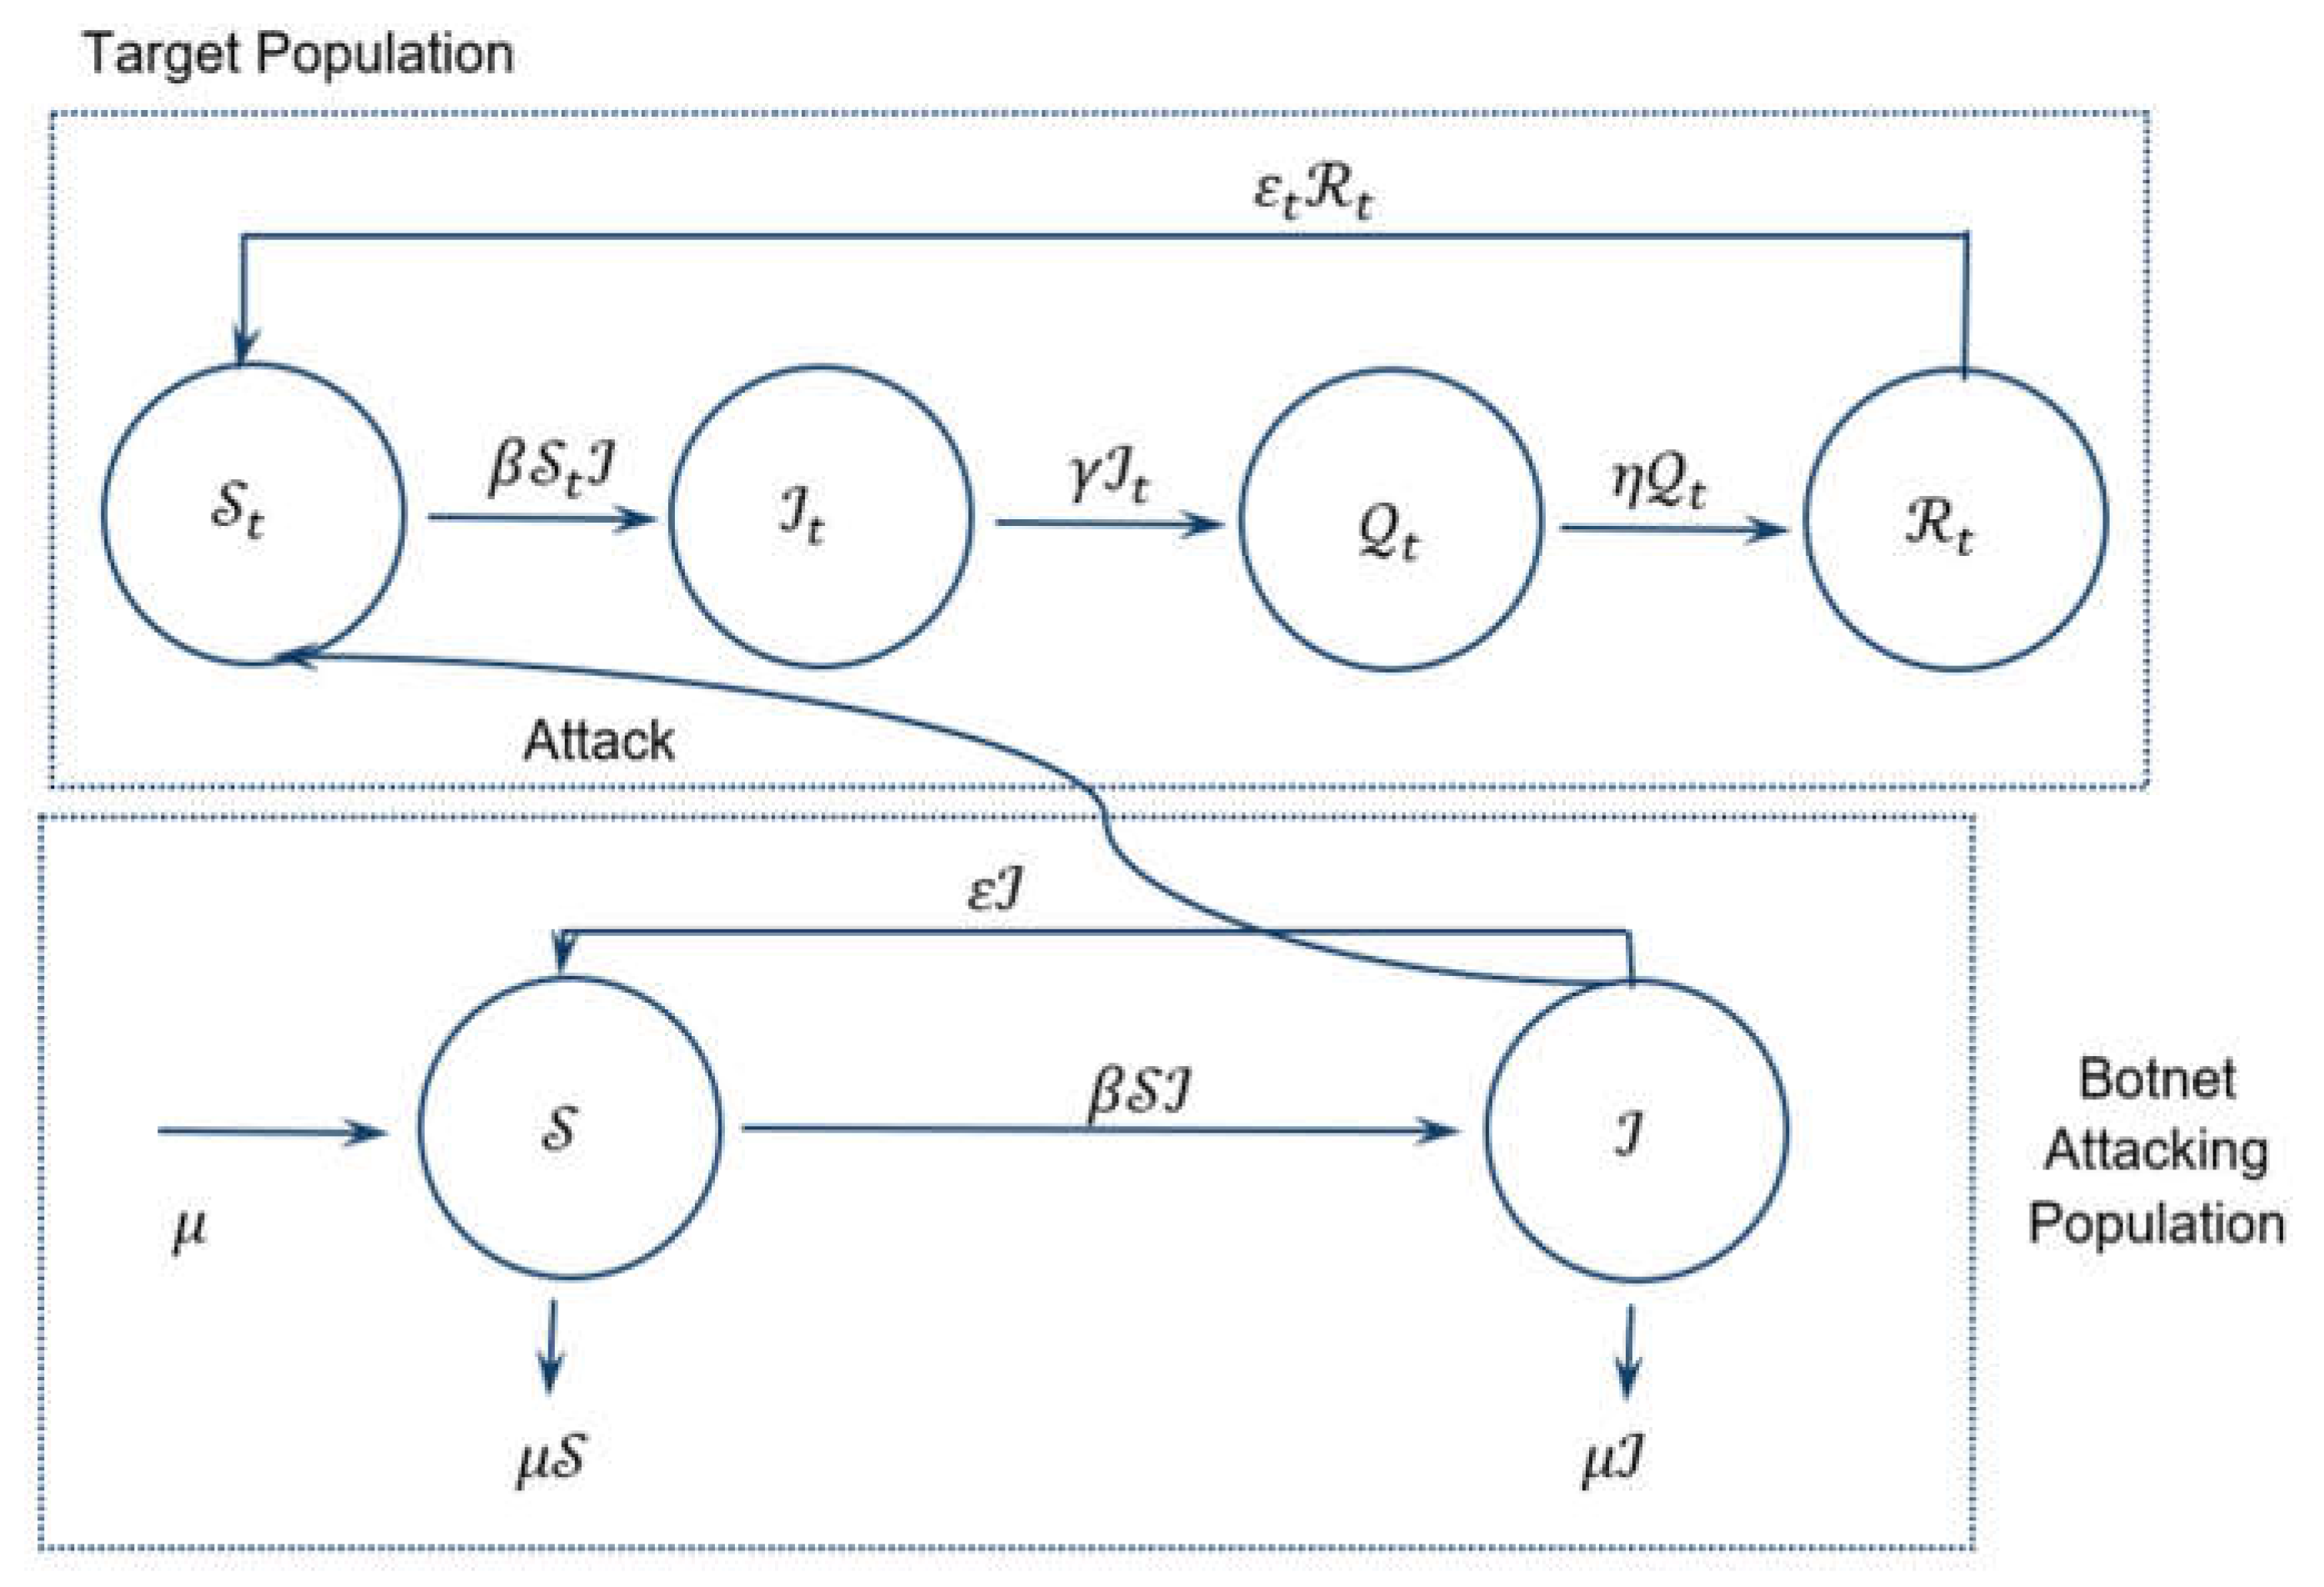
Figure 2.
Visualization of the infection free behavior of the pulsed periodic solution of (5), (6).
Disclaimer/Publisher’s Note: The statements, opinions and data contained in all publications are solely those of the individual author(s) and contributor(s) and not of MDPI and/or the editor(s). MDPI and/or the editor(s) disclaim responsibility for any injury to people or property resulting from any ideas, methods, instructions or products referred to in the content. |
© 2026 by the authors. Licensee MDPI, Basel, Switzerland. This article is an open access article distributed under the terms and conditions of the Creative Commons Attribution (CC BY) license (http://creativecommons.org/licenses/by/4.0/).
Copyright: This open access article is published under a Creative Commons CC BY 4.0 license, which permit the free download, distribution, and reuse, provided that the author and preprint are cited in any reuse.


