
Submitted:
14 February 2026
Posted:
26 February 2026
You are already at the latest version
Abstract
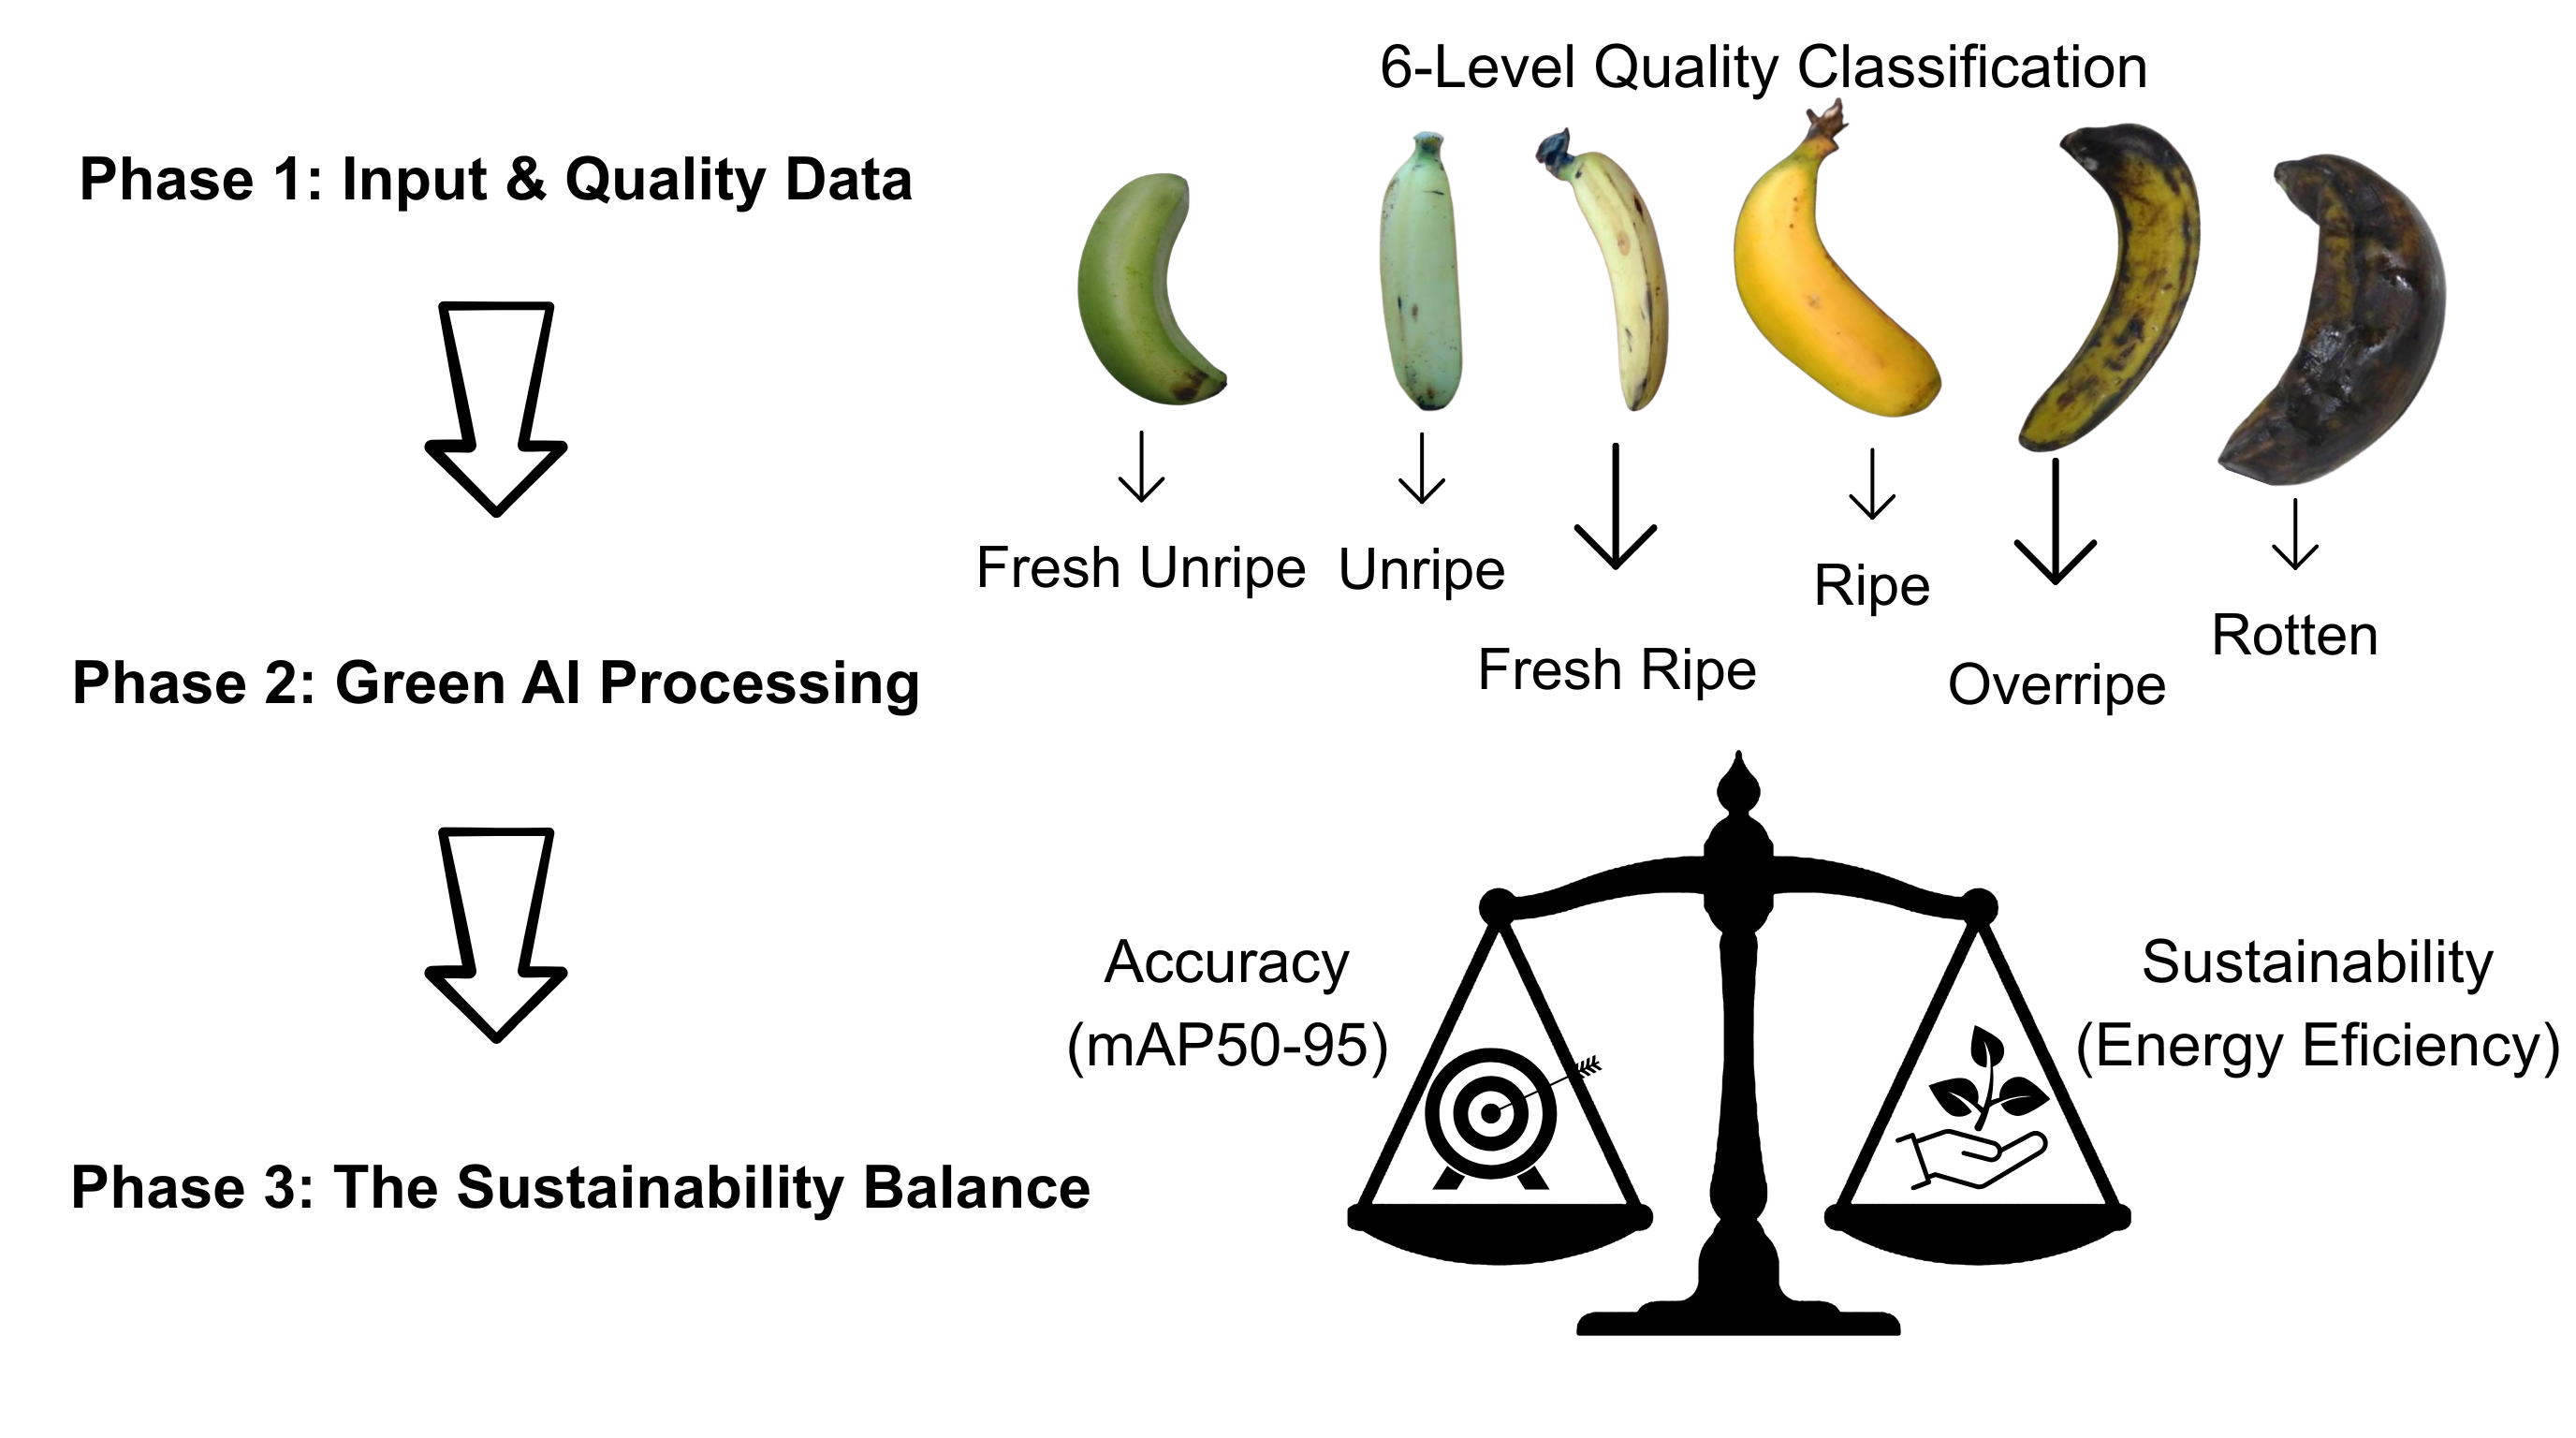
Post-harvest quality grading is critical for reducing losses in primary banana production. However, the adoption of artificial intelligence at the farm level is often constrained by limited energy and computational infrastructure. This study evaluates whether reliable banana quality grading can be achieved under such constraints by systematically com-paring lightweight object detection models. Four YOLO-based architectures were bench-marked using a curated dataset of over 11,000 annotated images across six commercial quality classes. Energy consumption and carbon emissions during model training and inference were quantified using CodeCarbon, while detection errors were diagnosed using the TIDE framework to assess practical visual grading limitations. The results reveal that legacy compact models do not inherently guarantee energy efficiency. Instead, modern lightweight architectures achieve a superior balance between spatial accuracy and energy use. Error analysis indicates that grading reliability is primarily challenged by localiza-tion errors in deteriorated fruit rather than class confusion. Ultimately, the environmental cost of model training is marginal compared to the potential reduction in post-harvest waste. These findings highlight that energy-aware model selection is essential for deploy-ing sustainable computer vision solutions in resource-constrained agricultural systems.
Keywords:
green AI
; object detection
; banana quality grading
; energy efficiency
; YOLO architectures
; sustainable agriculture
1. Introduction
Over the past decade, artificial intelligence (AI) has progressed from experimental systems to practical applications across healthcare, food industries, and agricultural supply chains [1]. Within the context of Agriculture 4.0, the integration of AI, the Internet of Things (IoT), and edge computing is enabling intelligent production systems oriented toward food security and sustainable development [2]. Bananas constitute a strategic fruit commodity for Vietnam, providing nutritional value and contributing substantially to export revenues, with an estimated export turnover of approximately USD 372 million in 2024 [3]. However, current manual grading practices often result in substantial inconsistency, thereby increasing post-harvest losses. Modern computer-vision models such as YOLO, Faster R-CNN and DETR have demonstrated strong capability in addressing these limitations [4,5]. Recent research trends further emphasize lightweight architectures designed for deployment devices [6,7] and hardware-aware compression techniques [8]. Beyond overall grading accuracy, understanding the nature of detection errors is essential in post-harvest systems, where fruit deformation, surface defects, and class ambiguity can directly affect grading reliability.
Despite this progress, most existing studies continue to prioritize accuracy or speed without adequately quantifying energy cost and emissions core dimensions of “Green AI” [9]. A largely untested paradox remains: do so-called “tiny” legacy models actually consume less energy than more advanced anchor-free architectures? The absence of empirical evaluation of real electricity consumption (kWh) introduces deployment risks, particularly when models are intended for resource-constrained edge platforms. This challenge is increasingly relevant as Vietnam has committed to agricultural emission reductions and participation in the Global Methane Pledge [10]. With post-harvest losses estimated at 20–25%, each kilogram of wasted bananas may generate approximately 0.5–1.1 kg CO2 [11] or around 0.8 kg CO2 according to recent life-cycle assessments [12]. Consequently, an AI-based grading system must not only achieve high classification accuracy but also maintain a low carbon footprint, ensuring a positive net environmental balance.
Building on this context, the present study conducts a comprehensive assessment of accuracy energy trade-offs among lightweight YOLO models (v3-tiny, v5n, v8n, v11n) for six-level banana quality classification. An extended Cost–Benefit Analysis (CBA) framework is applied to compare technical performance alongside life-cycle emissions. The objective is to identify the model achieving the optimal equilibrium point, thereby illustrating the transition toward “Green AI” in modern architectures and supporting Vietnam’s Net-Zero roadmap and sustainable agricultural development strategies [13].
2. Materials and Methods
2.1. Data, Sampling Strategy, Hardware, and Model Architectures
The dataset consists of banana images manually annotated into six quality categories: fresh ripe, fresh unripe, ripe, overripe, unripe, and rotten. The data were intentionally partitioned to ensure balance and prevent information leakage across splits: training (9,592 images), validation (816 images), and an independent test set (414 images). The independent test split enables an objective assessment of model generalization. The models evaluated include YOLOv3-tiny, YOLOv5n, YOLOv8n, and YOLO11n all lightweight variants designed for deployment on constrained devices while maintaining acceptable accuracy levels. All models were trained using the Ultralytics YOLO framework, which integrates standardized pipelines for training, inference, and evaluation, thereby reducing implementation bias [14].
Experiments were conducted under a consistent hardware configuration: Intel Core i5-12450HX (12 cores), NVIDIA GeForce RTX 3050 (6 GB), ~20 GB RAM, Windows 11, and Python 3.11.9. Maintaining a fixed configuration ensures fairness in cross-model comparison.
2.2. Training Procedure
The training process was designed to balance speed and accuracy, following optimization recommendations from YOLOv4 [15]. Core hyperparameters included: 50 epochs, batch size 16, image resolution 640×640, SGD optimizer (learning rate = 0.01), cosine decay for learning-rate scheduling, momentum 0.937, and early stopping (patience = 10).The pipeline comprised: (i) loading pretrained weights; (ii) training on the training set; (iii) monitoring performance on the validation set; (iv) saving the best.pt checkpoint based on peak mAP; (v) logging metrics into result.csv. To enhance reproducibility, the random seed was fixed and computational settings were kept stable across runs.
2.3. Energy and Emission Tracker
Alongside performance evaluation, energy consumption and emissions were tracked using CodeCarbon, which records hardware power draw, execution time, and region-specific emission factors [16,17].
Energy consumption was estimated as:
where:
Estimated CO2-equivalent emissions were computed as:
Where denotes the carbon intensity of the grid (kgCO2e/kWh), and ≈1 for personal computing environments. All measurements were stored in emissions.csv, enabling comparison of models from a Green-AI perspective.
2.4. Model Evaluation
While standard detection metrics were employed for quantitative evaluation, greater emphasis was placed on system-level relevance for post-harvest grading under energy and infrastructure constraints. To ensure robustness and reproducibility, each model was trained and evaluated across five independent runs using different random initializations, and performance results were reported as mean values with associated variability. This approach reduces the influence of stochastic effects and supports reliable comparison between architectures.
Detection errors were further examined using the TIDE toolkit, which decomposes performance degradation into interpretable error categories, including localization, classification, background, duplicate, and missing detections, as well as false positives and false negatives. By aggregating error patterns across repeated runs, this analysis identifies consistent sources of grading unreliability and provides practical guidance for improving post-harvest quality assessment systems [18].
3. Results
3.1. Comparing the Results of the Training Process
The training processes of the four models (YOLOv3-tiny, YOLOv5n, YOLOv8n, and YOLO11n) were evaluated across three dimensions: (i) convergence behavior (loss dynamics), (ii) recognition performance (mAP), and (iii) energy consumption. Experimental data extracted from result.csv and emissions.csv reveal pronounced performance differentiation, reflecting the paradigm shift from anchor-based to anchor-free network design.
The loss curves indicate that YOLOv3-tiny exhibits substantial oscillations and the slowest convergence rate, particularly in box_loss. This observation is consistent with the discussion by Redmon and Farhadi (2018) [19], who highlight inherent limitations of anchor-based mechanisms, where the model must continuously refine pre-defined anchor templates. Such structural rigidity constrains the network when dealing with objects characterized by curved geometry and irregular deformation, such as bananas. In contrast, YOLOv8n and YOLO11n demonstrate faster and more stable convergence. This improvement is attributed to the adoption of anchor-free detection and the incorporation of a decoupled detection head, which separates classification and localization objectives, thereby mitigating optimization conflicts [20]. Superior mAP50–95 scores relative to YOLOv3-tiny further indicate the benefits of backbone refinements. In YOLOv5n, CSPNet alleviates gradient redundancy and enhances learning efficiency [21], whereas in YOLOv8n, C2f blocks inspired by ELAN facilitate more effective gradient flow control [22]. Moreover, YOLO11n leverages Spatial Attention (C2PSA), analogous to CBAM [23], enabling the model to emphasize defect regions while suppressing background noise. Across repeated training runs, modern lightweight architectures exhibited lower performance variability compared with legacy compact models. Lower variability across repeated training runs indicates reproducible model behavior, which is essential for maintaining consistent grading performance in post-harvest handling environments.
A quantitative analysis of convergence dynamics, defined as the epoch required to reach 95% of peak performance, further substantiates these architectural advantages. YOLOv8n demonstrates the most rapid feature assimilation, stabilizing its mAP50 metric at epoch 19, which is approximately 17% faster than the legacy YOLOv3-tiny (epoch 23). This acceleration indicates that the anchor-free head and Task-Aligned Assigner significantly reduce the search space for the optimizer [14,22]. Furthermore, regarding localization precision (box_loss), YOLO11n exhibits superior optimization efficiency by converging at epoch 31, outperforming YOLOv8n (epoch 34) and significantly surpassing YOLOv5n (epoch 41). This finding suggests that the integration of spatial attention mechanisms (C2PSA) allows the network to ‘lock on’ to object boundaries more effectively, thereby reducing the computational budget required to reach optimal performance [16,24].
Energy monitoring results highlight an additional contrast. Despite being labeled “tiny,” YOLOv3-tiny records the highest energy consumption and CO2 emissions due to reliance on standard convolutions with a relatively large parameter count but low representational efficiency an example of “Red AI” inefficiency [24]. Conversely, YOLOv8n and YOLO11n achieve lower consumption by reducing FLOPs through architectural optimization, aligning with deployment requirements on energy-constrained edge devices in smart agriculture [16].
Figure 1.
Comparison of YOLO Models Training Metrics.
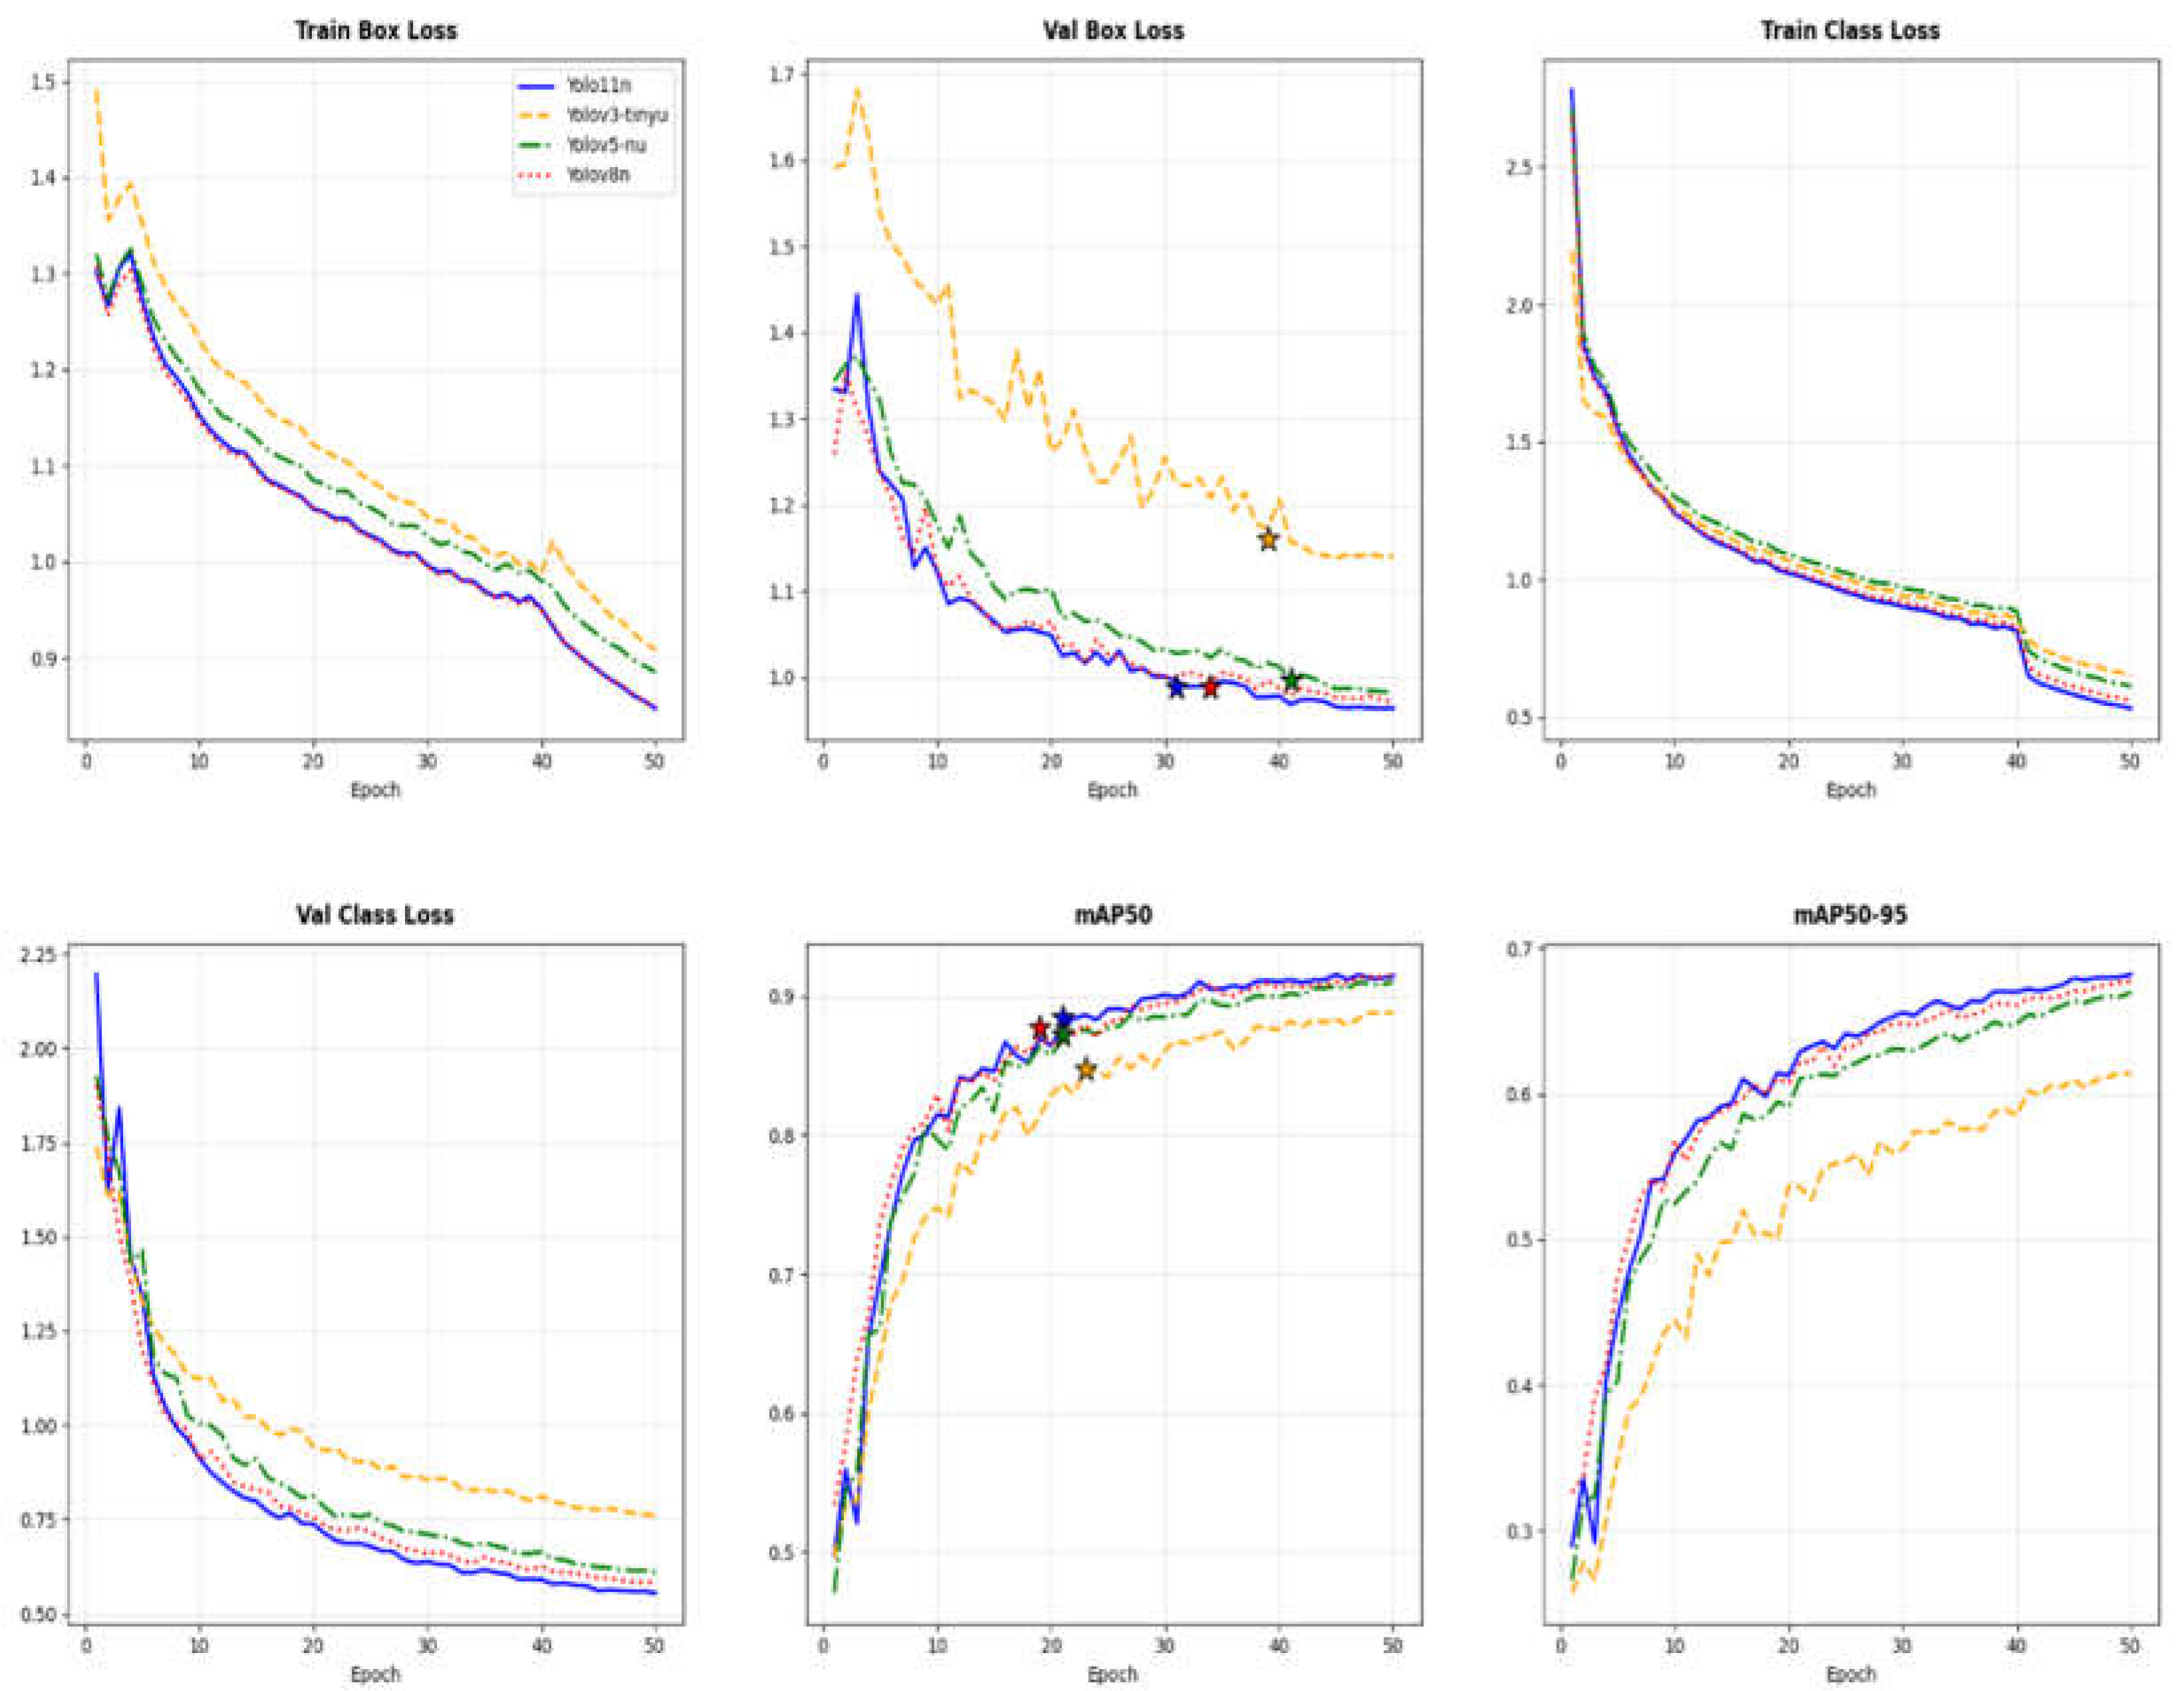

Table 1.
Resource Consumption & Emissions Comparison (CodeCarbon).
| Model | Yolo11n | Yolov3-tinyu | Yolov5nu | Yolov8n |
| Energy Consumption (kWh) | 0.1820±0.0006b | 0.2036±0.0005a | 0.1723±0.0001c | 0.1711±0.0001d |
| CO2 Emission (Kg) | 0.0865±0.0003b | 0.0968±0.0002a | 0.0819±0.0001c | 0.0814±0.0000d |
Data are presented as Mean ± SD. Different letters (e.g., a, b, c) indicate statistically significant differences (p < 0.05).
From an agricultural systems perspective, the reduced performance variability across repeated training runs supports the robustness of lightweight models for routine post-harvest operations, where stable grading behavior is often prioritized over marginal accuracy gains. Overall, the superior performance of YOLOv8n and YOLO11n is primarily attributable to: (i) removal of anchor constraints [19,20], (ii) improved gradient utilization via CSPNet/ELAN [21,22], and (iii) enhanced representational capacity through attention mechanisms [23]. While YOLOv3-tiny shows clear limitations in accuracy and performance variability, YOLOv8n emerges as a balanced option for scenarios requiring sustainable deployment. Specifically, the lower variability across training runs indicates reproducible model behavior, which is critical for consistent grading performance in post-harvest environments. Furthermore, the observed stable convergence behavior suggests that the model can be trained reliably without extensive hyperparameter tuning, supporting deployment in resource-limited agricultural settings
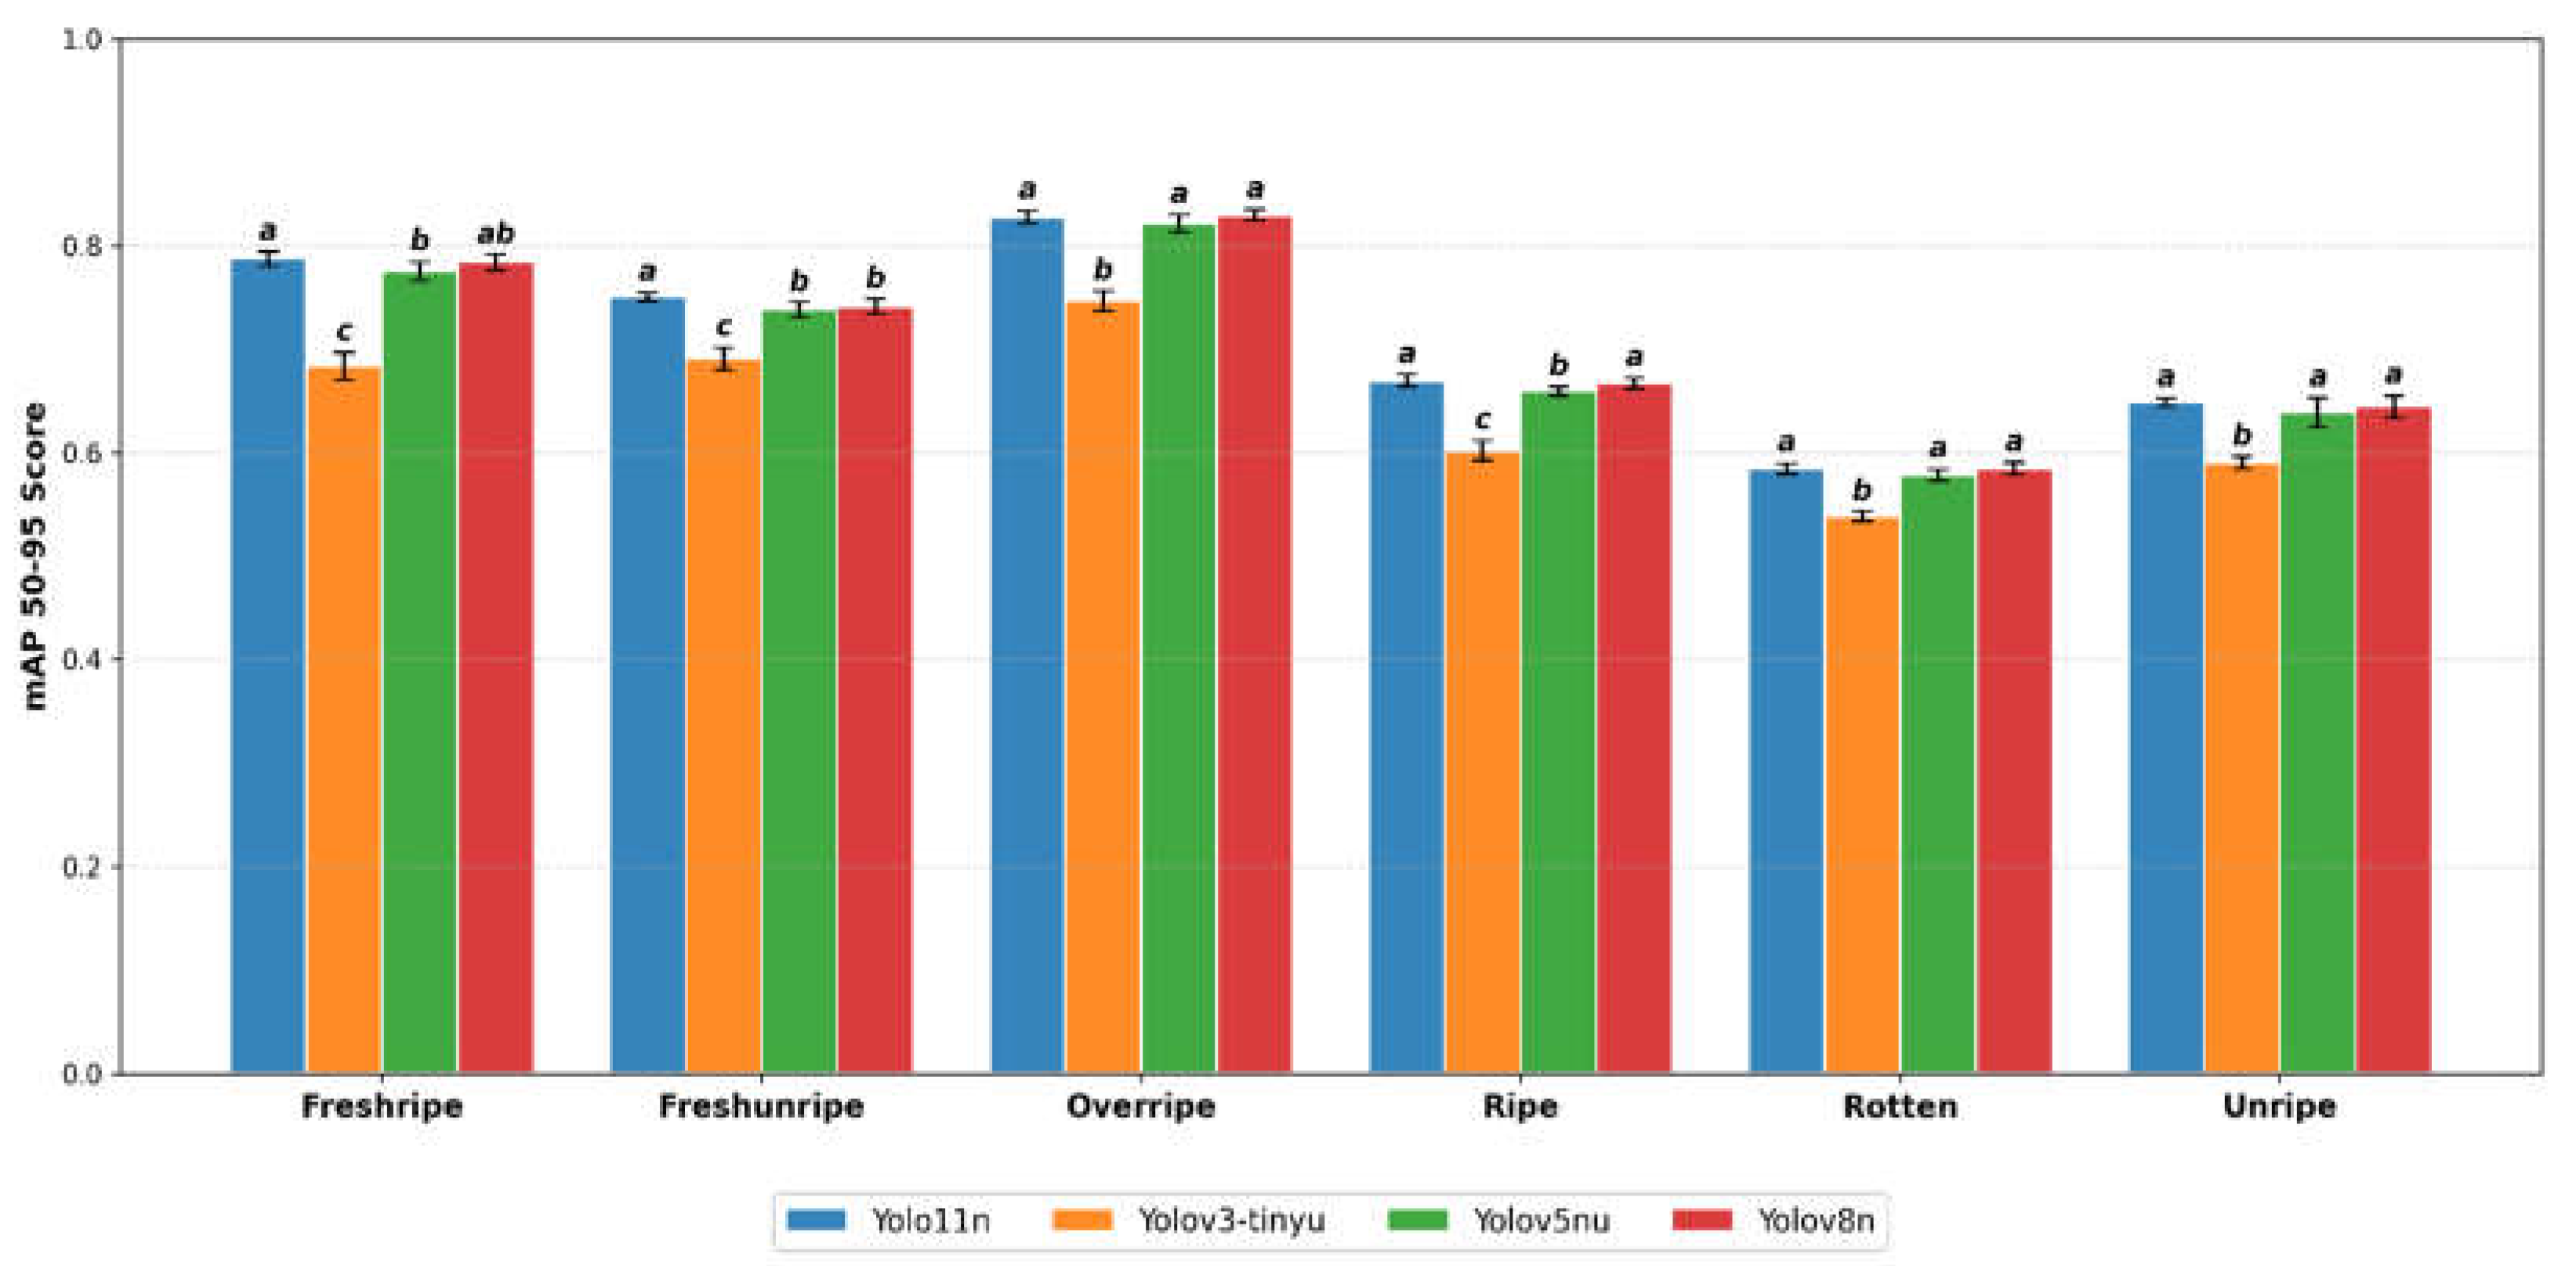
Figure 2.
Detection Performance per Banana Class (mAP 50-95). Data are presented as Mean ± SD. Different letters (e.g., a, b, c) indicate statistically significant differences (p < 0.05).
Figure 2.
Detection Performance per Banana Class (mAP 50-95). Data are presented as Mean ± SD. Different letters (e.g., a, b, c) indicate statistically significant differences (p < 0.05).
3.2. Accuracy Comparison and Error Analysis
Experiments were conducted on a NVIDIA GeForce RTX 3050, evaluating both detection accuracy and computational efficiency. As shown in Table 2, YOLO11n achieves the highest precision with an mAP50 of 0.9483 ± 0.0031. However, substantial divergence appears when examining mAP50–95. While visually salient categories (overripe, freshripe) achieve mAP50 > 0.948, the rotten class deteriorates sharply at mAP50–95 (0.5841 ± 0.0051), indicating a specific weakness in detecting decay with high precision.
This performance divergence is explained by error decomposition (TIDE, Table 3) and architectural constraints:
- Biological & Geometric Factors: Three primary factors drive the performance drop in the rotten class. First, high inter-class similarity between late-ripening and decay stages leads to fine-grained decision boundaries that are difficult to separate [25]. Second, large intra-class variability limits generalization capacity [26]. Third, heavily damaged fruit exhibit non-rigid geometric deformation that conventional convolutional networks struggle to model [27].
- Localization Error: TIDE analysis reveals that localization dominates mAP loss across all models. This reflects the geometric mismatch between axis-aligned bounding boxes and the intrinsically curved geometry of bananas [28].
- Architectural Evolution: Classification errors differ sharply across generations. YOLOv3-tiny exhibits substantially higher classification error (dAP_cls = 2.1420 ± 0.2691), attributable to its anchor-based design and shallow depth [19]. In contrast, newer Nano variants benefit from anchor-free decoupled heads that mitigate optimization conflicts [20]. Furthermore, the reliance on LeakyReLU and absence of attention mechanisms in older models bias them toward local textures, increasing false detections in cluttered contexts [29].
- Training Dynamics: YOLOv3-tiny converges rapidly but saturates prematurely, consistent with representational limits in shallow networks [30]. Conversely, modern models (e.g., YOLOv8n) show high false-positive rates combined with exceptionally low miss rates (0.0497 ± 0.1110), indicating recall-oriented optimization driven by modern loss functions [31,32].
From a post-harvest operational perspective, these metrics dictate system viability. The high throughput and stable convergence of YOLOv8n and YOLO11n support real-time grading on high-speed conveyor belts. However, the prevalence of localization errors exacerbated by the curved geometry of the fruit suggests challenges for robotic grasping mechanisms, which require precise coordinate estimation to avoid mechanical damage. Additionally, the specific difficulty in separating decay stages implies that strictly “quality control” lines may require stricter confidence thresholds or multi-modal sensing to prevent spoiled fruit from entering the supply chain.
3.3. Comparison Between YOLOv8n and YOLO11n
Extending the analysis to computational resources reveals a phenomenon that may be described as a “Parameter Efficiency Paradox.” Inspection of the relationship between parameter count and processing speed (FPS) (Figure 3) shows that, despite its substantially larger capacity (12.14M parameters), YOLOv3-tiny performs disproportionately poorly in accuracy (0.6418 ± 0.0044 mAP95) compared to modern Nano models (≈2.5–3.0M parameters), even though it maintains competitive throughput (140.82 ± 2.15 FPS). This representational inefficiency stems from its reliance on standard convolutions, which introduce dense and largely redundant connections between input and output channels. As reported by Denil et al. (2013) [33], a considerable portion of such parameters contributes little to meaningful feature learning.
In contrast, the superior performance-to-size ratio of YOLOv8n (3.01M parameters, 138.87 ± 4.57 FPS) and YOLO11n arises from architectural refinements, including depthwise separable convolutions and bottleneck-based modules (C2f, C3k2). These techniques enable effective model compression by substantially reducing redundant parameters while preserving representational capacity. Furthermore, the incorporation of CSPNet improves gradient flow and parameter utilization efficiency [34]. From a post-harvest systems perspective, this improved parameter efficiency enables reliable real-time grading without reliance on high-capacity hardware, supporting deployment in decentralized agricultural environments where computational resources are constrained. Such efficiency is particularly relevant for primary production systems, where stable processing speed is often prioritized over marginal gains in model complexity. Furthermore, the incorporation of CSPNet optimizes gradient flow, mitigates signal degradation, and maximizes parameter utilization efficiency [22].
From an energy perspective, this architectural shift illustrates the contrast between “Red AI” and “Green AI.” Experimental results indicate that YOLOv3-tiny yields the highest energy consumption (0.2036 ± 0.0005 kWh per training cycle), exemplifying resource-intensive computation [24]. Conversely, YOLOv8n and YOLO11n reduce consumption to 0.1711 ± 0.0001 kWh, corresponding to an energy saving of approximately 16%.
These advancements have practical implications beyond laboratory settings. In smart agriculture scenarios, banana classification systems are frequently deployed on edge devices such as drones or harvesting robots, where battery capacity is limited. Employing lightweight, energy-efficient architectures such as YOLOv8n not only lowers carbon emissions [35] but also prolongs device operation time, reduces thermal load, and enhances reliability under harsh field conditions.
3.4. Overall Comparison of the Four Models
The experimental results on the banana dataset indicate a clear evolutionary trajectory across YOLO generations. Contrary to the common assumption that legacy “tiny” models offer the best efficiency, our findings demonstrate that modern architectures (YOLOv8n, YOLO11n) achieve superior performance in terms of accuracy, resource efficiency, and environmental impact.
YOLO11n achieved the highest detection accuracy (mAP50–95 = 0.7112 ± 0.0028), maintaining a compact parameter count (2.59M). However, this precision comes with a trade-off in speed (100.65 ± 3.22 FPS). YOLOv8n emerged as the most balanced candidate for sustainable agriculture, providing an optimal compromise: it rivals the legacy YOLOv3-tiny in speed (138.87 ± 4.57 FPS vs. 140.82 ± 2.15 FPS) but consumes significantly less energy. Specifically, YOLOv8n recorded the lowest energy consumption (0.1711 ± 0.0001 kWh) and CO2 emissions (0.0814 ± 0.0000 kg).
Notably, YOLOv3-tiny, despite its “tiny” designation, exhibits the largest number of parameters (12.14M) and the highest energy consumption (0.2036 ± 0.0005 kWh) while delivering the lowest accuracy (0.6418 ± 0.0044). This reflects the structural constraints of legacy anchor-based architectures compared to the optimized anchor-free mechanisms and C2f/C3k2 blocks found in newer iterations [14,36].
Table 4.
Multi-dimensional sustainability assessment of the proposed AI solution for post-harvest banana management.
Table 4.
Multi-dimensional sustainability assessment of the proposed AI solution for post-harvest banana management.
| Factor | Cost / Negative Impact | Benefit / Positive Impact | Supporting Evidence |
| Environmental | (Etraining + Einterference): Carbon emissions generated during AI model training. (Training YOLOv8n/11n emits approx. ~ 0.081–0.086 CO2e). | (Eavoided): Emissions avoided through reduced waste. 1 kg of spoiled bananas generates ≈ 0.5–1.1 kg CO2e via production and decomposition [11]. | Preventing the waste of a single kilogram of bananas is sufficient to offset the entire training emissions of one modern YOLO model [10]. |
| Economic | Hardware costs (Jetson Nano / Raspberry Pi) and operational electricity costs. | Agricultural value preserved. Vietnam’s banana exports reached ~USD 372 million in 2024 [3]. A 1% reduction in post-harvest loss can save millions of USD. | Current post-harvest losses in Vietnam are 20–25%, indicating substantial potential for financial recovery [10]. |
| Social | Requirement for digital-skill training for farmers (initial adoption barrier). | Enhances agricultural value, increases farmer income, and aligns with the National Digital Transformation Program (Decision 749/QĐ-TTg) [37,38]. | Supports sustainable rural economic development and modernization targets. |
Overall, AI-enabled detection systems contribute not only to productivity gains but also to greenhouse-gas mitigation. The analysis confirms that YOLOv8n offers the most “Green AI” compliant solution, balancing high throughput with minimal carbon footprint, while YOLO11n remains the superior choice for precision-critical applications. Crucially, the observed training behavior challenges the assumption that higher model complexity inherently leads to more reliable post-harvest grading outcomes.
Table 5.
Summary of statistical benchmark results comparing detection performance, computational efficiency, and environmental impact across YOLO architectures.
Table 5.
Summary of statistical benchmark results comparing detection performance, computational efficiency, and environmental impact across YOLO architectures.
| Model | mAP50-95 | Prameters (M) | FPS | Energy (kWh) |
| Yolo11n | 0.7112±0.0028a | 2.59 | 100.65±3.22c | 0.1820±0.0006b |
| Yolov8n | 0.7084±0.0021a | 3.01 | 138.87±4.57a | 0.1711±0.0001d |
| Yolov5n | 0.7017±0.0035b | 2.51 | 119.56±10.30b | 0.1723±0.0001c |
| Yolov3-tiny | 0.6418±0.0044c | 12.14 | 140.82±2.15a | 0.2036±0.0005a |
Data are expressed as Mean ± SD. Different letters (a, b, c) indicate statistically significant differences between models (p < 0.05).
4. Discussion
This study provides a systematic evaluation of lightweight object detection models, implemented using representative YOLO-based architectures, for post-harvest banana quality grading under energy and infrastructure constraints commonly encountered in primary production systems. The findings demonstrate that model compactness alone does not ensure energy efficiency or grading robustness; instead, contemporary lightweight architectures achieve a more balanced trade-off between detection performance and computational demand compared with legacy compact models.
Importantly, the environmental burden associated with model training was found to be modest relative to the potential benefits of reducing post-harvest losses through automated grading. These results indicate that energy-aware model selection, rather than maximal model complexity or computational capacity, is critical for practical deployment of AI-assisted grading systems in decentralized agricultural settings.
Although the present analysis focuses on controlled training-phase evaluation to enable fair comparison among model architectures, the insights obtained offer a useful reference for extending energy-efficient AI solutions to other post-harvest applications. Future work will address current limitations in handling deformed fruit through instance-level approaches and will further examine inference-time energy consumption on embedded platforms relevant to real-world agricultural operations.
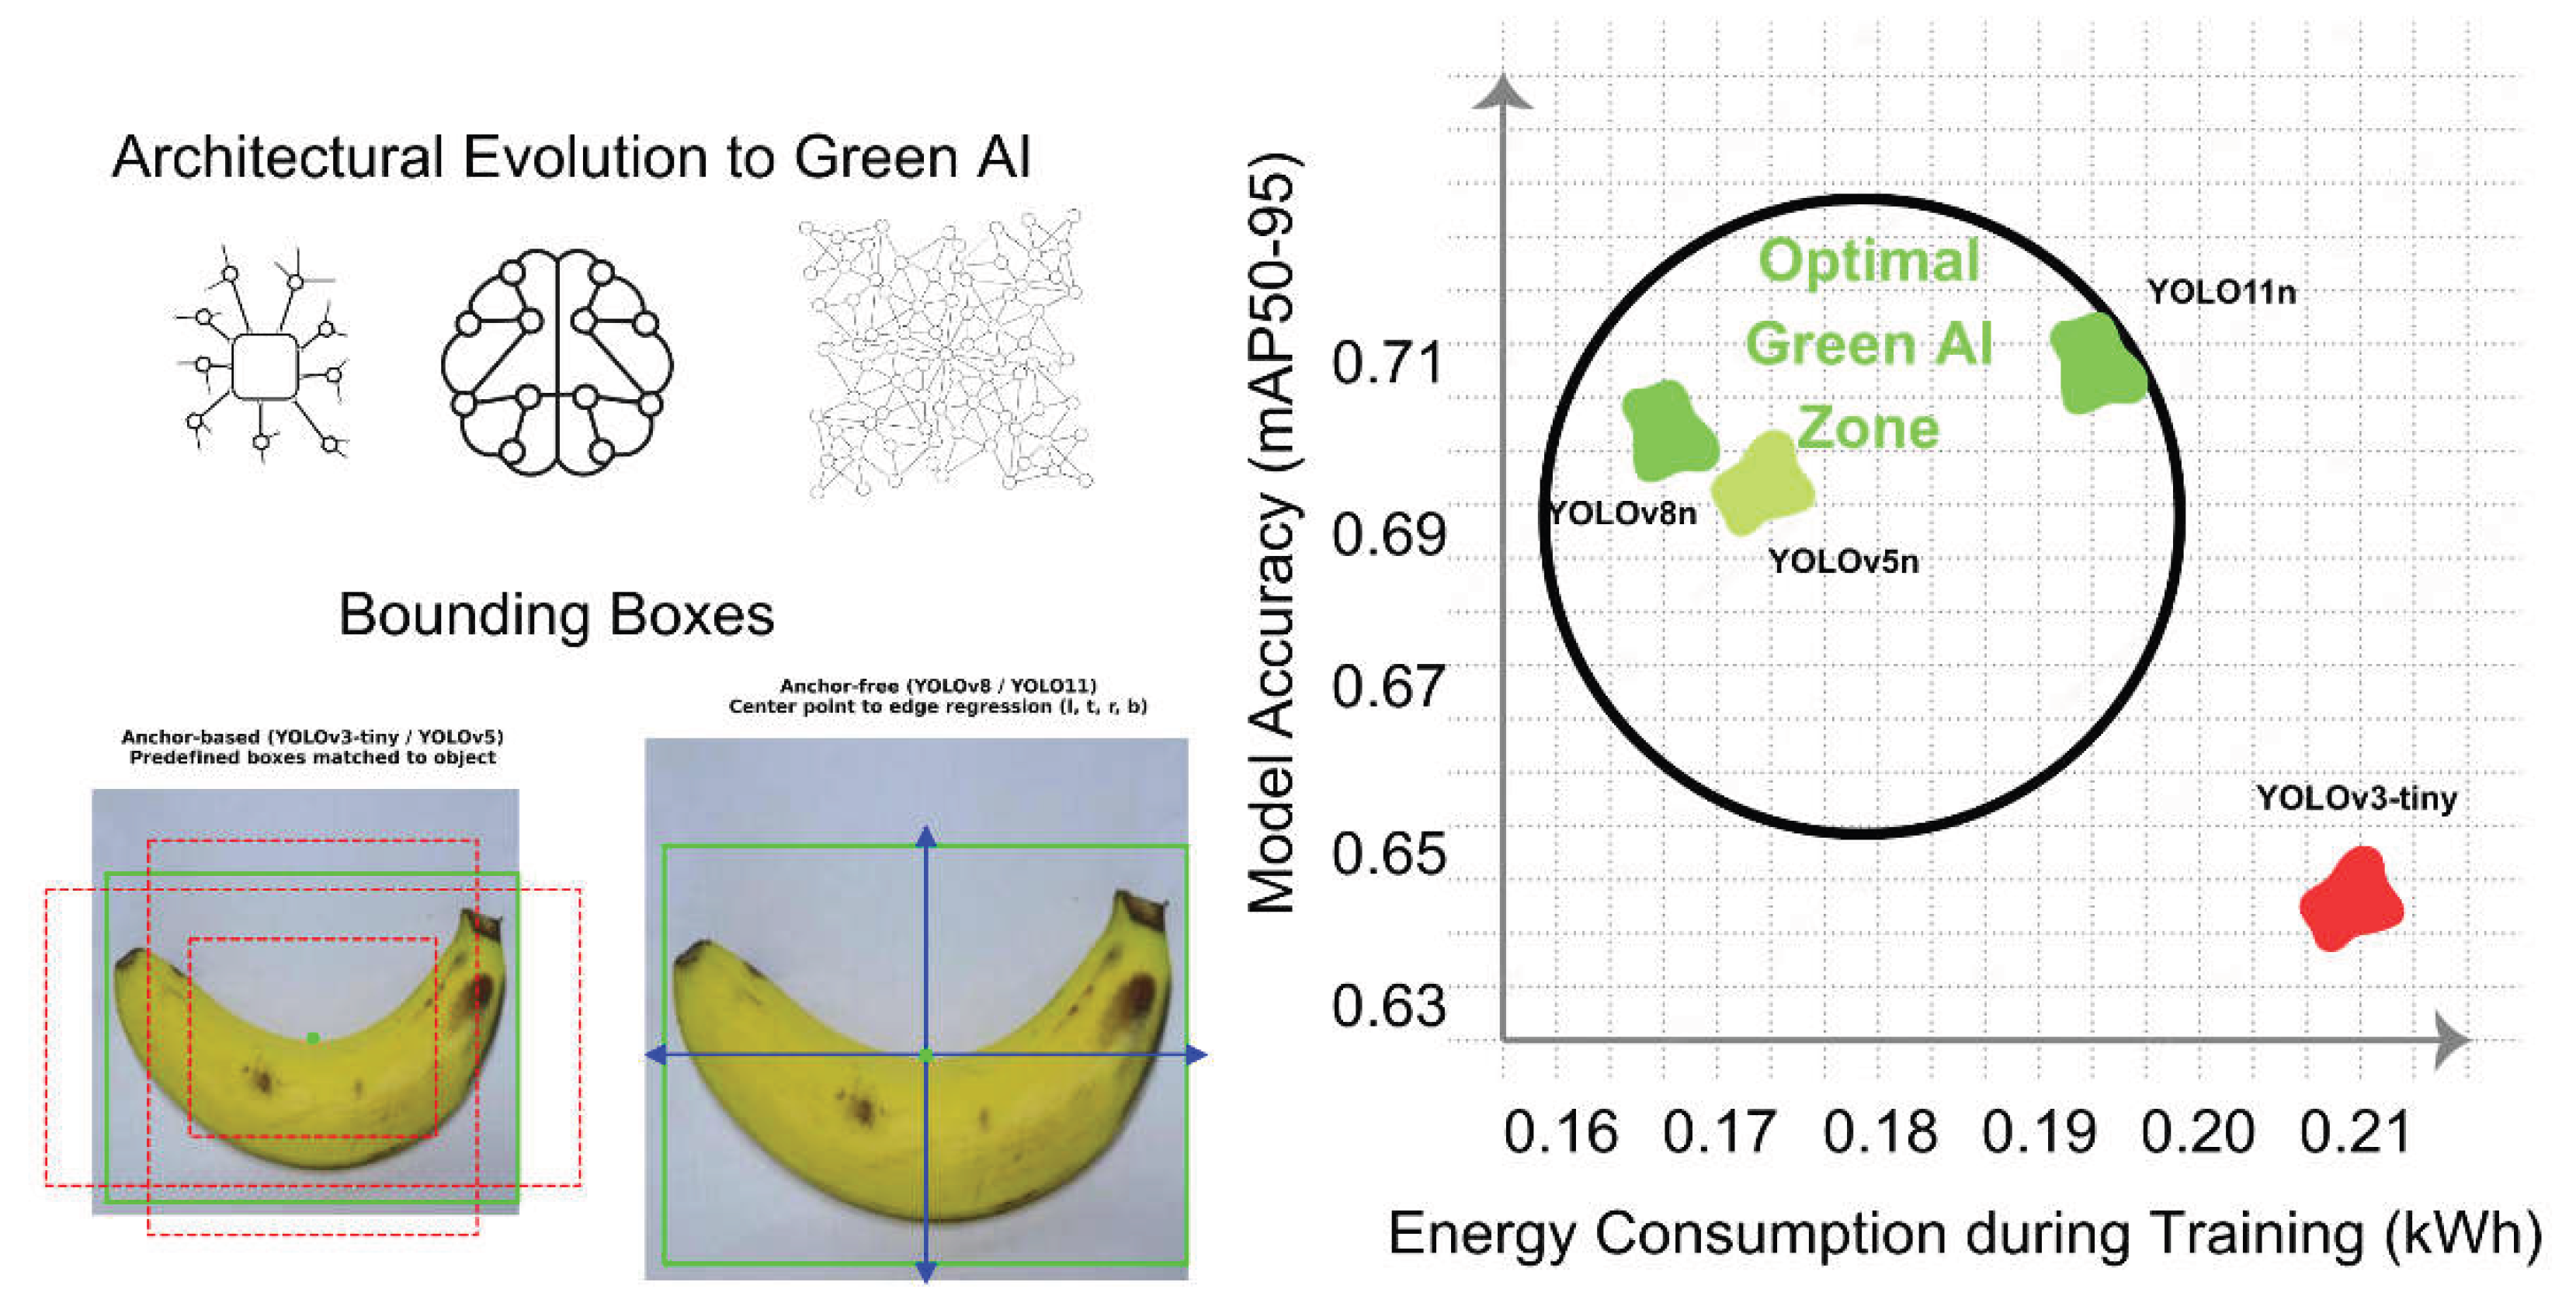
Figure 4.
Architectural evolution and performance benchmarking of YOLO models. The left panel illustrates the transition from legacy anchor-based mechanisms to modern anchor-free architectures. The right panel presents the trade-off between localization accuracy (mAP50-95) and training energy consumption (kWh), highlighting the optimal Green AI zone.
5. Conclusions
This study successfully established a comprehensive benchmark for lightweight object detection models in post-harvest banana quality grading, uniquely evaluating the critical trade-off between detection accuracy and energy efficiency. Contrary to the prevailing assumption that legacy compact models are optimal for resource-constrained environments, our findings explicitly demonstrate that model compactness does not inherently guarantee energy efficiency. The legacy YOLOv3-tiny exhibited both the highest energy consumption and the lowest accuracy.
In contrast, modern anchor-free architectures achieved a superior balance. YOLOv8n emerged as the most sustainable “Green AI” solution, offering high-speed processing with the lowest carbon footprint, making it highly suitable for high-throughput grading lines. Meanwhile, YOLO11n provided the highest precision, which is critical for strictly separating decayed fruit from the supply chain. Furthermore, detailed error diagnosis using the TIDE framework revealed that grading reliability is primarily challenged by localization errors on geometrically deformed and deteriorated fruit, rather than fundamental class confusion.
Crucially, the Cost-Benefit Analysis highlights that the environmental burden associated with training modern AI models is marginal when contrasted with the substantial CO2 emissions avoided by mitigating post-harvest agricultural waste. Ultimately, these findings underscore that energy-aware model selection, rather than maximal computational capacity, is paramount for the sustainable deployment of computer vision systems in primary agricultural production.
Future research will focus on addressing the geometric challenges of heavily decayed fruit through instance-level segmentation and attention-based bounding box refinement. Additionally, subsequent studies will extend this benchmark to evaluate real-time inference energy consumption directly on embedded edge devices (e.g., Jetson Nano) deployed in active packinghouse environments
Supplementary Materials
The following supporting information can be downloaded at the website of this paper posted on Preprints.org.
Author Contributions
Conceptualization, H.B.N. and N.T.M.N.; methodology, H.B.N.; software, H.B.N.; validation, H.B.N. and N.T.M.N.; formal analysis, H.B.N.; investigation, H.B.N.; resources, N.T.M.N.; data curation, H.B.N.; writing—original draft preparation, H.B.N.; writing—review and editing, N.T.M.N.; visualization, H.B.N.; supervision, N.T.M.N.; project administration, N.T.M.N. All authors have read and agreed to the published version of the manuscript.
Funding
This research received no external funding.
Institutional Review Board Statement
Not applicable.
Informed Consent Statement
Not applicable.
Data Availability Statement
The original data presented in the study are included in the article; further inquiries can be directed to the corresponding author.
Acknowledgments
During the preparation of this manuscript, the authors used Gemini 3 Pro for the purposes of refining technical terminology and language polishing. The authors have reviewed and edited the output and take full responsibility for the content of this publication.
Conflicts of Interest
The authors declare no conflicts of interest.
Abbreviations
The following abbreviations are used in this manuscript:
| AI | Artificial Intelligence; |
| Bkg | Background Error; |
| Both | Both Classification and Localization Error; |
| CBA | Cost–Benefit Analysis; |
| Cls | Classification Error; |
| DETR | Real-Time Detection Transformer; |
| Dupe | Duplicate Detection Error; |
| FPS | Frames Per Second; |
| Loc | Localization Error; |
| Miss | Missed Ground Truth Error; |
| R-CNN | Region-based Convolutional Neural Network; |
| TIDE | Toolbox for Identifying Object Detection Errors; |
| YOLO | You Only Look Once. |
References
- Min, X.; Ye, Y.; Xiong, S.; Chen, X. Computer Vision Meets Generative Models in Agriculture: Technological Advances, Challenges and Opportunities. Applied Sciences 2025, 15, 7663. [Google Scholar] [CrossRef]
- Ali, Z.; Muhammad, A.; Lee, N.; Waqar, M.; Lee, S.W. Artificial Intelligence for sustainable agriculture: a comprehensive review of AI-driven technologies in crop production. Sustainability 2025, 17, 2281. [Google Scholar] [CrossRef]
- Vietnam News Agency. Việt Nam targets $1 billion in banana exports. Available online: https://vietnamnews.vn/economy/1731834/viet-nam-targets-1-billion-in-banana-exports.html.
- Saltık, A.O.; Allmendinger, A.; Stein, A. Comparative analysis of yolov9, yolov10 and rt-detr for real-time weed detection. In Proceedings of the European Conference on Computer Vision, 2024; pp. 177–193. [Google Scholar]
- Khan, Z.; Shen, Y.; Liu, H. ObjectDetection in Agriculture: A Comprehensive Review of Methods, Applications, Challenges, and Future Directions. Agriculture 2025, 15, 1351. [Google Scholar] [CrossRef]
- Joshi, H. Edge-AI for agriculture: lightweight vision models for disease detection in resource-limited settings. arXiv 2024. arXiv:2412.18635.
- Kim, J.; Kim, G.; Yoshitoshi, R.; Tokuda, K. Real-time object detection for edge computing-based agricultural automation: A case study comparing the YOLOX and YOLOv12 architectures and their performance in potato harvesting systems. Sensors 2025, 25, 4586. [Google Scholar] [CrossRef]
- Kouzinopoulos, C.S.; Manna, Y. Hardware-Aware YOLO Compression for Low-Power Edge AI on STM32U5 for Weeds Detection in Digital Agriculture. arXiv arXiv:2511.07990.
- Patterson, D.; Gonzalez, J.; Le, Q.; Liang, C.; Munguia, L.-M.; Rothchild, D.; So, D.; Texier, M.; Dean, J. Carbon emissions and large neural network training. arXiv arXiv:2104.10350. [CrossRef]
- Approval of the Strategy for Sustainable Agricultural and Rural Development for the period 2021-2030, with a vision to 2050. 2022.
- Svanes, E.; Aronsson, A.K. Carbon footprint of a Cavendish banana supply chain. The International Journal of Life Cycle Assessment 2013, 18, 1450–1464. [Google Scholar] [CrossRef]
- Suppen-Reynaga, N.; Guerrero, A.B.; Dominguez, E.R.; Sacayón, E.; Solano, A. Life cycle assessment of bananas, melons, and watermelons from Costa Rica. Cleaner Circular Bioeconomy 2024, 9, 100120. [Google Scholar] [CrossRef]
- Vinuesa, R.; Azizpour, H.; Leite, I.; Balaam, M.; Dignum, V.; Domisch, S.; Felländer, A.; Langhans, S.D.; Tegmark, M.; Fuso Nerini, F. The role of artificial intelligence in achieving the Sustainable Development Goals. Nature communications 2020, 11, 233. [Google Scholar] [CrossRef]
- Jocher, G.; Chaurasia, A.; Qiu, J. Ultralytics YOLOv8; Ultralytics, 2023. [Google Scholar]
- Bochkovskiy, A.; Wang, C.-Y.; Liao, H.-Y.M. Yolov4: Optimal speed and accuracy of object detection. arXiv arXiv:2004.10934. [CrossRef]
- Lacoste, A.; Luccioni, A.; Schmidt, V.; Dandres, T. Quantifying the carbon emissions of machine learning. arXiv 2019, arXiv:1910.09700. [Google Scholar] [CrossRef]
- CodeCarbon Methodology. 2024.
- Bolya, D.; Foley, S.; Hays, J.; Hoffman, J. Tide: A general toolbox for identifying object detection errors. European Conference on Computer Vision, 2020; pp. 558–573. [Google Scholar]
- Redmon, J.; Farhadi, A. Yolov3: An incremental improvement. arXiv arXiv:1804.02767. [CrossRef]
- Ge, Z.; Liu, S.; Wang, F.; Li, Z.; Sun, J. Yolox: Exceeding yolo series in 2021. arXiv arXiv:2107.08430. [CrossRef]
- Wang, C.-Y.; Liao, H.-Y.M.; Wu, Y.-H.; Chen, P.-Y.; Hsieh, J.-W.; Yeh, I.-H. CSPNet: A new backbone that can enhance learning capability of CNN. In Proceedings of the IEEE/CVF conference on computer vision and pattern recognition workshops, 2020; pp. 390–391. [Google Scholar]
- Wang, C.-Y.; Bochkovskiy, A.; Liao, H.-Y.M. YOLOv7: Trainable bag-of-freebies sets new state-of-the-art for real-time object detectors. In Proceedings of the IEEE/CVF conference on computer vision and pattern recognition, 2023; pp. 7464–7475. [Google Scholar]
- Woo, S.; Park, J.; Lee, J.-Y.; Kweon, I.S. Cbam: Convolutional block attention module. In Proceedings of the European conference on computer vision (ECCV), 2018; pp. 3–19. [Google Scholar]
- Schwartz, R.; Dodge, J.; Smith, N.A.; Etzioni, O. GREEN AI. Communications of the ACM 2020, 63, 54–63. [Google Scholar] [CrossRef]
- Bhargava, A.; Bansal, A. Fruits and vegetables quality evaluation using computer vision: A review. Journal of King Saud University-Computer Information Sciences 2021, 33, 243–257. [Google Scholar] [CrossRef]
- Liu, L.; Ouyang, W.; Wang, X.; Fieguth, P.; Chen, J.; Liu, X.; Pietikäinen, M. Deep learning for generic object detection: A survey. International journal of computer vision 2020, 128, 261–318. [Google Scholar] [CrossRef]
- Dai, J.; Qi, H.; Xiong, Y.; Li, Y.; Zhang, G.; Hu, H.; Wei, Y. Deformable convolutional networks. In Proceedings of the IEEE international conference on computer vision, 2017; pp. 764–773. [Google Scholar]
- Rezatofighi, H.; Tsoi, N.; Gwak, J.; Sadeghian, A.; Reid, I.; Savarese, S. Generalized intersection over union: A metric and a loss for bounding box regression. In Proceedings of the IEEE/CVF conference on computer vision and pattern recognition, 2019; pp. 658–666. [Google Scholar]
- Araujo, A.; Norris, W.; Sim, J. Computing receptive fields of convolutional neural networks. Distill 2019, 4, e21. [Google Scholar] [CrossRef]
- Goodfellow, I.; Bengio, Y.; Courville, A.; Bengio, Y. Deep learning; MIT press: Cambridge, 2016; Volume 1. [Google Scholar]
- Hoiem, D.; Chodpathumwan, Y.; Dai, Q. Diagnosing error in object detectors. In Proceedings of the European conference on computer vision, 2012; pp. 340–353. [Google Scholar]
- Zhang, H.; Wang, Y.; Dayoub, F.; Sunderhauf, N. Varifocalnet: An iou-aware dense object detector. In Proceedings of the IEEE/CVF conference on computer vision and pattern recognition, 2021; pp. 8514–8523. [Google Scholar]
- Denil, M.; Shakibi, B.; Dinh, L.; Ranzato, M.A.; De Freitas, N. Predicting parameters in deep learning. Advances in neural information processing systems 2013, 26. [Google Scholar]
- Howard, A.G.; Zhu, M.; Chen, B.; Kalenichenko, D.; Wang, W.; Weyand, T.; Andreetto, M.; Adam, H. Mobilenets: Efficient convolutional neural networks for mobile vision applications. arXiv arXiv:1704.04861. [CrossRef]
- Strubell, E.; Ganesh, A.; McCallum, A. Energy and policy considerations for deep learning in NLP. In Proceedings of the 57th annual meeting of the association for computational linguistics, 2019; pp. 3645–3650. [Google Scholar]
- Jocher, G.; Qiu, J. Ultralytics YOLO11; Ultralytics, 2024. [Google Scholar]
- Prime Minister. Decision 749/QD-TTg approves the “National Digital Transformation Program until 2025, with orientation to 2030”. 2020. [Google Scholar]
- Prime Minister. Decision 431/QD-TTg approves the Project for the Development of Key Fruit Trees until 2025 and 2030. 2022. [Google Scholar]
Figure 3.
Benchmark: Trade-off between Model Size and Speed (FPS). Data are expressed as Mean ± SD. Different letters (a, b, c) indicate statistically significant differences between models (p < 0.05).
Figure 3.
Benchmark: Trade-off between Model Size and Speed (FPS). Data are expressed as Mean ± SD. Different letters (a, b, c) indicate statistically significant differences between models (p < 0.05).
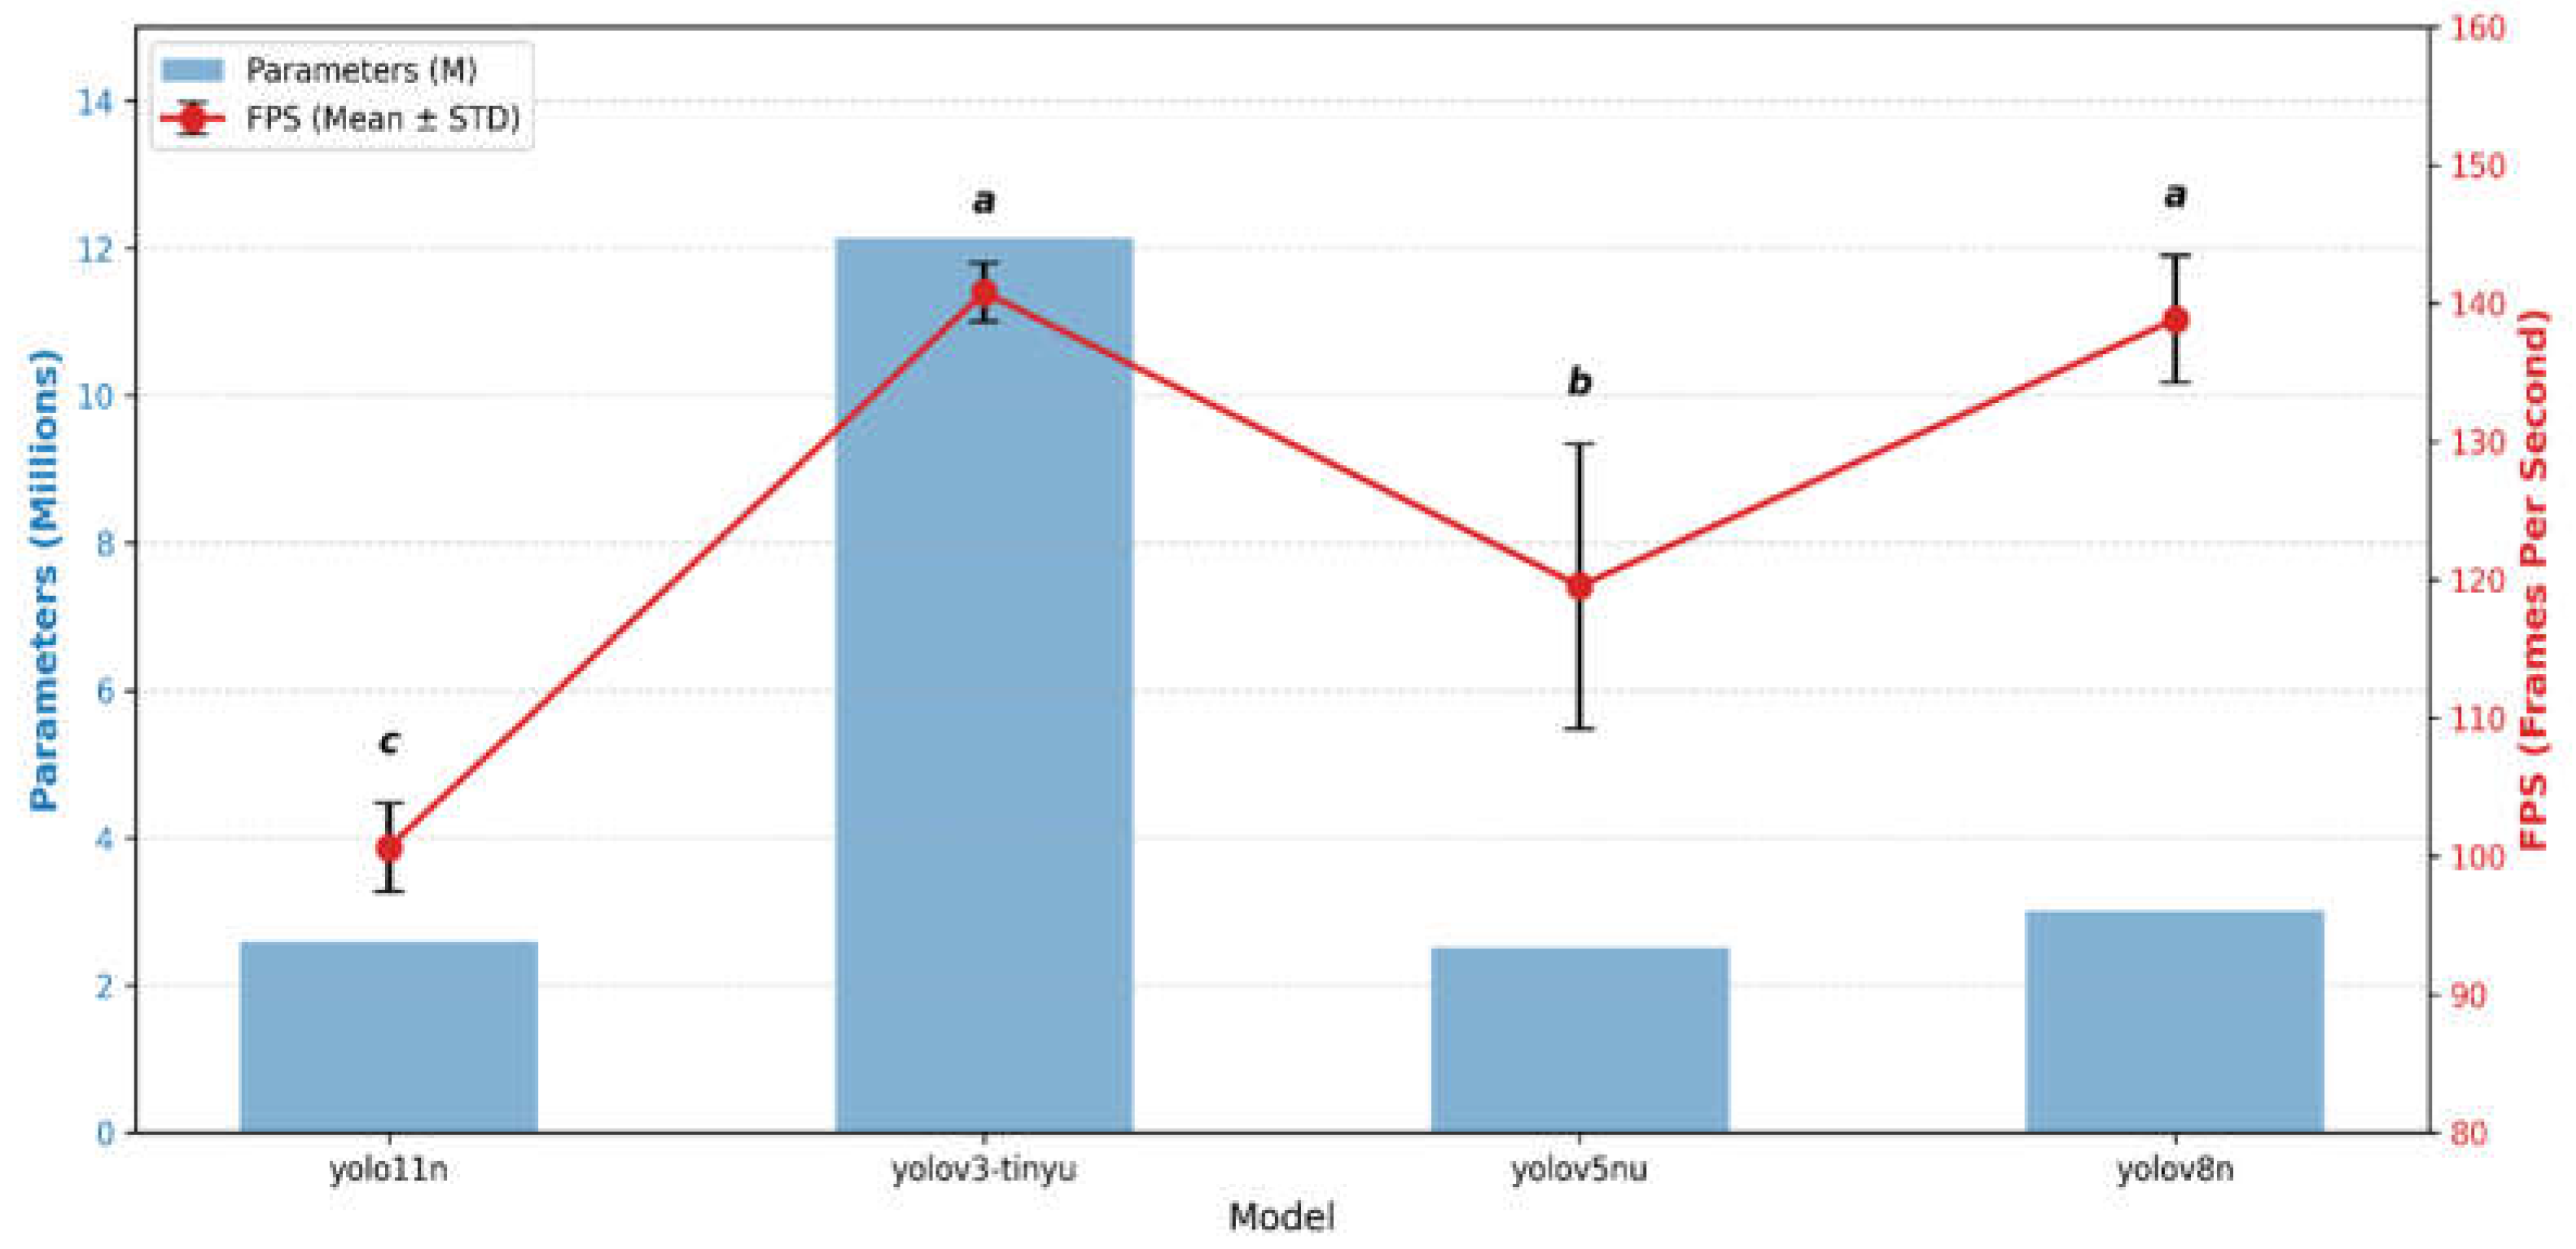
Table 2.
Overall Performance Comparison (mAP50 vs. mAP50–95).
| Model | Yolo11n | Yolov3-tinyu | Yolov5nu | Yolov8n |
| mAP50 | 0.9483±0.0031a | 0.9228±0.0054b | 0.9454±0.0010a | 0.9457±0.0029a |
| mAP95 | 0.7112±0.0028a | 0.6418±0.0044c | 0.7017±0.0035b | 0.7084±0.0021a |
Data are expressed as Mean ± SD. Different letters (a, b, c) indicate statistically significant differences between models (p < 0.05).
Table 3.
Quantitative error decomposition using the TIDE framework across four YOLO models.
| Model | Yolov8n | Yolov5nu | Yolov3-tinyu | Yolo11n |
| Cls | 1.3140±0.1869b | 1.3551±0.1949b | 2.1420±0.2691a | 1.2496±0.1726b |
| Loc | 1.8293±0.1218b | 1.7897±0.3728b | 2.4827±0.2452a | 1.8199±0.2790b |
| Both | 0.4243±0.0758b | 0.3736±0.0636bc | 0.6165±0.0802a | 0.3180±0.0635c |
| Dupe | 0.1314±0.0554ab | 0.0897±0.0181b | 0.1438±0.0322a | 0.1160±0.0374ab |
| Bkg | 0.5313±0.0462a | 0.4972±0.0529a | 0.5760±0.0640a | 0.5679±0.0591a |
| Miss | 0.0497±0.1110b | 0.1108±0.0953ab | 0.3440±0.2267a | 0.1852±0.2001ab |
Data are expressed as Mean ± SD. Different letters (a, b, c) indicate statistically significant differences between models (p < 0.05).
Disclaimer/Publisher’s Note: The statements, opinions and data contained in all publications are solely those of the individual author(s) and contributor(s) and not of MDPI and/or the editor(s). MDPI and/or the editor(s) disclaim responsibility for any injury to people or property resulting from any ideas, methods, instructions or products referred to in the content. |
© 2026 by the authors. Licensee MDPI, Basel, Switzerland. This article is an open access article distributed under the terms and conditions of the Creative Commons Attribution (CC BY) license (http://creativecommons.org/licenses/by/4.0/).
Copyright: This open access article is published under a Creative Commons CC BY 4.0 license, which permit the free download, distribution, and reuse, provided that the author and preprint are cited in any reuse.