Submitted:
13 February 2026
Posted:
27 February 2026
You are already at the latest version
Abstract
Background/Objectives: Chronic low back pain (CLBP) affects approximately 20% of the global population. While cannabis-based therapies have shown short-term analgesic potential, long-term evidence remains scarce. This study assessed the four-year efficacy of inhaled cannabis therapy on pain and disability outcomes, while exploring BioWell gas discharge visualization (GDV) parameters as non-invasive biomarkers.
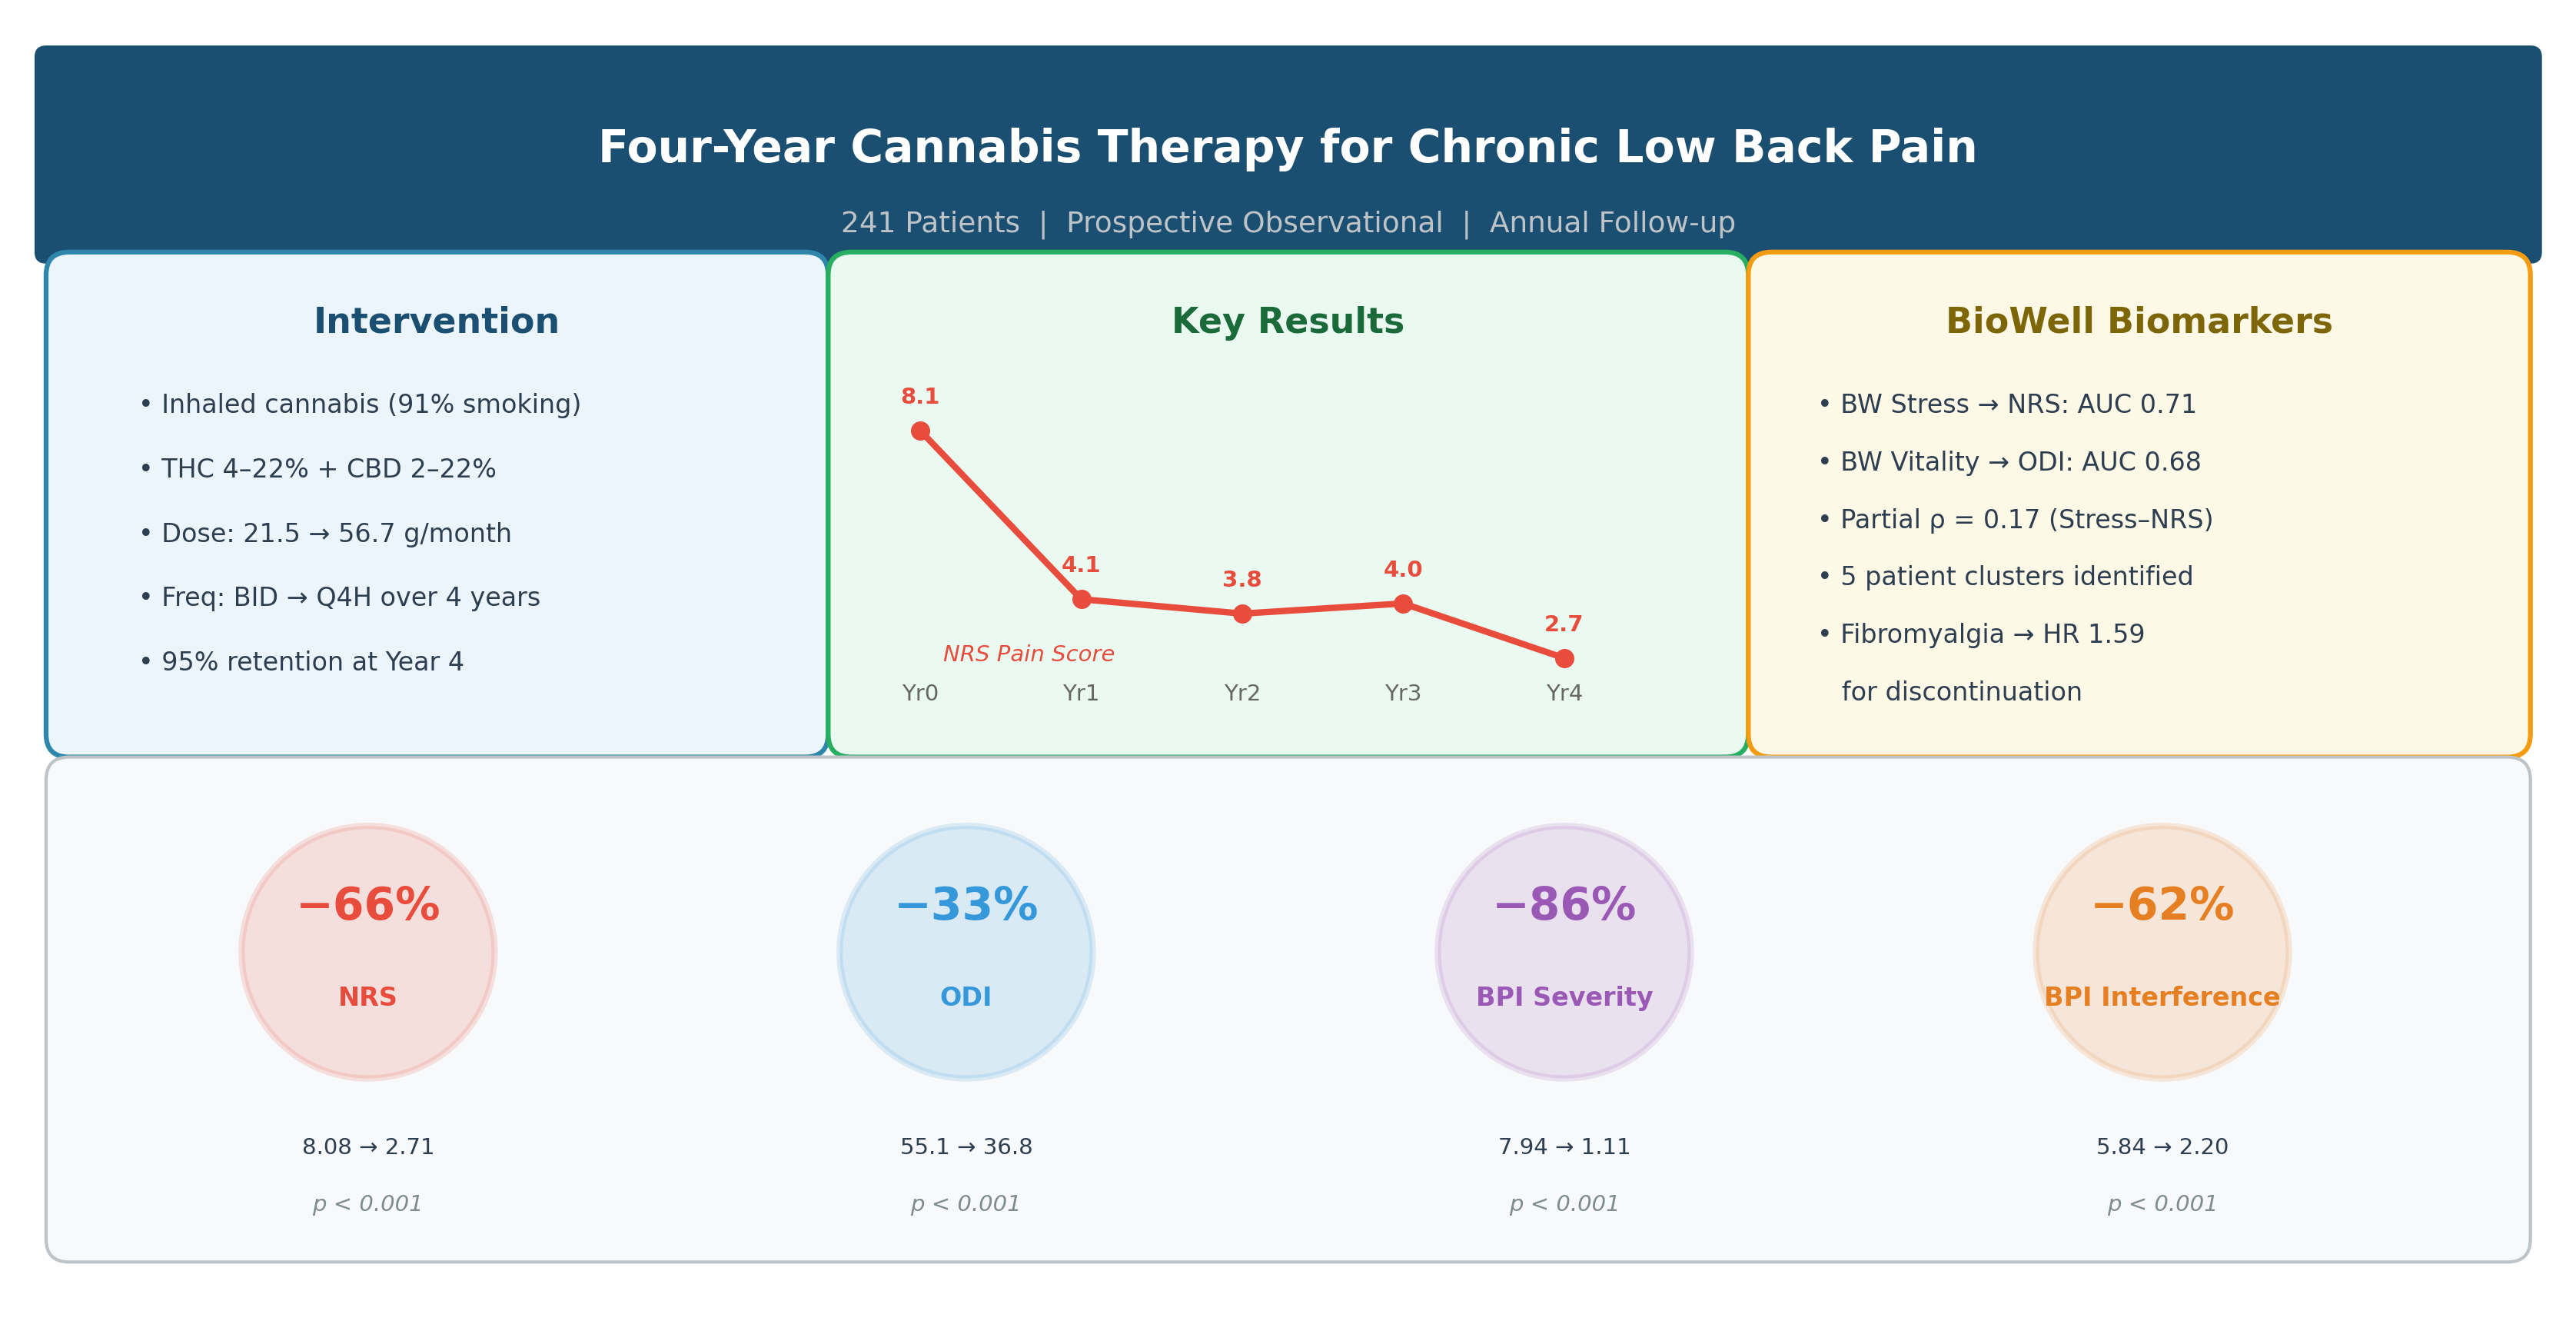
Methods: In this prospective observational study (IRB 0634-25-RMC and 807-21-RMC), 241 adults with CLBP (mean age 49.3 ± 14.9 years; 62.2% male) who had failed ≥1 year of conventional therapy initiated inhaled cannabis (predominantly smoking, 91%). Cannabis contained THC (4–22%) and CBD (2–22%), with dosing titrated from 21.5 g/month (Year 1) to 56.7 g/month (Year 4). Primary outcomes—NRS, ODI, BPI severity and interference—and secondary BioWell stress and vitality were assessed annually. Analyses included repeated-measures ANOVA, mixed-effects models, ROC analysis, network analysis, K-means clustering, and survival analysis.
Results: Of 241 enrolled patients, 229 (95.0%) completed Year 4 follow-up. NRS decreased from 8.08 ± 1.61 to 2.71 ± 1.46 (p < 0.001), ODI from 55.05 ± 15.90 to 36.82 ± 8.47 (p < 0.001), BPI severity from 7.94 ± 1.71 to 1.11 ± 0.53 (p < 0.001), and BPI interference from 5.84 ± 2.02 to 2.20 ± 1.69 (p < 0.001). BioWell stress discriminated moderate-to-severe pain (NRS > 4) with AUC 0.71 (95% CI 0.65–0.77). Fibromyalgia at baseline predicted discontinuation (HR 1.59, 95% CI 1.18–2.14, p = 0.003).
Conclusions: Inhaled cannabis therapy was associated with sustained reductions in pain and disability over four years. BioWell stress showed modest discriminative ability as a biomarker. These findings are associative and require confirmation in controlled trials.
Keywords:
chronic low back pain
; cannabis
; tetrahydrocannabinol
; cannabidiol
; BioWell
; gas discharge visualization
; patient-reported outcomes
; observational study
1. Introduction
Chronic low back pain (CLBP) is a pervasive global health challenge, affecting approximately 20% of the population and ranking among the leading causes of disability worldwide [1]. Conventional pharmacological treatments, particularly opioids, remain a mainstay for pain management, yet their widespread use is associated with significant risks including addiction, tolerance, overdose, and mortality [2,3]. Alternative and adjunctive therapies, including cannabis-based treatments, have gained attention due to their interaction with the endocannabinoid system, potentially offering comparable pain relief with a different risk profile [4,5]. However, cannabis therapy remains controversial, with mixed evidence regarding efficacy, functional outcomes, and long-term safety [6,7].
Evidence on the sustained efficacy of cannabis in CLBP over extended periods remains scarce. Most studies report outcomes at 6–12 months, with few extending beyond two years. Aviram et al. (2021) reported a 20% pain reduction across various chronic pain etiologies over 12 months in a multicenter Israeli cohort [8], but longer-term data specific to CLBP are lacking. The present study addresses this gap by evaluating four-year outcomes in a CLBP cohort with detailed documentation of cannabis dose, route of administration, and dosing frequency.
Concurrently, the integration of novel non-invasive diagnostic tools into pain research has generated interest. Gas Discharge Visualization (GDV), also known as electrophotonic imaging, measures ultra-weak photon emissions from biological tissues—a phenomenon arising from metabolic processes involving reactive oxygen species and mitochondrial respiration [9,10,11,12]. The BioWell device employs a single-finger GDV technique to quantify stress (0–10 scale, lower indicates less stress) and vitality (0–100 scale, higher indicates greater vitality) [13,14]. While photon-based measures are well-accepted in medicine (e.g., PET scanning, infrared imaging), BioWell’s clinical validity for pain assessment remains under investigation, with limited standardization and broader clinical validation to date [15,16].
The objectives of this study were: (1) to evaluate the four-year longitudinal efficacy of inhaled cannabis therapy on patient-reported outcome measures (PROMs) in CLBP patients who failed conventional treatments (primary analysis); (2) to explore BioWell GDV parameters as potential non-invasive biomarkers correlated with treatment response (secondary analysis); and (3) to examine demographic and comorbidity influences on outcomes through network analysis, cluster analysis, and survival modeling (exploratory analyses). Given the observational design, all findings are interpreted as associations rather than causal effects.
2. Materials and Methods
2.1. Study Design and Setting
This prospective observational study was conducted at a single orthopedic pain clinic (Dr. Robinson Ltd.) affiliated with Hasharon Hospital, Rabin Medical Center, Israel. Patients were enrolled between 2018 and 2020 and followed for four years with annual assessments (baseline Year 0 through Year 4). The study adhered to STROBE reporting guidelines for observational studies.
2.2. Ethical Approval and Informed Consent
The study was approved by the Institutional Review Board of Rabin Medical Center (IRB protocols 0634-25-RMC and 807-21-RMC). All participants provided informed consent. In Israel, medical cannabis is regulated by the Israeli Medical Cannabis Agency (IMCA) under the Ministry of Health (MOH). Patients receive cannabis licenses through a standardized electronic application process (effective April 2019), which includes a mandatory checkbox confirming research participation consent. Cannabis was prescribed as part of routine clinical care under existing MOH licenses; it was not administered as an experimental intervention. Therefore, this study is classified as an observational study of standard-of-care treatment and does not require clinical trial registration per ICMJE guidelines for non-interventional studies.
2.3. Participants
Inclusion criteria were: adults aged ≥18 years, diagnosed with CLBP for ≥1 year, having failed conventional therapies (including physiotherapy, non-opioid analgesics, and/or opioids) for at least one year, and initiating cannabis therapy under MOH license. Exclusion criteria were: prior cannabis use within three months, severe unstable psychiatric conditions, or inability to provide informed consent. Of 256 screened patients, 245 met inclusion criteria, 4 were excluded due to inability to perform BioWell measurement, and 241 were enrolled (Figure 1).
2.4. Cannabis Intervention
Cannabis was prescribed as a secondary intervention after failure of ≥1 year of conventional therapy, which typically included combinations of physiotherapy (specific exercise modalities were not systematically recorded), non-opioid analgesics (NSAIDs, acetaminophen), and in some cases opioids. Cannabis formulations contained THC (4–22%) and CBD (2–22%) with variable ratios, prescribed according to MOH guidelines and titrated individually by the treating physician.
Route of administration: The predominant route was inhalation via smoking (91% of treated patients at Year 1), with a minority using vaporization (6%). No oral or sublingual routes were used. Nineteen patients switched between vaporization and smoking across the study period.
Dosage: Mean monthly cannabis dosage increased from 21.5 ± 4.1 g/month at Year 1 to 56.7 ± 12.2 g/month at Year 4 (range 20–90 g/month). Mean THC content rose from 3.89 ± 1.57 g/month (Year 1) to 11.07 ± 3.62 g/month (Year 4). Mean CBD content rose from 1.36 ± 0.93 g/month (Year 1) to 2.75 ± 1.69 g/month (Year 4). Note: administered dose does not equal absorbed dose, as inhalation efficiency varies between patients.
Dosing frequency: Dosing frequency was escalated over time. At Year 1, 88% of patients used twice-daily (BID) dosing. By Year 2, the majority had transitioned to four-times-daily (QID, 60%) or every-4-hours (Q4H, 24%) regimens. By Year 4, all 229 remaining patients were on Q4H dosing.
2.5. Outcome Measures
Primary outcomes (pre-specified) were patient-reported outcome measures (PROMs) assessed annually: Numeric Rating Scale (NRS, 0–10; higher = more pain) [17], Oswestry Disability Index (ODI, 0–100%; higher = greater disability) [18], and Brief Pain Inventory (BPI) pain severity and interference subscales (0–10 each) [17].
Secondary outcomes (pre-specified) included BioWell stress (0–10, lower better) and vitality (0–100, higher better), measured via single-finger GDV using the BioWell device (fourth finger of both hands). Each reported BioWell value represents the average of four to five sequential captures taken within a single session (each capture requiring approximately 3–5 seconds), thereby reducing measurement noise. Importantly, the BioWell measurement is fully automated: the device captures the electrophotonic emission pattern, and the software algorithm computes stress and vitality scores without operator interpretation or subjective rating, eliminating inter-rater variability as a source of bias. Cannabis dosage variables (grams/month, THC grams, CBD grams, THC%, CBD%) were recorded at each visit.
Baseline covariates included age, sex (binary), pain duration (years), BMI, race, birth continent of ancestors, employment status, and comorbidities (anxiety, past psychosis, fibromyalgia, sleep disorder).
2.6. Statistical Analysis
Analyses were structured hierarchically as primary, secondary, and exploratory to address the study objectives:
Primary analysis: Longitudinal trends in NRS, ODI, and BPI were assessed using repeated-measures ANOVA with Tukey–Kramer post-hoc comparisons. Mixed-effects models evaluated the impact of dosage group on NRS, adjusting for time-varying covariates.
Secondary analyses: Pearson and partial correlations between BioWell parameters and PROMs were computed, adjusting for age, sex, and fibromyalgia status. Receiver Operating Characteristic (ROC) analysis evaluated the discriminative ability of BioWell parameters for moderate-to-severe pain (NRS > 4), reporting area under the curve (AUC) with 95% confidence intervals [19]. Canonical Correlation Analysis (CCA) and Structural Equation Modeling (SEM) assessed multivariate associations.
Exploratory analyses: Network analysis examined baseline interrelationships among variables using Pearson and point-biserial correlations (significance threshold |r| > 0.2). K-means clustering identified patient subgroups based on mean BioWell stress, vitality, NRS, and ODI across follow-up (optimal k = 5 by elbow method and silhouette scores). Kaplan–Meier survival analysis and Cox proportional hazards models assessed therapy retention and predictors of discontinuation [20,21]. These exploratory analyses are hypothesis-generating and should be interpreted with caution.
Missing data: Multiple imputation (MICE, m = 5, method = pmm, maxit = 20) was performed for missing data, with sensitivity analyses comparing complete-case and imputed results. Statistical significance was set at p < 0.05. All analyses were conducted in R (version 4.2.0). No a priori power calculation was performed; however, post-hoc analysis confirmed that the sample of 241 patients provided >99% power to detect the observed NRS change (Δ = 5.37, SD ≈ 1.5) at α = 0.05 using a paired t-test framework, and >95% power for the smallest observed primary outcome change (ODI, Δ = 18.23). Standardized effect sizes (Cohen’s d) were calculated for all primary outcomes to quantify clinical magnitude beyond statistical significance.
3. Results
3.1. Participant Flow and Baseline Characteristics
Of 256 screened patients, 241 were enrolled and assessed at baseline (Year 0). All 241 completed Year 1 assessment. Attrition was observed at Years 2–4, with complete NRS data available for 233 (Year 2), 214 (Year 3), and 229 (Year 4) patients. The higher completion at Year 4 compared to Year 3 reflects patients who missed interim visits but returned for final assessment. Twelve patients had missing Year 4 data: technical failure of BioWell measurement (n = 5), lack of cannabis efficacy (n = 2), change of physician (n = 3), death (n = 1), and psychosis necessitating cannabis discontinuation (n = 1). The participant flow is depicted in Figure 1. Baseline demographic and clinical characteristics are presented in Table 1.
3.2. Cannabis Dosing Over Time
3.3. Primary Outcomes: Longitudinal Trends
Significant improvements were observed across all primary PROMs (Table 3). NRS decreased from 8.08 ± 1.61 at baseline to 2.71 ± 1.46 at Year 4 (F = 215.4, p < 0.001; Cohen’s d = 3.49), a reduction exceeding the minimal clinically important difference of 2 points [17]. ODI declined from 55.05 ± 15.90 to 36.82 ± 8.47 (p < 0.001; d = 1.43), and BPI severity decreased from 7.94 ± 1.71 to 1.11 ± 0.53 (p < 0.001; d = 5.41). BPI interference declined from 5.84 ± 2.02 to 2.20 ± 1.69 (p < 0.001; d = 1.95). All effect sizes substantially exceed the threshold for large effects (d ≥ 0.8) [30]. The largest improvements occurred within the first year, with subsequent gains plateauing or showing modest further improvement. Tukey–Kramer post-hoc comparisons confirmed significant differences between baseline and all subsequent years for NRS, ODI, BPI severity, and BPI interference (p < 0.05).
3.4. Secondary Outcomes: BioWell Parameters
BioWell stress declined from 4.46 to 3.35 by Year 3, with a partial rebound to 4.15 at Year 4 (F = 5.6, p < 0.001). BioWell vitality declined from 50.30 to 41.80 at Year 2, recovering to 50.63 by Year 4 (F = 30.2, p < 0.001), suggesting a transient dip followed by stabilization (Figure 3 and Figure 4).
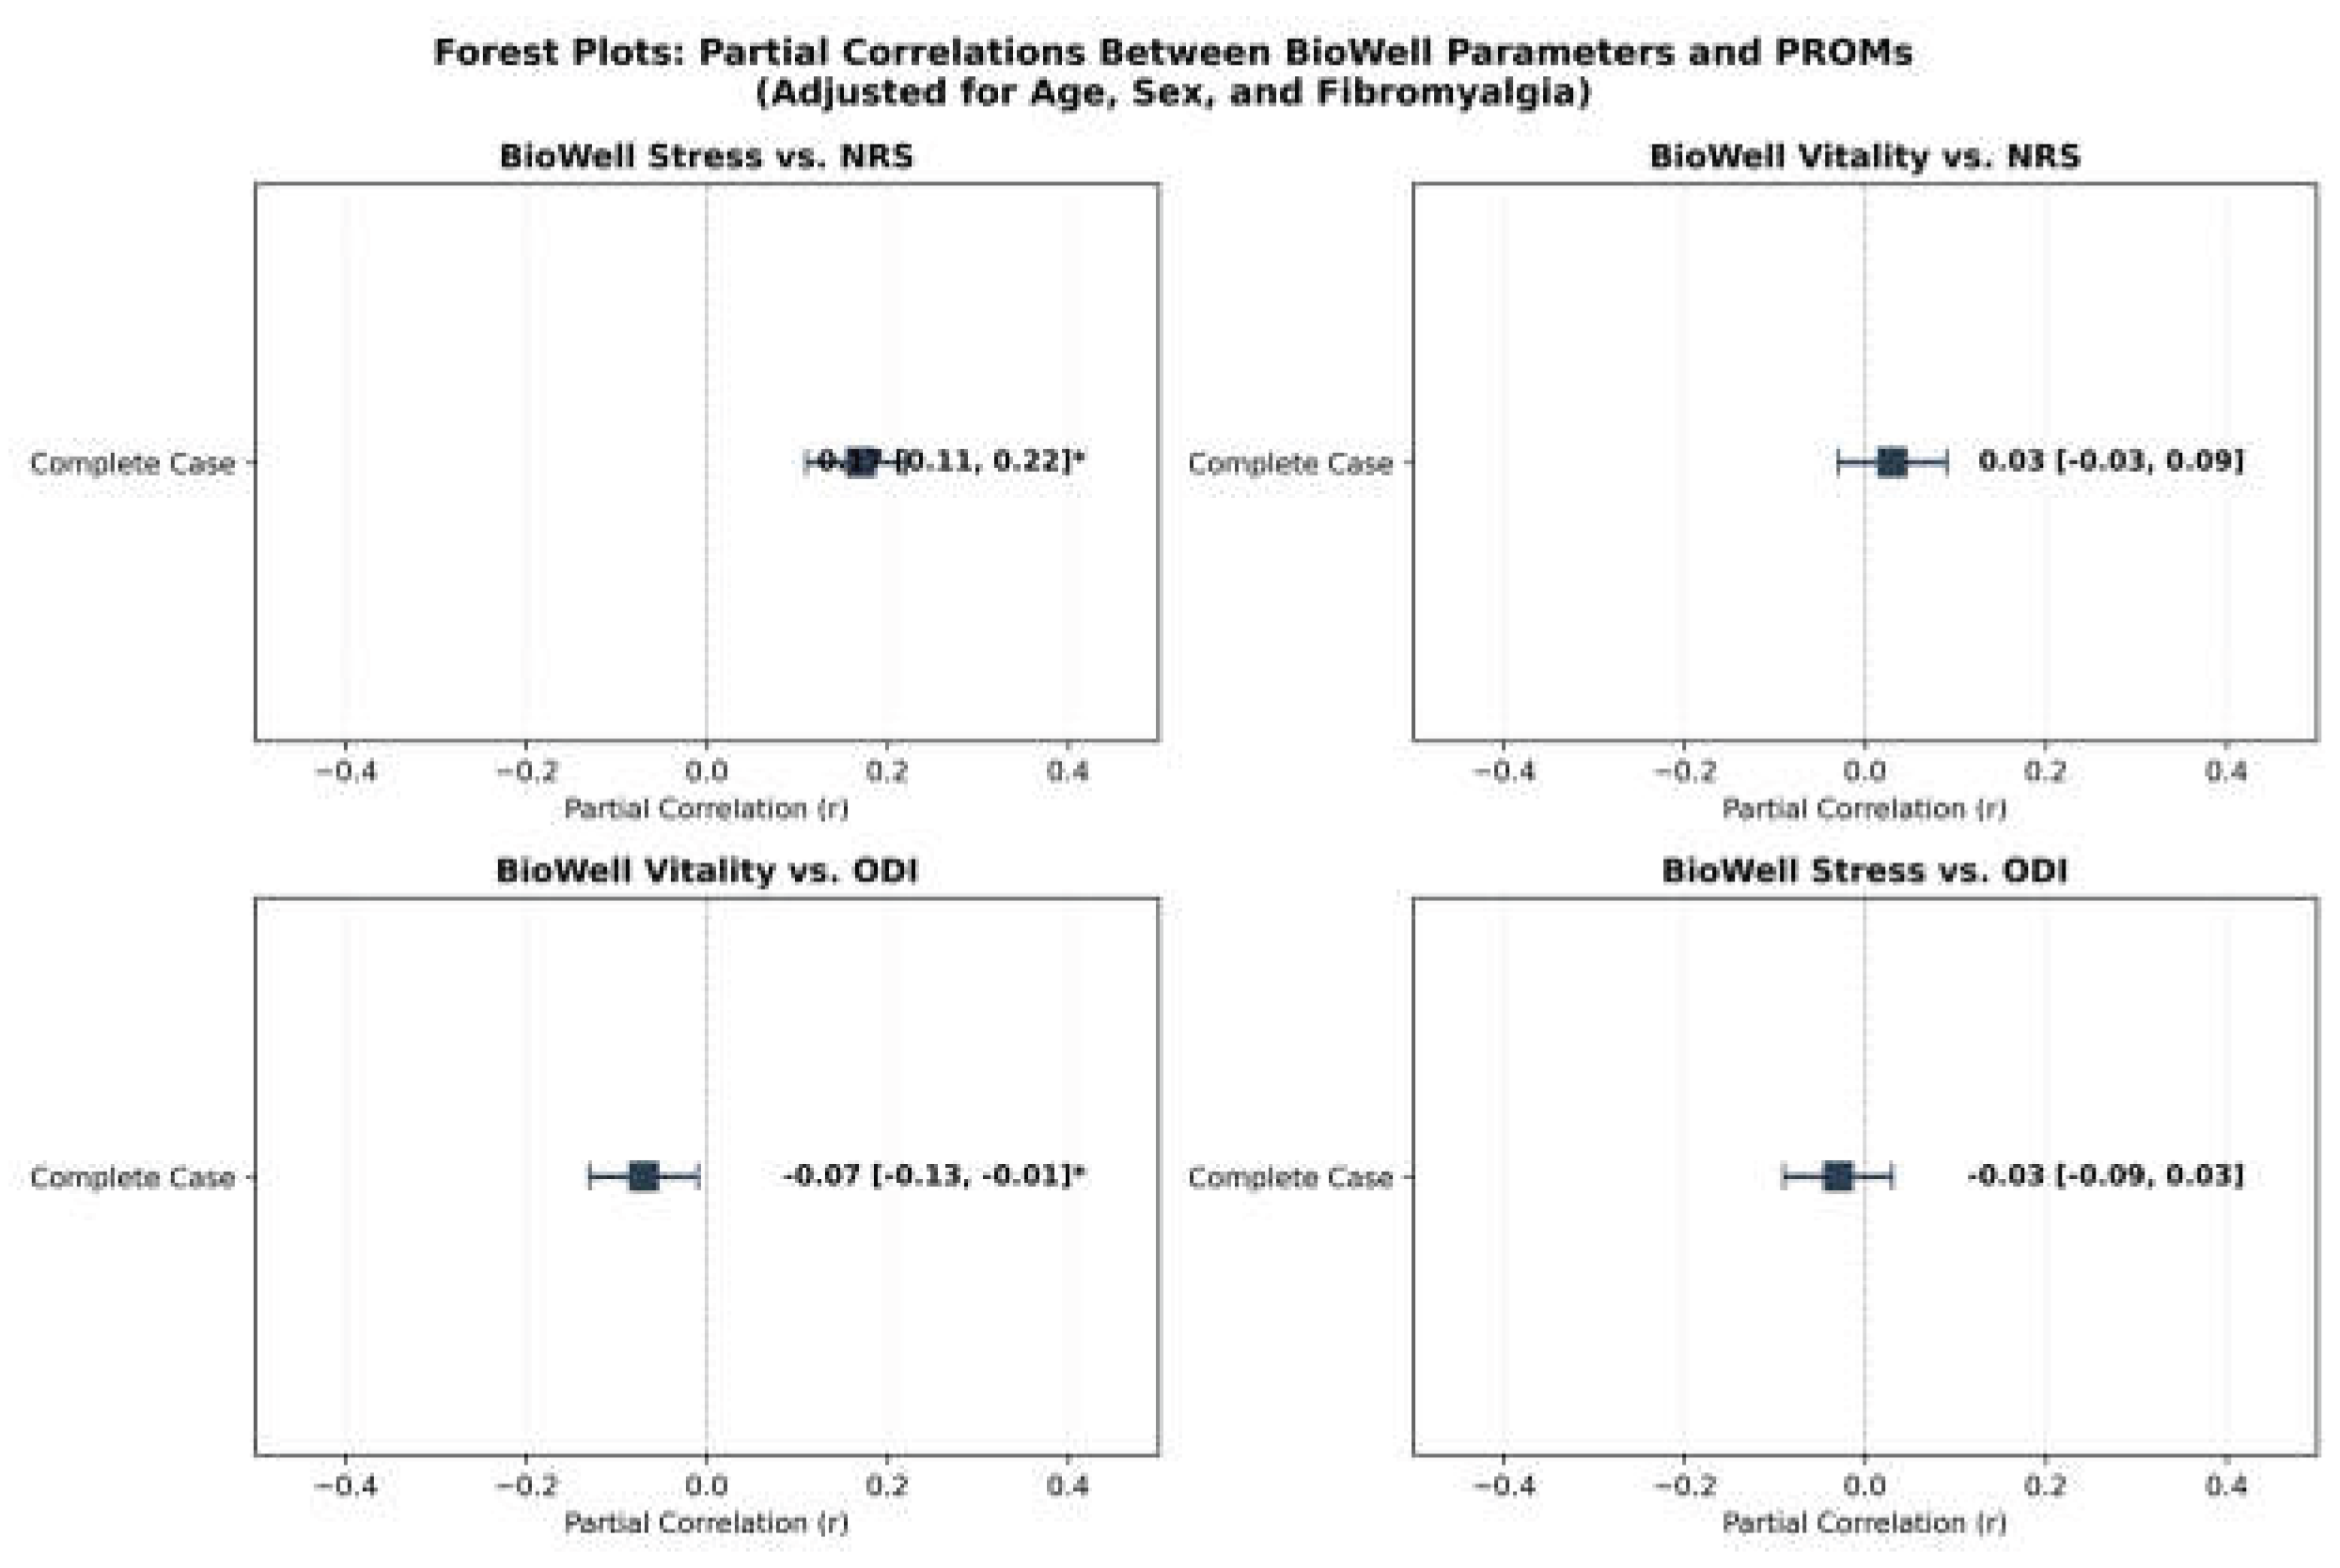
ROC analysis demonstrated that BioWell stress discriminated moderate-to-severe pain (NRS > 4) with AUC 0.71 (95% CI 0.65–0.77, p < 0.001), and BioWell vitality with AUC 0.68 (95% CI 0.62–0.74, p < 0.001). Forest plots of partial correlations (adjusting for age, sex, fibromyalgia) showed BioWell stress had a small positive association with NRS (ρ = 0.17, 95% CI 0.11–0.22) and BioWell vitality a small inverse association with ODI (ρ = −0.07, 95% CI −0.13 to −0.01) (Figure 9). CCA showed a significant multivariate association (first canonical correlation 0.68, 95% CI 0.62–0.74, p < 0.001). SEM confirmed a latent PainStatus–BioWellHealth path coefficient of −0.55 (p < 0.001).
3.5. Dose–Response Relationships
Multiple linear regression demonstrated that dosage group significantly predicted NRS reduction (β = −0.72, 95% CI −1.05 to −0.39, p < 0.001). THC content exerted a stronger analgesic effect (β = −0.15 per gram, p < 0.001) compared to CBD (β = −0.08, p = 0.03), suggesting THC as the primary driver of pain relief. Sensitivity analyses excluding dosage outliers attenuated the THC effect minimally (β = −0.13, p < 0.001), confirming robustness.
3.6. Exploratory Analyses: Network Analysis
Baseline network analysis (N = 241) revealed a core cluster linking NRS, BPI severity (r = 0.89, p < 0.001), ODI (r = 0.62, p < 0.001), and BPI interference (r = 0.55, p < 0.001). Fibromyalgia at baseline correlated moderately with NRS (r = 0.45), ODI (r = 0.39), and BPI severity (r = 0.41, all p < 0.001). Age showed a weak negative correlation with BioWell vitality (r = −0.28, p < 0.05), consistent with age-related decline in mitochondrial function [22]. BMI had minor positive correlations with ODI (r = 0.25) and BPI interference (r = 0.22, p < 0.05). These relationships are visualized in Figure 5.
3.7. Exploratory Analyses: Cluster Analysis
K-means clustering identified five patient subgroups (Figure 6 and Figure 7). Cluster 1 (n = 45) was characterized by high pain and disability (NRS 5.93, ODI 60.24). Cluster 4 (n = 58) showed low stress with moderate disability (BioWell stress 3.51, ODI 54.12). Cluster 5 (n = 83) had the lowest stress (3.09) with moderate pain (NRS 4.40). ANOVA confirmed significant NRS differences across clusters (F = 55.09, p < 0.001), supporting heterogeneity in treatment response.
3.8. Exploratory Analyses: Survival Analysis
Kaplan–Meier analysis [20] estimated 81% therapy retention at Year 4. Fibromyalgia at baseline significantly predicted discontinuation (HR 1.59, 95% CI 1.18–2.14, p = 0.003). NRS was also a significant predictor (HR 1.32 per unit, 95% CI 1.24–1.41, p < 0.001), though the proportional hazards assumption was violated for NRS (χ2 = 24.7, p < 0.001), indicating its effect varies over time. Age was not a significant predictor (p = 0.254). Results are depicted in Figure 8.
3.9. Subgroup and Sensitivity Analyses
Females had higher BioWell stress (4.5 ± 1.1 vs. 4.2 ± 1.0, p = 0.005) but no significant NRS difference (p = 0.356) [23,24]. Patients with sleep disorders reported higher NRS (5.4 ± 2.9 vs. 5.0 ± 2.8, p = 0.001). Arab patients reported higher NRS than Jewish patients (5.5 ± 2.9 vs. 5.1 ± 2.8, p = 0.010) [25]. Complete-case versus imputed analyses yielded NRS β differences < 0.03 (p < 0.001), validating imputation reliability.
Figure 9.
Forest plots of partial correlations between BioWell parameters and PROMs, adjusting for age, sex, and fibromyalgia status. * indicates CI excludes zero.
Figure 9.
Forest plots of partial correlations between BioWell parameters and PROMs, adjusting for age, sex, and fibromyalgia status. * indicates CI excludes zero.
4. Discussion
This four-year prospective observational study of 241 patients with CLBP demonstrated sustained improvements in pain intensity, disability, and pain interference associated with inhaled cannabis therapy. NRS decreased from 8.08 to 2.71 (a 66% reduction), ODI from 55.05 to 36.82 (33% reduction), and BPI severity from 7.94 to 1.11 (86% reduction) over the study period. These improvements substantially exceeded established minimal clinically important differences [17,18]. The largest gains occurred within the first year, with subsequent improvements plateauing, a pattern consistent with early therapeutic optimization.
These results extend prior work from our group and others. In a 10-year prospective study of a separate, non-overlapping CLBP cohort (N = 1,000), Robinson et al. [33] reported sustained pain reduction with inhaled cannabis, with significant opioid-sparing effects. In a five-year study of diabetic neuropathy patients (again a distinct cohort with no participant overlap), Robinson et al. [34] demonstrated long-term efficacy and safety of inhaled cannabis therapy. Yassin et al. [35] showed that adding cannabis to analgesic treatment in fibromyalgia-related low back pain significantly reduced pain severity. Robinson et al. [36] compared sublingual and inhaled cannabis routes for CLBP, finding superior outcomes with inhalation. In a multicenter study, Aviram et al. [8] reported a 20% pain reduction across mixed chronic pain etiologies over 12 months, and Pud et al. [37] provided further evidence from a structured prospective cohort of cannabis oil extracts. The present study’s exclusive focus on a four-year CLBP cohort (N = 241) with no overlap with these prior studies, detailed dosing documentation, and integration of BioWell parameters extends this body of evidence. The observed dose–response relationship, with THC showing a stronger analgesic effect (β = −0.15 per gram) than CBD (β = −0.08 per gram), is consistent with systematic reviews suggesting THC as the primary analgesic component [26,27]. The progressive dosage escalation from 21.5 to 56.7 g/month and frequency escalation from BID to Q4H suggest either developing tolerance or ongoing dose optimization, a clinically relevant observation that warrants pharmacokinetic investigation. Critically, however, all of these studies—including the present one—are observational in design, and randomized controlled trials with appropriate control groups are essential to establish causal efficacy.
BioWell parameters showed modest but statistically significant associations with PROMs. BioWell stress discriminated moderate-to-severe pain with AUC 0.71, and the partial correlation with NRS (ρ = 0.17) was significant after adjustment for covariates. BioWell vitality showed a weaker, borderline association with ODI (ρ = −0.07). While these effect sizes are small, they suggest potential complementary utility rather than replacement of subjective PROMs. The transient dip in BioWell vitality at Year 2 with subsequent recovery is intriguing and may reflect adaptive metabolic responses to cannabis therapy, though this interpretation is speculative.
Importantly, these BioWell–pain associations should be interpreted in light of our prior work. In a separate, non-overlapping cohort of cannabis-treated chronic neuropathic pain patients, Yassin et al. [32] demonstrated that ultra-weak photon emission (measured via the same BioWell device) showed significantly stronger specificity for anxiety (AUC 0.744) than for pain intensity (AUC 0.550). This suggests that the BioWell–NRS correlation observed in the present CLBP cohort (ρ = 0.17) may be mediated through anxiety and psychological distress rather than direct nociception. Given that 44.4% of our cohort had comorbid anxiety at baseline, and that chronic pain and anxiety share overlapping autonomic and neuroendocrine pathways, a mediation model in which BioWell captures stress-related physiological arousal—which in turn co-varies with pain report—is both plausible and consistent with both studies. This interpretation has implications for future research: BioWell may be best positioned as a complementary measure of the affective-autonomic dimension of the pain experience, rather than a direct nociceptive biomarker, and formal mediation analyses incorporating validated anxiety instruments should be pursued.
The exploratory cluster analysis revealed five distinct patient subgroups with significantly different pain profiles (F = 55.09, p < 0.001), supporting the heterogeneity of CLBP treatment response and the potential for personalized approaches. The network analysis confirmed a core pain–disability cluster (NRS–BPI severity r = 0.89) with fibromyalgia as a significant modifier (r = 0.45 with NRS), consistent with known comorbidity effects on pain perception [28,29]. These exploratory findings require validation in independent cohorts.
The survival analysis finding that fibromyalgia predicted discontinuation (HR 1.59) has clinical implications for patient monitoring and support strategies. The low overall attrition rate (5% by Year 4) is notable and may reflect the effectiveness of cannabis therapy in this population, though it could also reflect selection bias inherent in an observational design. Regarding safety, serious adverse events were rare: one case of psychosis necessitating cannabis discontinuation and one unrelated death over 964 patient-years of follow-up. This adverse event profile compares favorably with long-term opioid therapy, where rates of opioid use disorder range from 8% to 12% and overdose mortality remains a significant concern [2,3].
4.1. Strengths and Limitations
Strengths include the four-year follow-up duration, comprehensive dosing documentation (route, frequency, THC/CBD content), high retention rate, and integration of both subjective and exploratory objective biomarkers.
Several important limitations must be acknowledged. First, the observational design without a control group precludes causal inference; observed improvements may partly reflect natural history, regression to the mean, placebo effects, or concurrent therapies. Second, the single-center setting may limit generalizability. Third, no a priori power calculation was performed, although post-hoc analysis confirmed adequate power (>99%) for the observed primary outcome changes [30]. Fourth, detailed physiotherapy types and exercise components were not systematically recorded. Fifth, BioWell GDV technology has limited validation as a clinical biomarker [15,16]. Sixth, individual patient adherence could not be objectively verified. Seventh, the aging demographics (mean age 49.3, range 18–88) introduce potential confounding [31]. Finally, certain exploratory analyses (network, clustering) should be interpreted as hypothesis-generating rather than confirmatory.
5. Conclusions
In this four-year observational study, inhaled cannabis therapy was associated with sustained, clinically meaningful reductions in pain intensity and disability in CLBP patients who had failed conventional treatments. BioWell GDV parameters showed modest discriminative ability as potential non-invasive biomarkers of pain status, warranting further validation. Fibromyalgia was identified as a predictor of treatment discontinuation in exploratory analysis. Importantly, these findings are associative and do not establish causation. Confirmation through randomized controlled trials with standardized cannabis formulations, larger multi-center cohorts, and validated biomarker protocols is needed to establish the role of cannabis therapy in long-term CLBP management.
Supplementary Materials
The following supporting information can be downloaded at the website of this paper posted on Preprints.org.
Author Contributions
Conceptualization, D.R. and M.Y.; methodology, D.R. and M.K.; formal analysis, D.R. and H.M.; investigation, M.K., N.K. and W.A.R.; data curation, H.M.; writing—original draft preparation, D.R.; writing—review and editing, M.K., E.L. and M.Y.; supervision, M.Y. and E.L. All authors have read and agreed to the published version of the manuscript.
Funding
This research received no external funding.
Institutional Review Board Statement
The study was conducted in accordance with the Declaration of Helsinki, and approved by the Institutional Review Board of Rabin Medical Center (protocols 0634-25-RMC and 807-21-RMC).
Informed Consent Statement
Informed consent was obtained from all subjects involved in the study.
Data Availability Statement
The data presented in this study are available on request from the corresponding author due to patient privacy.
Conflicts of Interest
The authors declare no conflicts of interest.
Abbreviations
The following abbreviations are used in this manuscript:
| Abbreviation | Definition |
| BID | Twice daily |
| BMI | Body mass index |
| BPI | Brief Pain Inventory |
| CBD | Cannabidiol |
| CCA | Canonical Correlation Analysis |
| CI | Confidence interval |
| CLBP | Chronic low back pain |
| GDV | Gas Discharge Visualization |
| HR | Hazard ratio |
| IMCA | Israeli Medical Cannabis Agency |
| MOH | Ministry of Health |
| NRS | Numeric Rating Scale |
| ODI | Oswestry Disability Index |
| PCA | Principal Component Analysis |
| PROM | Patient-reported outcome measure |
| Q4H | Every 4 hours |
| QID | Four times daily |
| ROC | Receiver Operating Characteristic |
| SEM | Structural Equation Modeling |
| THC | Tetrahydrocannabinol |
References
- Hoy, D.; Bain, C.; Williams, G.; March, L.; Brooks, P.; Blyth, F.; Woolf, A.; Vos, T.; Buchbinder, R. A Systematic Review of the Global Prevalence of Low Back Pain. Arthritis Rheum. 2012, 64, 2028–2037. [CrossRef]
- Volkow, N.D.; McLellan, A.T. Opioid Abuse in Chronic Pain—Misconceptions and Mitigation Strategies. N. Engl. J. Med. 2016, 374, 1253–1263. [CrossRef]
- Dowell, D.; Haegerich, T.M.; Chou, R. CDC Guideline for Prescribing Opioids for Chronic Pain—United States, 2016. MMWR Recomm. Rep. 2016, 65, 1–49.
- Whiting, P.F.; Wolff, R.F.; Deshpande, S.; Di Nisio, M.; Duffy, S.; Hernandez, A.V.; Keurentjes, J.C.; Lang, S.; Misso, K.; Ryder, S.; et al. Cannabinoids for Medical Use: A Systematic Review and Meta-analysis. JAMA 2015, 313, 2456–2473.
- National Academies of Sciences, Engineering, and Medicine. The Health Effects of Cannabis and Cannabinoids; The National Academies Press: Washington, DC, USA, 2017.
- Campbell, G.; Hall, W.D.; Peacock, A.; Lintzeris, N.; Bruno, R.; Larance, B.; Nielsen, S.; Cohen, M.; Chan, G.; Mattick, R.P.; et al. Effect of Cannabis Use in People with Chronic Noncancer Pain Prescribed Opioids. Lancet Public Health 2018, 3, e341–e350.
- Stockings, E.; Campbell, G.; Hall, W.D.; Nielsen, S.; Zagic, D.; Rahman, R.; Murnion, B.; Farrell, M.; Weier, M.; Degenhardt, L. Cannabis and Cannabinoids for the Treatment of People with Chronic Noncancer Pain Conditions. Pain 2018, 159, 1932–1954. [CrossRef]
- Aviram, J.; Lewitus, G.M.; Vysotski, Y.; Uribayev, A.; Procaccia, S.; Cohen, I.; Leibovici, A.; Abo-Amna, M.; Akria, L.; Goncharov, D.; et al. Medical Cannabis Treatment for Chronic Pain: Outcomes and Prediction of Response. Eur. J. Pain 2021, 25, 359–374.
- Korotkov, K.; Williams, B.; Wisneski, L.A. Assessing Biophysical Energy Transfer Mechanisms in Living Systems. J. Altern. Complement. Med. 2004, 10, 49–57.
- Cifra, M.; Pospíšil, P. Ultra-Weak Photon Emission from Biological Systems. J. Photochem. Photobiol. B 2014, 139, 2–10.
- Kobayashi, M. Highly Sensitive Imaging for Ultra-Weak Photon Emission from Living Organisms. J. Photochem. Photobiol. B 2014, 139, 34–38.
- Van Wijk, R.; Van Wijk, E.P.A. An Introduction to Human Biophoton Emission. Forsch. Komplementarmed. Klass. Naturheilkd. 2005, 12, 77–83.
- Williams, D.; Yakovleva, E. Electrophotonic Imaging as a Diagnostic Tool. Complement. Ther. Clin. Pract. 2024, 54, 101802.
- Bundzen, P.V.; Korotkov, K.G.; Unestahl, L.E. Altered States of Consciousness: Review of Experimental Data. J. Altern. Complement. Med. 2002, 8, 153–165. [CrossRef]
- Smith, J.; Patel, R.; Kumar, A. Critical Evaluation of Gas Discharge Visualization in Clinical Settings. J. Integr. Med. 2025, 23, 45–52.
- Chouhan, S.; Singh, R.; Verma, P. Cross-Cultural Validation of GDV Bioelectrographic Metrics. Int. J. Biophotonics 2024, 17, 45–53.
- Hawker, G.A.; Mian, S.; Kendzerska, T.; French, M. Measures of Adult Pain. Arthritis Care Res. 2011, 63, S240–S252. [CrossRef]
- Fairbank, J.C.T.; Pynsent, P.B. The Oswestry Disability Index. Spine 2000, 25, 2940–2953.
- Hanley, J.A.; McNeil, B.J. The Meaning and Use of the Area Under a Receiver Operating Characteristic (ROC) Curve. Radiology 1982, 143, 29–36.
- Kaplan, E.L.; Meier, P. Nonparametric Estimation from Incomplete Observations. J. Am. Stat. Assoc. 1958, 53, 457–481.
- Cox, D.R. Regression Models and Life-Tables. J. R. Stat. Soc. Ser. B 1972, 34, 187–220.
- Ghaffari, A.; Rostami, H.R.; Emami Razavi, S.Z. Age and Sex Differences in GDV Bioelectrography Parameters. J. Psychophysiol. 2020, 34, 123–130.
- Craft, R.M.; Mogil, J.S.; Aloisi, A.M. Sex Differences in Pain and Analgesia. Eur. J. Pain 2004, 8, 397–411. [CrossRef]
- Riley, J.L., III; Robinson, M.E.; Wise, E.A.; Myers, C.D.; Fillingim, R.B. Sex Differences in the Perception of Noxious Experimental Stimuli. Pain 1998, 74, 181–187.
- Vyas, M.B.; LeBaron, V.T.; Bhatt, A.S.; Gilbertson-White, S. The Role of Demographics and Individual Differences in Chronic Pain Outcomes. Pain Med. 2019, 20, 897–905.
- Abrams, D.I.; Couey, P.; Shade, S.B.; Kelly, M.E.; Benowitz, N.L. Cannabinoid–Opioid Interaction in Chronic Pain. Clin. Pharmacol. Ther. 2011, 90, 844–851. [CrossRef]
- Lynch, M.E.; Campbell, F. Cannabinoids for Treatment of Chronic Non-Cancer Pain. Br. J. Clin. Pharmacol. 2011, 72, 735–744.
- Fishbain, D.A.; Cutler, R.; Rosomoff, H.L.; Rosomoff, R.S. Chronic Pain-Associated Depression. Clin. J. Pain 1997, 13, 116–137.
- Wolfe, F.; Smythe, H.A.; Yunus, M.B.; Bennett, R.M.; Bombardier, C.; Goldenberg, D.L.; Tugwell, P.; Campbell, S.M.; Abeles, M.; Clark, P.; et al. The American College of Rheumatology 1990 Criteria for the Classification of Fibromyalgia. Arthritis Rheum. 1990, 33, 160–172.
- Cohen, J. Statistical Power Analysis for the Behavioral Sciences, 2nd ed.; Lawrence Erlbaum Associates: Hillsdale, NJ, USA, 1988.
- Degenhardt, L.; Lintzeris, N.; Campbell, G.; Bruno, R.; Cohen, M.; Farrell, M.; Hall, W.D. Experience of Adjunctive Cannabis Use for Chronic Non-Cancer Pain. Drug Alcohol Depend. 2015, 147, 144–150. [CrossRef]
- Yassin, M.; Robinson, D.; Khatib, M.; Murad, H.; Qawasme, F.; Lavon, E. Ultra-Weak Photon Emission Demonstrates Specificity for Anxiety over Pain in Cannabis-Treated Chronic Neuropathic Pain. Bioengineering 2025, 12, 1359.
- Robinson, D.; Khatib, M.; Eissa, M.; Yassin, M. Long-Term Cannabis Therapy for Chronic Low Back Pain: A 10-Year Prospective Study. Integr. Med. Rep. 2025, 4, 116–123.
- Robinson, D.; Khatib, M.; Lavon, E.; Kafri, N.; Abu Rashed, W.; Yassin, M. Long-Term Efficacy and Safety of Inhaled Cannabis Therapy for Painful Diabetic Neuropathy: A 5-Year Study. Biomedicines 2025, 13, 2406.
- Yassin, M.; Oron, A.; Robinson, D. Effect of Adding Medical Cannabis to Analgesic Treatment in Patients with Low Back Pain Related to Fibromyalgia: An Observational Cross-Over Single Centre Study. Clin. Exp. Rheumatol. 2019, 37 (Suppl. 116), 13–20. [CrossRef]
- Robinson, D.; Ritter, S.; Yassin, M. Comparing Sublingual and Inhaled Cannabis Therapies for Low Back Pain: An Observational Open-Label Study. Rambam Maimonides Med. J. 2022, 13, e0028.
- Pud, D.; Aamar, S.; Schiff-Keren, B.; Sheinfeld, R.; Brill, S.; Robinson, D.; Fogelman, Y.; Habib, G.; Sharon, H.; Amital, H.; et al. Cannabis Oil Extracts for Chronic Pain: What Else Can Be Learned from Another Structured Prospective Cohort? Pain Rep. 2024, 9, e1143. [CrossRef]
Figure 1.
Study participant flow diagram. Of 256 screened patients, 241 were enrolled. Year 4 missing data (n = 12): technical failure (n = 5), lack of efficacy (n = 2), change of physician (n = 3), death (n = 1), psychosis (n = 1).
Figure 1.
Study participant flow diagram. Of 256 screened patients, 241 were enrolled. Year 4 missing data (n = 12): technical failure (n = 5), lack of efficacy (n = 2), change of physician (n = 3), death (n = 1), psychosis (n = 1).
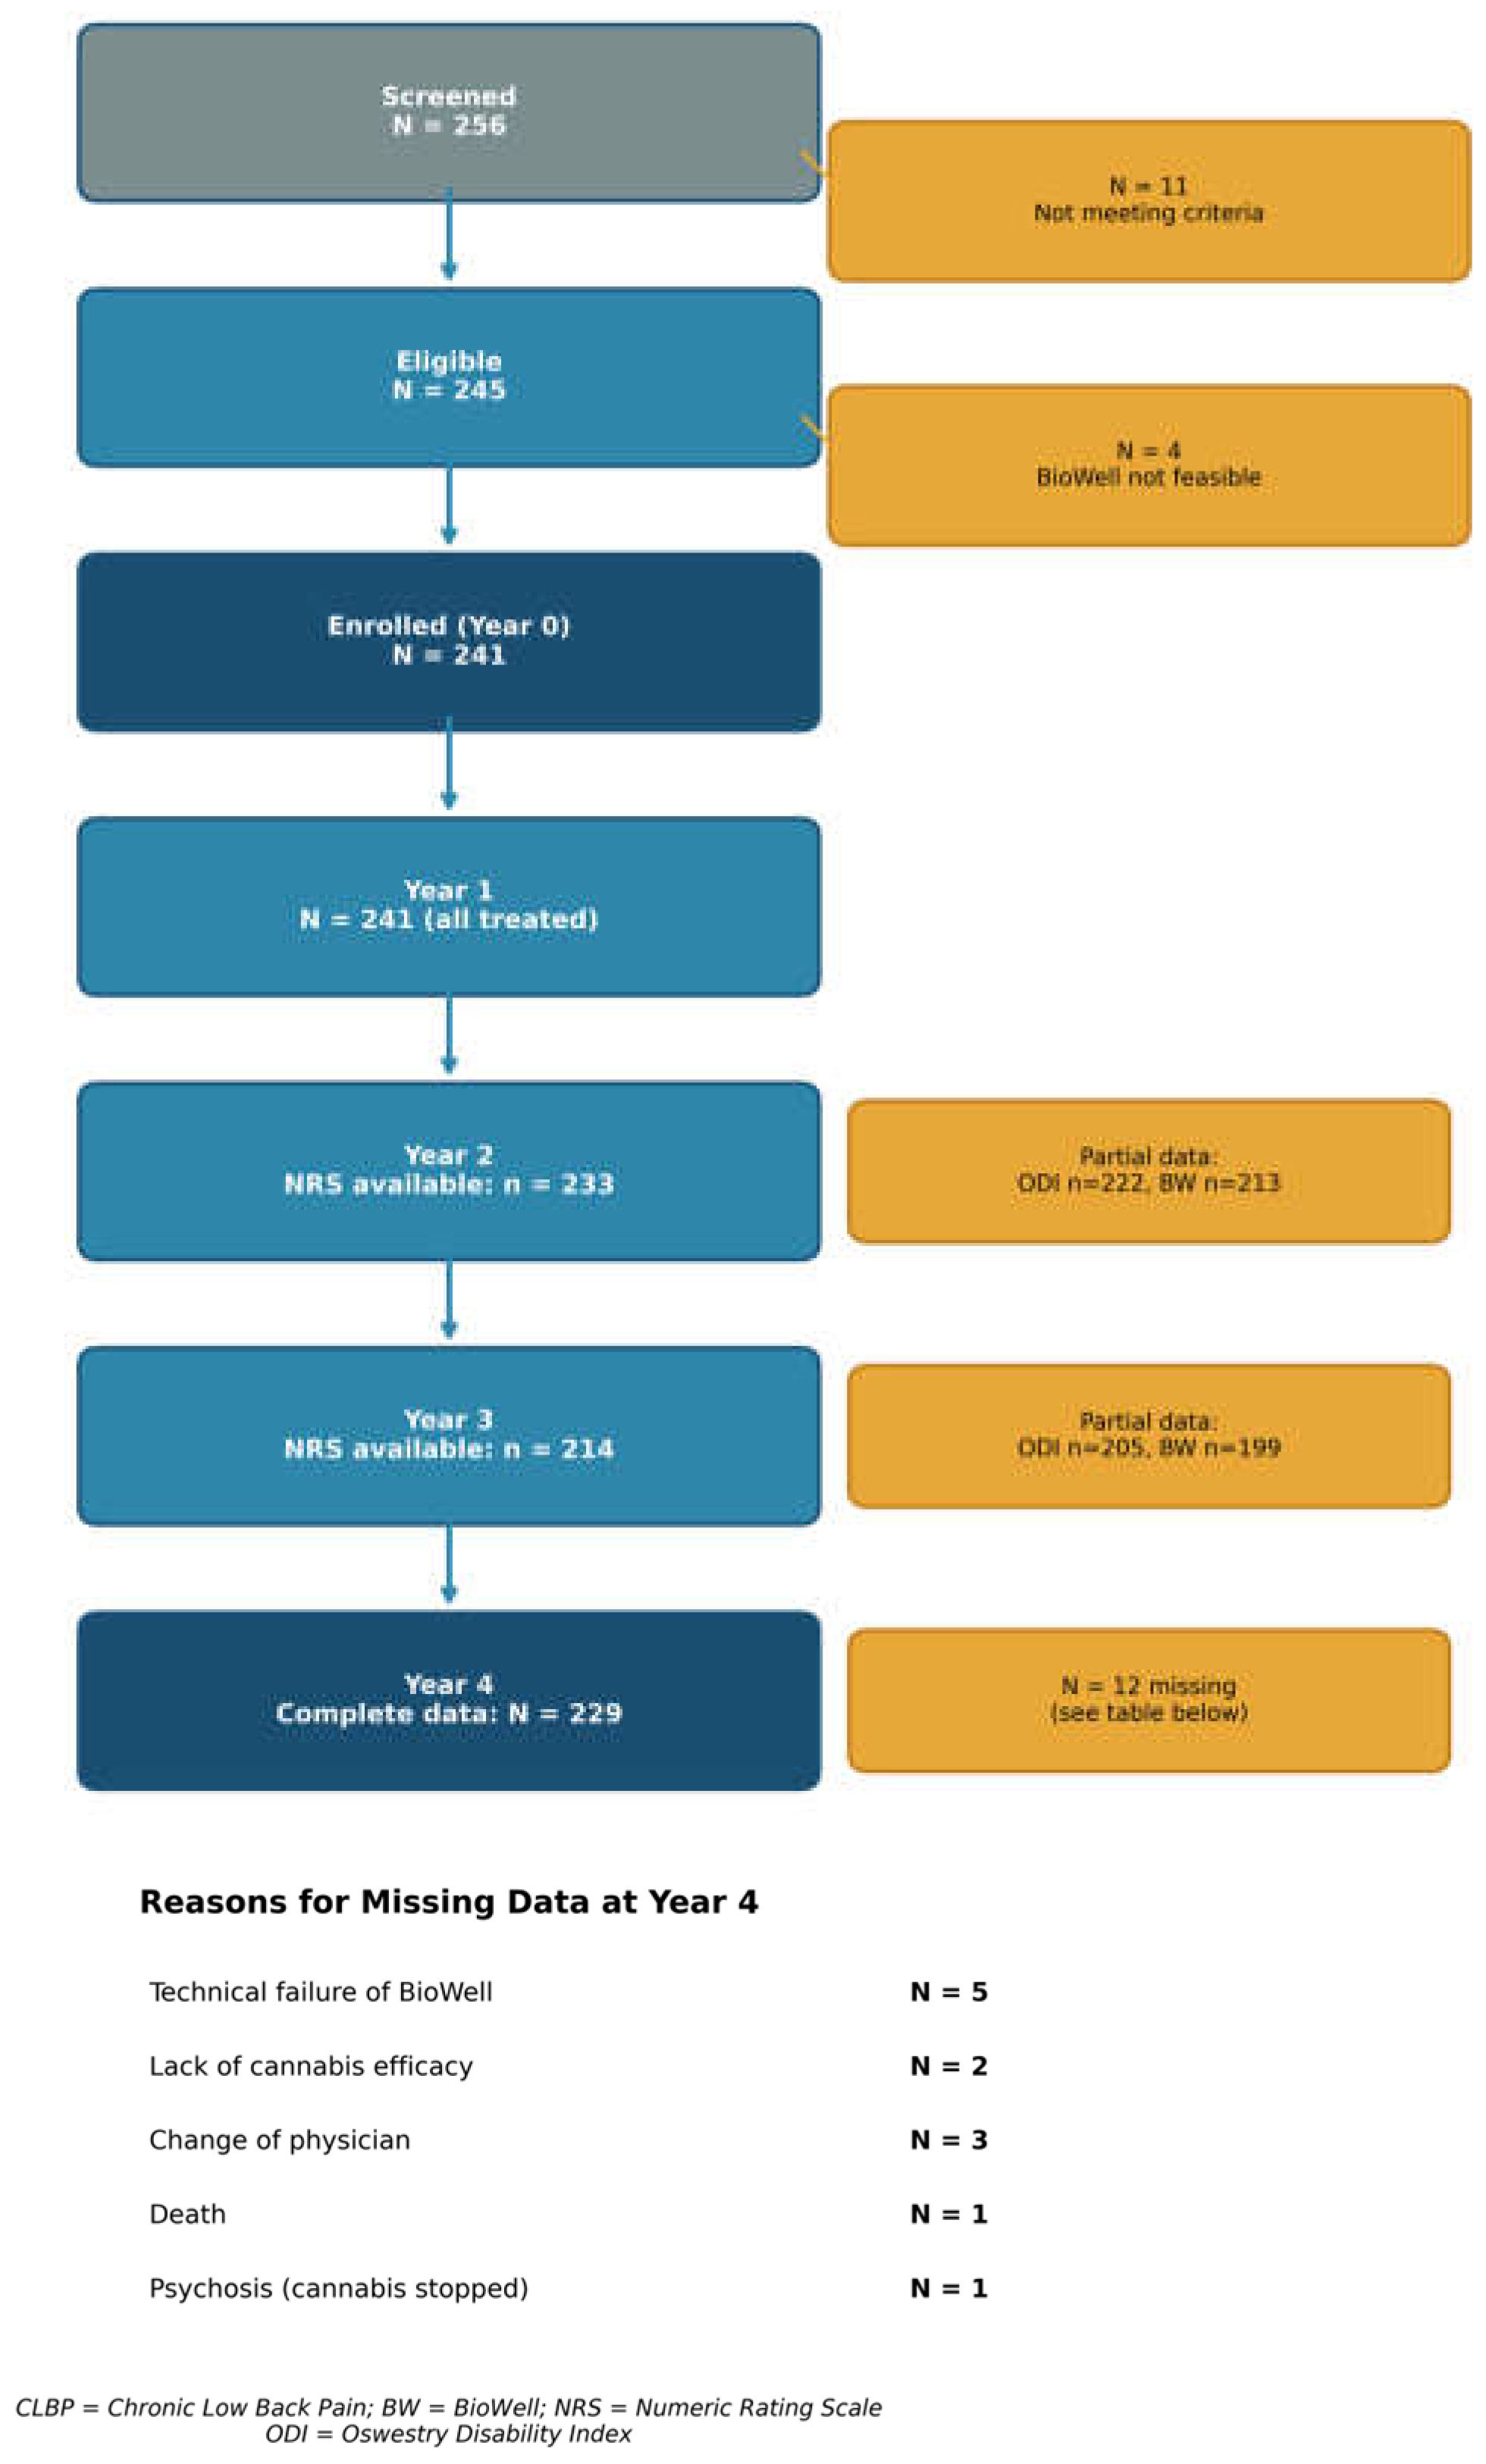
Figure 2.
Cannabis dosage distribution over four years (N = 1205 observations). (a) Monthly cannabis dosage; (b) monthly THC content; (c) monthly CBD content. Box plots show median, interquartile range, and outliers.
Figure 2.
Cannabis dosage distribution over four years (N = 1205 observations). (a) Monthly cannabis dosage; (b) monthly THC content; (c) monthly CBD content. Box plots show median, interquartile range, and outliers.
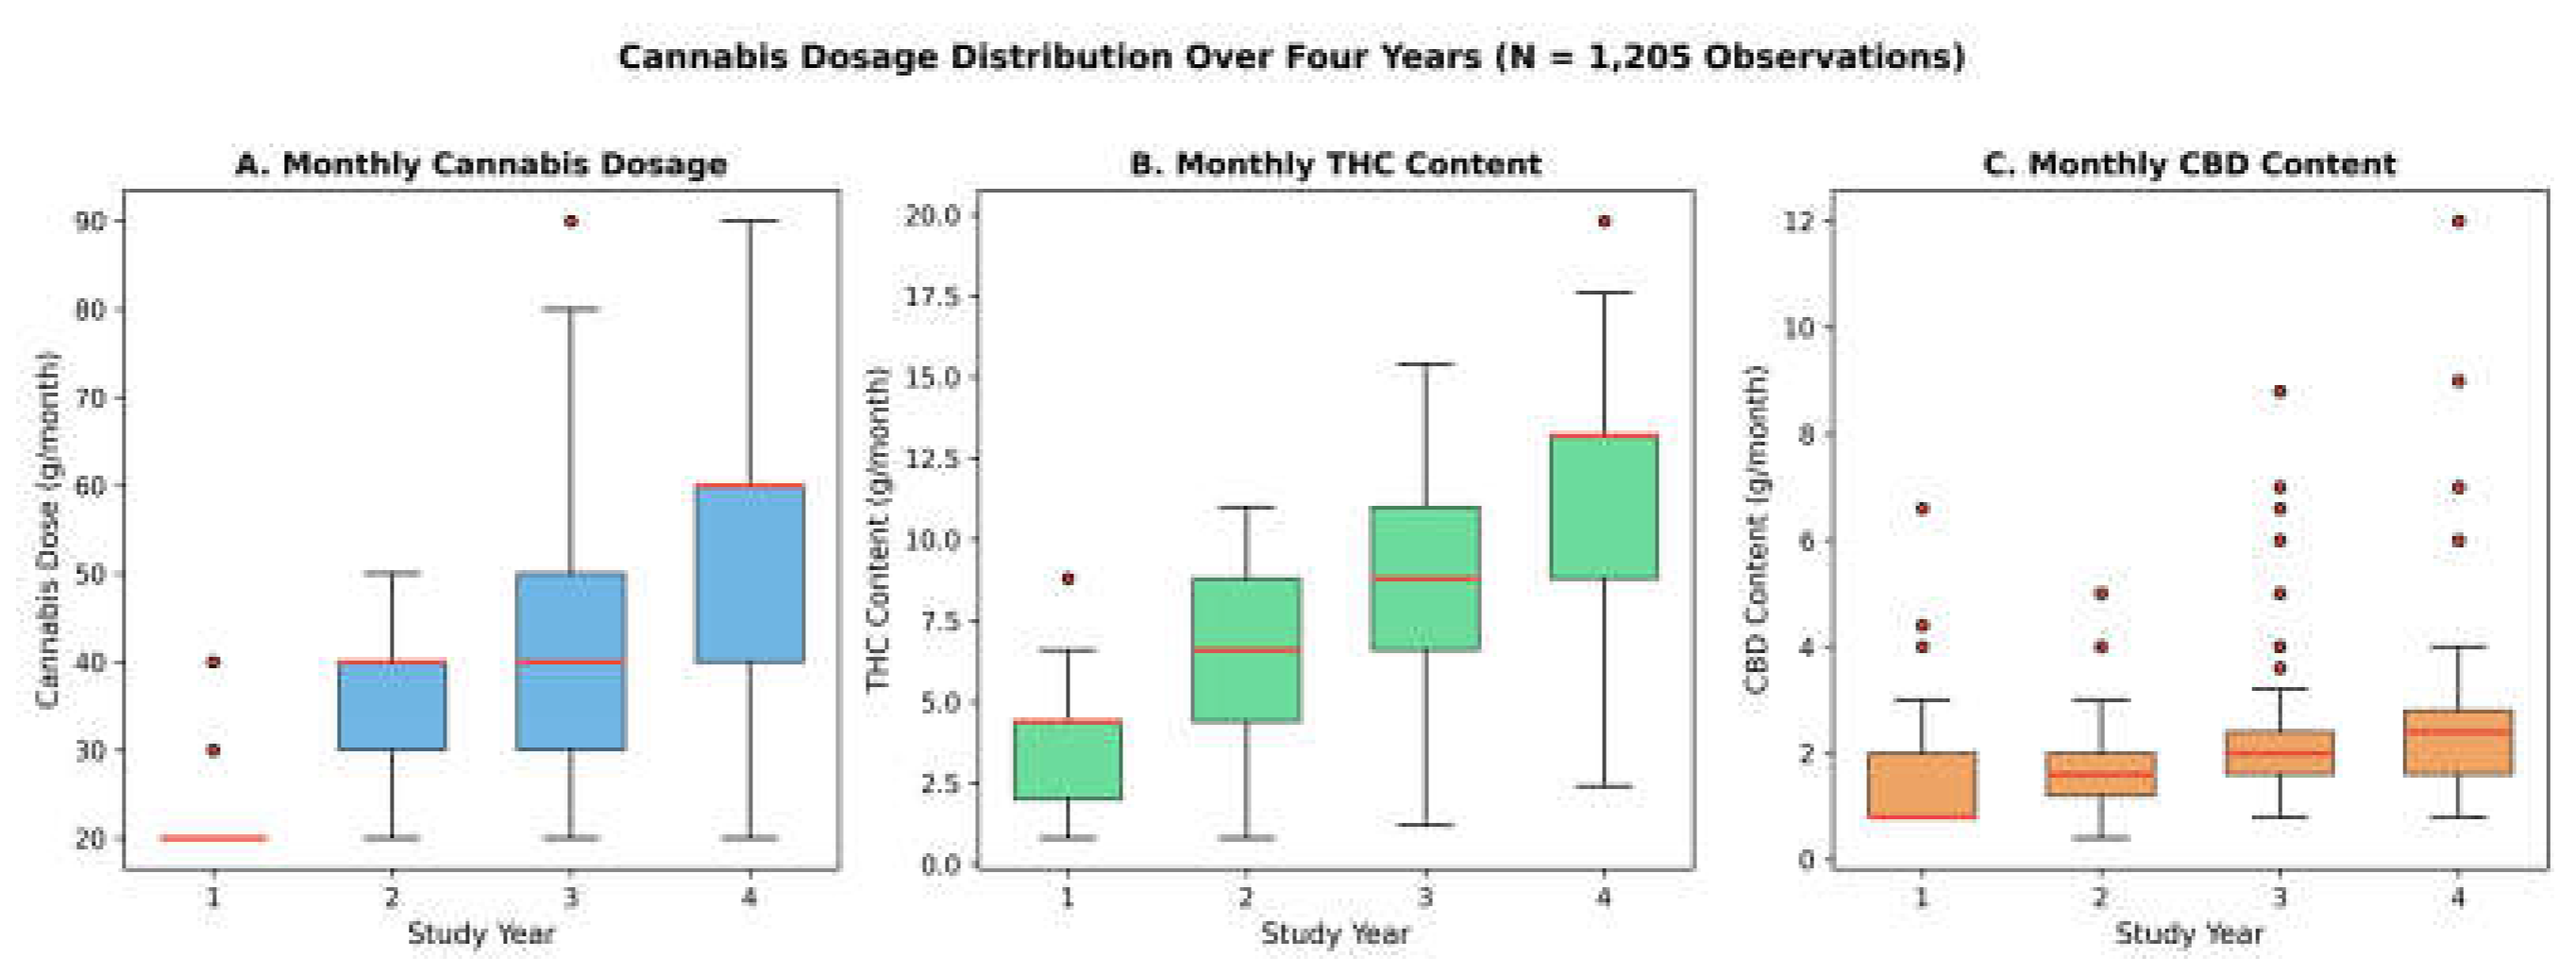
Figure 3.
Reasons for missing data at Year 4 and NRS data availability by study year. (a) Year 4 disposition (N = 241); (b) NRS data availability by year.
Figure 3.
Reasons for missing data at Year 4 and NRS data availability by study year. (a) Year 4 disposition (N = 241); (b) NRS data availability by year.
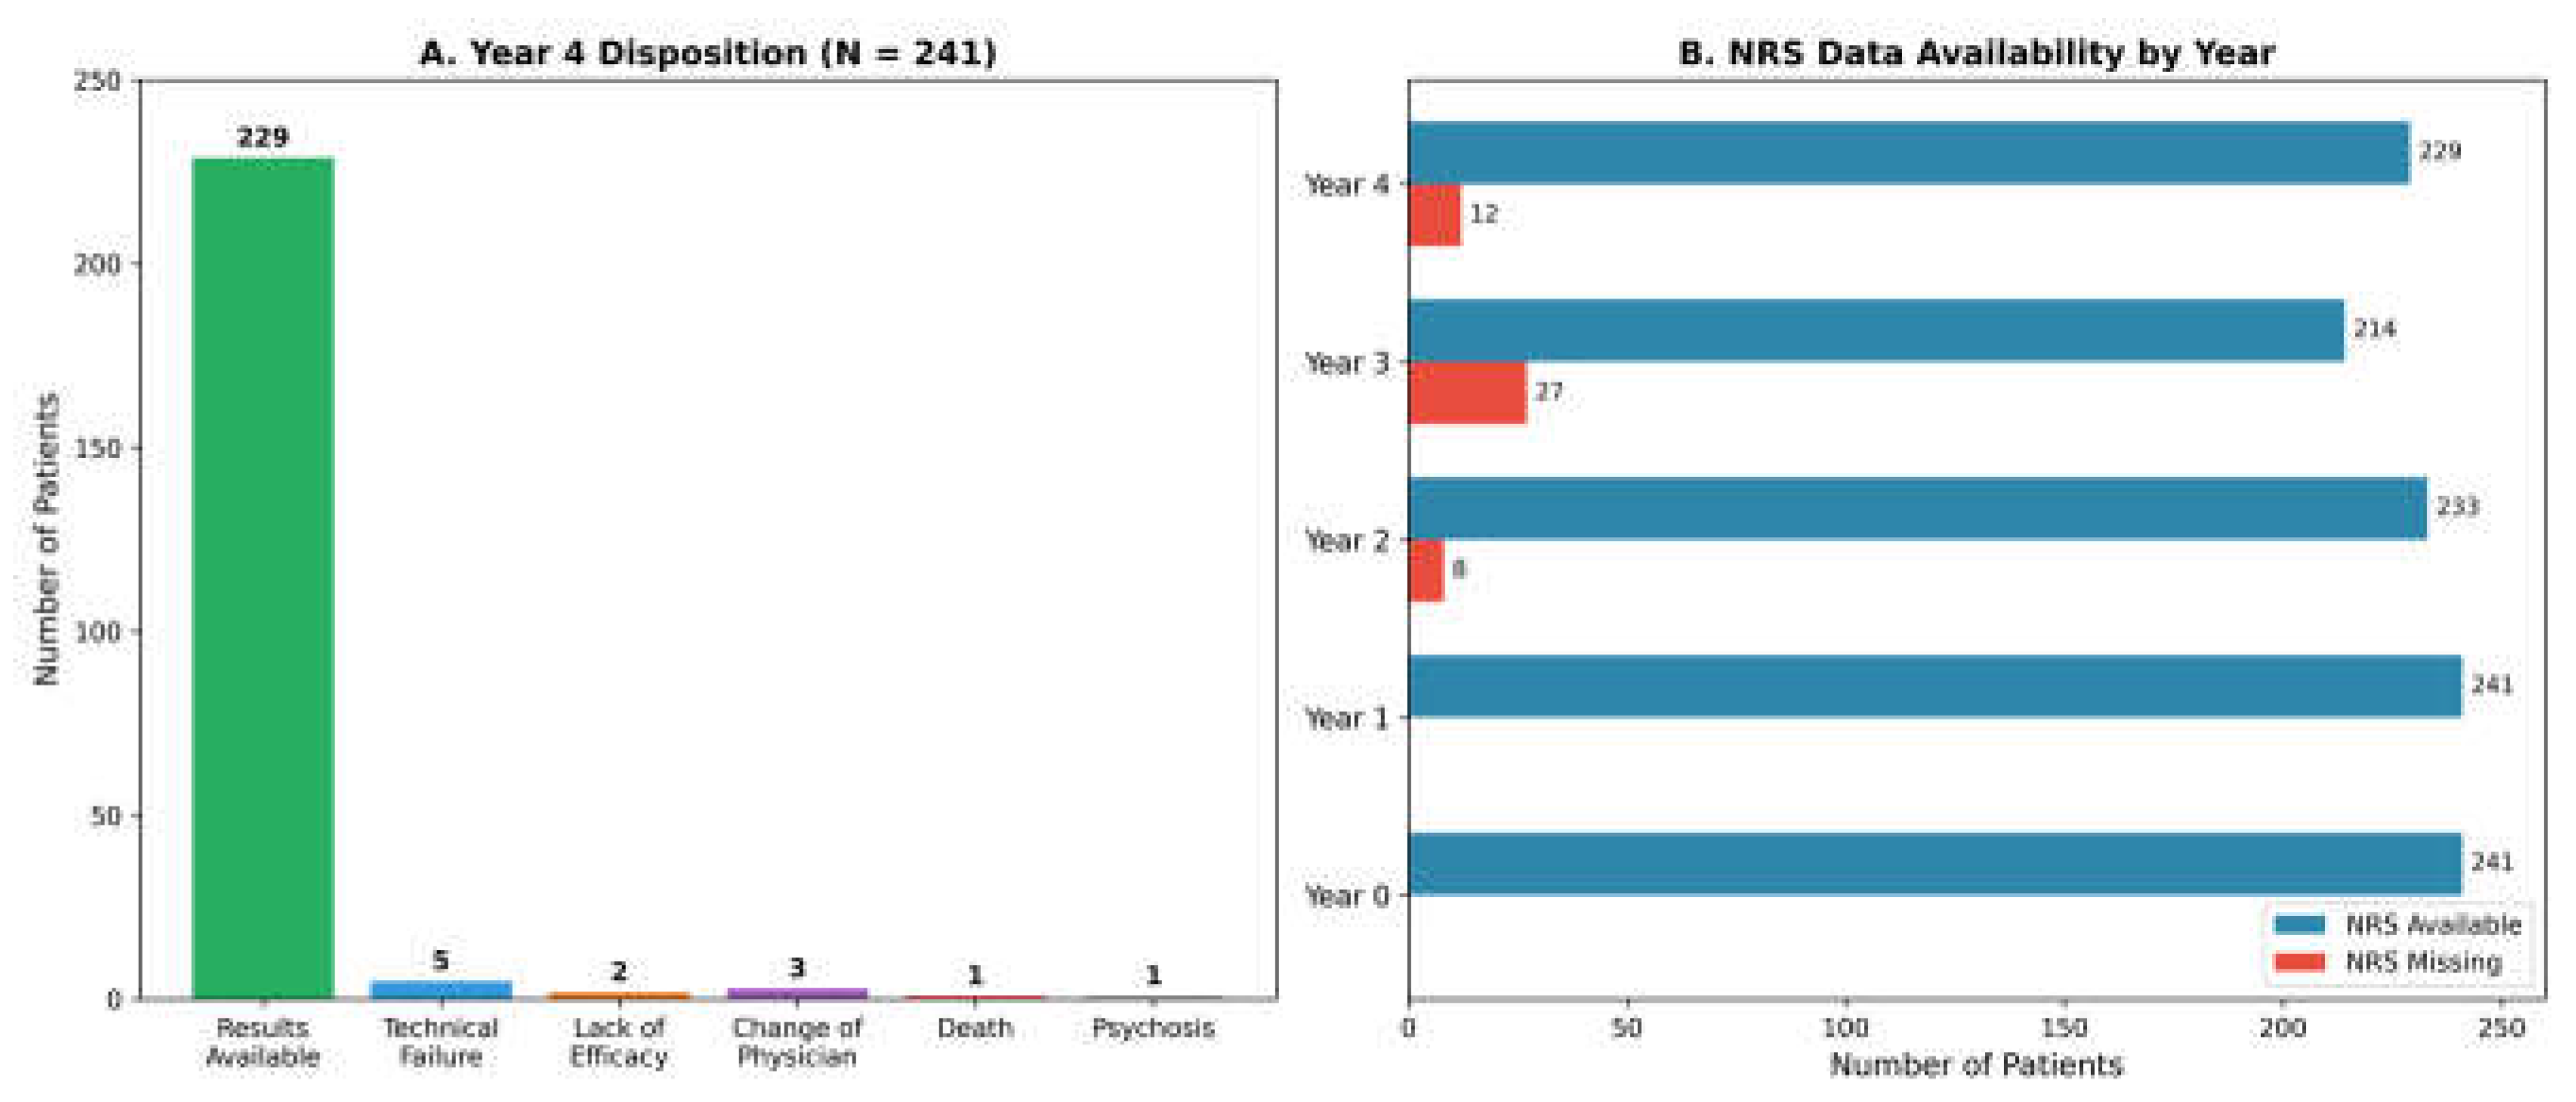
Figure 4.
Longitudinal trends in BioWell parameters over four years. (a) BioWell stress (0–10 scale); (b) BioWell vitality (0–100 scale). Data shown as mean ± 95% CI. n values indicated at each timepoint.
Figure 4.
Longitudinal trends in BioWell parameters over four years. (a) BioWell stress (0–10 scale); (b) BioWell vitality (0–100 scale). Data shown as mean ± 95% CI. n values indicated at each timepoint.
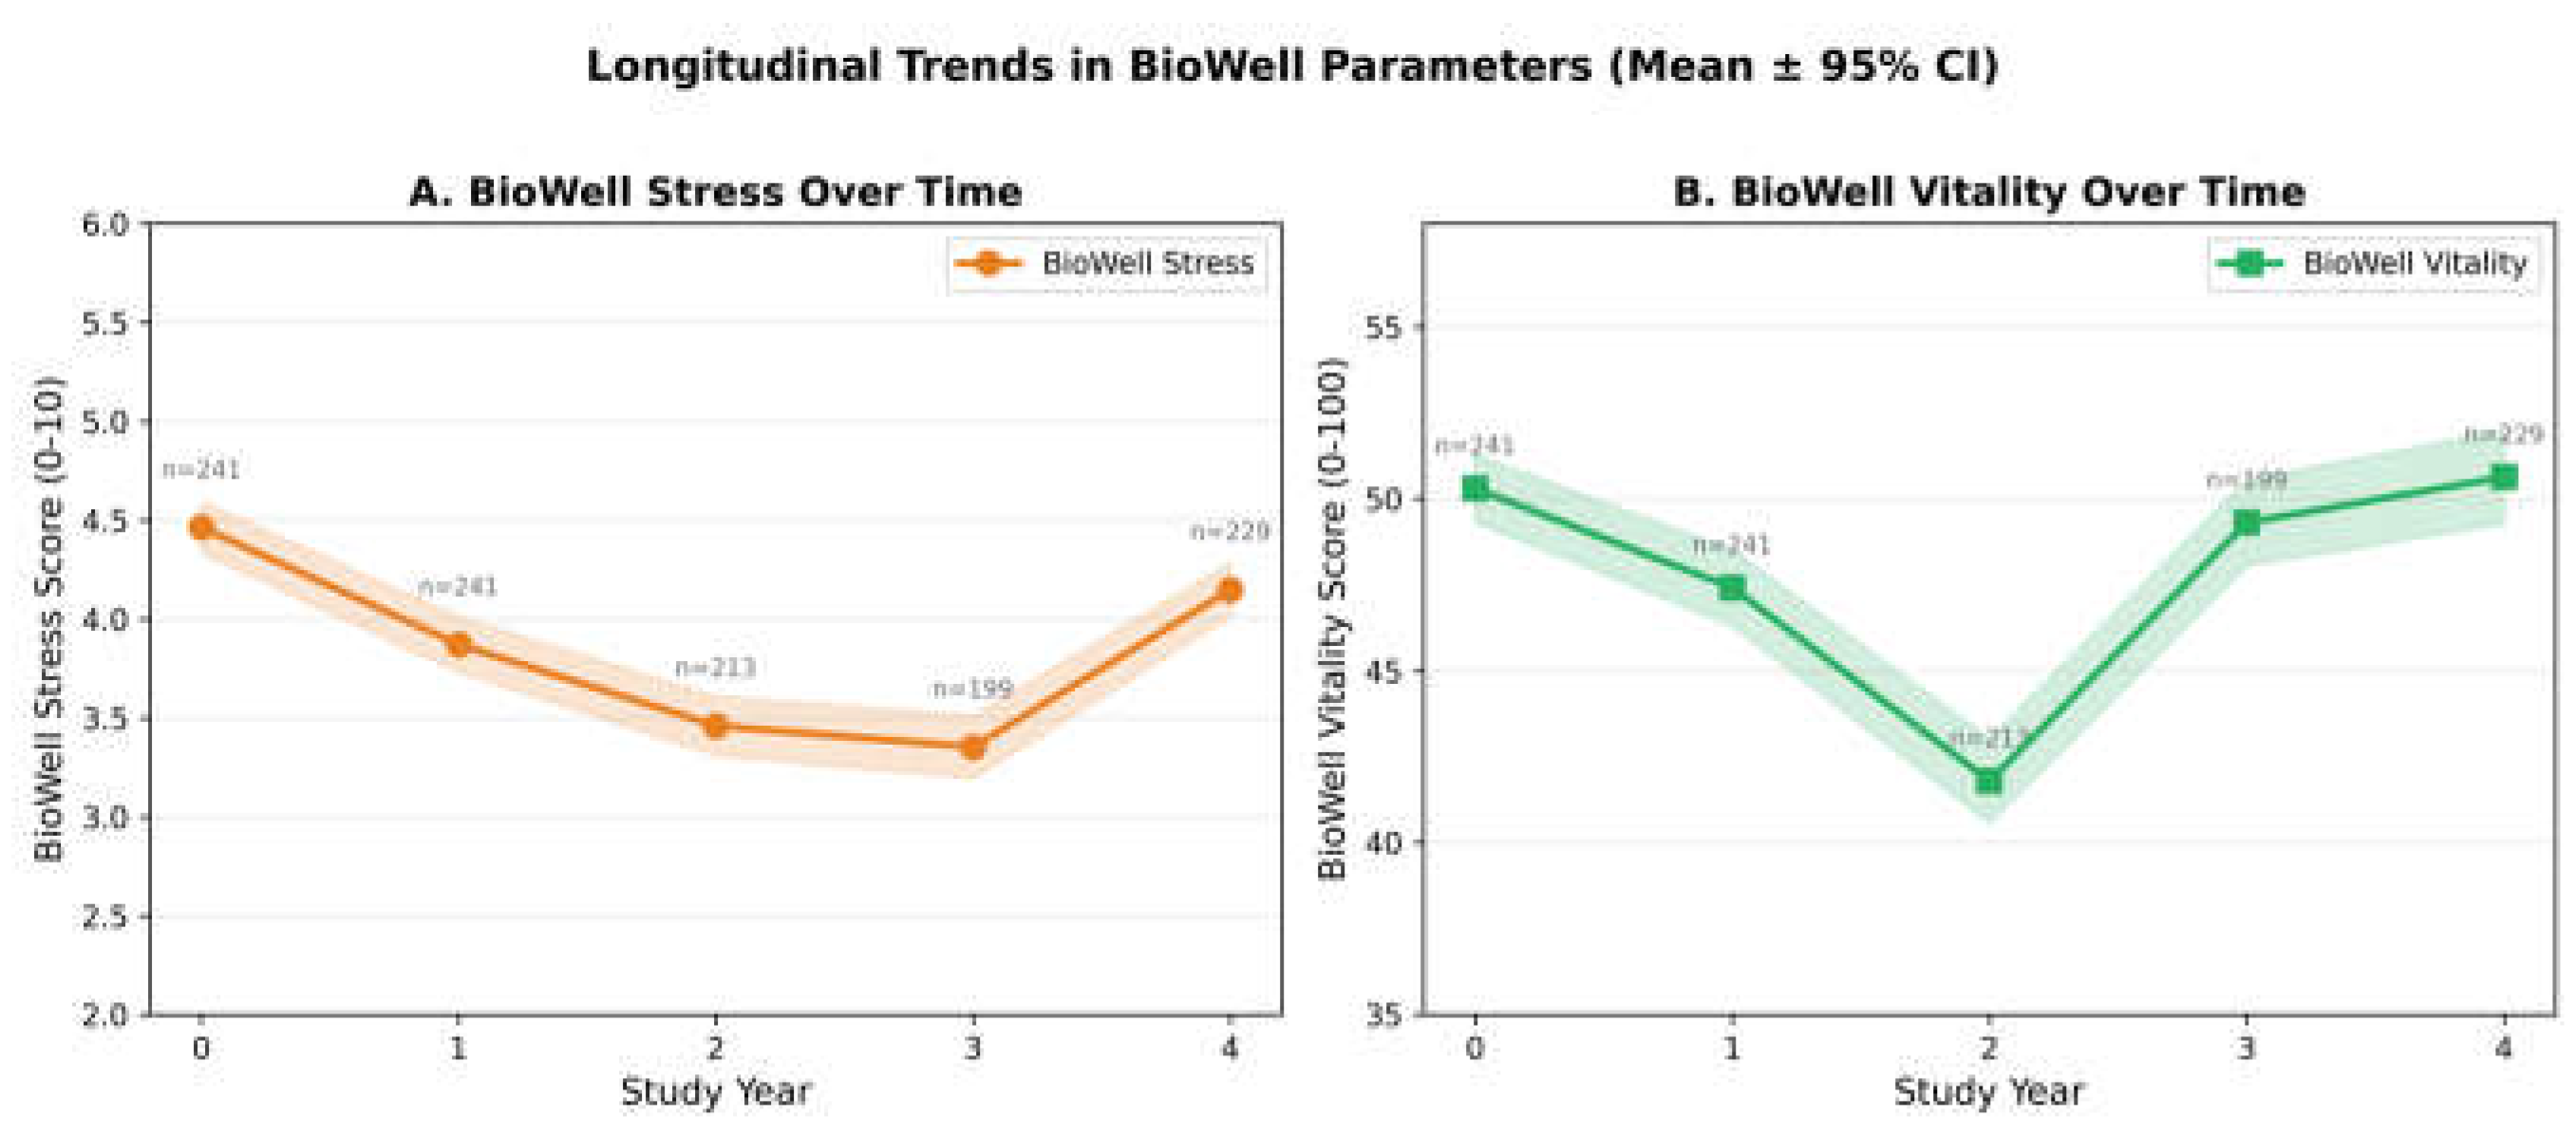
Figure 5.
Correlation networks of PROMs, BioWell parameters, fibromyalgia status, and BMI at baseline (N = 241). Bar charts show pairwise correlations; heatmap displays full correlation matrix.
Figure 5.
Correlation networks of PROMs, BioWell parameters, fibromyalgia status, and BMI at baseline (N = 241). Bar charts show pairwise correlations; heatmap displays full correlation matrix.
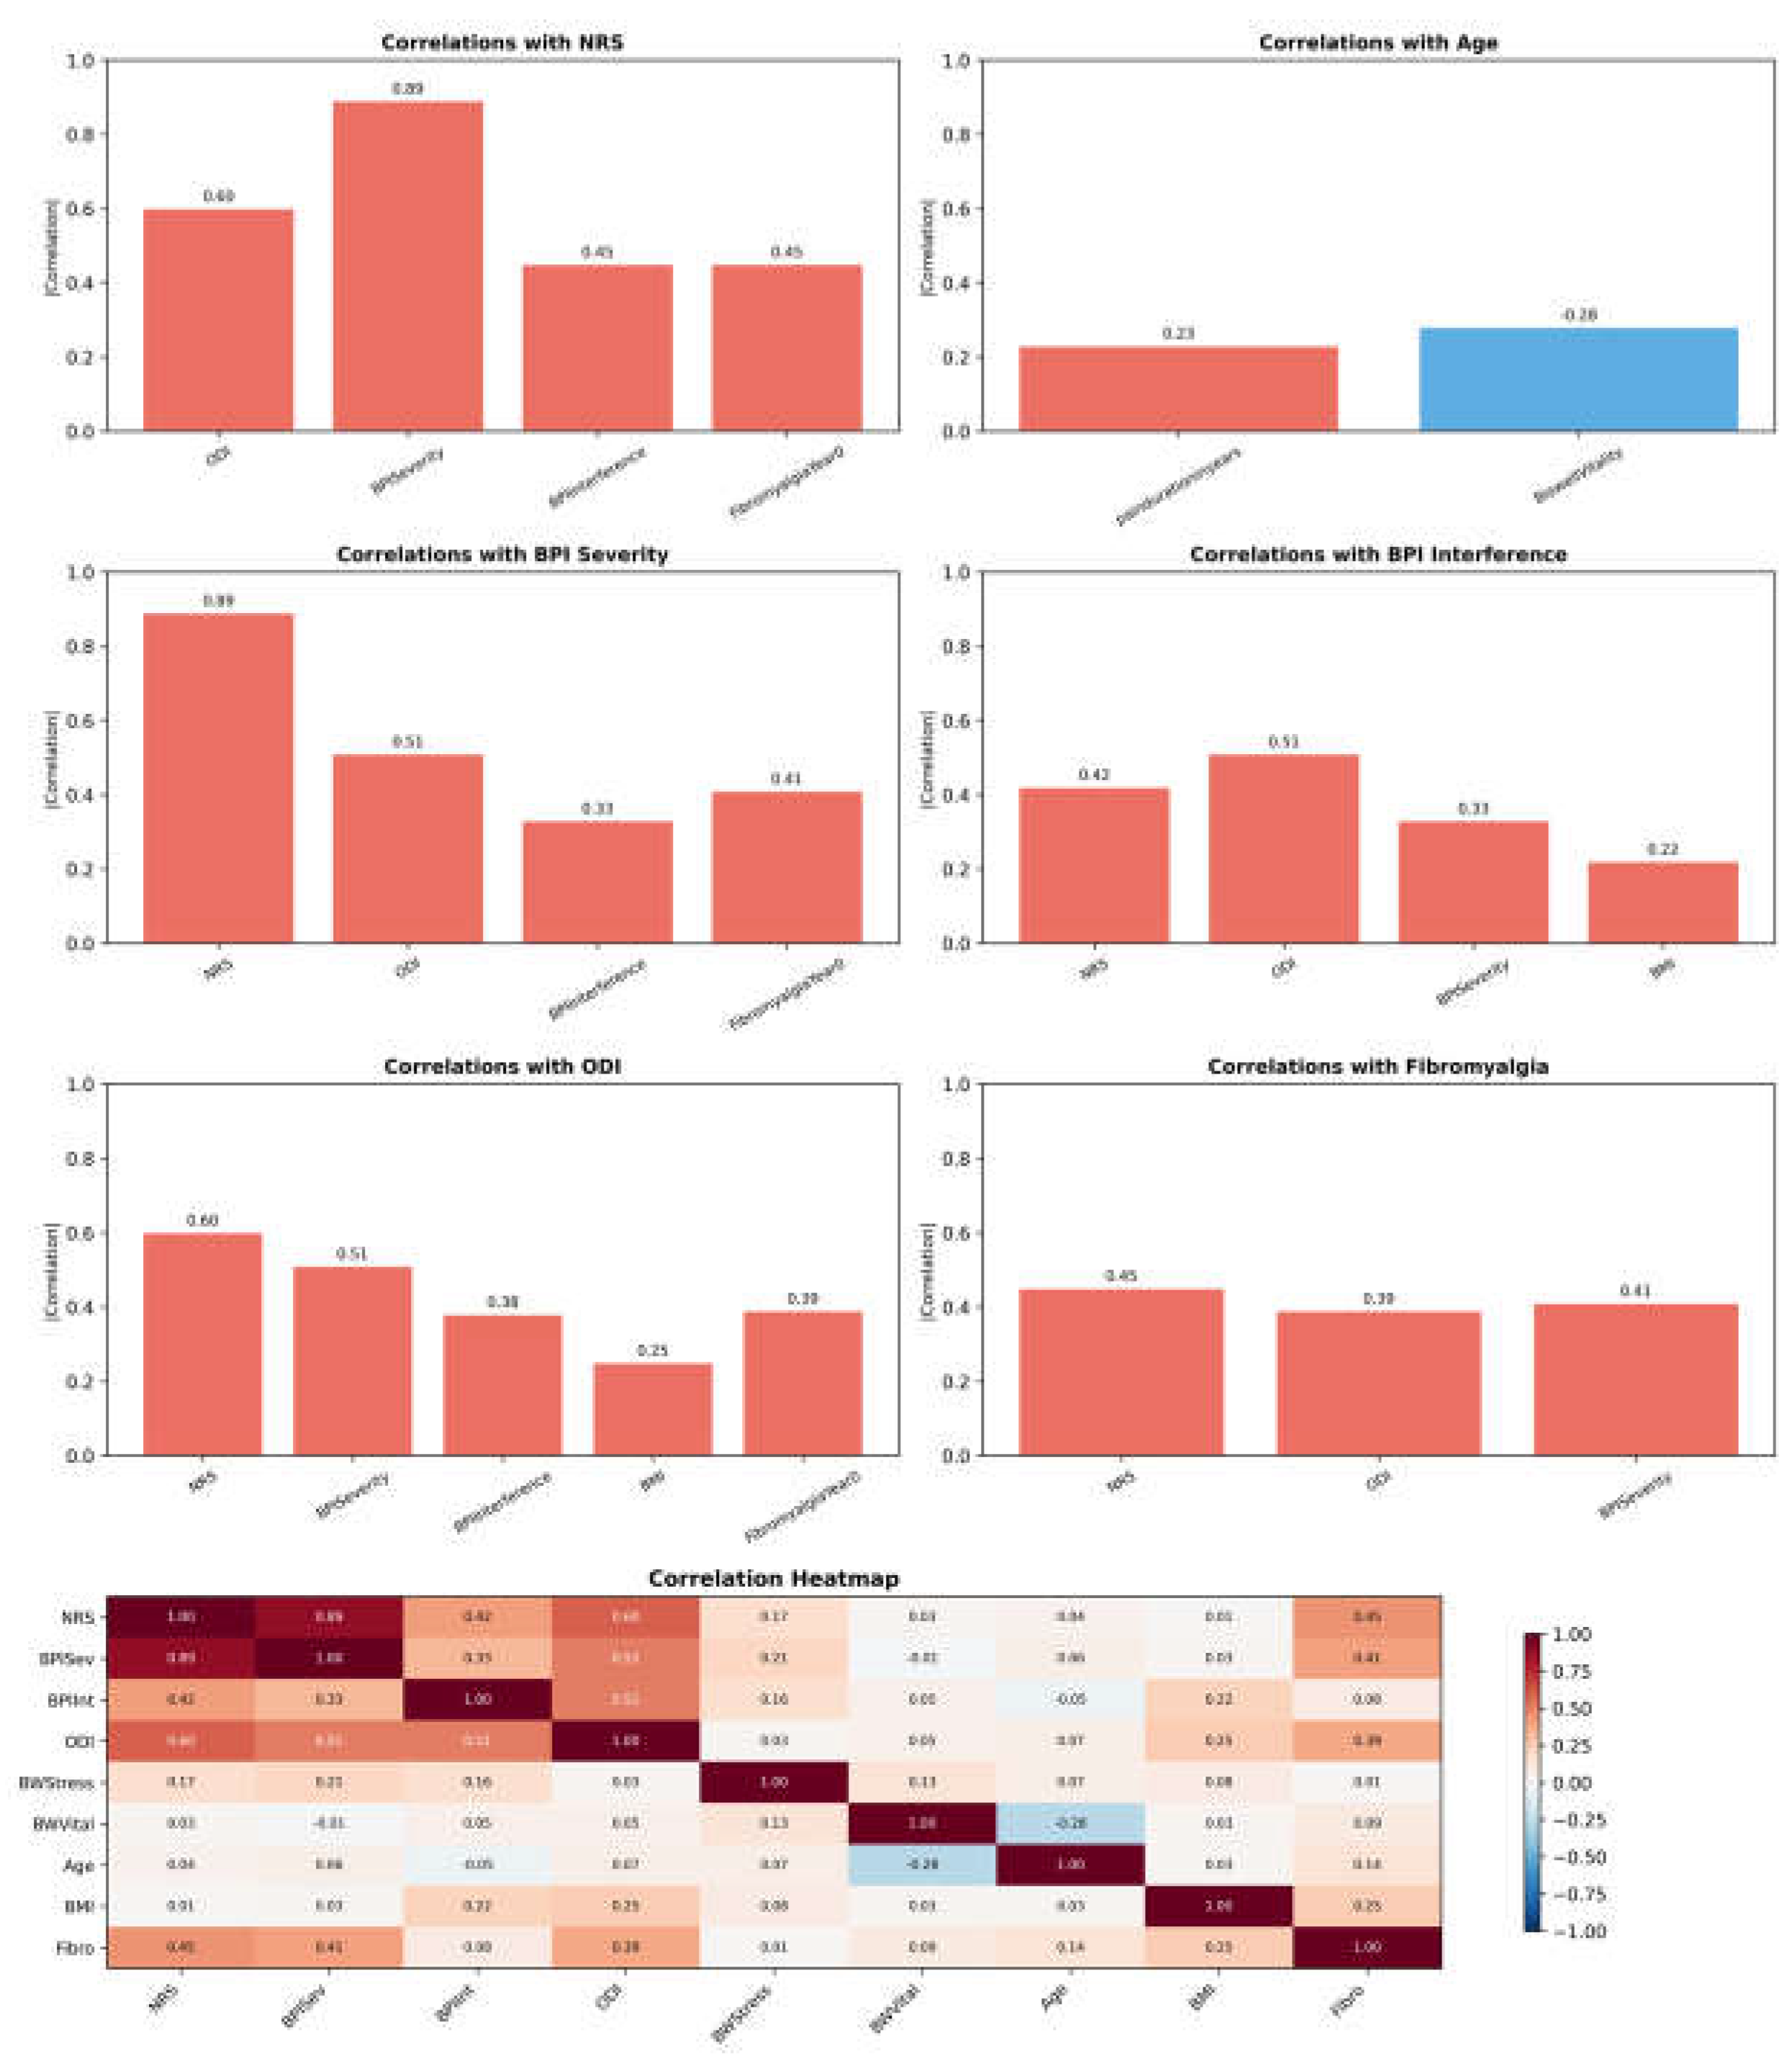
Figure 6.
Mean values of NRS, ODI, BioWell stress, and BioWell vitality by cluster (K-means, k = 5).
Figure 6.
Mean values of NRS, ODI, BioWell stress, and BioWell vitality by cluster (K-means, k = 5).
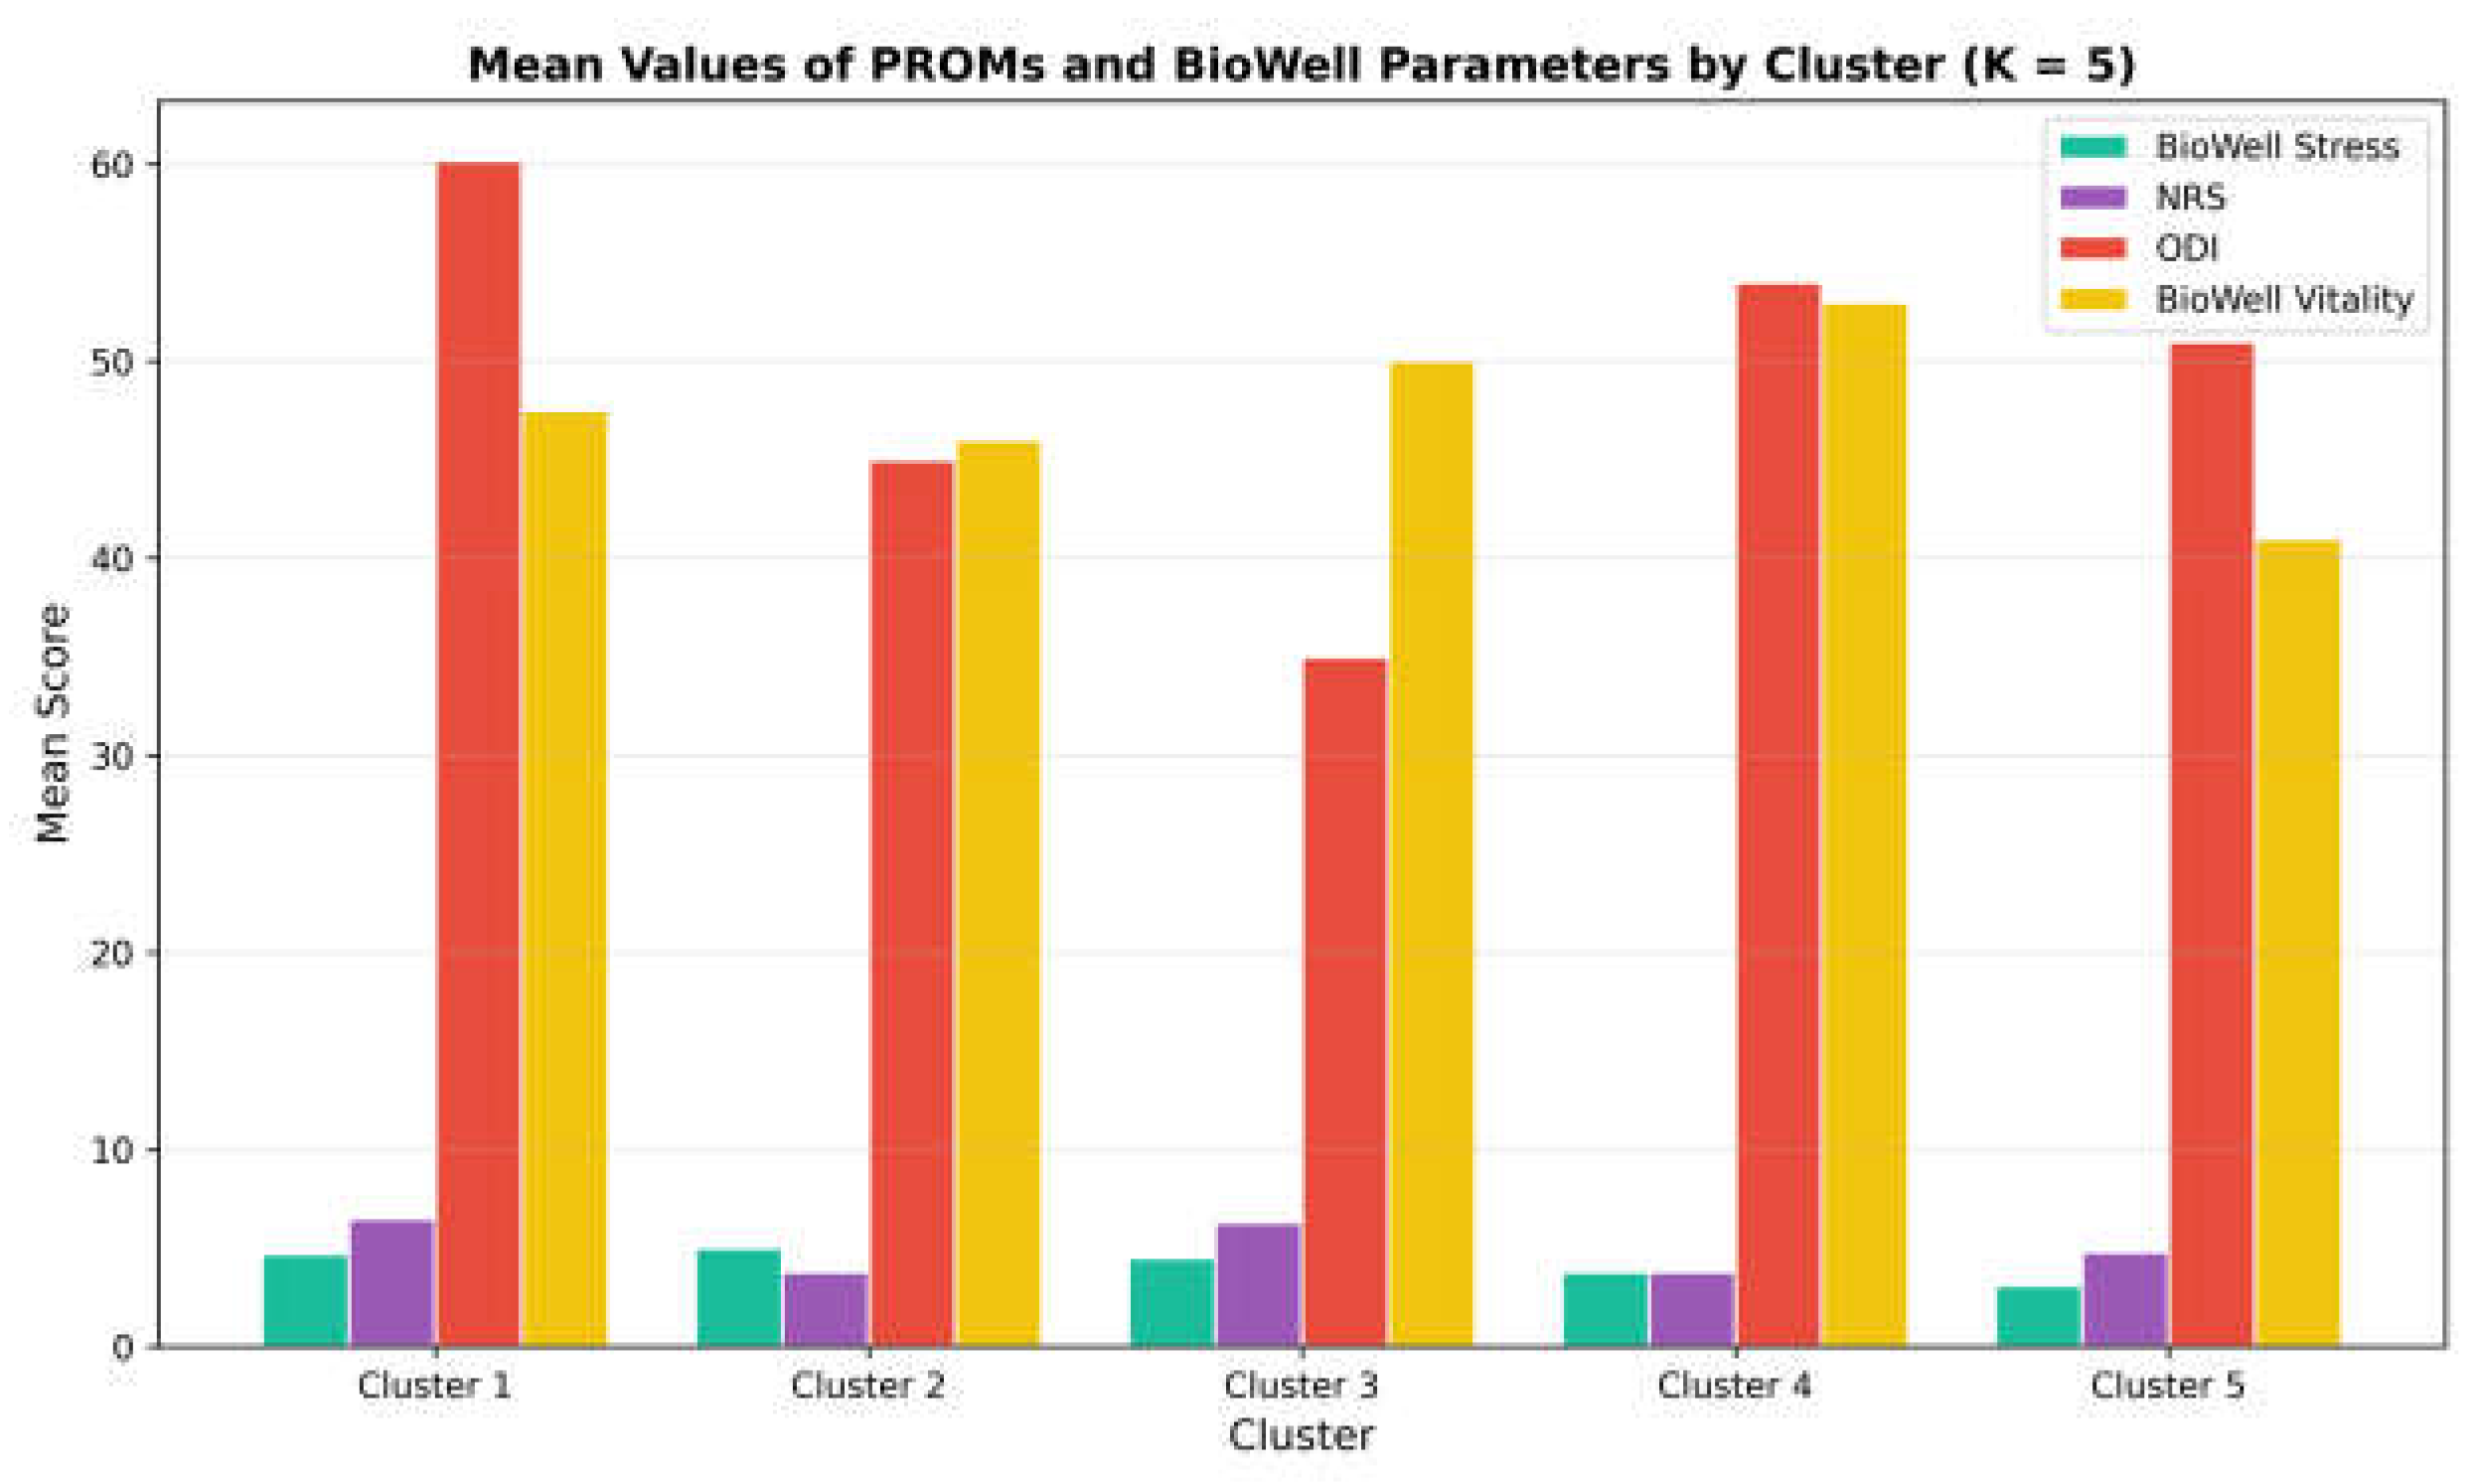
Figure 7.
K-means clustering of 241 patients projected onto two principal components (PCA). Convex hulls delineate cluster boundaries.
Figure 7.
K-means clustering of 241 patients projected onto two principal components (PCA). Convex hulls delineate cluster boundaries.
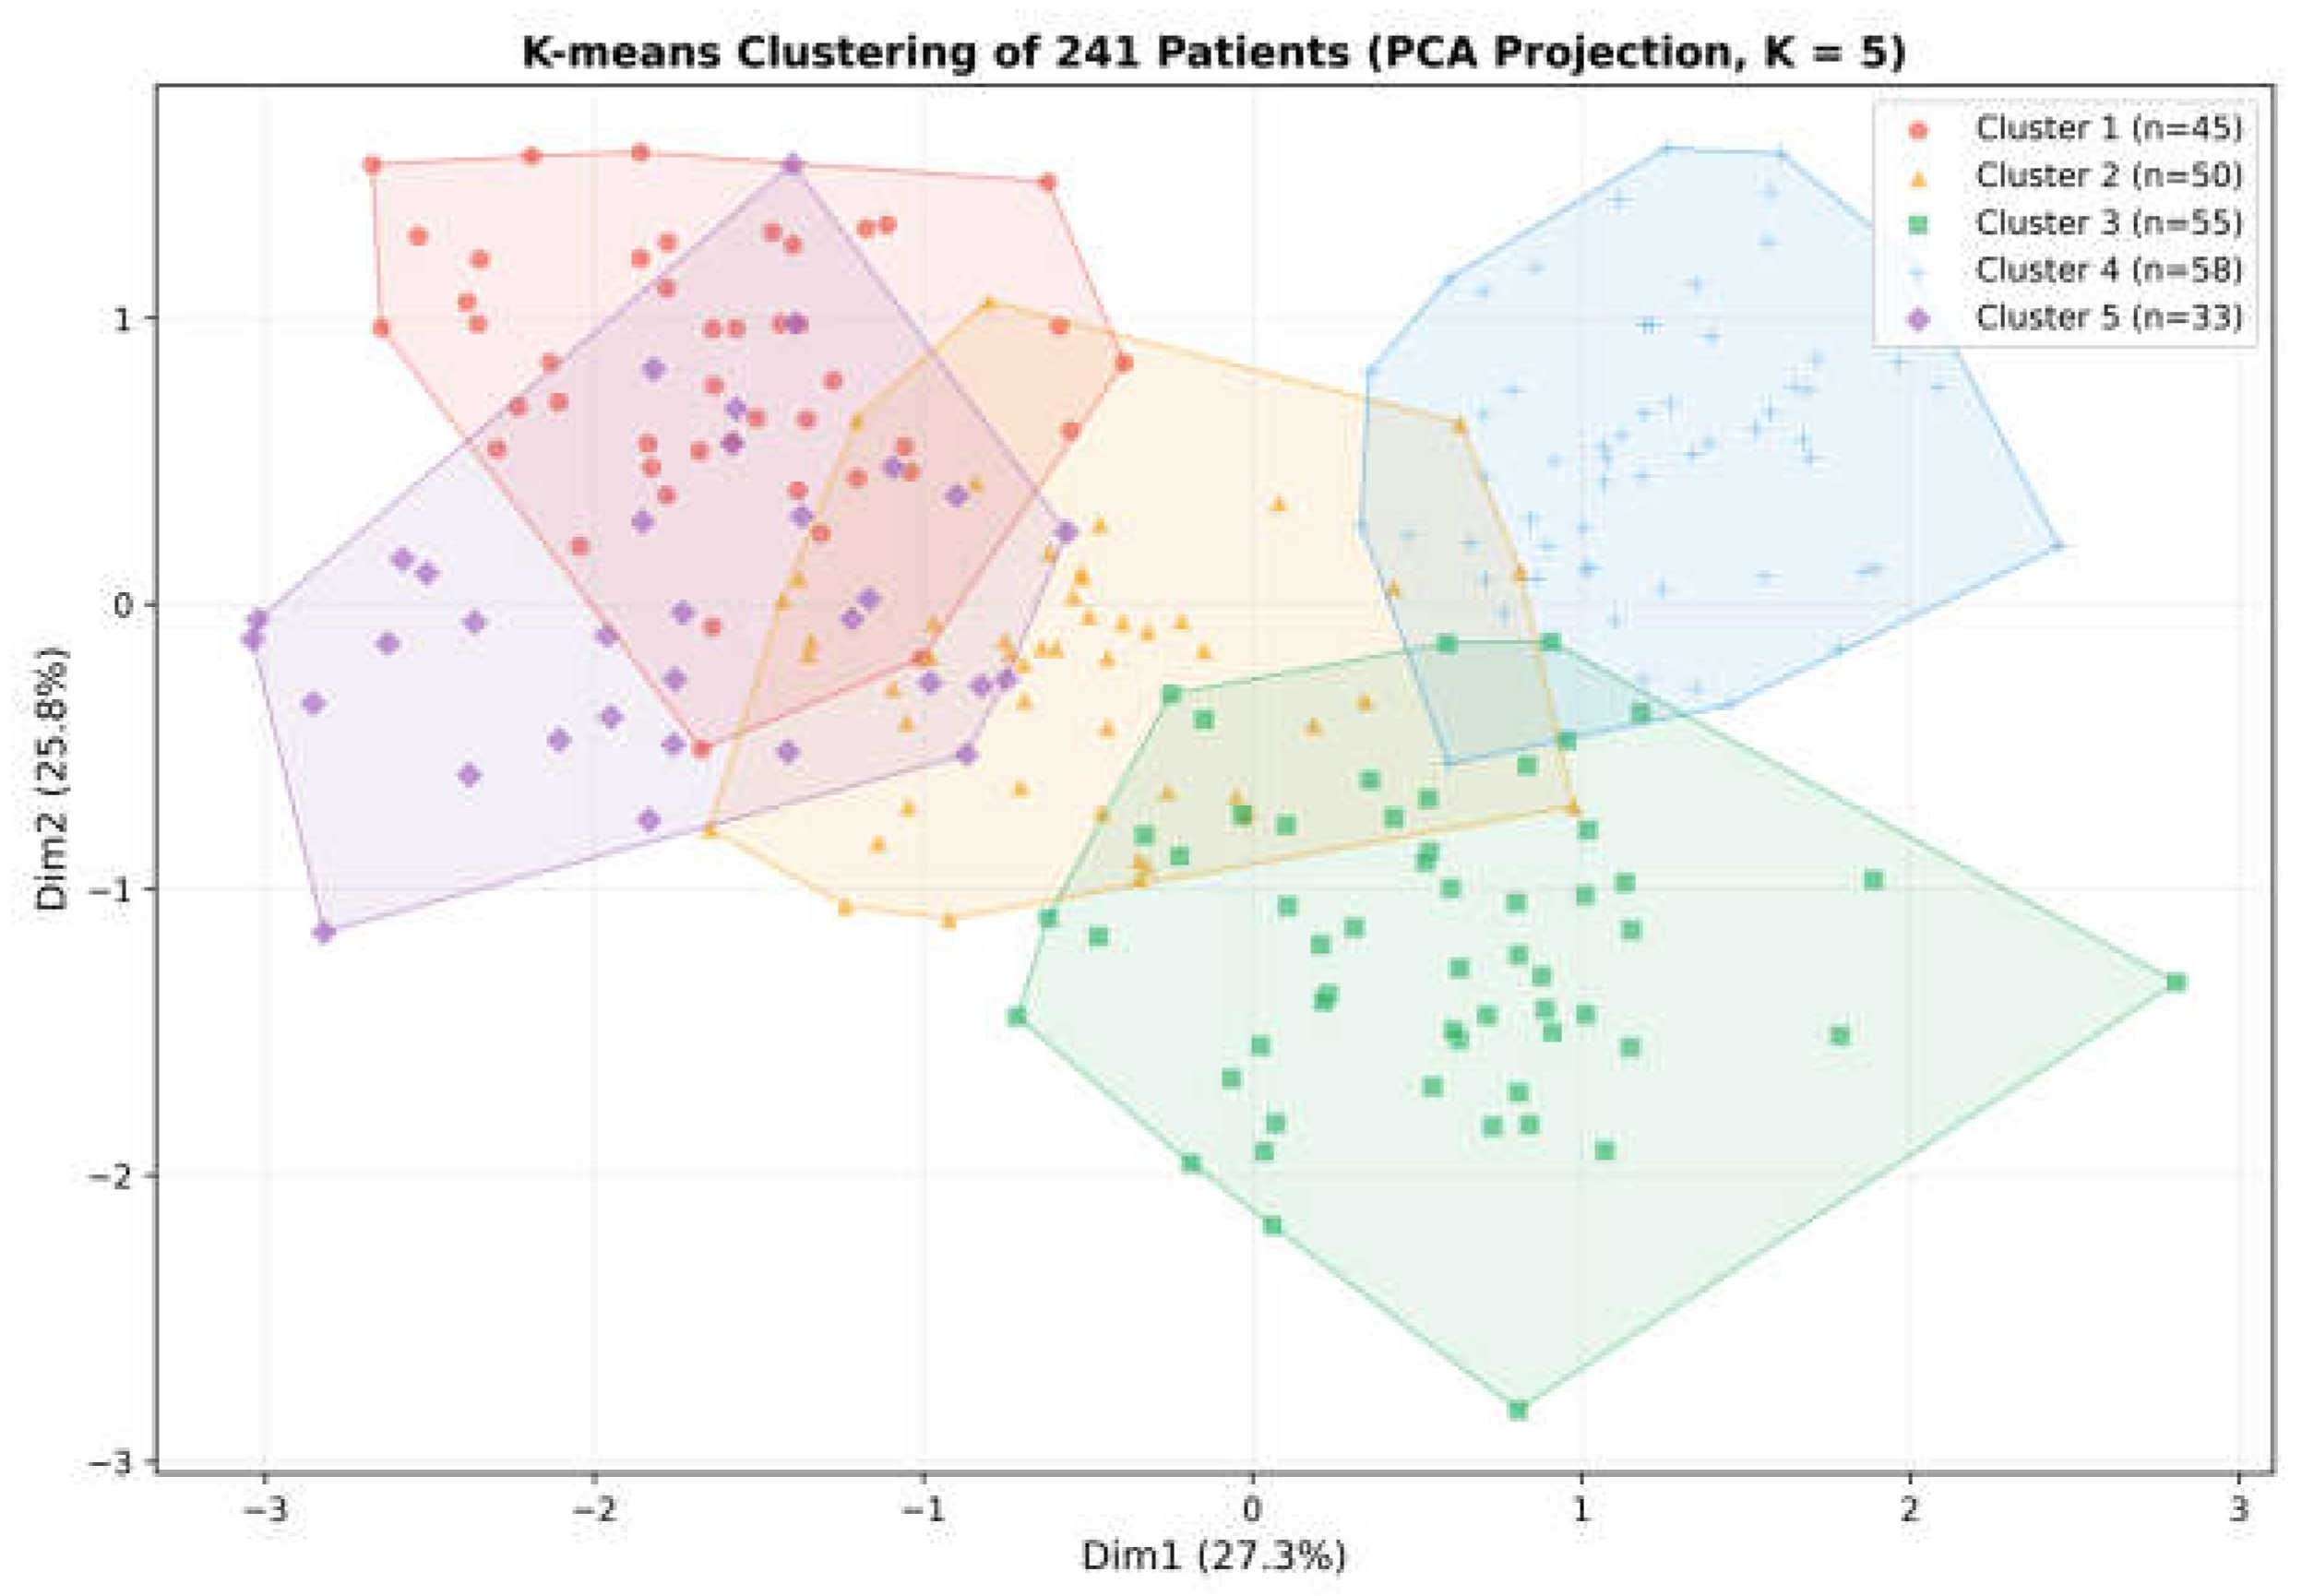
Figure 8.
Kaplan–Meier survival analysis of therapy retention by fibromyalgia status. Shaded bands represent 95% CI. HR, hazard ratio.
Figure 8.
Kaplan–Meier survival analysis of therapy retention by fibromyalgia status. Shaded bands represent 95% CI. HR, hazard ratio.
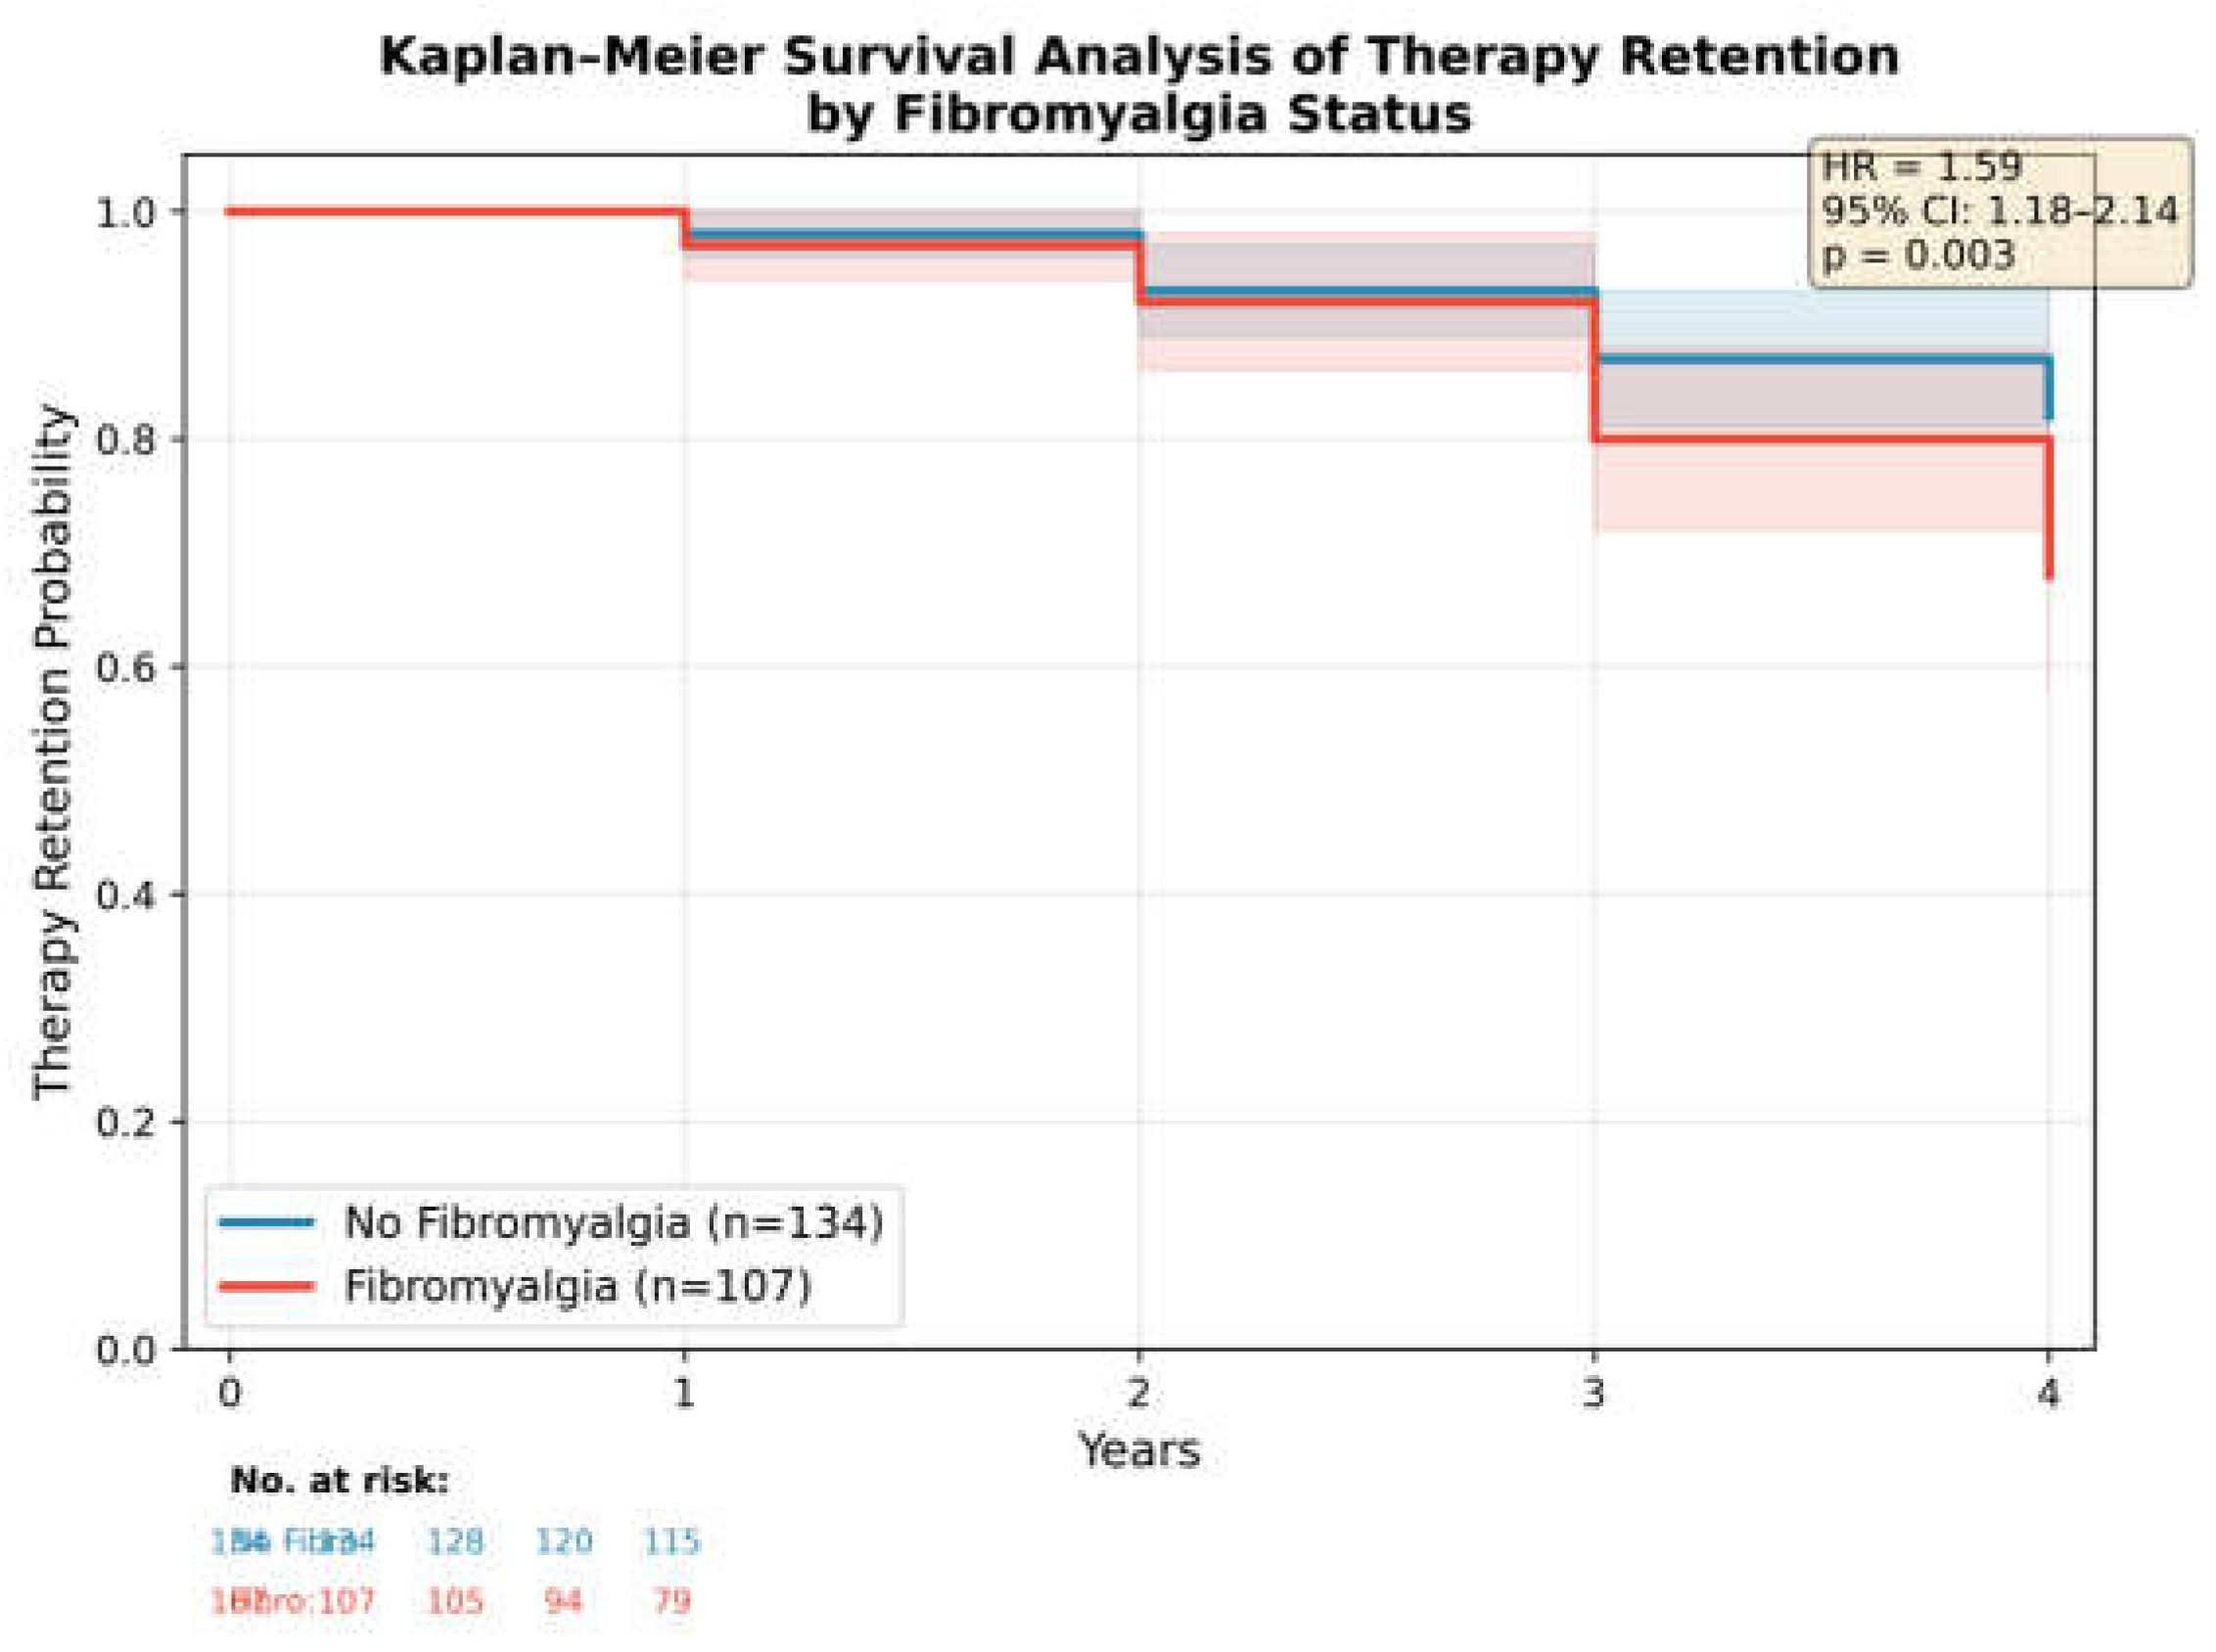

Table 1.
Baseline demographic and clinical characteristics (N = 241).
| Characteristic | Value |
|---|---|
| Age, years, mean ± SD (range) | 49.3 ± 14.9 (18–88) |
| Male sex, n (%) | 150 (62.2) |
| BMI, kg/m2, mean ± SD | 29.3 ± 6.0 |
| Pain duration, years, mean ± SD | 15.1 ± 11.2 |
| Comorbidities, n (%): | |
| Anxiety | 107 (44.4) |
| Fibromyalgia | 107 (44.4) |
| Sleep disorder | 67 (27.8) |
| Past psychosis history | 7 (2.9) |
| Baseline NRS, mean ± SD | 8.08 ± 1.61 |
| Baseline ODI, mean ± SD | 55.05 ± 15.90 |
| Baseline BPI severity, mean ± SD | 7.94 ± 1.71 |
| Baseline BPI interference, mean ± SD | 5.84 ± 2.02 |
| Baseline BioWell stress, mean ± SD | 4.46 ± 1.04 |
| Baseline BioWell vitality, mean ± SD | 50.30 ± 7.78 |
NRS, Numeric Rating Scale; ODI, Oswestry Disability Index; BPI, Brief Pain Inventory; BMI, body mass index.
Table 2.
Cannabis dosing parameters by study year.
| Parameter | Year 1 (n=241) | Year 2 (n=228) | Year 3 (n=214) | Year 4 (n=229) | p |
|---|---|---|---|---|---|
| Dose, g/month | 21.5±4.1 | 34.8±10.8 | 44.5±11.9 | 56.7±12.2 | <0.001 |
| THC, g/month | 3.89±1.57 | 6.58±2.80 | 8.52±3.15 | 11.07±3.62 | <0.001 |
| CBD, g/month | 1.36±0.93 | 1.60±0.90 | 2.33±1.51 | 2.75±1.69 | <0.001 |
| Smoking, n(%) | 226(93.8) | 226(99.1) | 202(94.4) | 226(98.7) | — |
| BID | 213(88.4) | 3(1.3) | 0(0) | 0(0) | — |
| QID | 8(3.3) | 140(61.4) | 97(45.3) | 0(0) | — |
| Q4H | 4(1.7) | 55(24.1) | 116(54.2) | 229(100) | — |
Values are mean ± SD or n (%). BID, twice daily; QID, four times daily; Q4H, every 4 hours.
Table 3.
Patient-reported outcomes and BioWell parameters by study year (mean ± SD).
| Outcome | Year 0 | Year 1 | Year 2 | Year 3 | Year 4 | F (p) |
|---|---|---|---|---|---|---|
| NRS | 8.08±1.61 (241) | 4.10±2.33 (241) | 3.76±2.45 (233) | 4.00±2.36 (214) | 2.71±1.46 (229) | 215.4 (<0.001) |
| ODI | 55.05±15.90 (241) | 49.40±16.78 (241) | 49.43±18.54 (222) | 50.88±18.13 (205) | 36.82±8.47 (229) | 73.7 (<0.001) |
| BPI Severity | 7.94±1.71 (241) | 3.94±2.15 (241) | 3.54±2.45 (219) | 1.14±0.48 (205) | 1.11±0.53 (229) | 277.9 (<0.001) |
| BPI Interf. | 5.84±2.02 (241) | 4.36±2.19 (241) | 2.50±1.14 (219) | 2.50±1.80 (205) | 2.20±1.69 (229) | 105.2 (<0.001) |
| BW Stress | 4.46±1.04 (241) | 3.87±1.11 (241) | 3.46±1.11 (213) | 3.35±1.14 (199) | 4.15±1.04 (229) | 5.6 (<0.001) |
| BW Vitality | 50.30±7.78 (241) | 47.41±8.72 (241) | 41.80±9.08 (213) | 49.30±8.97 (199) | 50.63±10.47 (229) | 30.2 (<0.001) |
Values are mean ± SD (n). NRS, Numeric Rating Scale; ODI, Oswestry Disability Index; BPI, Brief Pain Inventory; BW, BioWell. F-statistics from repeated-measures ANOVA.
Disclaimer/Publisher’s Note: The statements, opinions and data contained in all publications are solely those of the individual author(s) and contributor(s) and not of MDPI and/or the editor(s). MDPI and/or the editor(s) disclaim responsibility for any injury to people or property resulting from any ideas, methods, instructions or products referred to in the content. |
© 2026 by the authors. Licensee MDPI, Basel, Switzerland. This article is an open access article distributed under the terms and conditions of the Creative Commons Attribution (CC BY) license (http://creativecommons.org/licenses/by/4.0/).
Copyright: This open access article is published under a Creative Commons CC BY 4.0 license, which permit the free download, distribution, and reuse, provided that the author and preprint are cited in any reuse.


