Submitted:
13 February 2026
Posted:
14 February 2026
You are already at the latest version
Abstract
Microplastics (MPs) are routinely present throughout wastewater treatment plants (WWTPs) due to their widespread occurrence, while current treatment technologies achieve only partial removal. Therefore, WWTP effluents can still discharge a substantial fraction of MPs to receiving water bodies leading to environmental contamination. Most previous studies reported MP concentrations at specific time points, precluding a long-term monitoring and may result in over- or underestimation. The aim of this study is to examine the concentration, size, and polymer composition of MPs at inlet and outflow waters over a six-month period, from July to December, to assess the temporal variability of MPs across seven conventional urban WWTPs located in the Andalusia region, southern Spain. MPs were found in all sampling campaigns. In influent samples, concentrations were found to reach 6 – 78 MP/L, while the WWTP effluents contained a range of 12 – 65 MP/L. Fibers were the most abundant shape across all the WWTPs. The average size in the influent was 848 ± 1427 μm and effluent 918 ± 1221 μm. Polymers such as PA, PP, PVC and LDPE were the most abundant, reflecting the domestic origin of water samples.
Keywords:
microplastics
; wastewater treatment plant
; polymer composition
; temporal variability
; fibers
1. Introduction
Plastic pollution is widely recognised as a major global environmental issue, that pose a threat to marine and terrestrial ecosystems. World plastic production reached 413.8 Mt in 2023 [1], and without additional measures taken, future projections of the annual plastic production, utilization, and generation of waste may be expected to rise at an accelerated rate with an increase by 70% by 2040 compared to 2020 levels [2]. The most common polymers, also known as “Big six”, are polypropylene (PP), polyethylene (PE), polyvinyl chloride (PVC), polyurethane (PU), polyethylene terephthalate (PET) and polystyrene (PS), account for 80% of the plastics produced in Europe [3]. These are employed for a wide variety of applications, from food packaging and pipes to clothing, due to their properties (strength and chemical resistance, among others), which make them versatile, long-lasting and cost-effective [4].
Microplastics (MPs) are defined as small fragments with a size less than 5 mm and nanoplastics (NPs) with a size comprise between 1 to 1000 nm [5]. MPs are divided into two categories based on their primary or secondary origins. The primary MPs are intentionally manufactured/produced (e.g., cosmetics and personal care products). While secondary MPs are formed by the breakdown of plastic debris through erosion, mechanical abrasion, hydrodynamic process, or under UV and thermal stress that led to photo- and thermal degradation (several source, like clothes, lost materials and waste from fishing activities) [6]. Primary and secondary MPs and NPs have been found in several environments [7]. MPs are also considered as a vector, or “Trojan Horse” of organic xenobiotics and antibiotic resistant genes [8]. It is now recognized that MPs induce harmful effects in a wide range of organisms and may represent a potential threat to human health [9]. Concerns over ecotoxicity have led to international regulations, in 2018 the European Commission bans on intentionally added MPs in products and restriction of single-use plastics [10]. These policies aim to mitigate MPs impacts and support the achievement of the Sustainable Development Goals linked to MP pollution.
Wastewater treatment plants (WWTPs) are considered a significant source of MPs to aquatic and terrestrial environments, as they do not specifically target MPs. Current wastewater treatment processes were not originally designed to remove MPs, but rather to treat dissolved and suspended contaminants [11,12]. As a consequence, effluents from WWTP contains MPs, which can reach the freshwater system (rivers, lakes and aquifers) and may ultimately be transported to marine environments. There are several MPs source, including domestic wastewater, where personal care products (e.g., microbeads) contribute significantly to MPs pollution [13] and industrial waste (e.g., textile manufacturing, paint and resin) also introduce MPs into wastewater systems [14]. It has recently been reported that the particles identified were predominantly fibres and fragments, with sizes ranging from 10 μm to 5 mm [15]. WWTPs are consisting of successive treatment units, that comprise a preliminary and primary treatment (physical and mechanical processes). These initial stages can remove 56.8% to 98.4% of MPs, primarily through sedimentation [11,16]. These are followed by biological units, or secondary treatment, where the activated sludge process shows variable removal efficiency, ranging from 42.1% to 99.2% [14]. In some of WWTPs is present the tertiary treatment (optional). With advanced methods, such as membrane bioreactors, is achieve up to 99.9% removal efficiency [13]. However, despite the removal capabilities of WWTPs, significant quantities of MPs still enter natural water bodies due to the large volumes of treated effluent released daily [11,13]. During the treatment process, MPs are transferred to sludge, where they are widely present, becoming a sink of these pollutants. In a recent study from Spanish WWTP, it is estimated that among 8.05 × 10⁴ and 1.77 × 10⁹ MPs · day−1 were loaded to sludge; representing a major source of MPs into agriculture when sludge is used as additive [17]. This ongoing issue highlights the need for a systematic monitoring, improved treatment technologies and better management practices to mitigate the environmental impact of MPs pollution.
The aim of this study is to provide the quantification, identification and characterization of MPs and fibers in the inlet and outflow water collected from seven municipal WWTPs in the Andalusia region (Spain), over a six months-period, investigating seasonal MPs abundance and retention rate.
2. Materials and Methods
2.1. Study Areas
2.2. Sampling Strategy and Sample Preservation
Wastewater samples were collected in the early morning at each WWTP from the influent (plant inlet) and final effluent (plant outlet). For MPs analysis, 2 L of concentrated effluent was processed per sample. Samples were transported to the laboratory immediately after collection and kept at 4 °C until microplastic extraction.
Given the hydraulic retention time (HRT) of WWTPs, influent and effluent samples obtained within the same sampling window may not represent the same water parcel. Therefore, influent–effluent comparisons were treated as contemporaneous measurements, and removal estimates were interpreted considering this methodological constraint.
2.3. Microplastics Extraction
Upon arrival at the laboratory, wastewater samples were kept at 4 °C and processed for MPs extraction following a protocol adapted from Edo et al. [18]. Prior to chemical treatment, samples were allowed to equilibrate to room temperature. For each sample, 2 L of concentrated effluent was processed. The concentrated material retained during the concentration/filtration step was carefully recovered using a stainless-steel spatula and rinsed with ultrapure water into a 250 mL glass beaker.
To remove organic matter, samples were first digested with 10% (w/v) KOH, added at a 1:3 (sample:KOH, v/v) ratio, and incubated at 40 °C for 24 h. When residual organic material remained, a second digestion step was applied by adding 15% H₂O₂ at 1:1 (sample:H₂O₂, v/v) and incubating at 40 °C for 72 h, extending the incubation, when necessary, until the solution became visually clear (indicative of complete digestion).
After digestion, samples were sieved through a 5 mm mesh to remove large debris. The target size range analyzed in this study was 45–5000 µm, consistent with the lower cut-off of the concentration/filtration step. Density separation was performed by adding a 6.8 M NaCl solution to increase the aqueous density and promote flotation of low-density polymer particles. The suspension was stirred and allowed to settle, after which the supernatant was collected and vacuum-filtered through 45 µm cellulose microfiber filters (Whatman). The walls of the glassware were rinsed thoroughly with ultrapure water and the rinsate was filtered to maximize particle recovery. Filters were dried at 40 °C for 48 h and stored in covered Petri dishes until further analysis.
Removal efficiencies (RE%) for each WWTP were calculated using the concentrations of fibers counted for influent (CMP,infl) and effluent (CMP,effl) (Eq (1)) [19]:
2.4. Microplastics Identification
All suspected MPs retained on the filters within the 45–5000 μm size range were first examined by visual inspection under a microscope. MP items were categorized based on morphology (fibers and fragments) and color and the area of fragments and lenght of fibers was measured, and any non-plastic-looking material was excluded as far as possible prior to polymer confirmation.
Polymer identification was subsequently carried out by Fourier-transform infrared spectroscopy (FTIR) using a Bruker ALPHA system and Bruker’s dedicated software. Measurements were acquired in transmittance mode over a spectral range of 4000–500 cm⁻¹. Samples were analyzed on individual items and the resulting spectra were compared against the Bruker reference libraries, and a particle was assigned to a polymer type when the similarity score was ≥40%.
2.5. Quality Assurance/Quality Control
Procedural (process) blanks were included to assess potential contamination introduced during sample handling and processing. Blanks were run through the full procedure using ultrapure water and treated identically to samples. The mean blank mass (0.004 ± 0.008 g) was subtracted from sample filter masses prior to concentration calculations. Method performance was further evaluated using a positive control consisting of 0.1 g polystyrene particles (~100 µm) processed alongside samples, yielding a mean recovery of 99.267 ± 0.386%.
3. Results and Discussion
A total of 6,284 particles was found in the influent and effluent waters sampled from the seven urban WWTPs. Table 2 shows the concentrations of microplastic per litre (MP/L) observed monthly over the six-month period for each WWTP water sampled. For all the WWTPs, the influent range concentration was 6 – 78 MP/L and effluent range concentration was 12 – 65 MP/L. In particular, the highest items abundance was observed in Tomares WWTP in July (78 MP/L). October is the month with the high particles concentration in the influent (36 – 76 MP/L) for all the WWTPs. A wide range of concentrations was found in several WWTPs in Europe, and elsewhere, between 1-3160 MP/L for inlet water and 0.0007-125 MP/L for effluents [20,21]. For example, in a WWTP in UK was found a range concentration of 15.7 ± 5.2 MP/L [22], and in Spain a range of 1246.4 – 345.7 MPs/L for influent and 72.9-4.2 MPs/L in effluent [23]. It is noteworthy that the lack of standardized MP monitoring protocols in WWTPs, together with the use of different units to report MP concentration, can lead to discordance in MP abundance and biased comparisons across studies [24]. However, is expected that the European Commission will establish a standardized protocol for microplastic and microliter monitoring in WWTPs, in contrast under the Drinking Water Directive (EU) 2020/2184, harmonized methodology for the measurement of microplastics in drinking water have been established, representing an initial regulatory step towards the microplastic standardized monitoring.
Notably, no seasonal patterns were found for MP abundance, the concentrations found were similar for summer and winter seasons. Likely, increased tourism in summer and the use of heavier synthetic clothing in winter, compared to spring, together with greater mobilization of MPs due to the rainfall may influence MP particles concentrations [25,26,27]. MPs abundance were also very similar among the WWTP, either coastal or inland and even in Sevilla R, where a tertiary treatment is present.
Notably, the WWTP with tertiary treatment (Sevilla R) did not exhibit a clear improvement in MPs reduction compared with plants lacking a tertiary step. This finding should be interpreted in light of the fact that tertiary treatment is not a single technology, and its contribution depends strongly on the specific unit process (e.g., tertiary filtration such as disc/sand filters versus disinfection steps such as UV) and on whether samples are collected upstream or downstream of that unit. In particular, disinfection-based tertiary steps are not designed to physically retain particles, whereas filtration-based tertiary processes can enhance removal but show highly variable performance across configurations, operating conditions, and size classes—especially for fine fibers, which are frequently reported as the dominant residual fraction in treated effluents. Recent reviews highlight that MP removal during advanced/tertiary stages varies widely between treatment trains and unit operations, and that capture efficiencies depend on the filtration technology and the particle size range considered [28].
3.1. MP Polymer Composition
Among the particles encountered in the inlet and outlet effluent waters from the seven WWTPs, a total of 1,126 (including fibers and fragments) were randomly chosen and analyzed for polymer identification. Of these, 857 are found to be MP microplastic polymers, representing 76% of the analyzed samples. The main total polymers found in the inlet and outlet were polyamide (PA) (71%), polypropylene (PP) (9%), polyvinyl chloride (PVC) (6%), low-density polyethylene (LDPE) (5%), polystyrene (PS) (3%) and styrene acrylonitrile (SAN) (3%), with PA being the most abundant polymer in all the WWTPs (Figure 2). These are some of the 10 most demanding polymers manufactured in Europe [29]; reflecting a direct relationship between the most consumed polymers and the residues found in wastewater. Occasionally, high density-polyethylene (HDPE), polycarbonate (PC), and polyurethane (PU) are present in small amounts (1%). Polyamide, known as nylon, is mostly used in textiles for clothes [30], polypropylene is a rigid plastic mainly used in food packaging and bottles [31]. Polyethylene is one of the cheapest polymers and is used in plastic bags, toys, packaging for detergent, shampoo and bleach [32,33]. Polystyrene is used in foam containers, plastic cutlery, floats [31]. Finally, PVC is mainly used in pipes and electrical cables [31]. The polymers identified in this study corresponded to those previously reported in the inlet and outlet effluents of other European WWTPs [17]. Although, the proportion of polymers was not consistent with studies in WWTPs elsewhere [34,35,36]. For example, in a WWTP in Turkey, the most prevalent polymers are PE and PP [36]. In the study of Hajji et al. [34], has been found that PE was the most abundant polymer in two WWTPs in Morocco. In a WWTP in China, one of the most frequent polymers has been PA, although PE and polyester have also been detected in great abundance [35]. The predominance of polyamide among the polymers identified here could be related to the fact that most of the MPs found were fibers. This finding is in accordance whit the study of Napper et al. [37], in which the effluent from WWTP outflows in the United Kingdom was analysed. Furthermore, the presence of a high proportion of PA fibers in the WWTPs analysed here, could be attributed to the domestic origin of the wastewaters [38]. No differences were observed comparing the polymers found in each WWTP.
The high contribution of polyamide (PA; 71%) is striking but plausible given that the retained fraction was dominated by fibers, and PA is commonly associated with textile-derived inputs. However, polymer attribution should be interpreted together with the proportion of particles that could be confidently polymer-confirmed by FTIR. In our dataset, 76% of the analyzed items yielded spectra consistent with synthetic polymers, whereas the remaining 24% did not match polymer libraries above the acceptance threshold and likely included cellulosic or semi-synthetic fibers (e.g., cotton, rayon/viscose) and/or organic debris remaining after digestion. This is particularly relevant for fiber-rich samples, where visual classification alone can overestimate “plastic” fibers and where non-plastic fibers can be abundant in wastewater. In addition, because FTIR characterization was performed on a subset of visually identified particles (selected as “representative”), the polymer profile may be affected by selection bias; for example, an over-representation of fibers or larger/easier-to-handle particles; potentially inflating the apparent dominance of PA. Future work would benefit from a fully randomized particle selection scheme (or complete filter mapping where feasible) and explicit reporting of the fraction of cellulosic/semi-synthetic fibers to better constrain polymer-specific trends.
The overall polymer composition was similar among plants, with variations only in their relative abundances [39]. However, in the case of two WWTPs, analysed in Thailand, the MP polymer content changes between the two plants, justified by the influence of the surrounding communities [13].
No seasonal pattern in terms of polymer type was found. The composition of the inlet and outlet effluents are the same during the six months, as urban wastewaters (same domestic sources) may present similar polymer composition over seasons, in agreement with the literature [34,40,41]. However, Ridall et al. [26] observed an increased presence of PA during winter, likely due to at the increased amount of nylon clothing being washed during this season (Florida). No differences were found regarding the difference between coastal (A, B) and inland WWTPs (C – G) (Figure 1).
3.2. MP Characteristics (Size, Shape and Colour)
A total of 6,824 particles were measured. The most abundant MP size fraction in both influent and effluent of each WWTP was 100 – 500 μm (28.7% and 17.2%), followed by 1000 – 5000 μm fraction (13.3% and 11.0%) and 500 – 1000 μm fraction (11.6% and 8.2%). Less particles were found in the smallest (< 100 μm) and the largest (>5000 μm) fractions (with < 5%), remains consistent throughout the six months. The average MP size at inflow water of the WWTPs was 848 ± 1427 µm, while mean size at the outflow was 873 ± 1343 µm (Figure 3).
The predominant shape found in all sample from the WWTP waters was fiber (86%), followed by fragment (14%) (Figure 4). This is in agreement with other studies in literature [42,43] where fibers are the most abundant type of MPs found in urban WWTP released primarily from domestic laundry systems [23,44]. No flakes or sphere are found. The number of fibers released during a clothes wash can vary between 1.9 × 10³ and 6 × 10⁶ [45,46]. Fragments can be derived from several sources and enter the WWTP stream, and also they can be generated during the treatment stream from the degradation of plastic equipment, as hypothesized by Blair et al. [43]. The majority of MPs were predominantly black (Figure 5). Black fibers dominated the influent and effluent, 47.8% and 35.6 respectivel. This is in agreement with a study of French WWTP [20]. In contrast, fragments showed a more diverse color distribution, with a greater contribution from non-black particles. This proportion increased markedly in certain months.
3.3. MP Removal Efficiencies (RE%)
The average MP removal efficiency (RE) across the surveyed WWTPs, calculated from influent and effluent microplastic concentrations and excluding fragments (as not all visually classified fragments could be polymer-confirmed), ranged between 16% and 55% [47]. These values are lower than those commonly reported in the literature, where RE typically falls between ~40% and 99% [42,44]. Importantly, in several sampling events RE was unexpectedly low and, in some cases, effluent concentrations exceeded influent concentrations (Table 2), yielding negative or near-zero RE. This pattern does not necessarily imply net “production” of microplastics, but is more plausibly explained by a combination of factors, including imperfect influent–effluent pairing due to hydraulic retention time (HRT) (samples collected in the same morning may not represent the same water parcel), strong intra-day variability captured by grab sampling (which would be reduced by 24 h composite sampling and larger processed volumes), influent sampling after preliminary treatment/headworks (potentially underestimating inlet loads), potential fragmentation during pumping and mixing leading to higher numbers of smaller particles at the outlet, and fiber contamination and/or incomplete blank correction. Despite these constraints, to the best of our knowledge this is the first study surveying MPs in seven urban WWTPs (coastal and inland) over a six-month period, and we did not observe a consistent temporal pattern in microplastic concentrations. Overall, our results support that WWTPs are an important pathway for microplastics to reach aquatic and terrestrial ecosystems, consistent with observations from other regions.
Although a consistent temporal pattern was not observed over the six-month survey, this result should be interpreted in the context of the high short-term variability typical of WWTP influents and effluents. Episodic drivers such as rainfall and storm overflows, changes in influent flow (dilution effects), and punctual discharges can generate sharp fluctuations that may mask broader seasonal signals, while in coastal systems additional variability may be linked to tourism-related population changes. Moreover, given the relatively short monitoring window and the use of discrete sampling events, the statistical power to detect modest seasonal effects is inherently limited. Future monitoring integrating longer time series (≥12 months), hydrologically informed covariates (rainfall/flow), and preferably composite sampling would provide a stronger basis to resolve seasonality.
4. Conclusions
Although no markable difference in the concentrations, predominant size, morphology or polymer type were reported, this study contributes to further inside in the monitoring the role of urban WWTPs in the MP particles discharge in the environment. This is the first study to monitor MPs in seven urban WWTPs spanning both influent and effluent water over a six-month period. MPs were detected in both influents and final effluents throughout the survey, supporting the role of WWTPs as an ongoing route of MP discharge to aquatic and terrestrial ecosystems. Removal efficiencies estimated from influent–effluent concentrations were generally low to moderate and highly variable between plants and campaigns; in several instances, effluent values exceeded influent values, emphasizing that RE can be strongly affected by hydraulic retention time (HRT) mismatching, intra-day variability captured by grab sampling, potential in-plant fragmentation processes, and quality assurance/quality control (QA/QC) considerations (notably fiber contamination and blank correction). Despite the multi-site design, no consistent temporal trend or systematic coastal–inland differences were detected within the study window, suggesting that episodic hydrological and operational drivers (rainfall and flow changes, punctual loads) may outweigh seasonal effects at this scale. The effluents were dominated by fibers, and PA was the most frequently identified polymer among FTIR-confirmed particles, consistent with textile-related sources; however, a non-negligible fraction of analyzed items did not reach the polymer match threshold and likely includes cellulosic/semi-synthetic fibers. Finally, the lack of an evident benefit in the plant with tertiary treatment highlights that tertiary configurations differ widely and may not efficiently retain fine fibers unless dedicated filtration is implemented. Future monitoring should therefore adopt HRT-informed influent–effluent pairing, longer time series, composite sampling, and standardized QA/QC, while mitigation efforts should combine upstream source control with treatment upgrades specifically targeting the smallest and most abundant residual fractions.
Author Contributions
Conceptualization, M.Y.S. and M.S.; methodology, M.P.Y. and M.S.; formal analysis, E.S., R.N., M.P.Y., M.S.; investigation, R.N., M.P.Y. and M.S.; data curation, E.S., R.N., M.P.Y. and M.S.; writing—original draft preparation, E.S.; writing—review and editing, M.P.Y., M.A.C., M.S; funding acquisition, M.P.Y.S and M.A.C. All authors have read and agreed to the published version of the manuscript.
Funding
The authors gratefully acknowledge financial support from the Junta de Andalucía (Spain) to the FQM-110 and from the Junta de Andalucía Project (FEDER-UCA-2024-A2-37 DEGRABIOPLAS).
Data Availability Statement
Data supporting this study’s findings are available from the corre- sponding author upon reasonable request.
Conflicts of Interest
The authors declare that they have no known competing financial interests or personal relationships that could have appeared to influence the work reported in this paper.
Abbreviations
The following abbreviations are used in this manuscript:
| MPs | Microplastics |
| NPs | Nanoplastics |
| WWTPs | Wastewater Treatment Plants |
| PP | Polypropylene |
| PE | Polyethylene |
| LDPE | Low-density polyethylene |
| HDPE | High-density polyethylene |
| PVC | Polyvinyl Chloride |
| SAN | Styrene Acrylonitrile |
| PU | Polyurethane |
| PET | Polyethylene Terephthalate |
| PC | Polycarbonate |
| PS | Polystyrene |
| PA | Polyamide |
| HRT | Hydraulic Retention Time |
| RE | Removal Efficiency |
| QA | Quality Assurance |
| QC | Quality Control |
References
- PlasticEurope_TheFacts_2024_digital-1pager.
- OECD Global Plastics Outlook: Policy Scenarios to 2060; OECD, 2022; ISBN 978-92-64-97364-0.
- Hildebrandt, J.; Thünemann, A.F. Aqueous Dispersions of Polypropylene: Toward Reference Materials for Characterizing Nanoplastics. Macromol. Rapid Commun. 2023, 44, 2200874. [Google Scholar] [CrossRef] [PubMed]
- Magalhães, S.; Alves, L.; Medronho, B.; Romano, A.; Rasteiro, M.D.G. Microplastics in Ecosystems: From Current Trends to Bio-Based Removal Strategies. Molecules 2020, 25, 3954. [Google Scholar] [CrossRef] [PubMed]
- Gigault, J.; Halle, A.T.; Baudrimont, M.; Pascal, P.-Y.; Gauffre, F.; Phi, T.-L.; El Hadri, H.; Grassl, B.; Reynaud, S. Current Opinion: What Is a Nanoplastic? Environmental Pollution 2018, 235, 1030–1034. [Google Scholar] [CrossRef] [PubMed]
- Duis, K.; Coors, A. Microplastics in the Aquatic and Terrestrial Environment: Sources (with a Specific Focus on Personal Care Products), Fate and Effects. Environ Sci Eur 2016, 28, 2. [Google Scholar] [CrossRef]
- Peng, J.; Wang, J.; Cai, L. Current Understanding of Microplastics in the Environment: Occurrence, Fate, Risks, and What We Should Do. Integrated Environmental Assessment and Management 2017, 13, 476–482. [Google Scholar] [CrossRef]
- Luo, G.; Liang, B.; Cui, H.; Kang, Y.; Zhou, X.; Tao, Y.; Lu, L.; Fan, L.; Guo, J.; Wang, A.; et al. Determining the Contribution of Micro/Nanoplastics to Antimicrobial Resistance: Challenges and Perspectives. Environ. Sci. Technol. 2023, 57, 12137–12152. [Google Scholar] [CrossRef]
- Jeong, E.; Lee, J.-Y.; Redwan, M. Animal Exposure to Microplastics and Health Effects: A Review. Emerging Contaminants 2024, 10, 100369. [Google Scholar] [CrossRef]
- European Parliament Microplastics: Sources, Effects and Solutions; 2018.
- Bodzek, M.; Pohl, A.; Rosik-Dulewska, C. Microplastics in Wastewater Treatment Plants: Characteristics, Occurrence and Removal Technologies. Water 2024, 16, 3574. [Google Scholar] [CrossRef]
- Freeman, S.; Booth, A.M.; Sabbah, I.; Tiller, R.; Dierking, J.; Klun, K.; Rotter, A.; Ben-David, E.; Javidpour, J.; Angel, D.L. Between Source and Sea: The Role of Wastewater Treatment in Reducing Marine Microplastics. Journal of Environmental Management 2020, 266, 110642. [Google Scholar] [CrossRef]
- Tadsuwan, K.; Babel, S. Unraveling Microplastics Removal in Wastewater Treatment Plant: A Comparative Study of Two Wastewater Treatment Plants in Thailand. Chemosphere 2022, 307, 135733. [Google Scholar] [CrossRef]
- Hu, Z.; Sun, Y.; Zhou, J.; Sun, W.; Shah, K.J. Microplastics in Wastewater Plants: A Review of Sources, Characteristics, Distribution and Removal Technologies. Journal of Contaminant Hydrology 2024, 267, 104448. [Google Scholar] [CrossRef]
- Ormaniec, P.; Mikosz, J. Circulation of Microplastics in a Municipal Wastewater Treatment Plant with Multiphase Activated Sludge. Desalination and Water Treatment 2024, 317, 100265. [Google Scholar] [CrossRef]
- Kurt, Z.; Özdemir, I.; James R., A.M. Effectiveness of Microplastics Removal in Wastewater Treatment Plants: A Critical Analysis of Wastewater Treatment Processes. Journal of Environmental Chemical Engineering 2022, 10, 107831. [Google Scholar] [CrossRef]
- Franco, A.A.; Martín-García, A.P.; Egea-Corbacho, A.; Arellano, J.M.; Albendín, G.; Rodríguez-Barroso, R.; Quiroga, J.M.; Coello, M.D. Assessment and Accumulation of Microplastics in Sewage Sludge at Wastewater Treatment Plants Located in Cádiz, Spain. Environmental Pollution 2023, 317, 120689. [Google Scholar] [CrossRef] [PubMed]
- Edo, C.; González-Pleiter, M.; Leganés, F.; Fernández-Piñas, F.; Rosal, R. Fate of Microplastics in Wastewater Treatment Plants and Their Environmental Dispersion with Effluent and Sludge. Environmental Pollution 2020, 259, 113837. [Google Scholar] [CrossRef] [PubMed]
- Conley, K.; Clum, A.; Deepe, J.; Lane, H.; Beckingham, B. Wastewater Treatment Plants as a Source of Microplastics to an Urban Estuary: Removal Efficiencies and Loading per Capita over One Year. Water Research X 2019, 3, 100030. [Google Scholar] [CrossRef]
- Kazour, M.; Terki, S.; Rabhi, K.; Jemaa, S.; Khalaf, G.; Amara, R. Sources of Microplastics Pollution in the Marine Environment: Importance of Wastewater Treatment Plant and Coastal Landfill. Marine Pollution Bulletin 2019, 146, 608–618. [Google Scholar] [CrossRef]
- Sun, J.; Dai, X.; Wang, Q.; Van Loosdrecht, M.C.M.; Ni, B.-J. Microplastics in Wastewater Treatment Plants: Detection, Occurrence and Removal. Water Research 2019, 152, 21–37. [Google Scholar] [CrossRef]
- Murphy, F.; Ewins, C.; Carbonnier, F.; Quinn, B. Wastewater Treatment Works (WwTW) as a Source of Microplastics in the Aquatic Environment. Environ. Sci. Technol. 2016, 50, 5800–5808. [Google Scholar] [CrossRef]
- Franco, A.A.; Iglesias-Arroyo, D.; Egea-Corbacho, Á.; Martín-García, A.P.; Quiroga, J.M.; Coello, M.D. Influence of Tourism on Microplastic Contamination at Wastewater Treatment Plants in the Coastal Municipality of Chiclana de La Frontera. Science of The Total Environment 2023, 900, 165573. [Google Scholar] [CrossRef]
- Magni, S.; Binelli, A.; Pittura, L.; Avio, C.G.; Della Torre, C.; Parenti, C.C.; Gorbi, S.; Regoli, F. The Fate of Microplastics in an Italian Wastewater Treatment Plant. Science of The Total Environment 2019, 652, 602–610. [Google Scholar] [CrossRef]
- Prasetya, K.D.; Hassan, F.; Yen, Y.-T.; Chen, P.-Y.; Jiang, J.-J.; Wang, Y.-F.; You, S.-J. Assessing the Fate of Microplastics in Multi-Stage Treatment Units through Distribution Patterns and Settling Dynamics Models. Journal of Contaminant Hydrology 2026, 276, 104734. [Google Scholar] [CrossRef] [PubMed]
- Ridall, A.; Farrar, E.; Dansby, M.; Ingels, J. Influence of Wastewater Treatment Plants and Water Input Sources on Size, Shape, and Polymer Distributions of Microplastics in St. Andrew Bay, Florida, USA. Marine Pollution Bulletin 2023, 187, 114552. [Google Scholar] [CrossRef] [PubMed]
- Zhang, L.; Liu, J.; Xie, Y.; Zhong, S.; Gao, P. Occurrence and Removal of Microplastics from Wastewater Treatment Plants in a Typical Tourist City in China. Journal of Cleaner Production 2021, 291, 125968. [Google Scholar] [CrossRef]
- Yaseen, A.; Assad, I.; Sofi, M.S.; Hashmi, M.Z.; Bhat, S.U. A Global Review of Microplastics in Wastewater Treatment Plants: Understanding Their Occurrence, Fate and Impact. Environmental Research 2022, 212, 113258. [Google Scholar] [CrossRef]
- AF-Plastics-the-Facts-2021_250122.
- Nematollahi, M.J.; Mobasheri, M.; Esmaeili, Z.; Mahmoudi, M.; Yousefi, N.; Busquets, R. Distribution and Abundance of Microplastics in Urban and Industrial Wastewater Treatment Plants in Tabriz Metropolis. Sci Rep 2025, 15, 24577. [Google Scholar] [CrossRef]
- Andrady, A.L. Microplastics in the Marine Environment. Marine Pollution Bulletin 2011, 62, 1596–1605. [Google Scholar] [CrossRef]
- Akarsu, C.; Kumbur, H.; Gökdağ, K.; Kıdeyş, A.E.; Sanchez-Vidal, A. Microplastics Composition and Load from Three Wastewater Treatment Plants Discharging into Mersin Bay, North Eastern Mediterranean Sea. Marine Pollution Bulletin 2020, 150, 110776. [Google Scholar] [CrossRef]
- Ziajahromi, S.; Neale, P.A.; Rintoul, L.; Leusch, F.D.L. Wastewater Treatment Plants as a Pathway for Microplastics: Development of a New Approach to Sample Wastewater-Based Microplastics. Water Research 2017, 112, 93–99. [Google Scholar] [CrossRef]
- Hajji, S.; Ben-Haddad, M.; Abelouah, M.R.; De-la-Torre, G.E.; Alla, A.A. Occurrence, Characteristics, and Removal of Microplastics in Wastewater Treatment Plants Located on the Moroccan Atlantic: The Case of Agadir Metropolis. Science of The Total Environment 2023, 862, 160815. [Google Scholar] [CrossRef]
- Luo, Y.; Xie, H.; Xu, H.; Zhou, C.; Wang, P.; Liu, Z.; Yang, Y.; Huang, J.; Wang, C.; Zhao, X. Wastewater Treatment Plant Serves as a Potentially Controllable Source of Microplastic: Association of Microplastic Removal and Operational Parameters and Water Quality Data. Journal of Hazardous Materials 2023, 441, 129974. [Google Scholar] [CrossRef]
- Üstün, G.E.; Bozdaş, K.; Can, T. Abundance and Characteristics of Microplastics in an Urban Wastewater Treatment Plant in Turkey. Environmental Pollution 2022, 310, 119890. [Google Scholar] [CrossRef] [PubMed]
- Napper, I.E.; Parker-Jurd, F.N.F.; Wright, S.L.; Thompson, R.C. Examining the Release of Synthetic Microfibres to the Environment via Two Major Pathways: Atmospheric Deposition and Treated Wastewater Effluent. Science of The Total Environment 2023, 857, 159317. [Google Scholar] [CrossRef]
- Gao, Z.; Cizdziel, J.V.; Wontor, K.; Vianello, A. Spatiotemporal Characteristics of Microplastics in a University Wastewater Treatment Plant: Influence of Sudden on-Campus Population Swings. Journal of Environmental Chemical Engineering 2022, 10, 108834. [Google Scholar] [CrossRef]
- Okoffo, E.D.; Rauert, C.; Thomas, K.V. Mass Quantification of Microplastic at Wastewater Treatment Plants by Pyrolysis-Gas Chromatography–Mass Spectrometry. Science of The Total Environment 2023, 856, 159251. [Google Scholar] [CrossRef] [PubMed]
- Yang, F.; Li, D.; Zhang, Z.; Wen, L.; Liu, S.; Hu, E.; Li, M.; Gao, L. Characteristics and the Potential Impact Factors of Microplastics in Wastewater Originated from Different Human Activity. Process Safety and Environmental Protection 2022, 166, 78–85. [Google Scholar] [CrossRef]
- Zhang, Z.; Liu, W.; Gao, Q.; Huang, F.; Kang, Y.; Pan, Y.; Luo, G.; Zhou, X.; Fan, L.; Wang, A.; et al. Microplastics Extraction from Wastewater Treatment Plants: Two-Step Digestion Pre-Treatment and Application. Water Research 2023, 230, 119569. [Google Scholar] [CrossRef]
- Martín-García, A.P.; Egea-Corbacho, Á.; Franco, A.A.; Rodríguez-Barroso, R.; Coello, M.D.; Quiroga, J.M. Grab and Composite Samples: Variations in the Analysis of Microplastics in a Real Wastewater Treatment Plant in the South of Spain. Journal of Environmental Chemical Engineering 2023, 11, 109486. [Google Scholar] [CrossRef]
- Bayo, J.; Olmos, S.; López-Castellanos, J. Microplastics in an Urban Wastewater Treatment Plant: The Influence of Physicochemical Parameters and Environmental Factors. Chemosphere 2020, 238, 124593. [Google Scholar] [CrossRef]
- Blair, R.M.; Waldron, S.; Gauchotte-Lindsay, C. Average Daily Flow of Microplastics through a Tertiary Wastewater Treatment Plant over a Ten-Month Period. Water Research 2019, 163, 114909. [Google Scholar] [CrossRef]
- Browne, M.A.; Crump, P.; Niven, S.J.; Teuten, E.; Tonkin, A.; Galloway, T.; Thompson, R. Accumulation of Microplastic on Shorelines Woldwide: Sources and Sinks. Environmental Science and Technology 2011, 45, 9175–9179. [Google Scholar] [CrossRef]
- De Falco, F.; Gullo, M.P.; Gentile, G.; Di Pace, E.; Cocca, M.; Gelabert, L.; Brouta-Agnésa, M.; Rovira, A.; Escudero, R.; Villalba, R.; et al. Evaluation of Microplastic Release Caused by Textile Washing Processes of Synthetic Fabrics. Environmental Pollution 2018, 236, 916–925. [Google Scholar] [CrossRef]
- Schell, T.; Hurley, R.; Nizzetto, L.; Rico, A.; Vighi, M. Spatio-Temporal Distribution of Microplastics in a Mediterranean River Catchment: The Importance of Wastewater as an Environmental Pathway. Journal of Hazardous Materials 2021, 420, 126481. [Google Scholar] [CrossRef]
Figure 1.
Location of the sample sites of the seven urban WWTPs in the South of Spain.
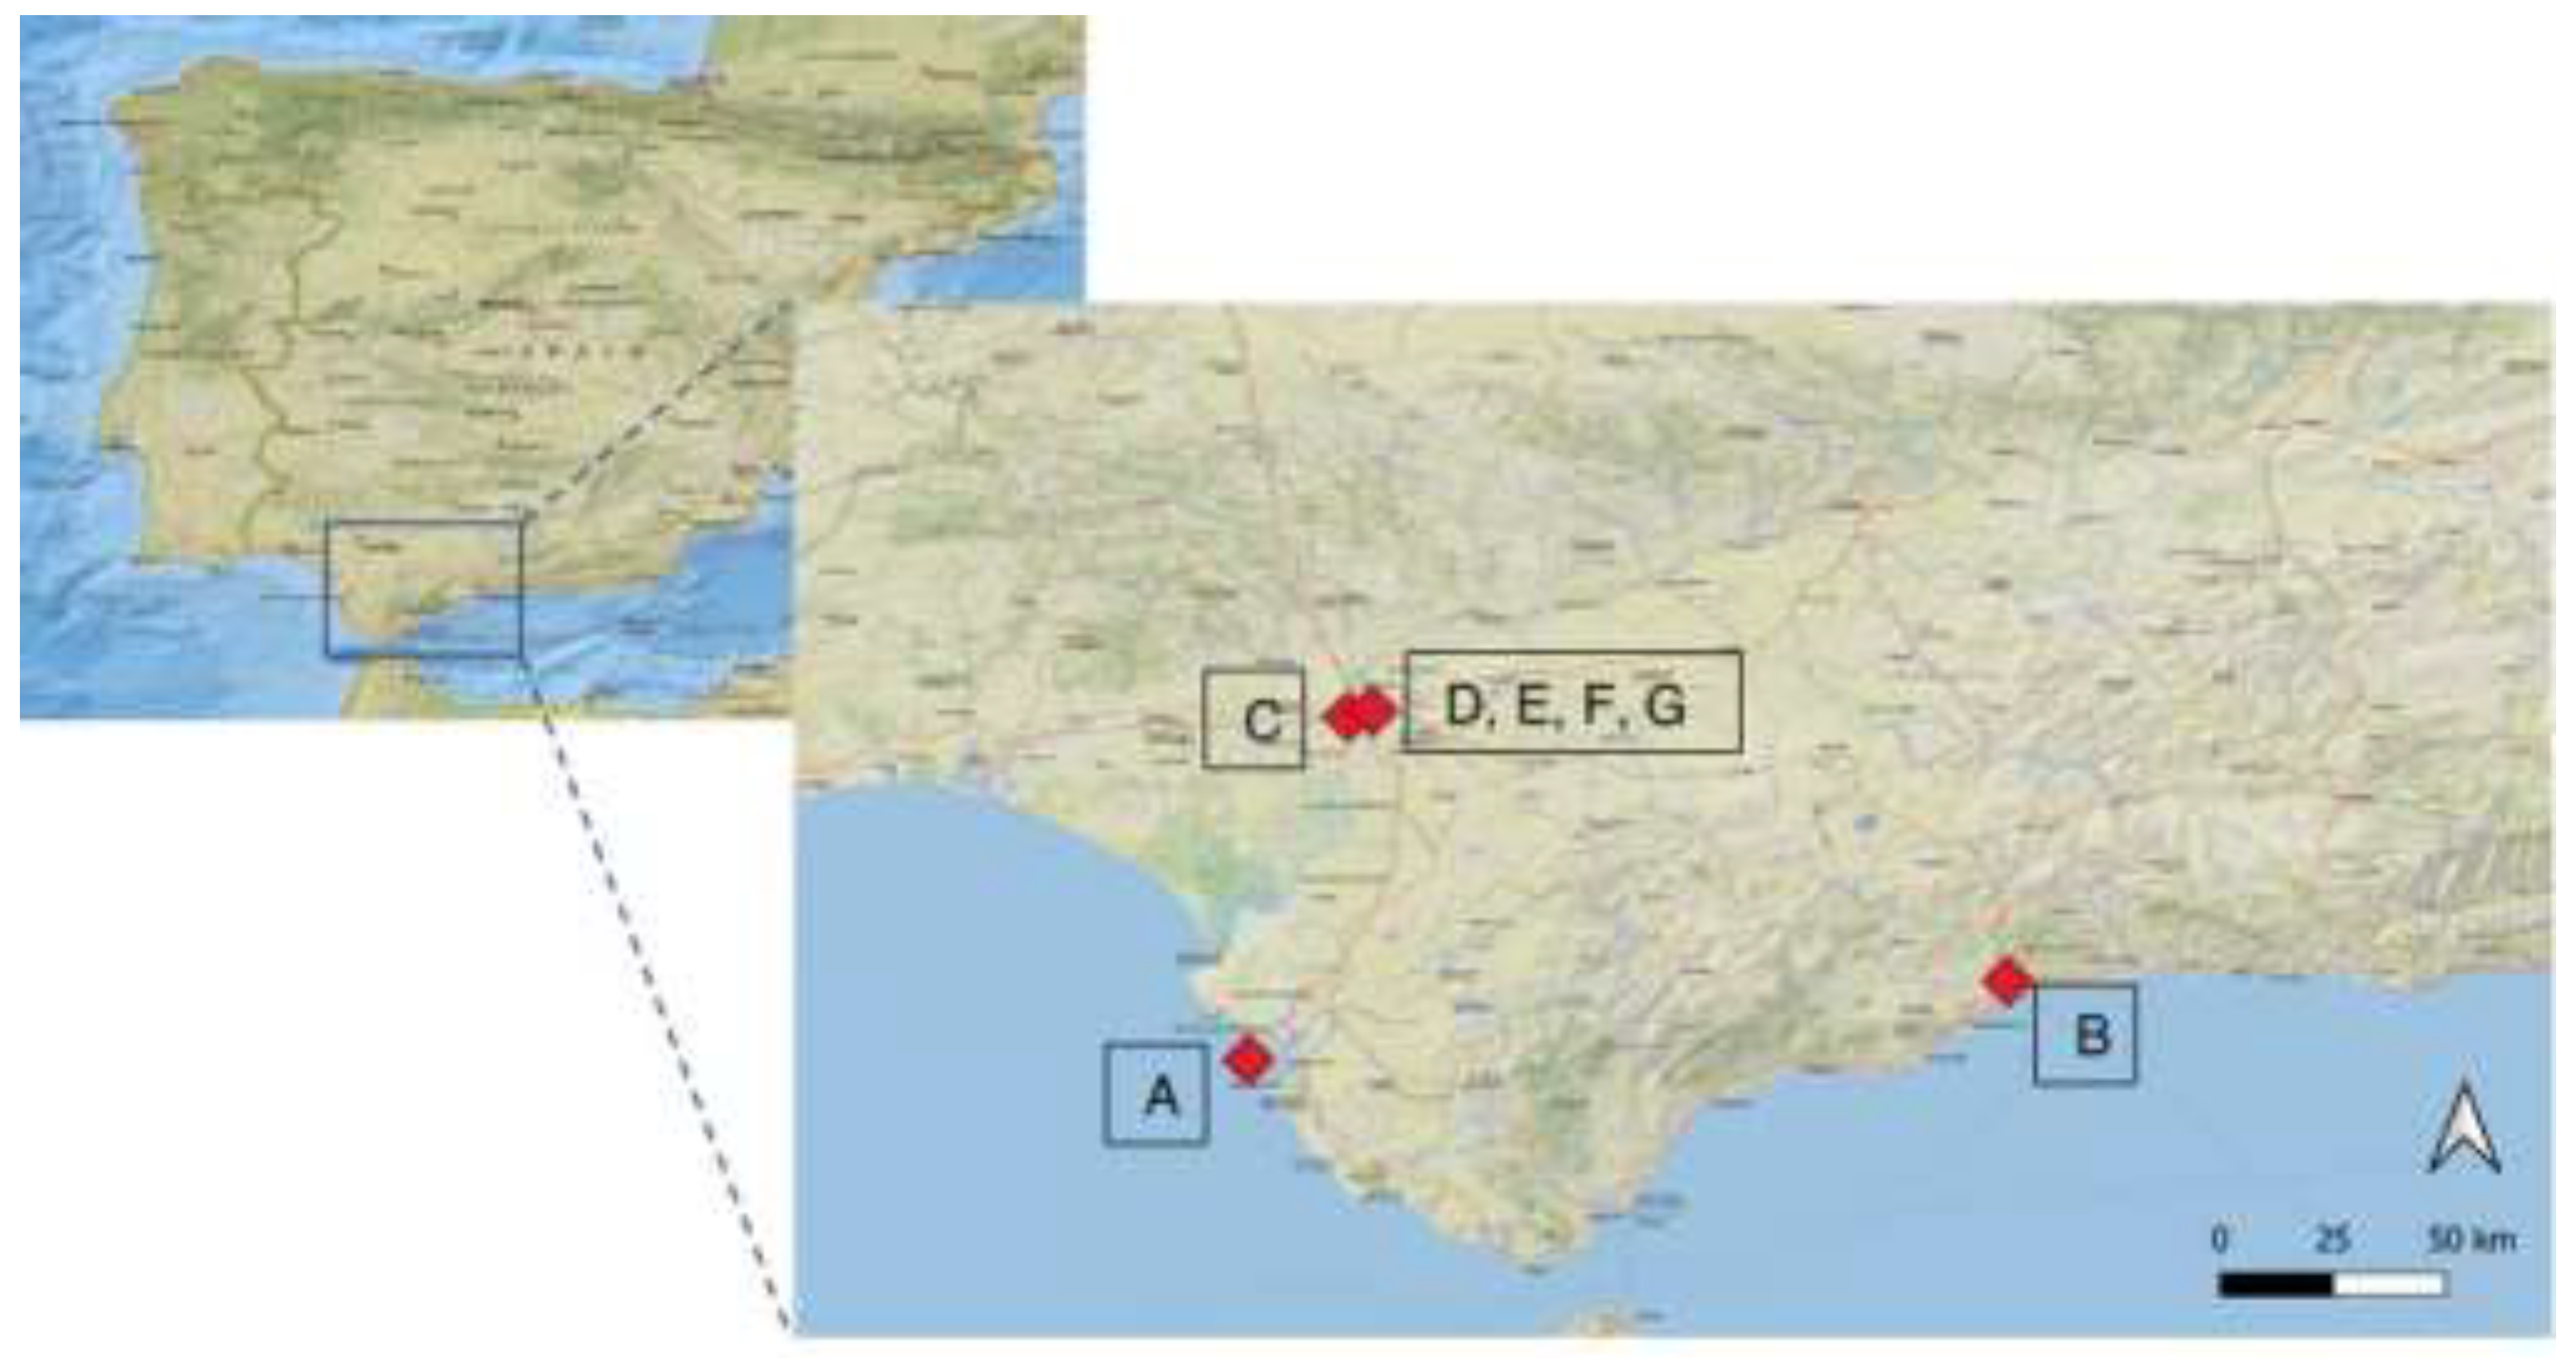
Figure 2.
MPs composition (%) detected in influent and effluent of the seven WWTPs in Southern Spain from July to December 20.
Figure 2.
MPs composition (%) detected in influent and effluent of the seven WWTPs in Southern Spain from July to December 20.
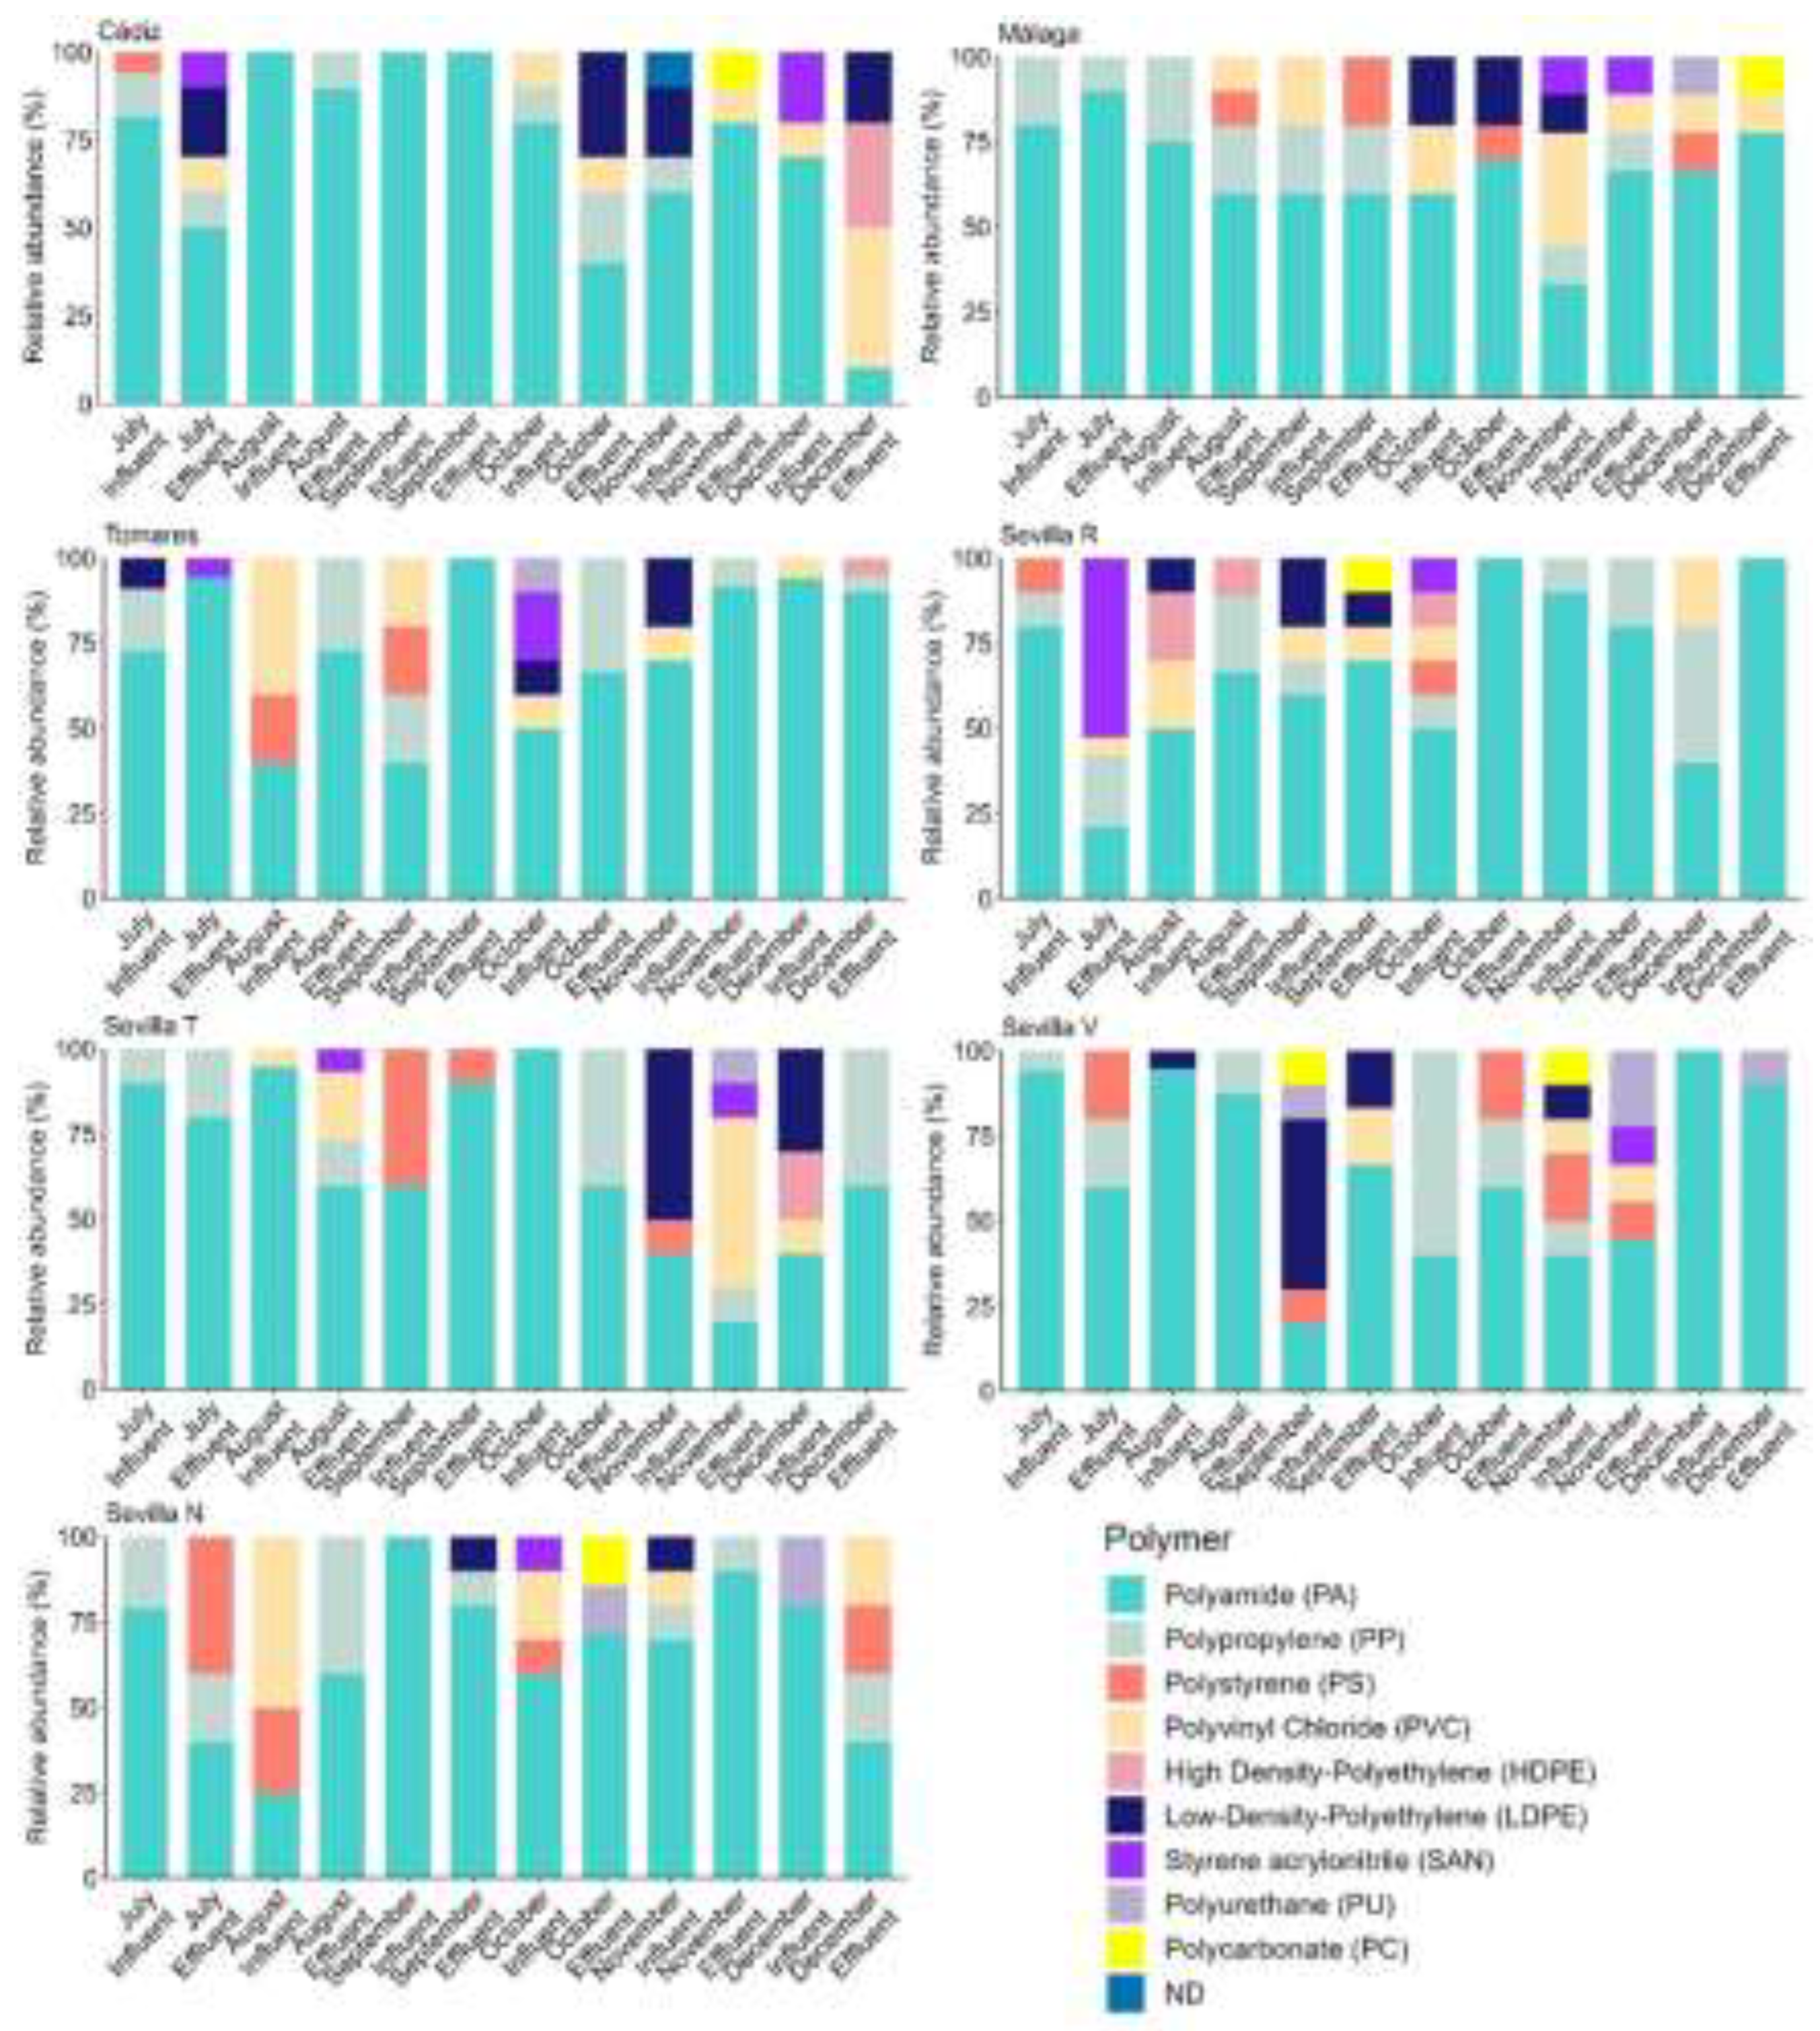
Figure 3.
Particles size (mm) of the fiber found in the influent (left) and effluent (right) in the seven WWTPs in Southern Spain from July to December 2020.
Figure 3.
Particles size (mm) of the fiber found in the influent (left) and effluent (right) in the seven WWTPs in Southern Spain from July to December 2020.
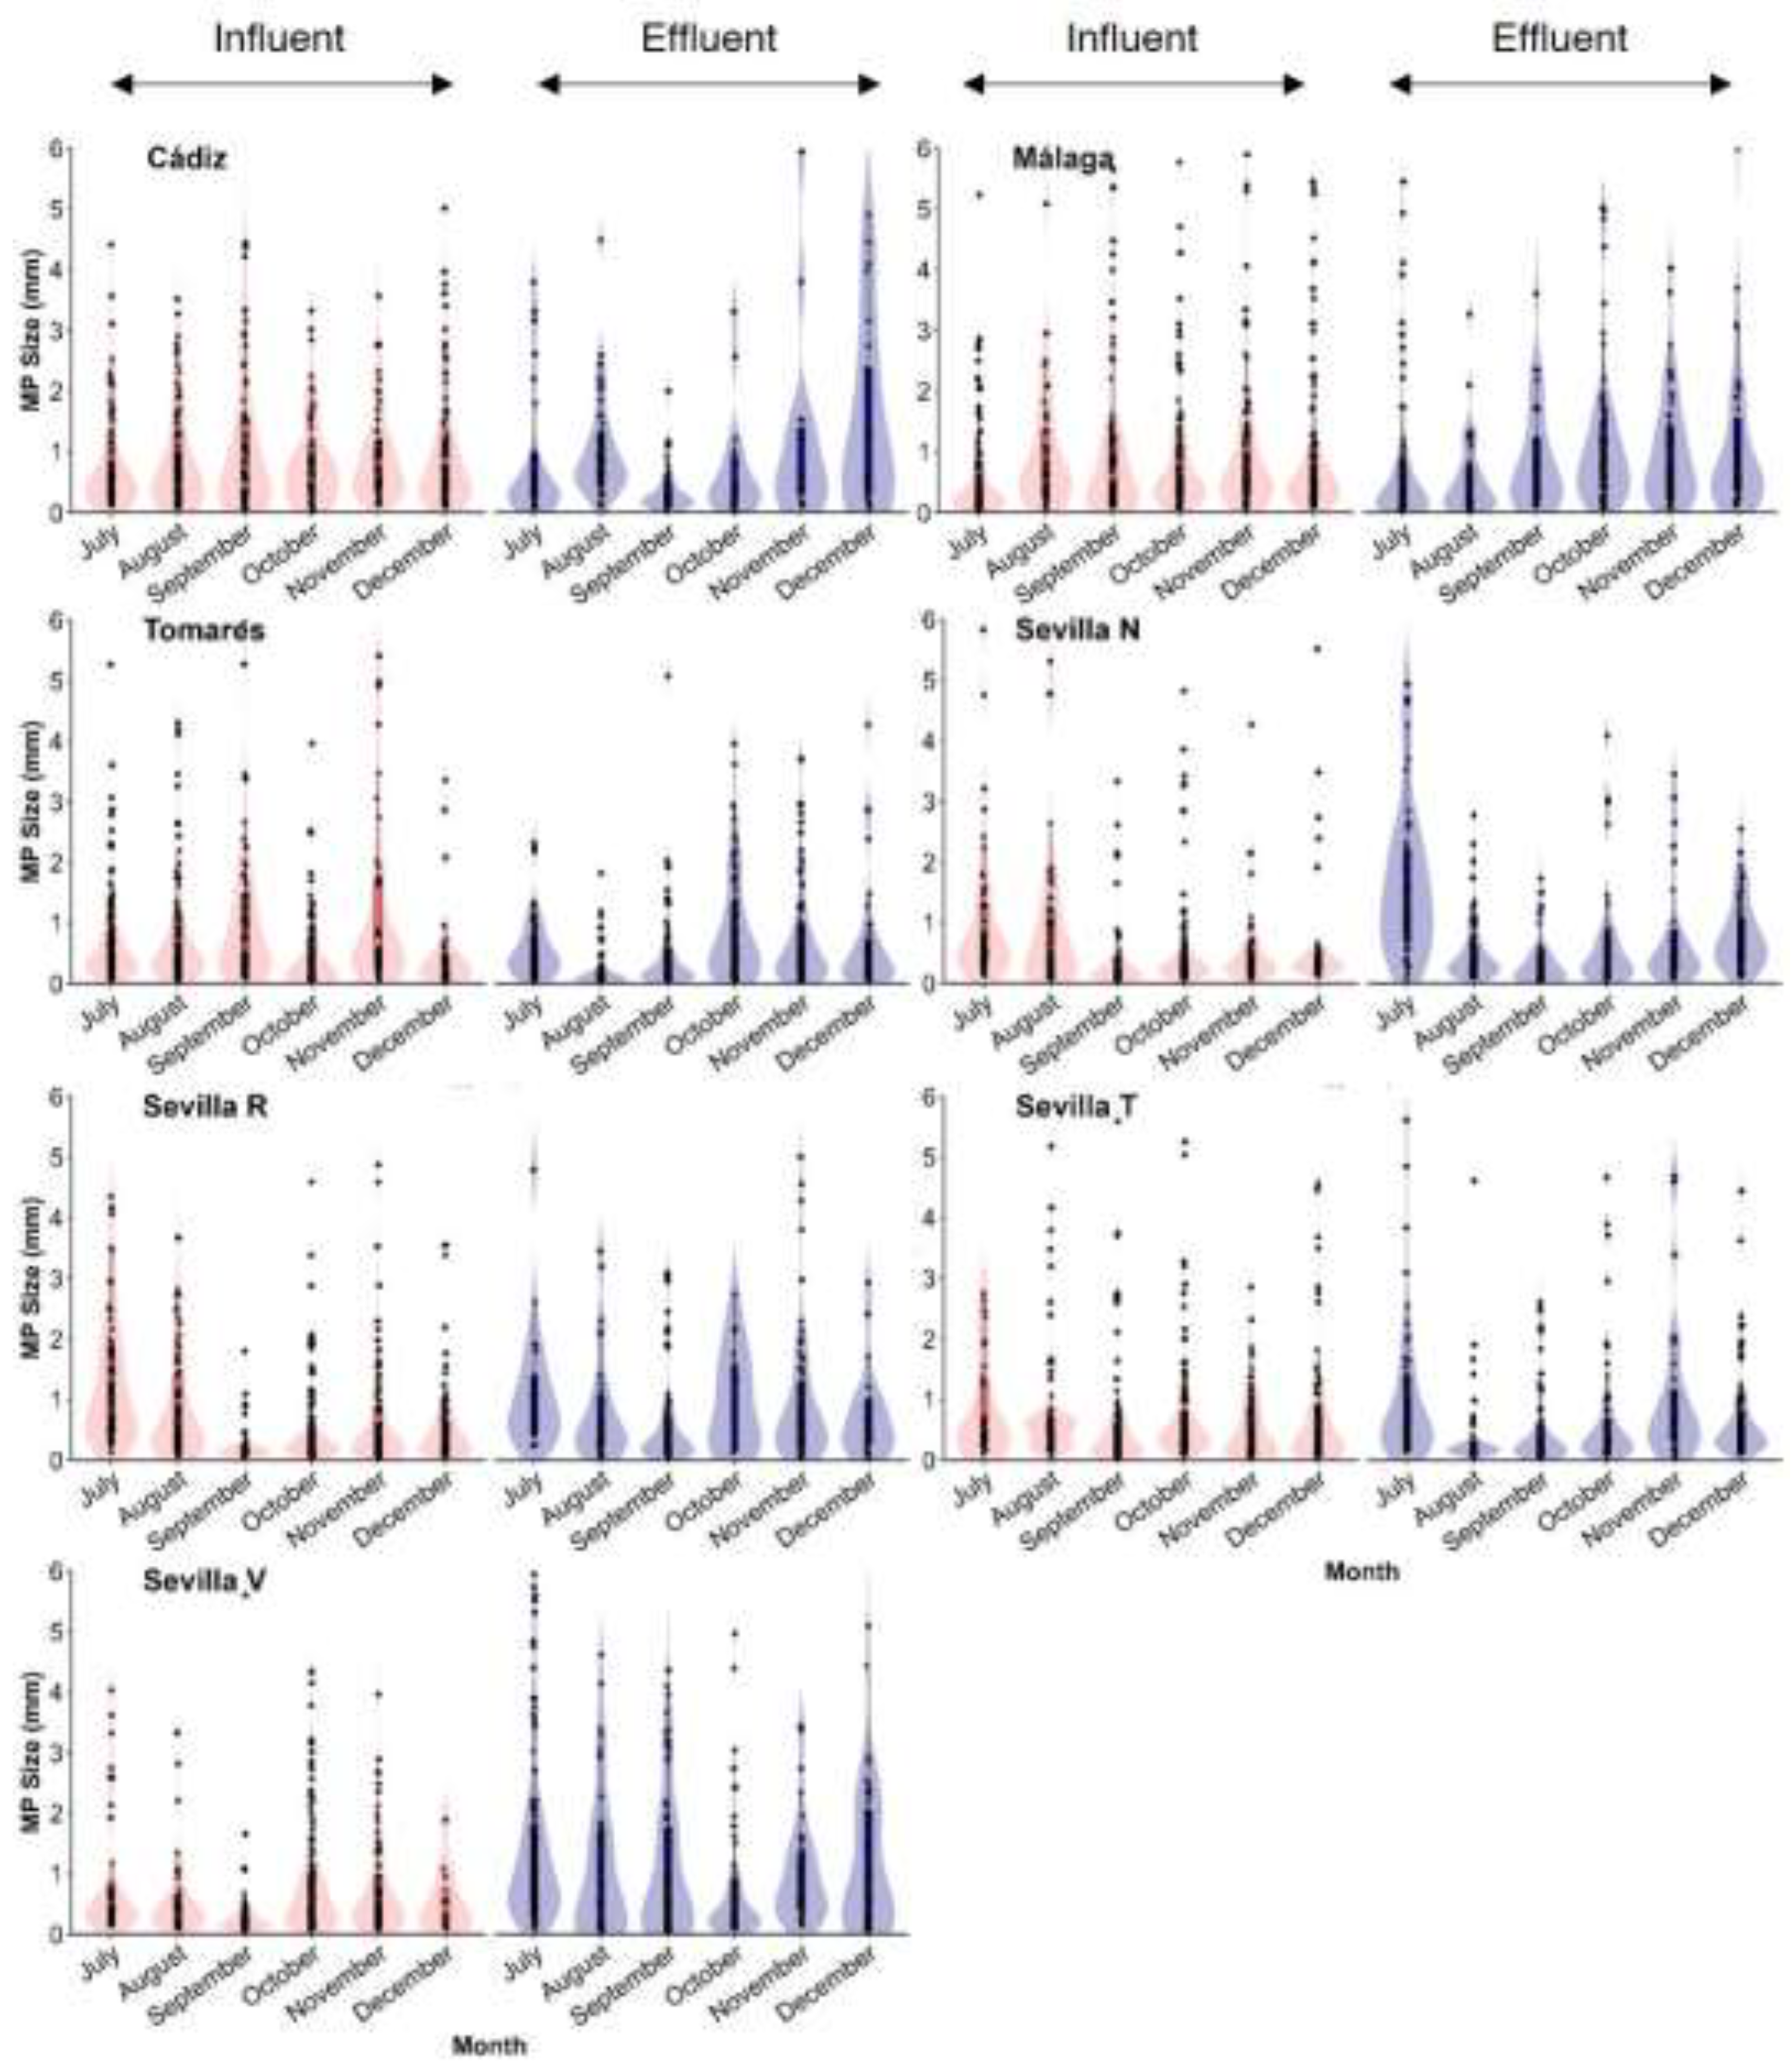
Figure 4.
The total number of items (fibres and particles) found in the seven WWTPs in Southern Spain from July to December 2020.
Figure 4.
The total number of items (fibres and particles) found in the seven WWTPs in Southern Spain from July to December 2020.
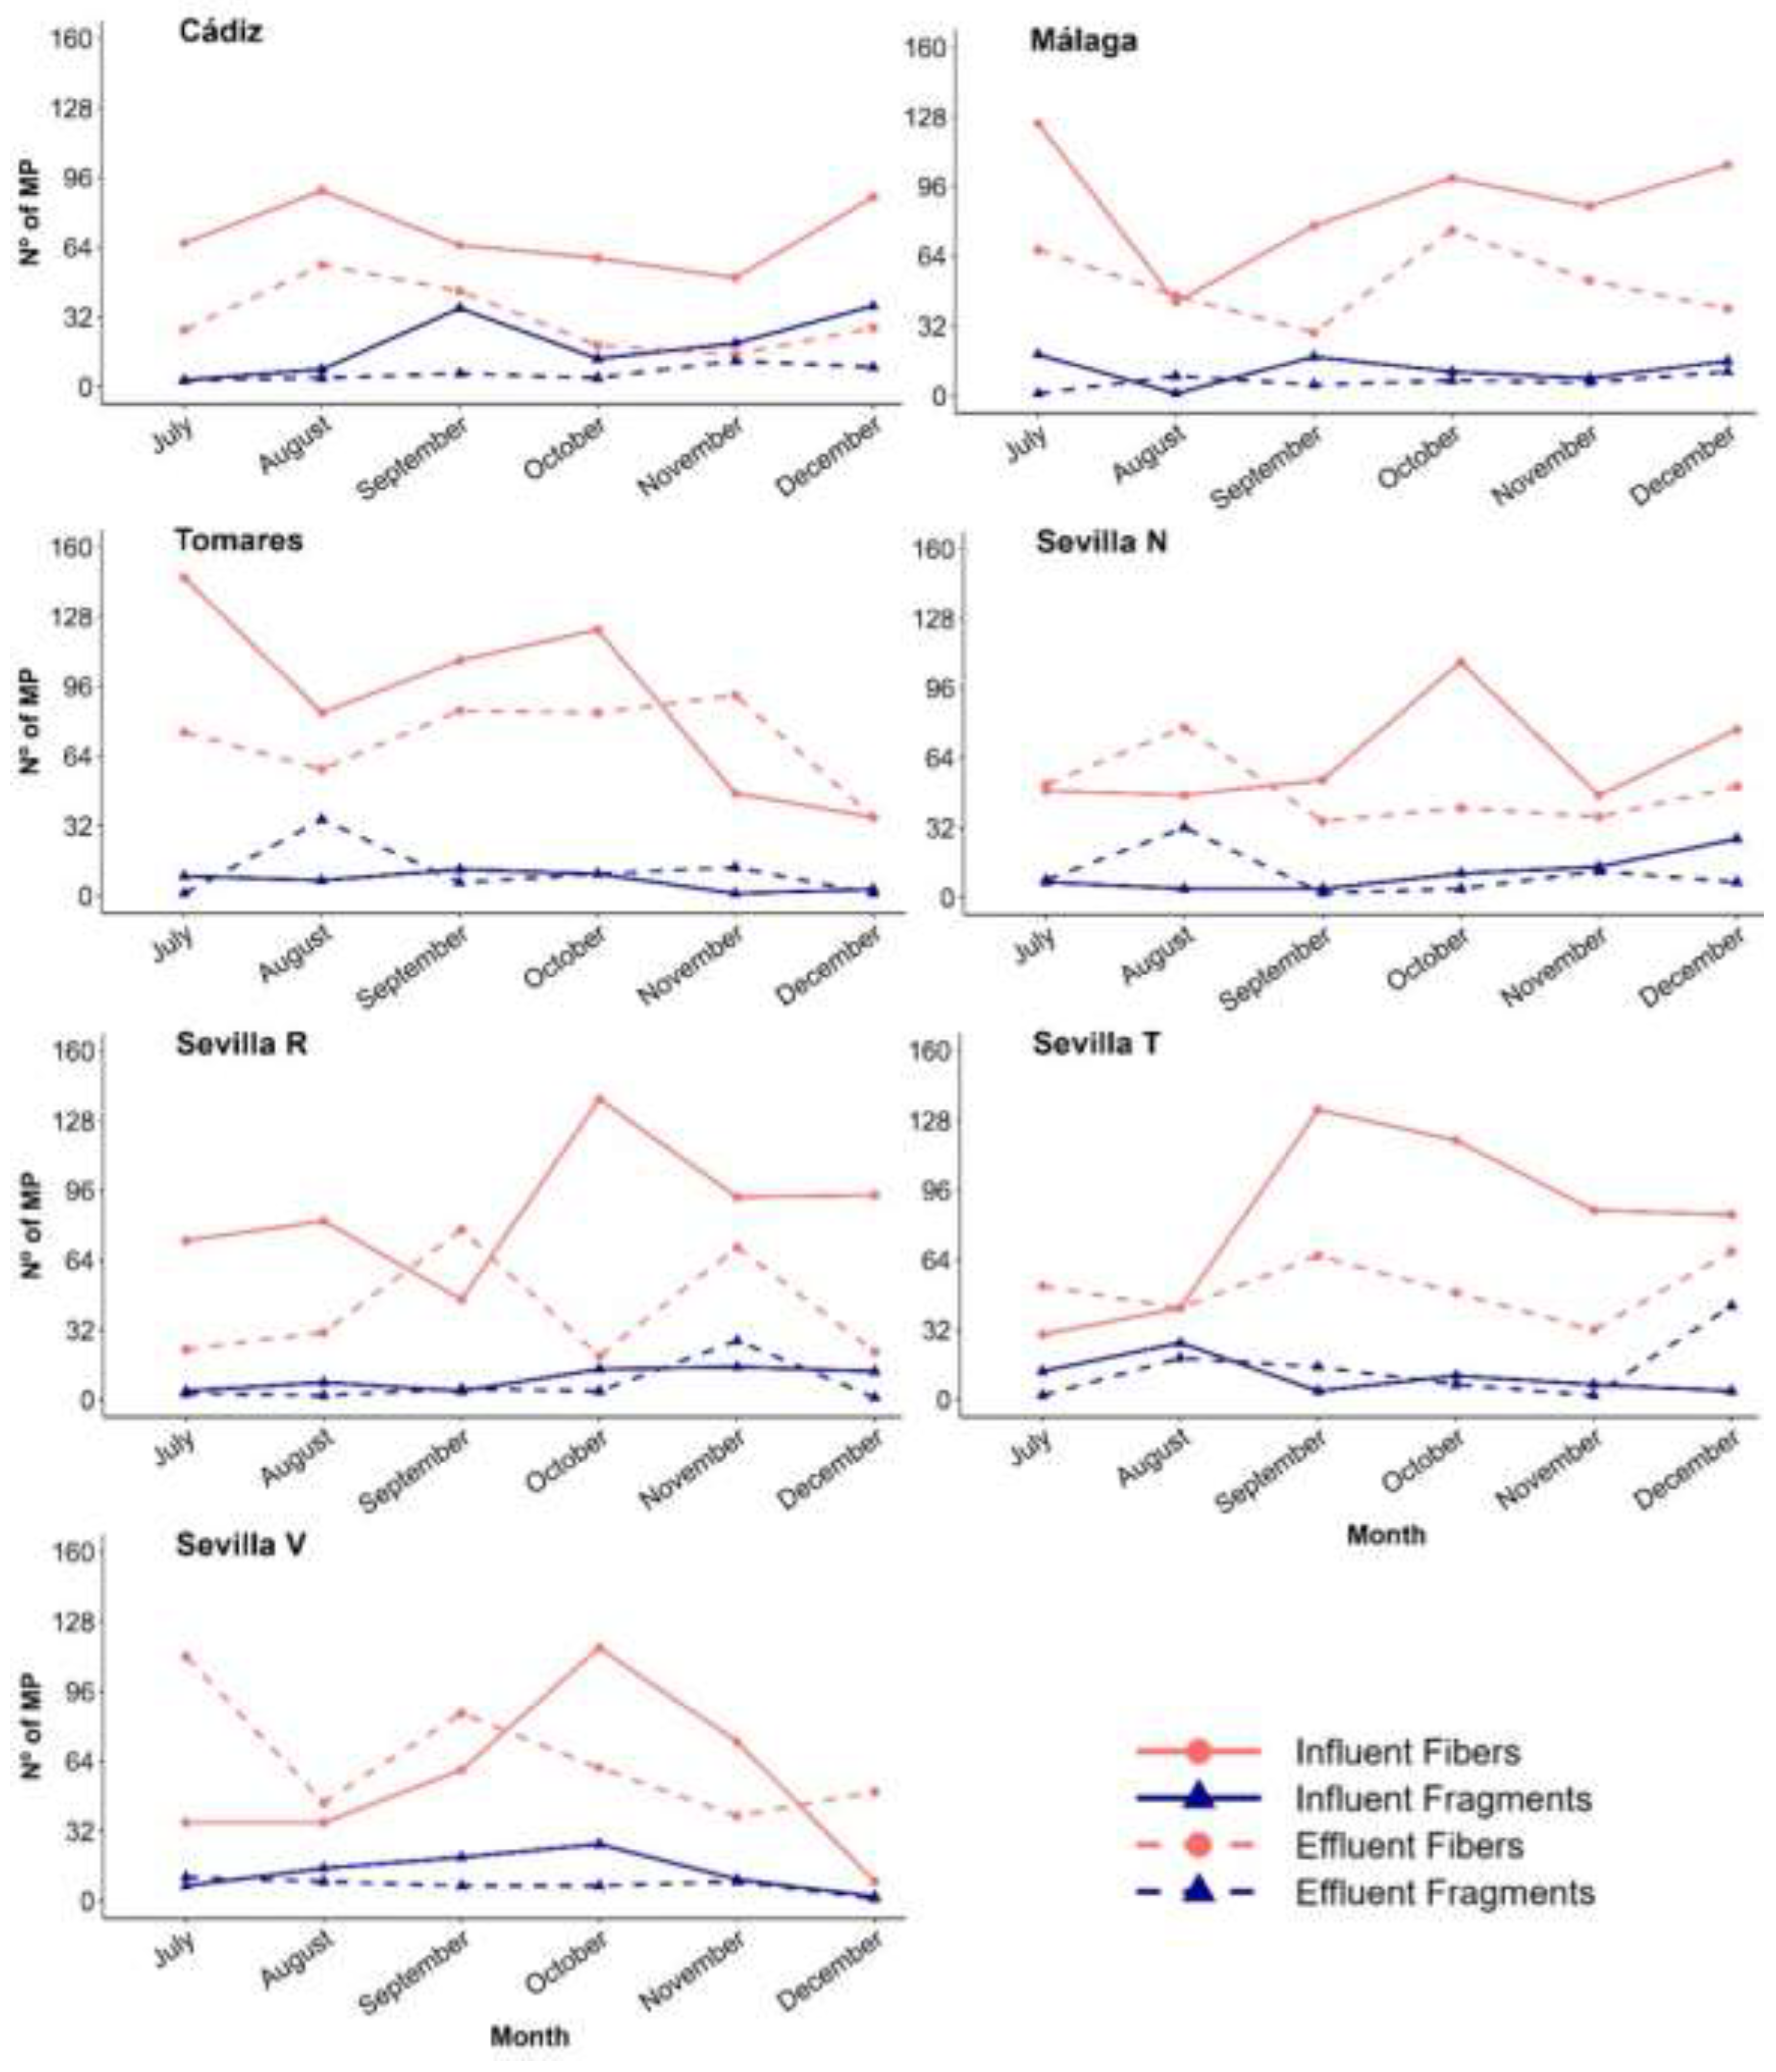
Figure 5.
The total number of items (fibres and particles) found in the influent (left) and effluent (right) in the seven WWTPs in Southern Spain from July to December 2020. In addition, the observed colour of each individual item is indicated in the stacked bars.
Figure 5.
The total number of items (fibres and particles) found in the influent (left) and effluent (right) in the seven WWTPs in Southern Spain from July to December 2020. In addition, the observed colour of each individual item is indicated in the stacked bars.
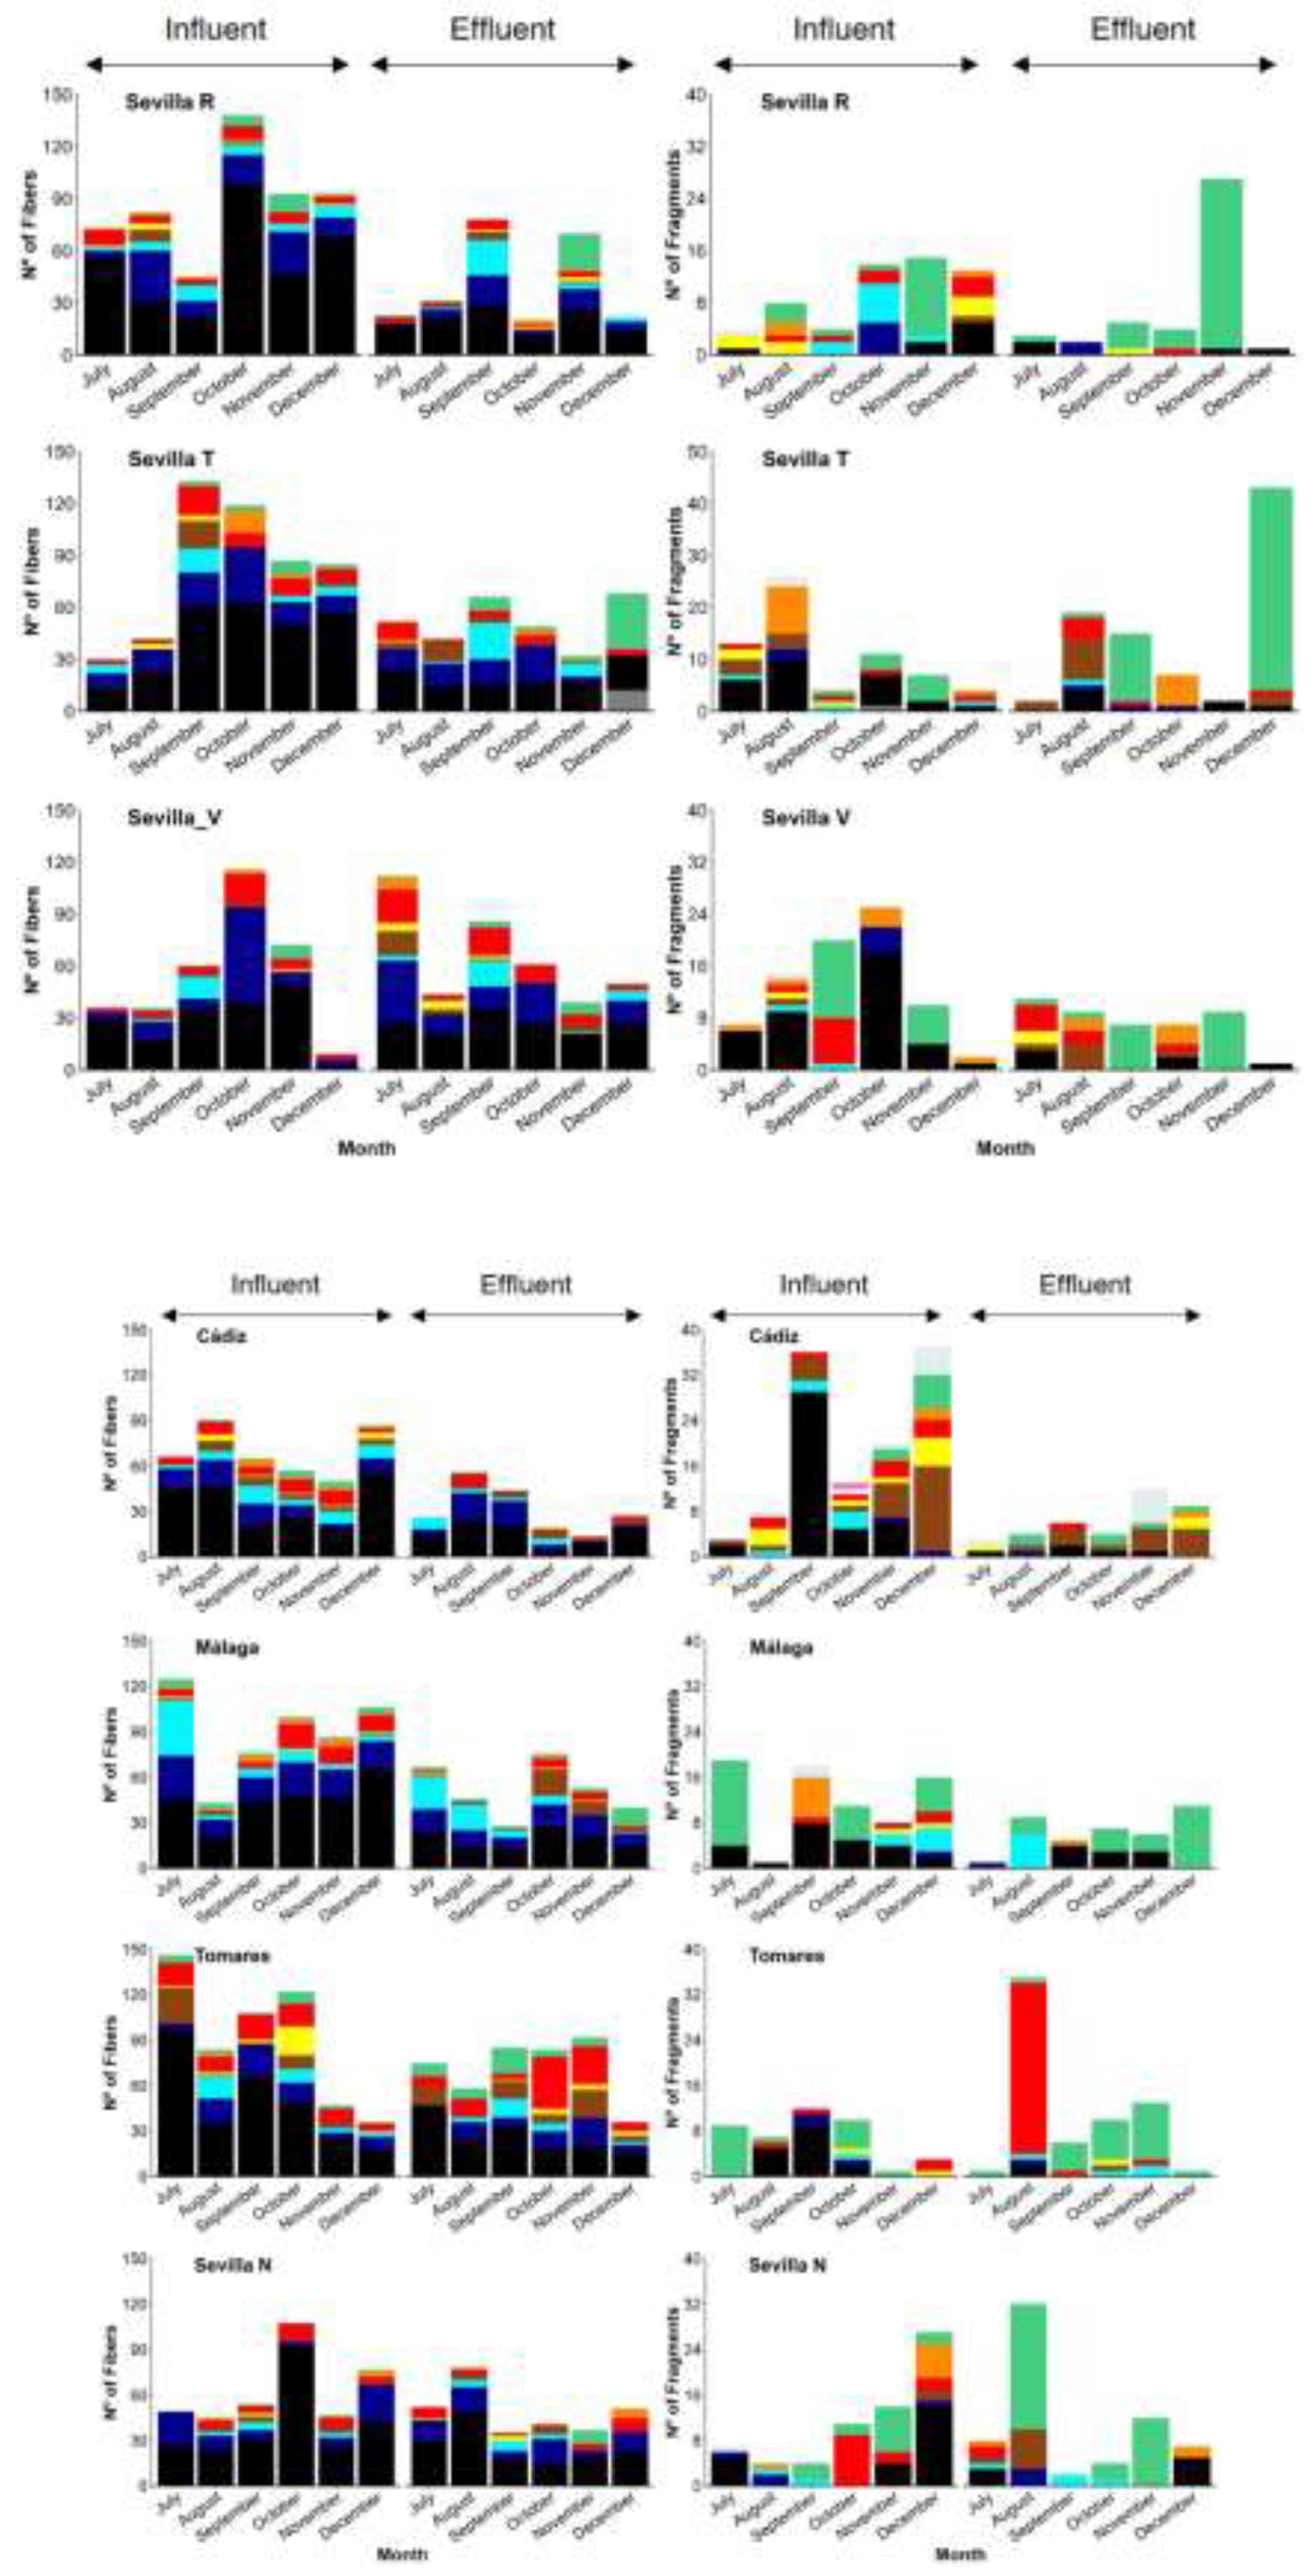

Table 1.
Information about the seven WWTPs analyzed, in the Andalusian region.
| WWTP | Location | Treatment capacity (m3/d) |
Population equivalent | Influx composition | Type of process | Water treatment processs |
|---|---|---|---|---|---|---|
| A Cádiz | Coast | 75,000 | 375,000 | Urban | Activated sludge, anaerobic digestion | Primary, secondary |
| B Málaga | Coast | 177,000 | 1,300,000 | Urban | Activated sludge, anaerobic digestion, ultrafiltration | Primary, secondary |
| C Tomares | Inland area | 112,000 | 350,000 | Urban | Activated sludge, anaerobic digestion | Primary, secondary |
| D Sevilla N | Inland area | 90,000 | 350,000 | Urban | Activated sludge, anaerobic digestion, | Primary, secondary |
| E Sevilla R | Inland area | 90,000 | 350,000 | Urban | Activated sludge, anaerobic digestion, N and P removal, tertiary treatment | Primary, secondary, tertiary |
| F Sevilla T | Inland area | 50,000 | 200,000 | Urban | Activated sludge, anaerobic digestion | Primary, secondary |
| G Sevilla V | Inland area | 9,220 | 41,000 | Urban | Carrousel system, N and P removal, sludge dewatering | Primary, secondary |
Table 2.
The microplastic concentrations (Microplastics per litre, MP/L) found over the six-month sampling period in each water samples of WWTP influent and effluent.
Table 2.
The microplastic concentrations (Microplastics per litre, MP/L) found over the six-month sampling period in each water samples of WWTP influent and effluent.
| Cádiz | Málaga | Tomares | Sevilla N | Sevilla R | Sevilla T | Sevilla V | |||
|---|---|---|---|---|---|---|---|---|---|
| July | Influent | 35 | 72 | 78 | 28 | 39 | 22 | 22 | |
| Effluent | 13 | 34 | 38 | 30 | 13 | 28 | 62 | ||
| August | Influent | 49 | 22 | 46 | 26 | 45 | 34 | 26 | |
| Effluent | 30 | 28 | 47 | 55 | 17 | 31 | 27 | ||
| September | Influent | 51 | 48 | 60 | 29 | 25 | 69 | 40 | |
| Effluent | 25 | 17 | 46 | 19 | 42 | 41 | 47 | ||
| October | Influent | 36 | 56 | 66 | 60 | 76 | 65 | 71 | |
| Effluent | 12 | 42 | 47 | 23 | 12 | 28 | 34 | ||
| November | Influent | 35 | 48 | 24 | 31 | 54 | 47 | 42 | |
| Effluent | 14 | 30 | 53 | 25 | 49 | 17 | 24 | ||
| December | Influent | 62 | 61 | 20 | 52 | 54 | 45 | 6 | |
| Effluent | 18 | 26 | 19 | 29 | 12 | 65 | 26 | ||
Disclaimer/Publisher’s Note: The statements, opinions and data contained in all publications are solely those of the individual author(s) and contributor(s) and not of MDPI and/or the editor(s). MDPI and/or the editor(s) disclaim responsibility for any injury to people or property resulting from any ideas, methods, instructions or products referred to in the content. |
© 2026 by the authors. Licensee MDPI, Basel, Switzerland. This article is an open access article distributed under the terms and conditions of the Creative Commons Attribution (CC BY) license (http://creativecommons.org/licenses/by/4.0/).
Copyright: This open access article is published under a Creative Commons CC BY 4.0 license, which permit the free download, distribution, and reuse, provided that the author and preprint are cited in any reuse.


