

Submitted:
12 February 2026
Posted:
14 February 2026
You are already at the latest version
Abstract
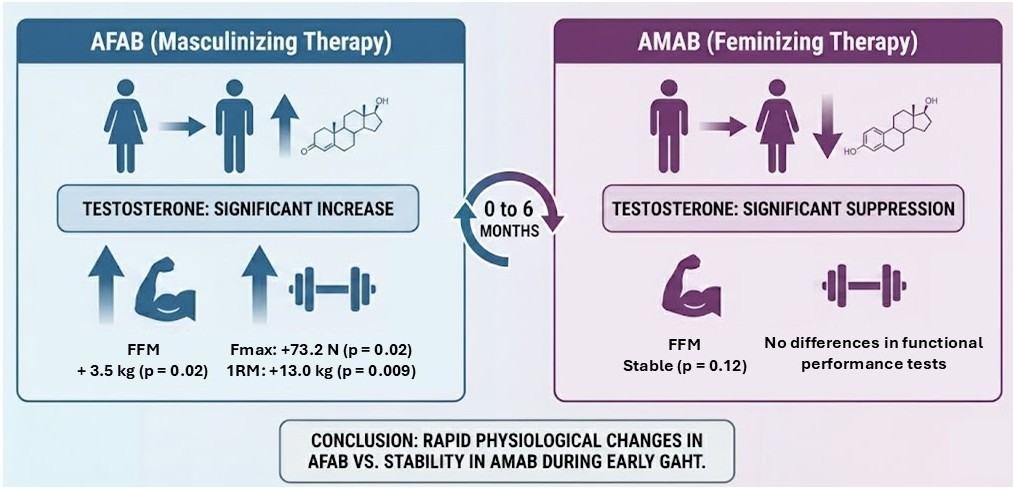
Background/Objectives: Gender-affirming hormone therapy (GAHT) is a cornerstone of medical transition, yet its early effects on physical performance and body composition remain partially explored, particularly in non-athletic individuals. This pilot study aimed to evaluate the short-term, within-individual changes in strength, anthropometry, and body composition in not-athletic transgenders during the first six months of GAHT. Methods: This prospective longitudinal study enrolled 19 participants (8 assigned female at birth [AFAB]; 11 assigned male at birth [AMAB]). Participants were assessed at baseline (T0) and after six months of GAHT (T6). Assessments included bioelectrical impedance analysis (BIA) for body composition, isometric leg extension (maximal force [Fmax] and endurance), 1-repetition maximum (1RM) bench press, handgrip strength (HG), and submaximal cycle ergometry for VO2max estimation. Results: In the AFAB group, GAHT led to a significant increase in total testosterone (TT), fat-free mass (+3.5 kg; p = 0.020), Fmax (p = 0.015), and 1RM bench press (+13.0 kg; p = 0.009). A strong correlation was found between TT increases and 1RM improvements (r = 0.718). Conversely, the AMAB group achieved significant suppression of TT and gonadotropins but exhibited remarkable stability in all anthropometric parameters and functional performance metrics, with no significant declines in strength or cardiorespiratory fitness (p > 0.05). Conclusions: These findings reveal a distinct sexual dimorphism in the early response to GAHT. While AFAB individuals experience rapid functional and anabolic gains, AMAB individuals maintain physical stability during the first six months of therapy. Our findings suggest the recommendation to lifestyle shifts from sedentary to active physical training session in transgender individuals to preserve them from potential metabolic adverse effects of GAHT in the long-term.
Keywords:
transgender
; physical exercise
; exercise performance
; gender dysphoria
; body composition
; testosterone
; estrogens
1. Introduction
Gender-affirming hormone therapy (GAHT) constitutes a fundamental component of the medical transition process for transgender individuals, aiming to align secondary sex characteristics with affirmed gender identity and to alleviate gender dysphoria [1]. Over the past decade, access to GAHT has expanded and clinical protocols have become increasingly standardized, contributing to substantial improvements in psychological well-being, quality of life, and social functioning among transgender people [1,2]. Despite these advances, the biological effects of GAHT on physical performance and body composition remain only partially explored, and current evidence is characterized by significant heterogeneity in study design, methodology, and participant populations [3,4].
It is well established that sex steroids play a central role in regulating muscle mass, fat distribution, bone integrity, and cardiorespiratory function in cisgender individuals [5]. Testosterone, in particular, exerts anabolic effects on skeletal muscle, enhances hemoglobin concentration, and influences neuromuscular efficiency, while estrogen promotes increases in fat mass - especially in peripheral compartments - and modulates connective tissue properties [5]. Given these known physiological roles, GAHT is expected to induce measurable changes in strength, endurance, anthropometric parameters, and body composition. However, the extent to which these changes manifest, their inter-individual variability, and the time course with which they appear during the early phases of therapy remain insufficiently characterized in transgender cohorts [3].
The existing literature offers valuable but incomplete insights. Several cross-sectional and short-term longitudinal studies have reported reductions in muscle mass and strength among transgender women receiving feminizing hormone therapy [6], and increases in lean mass and hemoglobin among transgender men on masculinizing regimens [7].
However, the current body of evidence is constrained by several methodological limitations. First, most available studies are cross-sectional rather than longitudinal, limiting the ability to capture within-individual trajectories of change during the early phases of GAHT [3]. Second, assessments of physical performance have relied predominantly on hand-grip dynamometry, largely due to its simplicity and accessibility [3,8]. Although grip strength is associated with general health status in older adults and correlates with upper-body maximal strength in certain movement patterns, it is an incomplete proxy for overall muscular performance [9]. Evidence indicates that hand-grip strength correlates only weakly with lower-limb strength - particularly knee flexion and extension - and therefore provides a limited representation of global neuromuscular function [10]. Comprehensive evaluations that integrate both upper- and lower-limb performance metrics remain notably scarce [3].
A further limitation concerns the populations enrolled in existing research. Several studies include competitive or recreational athletes, whose training regimens, neuromuscular adaptations, and baseline performance levels may substantially influence outcomes [11,12]. This heterogeneity makes it challenging to disentangle the specific contribution of GAHT from the confounding effects of structured physical training, thereby restricting the generalizability of findings to non-athletic transgender individuals.
Taken together, these gaps highlight the need for well-designed, prospective studies that systematically evaluate early alterations in physical performance and body composition using multidimensional assessment tools and non-athletic cohorts. In this context, the present study aims to serve as a pilot investigation addressing these limitations by examining the short-term, within-individual effects of GAHT on strength, anthropometry, and body composition in a longitudinal framework.
2. Materials and Methods
2.1. Study Design
This study was designed as a prospective, longitudinal observational investigation. Participants were consecutively recruited from 1st March 2025 to 30th June 2025 following a clinical diagnosis of gender dysphoria [13] at the Outpatient Clinic for Gender Dysphoria of the “Renato Dulbecco” University Hospital in Catanzaro, Italy. All individuals subsequently underwent a comprehensive physical and functional assessment at the Laboratory of Exercise and Sport Sciences, University “Magna Graecia” of Catanzaro.
All participants completed a preliminary pre-test session consisting of anthropometric measurements, body composition assessment, and a familiarization exercise test to ensure full understanding of the experimental procedures.
Each participant was assessed at two timepoints:
- Baseline (T0): Prior to the initiation of GAHT.
- Follow-up (T6): Six months after the start of GAHT.
The study was conducted in accordance with the Declaration of Helsinki, and approved by the Calabria Region Ethics Committee (protocol code 25/2025). Participants were fully informed of the objectives, procedures, risks, and potential benefits of the study and provided written informed consent prior to enrolment.
2.2. Participants
A total of 25 non-athletic individuals diagnosed with gender dysphoria and initiating GAHT were enrolled. Patients were classified according to sex assigned at birth into two groups: Assigned Female at Birth (AFAB) and Assigned Male at Birth (AMAB). They were excluded if reporting contraindications to physical activity as determined by the Physical Activity Readiness Questionnaire [14]. The final sample comprised 19 participants (8 AFAB and 11 AMAB) due to the following circumstances: one participant discontinued GAHT, four did not complete the follow-up assessment, and one presented with a non-compliant interval between T0 and T6 evaluations. All of the 19 participants completed both assessments.
2.3. Study Protocol
All evaluations were conducted at both T0 and T6 using identical procedures.
GAHT regimens were prescribed according to current clinical practice and individualized medical assessment [1,15].
AFAB individuals received masculinizing hormone therapy consisting of either transdermal testosterone gel or intramuscular testosterone undecanoate. Treatment was titrated to maintain serum testosterone concentrations within the physiological male reference range, to ensure adequate suppression of the hypothalamic-pituitary-ovarian axis, and to preserve hematocrit levels within normal limits.
AMAB individuals received feminizing hormone therapy, consisting of anti-androgen treatment with triptorelin acetate to suppress the hypothalamic-pituitary-testicular axis, combined with estrogen therapy administered either as transdermal estradiol or oral estradiol valerate. Estrogen regimens were adjusted according to clinical practice to achieve desired feminization while maintaining safety parameters.
Routine biochemical monitoring - including sex-hormone assays [luteinizing hormone (LH), follicle-stimulating hormone (FSH), total testosterone (TT), estradiol (E2), prolactin (PRL)], liver and kidney function markers, and complete blood count - was performed at each clinical visit to ensure therapeutic effectiveness and safety. Blood samples were collected by venipuncture with the use of sterile BD Vacutainer ® tubes and 23-Ga needles. Serum hormonal levels were measured via Advia Centaur XP ® (Siemens Healthcare Diagnostics Inc., Tarrytown, NY, USA) throughout chemiluminescence assays using commercial kits. For the current study, only the biochemical tests executed at T0 and T6 were considered.
2.3.1. Anthropometric and Body Composition Measures
Body height and mass were measured using a SECA stadiometer with integrated scale (Intermed S.r.l., Milan, Italy; accuracy: 0.1 cm and 0.1 kg). Height was recorded with participants standing barefoot, heels together, arms relaxed, head oriented to the Frankfurt plane, and following a deep inhalation to reach maximal vertical extension.
Body composition was assessed by bioelectrical impedance analysis (BIA) (BIA 101, AKERN, Florence, Italy). Participants wore light clothing, removed metal accessories, and abstained from food for 3-4 hours before the test. Measurements were performed in the supine position after a brief acclimation period. Two single-use electrodes were placed unilaterally on the hand and foot. Variables included:
- Body mass index (BMI, kg/m²);
- Fat mass (FM, kg)
- Fat mass (FM, %);
- Fat-free mass (FFM, kg);
- Skeletal muscle mass (SMM, kg).
2.3.2. Weekly Physical Activity Level
Physical activity was quantified using the Global Physical Activity Questionnaire [16], capturing activity performed in work, transport, and leisure domains. Total physical activity was expressed as metabolic equivalent of task (MET)-minutes per week.
2.3.3. Physical Performance Assessment
Following the pre-test familiarization, participants performed a standardized battery of functional tests at both time points.
- Isometric leg extension protocol. Isometric knee extensor maximal force (Fmax) and mean force (Fmean) were assessed using a modified leg extension machine (Nextline Leg Extension; Visa Sport, Marcellinara (CZ), Italy) equipped with a load cell (MuscleLab™ 6000; MuscleLab, Stathelle, Norway). Leg dominance was determined by asking participants which foot they would use to strike a stationary ball. Participants were positioned with the dominant leg fixed at 90° knee flexion, trunk-thigh angle at 90°, and straps placed over pelvis and shoulders to minimize compensatory movement. A cuff at the ankle was connected to the load cell via a non-elastic strap. The rate of force development (RFD) was also obtained from the same evaluation protocol.
For Fmax calculation, participants performed at least three 5-second maximal voluntary isometric contractions, each separated by 60 seconds of rest. Standardized verbal encouragement was provided, and the highest value was retained.
For Fmean calculation, after 3 minutes of rest, participants completed 12 maximal isometric contractions lasting 3 seconds each, separated by 5 seconds of rest. Endurance was quantified as the mean force across all 12 repetitions.
Fatigue Index. A fatigue percentage was calculated from maximal force at first repetition (and at twelfth repetition (), following the formula:
- The chair stand test (CST) evaluated lower limb muscular performance. Participants were asked to stand up and sit down performing as many repetitions as possible in 30 seconds. The number of repetitions executed was recorded and used for the analysis.
- Upper-limb isometric strength (HG) was evaluated using a Jamar hydraulic dynamometer [17]. Testing was performed on the self-reported dominant arm. Participants sat on an armless chair with elbow at 90° flexion and forearm in a neutral position. After adjusting the grip size, three 3-second maximal contractions were executed with 30-second rest intervals. The highest value was recorded.
- Flexibility was evaluated using the Sit and Reach test protocol. Participants sat with their feet hip-width apart against the test box. They kept their knees straight and leaned forward as far as possible, sliding their hands along the measuring board. The distance reached was measured in centimeters.
- Modified YMCA submaximal cycle ergometer test. Cardiorespiratory fitness was assessed using an incremental submaximal step test on a cycle ergometer (Ergoselect; ergoline GmbH, Bitz, Germany) to estimate maximal oxygen consumption (V̇O₂max) through extrapolation of the linear heart rate-workload relationship. After a 3-minute warm-up at 0 W, participants completed up to four 3-minute stages at 50 rpm. The initial workload was 0.5 kg (25 W; 150 kgm·min⁻¹). Subsequent workloads were determined according to the heart rate measured during the final minute of the preceding stage. The protocol aimed to obtain at least two steady-state heart rate values between 110 bpm and 85% of age-predicted maximal heart rate (HRmax) (220 – age). The test ended up reaching 85% HRmax or volitional exhaustion. Perceived exertion was monitored using the OMNI Scale (0–10) [18].
- Upper-body one-repetition maximum (1RM) strength test. Dynamic maximal upper-body strength was assessed using the bench press exercise performed on a horizontal bench. After a standardized warm-up with submaximal loads, the maximum weight that could be lifted once with proper technique was estimated using the Brzycki equation [19]:
2.4. Statistical Analysis
Statistical analyses were performed using SPSS, version 23.0. Data distribution was assessed for normality using the Shapiro-Wilk test. Continuous variables were expressed as means and standard deviations. The absolute change between baseline (T0) and six-month follow-up (T6) was calculated as percentage difference, Delta (Δ) between T6 and T0. Within-group differences for hormonal levels, body composition parameters, and functional performance scores between T0 and T6 were analyzed using the Paired Samples t-test for normally distributed data or the Wilcoxon signed-rank test for non-parametric data. Cohen’s d effect size regarding the magnitude of the differences between T0 and T6 in each group was also calculated and interpreted as: 0.2 = small, 0.5 = medium, 0.8 = large. The relationship between changes in hormonal concentrations and variations in physical performance or body composition was evaluated using Pearson’s correlation coefficient (r). Statistical significance was set at p < 0.05 for all analyses.
3. Results
All individuals reported poor physical activity at baseline, and an increase in weekly physical activity levels was observed in both groups. In the AFAB cohort, MET-minutes per week rose from 725.0 ± 327.0 at T0 to 1390.0 ± 754.4 at T6 (p = 0.041). Similarly, the AMAB group showed an increase from 921.8 ± 633.0 to 1400.0 ± 871.1 MET-minutes/week, although this trend did not reach statistical significance.
The administration of GAHT for six months induced significant hormonal shifts in both groups (Table 1 and Table 1.1). In the AFAB cohort, TT levels exhibited a marked increase from baseline (T0: 51.5 ± 10.2 ng/dL to T6: 544.3 ± 119.7 ng/dL; p = 0.005), reaching physiological male ranges. Other hormonal markers, including LH, FSH, E2, and PRL, showed no statistically significant variations in this group (Table 1).
In the AMAB group, feminizing therapy resulted in a profound suppression of the hypothalamic-pituitary-gonadal axis. Significant reductions were observed in LH (p = 0.002), FSH (p = 0.002), and TT (T0: 494.5 ± 60.1 ng/dL to T6: 31.1 ± 8.4 ng/dL; p = 0.002). Additionally, a significant increase in PRL levels was noted (p = 0.037), while the increase in E2 approached but did not reach statistical significance (p = 0.064) (Table 1.1).

Table 1.
Hormonal variations between T0 and T6 among AFAB. Values are expressed as means and standard deviations. Units of measurement are reported in brackets.
Table 1.
Hormonal variations between T0 and T6 among AFAB. Values are expressed as means and standard deviations. Units of measurement are reported in brackets.
| Hormone | AFAB T0 (n = 8) |
AFAB T6 (n = 8) |
Δ AFAB (T0-T6) |
p | Cohen’s d |
|---|---|---|---|---|---|
| LH (mUI/mL) | 9.3 ± 3.6 | 6.1 ± 1.6 | -3.2 | 0.363 | -0.344 |
| FSH (mUI/mL) | 5.9 ± 0.3 | 5.6 ± 0.9 | -0.3 | 0.776 | -0.105 |
| TT (ng/dL) | 51.5 ± 10.2 | 544.3 ± 119.7 | +492.8 | 0.005 | 1.423 |
| E2 (pg/mL) | 87.7 ± 19.8 | 69.5 ± 13.8 | -18.2 | 0.490 | -0.257 |
| PRL (ng/mL) | 28.7 ± 11.3 | 15.2 ± 3.5 | -13.5 | 0.571 | -0.275 |
AFAB: assigned female at birth; E2: estradiol; FSH: follicle-stimulating hormone; LH: luteinizing hormone; PRL: prolactin; T0: baseline evaluation before GAHT; T6: evaluation after six months of GAHT; TT: total testosterone; Δ AFAB (T0-T6): difference after six months of GAHT in AFAB cohort.
Table 1.1.
Hormonal variations between T0 and T6 among AMAB. Values are expressed as means and standard deviations. Units of measurement are reported in brackets.
Table 1.1.
Hormonal variations between T0 and T6 among AMAB. Values are expressed as means and standard deviations. Units of measurement are reported in brackets.
| Hormone | AMAB T0 (n = 11) |
AMAB T6 (n = 11) |
Δ AMAB (T0-T6) |
p | Cohen’s d |
|---|---|---|---|---|---|
| LH (mUI/mL) | 3.2 ± 0.5 | 0.4 ± 0.2 | -2.8 | 0.002 | -2.027 |
| FSH (mUI/mL) | 4.1 ± 0.8 | 0.4 ± 0.1 | -3.7 | 0.002 | -1.983 |
| TT (ng/dL) | 494.5 ± 60.1 | 31.1 ± 8.4 | -463.4 | 0.002 | -3.402 |
| E2 (pg/mL) | 37.2 ± 5.5 | 88.6 ± 19.5 | +51.4 | 0.064 | 0.857 |
| PRL (ng/mL) | 10.7 ± 1.5 | 15.2 ± 1.5 | +4.5 | 0.037 | 1.155 |
AMAB: assigned male at birth; E2: estradiol; FSH: follicle-stimulating hormone; LH: luteinizing hormone; PRL: prolactin; T0: baseline evaluation before GAHT; T6: evaluation after six months of GAHT; TT: total testosterone; Δ AMAB (T0-T6): difference after six months of GAHT in AMAB cohort.
Changes in anthropometric parameters and body composition are detailed in Table 2 and Table 2.1. In the AFAB group, a significant increase in FFM was observed after six months of GAHT (+3.5 kg; p = 0.020). Although increases were noted in body mass (+4.2 kg), BMI (+1.6 kg/mq), and SMM (+2.7 kg), these trends did not reach statistical significance (p > 0.05) (Table 2).
Conversely, the AMAB group displayed high stability across all anthropometric and body composition variables. No significant changes were detected in body mass, BMI, FFM, or SMM (p > 0.05), although a slight, non-significant increase in FM percentage was recorded (+2.0%; p = 0.115) (Table 2.1).
Table 2.
Anthropometric and body composition variations between T0 and T6 among AFAB participants. Values are expressed as means and standard deviations. Units of measurement are reported in brackets.
Table 2.
Anthropometric and body composition variations between T0 and T6 among AFAB participants. Values are expressed as means and standard deviations. Units of measurement are reported in brackets.
| Measure | AFAB T0 (n = 8) |
AFAB T6 (n = 8) |
Δ AFAB (T0-T6) | p | Cohen’s d |
|---|---|---|---|---|---|
| Body mass (kg) | 75.9 ± 10.0 | 80.1 ± 8.6 | +4.2 | 0.085 | 0.708 |
| BMI (kg/m2) | 27.2 ± 3.2 | 28.8 ± 2.6 | +1.6 | 0.080 | 0.722 |
| FFM (kg) | 45.6 ± 2.8 | 49.1 ± 2.4 | +3.5 | 0.020 | 1.058 |
| FM (kg) | 30.3 ± 7.3 | 31.0 ± 6.4 | +0.7 | 0.679 | 0.153 |
| FM (%) | 36.2 ± 4.4 | 36.0 ± 3.9 | -0.2 | 0.883 | -0.054 |
| SMM (kg) | 21.2 ± 1.2 | 23.9 ± 1.2 | +2.7 | 0.075 | 0.739 |
AFAB: assigned female at birth; BMI: body mass index; FFM: free fat mass; FM: fat mass; SMM: skeletal muscle mass; T0: baseline evaluation before GAHT; T6: evaluation after six months of GAHT; Δ AFAB (T0-T6): difference after six months of GAHT in AFAB cohort.
Table 2.1.
Anthropometric and body composition variations between T0 and T6 among AMAB participants. Values are expressed as means and standard deviations. Units of measurement are reported in brackets.
Table 2.1.
Anthropometric and body composition variations between T0 and T6 among AMAB participants. Values are expressed as means and standard deviations. Units of measurement are reported in brackets.
| Measure | AMAB T0 (n = 11) |
AMAB T6 (n = 11) |
Δ AMAB (T0-T6) |
p | Cohen’s d |
|---|---|---|---|---|---|
| Body mass (kg) | 69.7 ± 5.3 | 69.5 ± 4.6 | -0.2 | 0.867 | -0.052 |
| BMI (kg/m2) | 23.5 ± 1.6 | 23.5 ± 1.4 | 0 | 0.932 | -0.026 |
| FFM (kg) | 53.4 ± 2.6 | 52.0 ± 2.1 | -1.4 | 0.121 | -0.512 |
| FM (kg) | 16.3 ± 3.3 | 17.5 ± 3.0 | +1.2 | 0.376 | 0.279 |
| FM (%) | 21.6 ± 2.9 | 23.6 ± 2.7 | +2.0 | 0.115 | 0.520 |
| SMM (kg) | 28.8 ± 1.0 | 28.6 ± 1.0 | -0.2 | 0.515 | -0.204 |
AMAB: assigned male at birth; BMI: body mass index; FFM: free fat mass; FM: fat mass; SMM: skeletal muscle mass; T0: baseline evaluation before GAHT; T6: evaluation after six months of GAHT; Δ AMAB (T0-T6): difference after six months of GAHT in AMAB cohort.
The results of the functional performance battery are presented in Table 3 and Table 3.1. The AFAB cohort demonstrated significant improvements in several strength-related metrics. Specifically, Fmax increased by 73.2 N (p = 0.015), and Fmean increased by 48.3 N (p = 0.016). Furthermore, dynamic upper-body strength, measured via the 1RM bench press, showed a substantial increase (+13.0 kg; p = 0.009). No significant changes were observed in VO2max, flexibility (Sit and Reach), or HG (Table 3).
In contrast, the AMAB group showed no significant variations in any of the functional performance tests evaluated (p > 0.05). Performance in strength, endurance, and cardiorespiratory fitness remained stable relative to baseline values after six months of GAHT (Table 3.1).
Table 3.
Functional performance tests variations between T0 and T6 among AFAB participants. Values are expressed as means and standard deviations. Units of measurement are reported in brackets.
Table 3.
Functional performance tests variations between T0 and T6 among AFAB participants. Values are expressed as means and standard deviations. Units of measurement are reported in brackets.
| Measure | AFAB T0 (n = 8) |
AFAB T6 (n = 8) |
Δ AFAB (T0-T6) | p | Cohen’s d |
|---|---|---|---|---|---|
| Sit and reach (cm) | 0.2 ± 4.1 | -0.6 ± 6.7 | -0.8 | 0.527 | 0.309 |
| VO2max (ml⋅kg−1⋅min−1) | 31.9 ± 3.1 | 31.1 ± 3.4 | -0.8 | 0.317 | -0.413 |
| HG (kg) | 27.3 ± 3.3 | 27.8 ± 3.4 | +0.5 | 0.847 | 0.071 |
| Fmax (N) | 416.7 ± 31.5 | 489.9 ± 45.7 | +73.2 | 0.015 | 1.274 |
| RFD (N/s) | 2255.6 ± 281.8 | 2028.0 ± 317.4 | -227.6 | 0.284 | -0.553 |
| Fmean (N) | 353.7 ± 23.4 | 402.0 ± 37.3 | +48.3 | 0.016 | 1.246 |
| Fatigue (%) | 15.6 ± 2.4 | 21.0 ± 2.3 | +5.4 | 0.148 | 0.574 |
| 1RM (kg) | 21.1 ± 3.4 | 34.1 ± 2.3 | +13.0 | 0.009 | 1.272 |
| CST (n. rep) | 17.0 ± 1.1 | 16.9 ± 0.7 | -0.1 | 0.867 | -0.062 |
1RM: upper-body one-repetition maximum strength test; AFAB: assigned female at birth; CST: chair stand test; F max: maximal isometric knee extensor force; HG: handgrip strength test; Fmean: mean isometric knee extensor force; MET: exercise intensity per week; RFD: knee extensor rate of force development; T0: baseline evaluation before GAHT; T6: evaluation after six months of GAHT; VO2max: maximal oxygen consumption; Δ AFAB (T0-T6): difference after six months of GAHT in AFAB cohort.
Table 3.1.
Functional performance tests variations between T0 and T6 among AMAB participants. Values are expressed as means and standard deviations. Units of measurement are reported in brackets.
Table 3.1.
Functional performance tests variations between T0 and T6 among AMAB participants. Values are expressed as means and standard deviations. Units of measurement are reported in brackets.
| Measure | AMAB T0 (n = 11) |
AMAB T6 (n = 11) |
Δ AMAB (T0-T6) |
p | Cohen’s d |
|---|---|---|---|---|---|
| Sit and reach (cm) | -2.5 ± 3.0 | -1.9 ± 3.3 | +0.6 | 0.707 | 0.764 |
| VO2max (ml⋅kg−1⋅min−1) | 34.3 ± 2.6 | 32.1 ± 2.4 | -2.2 | 0.339 | -0.319 |
| HG (kg) | 31.2 ± 2.0 | 30.1 ± 3.8 | -1.1 | 0.744 | -0.101 |
| Fmax (N) | 408.7 ± 21.2 | 408.3 ± 23.1 | -0.4 | 0.983 | -0.007 |
| RFD (N/s) | 2061.5 ± 166.5 | 2420.8 ± 379.0 | +359.3 | 0.478 | 0.265 |
| Fmean (N) | 357.0 ± 20.6 | 337.2 ± 23.9 | -19.8 | 0.310 | -0.340 |
| Fatigue (%) | 18.1 ± 2.6 | 19.0 ± 1.7 | +0.9 | 0.923 | 0.031 |
| 1RM (kg) | 34.7 ± 3.1 | 31.3 ± 2.8 | -3.4 | 0.167 | -0.449 |
| CST (n. rep) | 15.3 ± 0.6 | 14.7 ± 0.6 | -0.6 | 0.258 | -0.338 |
1RM: upper-body one-repetition maximum strength test; AMAB: assigned male at birth; CST: chair stand test; F max: maximal isometric knee extensor force; HG: handgrip strength test; Fmean: mean isometric knee extensor force; MET: exercise intensity per week; RFD: knee extensor rate of force development; T0: baseline evaluation before GAHT; T6: evaluation after six months of GAHT; VO2max: maximal oxygen consumption; Δ AMAB (T0-T6): difference after six months of GAHT in AMAB cohort.
Pearson correlation analysis (Table 4) revealed several significant associations between hormonal shifts and physiological adaptations.
In the AFAB group, the Δ in TT was positively correlated with Δ 1RM (r = 0.718; p < 0.05) and Δ Fatigue (r = 0.860; p < 0.01), while it showed a strong negative correlation with Δ Sit and Reach (r = -0.882; p < 0.05). Additionally, Δ PRL exhibited an extremely strong positive correlation with changes in fat mass (Δ FM: r = 0.947; p < 0.001). A significant correlation was also found between Δ LH and Δ VO2max (r = 0.878; p < 0.01).
In the AMAB group, significant positive correlations were identified between Δ LH and changes in knee extensor performance, specifically Δ Fmax (r = 0.660; p < 0.05) and Δ Fmean (r = 0.826; p < 0.01). Furthermore, Δ PRL was positively correlated with Δ Fmax (r = 0.629; p < 0.05).
4. Discussion
As far we know, the present pilot study provides for the first time a longitudinal evaluation of the early effects of GAHT on hormonal profiles, body composition, and physical performance in non-athletic transgender people. Our findings reveal a distinct sexual dimorphism in the physiological response to GAHT during the first six months of treatment. While AFAB individuals receiving masculinizing therapy experienced rapid and significant gains in muscular strength and lean mass, AMAB individuals undergoing feminizing therapy maintained stable physical performance and body composition throughout the same period.
A primary finding of this study is the significant increase in physical performance among AFAB participants after only six months of testosterone administration. The substantial improvements in Fmax, Fmean, and 1RM underscore the potent anabolic and ergogenic effects of testosterone. Notably, these performance gains appeared robust even though changes in body composition, such as SMM, did not reach full statistical significance (p = 0.075).
This suggests that early strength gains in AFAB individuals may be driven not only by muscular hypertrophy - evidenced by the significant increase in FFM - but also by rapid neuromuscular adaptations and metabolic changes within the muscle tissue. The strong positive correlation found between TT increases and 1RM bench press improvements further supports the role of androgen levels as a primary driver of these functional changes. This hypothesis is strongly supported by the Pearson correlation analysis, which identified a significant positive relationship between the increase in TT and 1RM bench press improvements. Furthermore, the strong positive correlation between Δ TT and the Fatigue index and the significant negative correlation with flexibility changes further define the specific impact of androgen levels on the physical profile of AFAB individuals. Moreover, the significant increase in weekly physical activity levels observed in the AFAB cohort suggests that testosterone therapy may have also enhanced energy levels or motivation, contributing to the overall functional improvement.
In contrast to the AFAB group, AMAB individuals exhibited remarkable stability in both body composition and functional performance despite achieving significant suppression of testosterone and gonadotropins (LH and FSH). After six months of feminizing GAHT, no significant reductions were observed in lower-limb force, upper-body strength, or cardiorespiratory fitness. These results suggest that the loss of muscle mass and strength typically associated with androgen deprivation may require a longer duration to manifest. The "muscle memory" effect, or the persistence of muscle tissue gained during previous testosterone-dominant periods, may contribute to the preservation of strength in the early stages of transition [20]. This stability is a crucial clinical finding, as it indicates that feminizing therapy does not lead to an immediate decline in physical capabilities during the initial six months of treatment. The implications of these aspects could clearly extend to the use of anti-androgen therapies aimed at meeting competitive parameters in AFAB patients with disorders of sex development [21].
The distinct sexual dimorphism observed in the early response to GAHT is further corroborated by the analysis of effect sizes, highlighting a substantial physiological impact in AFAB individuals contrasted by remarkable stability in the AMAB cohort. In the AFAB group, the large effect sizes for FFM (d = 1.058), Fmax (d = 1.274), and 1RM bench press (d = 1.272) confirm that masculinizing therapy exerts a potent and rapid transformative effect on the musculoskeletal system within only six months. Conversely, despite the massive effect size associated with TT suppression in the AMAB group, functional performance remained stable with negligible effect sizes for Fmax and HG. While a moderate effect size for FFM was noted in AMAB participants, its lack of statistical significance suggests that early feminizing GAHT does not lead to immediate, robust declines in physical capabilities. Overall, these findings emphasize that the early anabolic response to testosterone is disproportionately more rapid and intense than any immediate catabolic effects resulting from androgen deprivation in non-athletic populations.
Interestingly, our data indicates that functional performance metrics may be more sensitive indicators of early GAHT effects than traditional anthropometric or bioimpedance measures. In AFAB individuals, the percentage of increase in strength (e.g., Fmax and 1RM) was more pronounced than the corresponding change in FFM. This reinforces the necessity of using multidimensional assessments - including both upper- and lower-limb functional tests - rather than relying solely on body composition or HG, which showed no significant change in either group.
The main strength of this study lies in its prospective longitudinal design, which allowed for the assessment of within-individual changes, reducing the confounding variability inherent in cross-sectional studies. Furthermore, the use of a non-athletic cohort minimizes the interference of structured physical training on the observed hormonal effects. Finally, the comprehensive functional tests (1 RM, isometric leg extension, VO2max) provides a more detailed profile of physical performance than the widely used but limited handgrip dynamometry.
However, several limitations must be acknowledged. As a pilot study, the relatively small number of participants (n = 19) may have limited the statistical power to detect smaller changes, particularly in body composition trends. The six-month follow-up captures only the early phase of GAHT; long-term trajectories of physical change remain to be determined. Furthermore, while BIA is a validated tool, more precise imaging techniques like DEXA or MRI could provide deeper insights into regional fat distribution and muscle quality. However, current guidelines recommend performing DEXA follow-up scans for bone and body composition after 18-24 months [22], hence we did not perform any instrumental evaluation by DEXA; our decision for functional studies was primarily driven by the desire to closely monitor the early effects of hormone therapy on musculoskeletal health and to consider the potential changes in musculoskeletal performance.
Clinically, these findings suggest that healthcare providers can reassure AFAB individuals of rapid functional gains, while AMAB individuals can expect a period of physical stability during the first half-year of therapy without any adjunctive physical perceived stressor [23]. This information is vital for managing patient expectations regarding physical changes.
Future research should focus on investigating the cellular signaling pathways and neuromuscular junction adaptations that facilitate strength gains prior to major hypertrophic changes in AFAB cohorts. Exploring how standardized exercise interventions might synergize with GAHT to optimize health outcomes and body composition is also fundamental during transition.
5. Conclusions
This pilot study highlights a distinct sexual dimorphism in the physiological and functional response to GAHT during the initial six months of treatment. Our findings demonstrate that AFAB individuals experience rapid and significant improvements in muscular strength and FFM, strongly correlated with the increase in serum testosterone levels. Conversely, AMAB individuals exhibit a period of remarkable stability, maintaining their baseline physical performance and body composition despite profound androgen suppression.
These results suggest that while the anabolic effects of testosterone manifest quickly on physical performance, the potential loss of muscle mass and strength in AMAB individuals may require a longer duration to become evident. Clinically, these insights are invaluable for managing patient expectations and emphasize the recommendation to lifestyle shifts from sedentary to active physical training session in transgender individuals to preserve them from potential metabolic adverse effects of GAHT, to accurately monitor the short- and long-term stages of medical transition.
Author Contributions
Conceptualization, Giuseppe Seminara and A.A.; methodology, F.G. and G.P.E.; validation, F.G.; formal analysis, F.G.; investigation, A.R., Giacomo Smeriglio, M.C.Z., A.G. and F.G.; data curation, A.R., Giacomo Smeriglio and A.G.; writing—original draft preparation, Giuseppe Seminara, M.L. and F.G.; writing—review and editing, G.P.E. and A.A.; supervision, A.A. All authors have read and agreed to the published version of the manuscript.
Funding
This research received no external funding.
Institutional Review Board Statement
The study was conducted in accordance with the Declaration of Helsinki and approved by the Calabria Region Ethics Committee (protocol code 25/2025).
Informed Consent Statement
Informed consent was obtained from all subjects involved in the study. Written informed consent has been obtained from the patients to publish this paper.:
Data Availability Statement
The data presented in this study are available upon reasonable request from the corresponding author.
Conflicts of Interest
The authors declare no conflicts of interest.:
Abbreviations
The following abbreviations are used in this manuscript:
| 1RM | Upper-body one-repetition maximum strength |
| AFAB | Assigned female at birth |
| AMAB | Assigned male at birth |
| BIA | Bioelectrical impedance analysis |
| BMI | Body mass index |
| CST | Chair stand test |
| E2 | Estradiol |
| FFM | Fat-free mass |
| FM | Fat mass |
| Fmax | Isometric knee extensor maximal force |
| Fmean | Isometric knee extensor mean force |
| FSH | Follicle-stimulating hormone |
| GAHT | Gender-affirming hormone therapy |
| HG | Upper-limb isometric strength |
| HRmax | Maximal heart rate |
| LH | Luteinizing hormone estradiol |
| MET | Metabolic equivalent of task |
| PRL | Prolactin |
| RFD | Rate of force development |
| SMM | Skeletal muscle mass |
| T0 | Baseline |
| T6 | Follow-up |
| TT | Total testosterone |
| V̇O₂max | Maximal oxygen consumption |
| Δ | Delta |
References
- Hembree, W.C.; Cohen-Kettenis, P.T.; Gooren, L.; Hannema, S.E.; Meyer, W.J.; Murad, M.H.; Rosenthal, S.M.; Safer, J.D.; Tangpricha, V.; T'Sjoen, G.G. Endocrine Treatment of Gender-Dysphoric/Gender-Incongruent Persons: An Endocrine Society Clinical Practice Guideline. J Clin Endocrinol Metab 2017, 102, 3869-3903.
- Seminara, G.; Alessi, M.; Zagari, M.C.; Greco, F.; Raffa, A.; Leuzzi, M.; D’Aleo, E.; Campedelli, L.; Lastretti, M.; Greco, E.A.; Segura-Garcia, C.; Aversa, A.; Monarca, C. Psychological and Physical Correlates After Gender-Affirming Mastectomy: Insights from a Case Report and Review of the Literature. Sexes 2025, 6, 57. [CrossRef]
- Cheung, A.S.; Zwickl, S.; Miller, K.; Nolan, B.J.; Wong, A.F.Q.; Jones, P.; Eynon, N. The Impact of Gender-Affirming Hormone Therapy on Physical Performance. J Clin Endocrinol Metab 2024, 109, e455-e465.
- Mendes Sieczkowska, S.; Caruso Mazzolani, B.; Reis Coimbra, D.; Longobardi, I.; Rossilho Casale, A.; da Hora, J.D.F.V.M.P.; Roschel, H.; Gualano, B. Body composition and physical fitness in transgender versus cisgender individuals: a systematic review with meta-analysis. Br J Sports Med 2026, bjsports-2025-110239. [CrossRef]
- Hunter, S.K.; Angadi, S.S.; Bhargava, A.; Harper, J.; Hirschberg, A.L.; Levine, B.D.; Moreau, K.L.; Nokoff N.J.; Stachenfeld, N.S.; Bermon, S. The Biological Basis of Sex Differences in Athletic Performance: Consensus Statement for the American College of Sports Medicine. Med Sci Sports Exerc 2023, 55, 2328-2360. [CrossRef]
- Harper, J.; O'Donnell, E.; Sorouri Khorashad, B.; McDermott, H.; Witcomb, G.L. How does hormone transition in transgender women change body composition, muscle strength and haemoglobin? Systematic review with a focus on the implications for sport participation. Br J Sports Med 2021, 55, 865-872. [CrossRef]
- Wiik, A.; Lundberg, T.R.; Rullman, E.; Andersson, D.P.; Holmberg, M.; Mandić, M.; Brismar, T.B.; Dahlqvist Leinhard, O.; Chanpen, S.; Flanagan, J.N.; Arver, S.; Gustafsson, T. Muscle Strength, Size, and Composition Following 12 Months of Gender-affirming Treatment in Transgender Individuals. J Clin Endocrinol Metab 2020, 105, dgz247. [CrossRef]
- Ceolin, C.; Savino, S.; Gregorio, C; Beraldo, G.; Dall'Agnol, M.; Termini, G.; Vetrano, D.L.; Scala, A.; Ferlin, A.; Sergi, G.; Garolla, A.; De Rui, M. Age-Dependent Muscular Response to Testosterone-Based Gender-Affirming Therapy: Evidence from a 1-Year Observational Study. Endocr Pract 2025, S1530-891X(25)01337-0. [CrossRef]
- Cronin, J.; Lawton, T.; Harris, N.; Kilding, A.; McMaster, D.T. A Brief Review of Handgrip Strength and Sport Performance. J Strength Cond Res 2017, 31, 3187-3217. [CrossRef]
- Felicio, D.C.; Pereira, D.S.; Assumpção, A.M.; de Jesus-Moraleida, F.R.; de Queiroz, B.Z.; da Silva, J.P.; de Brito Rosa, N.M.; Dias, J.M.; Pereira, L.S. Poor correlation between handgrip strength and isokinetic performance of knee flexor and extensor muscles in community-dwelling elderly women. Geriatr Gerontol Int 2014, 14, 185-9. [CrossRef]
- Hamilton, B.; Brown, A.; Montagner-Moraes, S.; Comeras-Chueca, C.; Bush, P.G.; Guppy, F.M.; Pitsiladis, Y.P. Strength, power and aerobic capacity of transgender athletes: a cross-sectional study. Br J Sports Med 2024, 58, 586-597. [CrossRef]
- Roberts, T.A.; Smalley, J.; Ahrendt, D. Effect of gender affirming hormones on athletic performance in transwomen and transmen: implications for sporting organisations and legislators. Br J Sports Med 2020, bjsports-2020-102329. [CrossRef]
- American Psychiatric Association. Diagnostic and Statistical Manual of Mental Disorders, 5th ed.; American Psychiatric Association: Washington, DC, USA, 2022.
- Chisholm, D.M.; Collis, M.L.; Kulak, L.L.; Davenport, W.; Gruber, N. Physical activity readiness. British Columbia Medical Journal 1975, 17, 375-378.
- Coleman, E.; Radix, A.E.; Bouman, W.P.; Brown, G.R.; de Vries, A.L.C.; Deutsch, M.B.; Ettner, R.; Fraser, L.; Goodman, M.; Green, J.; Hancock, A.B.; Johnson, T.W.; Karasic, D.H.; Knudson, G.A.; Leibowitz, S.F.; Meyer-Bahlburg, H.F.L.; Monstrey, S.J.; Motmans, J.; Nahata, L.; Nieder, T.O.; Reisner, S.L.; Richards, C.; Schechter, L.S.; Tangpricha, V.; Tishelman, A.C.; Van Trotsenburg, M.A.A.; Winter, S.; Ducheny, K.; Adams, N.J.; Adrián, T.M.; Allen, L.R.; Azul, D.; Bagga, H.; Başar, K.; Bathory, D.S.; Belinky, J.J.; Berg, D.R.; Berli, J.U.; Bluebond-Langner, R.O.; Bouman, M.B.; Bowers, M.L.; Brassard, P.J.; Byrne, J.; Capitán, L.; Cargill, C.J.; Carswell, J.M.; Chang, S.C.; Chelvakumar, G.; Corneil, T.; Dalke, K.B.; De Cuypere, G.; de Vries, E.; Den Heijer, M.; Devor, A.H.; Dhejne, C.; D'Marco, A.; Edmiston, E.K.; Edwards-Leeper, L.; Ehrbar, R.; Ehrensaft, D.; Eisfeld, J.; Elaut, E.; Erickson-Schroth, L.; Feldman, J.L.; Fisher, A.D.; Garcia, M.M.; Gijs, L.; Green, S.E.; Hall, B.P.; Hardy, T.L.D.; Irwig, M.S.; Jacobs, L.A.; Janssen, A.C.; Johnson, K.; Klink, D.T.; Kreukels, B.P.C.; Kuper, L.E.; Kvach, E.J.; Malouf, M.A.; Massey, R.; Mazur, T.; McLachlan, C.; Morrison, S.D.; Mosser, S.W.; Neira, P.M.; Nygren, U.; Oates, J.M.; Obedin-Maliver, J.; Pagkalos, G.; Patton, J.; Phanuphak, N.; Rachlin, K.; Reed, T.; Rider, G.N.; Ristori, J.; Robbins-Cherry, S.; Roberts, S.A.; Rodriguez-Wallberg, K.A.; Rosenthal, S.M.; Sabir, K.; Safer, J.D.; Scheim, A.I.; Seal, L.J.; Sehoole, T.J.; Spencer, K.; St Amand, C.; Steensma, T.D.; Strang, J.F.; Taylor, G.B.; Tilleman, K.; T'Sjoen, G.G.; Vala, L.N.; Van Mello, N.M.; Veale, J.F.; Vencill, J.A.; Vincent, B.; Wesp, L.M.; West, M.A.; Arcelus, J. Standards of Care for the Health of Transgender and Gender Diverse People, Version 8. Int J Transgend Health 2022, 23 (Suppl 1), S1-S259. [CrossRef]
- World Health Organization. Global Physical Activity Questionnaire (GPAQ) Analysis Guide. Available online: https://www.who.int/publications/m/item/global-physical-activity-questionnaire (accessed on 7 December 2025).
- Roberts, H.C.; Denison, H.J.; Martin, H.J.; Patel, H.P.; Syddall, H.; Cooper, C., Sayer, A.A. A review of the measurement of grip strength in clinical and epidemiological studies: towards a standardised approach. Age Ageing 2011, 40, 423-9. [CrossRef]
- Robertson, R.J.; Goss, F.L.; Rutkowski, J.; Lenz, B.; Dixon, C.; Timmer, J.; Frazee, K.; Dube, J.; Andreacci, J. Concurrent validation of the OMNI perceived exertion scale for resistance exercise. Med Sci Sports Exerc 2003, 35, 333-41. [CrossRef]
- Brzycki, M. Strength Testing—Predicting a One-Rep Max from Reps-to-Fatigue. Journal of Physical Education, Recreation & Dance 1993, 64, 88–90. [CrossRef]
- Egner, I.M.; Bruusgaard, J.C.; Eftestøl, E.; Gundersen, K. A cellular memory mechanism aids overload hypertrophy in muscle long after an episodic exposure to anabolic steroids. J Physiol 2013, 591, 6221-30. [CrossRef]
- Chiarello, P.; Seminara, G.; Bossio, S.; Sicilia, L.; Greco, F.; Malatesta, P.; Greco, E.A.; Aversa, A. De La Chapelle Syndrome: Clinical and Physical Performance Implications. Sexes 2024, 5, 198-203. [CrossRef]
- Singh-Ospina, N.; Maraka, S.; Rodriguez-Gutierrez, R.; Davidge-Pitts, C.; Nippoldt, T.B.; Prokop, L.J.; Murad, M.H. Effect of Sex Steroids on the Bone Health of Transgender Individuals: A Systematic Review and Meta-Analysis. J Clin Endocrinol Metab 2017, 102, 3904-3913. [CrossRef]
- Ceolin, C.; Scala, A.; Scagnet, B.; Citron, A.; Vilona, F.; De Rui, M.; Miscioscia, M.; Camozzi, V.; Ferlin, A.; Sergi, G.; Garolla, A.; GIIG group. Body composition and perceived stress levels in transgender individuals after one year of gender affirming hormone therapy. Front Endocrinol (Lausanne) 2024, 15, 1496160. [CrossRef]
Table 4.
Pearson correlations (r) between changes (Δ) from T0 to T6 in body composition and functional performance tests in relation to hormonal levels.
Table 4.
Pearson correlations (r) between changes (Δ) from T0 to T6 in body composition and functional performance tests in relation to hormonal levels.
| Measure | Δ LH | Δ FSH | Δ TT | Δ E2 | Δ PRL |
|---|---|---|---|---|---|
| AFAB | |||||
| Δ FFM | 0.279 | 0.166 | 0.337 | 0.113 | 0.274 |
| Δ FM | 0.371 | 0.583 | 0.460 | -0.638 | 0.947*** |
| Δ FM | 0.384 | 0.602 | 0.384 | -0.673 | 0.930** |
| Δ SMM | 0.120 | -0.144 | 0.157 | 0.383 | -0.063 |
| Δ Sit and reach | -0.010 | -0.274 | -0.882* | -0.535 | -0.660 |
| Δ VO2max | 0.878** | 0.675 | 0.103 | -0.213 | 0.716 |
| Δ HG | 0.035 | -0.299 | -0.111 | 0.035 | 0.211 |
| Δ Fmax | -0.389 | 0.202 | -0.225 | -0.516 | -0.102 |
| Δ RFD | -0.316 | 0.400 | 0.672 | -0.535 | 0.123 |
| Δ Fmean | 0.332 | 0.564 | -0.001 | -0.429 | -0.379 |
| Δ Fatigue | 0.157 | 0.138 | 0.860** | -0.064 | 0.453 |
| Δ 1RM | -0.096 | -0.106 | 0.718* | 0.183 | -0.015 |
| Δ CST | -0.582 | -0.625 | -0.538 | 0.224 | -0.636 |
| AMAB | |||||
| Δ FFM | 0.573 | 0.156 | 0.557 | 0.153 | 0.430 |
| Δ FM | 0.055 | 0.135 | 0.186 | 0.024 | 0.127 |
| Δ FM | -0.089 | 0.067 | 0.039 | -0.004 | -0.003 |
| Δ SMM | -0.271 | 0.223 | -0.291 | 0.435 | -0.358 |
| Δ Sit and reach | -0.038 | 0.145 | -0.049 | 0.287 | 0.111 |
| Δ VO2max | -0.212 | 0.357 | -0.002 | 0.099 | -0.023 |
| Δ HG | -0.059 | 0.038 | -0.039 | 0.020 | 0.327 |
| Δ Fmax | 0.660* | 0.145 | 0.587 | 0.059 | 0.629* |
| Δ RFD | -0.300 | 0.451 | -0.506 | 0.439 | 0.000 |
| Δ Fmean | 0.826** | 0.035 | 0.419 | -0.016 | 0.200 |
| Δ Fatigue | -0.182 | 0.025 | -0.468 | 0.034 | -0.056 |
| Δ 1RM | 0.398 | -0.041 | 0.212 | -0.153 | -0.069 |
| Δ CST | 0.160 | 0.371 | 0.262 | 0.337 | 0.589 |
AFAB: assigned female at birth; AMAB: assigned male at birth; E2: estradiol; FFM: free fat mass; FM: fat mass; FSH: follicle-stimulating hormone; LH: luteinizing hormone; PRL: prolactin; SMM: skeletal muscle mass; TT: total testosterone; Δ: difference after six months of GAHT. * p < 0.05; ** p < 0.01; *** p < 0.001.
Disclaimer/Publisher’s Note: The statements, opinions and data contained in all publications are solely those of the individual author(s) and contributor(s) and not of MDPI and/or the editor(s). MDPI and/or the editor(s) disclaim responsibility for any injury to people or property resulting from any ideas, methods, instructions or products referred to in the content. |
© 2026 by the authors. Licensee MDPI, Basel, Switzerland. This article is an open access article distributed under the terms and conditions of the Creative Commons Attribution (CC BY) license.
Copyright: This open access article is published under a Creative Commons CC BY 4.0 license, which permit the free download, distribution, and reuse, provided that the author and preprint are cited in any reuse.