Submitted:
12 February 2026
Posted:
13 February 2026
You are already at the latest version
Abstract
Background: Doxorubicin causes dose-dependent cardiotoxicity linked to epigenetic dysregulation, especially DNA methylation. Metformin shows cardioprotective effects through metabolic and epigenetic mechanisms. This study examined the role of metformin in counteracting doxorubicin-induced DNA methylation changes. Methods: H9c2 cardiomyoblasts were treated with doxorubicin, with or without metformin (0.7–2.8 mM). Cell viability and IC₅₀ were determined by MTT assay. Genome-wide DNA methylation was analysed by whole-genome bisulfite sequencing, followed by PCA and differential methylation analysis with FDR correction. Results: Doxorubicin reduced cell viability (IC₅₀ = 0.164 μM). Pre-treatment with metformin increased IC₅₀ to 0.21, 0.289, and 0.51 μM (0.7, 1.4, 2.8 mM). PCA showed distinct separation among groups. Numerous differentially methylated regions (FDR < 0.05) were associated with genes involved in oxidative stress, mitochondria, apoptosis, and chromatin regulation. Conclusions: Metformin induced distinct, dosedependent genome-wide DNA methylation changes in cardiac cells, indicating a direct epigenetic effect. These findings suggest that metformin influences cardiac epigenetic regulation and may contribute to cardioprotection by modulating DNA methylation.
Keywords:
metformin
; doxorubicin
; cardiotoxicity
; DNA methylation
; epigenetics
; WGBS
; H9c2 cells
1. Introduction
Doxorubicin (DOX) is also one of the most popular anthracycline chemotherapeutic agents and is a part of the treatment or a generalized array of malignancies such as leukaemia, lymphomas, breast cancer, and sarcomas. Although DOX has a strong antitumor effect, its clinical use is crippled by cumulative and dose-dependent cardiotoxicity, which develop to dilated cardiomyopathy and congestive heart failure [21,28]. This is a problem of long-term cancer survivors. This delayed toxicity is a significant clinical problem of long-term cancer survivors.
DOX-induced cardiotoxicity is mediated by overproduction of reactive oxygen species (ROS), mitochondrial dysfunction, lipid peroxidation, and DNA damage, which are all mechanisms that are mechanistically determined [30]. The large quantity of mitochondrial content of cardiomyocytes and their low antioxidant ability makes them especially susceptible to oxidative stress. Moreover, DOX is selectively concentrated in cardiac mitochondria and binds to cardiolipin that results in the impairment of the electron transport chain, ATP depletion, and the activation of intrinsic apoptotic pathways [1] Topoisomerase IIb (Top2b) inhibition in cardiomyocytes also adds to the process of the DNA double-strand break and transcriptional dysregulation, which is differentiating mechanisms of cardiac injury with the antitumor activity of Top2a in proliferating tumour cells [19].
In addition to these conventional processes, there is also growing evidence to underscore the critical role played by epigenetic dysregulation in the pathogenesis and maintenance of DOX-induced cardiac injury. Epigenetic changes, especially DNA methylation, are used to control the structure of chromatin and gene expression and may create long-term epigenetic memory in response to toxic or environmental injury [11]. Abnormal global and gene-specific DNA methylation has been linked to cardiomyopathy, oxidative stress reactions, mitochondrial dysfunction, and cardiac regeneration impairment [3].
DNA methylation is mediated by DNA methyltransferases (DNMT1, DNMT3A and DNMT3B) and it is very important in transcriptional homeostasis and genomic stability. The change in DNMT expression and activity has been shown in cardiac hypertrophy, ischemic injury, and drug-induced cardiomyopathy models [2,23]. Dysregulated DNA methylation, which can result in chronic silencing of cardioprotective genes and prolonged activation of pro-apoptotic and inflammatory pathways, could mediate the connection between acute damage caused by chemotherapy and chronic cardiac remodelling and failure [20,30].
Metformin, an antidiabetic drug of first line, has received a lot of interest due to its pleiotropic cardioprotective properties that surpass the glycaemic regulation. Oxidative stress reduction, mitochondrial preservation, apoptosis inhibition, and cardiac energetics improvement have been demonstrated to be reduced by metformin, especially by AMP-activated protein kinase (AMPK) signalling [7,32]. Notably, more recent studies indicate that metformin is also an epigenetic modulator, which affects DNA methylation, histone acetylation, and chromatin accessibility [31].
On the molecular level, metformin has been observed to inhibit the expression of DNMT, disrupt the one-carbon metabolism, and reverse the aberrant promoter hypermethylation in cancer and non-cancerous cells [8,29]. In spite of its well-known epigenetic impact in the field of oncology, there is a lack of information on its ability to control the epigenetic changes triggered by chemotherapy in cardiomyocytes. The bifunctional nature of metformin in reducing oxidative stress and in remodelling the DNA methylation landscapes implies a possibility in reversing the epigenetic aspect of cardiotoxicity caused by DOX.
Although there is an increased awareness of epigenetic mechanisms of cardiac injury, genome-wide DNA methylation alteration induced by DOX and their regulation by metformin is not fully described. Specifically, it is yet to be fully understood what the identity of the differentially methylated genes and pathways associated with mitochondrial activity, apoptosis, oxidative stress, and chromatin regulation are in this case [19,24].
Hence, the current research will examine the global DNA methylation changes caused by Metformin in H9c2 rat cardiomyoblast cells, and determine the possible protective effects of metformin in regulating the same. This study aims to offer mechanistic understanding of the epigenetic mechanism of chemotherapy-induced cardiotoxicity and explain the importance of metformin as epigenetic cardioprotective agent by combining whole-genome bisulfite sequencing with bioinformatic and pathway enrichment analyses.
2. Molecular and Epigenetic Mechanisms of Doxorubicin-Induced Cardiotoxicity and the Cardioprotective Role of Metformin
2.1. Doxorubicin-Induced Cardiotoxicity: Clinical and Molecular Perspectives
Doxorubicin (DOX) is an anthracycline oncolytic agent that is widely used to treat various malignancies including leukaemia, lymphomas, breast cancer and sarcomas [34]. Despite its high anticancer properties, DOX has clinical limitations because of its cumulative and dose-dependent cardiotoxicity, which can be manifested as acute cardiac injury, early-onset cardiomyopathy and late-onset congestive heart failure [21]. Clinically, the DOX-induced cardiotoxicity can develop during the treatment and many years after treatment, especially on long-term cancer survivors. The risk of cardiotoxicity increases with the accumulation of dose of the drug, in old age, with underlying cardiovascular disease, and with radiotherapy or other cardiotoxic drugs [16,26].
2.2. Epigenetic Alterations in Doxorubicin-Induced Cardiac Injury
Secondly, despite the common mechanisms that explain most cases of cardiotoxicity due to DOX, there is new research that epigenetic dysregulation is a contributing factor. Other studies have also found that in DOX-exposed heart cells, DNMT expression and activity were also altered, resulting in the aberrant patterns of DNA methylation [14]. The changes might also suppress the expression of cardioprotective genes which are used in antioxidant defence, mitochondrial functioning, and cell survival. Notably, the epigenetic modifications caused by DOX can continue to persist, even following drug withdrawal and this is where the idea of the epigenetic memory was born.
2.3. DNA Methylation: Biological Significance and Mechanistic Insights
DNA methylation is a widespread epigenetic modification which is necessary to regulate gene expression, but not the DNA sequence. DNA methylation is based on covalent addition of the methyl group into the 5’ position of cytosine residues in CpG dinucleotides and is catalysed by a group of enzymes, known as DNA methyltransferases (DNMTs), including DNMT1, DNMT3A and DNMT3B (Bestor, 2000; Brownlee, 2005). Maintenance of the methylation of DNA is mainly done by DNMT1 during replication of DNA, de novo by DNMT3A and DNMT3B during development and cellular differentiation. DNA methylation is required in normal physiology in embryonic development, genomic imprinting, X-chromosome inactivation, and repression of transposable elements (Bird, 2002). The proper pattern of methylation is important in the process of genomic stability and cellular identity.
2.4. Mechanism of Action of Metformin
Metformin is a biguanide medication and has been in frequent use as first-line medication in the treatment of type 2 diabetes mellitus over a number of decades. Its main effect of action is connected with the regulation of cellular energy balance, primarily by activation of adenosine monophosphate-activated protein kinase (AMPK), which is one of the main intracellular energy sensors [33]. Metformin induces AMPK by inhibiting mitochondrial complex I of the electron transport chain, which decreases ATP synthesis, and elevates intracellular AMP/ATP ratio, which in turn induces AMPK phosphorylation and activation [27].
When activated, AMPK controls a series of downstream signalling pathways that all decrease energy-consuming and increase energy-generating pathways. These effects are manifested in metabolic tissues as a decrease in hepatic gluconeogenesis, enhancement of glucose uptake and insulin sensitivity [33]. In addition to its classical metabolic effects, AMPK activation caused by metformin also affects the oxidative stress regulation, inflammation, and cell survival pathways in tissues other than the liver, such as the heart.
2.5. Metformin as an Epigenetic Modulator
Metformin is an oral antihyperglycaemic agent that is a biguanide and is extensively used in the treatment of type 2 diabetes mellitus. It mainly prevents hepatic gluconeogenesis and enhances insulin sensitivity by its main mechanism of action through the activation of the AMP-activated protein kinase (AMPK) [33]. In addition to its metabolic properties, metformin has gained much attention due to its pleiotropic effects such as antioxidant, anti-inflammatory, and cardioprotective effects [27].
According to recent research, metformin has the potential to alter epigenetic processes in several ways. They are DNMT expression downregulation, one-carbon metabolism modulation and lowering of intracellular ROS that indirectly influence the maintenance of DNA methylation [8,25]. Metformin has been proven to reverse promoter hypermethylation of the tumour suppressor genes and reestablish tumour suppressor gene expression in cancer models [15].
2.6. Epigenetic Crosstalk Between Doxorubicin and Metformin
The opposite effect of DOX and metformin on epigenetics, in which DOX and metformin have their opposite effect on the regulation of epigenetics, can be an indication of the interaction of mechanisms of action. DOX causes a disordered epigenetic state that is caused by oxidative stress and DNMT upregulation, which is mediated by metformin [8,14] via chemotherapy. Metformin would stabilize the DNA methylation levels and inhibit the aberrant promoter hypermethylation to reduce long-term cardiac cell-level epigenetic damage without disrupting the anticancer activity of DOX. However, there is extremely limited experimental evidence to support this thesis especially in non-cancerous cardiac models.
2.7. H9c2 Cardiomyoblasts as a Model for Epigenetic Cardiotoxicity Studies
An in vitro model used to study cardiotoxicity and cardiac stress response is the H9c2 rat cardiomyoblast cell line that is a derivative of embryonic ventricular tissue [12]. These cells possess significant biochemical and molecular characteristics of cardiomyocytes and react predictably to oxidative and apoptotic stress by DOX. Notably, H9c2 cells can also respond to epigenetic stimuli, and such mechanisms as the DNMT induction and changes in DNA methylation were observed after the exposure to DOX [14] and can therefore be used to investigate the epigenetic mechanisms of cardiotoxicity. Despite these shortcomings, such as non-contractile phenotype and embryonic derivation of H9c2 cells, they form a strong and reproducible model of preliminary epigenetic research before the in vivo validation.
2.8. Knowledge Gaps and Rationale of the Study
Although there has been significant progress in the study of DOX-induced cardiotoxicity, little has been done to study the epigenetic pathways that have been involved in the latter. In particular, the changes in genome-wide DNA methylation of cardiac cells as well as their dose-dependent nature have not been exhaustively defined. Moreover, the possibility of having metformin counteracting the effects of DOX on the epigenetics of non-cancerous cardiac cells is highly hypothetical. To fill these gaps, this paper uses an in vitro H9c2 model to examine genome-wide DNA methylation alterations caused by doxorubicin and the possibility of epigenetic modulation as a cardioprotective approach. The proposed study will help to fill in the gaps in the understanding of chemotherapy-induced cardiotoxicity and aid the creation of epigenetic-based interventions in cardio-oncology by concentrating on DNA methylation changes.
2.9. Study Design
It was an experimental study in vitro, which was aimed at assessing the cardioprotective effect of MET on DNA methylation changes induced by DOX. A cellular model was used, H9c2 cells. The analysis involved cytotoxicity testing, drug exposure, WGBS-based genome-wide DNA methylation analysis, bioinformatic analysis, and pathway enrichment analysis.
The experimental design was comprised of 3 phases that included the key elements of the experiment:
Improvement of the cytotoxicity of the individual agents (metformin and DOX).
Testing of drug-drug interaction effects using the combination treatments.
WGBS analysis of epigenetics.
This combination method made it possible to assess functional endpoints, which are reflected in cell viability, and molecular endpoints, which are reflected in DNA methylation status, and reduce inter-experimental variation [9].
2.10. Experimental Groups
H9c2 cells were separated in the following experimental groups:
Control (untreated): Baseline evaluation of cell health and the state of DNA methylation.
Metformin alone: Cells were incubated with a predetermined concentration of metformin non-cytotoxic.
DOX alone: Cells were incubated with DOX at the half-maximal inhibitory concentration inhibition (IC50) of the drug in the 24 hours.
Metformin + DOX (pre-treatment): Cells had been pre-treated with metformin over the course of 4 months and then subjected to DOX.
Each of the experimental conditions was conducted in triplicate biological replicates to make them reproducible and provide them with a possibility of statistical validation.
2.11. Cell Culture
The cell line was cultured in Dulbecco Modified Eagle Medium (DMEM) with 10% Fetal bovine serum (FBS), 1% penicillin-streptomycin (100 U/mL penicillin and 100 ug/mL streptomycin) and 1% L- glutamine. Cells were then kept at 37 °C in a humidified incubator containing 5% CO2 as recommended by ATCC [12]. To avoid the growth inhibition of cells at high density, the cells were subculture at 70-80% confluence with 0.25% trypsin-EDTA, and the cell culture procedure was performed according to the standard [18].
2.12. Preparation and Treatment of Drugs
Doxorubicin was acquired in the form of a powder and then dissolved in sterile water to get a 10 mM stock solution. All the stock solutions were kept at -20 °C and freshly diluted before each experiment. Metformin hydrochloride was made at 100 mM stock solution in sterile water and filtered using a 0.22 um syringe filter and kept at 4 °C. In the pre-treatment experiments, cells were pre-treated with metformin over 4 months before administration of DOX, as earlier studies have shown that it is the most optimal period to achieve AMPK activation and DNMT down-regulation, respectively [22].
2.13. Treatment Design and Dose Selection for Genome-Wide DNA Methylation Analysis
The choice of experimental treatment conditions was informed by the need to capture epigenetic changes related to exposure to metformin and have enough of cellular integrity to undergo genome-wide DNA methylation profiling. Instead of conducting direct cytotoxicity analyses, the treatment concentrations were selected using past published literature of biologically relevant low and high dose of doxorubicin in H9c2 cardiomyoblasts cells. Cells were subjected to specific low and high dose doxorubicin conditions to determine the IC 50. Metformin treatment condition was also added as it is evidenced in its role in regulating oxidative stress and epigenetic regulation of cardiac cells. This experimental design enabled the exploration of methylation response globally in controlled treatment conditions without causing other experimental variability. The optimal concentrations were used to obtain sufficient DNA yield and quality to proceed to downstream sequencing and the maximum cell loss that might lead to genome-wide methylation analysis being compromised was reduced. This method made it possible to compare the global patterns of DNA methylation between treatment groups in a strong manner and conduct downstream analysis, such as principal component analysis, differentiation of methylation analysis, and functional pathway enrichment.
2.14. DNA Extraction and Bisulfite Conversion
The DNA in cell pellets was isolated with QIA amp DNA Mini Kit (Qiagen, Germany) based on the manufacturer instructions to guarantee the maximum yield and purity with acceptable A260/A280 ratios of 1.8-2.0. Conversion of bisulfide was done by using the EZ DNA Methylation-Goldtm Kit (Zymo Research, USA) that transforms unmethylated cytosines to uracil, but leaves the methylated cytosines intact [10]. This is necessary to allow future analysis of the DNA by methylation-specific PCR.
2.15. Whole-Genome Bisulfite Sequencing (WGBS)
Whole-genome bisulfite sequencing (WGBS) was used to conduct genome-wide DNA methylation analysis. After bisulfide conversion, sequencing libraries were made as per the regular protocols and sequenced. This method can map DNA methylation with single bases resolution of the entire genome and thus can effectively evaluate both global and locus-specific changes in methylation. The process of sequencing data processing was performed through the use of well-known bioinformatics pipelines, such as quality control, alignment of reads to the reference genome, and methylation calling. The levels of methylation were measured and condensed into genomic tiles to enable the downstream analysis, such as principal component analysis, differential methylation analysis and pathway enrichment analysis.
2.16. Statistical Analysis
The results of an MTT assay were reported as mean +- standard deviation (SD) of at least three independent experiments. The one-way analysis of variance (ANOVA) was used to statistically compare the groups with a significance level of p < 0.05 in which the post hoc test was used to compare the groups in multiple tests. Quality control, trimming and alignment of raw WGBS data to the reference rat genome was implemented using bisulfide-sensitive bioinformatic pipelines. The DNA level of methylation at each CpG site was measured as β-values, the percentage of reads that were methylated at that locus to the number of reads at each locus (between 0 and 1). The experimental groups were compared, and the difference between them in terms of methylation was analysed using a differential methylation method to determine the difference in methylation. Statistical significance of the differences in methylation was evaluated by means of proper statistical models and p-values were obtained at each CpG site and DMR. The false discovery rate (FDR) was used to correct multiple testing, using the Benjamini-Hochberg procedure. Statistically significant regions were those with adjusted p-value (FDR) of less than 0.05 and absolute Db (delta beta) of more than a predetermined value. The β-values were subjected to principal component analysis (PCA) and hierarchical clustering to assess the discrimination of the overall pattern of methylation between the control, MET low-dose and MET high-dose groups. Pathway enrichment analyses of genes that were linked with significant DMRs were conducted to determine biological processes that MET has epigenetically regulated. The evaluation of WGBS results was done with the help of sequencing quality measures, CpG coverage, and quantitative DNA methylation β-values in order to guarantee the quality genome-wide methylation analysis [35].
3. Results
3.1. Selection of Experimental Conditions for Genome-Wide DNA Methylation Analysis
Baseline cells and serial passages were evaluated using the MTT assay to determine the cell viability in the presence of doxorubicin (DOXO), alone or combined with metformin (0.7, 1.4 and 2.8 mM) using the MTT assay. To determine IC50 values, dose response curves were fitted by nonlinear regression through four parameter logistic model upper and lower plateaus set to 100 and 0 percent, respectively. The reference was made with baseline cells (1st dataset). The lowest value of IC50 was in the first experimental passage (2nd dataset), which means that DOXO is the most sensitive to the drug. Later on (3rd and 4th data sets), the IC50 values of DOXO were higher, which indicated lower sensitivity in comparison to early-passage cells. In all datasets, the pre-treatment of metformin caused a rightward shift in the DOXO dose-response curves concentration-dependently. The values of IC50 rose with metformin concentration, and the highest value was 2.8 mM. Such observation suggests less DOXO cytotoxicity when it is administered with metformin and shows a dose-dependent protective effect that is reproducible in all cell passages.
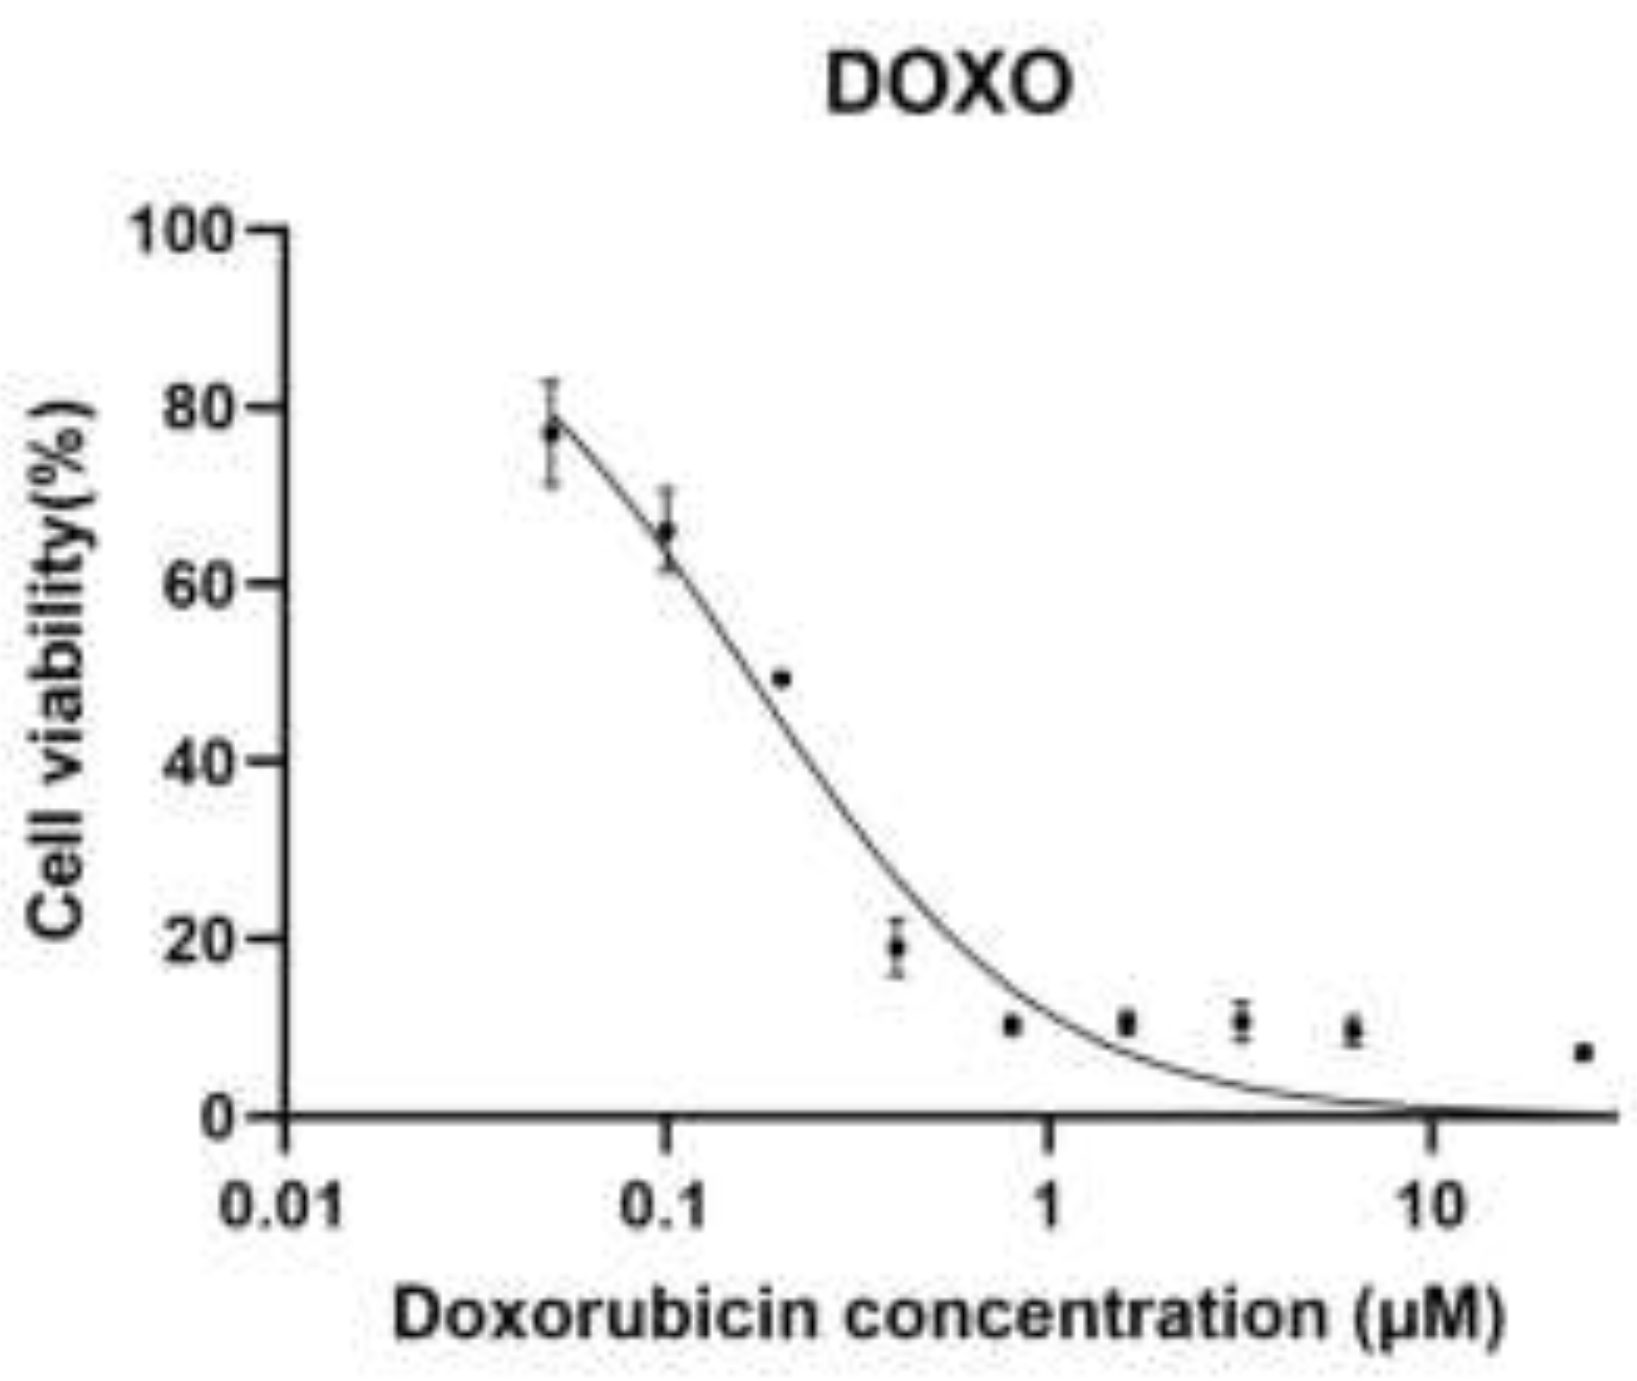
Figure 1.
A. Dose–response curve of doxorubicin (DOX) in H9c2 cardiomyoblast cells.
Dose–response curve of doxorubicin (DOXO) in H9c2 rat cardiomyoblast cells. Cells were treated with increasing concentrations of doxorubicin (0.05, 0.1, 0.2, 0.4, 0.8, 1.6, 3.2, 6.25, and 25 µM), and cell viability was assessed using the MTT assay. Data is normalized to untreated control cells (100%). Dose–response curves were generated using nonlinear regression (Figure 1A) with a four-parameter logistic (4PL) model, with the top and bottom constrained to 100% and 0%, respectively. The calculated IC₅₀ value for doxorubicin was 0.164 µM (95% CI: 0.140–0.192 µM).
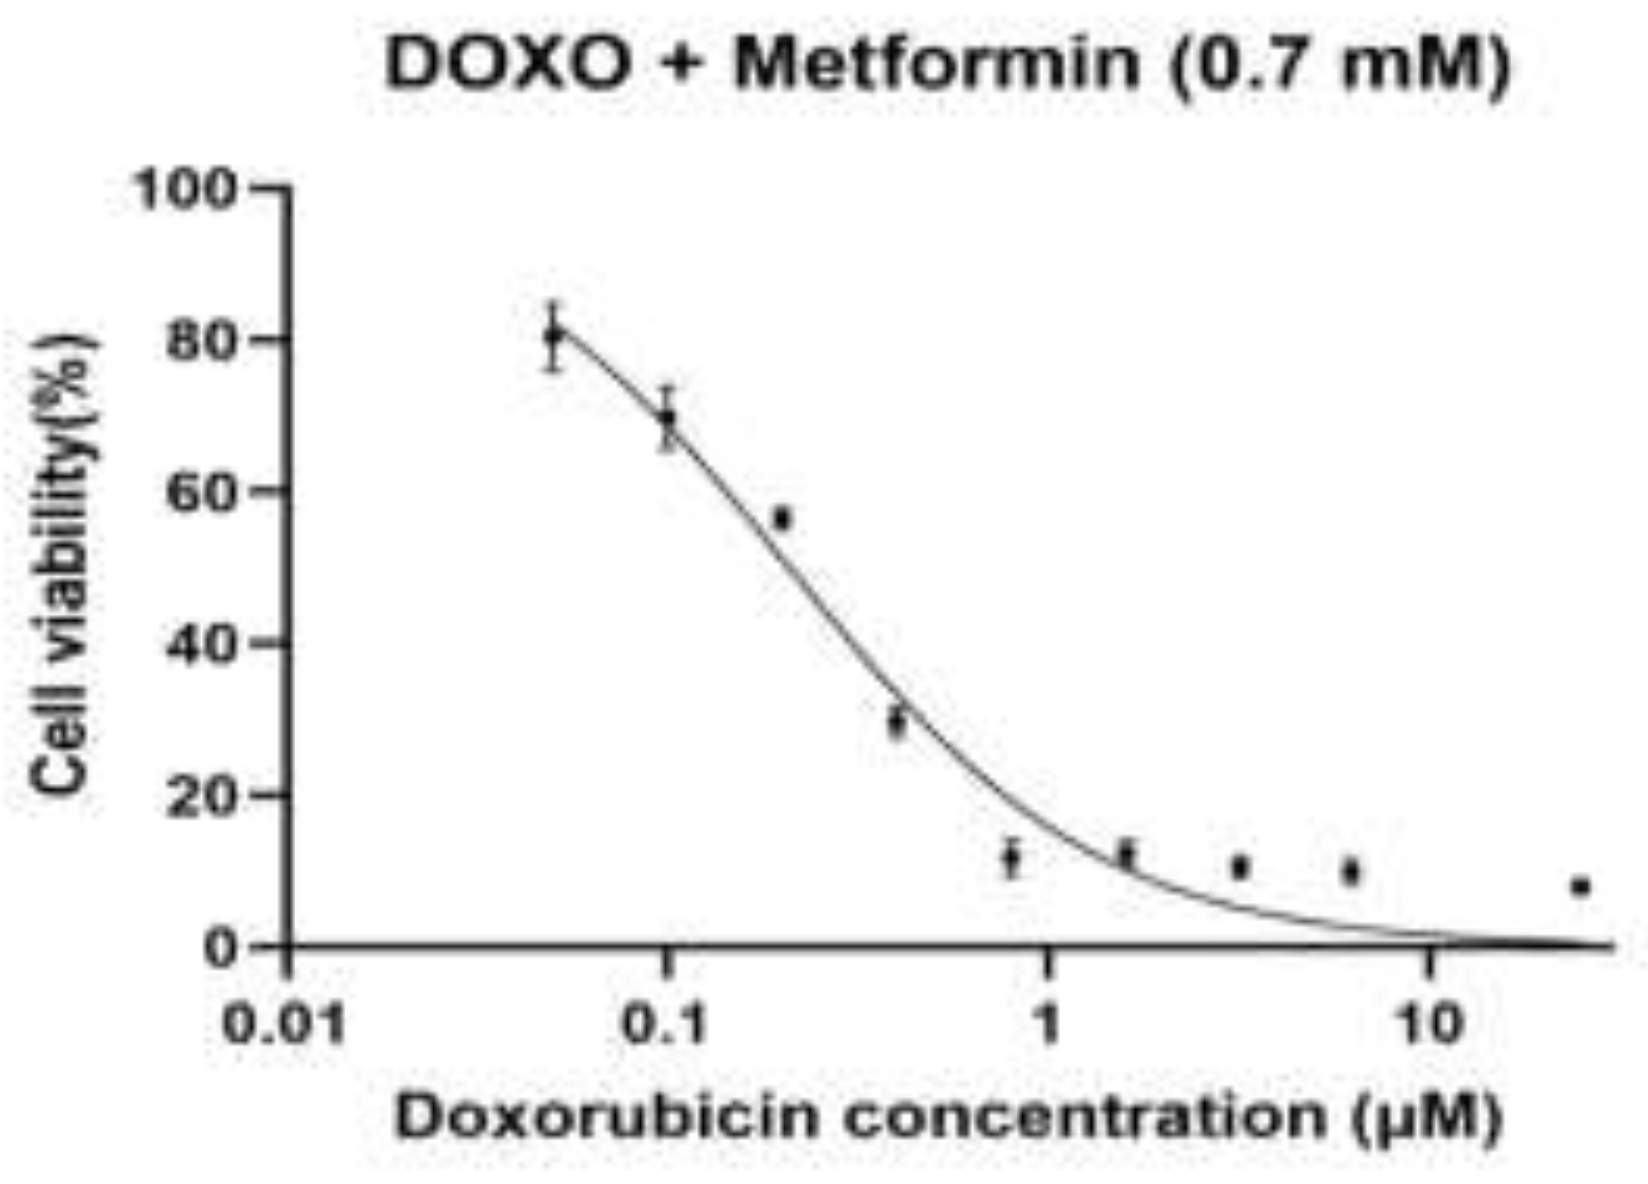
Figure 1.
B. Dose–response curve of doxorubicin in combination with metformin (0.7 mM) in H9c2 rat cardiomyoblast cells.
Figure 1.
B. Dose–response curve of doxorubicin in combination with metformin (0.7 mM) in H9c2 rat cardiomyoblast cells.
Dose–response curve of doxorubicin (DOXO) in combination with metformin (0.7 mM) in H9c2 rat cardiomyoblast cells. Cells were pre-treated with metformin (0.7 mM) and subsequently exposed to increasing concentrations of doxorubicin (0.05, 0.1, 0.2, 0.4, 0.8, 1.6, 3.2, 6.25, and 25 µM). Cell viability was assessed using the MTT assay and normalized to untreated control cells (100%). Dose–response curves were fitted using nonlinear regression (Figure 1B) with a four-parameter logistic (variable-slope) model, with the top and bottom constrained to 100% and 0%, respectively. The calculated IC₅₀ value for doxorubicin in the presence of metformin (0.7 mM) was approximately 0.21 µM.
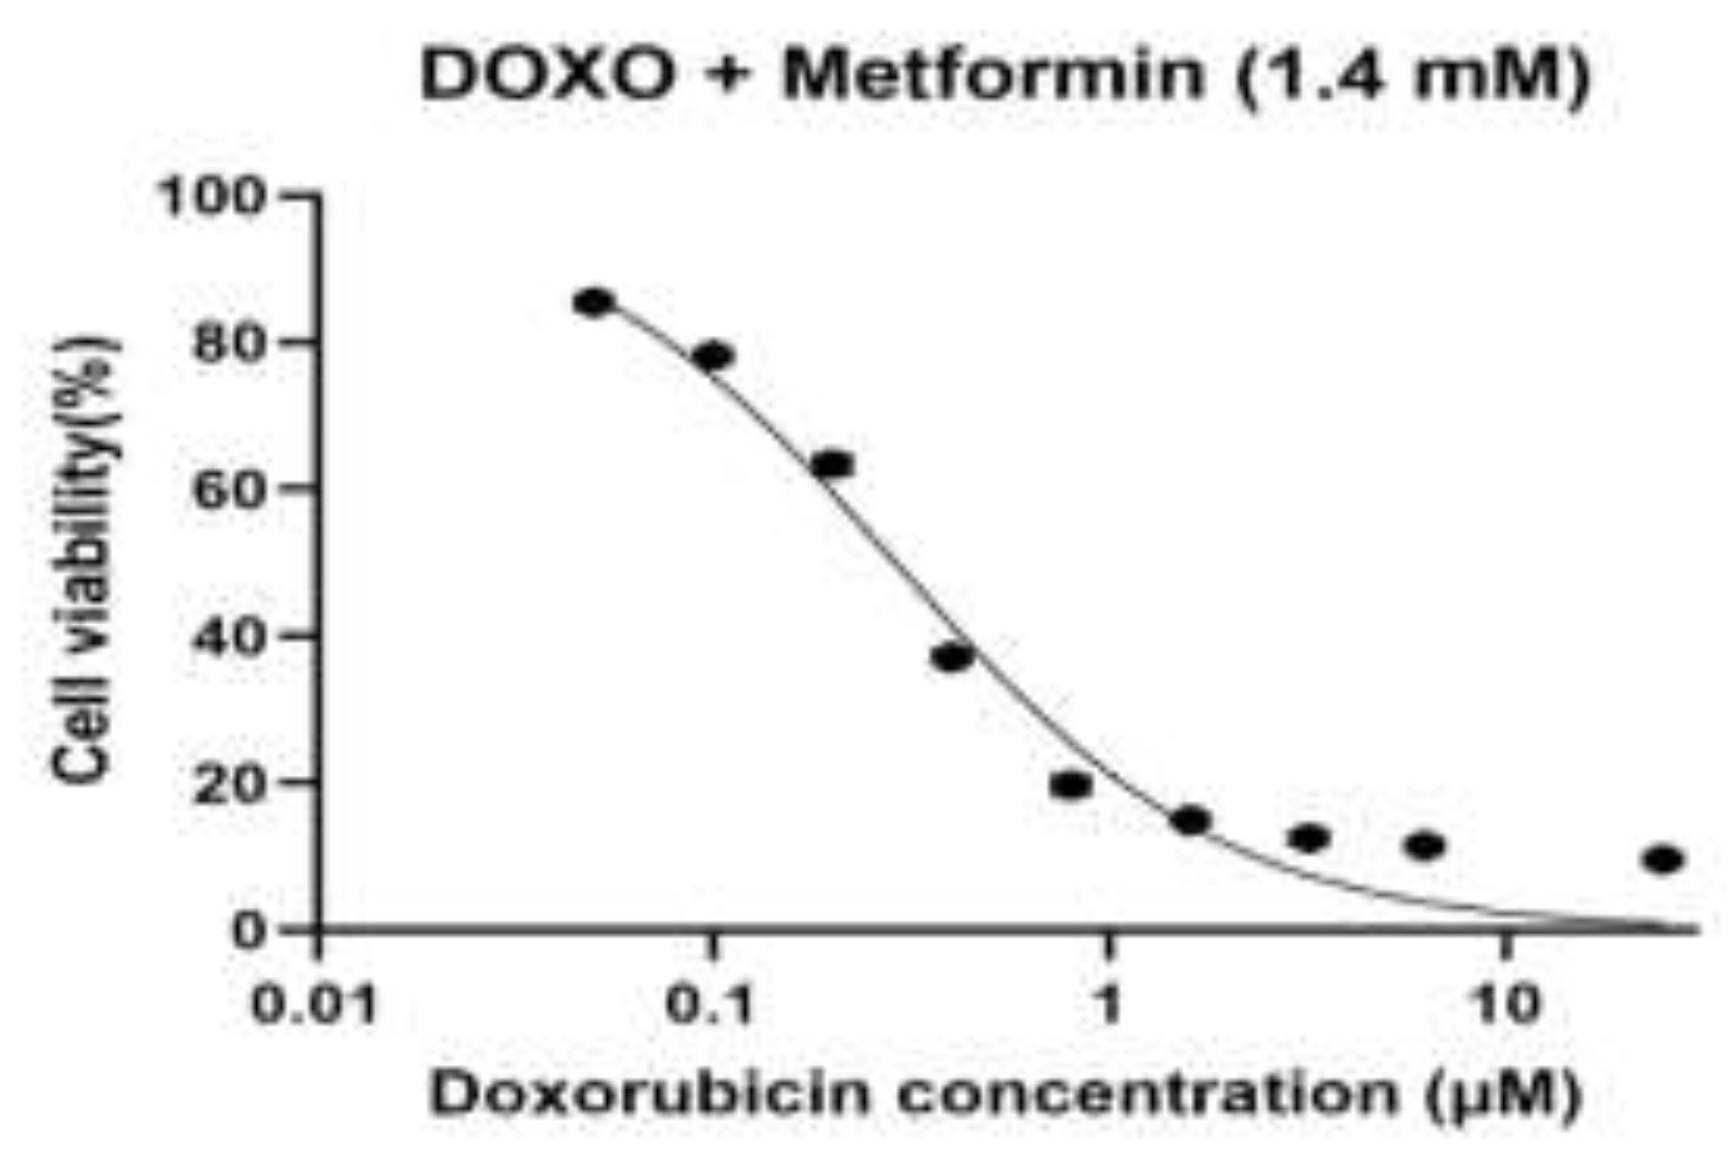
Figure 1.
C. Dose–response curve of doxorubicin in combination with metformin (1.4 mM) in H9c2 cardiomyoblast cells.
Figure 1.
C. Dose–response curve of doxorubicin in combination with metformin (1.4 mM) in H9c2 cardiomyoblast cells.
Dose–response curve of doxorubicin (DOXO) in combination with metformin (1.4 mM) in H9c2 rat cardiomyoblast cells. Cells were treated with metformin (1.4 mM) and subsequently exposed to increasing concentrations of doxorubicin (0.05, 0.1, 0.2, 0.4, 0.8, 1.6, 3.2, 6.25, and 25 µM). Cell viability (%) was assessed using the MTT assay and normalized to untreated control cells (100%). Data points represent mean values, and Dose–response curves were fitted by nonlinear regression (Figure 1C) using a four-parameter logistic (4PL) model, with the top and bottom constrained to 100% and 0%, respectively. The calculated IC₅₀ value was 0.289 µM (95% CI: 0.259–0.322 µM).
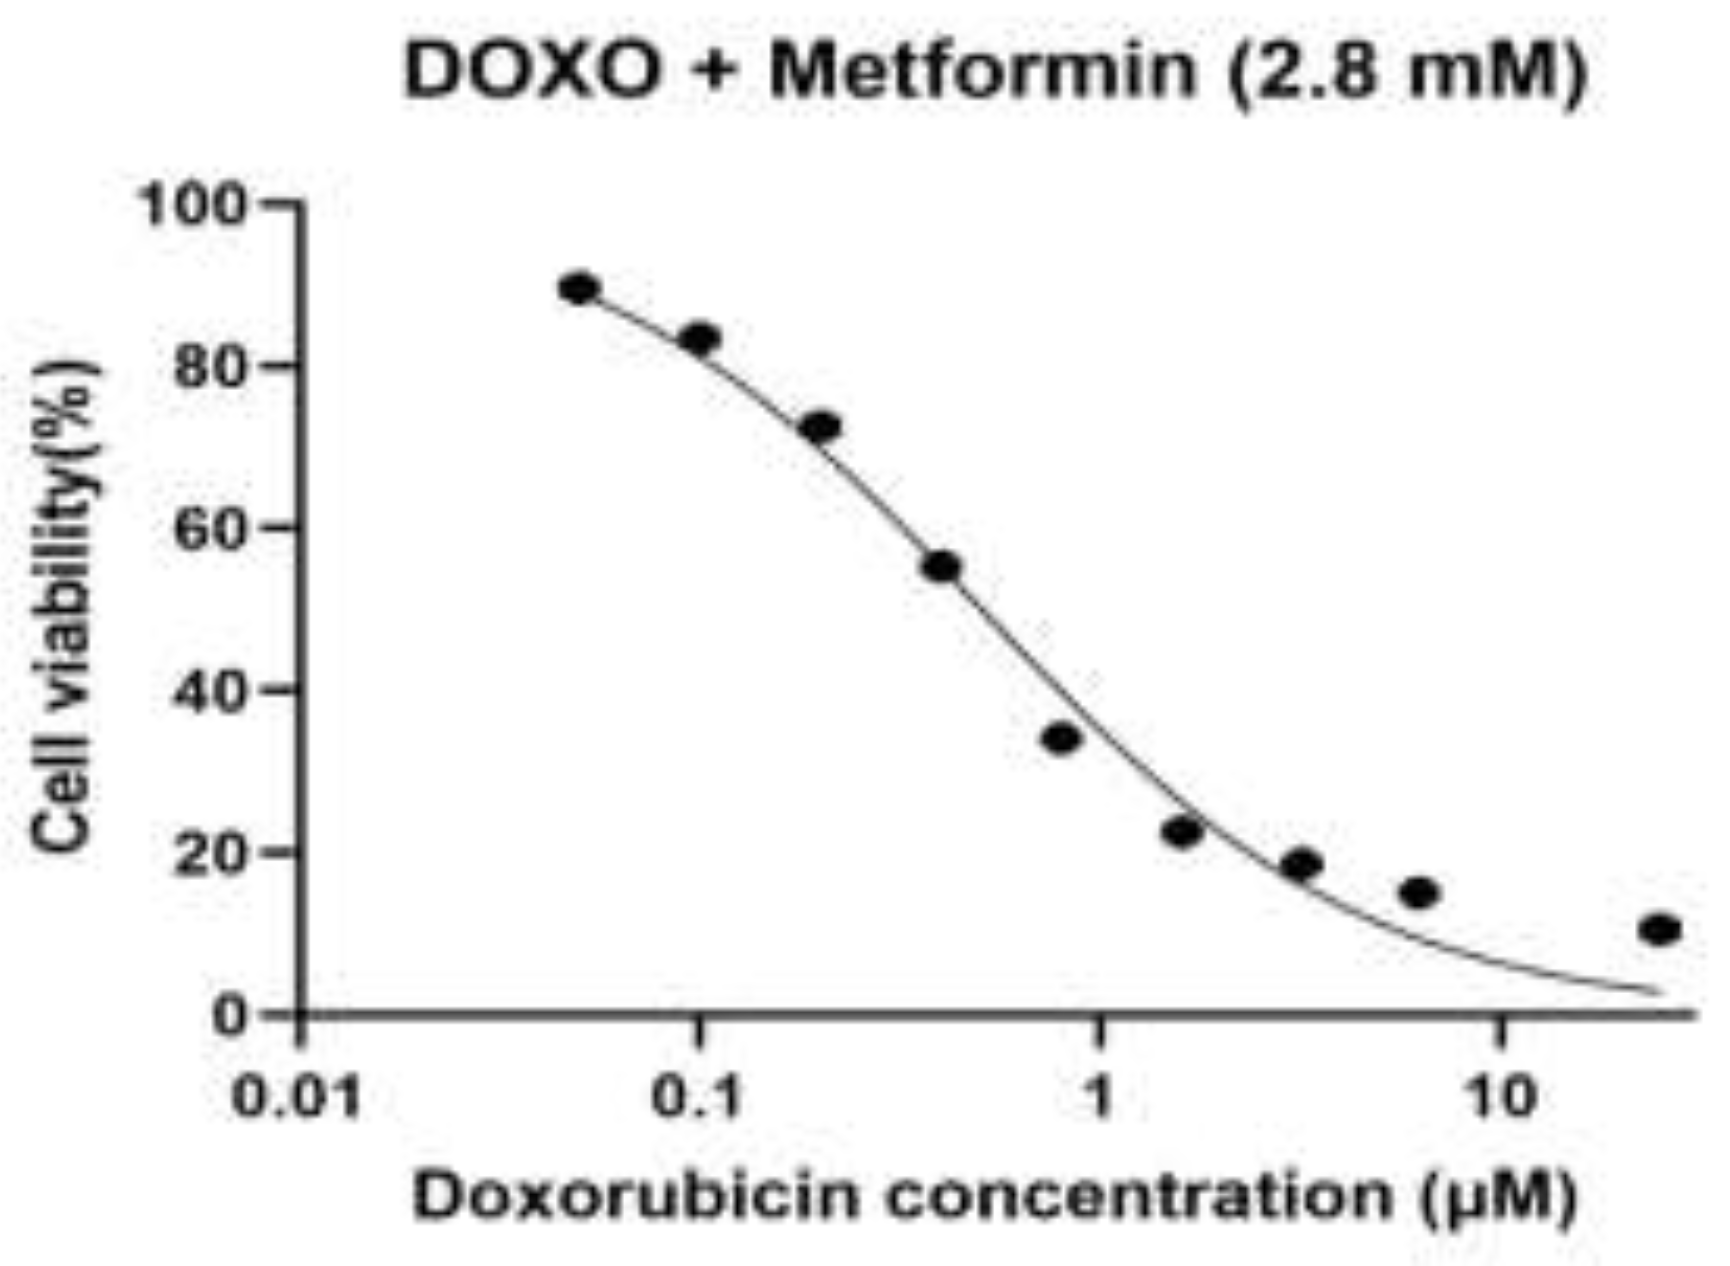
Figure 1.
D. Dose–response curve of doxorubicin (DOXO) in the presence of metformin (2.8 mM) in H9c2 rat cardiomyoblast cells.
Figure 1.
D. Dose–response curve of doxorubicin (DOXO) in the presence of metformin (2.8 mM) in H9c2 rat cardiomyoblast cells.
Dose–response curve of doxorubicin (DOXO) in the presence of metformin (2.8 mM) in H9c2 rat cardiomyoblast cells. Cells were treated with metformin (2.8 mM) and exposed to increasing concentrations of doxorubicin (0.05, 0.1, 0.2, 0.4, 0.8, 1.6, 3.2, 6.25, and 25 µM). Cell viability (%) was measured using the MTT assay and normalized to untreated control cells (100%). Dose–response curves were fitted by nonlinear regression (Figure 1D) using a four-parameter logistic (4PL) model, with the bottom constrained to 0% and top to 100%. The calculated IC₅₀ value was 0.51 µM.
Results summary based on the four dose–response curves
In both baseline cells and sequential passages, doxorubicin (DOXO) caused an evident dose-dependent decrease in cell viability when used alone or in combination with metformin (0.7, 1.4 and 2.8 mM), determined by the MTT assay (Figure 1A–D). A nonlinear regression analysis was performed on a four-parameter logistic model to demonstrate that there were different changes in the sensitivity to DOXO between passages and treatment conditions. The intermediate values of IC50 in the case of baseline cells were used as a baseline to compare the subsequent adaptations that would be exhibited in the course of experimental passaging. The lowest DOXO IC50 values were obtained in the first experimental passage, which reflected the highest drug sensitivity and the lowest drug resistance, which was in line with the early-passage cellular behaviour. However, subsequent passages (third and fourth datasets) revealed a steady rise in values of IC50 indicating an adaptive cellular response to repeated passaging, possibly due to altered metabolic state, tolerance to cellular stress or survival cue. In all the passages, the pre-treatment with metformin produced a concentration-dependent rightward movement of the DOXO dose-response curves, which was reflected in the higher IC50 values than that of DOXO alone. This was observed to be largely more intense at 2.8 mM metformin indicating that the sensitivity to DOXO was lesser at high metformin levels. The scale of this change was different in passages, which implies that the protective or modulatory effect of metformin depends on cellular fitness and adaptation depending on passage. Taken together, these findings show that experimental passaging and metformin concentration have a large effect on DOXO cytotoxicity, which illustrates that there are dynamic relationships between cellular adaptation and drug response.
3.2. International Patterns of DNA Methylation in Treatment Groups
The analysis of the levels of DNA methylation on genome-wide levels, using 1-kb genomic tiles, by principal component analysis (PCA) showed no doubt about a distinct difference between the control and metformin-treated H9c2 cells. There was a tight clustering of control samples, which means that there was high intra-group consistency of baseline methylation profiles. There was a large variation in the first principal component (PC1) between the samples of metformin-treated samples which explained the highest percentage of variance. High dose metformin samples were clustered together differentiated with those of the control and low dose metformin groups, and low dose metformin samples were placed at the middle of the cluster, which showed that global DNA methylation patterns shifted dose-dependently. These findings indicate that metformin causes dose-dependent, genome-wide changes in the methylation of the DNA in the cardiac cells.
Principal component analysis (PCA) of genome-wide DNA methylation levels calculated from 1-kb genomic tiles in H9c2 cardiomyoblast cells. Samples from control, low-dose-MET-treated, and high-dose-MET-treated groups show clear separation along the first two principal components (Figure 2), indicating distinct global methylation patterns. The clustering demonstrates dose-dependent epigenetic reprogramming induced by metformin at the genome-wide level.
Cell viability of H9c2 cardiomyoblasts cells treated with doxorubicin (0.05 µM) in the presence of increasing concentrations of metformin (0.7, 1.4, and 2.8 mM). Viability was assessed using the MTT assay and expressed as a percentage of untreated controls. Data are presented as mean ± SD. Statistical analysis revealed no significant differences (ns) between DOX alone and DOX plus metformin groups at this concentration (Figure 3), indicating that metformin does not exacerbate DOX cytotoxicity while exerting epigenetic modulatory effects.
3.3. Identification of Differentially Methylated Regions in Metformin-Treated Cells
DNA methylation analysis was conducted to determine the genomic regions that have been significantly changed after treatment with metformin. Both hypermethylated and hypomethylated areas are depicted in the volcano plot compared to control cells. Many of the regions were above statistical significance levels, which suggests that metformin causes extensive and two-sided DNA methylation alterations, and not a global shift. These findings also justify the epigenetic effects of metformin on the heart cells.
3.4. Data Quality Assessment of Methylation Data
Before downstream differential methylation analysis, data quality was assessed based on methylation beta-value distributions and sequencing coverage across all samples. Beta value distributions in control, low-dose, and high-dose groups presented the expected bimodal shape, with enrichment near unmethylated (β ≈ 0) and fully methylated (β ≈ 1) states, confirming reliable bisulfide conversion and accurate methylation calling.
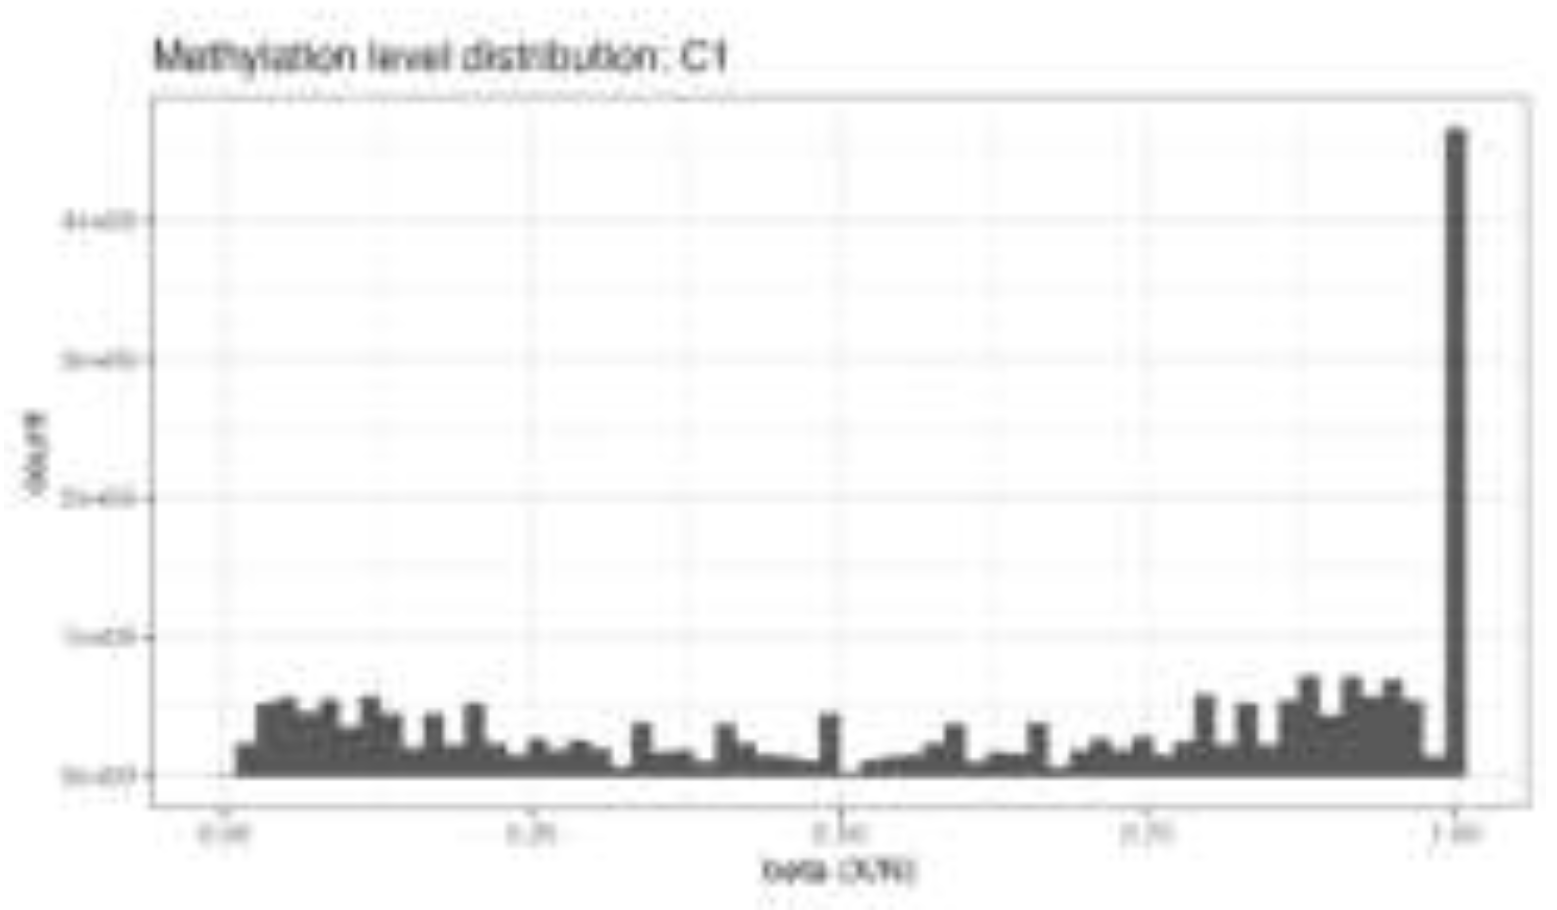
Figure 4.
A. Distribution of genome-wide DNA methylation β-values in control and treated H9c2 cells.
Figure 4.
A. Distribution of genome-wide DNA methylation β-values in control and treated H9c2 cells.
Distribution of DNA methylation β-values across the genome (Figure 4A) in control, low-dose MET, and high-dose MET–treated H9c2 cardiomyoblast cells. The histograms display the expected bimodal pattern, with peaks near β ≈ 0 (unmethylated CpG sites) and β ≈ 1 (fully methylated CpG sites), indicating high-quality bisulfite conversion and accurate methylation calling. The similarity in overall distribution shapes among groups supports the technical reliability of the WGBS data and validates subsequent differential methylation analyses.
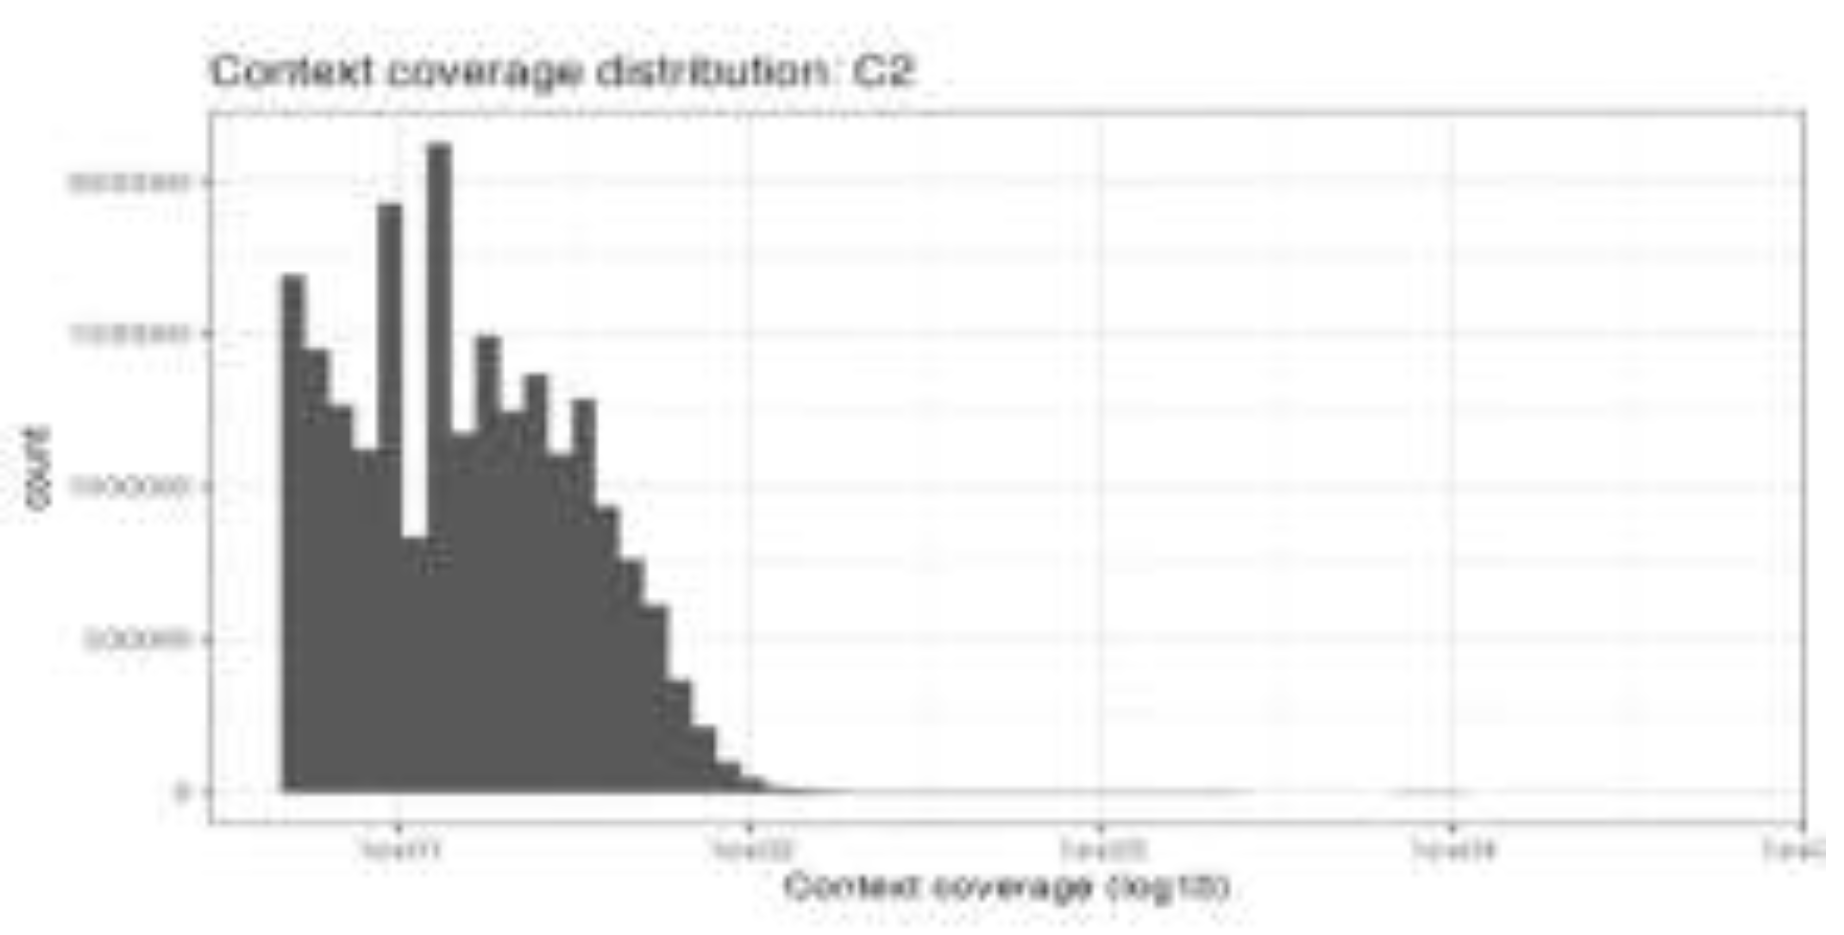
Figure 4.
B. Quality assessment of genome-wide DNA methylation data in H9c2 cells.
Quality control assessment of whole-genome bisulfite sequencing (WGBS) data (Figure 4B) in H9c2 cardiomyoblast cells. The upper panel shows the distribution of DNA methylation β-values, demonstrating the expected bimodal pattern with enrichment near unmethylated (β ≈ 0) and fully methylated (β ≈ 1) states, confirming efficient bisulfite conversion and reliable methylation calling. The lower panel depicts the distribution of sequencing read coverage across CpG sites (log₁₀ scale), indicating sufficient and uniform genome-wide coverage for downstream differential methylation analysis.
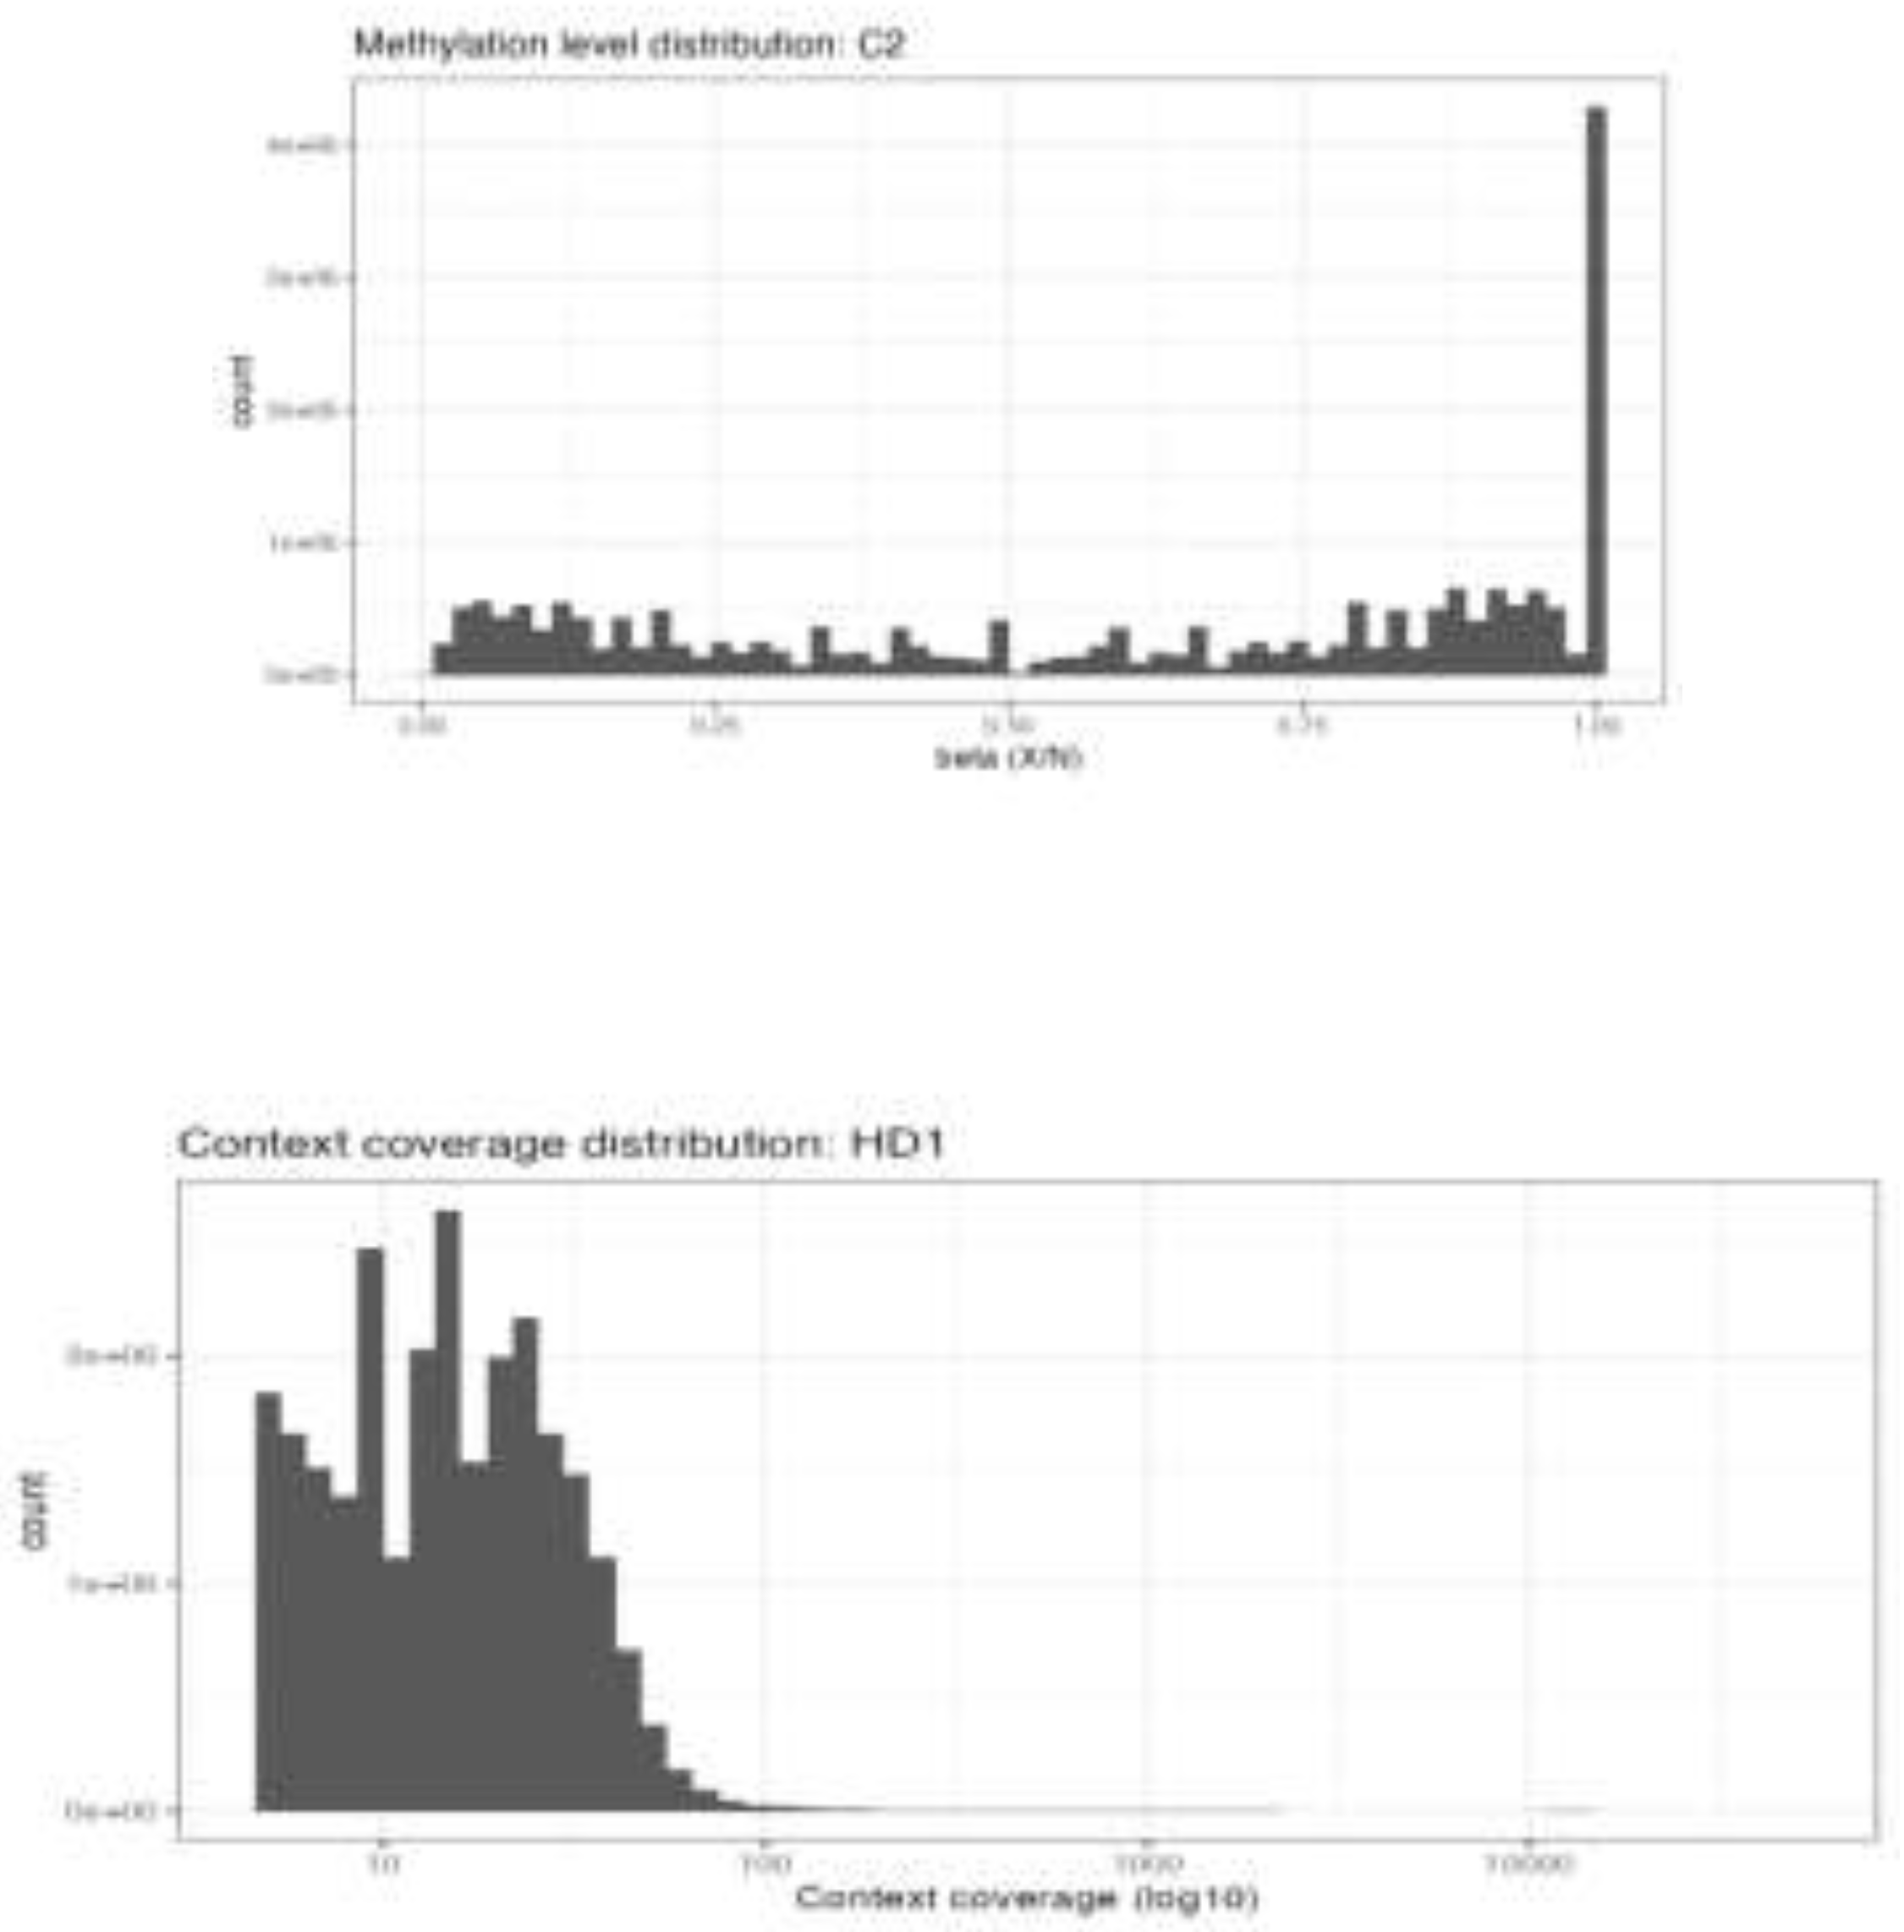
Figure 4.
C. Distribution of genome-wide DNA methylation β-values in C2 samples.
Genome-wide distribution of DNA methylation β-values in C2 samples (Figure 4C). The histogram shows the expected bimodal pattern with enrichment near β ≈ 0 (unmethylated CpG sites) and β ≈ 1 (fully methylated CpG sites), indicating efficient bisulfite conversion and reliable methylation calling. The preservation of this bimodal distribution confirms the high technical quality of the WGBS data for downstream differential methylation analysis.
Figure 4D. Sequencing coverage distribution in high-dose metformin–treated samples (HD1)
Distribution of sequencing read coverage across CpG sites in high-dose metformin–treated H9c2 cells (HD1) (Figure4D). Coverage is displayed on a log₁₀ scale, demonstrating sufficient and uniform read depth across the genome to support accurate methylation calling and robust identification of differentially methylated regions.
3.5. High-Dose Metformin Induces Differential DNA Methylation
To characterize methylation changes induced by high-dose metformin, differential methylation analysis was performed by comparing high-dose-treated cells with untreated control cells.
A substantial proportion of genomic regions exhibited significant differential methylation following high-dose metformin exposure. Both hypermethylated and hypomethylated regions were identified, confirming that metformin induces bi-directional epigenetic remodelling rather than a uniform shift in methylation levels. Hypermethylated regions were predominantly observed at positive delta methylation values, whereas hypomethylated regions were concentrated at negative delta methylation values exceeding statistical significance thresholds. These findings underscore the pronounced epigenetic impact of high-dose metformin on cardiac cells.
3.6. Differential DNA Methylation Following Low-Dose Metformin Exposure
Differential methylation analysis comparing low-dose metformin–treated cells with untreated controls identified both hypermethylated and hypomethylated regions, indicating bi-directional epigenetic modulation. However, the number of significantly altered regions and the magnitude of methylation changes were markedly lower than those observed following high-dose exposure. These findings demonstrate a dose-dependent epigenetic response, with low-dose metformin inducing relatively modest genome-wide DNA methylation alterations.
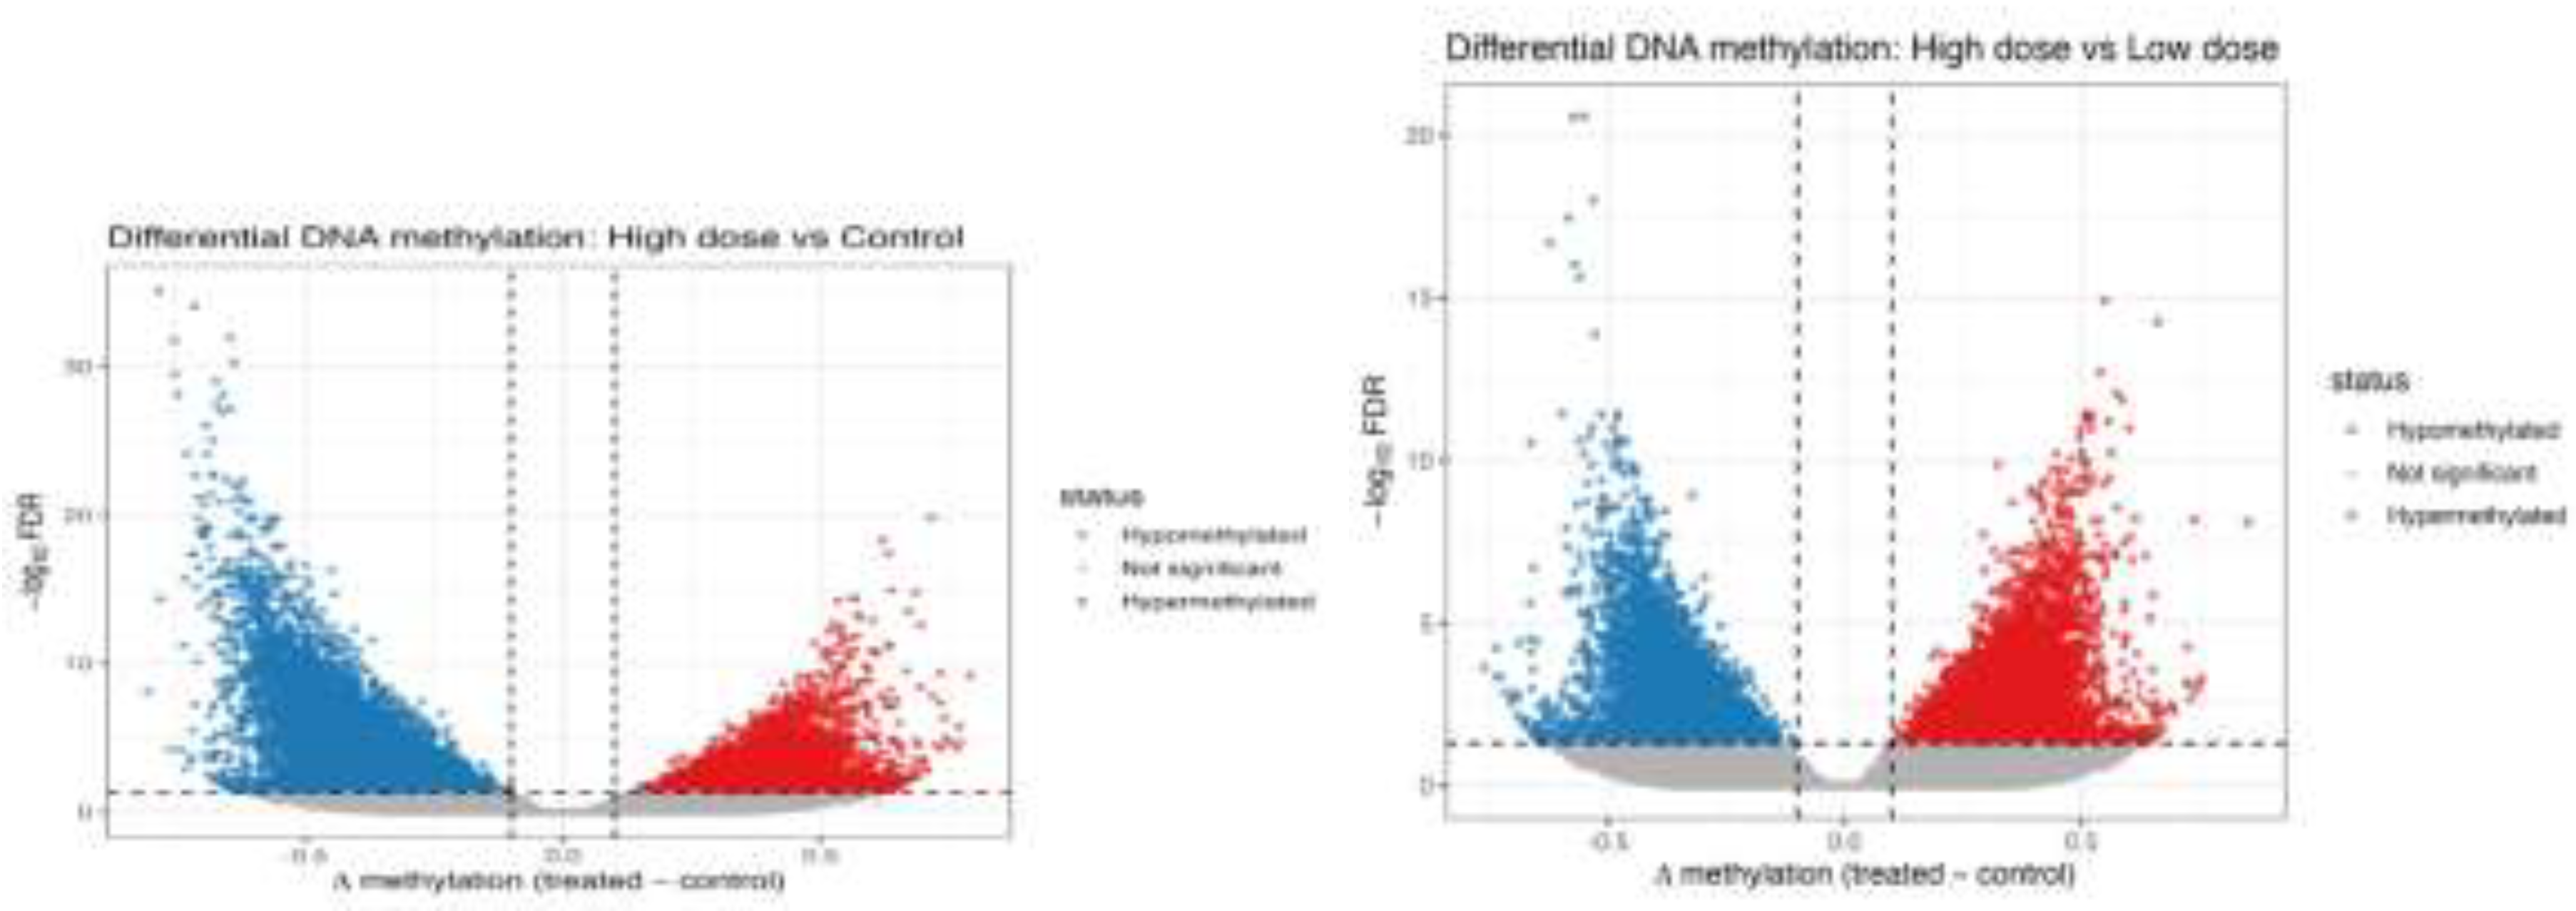
Figure 5.
A. Volcano plot of DMRs in high-dose MET–treated cells versus control.
Volcano plot (Figure 5A) depicting differentially methylated regions (DMRs) in high-dose MET–treated H9c2 cells compared with controls. Red points represent significantly hypermethylated regions, blue points represent significantly hypomethylated regions, and black points indicate non-significant loci (confirmation of baseline variability). The x-axis shows Δβ values (treated − control), and the y-axis shows −log10 FDR-adjusted p-values. The greater spread and number of significant DMRs in the high-dose group demonstrate a dose-dependent increase in metformin-induced epigenetic remodelling.
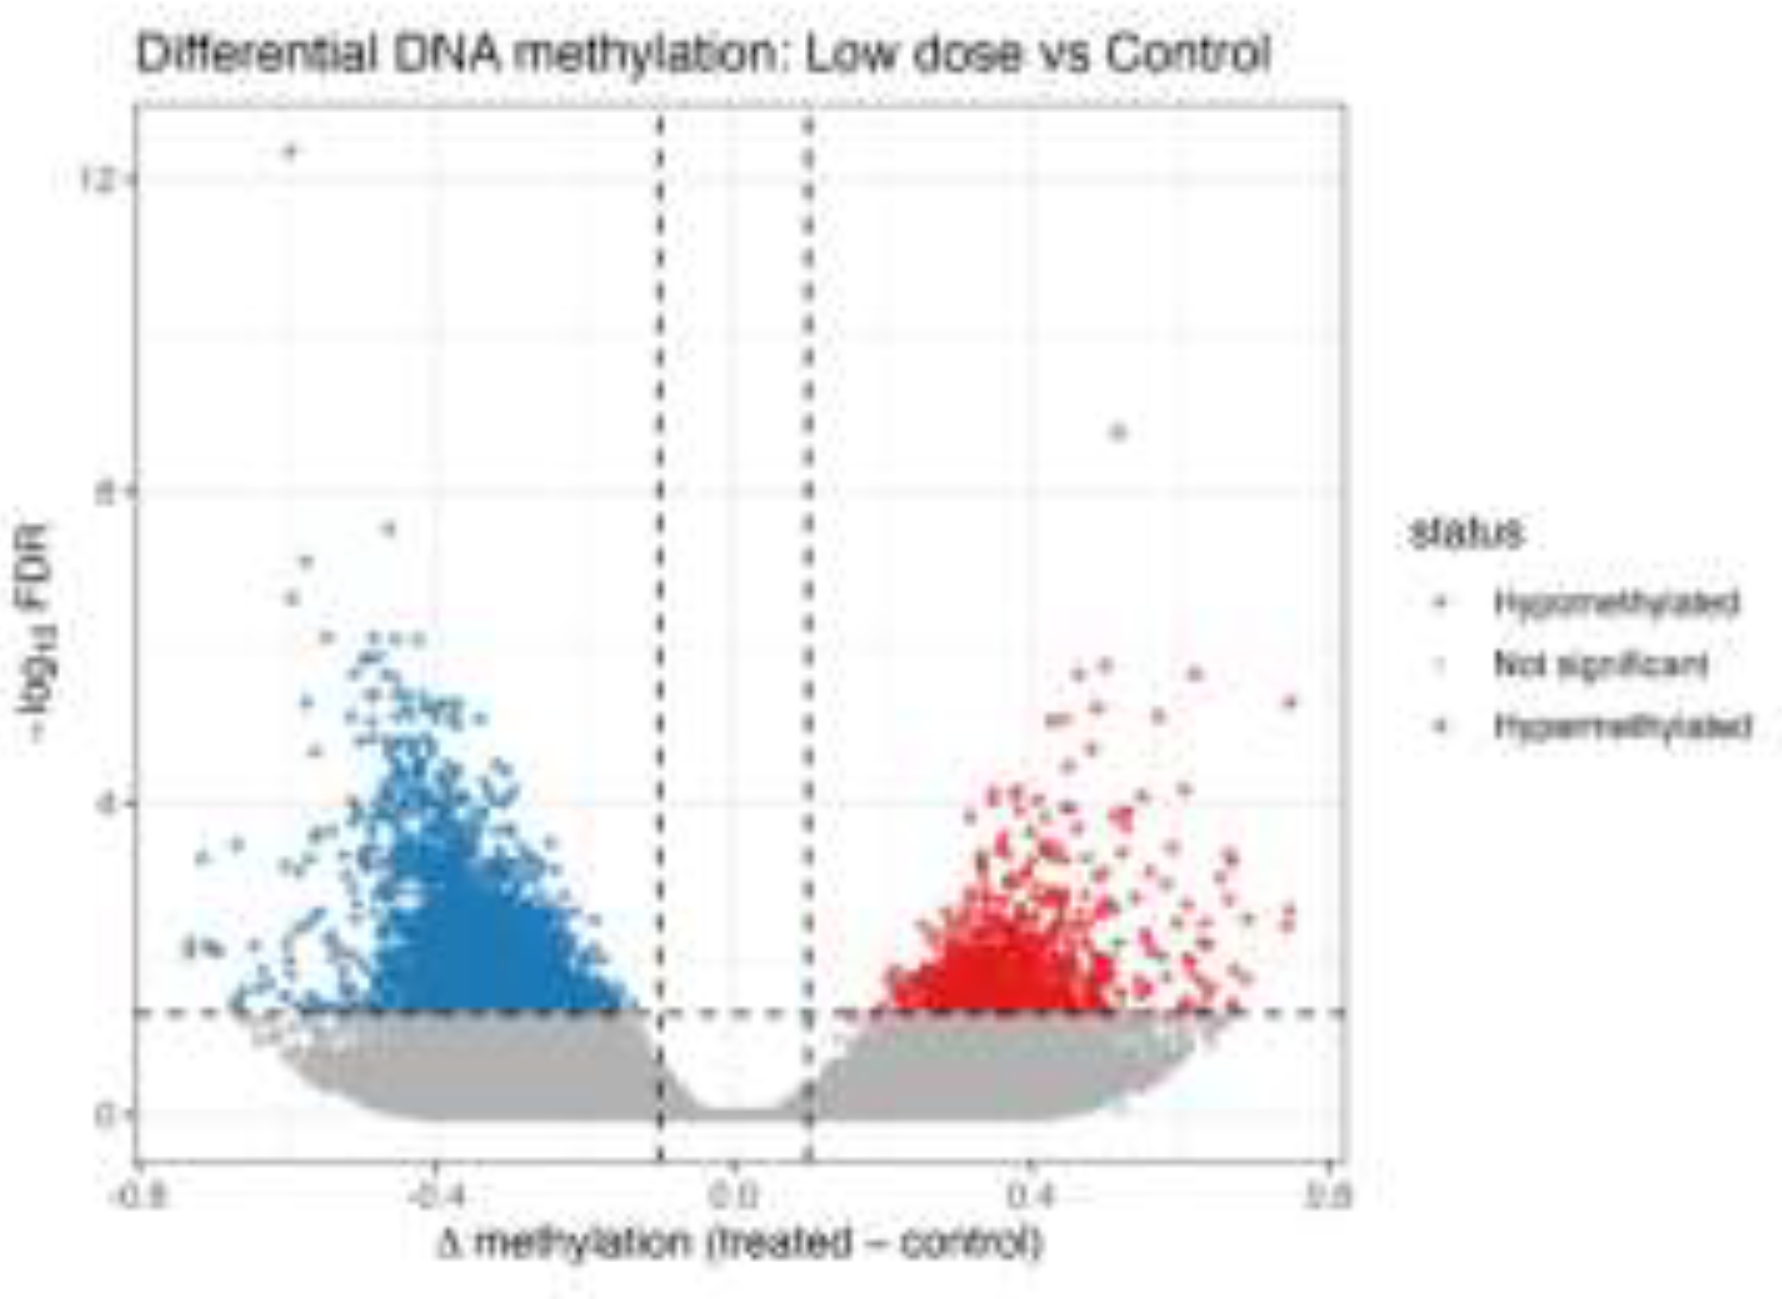
Figure 5.
B. Differential DNA methylation between high-dose and low-dose metformin–treated H9c2 cells.
Figure 5.
B. Differential DNA methylation between high-dose and low-dose metformin–treated H9c2 cells.
Volcano plot illustrating differentially methylated regions (DMRs) between high-dose and low-dose metformin (MET)–treated H9c2 cardiomyoblast cells (Figure 5B). The x-axis represents the difference in DNA methylation (Δβ; high dose − low dose), and the y-axis represents statistical significance (−log10 FDR-adjusted p-value). Red points indicate significantly hypermethylated regions in the high-dose group, blue points indicate significantly hypomethylated regions, and black points represent non-significant loci (confirmation/background). Vertical dashed lines denote the Δβ threshold, and the horizontal dashed line indicates the FDR significance cutoff (adjusted p < 0.05), demonstrating a clear dose-dependent epigenetic shift induced by metformin.
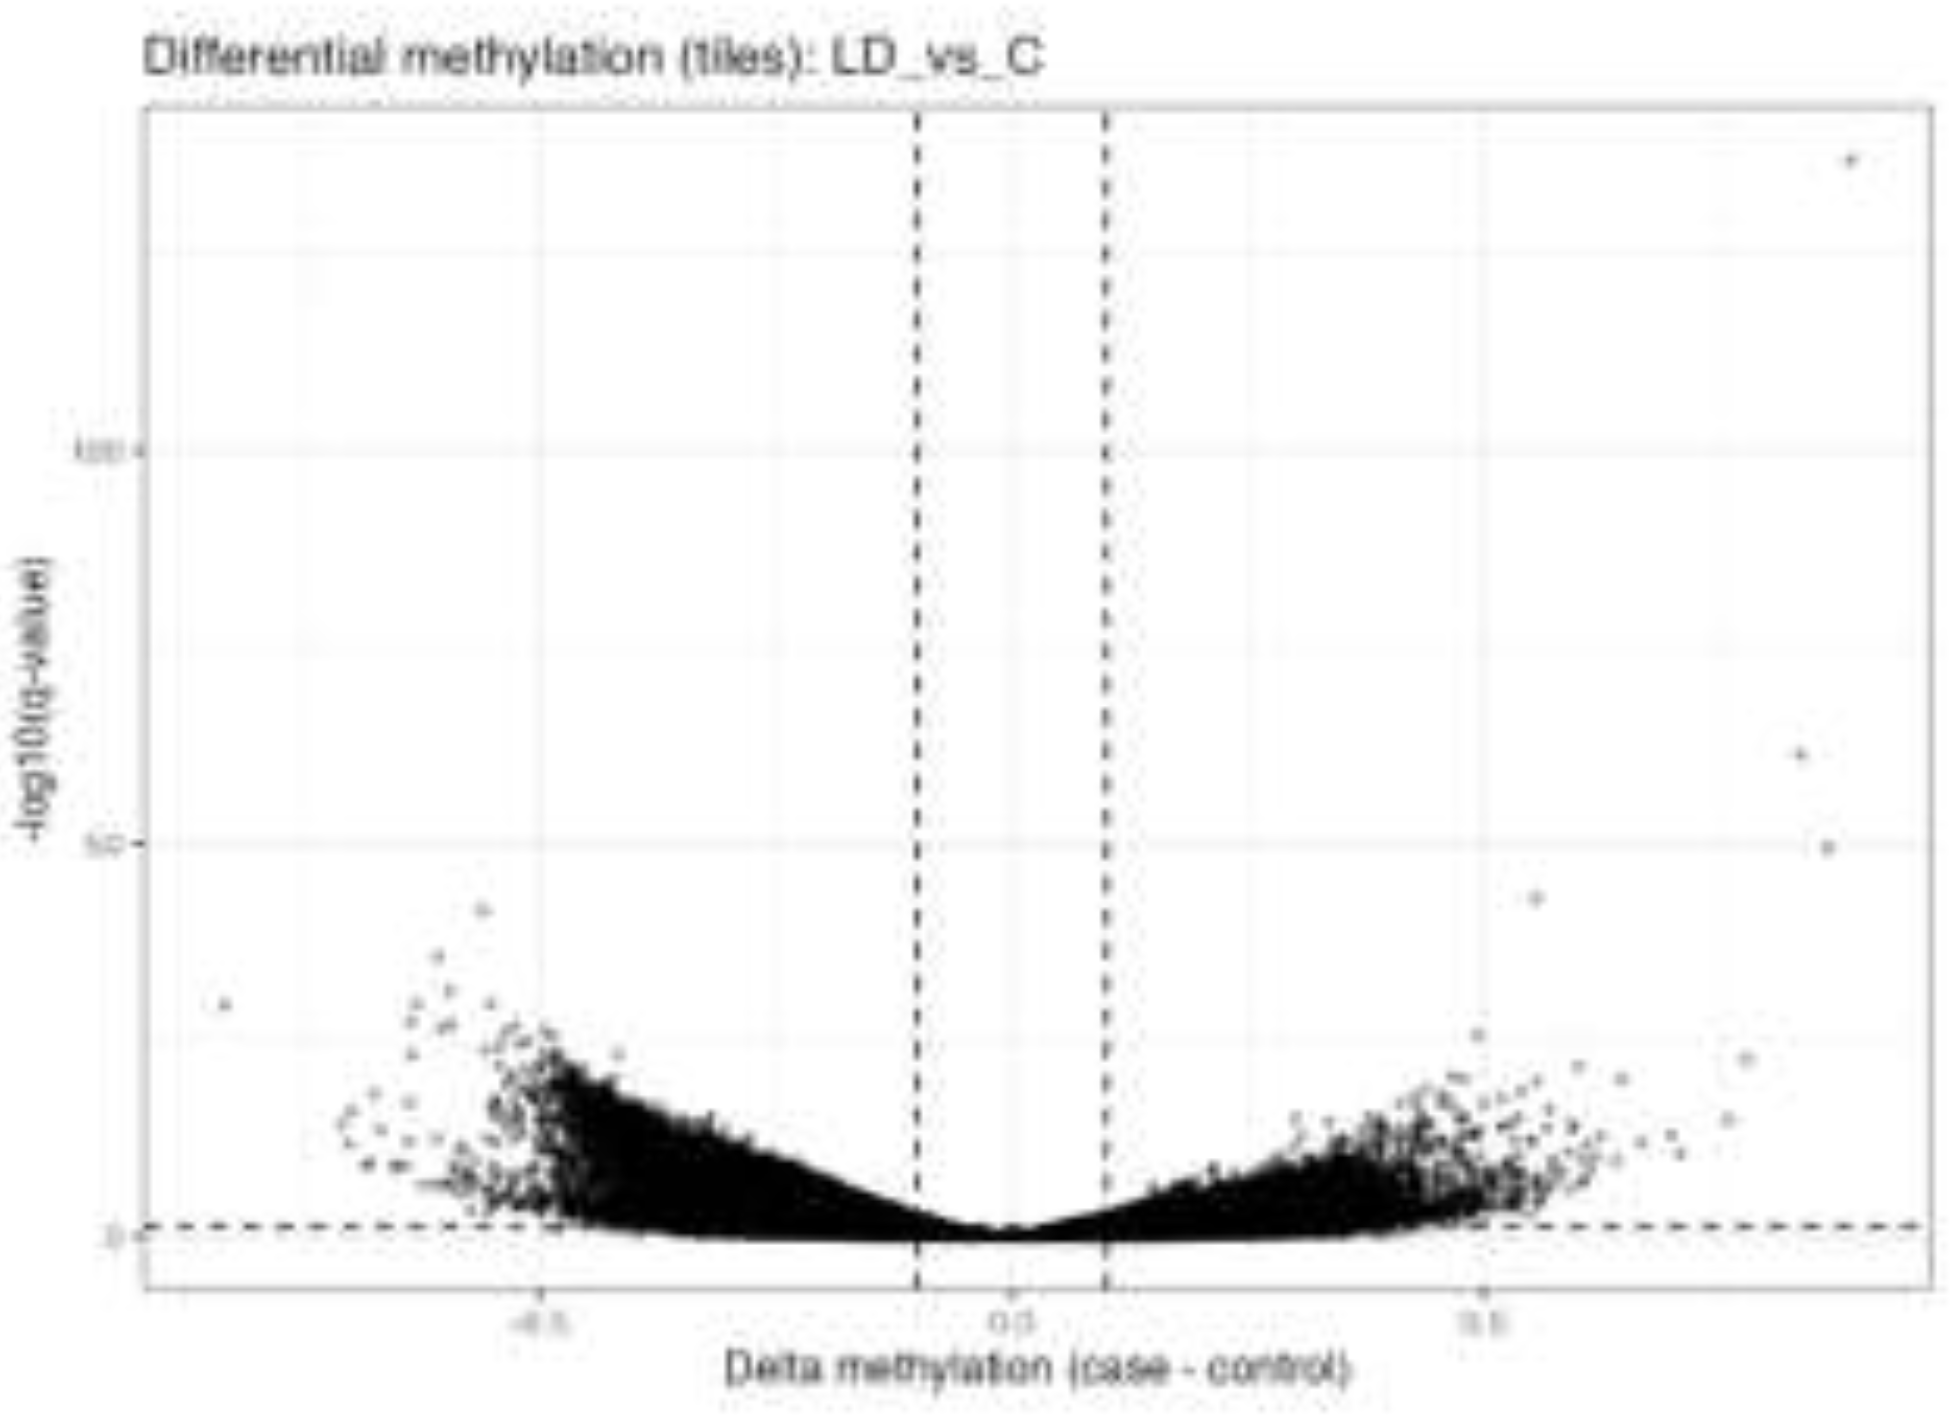
Figure 5.
C. Differential DNA methylation between low dose MET and control H9c2 cells.
Volcano plot showing differentially methylated regions (DMRs) in low-dose-metformin–treated H9c2 cells compared with untreated controls (Figure 5C). The x-axis represents the difference in DNA methylation (Δβ; treated − control), and the y-axis represents statistical significance (−log10 FDR-adjusted p-value). Black dots indicate regions that did not reach statistical significance (confirmation of background distribution), while regions exceeding the defined thresholds (|Δβ| and FDR < 0.05) are considered significantly differentially methylated.
3.7. Hierarchical Clustering Analysis of Differentially Methylated Regions
Hierarchical clustering of genome-wide DNA methylation profiles revealed clear groupings of samples by treatment. Control samples clustered tightly, indicating stable baseline methylation patterns. High-dose metformin–treated cells formed a distinct cluster characterized by pronounced methylation changes, whereas low-dose samples occupied an intermediate position between control and high-dose groups. This clustering pattern confirms a dose-dependent effect of metformin on global DNA methylation in H9c2 cardiomyoblast cells and is consistent with the PCA and differential methylation analyses.
Hierarchical clustering heatmap of differentially methylated 1-kb-genomic tiles in H9c2 cardiomyoblast cells treated with low-dose and high-dose metformin compared with untreated controls (Figure 6). Rows represent genomic regions, and columns represent individual samples. Methylation levels are displayed as scaled β-values (z-score), with red indicating higher methylation and blue indicating lower methylation. Unsupervised clustering reveals a clear separation of samples according to treatment group, demonstrating a dose-dependent epigenetic reprogramming effect of metformin on the cardiac DNA methylation landscape.
3.8. Dose-Dependent Epigenetic Responses to Metformin
Direct comparison between high-dose and low-dose metformin–treated samples revealed a distinct set of differentially methylated regions, confirming a dose-dependent epigenetic response. Several loci displayed increased methylation in the high-dose group, while others were hypomethylated, indicating both enhanced methylation and selective demethylation with increasing metformin concentration. These findings demonstrate progressive and locus-specific DNA methylation remodeling in response to escalating metformin exposure.
3.9. Comparison of the Most and Least Epigenetically Affected Genes in LD and HD Groups
Look at the appendix for more details.
Comparison of genes showing the highest and lowest numbers of differentially methylated regions (DMRs) in low-dose metformin (LD)–treated H9c2 cells, including methylation direction and associated biological functions, is summarized in Table 1.
These findings are summarized in Table 2.
3.10. Pathway Changes After Metformin Treatment for Low and High Doses
Schematic overview of the major families of ATP-dependent chromatin remodelling complexes (CRCs), including ISWI, CHD (NuRD), SWI/SNF (BAF/PBAF), and INO80/SWR, which regulate chromatin structure through nucleosome sliding, spacing, ejection, histone dimer removal, and histone variant exchange. These processes control DNA accessibility and interact closely with DNA methylation machinery to shape transcriptional programs.
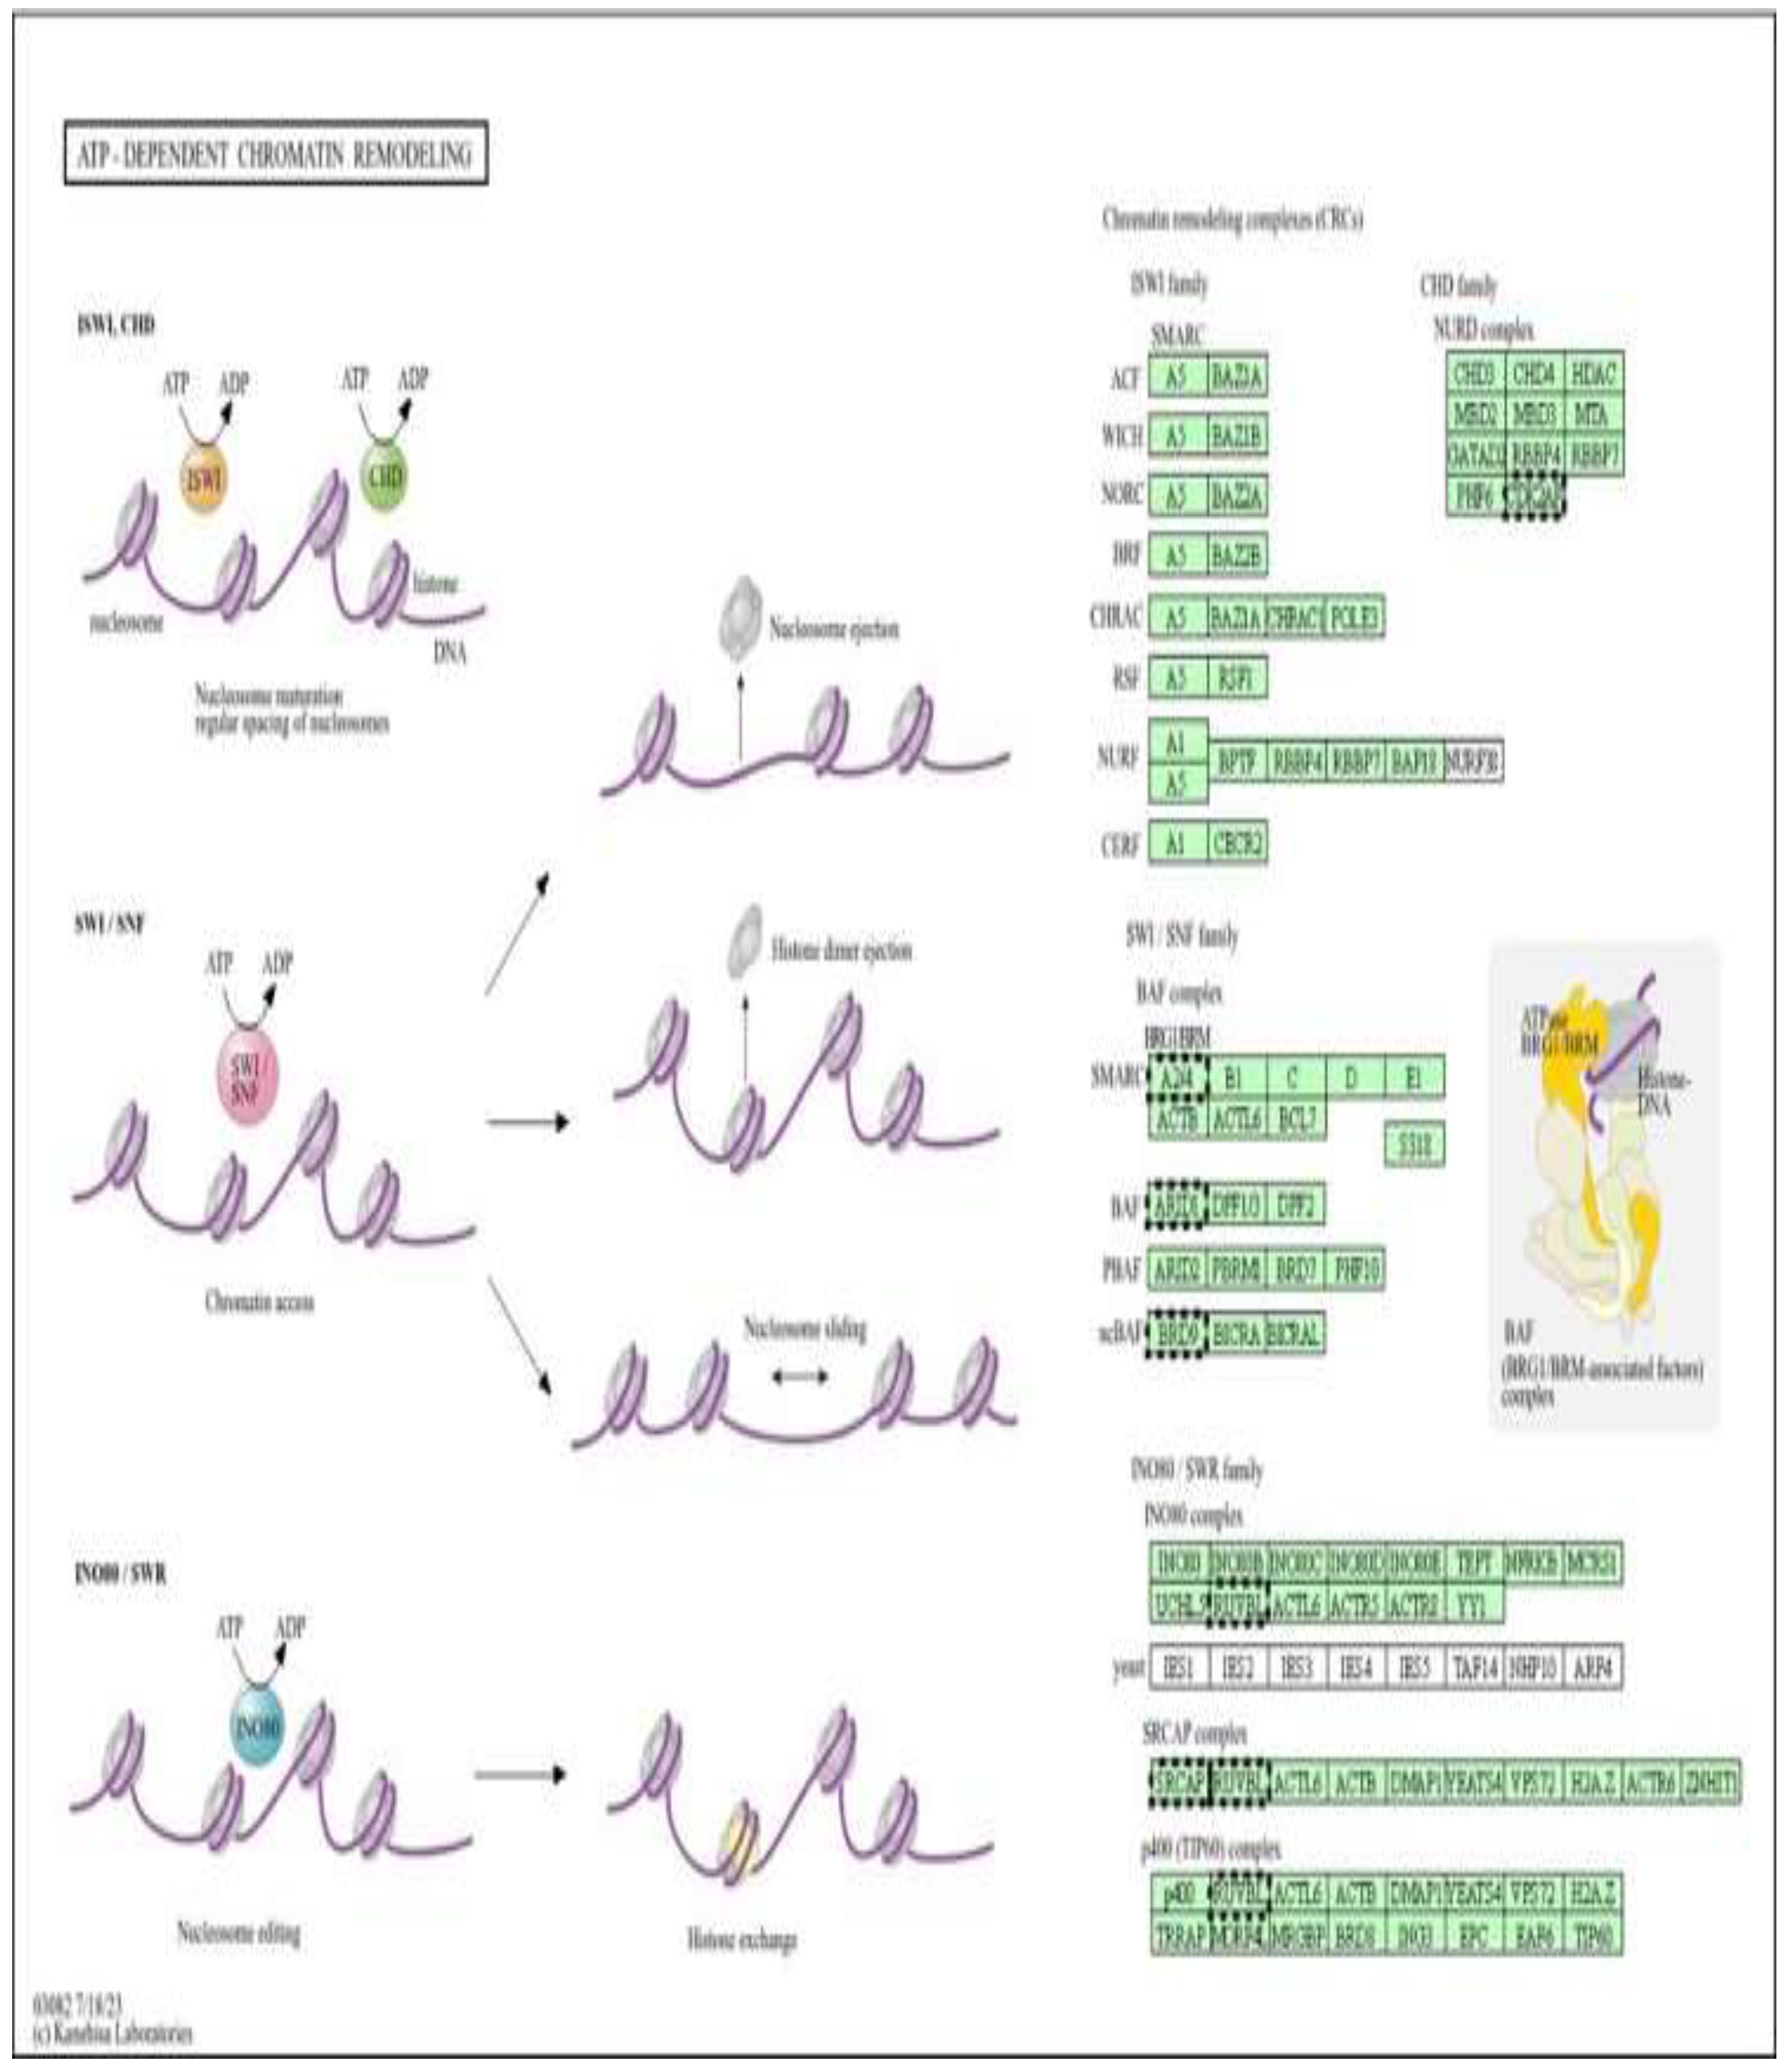
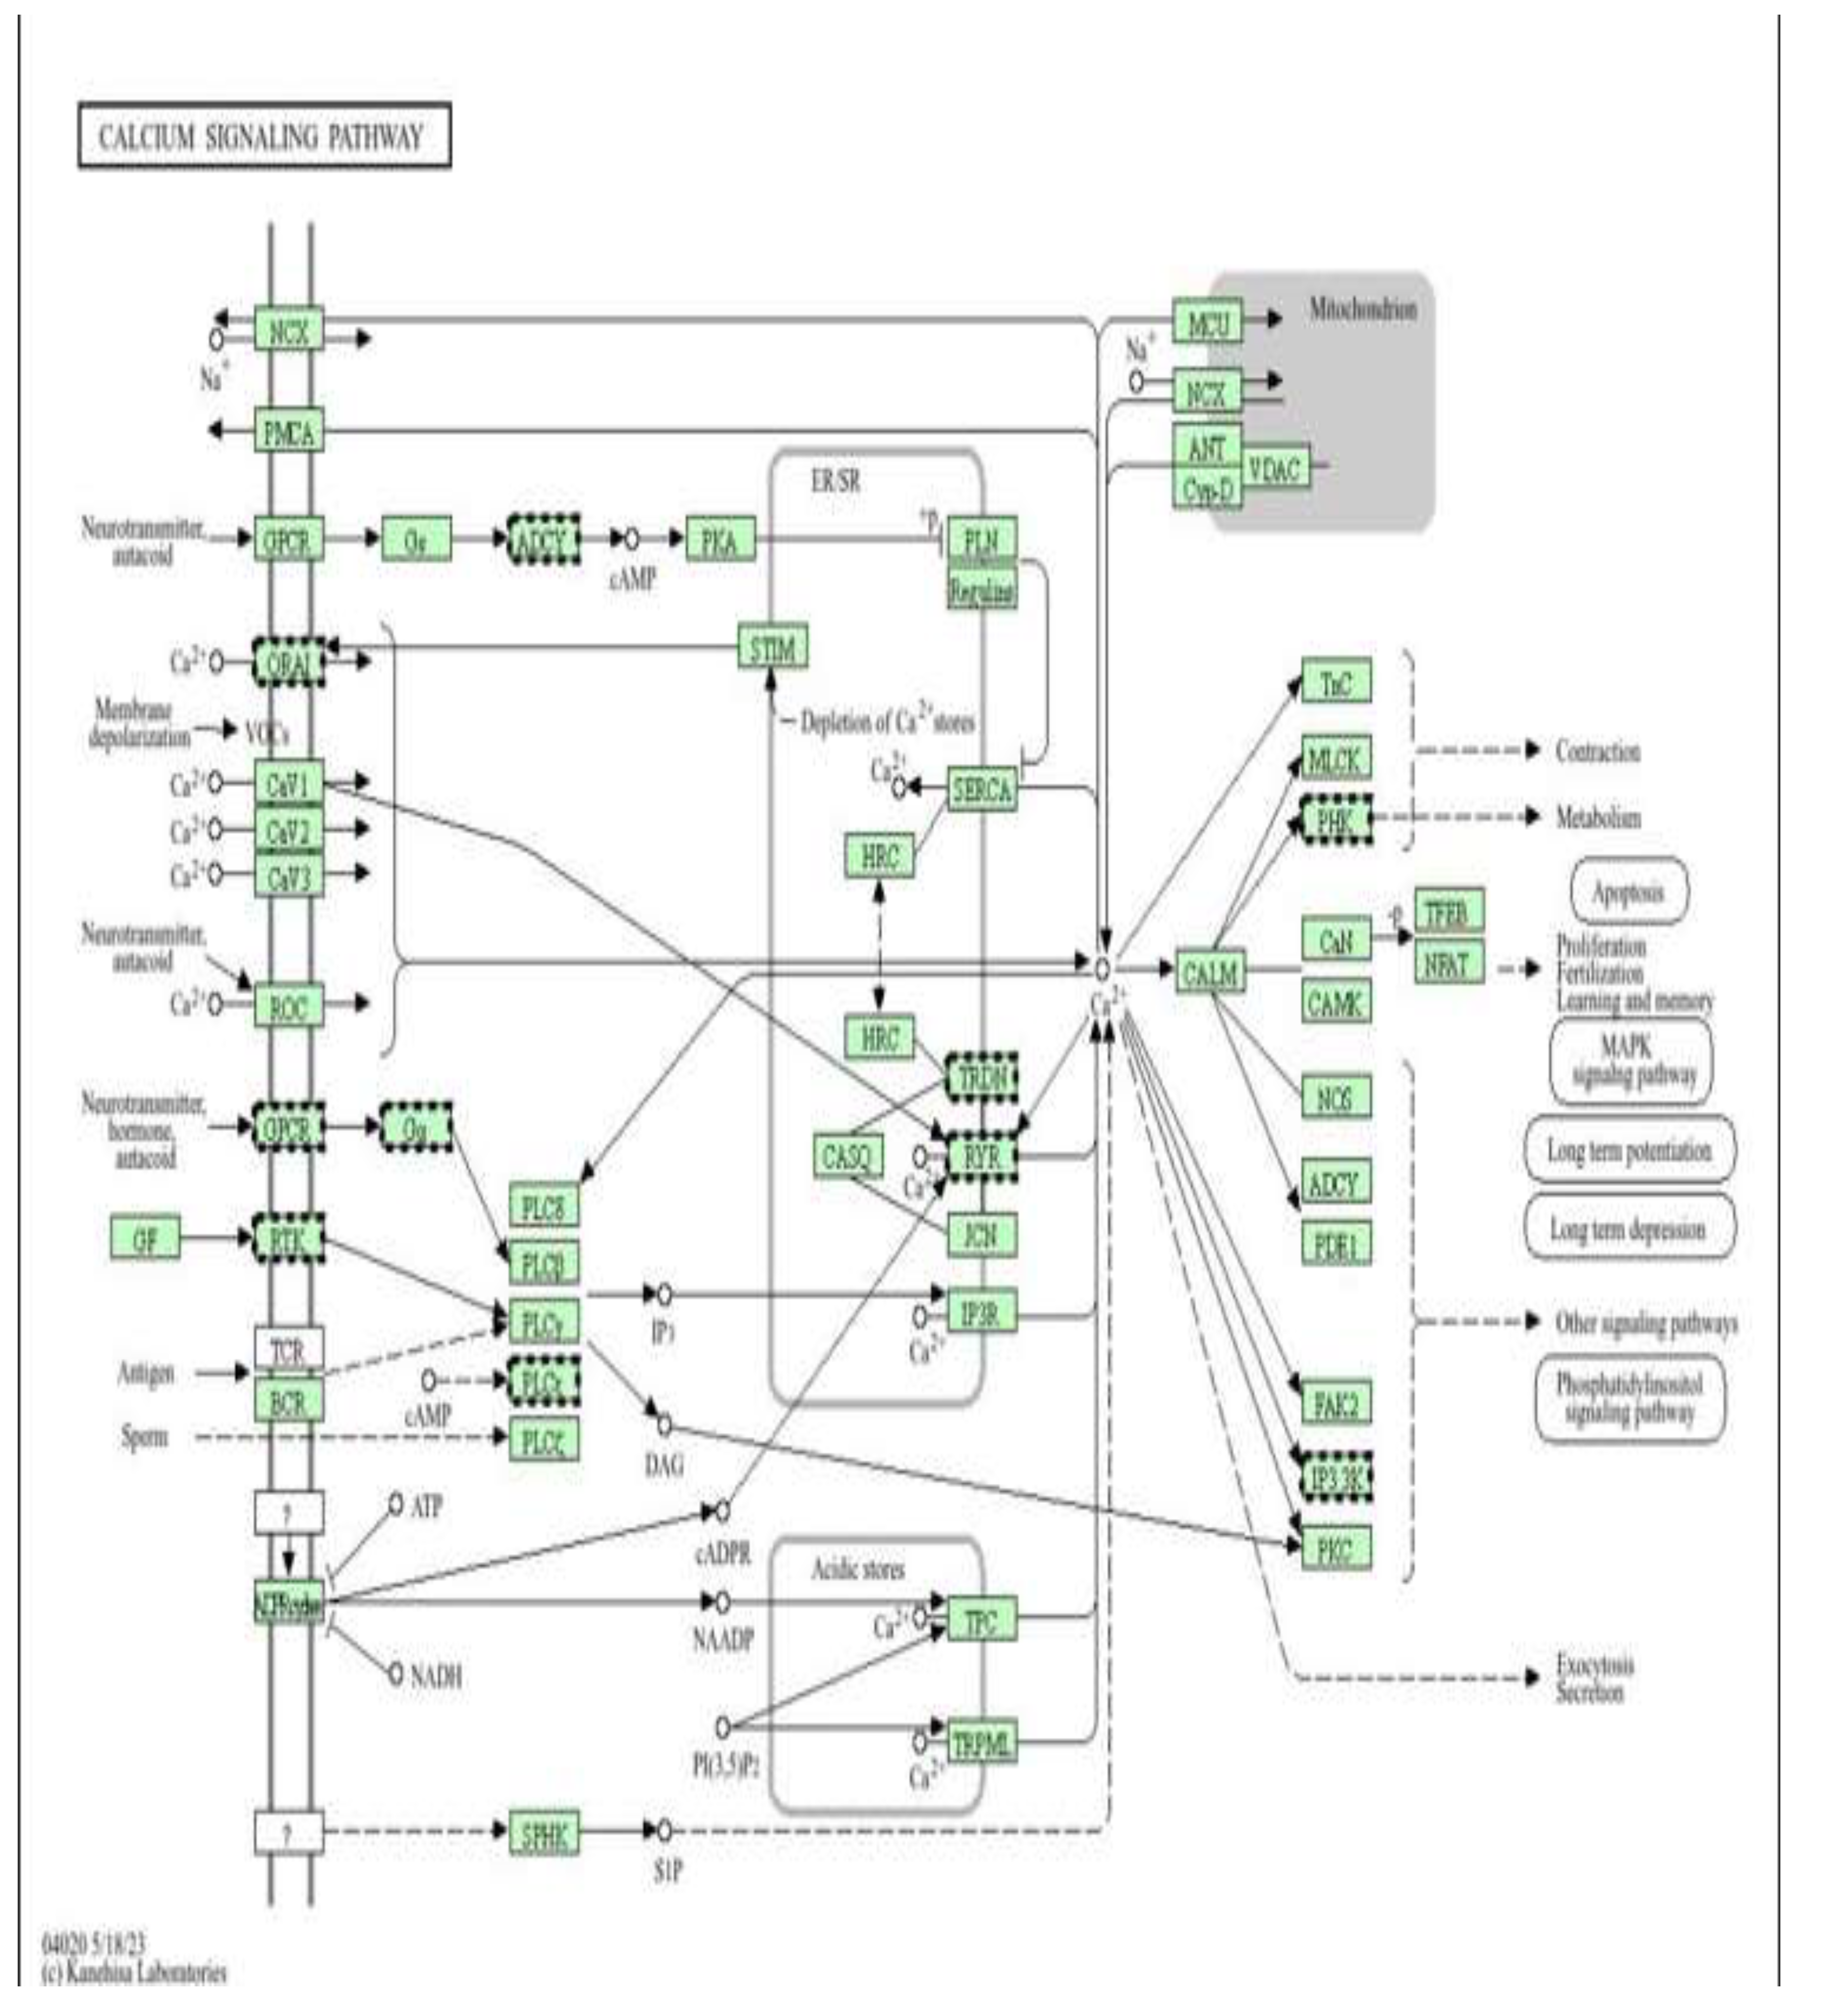
Figure 7.
ATP-dependent chromatin remodelling complexes as epigenetic targets of metformin-mediated cardioprotection (low dose). Pathway enrichment analysis was performed using DAVID (Figure 7) [13].
Figure 8.
calcium signalling pathway as a target of metformin-mediated protection (low dose). Pathway enrichment analysis was performed using DAVID [13].
Figure 8.
calcium signalling pathway as a target of metformin-mediated protection (low dose). Pathway enrichment analysis was performed using DAVID [13].
Schematic representation of the cardiac calcium (Ca²⁺) signalling network(Figure 8), illustrating Ca²⁺ influx through voltage-operated and receptor-operated channels, release from the sarcoplasmic reticulum via ryanodine receptors (RYR) and IP₃ receptors (IP3R), reuptake by SERCA, and extrusion through NCX and PMCA, as well as mitochondrial Ca²⁺ handling via MCU, ANT, and VDAC. Downstream Ca²⁺-dependent effectors, including calmodulin (CALM), CaMK, calcineurin (CaN), NFAT, MLCK, and PKC, regulate key cellular processes such as contraction, metabolism, apoptosis, and gene transcription.
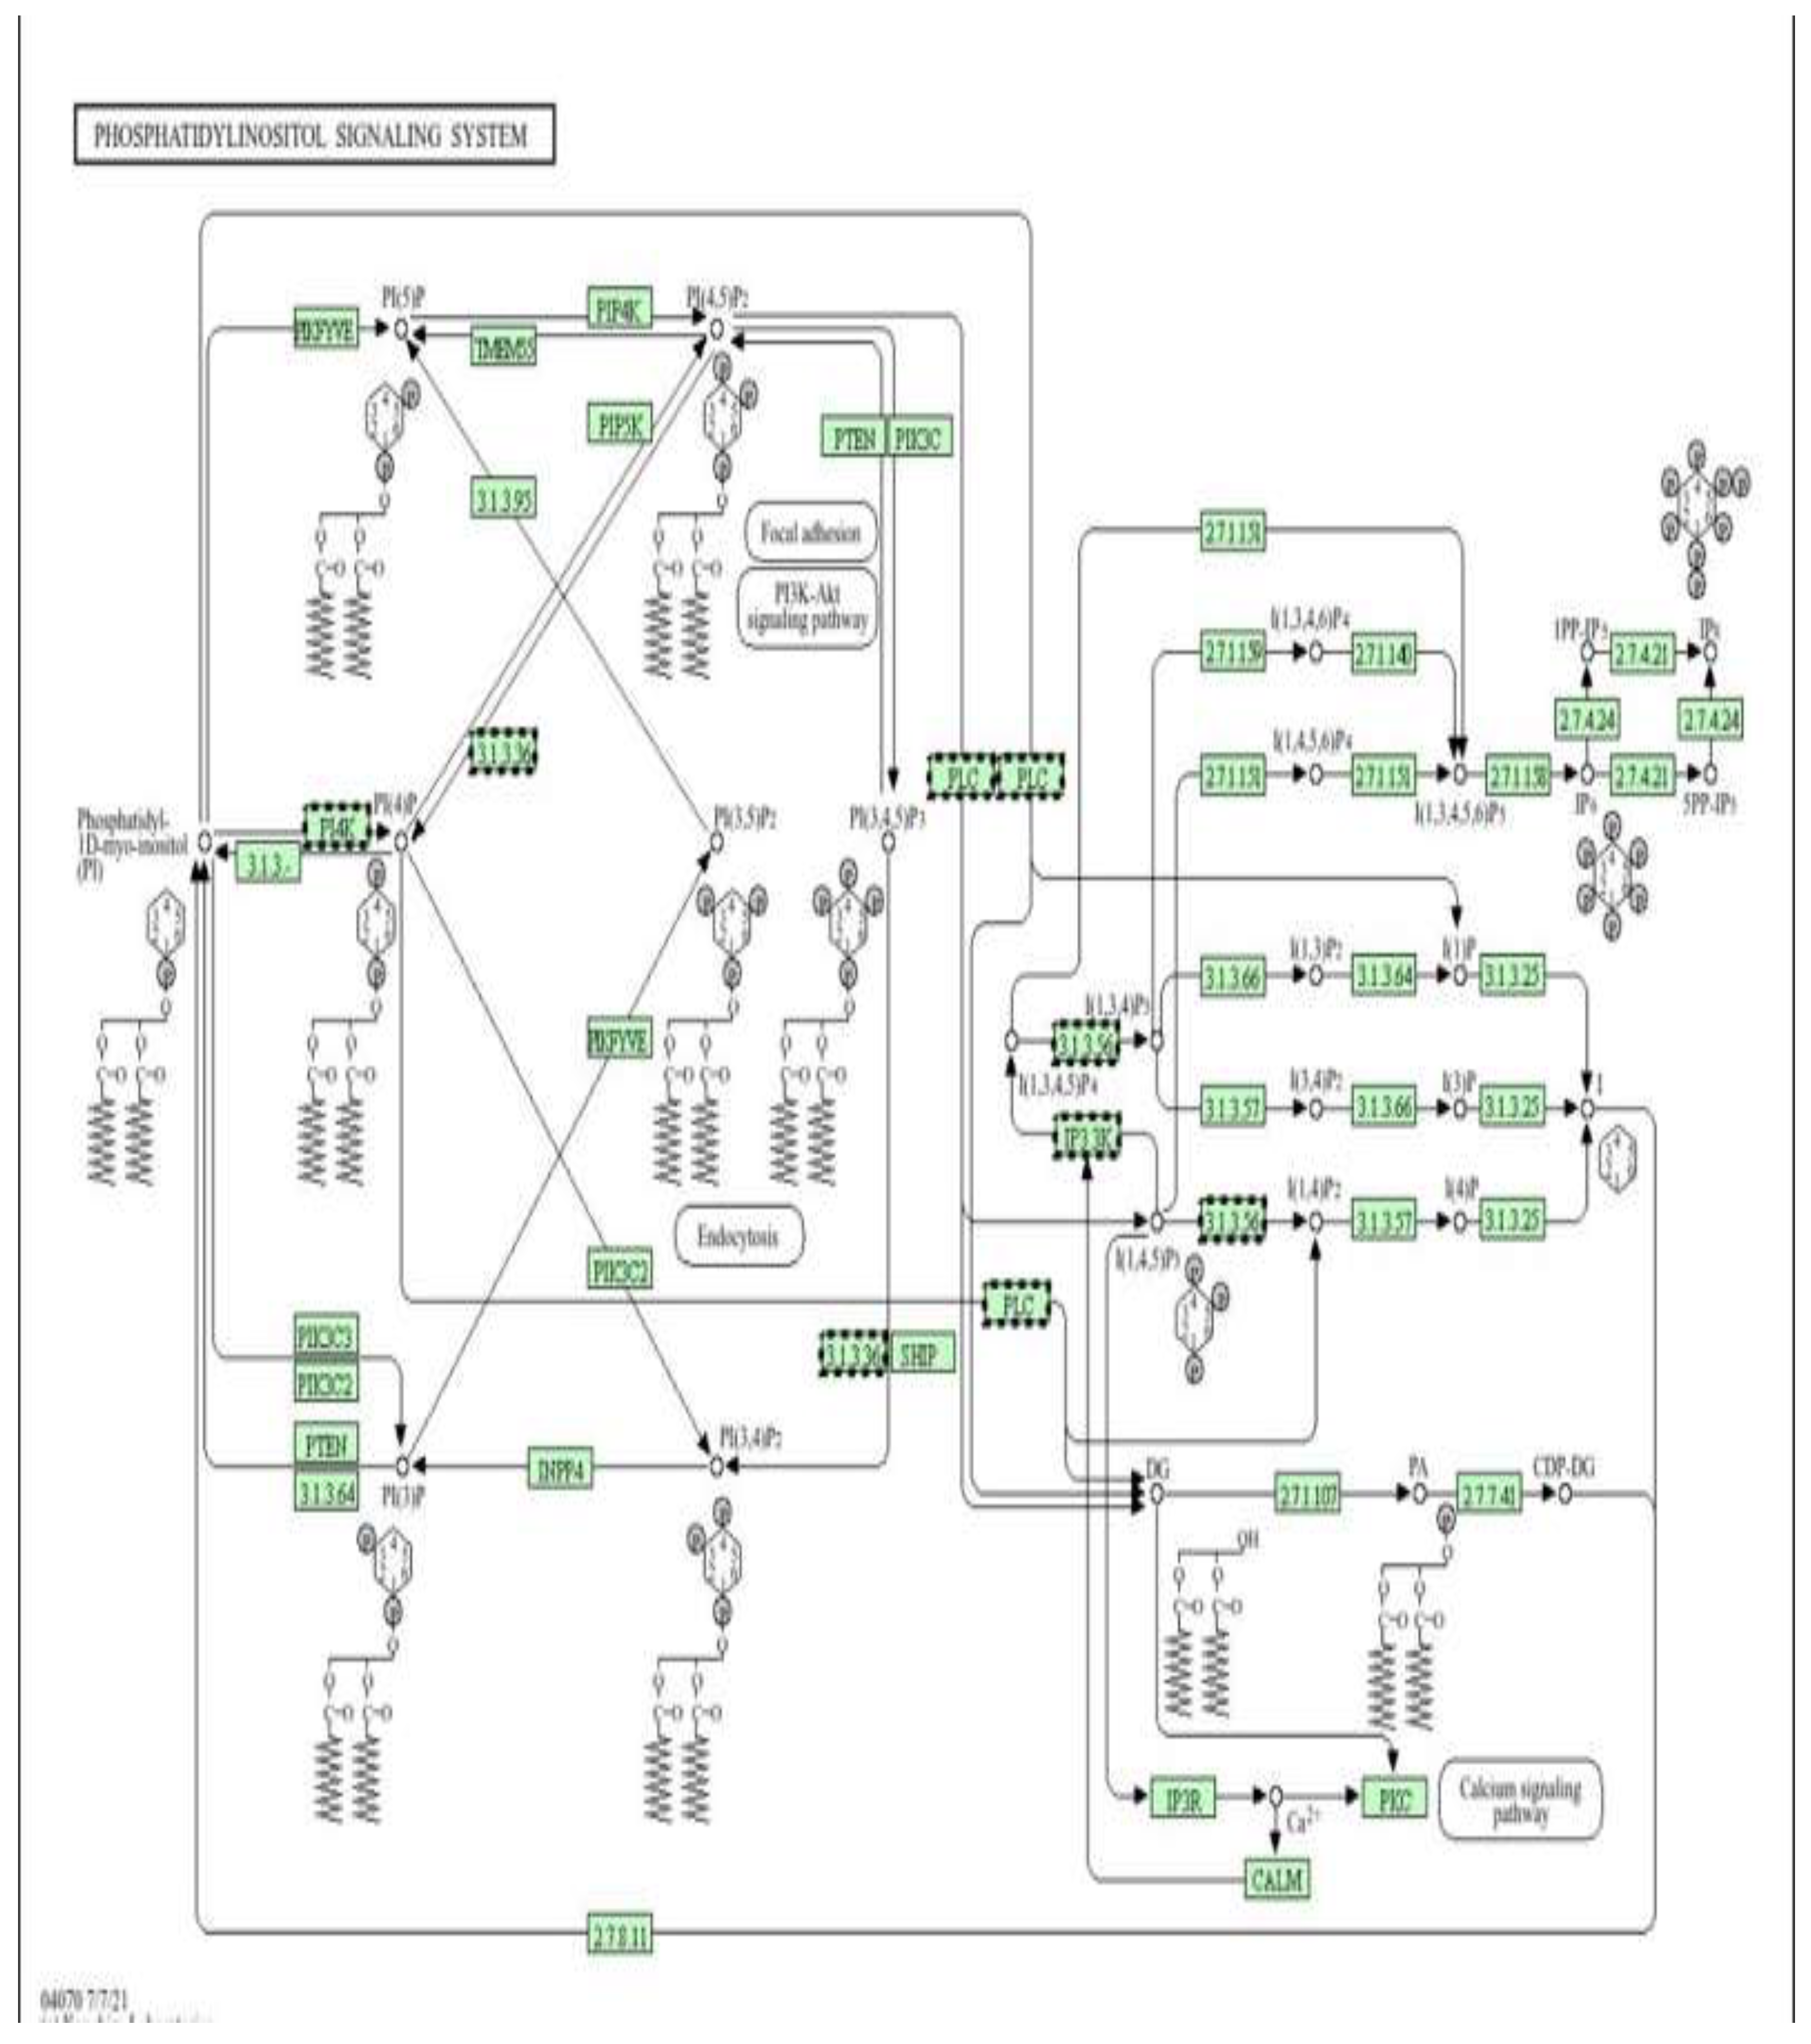
Figure 9.
Phosphatidylinositol (PI) signalling pathway as an epigenetically regulated target of metformin (low dose) (Figure9). Pathway enrichment analysis was performed using DAVID [13].
Figure 9.
Phosphatidylinositol (PI) signalling pathway as an epigenetically regulated target of metformin (low dose) (Figure9). Pathway enrichment analysis was performed using DAVID [13].
Schematic representation of the phosphatidylinositol (PI) signalling system, highlighting the interconversion of phosphoinositides (PI, PI4P, PI(4,5)P₂, PI(3,4,5)P₃) by PI kinases (PI3K, PI4K, PIP5K), phosphatases (PTEN, SHIP, INPP4), and phospholipase C (PLC). This pathway generates key second messengers, including IP₃ and DAG, which activate Ca²⁺ release via IP3R and downstream effectors such as PKC, CaM, and Akt, thereby regulating cell survival, metabolism, proliferation, and apoptosis.
Figure 10 shows a Schematic representation of the thermogenesis signalling network, illustrating sympathetic stimulation, β-adrenergic receptor (β3-AR) activation, cAMP–PKA signalling, and downstream transcriptional regulators (CREB, PGC-1α, PRDM16, PPARγ, SIRT6) that control mitochondrial biogenesis, fatty acid oxidation, and uncoupling protein-1 (UCP1) expression. The pathway integrates AMPK, mTOR, and MAPK signalling with lipid mobilization and oxidative phosphorylation to regulate cellular energy expenditure and heat production.
This figure illustrates the major families of ATP-dependent chromatin remodelling complexes (CRCs) (Figure 11), including ISWI, CHD (NuRD), SWI/SNF (BAF/PBAF), and INO80/SWR, and their roles in regulating nucleosome spacing, sliding, ejection, histone dimer removal, and histone variant exchange. These remodelling activities control chromatin accessibility and cooperate with DNA methylation machinery to establish and maintain transcriptionally permissive or repressive states. In the context of the present study, doxorubicin-induced oxidative stress and mitochondrial dysfunction are proposed to disrupt the function and recruitment of these ATP-dependent remodelers, thereby altering chromatin structure and leading to aberrant DNA methylation patterns in H9c2 cardiomyoblast cells. Metformin, through AMPK activation and restoration of cellular energy homeostasis, may preserve the activity of ATP-dependent remodelling complexes and limit stress-induced mislocalization of key subunits (e.g., SMARCA4/BRG1, ACTL6, CHD, and INO80 components). By stabilizing chromatin architecture and its interaction with DNA methyltransferases, metformin is suggested to counteract doxorubicin-driven epigenetic reprogramming and contribute to the cardioprotective DNA methylation profiles observed in this genome-wide analysis.
Figure 12 shows a Schematic representation of the phosphatidylinositol (PI) signalling system, illustrating the interconversion of membrane phosphoinositides (PI, PI4P, PI(4,5)P₂, PI(3,4,5)P₃) by PI kinases (PI3K, PI4K, PIP5K), phosphatases (PTEN, SHIP, INPP4), and phospholipase C (PLC). This pathway generates key second messengers, including IP₃ and diacylglycerol (DAG), which activate Ca²⁺ release through IP₃ receptors (IP3R) and downstream effectors such as PKC, calmodulin (CaM), and Akt, thereby regulating cell survival, metabolism, proliferation, and apoptosis, In the context of the present study, doxorubicin-induced oxidative stress and mitochondrial dysfunction are associated with dysregulation of PI3K/Akt and PLC–IP₃–Ca²⁺ signalling, contributing to abnormal activation of pro-apoptotic and stress-responsive pathways and to epigenetic instability. Metformin, via AMPK activation and modulation of PI3K/Akt signalling, is proposed to restore balanced phosphoinositide turnover, limit pathological Ca²⁺ mobilization, and suppress excessive PKC and Akt stress signalling. The differential DNA methylation observed in genes involved in PI metabolism, Ca²⁺ handling, and downstream survival pathways supports a model in which metformin exerts cardioprotective effects, at least in part, by epigenetically stabilizing the phosphatidylinositol signalling network in H9c2 cells exposed to doxorubicin.
Figure 13 shows a Schematic representation of the intracellular Ca²⁺ signalling network in cardiomyocytes, illustrating Ca²⁺ influx through voltage-operated (CaV1–3) and receptor-operated channels (ROC, ORAI), release from the sarcoplasmic reticulum via ryanodine receptors (RYR) and IP₃ receptors (IP3R), reuptake by SERCA, and extrusion through NCX and PMCA. Mitochondrial Ca²⁺ handling is mediated by MCU, VDAC, ANT, and Cyclophilin D. Downstream Ca²⁺-dependent effectors, including calmodulin (CALM), CaMK, calcineurin (CaN)/NFAT, PKC, MLCK, and Troponin C (TnC), regulate excitation–contraction coupling, metabolism, transcription, and apoptosis, In the context of this study, doxorubicin disrupts Ca²⁺ homeostasis, leading to sarcoplasmic reticulum Ca²⁺ leak, mitochondrial Ca²⁺ overload, oxidative stress, and activation of pro-apoptotic signalling pathways, processes that are tightly linked to epigenetic dysregulation and altered DNA methylation. Metformin, through activation of AMPK and improvement of mitochondrial function, is proposed to stabilize Ca²⁺ cycling by preserving SERCA activity, limiting excessive RYR and IP3R-mediated Ca²⁺ release, and reducing mitochondrial Ca²⁺ accumulation. This normalization of Ca²⁺-dependent signalling (CaMK, NFAT, PKC) may indirectly protect the epigenome by decreasing ROS-induced DNMT dysfunction and maintaining chromatin and DNA methylation stability in H9c2 cardiomyoblast cells exposed to doxorubicin.
Figure 14 shows a Schematic representation of the thermogenesis and energy-regulating signalling network, highlighting β-adrenergic receptor (β3-AR)/cAMP/PKA signalling, AMPK activation, and downstream transcriptional regulators (CREB, PGC-1α, PRDM16, PPARγ, SIRT6, ATF2) that control mitochondrial biogenesis, fatty-acid oxidation, and uncoupling protein-1 (UCP1) expression. These pathways coordinate lipolysis, oxidative phosphorylation, and heat production by regulating the electron transport chain, the TCA cycle, and fatty-acid transport (CPT1, CACT, CPT2).In this study, doxorubicin-induced mitochondrial dysfunction and oxidative stress impair cellular energy homeostasis and contribute to epigenetic instability in cardiomyoblasts. Metformin, via AMPK activation and modulation of mTOR and PGC-1α/SIRT signalling, is proposed to enhance mitochondrial efficiency, reduce ROS generation, and stabilize metabolic gene expression. The DNA methylation changes observed in genes involved in mitochondrial metabolism, fatty acid oxidation, and oxidative phosphorylation suggest that metformin exerts cardioprotective effects, at least in part, through epigenetic regulation of energy and thermogenic pathways, thereby preserving mitochondrial function and limiting doxorubicin-induced cardiotoxic remodelling.
4. Conclusion
This study demonstrated that metformin induces widespread and dose-dependent alterations in DNA methylation patterns in H9c2 cardiomyoblast cells. The identification of both hypermethylated and hypomethylated regions highlights a complex and bidirectional epigenetic response, suggesting that cumulative exposure to metformin may lead to persistent reprogramming of cardiac gene regulation.
Importantly, the present findings provide mechanistic support for the concept that epigenetic alterations may contribute to the delayed, progressive nature of anthracycline cardiotoxicity, thereby linking acute drug exposure to long-term cardiac dysfunction via stable DNA methylation changes. Such epigenetic signatures may, in the future, serve as molecular biomarkers for early risk stratification and prediction of susceptibility to cardiotoxicity in patients receiving anthracycline-based chemotherapy.
From a cardio-oncology perspective, the demonstration that DNA methylation pathways are involved in doxorubicin-induced injury, and that these pathways are potentially modifiable by agents such as metformin, supports the emerging paradigm of epigenetic-based cardioprotection. These results suggest that metformin, beyond its metabolic effects, may represent a promising adjunctive therapy to attenuate chemotherapy-induced epigenetic remodelling and preserve cardiac function without compromising antitumor efficacy.
Collectively, this study advances the understanding of the epigenetic basis of doxorubicin cardiotoxicity and highlights the translational potential of targeting DNA methylation pathways in cardio-oncology. Future clinical and longitudinal studies integrating epigenomic, transcriptomic, and functional cardiac assessments are warranted to validate these findings and to explore the feasibility of incorporating epigenetic biomarkers and epigenetic-modulating agents into personalized cardioprotective strategies for cancer patients.
Author Contributions
Conceptualization, M.Z. and H.H.; methodology, M.A.A. and N.H.; software and bioinformatics analysis, N.H. and H.S.; validation, M.A.A. and M.Z.; formal analysis, M.A.A.; investigation, M.A.A. and H.M.; resources and funding acquisition, M.Z.; data curation, M.A.A. and N.H.; writing—original draft preparation, M.A.A.; writing—review and editing, M.Z., H.H., and H.S.; visualization, M.A.A.; supervision, M.Z.; project administration, M.Z. All authors have read and agreed to the published version of the manuscript.
Funding
This research received no external funding.
Institutional Review Board Statement
Not applicable.
Informed Consent Statement
Not applicable.
Data Availability Statement
The raw whole-genome bisulfite sequencing (WGBS) data generated in this study have been deposited in the NCBI BioProject repository under accession number PRJNA1422602. The data will be made publicly available upon publication of this manuscript. Processed data and differentially methylated region (DMR) tables are provided as Supplementary Materials.
Conflicts of Interest
The authors declare no conflicts of interest.
References
- Ajzashokhi, A. H.; Bostan, H. B.; Jomezadeh, V.; Hayes, A. W.; Karimi, G. A review on the cardioprotective mechanisms of metformin against doxorubicin. Human & Experimental Toxicology 2020, 39(3), 237–248. [Google Scholar]
- Baccarelli, A. A.; Byun, H. M. Platelet mitochondrial DNA methylation: A potential biomarker of cardiovascular disease. Clinical Epigenetics 2021, 13, 41. [Google Scholar] [CrossRef]
- Bauer, M. A.; Todorova, V. K.; Stone, A.; Carter, W.; Plotkin, M. D.; Hsu, P. C. ... Makhoul, I. Genome-wide DNA methylation signatures predict the early asymptomatic doxorubicin-induced cardiotoxicity in breast cancer. Cancers 2021, 13(24), 6291. [Google Scholar] [CrossRef] [PubMed]
- Bestor, T. H. The DNA methyltransferases of mammals. Human Molecular Genetics 2000, 9(16), 2395–2402. [Google Scholar] [CrossRef] [PubMed]
- Bird, A. DNA methylation patterns and epigenetic memory. Genes & Development 2002, 16(1), 6–21. [Google Scholar] [CrossRef]
- Brownlee, M. The pathobiology of diabetic complications: A unifying mechanism. Diabetes 2005, 54(6), 1615–1625. [Google Scholar] [CrossRef]
- Chen, Y.; Li, S.; Wang, M.; Chen, X. Cardioprotective effects of metformin: Focus on AMPK signalling and mitochondrial homeostasis. Pharmacological Research 2023, 188, 106647. [Google Scholar] [CrossRef]
- Cuyàs, E.; Verdura, S.; Llorach-Parés, L.; Fernández-Arroyo, S.; Joven, J.; Martin-Castillo, B.; Menendez, J. A. Metformin is a direct SIRT1-activating compound: Computational modelling and experimental validation. Frontiers in Endocrinology 2020, 11, 273. [Google Scholar] [CrossRef]
- Fresno Vara, J. A.; Casado, E.; de Castro, J.; Cejas, P.; Belda-Iniesta, C.; González-Barón, M. PI3K/Akt signalling pathway and cancer. Cancer Treatment Reviews 2004, 30(2), 193–204. [Google Scholar] [CrossRef]
- Frommer, M.; McDonald, L. E.; Millar, D. S.; Collis, C. M.; Watt, F.; Grigg, G. W.; Molloy, P. L.; Paul, C. L. A genomic sequencing protocol that yields a positive display of 5-methylcytosine residues in individual DNA strands. Proceedings of the National Academy of Sciences 1992, 89(5), 1827–1831. [Google Scholar] [CrossRef]
- Greco, C. M.; Kunderfranco, P.; Condorelli, G. Epigenetic modifications in cardiovascular disease. Nature Reviews Cardiology 2021, 18(1), 30–45. [Google Scholar] [CrossRef]
- Hescheler, J.; Meyer, R.; Plant, S.; Krautwurst, D.; Rosenthal, W.; Schultz, G. Morphological, biochemical, and electrophysiological characterization of a clonal cell line from rat heart. Circulation Research 1991, 69(6), 1476–1486. [Google Scholar] [CrossRef] [PubMed]
- Huang, D. W.; Sherman, B. T.; Lempicki, R. A. Systematic and integrative analysis of large gene lists using DAVID bioinformatics resources. Nature Protocols 2009, 4(1), 44–57. [Google Scholar] [CrossRef] [PubMed]
- Khan, M.; Yusuf, N.; Ahmad, A.; Hoda, M. N. Epigenetic regulation of cardiotoxicity induced by doxorubicin. Cardiovascular Toxicology 2019, 19(6), 533–543. [Google Scholar] [CrossRef]
- Li, L. C.; Dahiya, R. MethPrimer: Designing primers for methylation PCRs. Bioinformatics 2002, 18(11), 1427–1431. [Google Scholar] [CrossRef]
- Lipshultz, S. E.; Franco, V. I.; Miller, T. L.; Colan, S. D.; Sallan, S. E. Cardiovascular disease in adult survivors of childhood cancer. Annual Review of Medicine 2013, 64, 161–176. [Google Scholar] [CrossRef]
- Lister, P. D.; Wolter, D. J.; Hanson, N. D. Antibacterial-resistant Pseudomonas aeruginosa: clinical impact and complex regulation of chromosomally encoded resistance mechanisms. Clinical microbiology reviews 2009, 22(4), 582–610. [Google Scholar] [CrossRef]
- Littler, N.; Mullen, M.; Beckett, H.; Freshney, A.; Pinder, L. Benchmarking school nursing practice: the North West Regional Benchmarking Group. British Journal of School Nursing 2016, 11(3), 131–134. [Google Scholar] [CrossRef]
- Lyu, Y. L.; Kerrigan, J. E.; Lin, C. P.; Azarova, A. M.; Tsai, Y. C.; Ban, Y.; Liu, L. F. Topoisomerase IIβ-mediated DNA double-strand breaks: A mechanism for doxorubicin-induced cardiotoxicity. Proceedings of the National Academy of Sciences 2023, 120(4), e2214789120. [Google Scholar] [CrossRef]
- Meder, B.; Haas, J.; Sedaghat-Hamedani, F.; Kayvanpour, E.; Frese, K.; Lai, A. ... Katus, H.A. Epigenome-wide association study identifies cardiac gene patterning and a novel class of biomarkers for heart failure. Circulation 2021, 141(7), 598–610. [Google Scholar] [CrossRef]
- Octavia, Y.; Tocchetti, C. G.; Gabrielson, K. L.; Janssens, S.; Crijns, H. J.; Moens, A. L. Doxorubicin-induced cardiomyopathy: From molecular mechanisms to therapeutic strategies. Journal of Molecular and Cellular Cardiology 2012, 52(6), 1213–1225. [Google Scholar] [CrossRef] [PubMed]
- Pang, L.; Cai, Y.; Tang, E. H. C.; Irwin, M. G. Metformin protects against doxorubicin-induced cardiotoxicity through AMPK-dependent pathways. Cardiovascular Research 2020, 116(3), 655–666. [Google Scholar] [CrossRef]
- Papait, R.; Serio, S.; Pagiatakis, C.; Rusconi, F.; Condorelli, G. Histone and DNA methylation in cardiac development, homeostasis, and disease. Trends in Genetics 2020, 36(5), 324–336. [Google Scholar] [CrossRef]
- Pépin, J. L.; Eastwood, P.; Eckert, D. J. Novel avenues to approach non-CPAP therapy and implement comprehensive obstructive sleep apnoea care. European Respiratory Journal 2022, 59(6). [Google Scholar] [CrossRef]
- Pernicova, I.; Korbonits, M. Metformin—Mode of action and clinical implications for diabetes and cancer. Nature Reviews Endocrinology 2014, 10(3), 143–156. [Google Scholar] [CrossRef]
- Swain, S. M.; Whaley, F. S.; Ewer, M. S. Congestive heart failure in patients treated with doxorubicin. Cancer 2003, 97(11), 2869–2879. [Google Scholar] [CrossRef]
- Viollet, B.; Guigas, B.; Sanz García, N.; Leclerc, J.; Foretz, M.; Andreelli, F. Cellular and molecular mechanisms of metformin: An overview. Clinical Science 2012, 122(6), 253–270. [Google Scholar] [CrossRef]
- Wallace, K. B.; Sardão, V. A.; Oliveira, P. J. Mitochondrial determinants of doxorubicin-induced cardiomyopathy. Circulation Research 2020, 126(7), 926–941. [Google Scholar] [CrossRef]
- Yang, X.; Wang, Y.; Li, J.; Wang, H. Metformin regulates DNMT expression and DNA methylation in oxidative stress–induced cardiac injury. Epigenomics 2023, 15(9), 745–760. [Google Scholar] [CrossRef]
- Zhang, S.; Liu, X.; Bawa-Khalfe, T.; Lu, L. S.; Lyu, Y. L.; Liu, L. F.; Yeh, E. T. H. Molecular basis of doxorubicin-induced cardiotoxicity. Nature Medicine 2021, 18(11), 1639–1642. [Google Scholar] [CrossRef]
- Zhong, T.; Men, Y.; Lu, L.; Geng, T.; Zhou, J.; Mitsuhashi, A.; Zhao, Y. Metformin alters DNA methylation and chromatin accessibility in metabolic and cancer-related pathways. Clinical Epigenetics 2022, 14, 68. [Google Scholar] [CrossRef]
- Zhou, G.; Myers, R.; Li, Y.; Chen, Y.; Shen, X.; Fenyk-Melody, J.; Moller, D. E. Role of AMP-activated protein kinase in the mechanism of metformin action. Journal of Clinical Investigation 2021, 131(1), e142196. [Google Scholar] [CrossRef]
- Zhou, G.; Myers, R.; Li, Y.; Chen, Y.; Shen, X.; Fenyk-Melody, J.; Wu, M.; Ventre, J.; Doebber, T.; Fujii, N.; Musi, N.; Hirshman, M. F.; Goodyear, L. J.; Moller, D. E. Role of AMP-activated protein kinase in mechanism of metformin action. Journal of Clinical Investigation 2001, 108(8), 1167–1174. [Google Scholar] [CrossRef]
- Minotti, G.; Menna, P.; Salvatorelli, E.; Cairo, G.; Gianni, L. Anthracyclines: Molecular advances and pharmacologic developments in antitumor activity and cardiotoxicity. Pharmacological Reviews 2004, 56(2), 185–229. [Google Scholar] [CrossRef]
- Lister, R.; Pelizzola, M.; Dowen, R.H.; Hawkins, R.D.; Hon, G.; Tonti-Filippini, J.; Ecker, J.R. Human DNA methylomes at base resolution show widespread epigenomic differences. Nature 2009, 462, 315–322. [Google Scholar] [CrossRef]
Figure 2.
Principal component analysis (PCA) of genome-wide DNA methylation profiles in control, low-dose-MET-treated, and high-dose-MET–treated H9c2 cells.
Figure 2.
Principal component analysis (PCA) of genome-wide DNA methylation profiles in control, low-dose-MET-treated, and high-dose-MET–treated H9c2 cells.
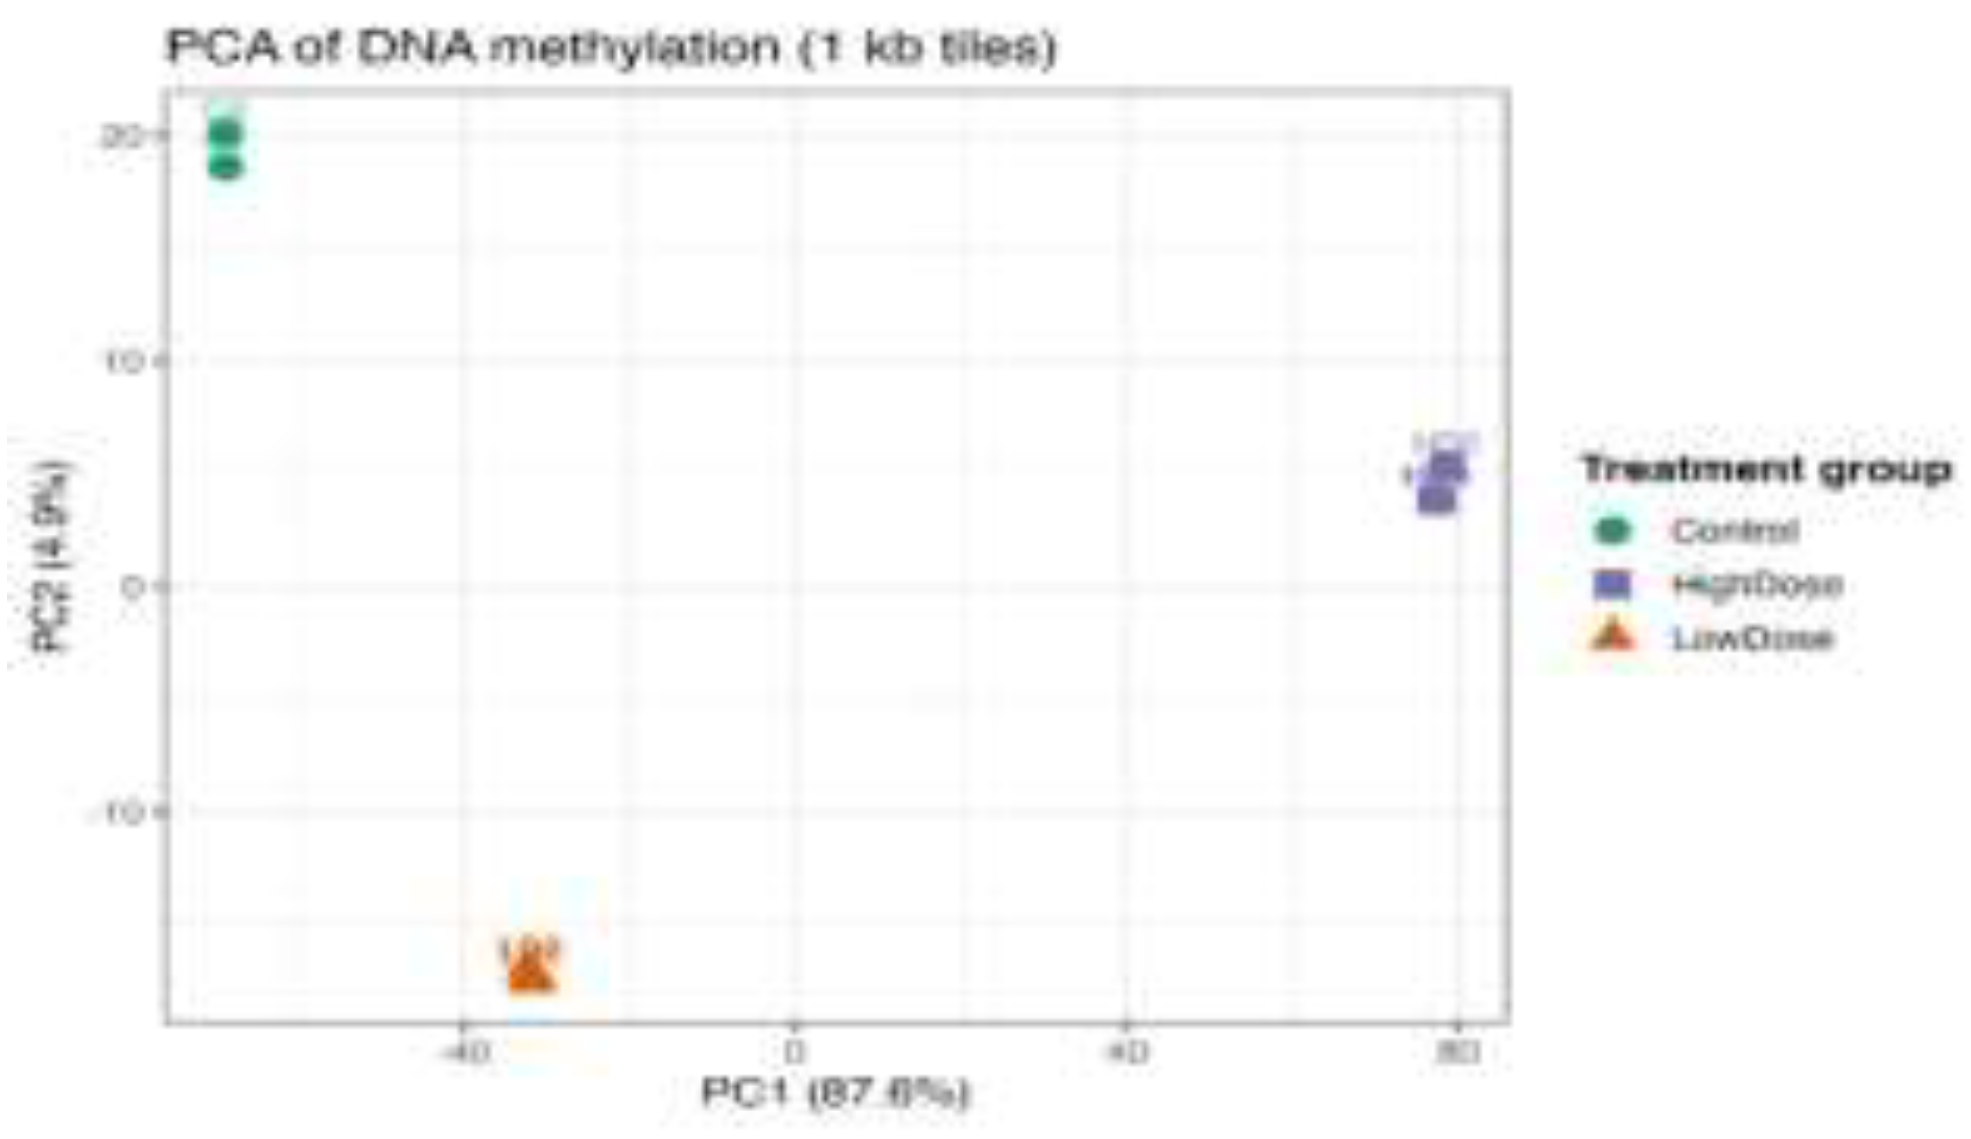
Figure 3.
Effect of metformin on doxorubicin-induced cytotoxicity in H9c2 cells.
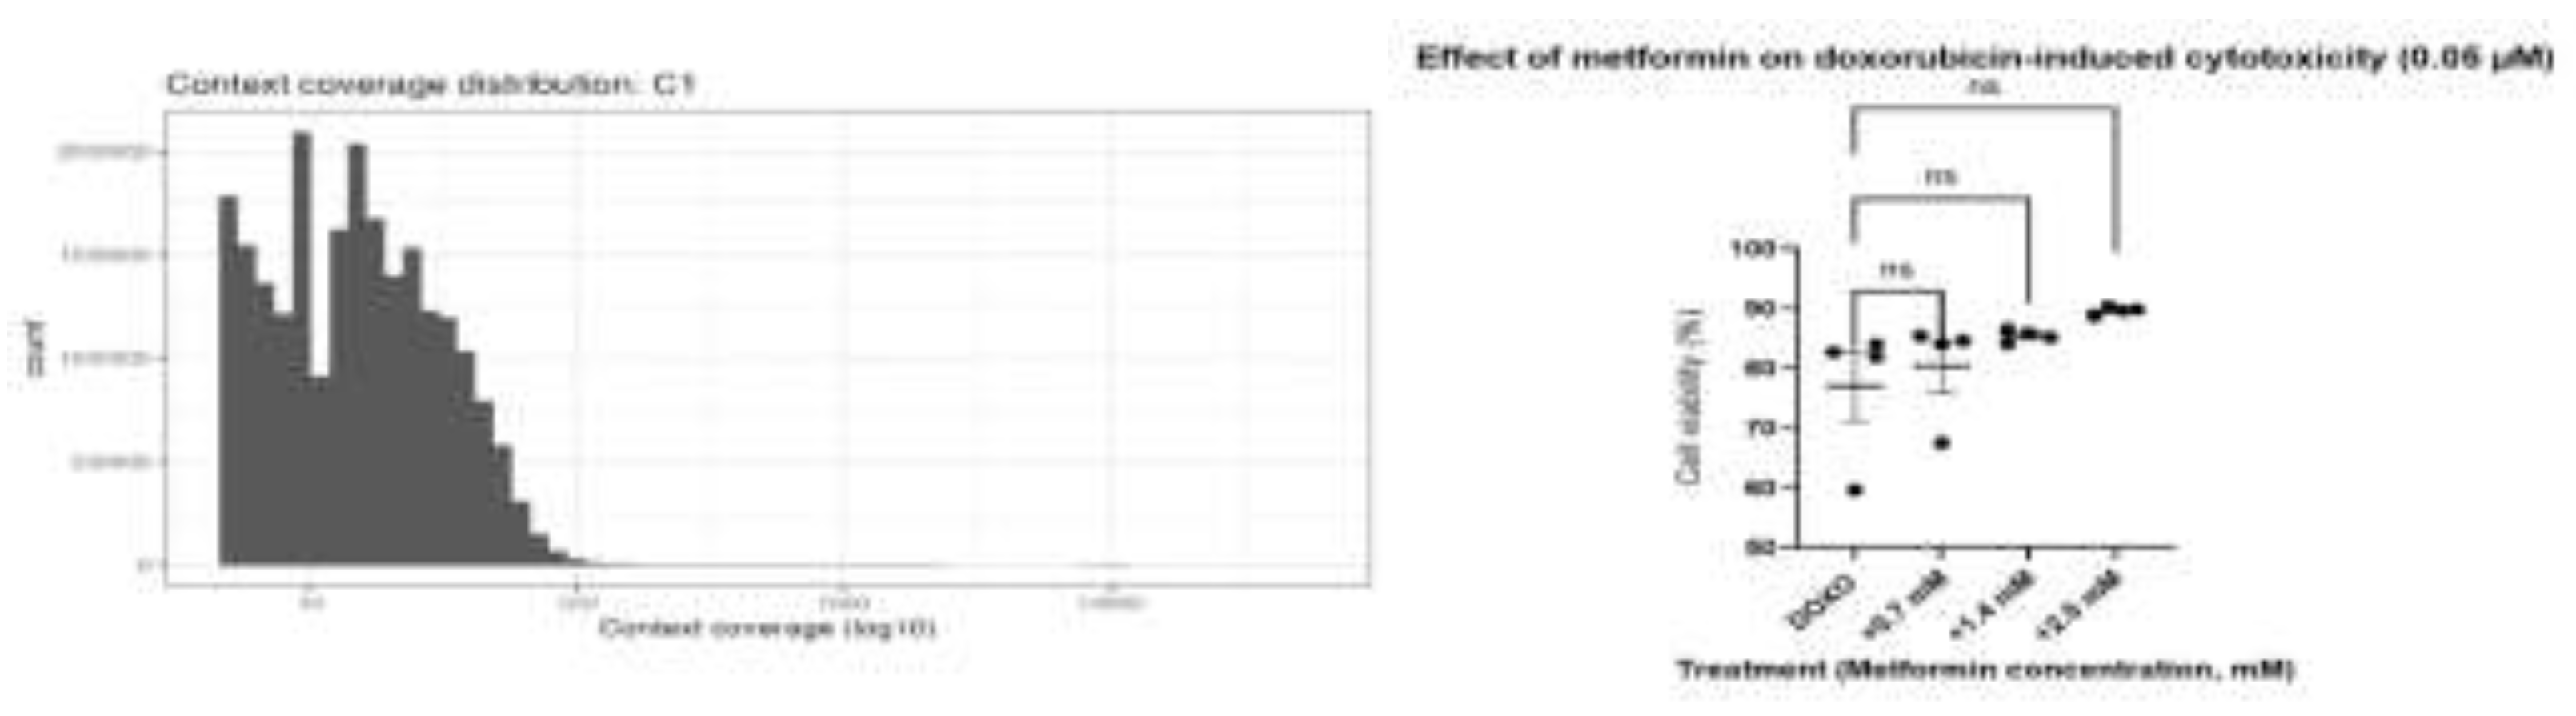
Figure 6.
Hierarchical clustering heatmap of genome-wide DNA methylation profiles in control, low-dose, and high-dose metformin-treated H9c2 cells.
Figure 6.
Hierarchical clustering heatmap of genome-wide DNA methylation profiles in control, low-dose, and high-dose metformin-treated H9c2 cells.
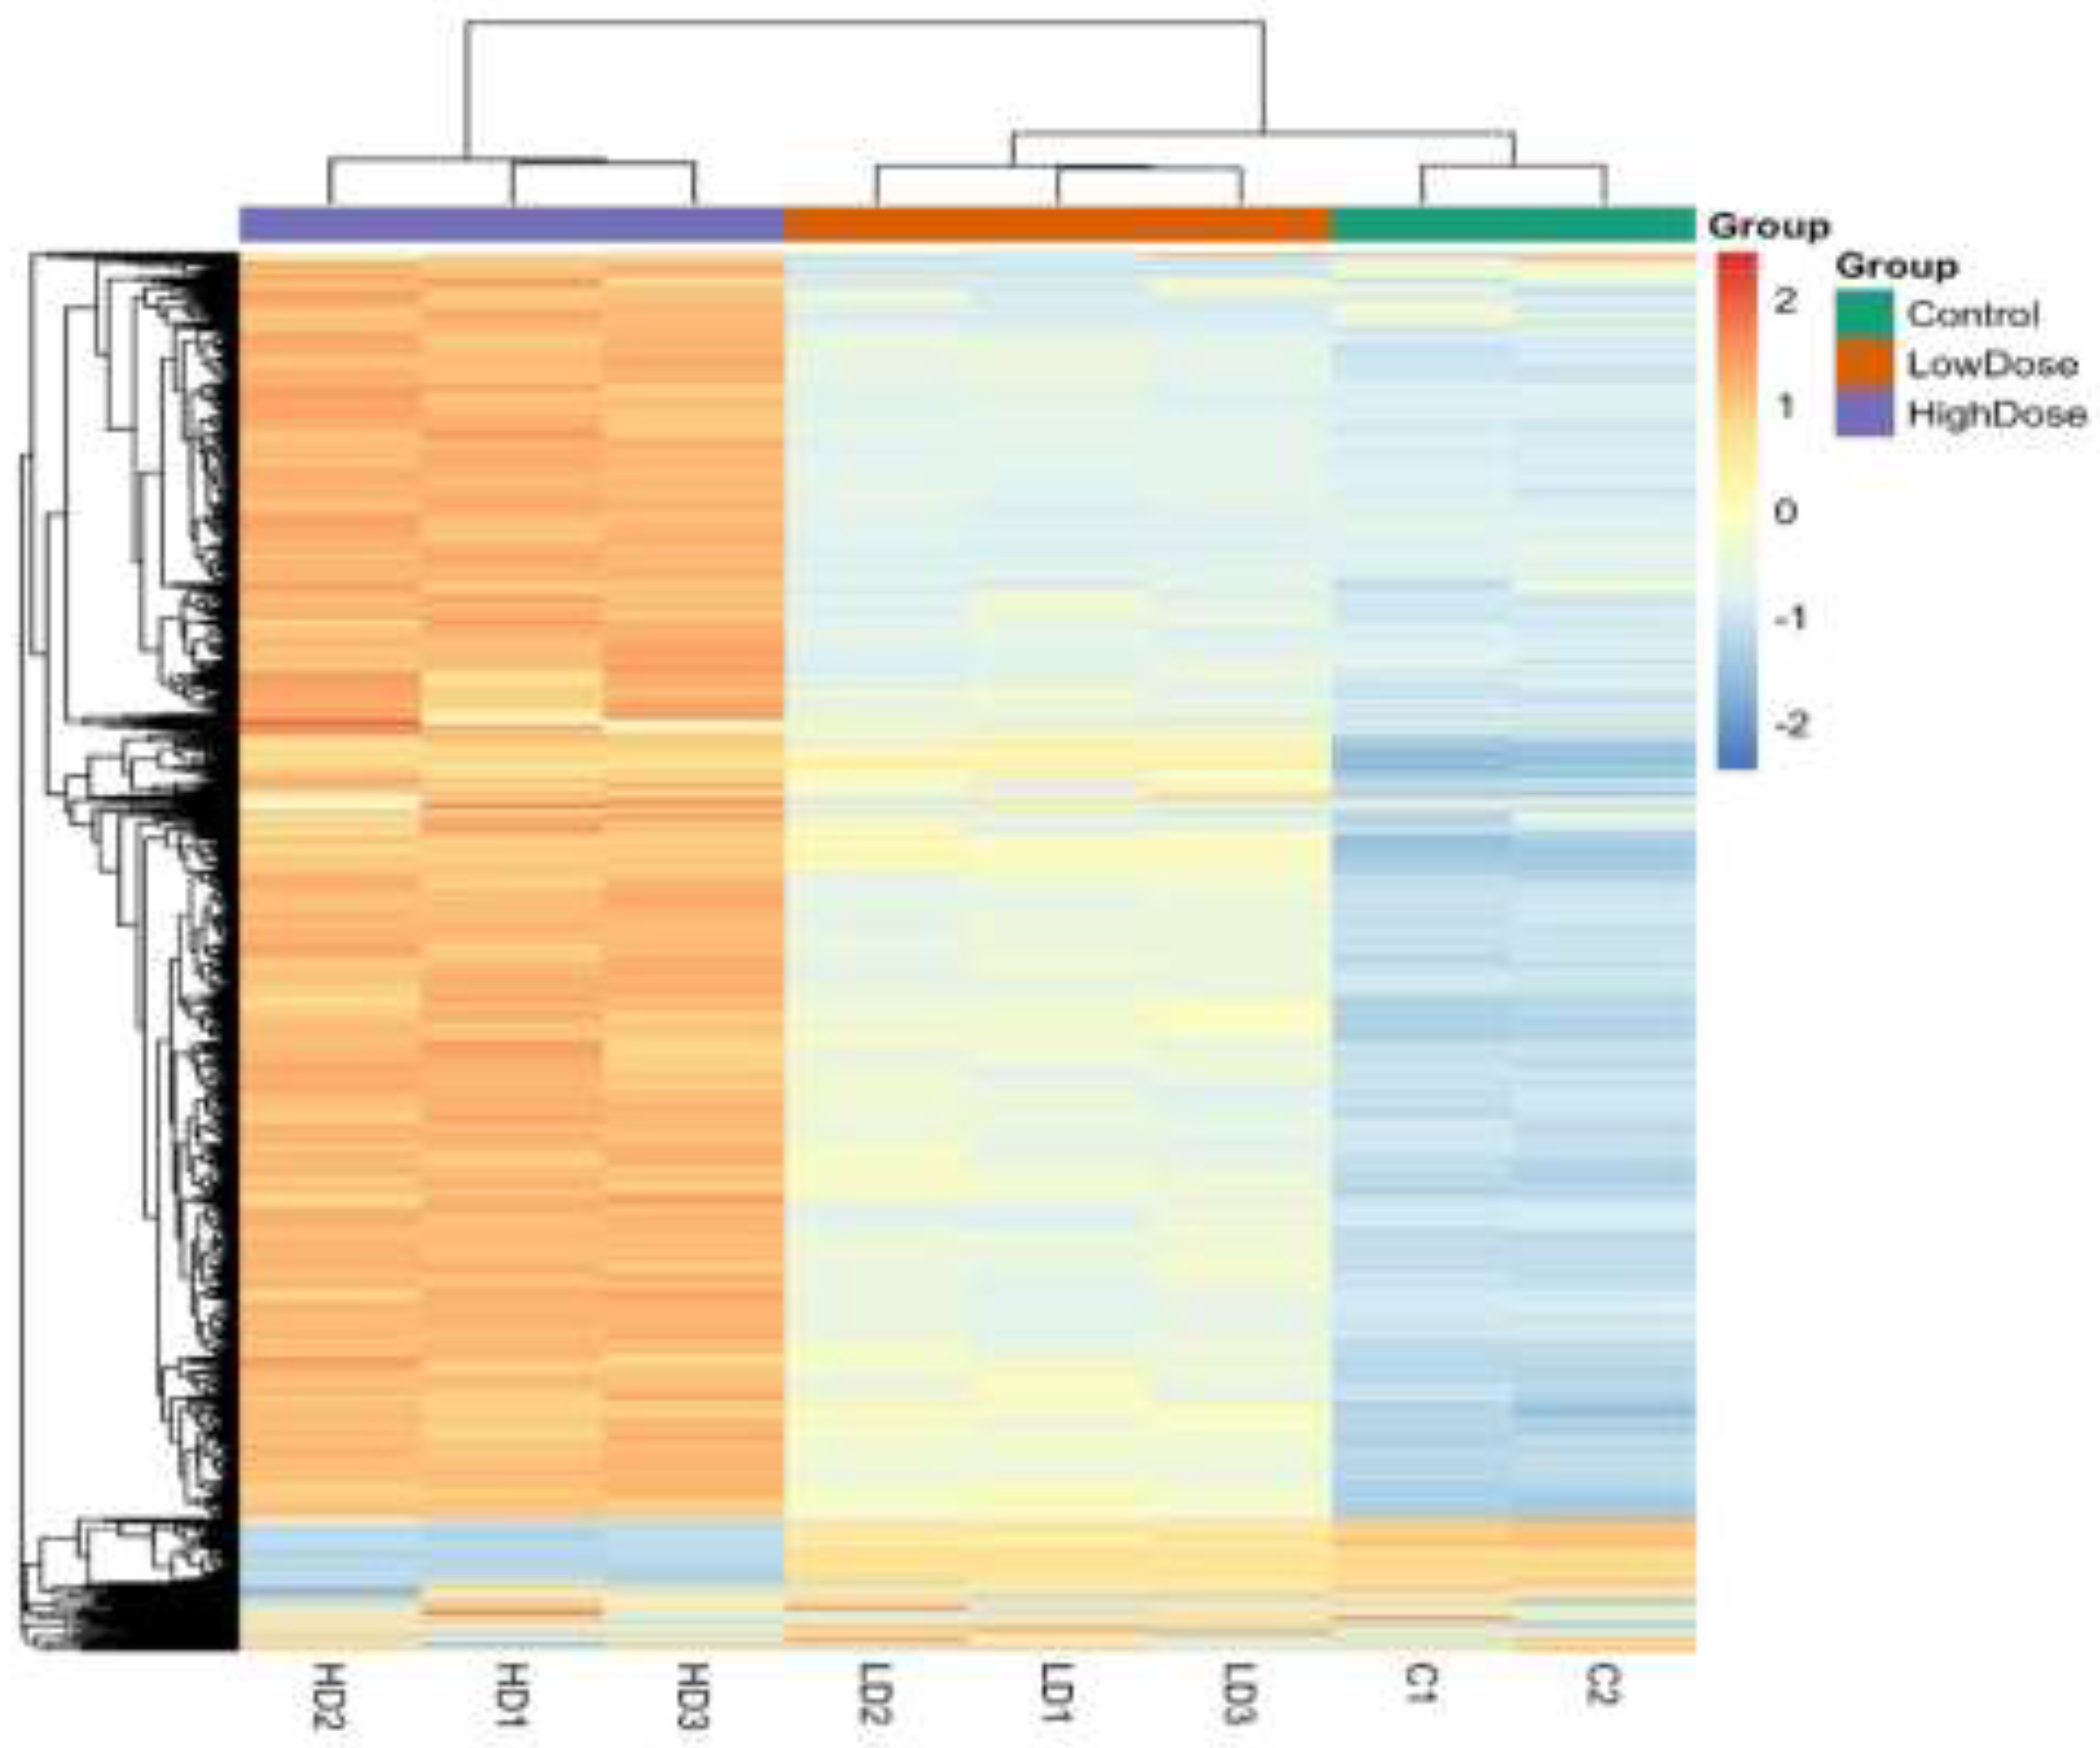
Figure 10.
Thermogenesis and mitochondrial energy metabolism as downstream targets of metformin-mediated epigenetic cardioprotection (low dose). Pathway enrichment analysis was performed using DAVID [13].
Figure 10.
Thermogenesis and mitochondrial energy metabolism as downstream targets of metformin-mediated epigenetic cardioprotection (low dose). Pathway enrichment analysis was performed using DAVID [13].
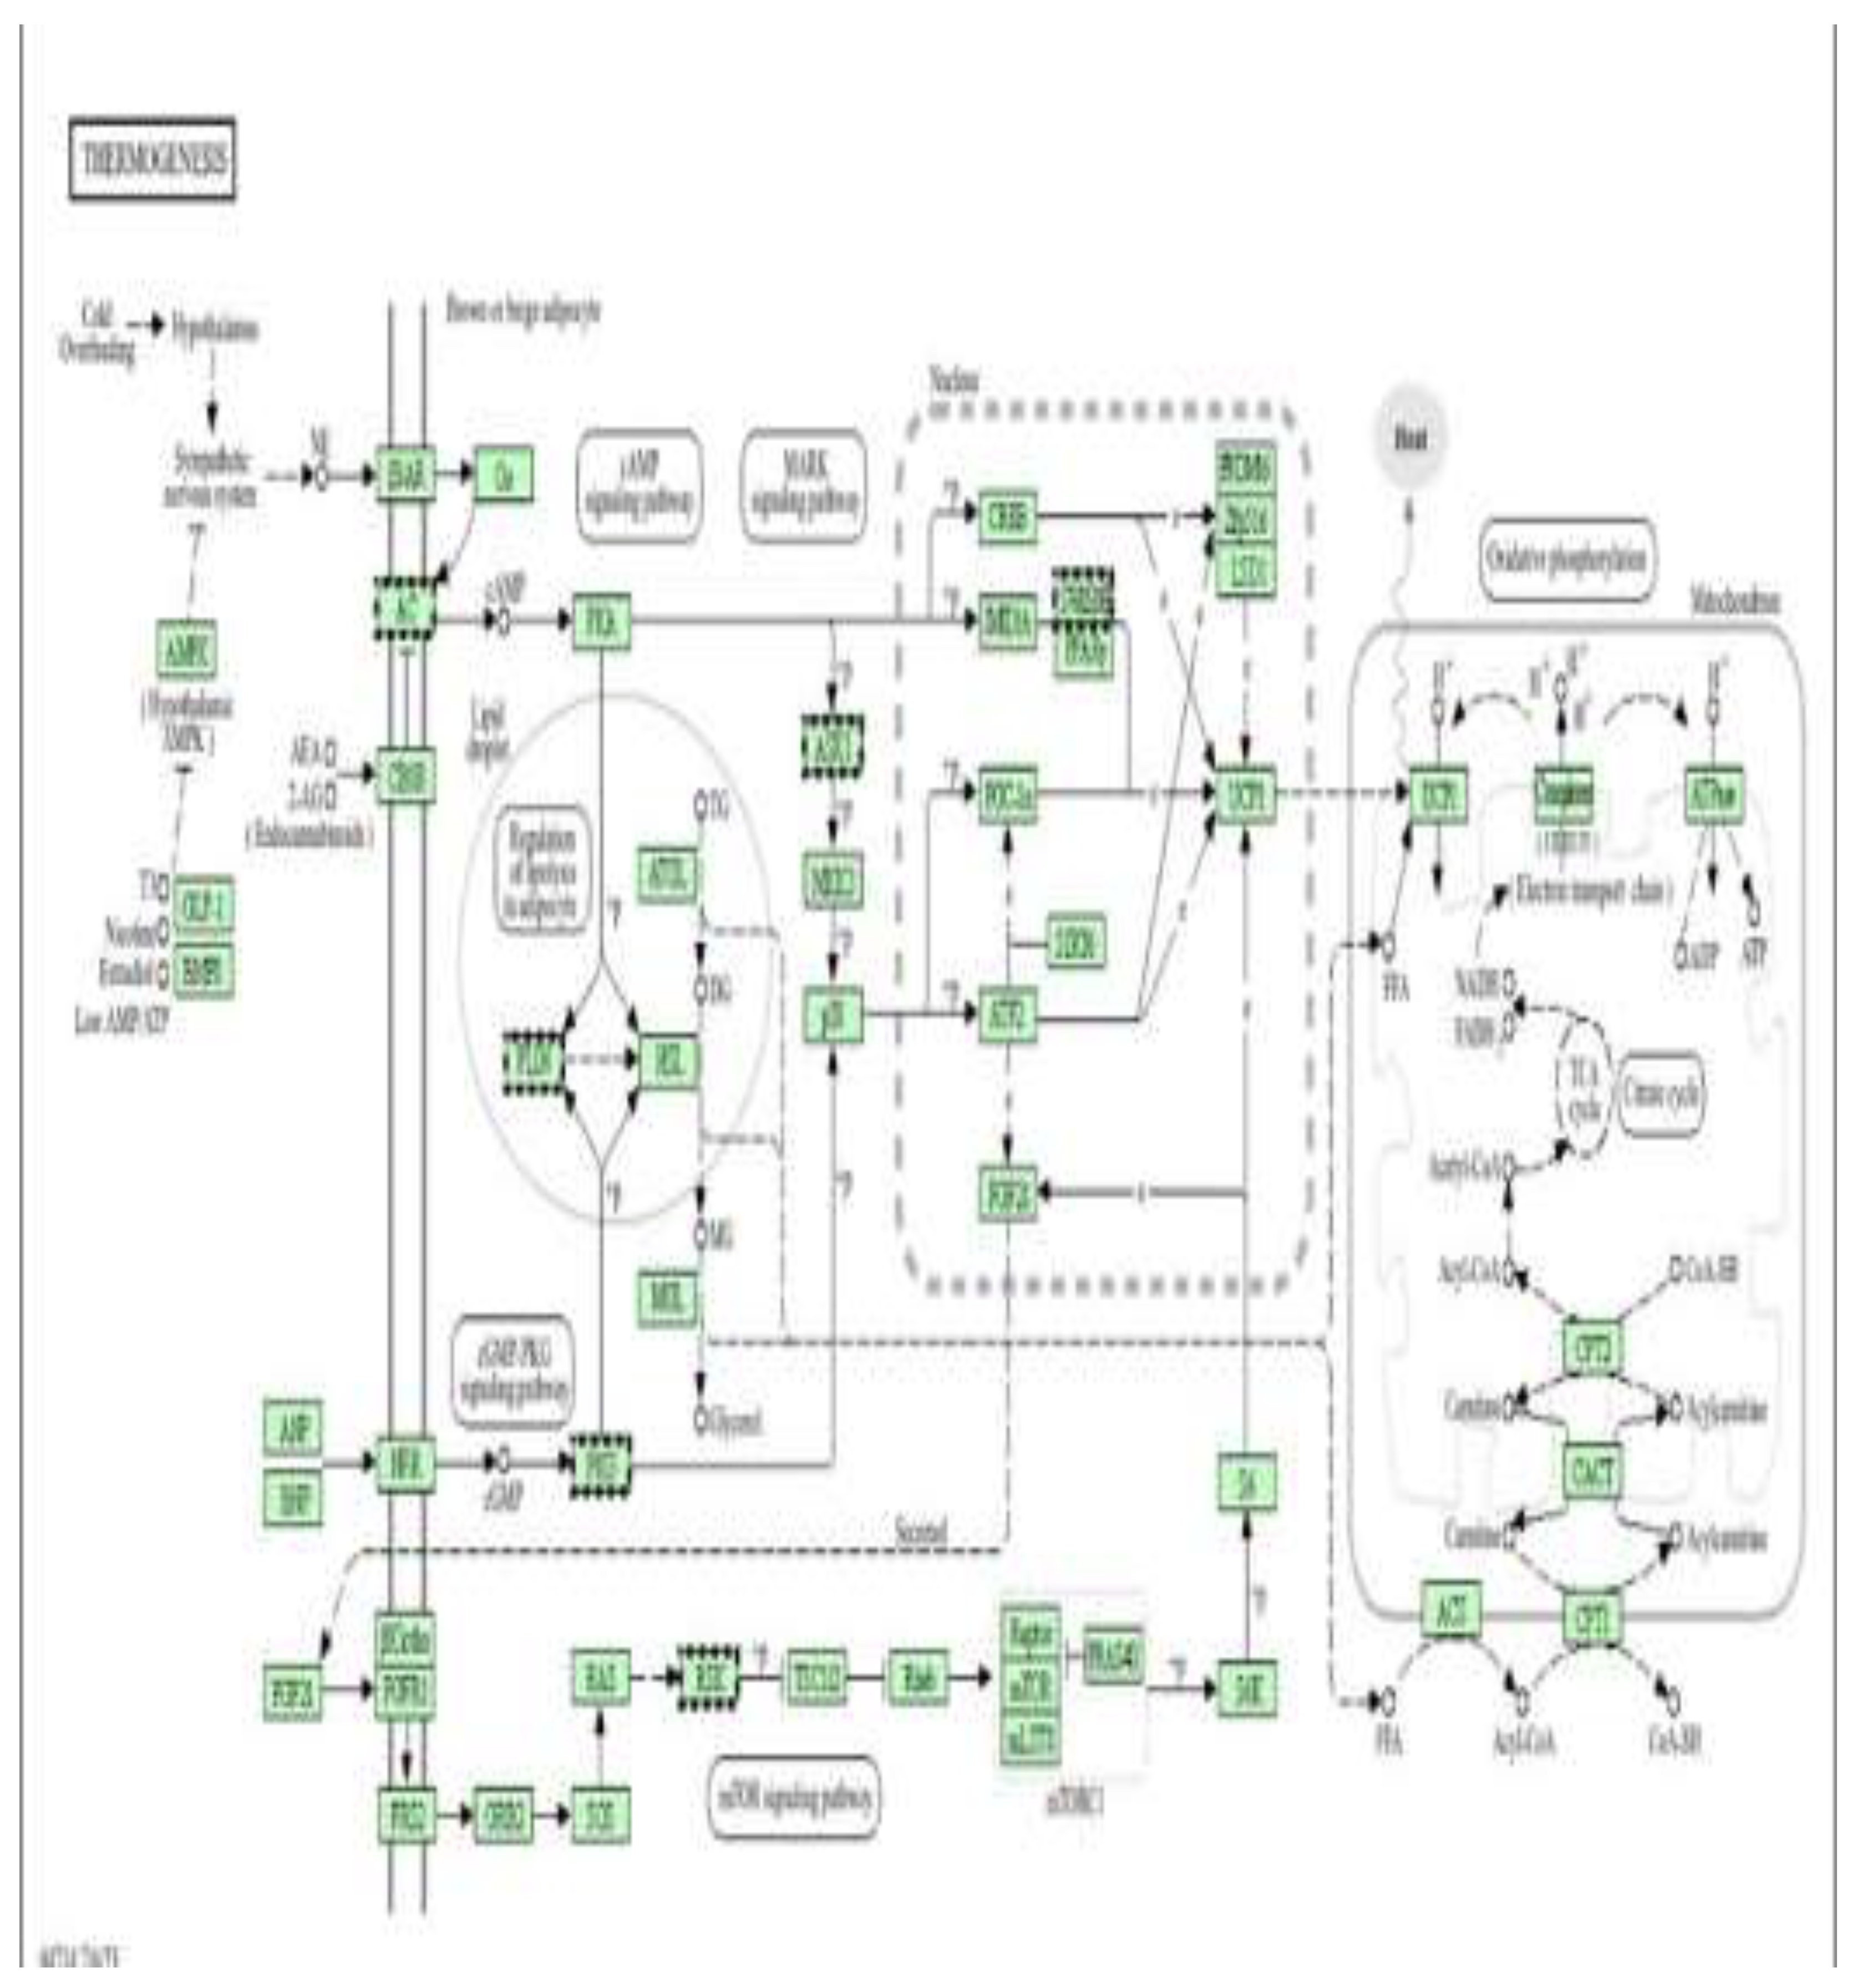
Figure 11.
ATP-dependent chromatin remodelling complexes as epigenetic mediators of metformin protection (high dose). Pathway enrichment analysis was performed using DAVID (Database for Annotation, Visualization and Integrated Discovery) [13].
Figure 11.
ATP-dependent chromatin remodelling complexes as epigenetic mediators of metformin protection (high dose). Pathway enrichment analysis was performed using DAVID (Database for Annotation, Visualization and Integrated Discovery) [13].
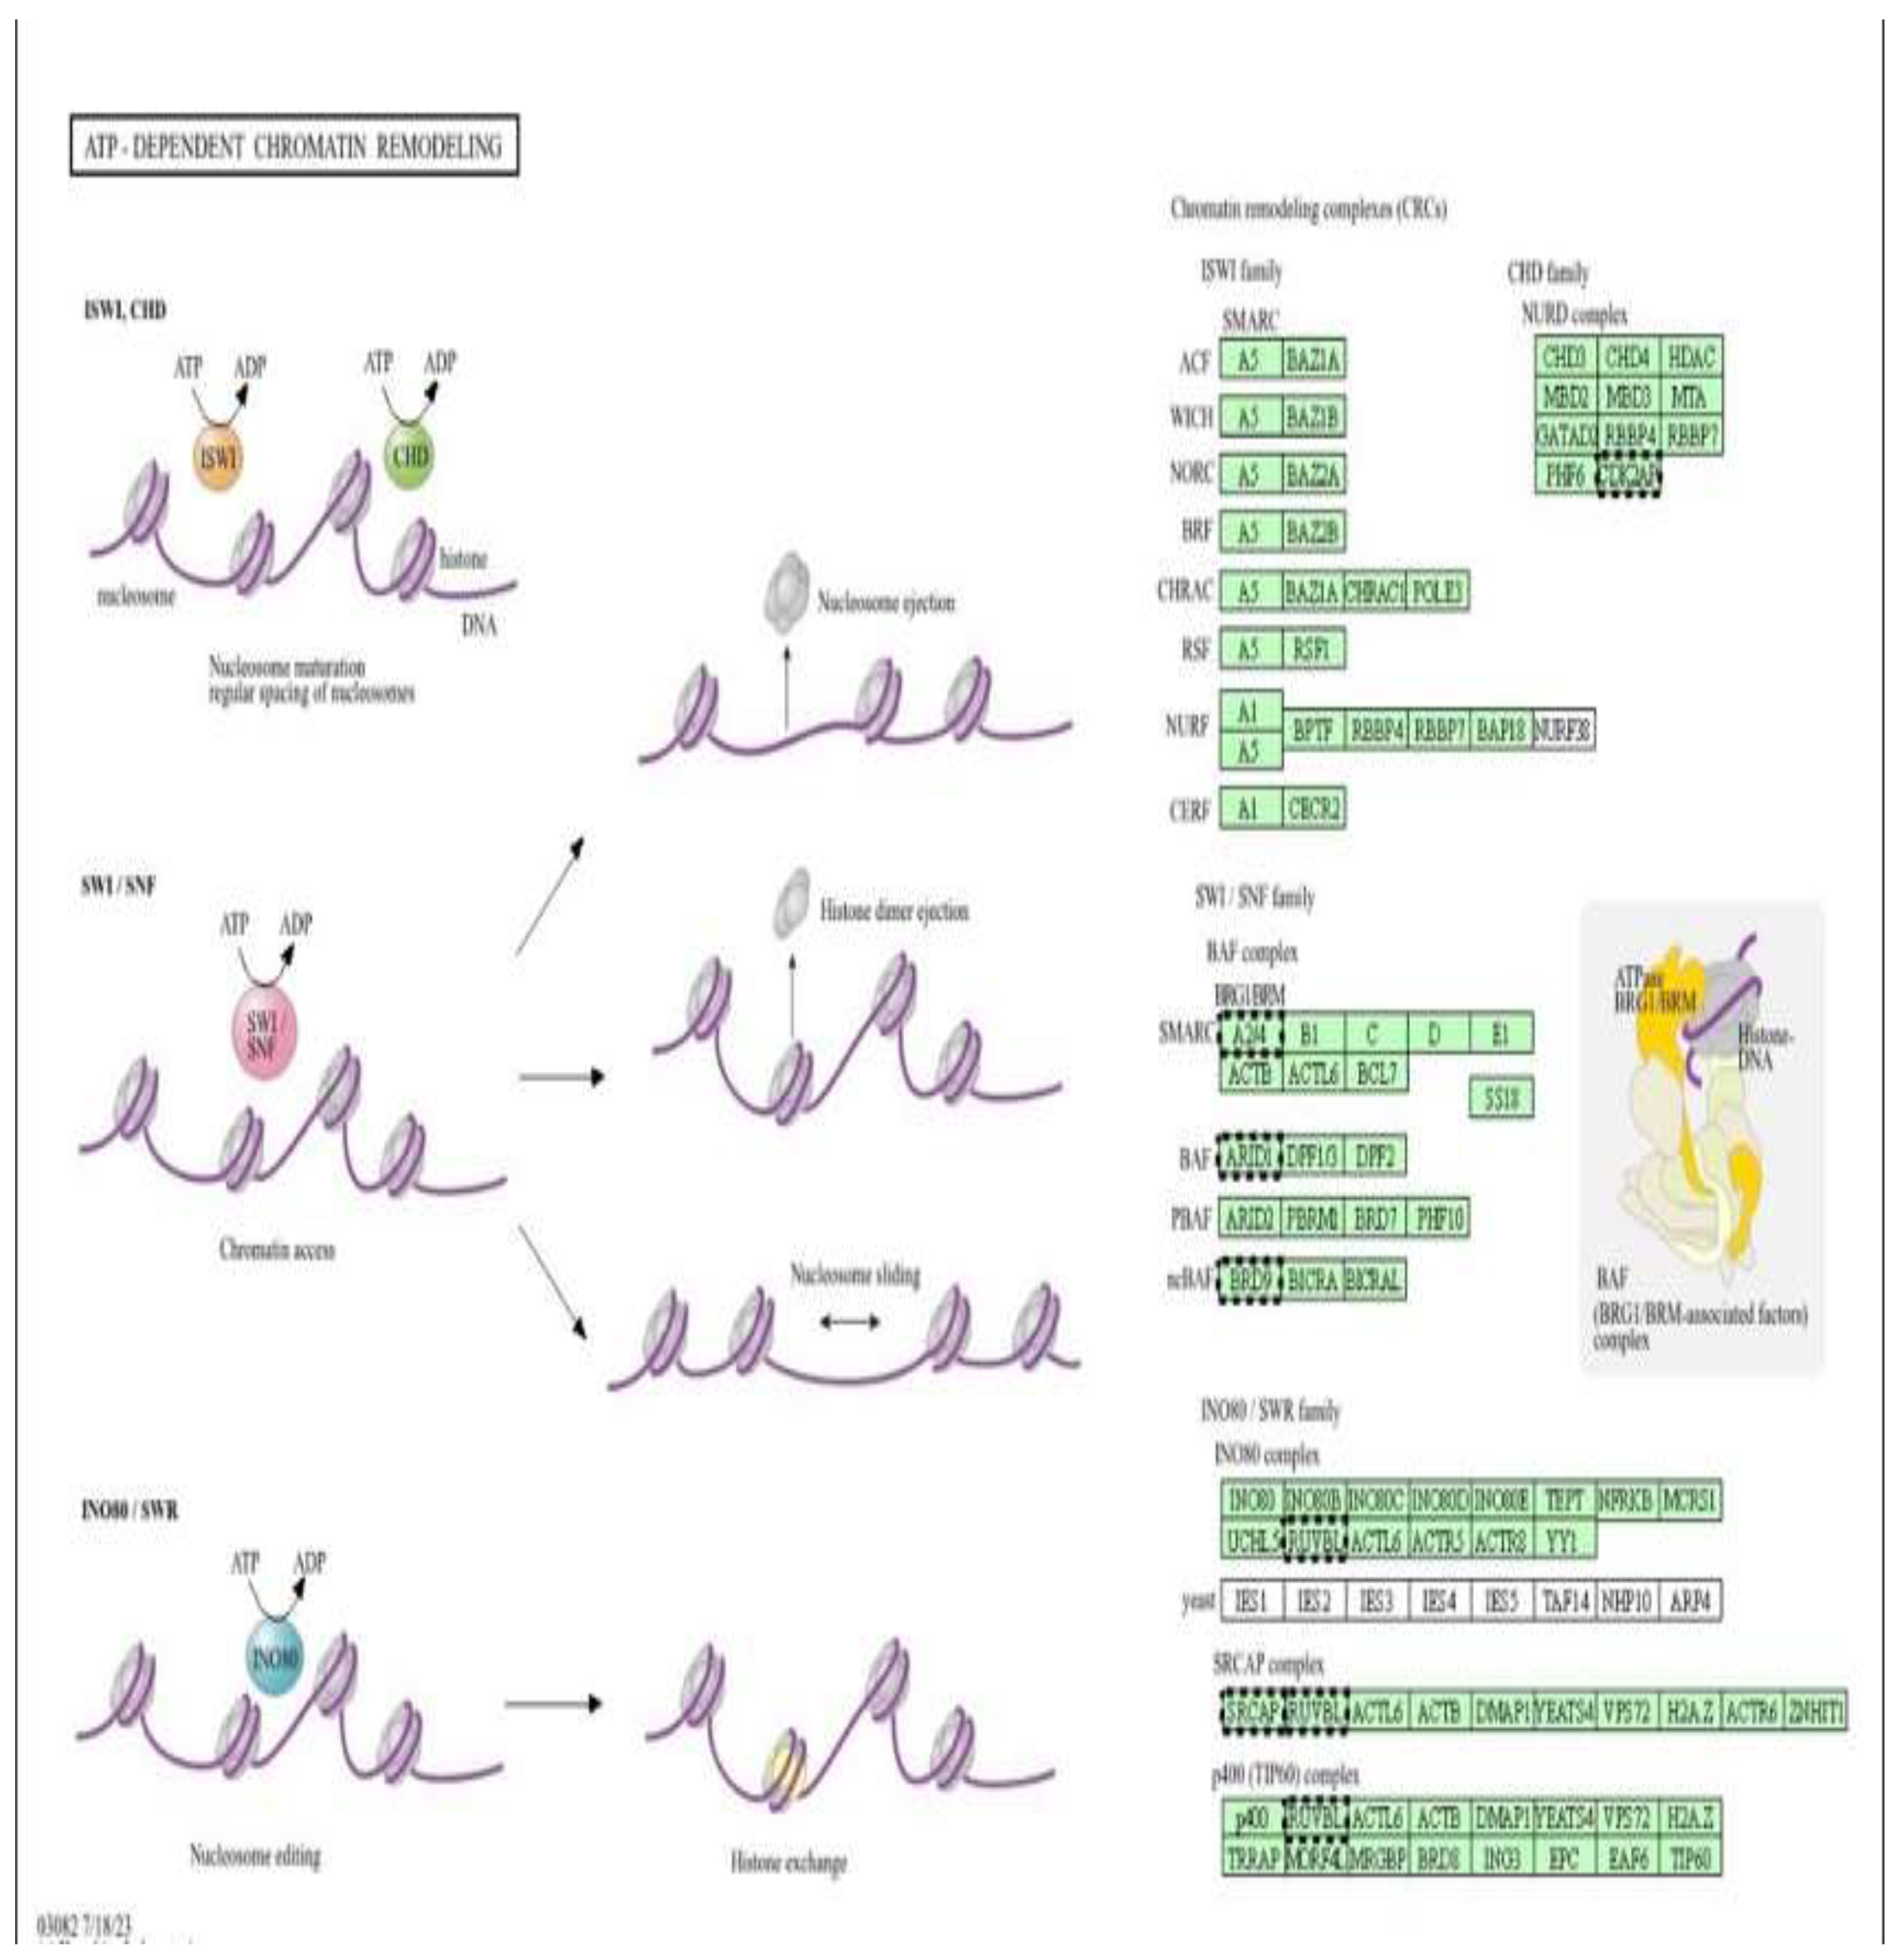
Figure 12.
Phosphatidylinositol (PI) signalling pathway as an epigenetically modulated target of metformin cardiomyoblast (high dose). Pathway enrichment analysis was performed using DAVID [13].
Figure 12.
Phosphatidylinositol (PI) signalling pathway as an epigenetically modulated target of metformin cardiomyoblast (high dose). Pathway enrichment analysis was performed using DAVID [13].
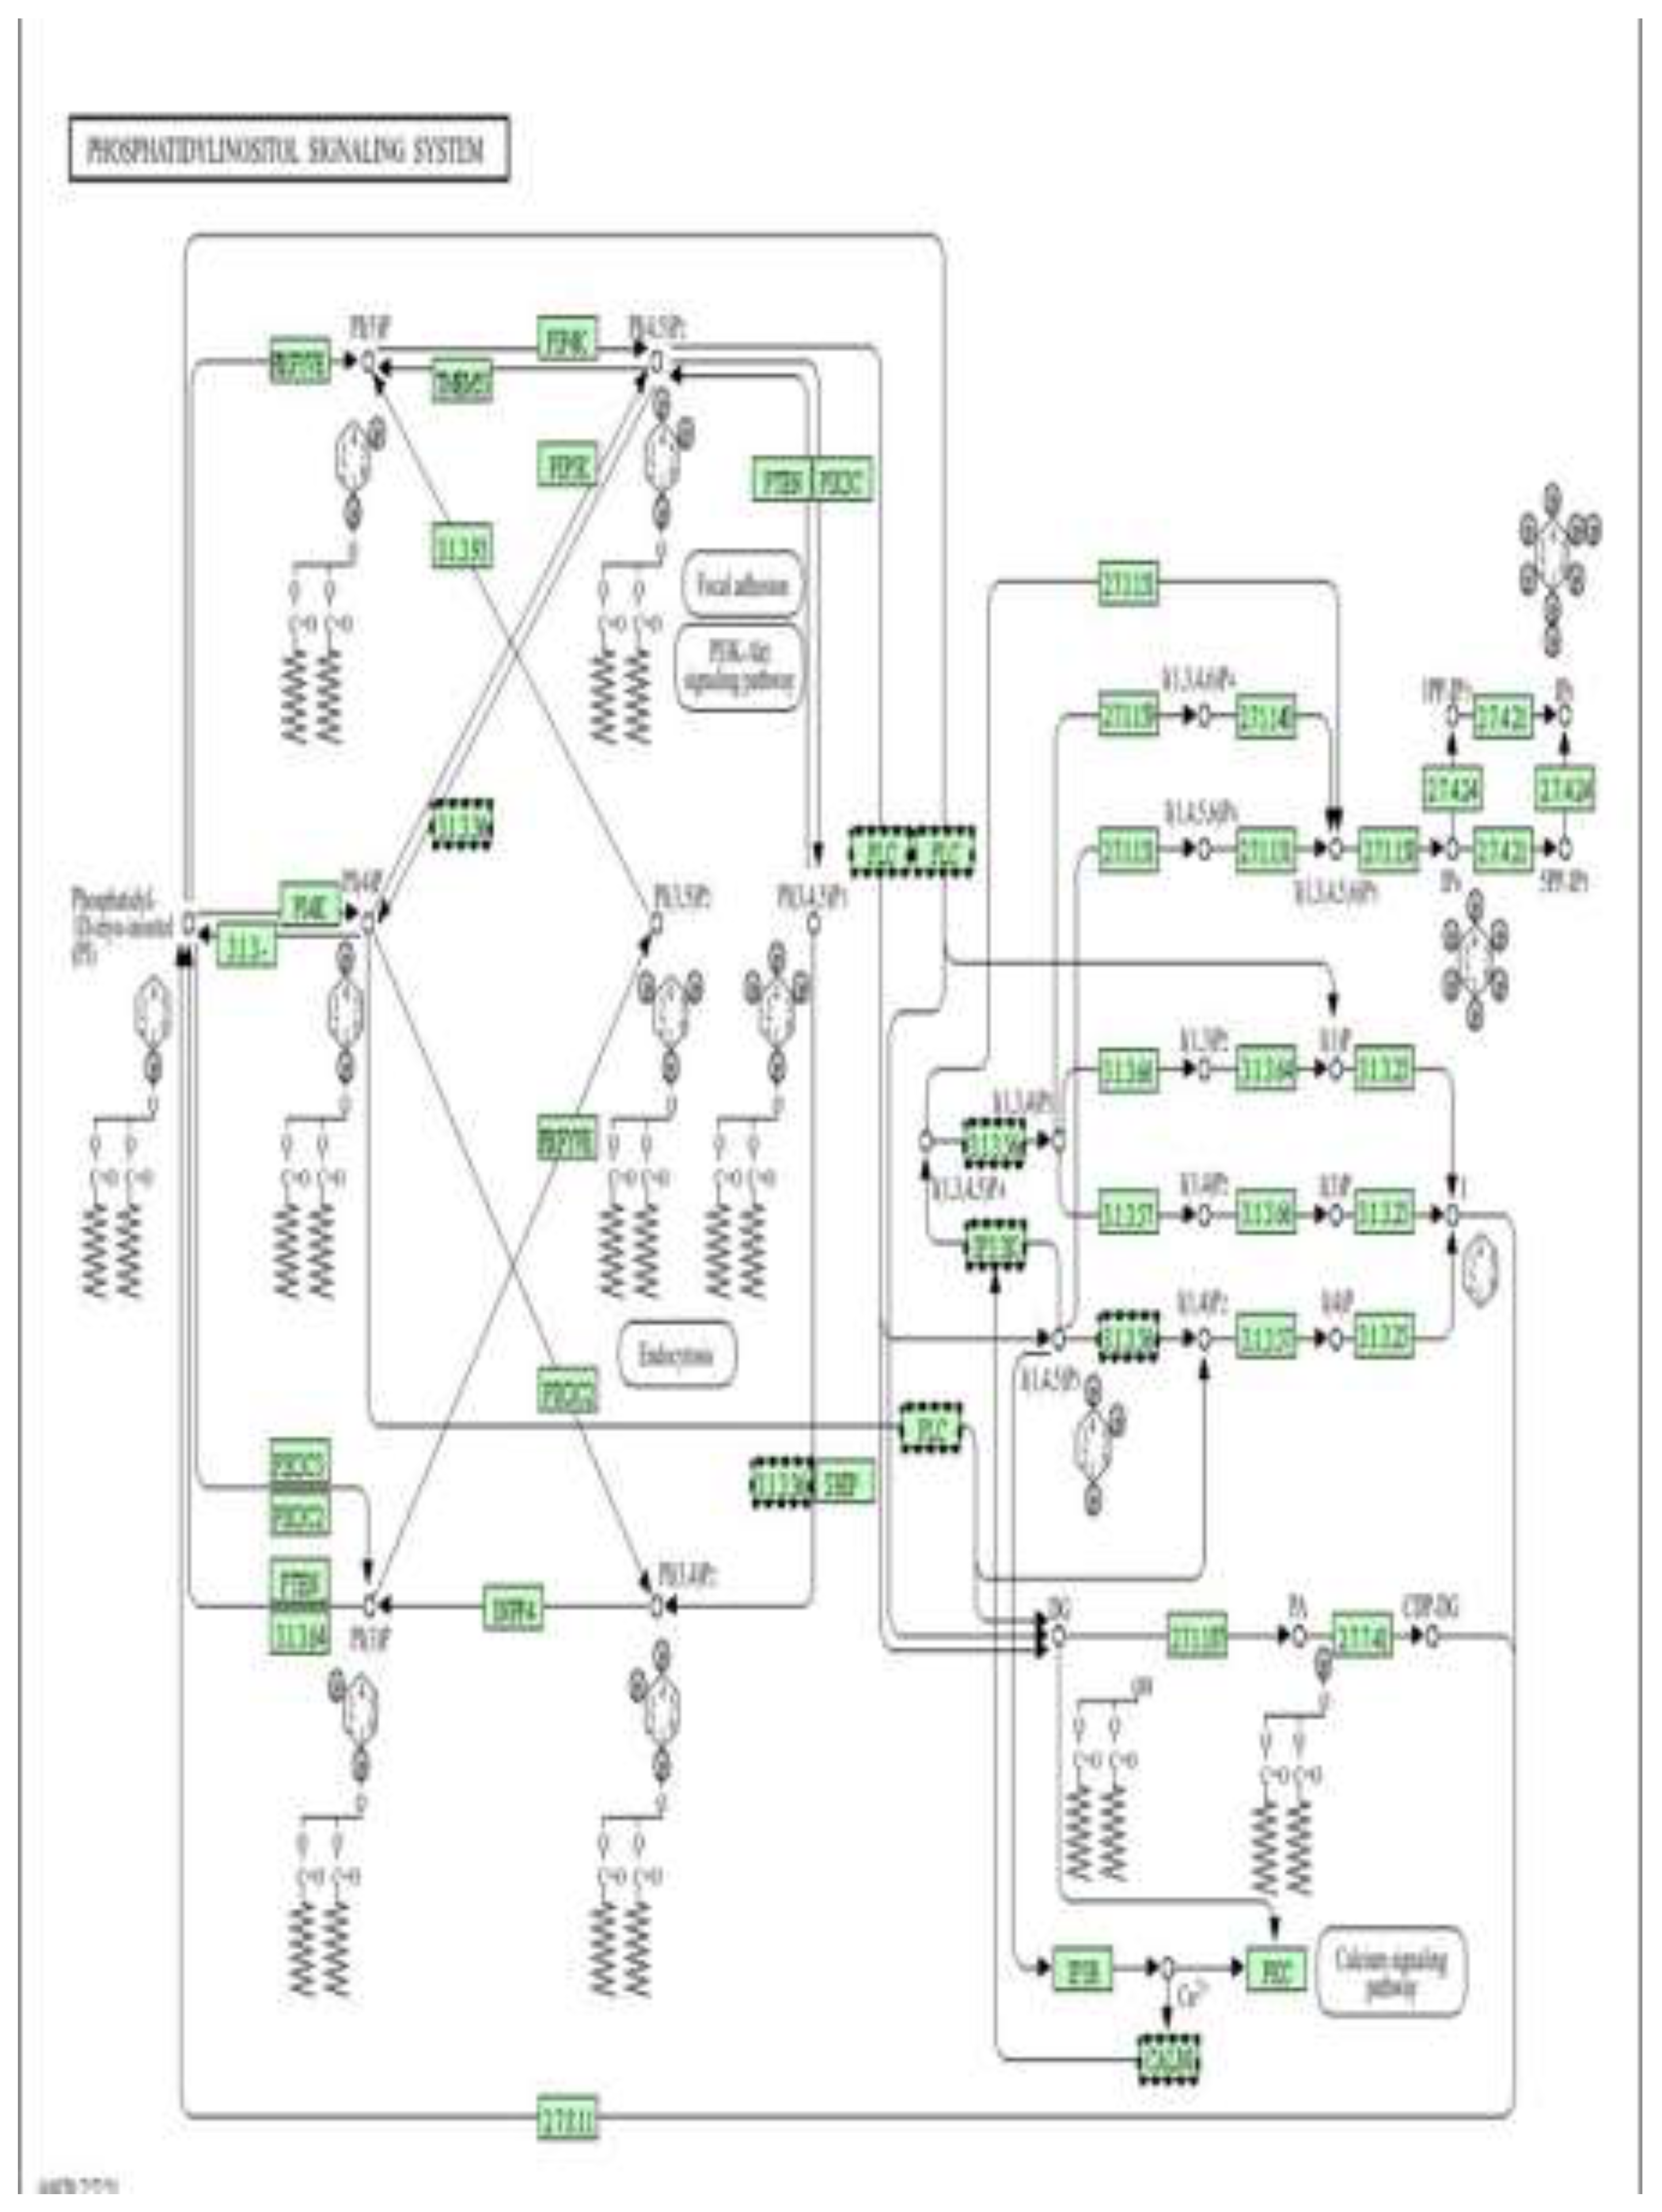
Figure 13.
Calcium signalling pathway as a mechanistic and epigenetic target of metformin (high dose). Pathway enrichment analysis was performed using DAVID [13].
Figure 13.
Calcium signalling pathway as a mechanistic and epigenetic target of metformin (high dose). Pathway enrichment analysis was performed using DAVID [13].
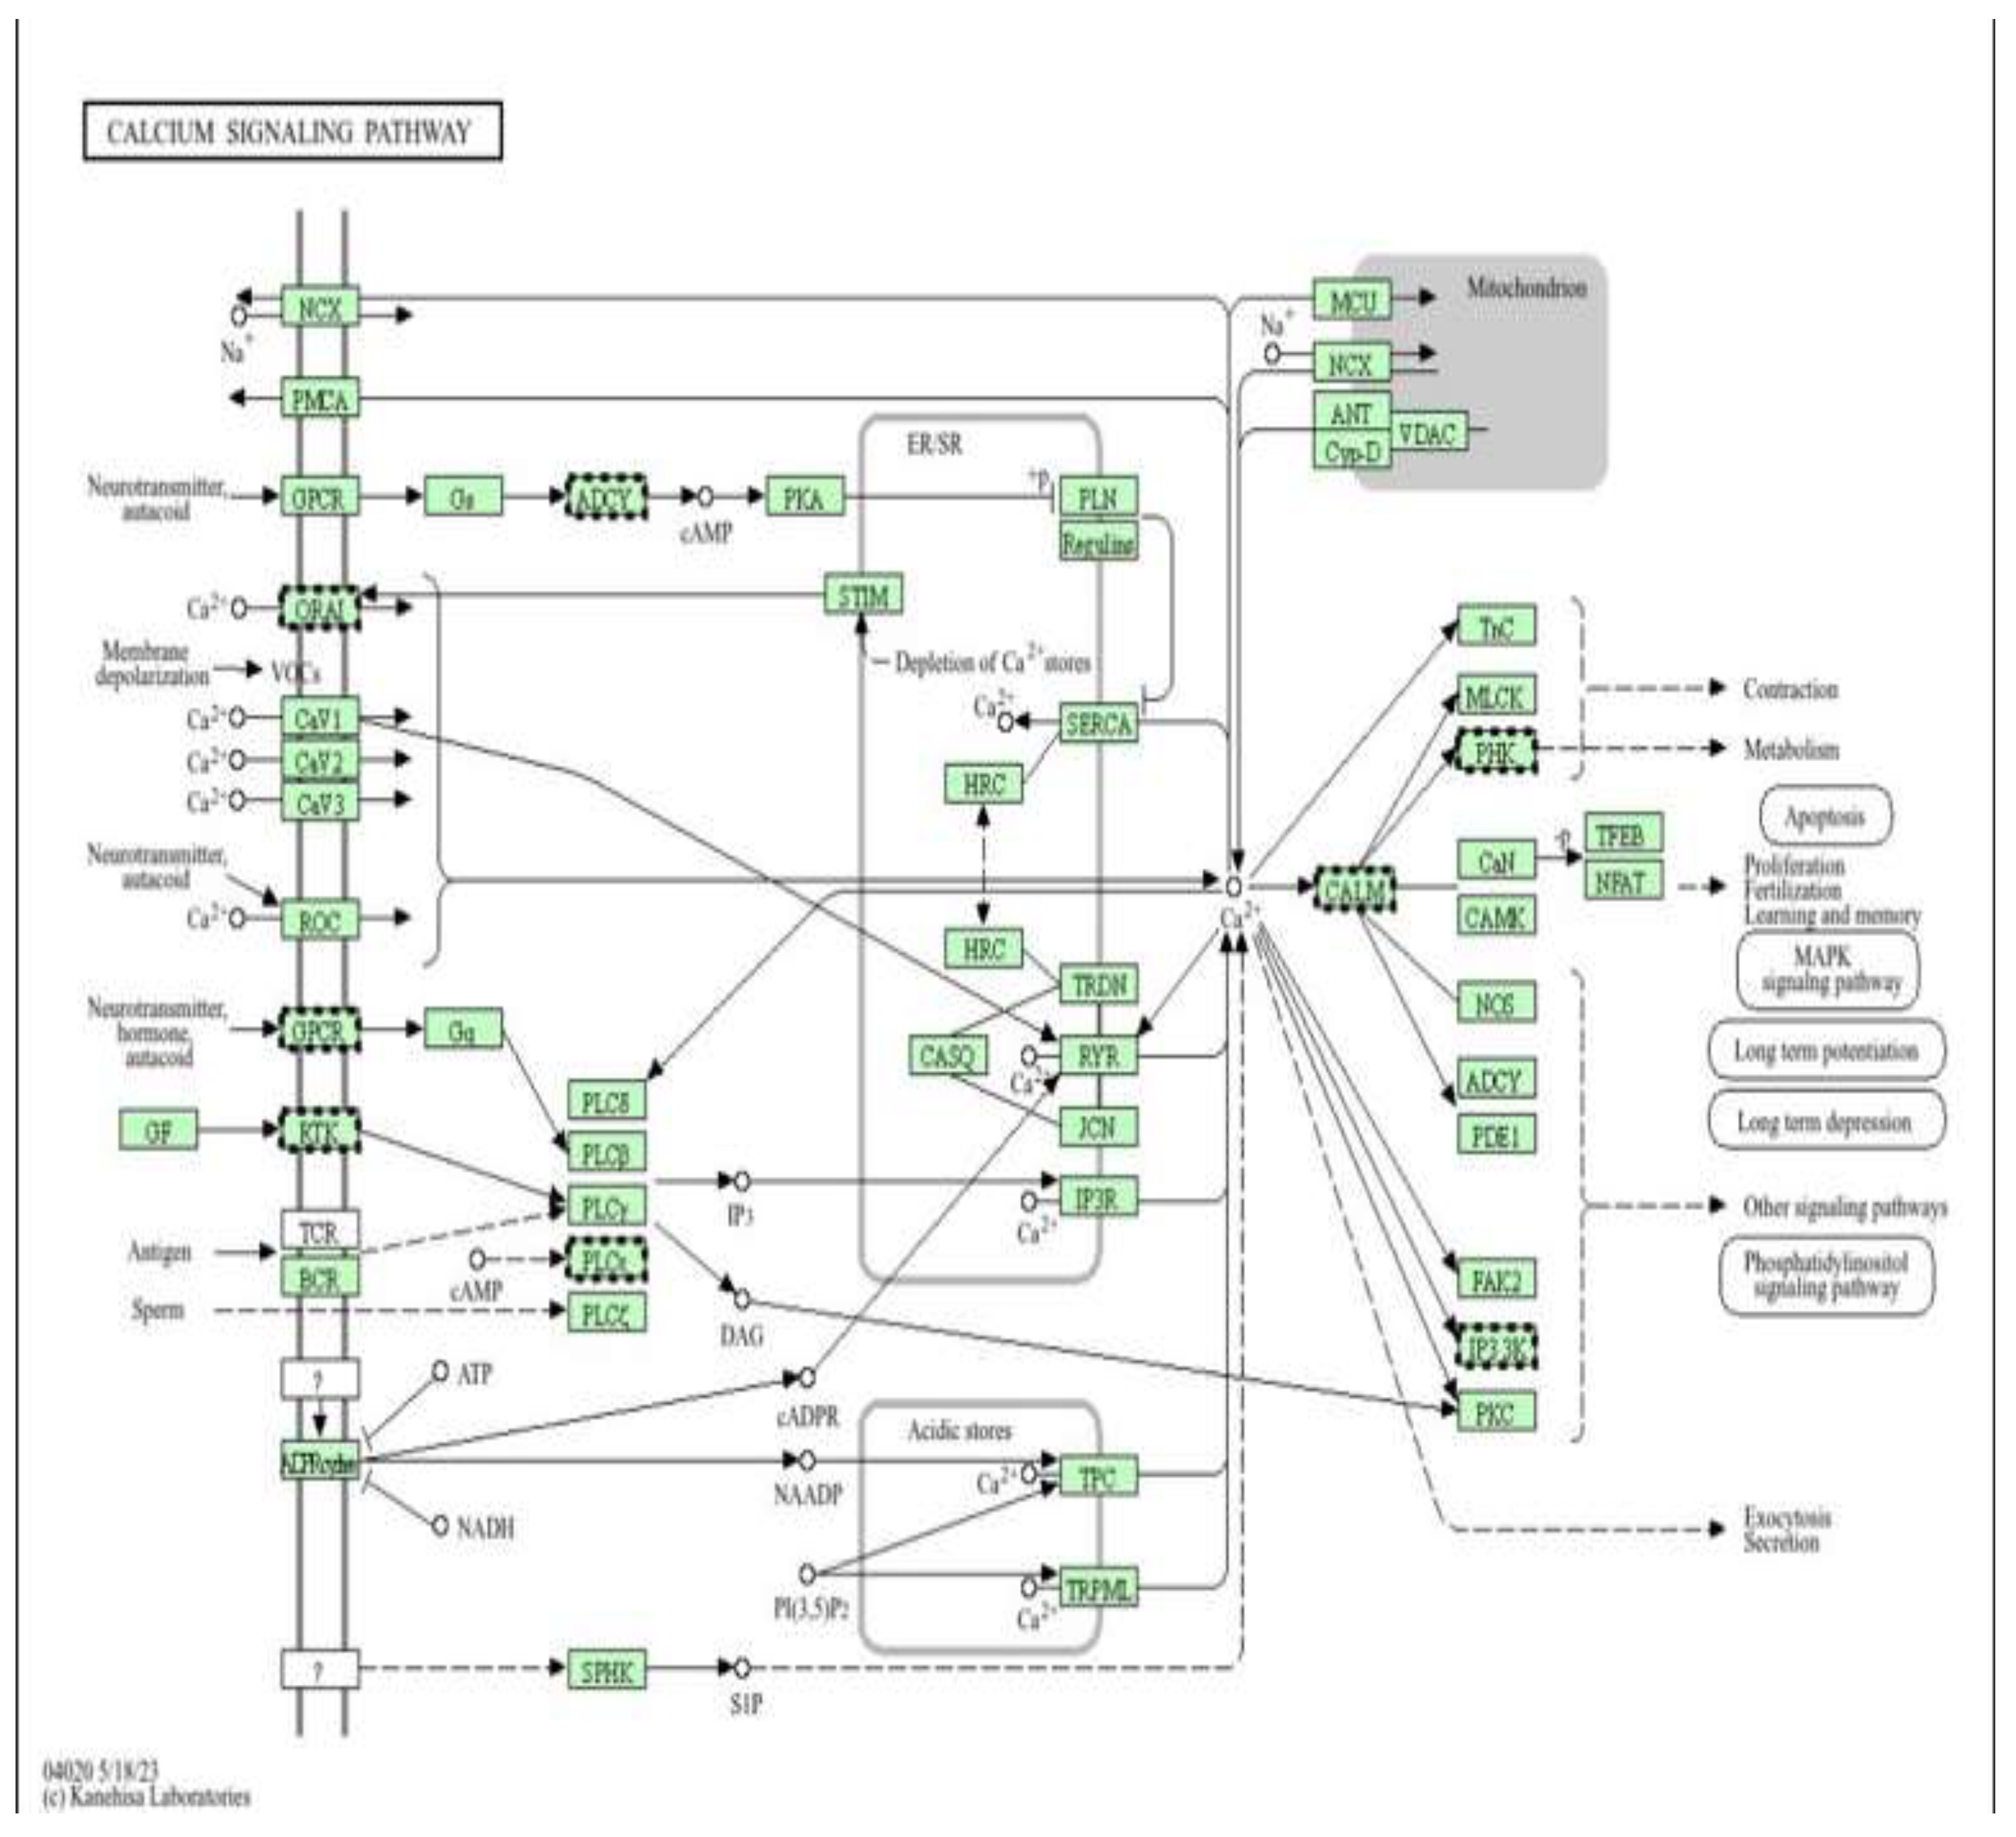
Figure 14.
Thermogenesis and mitochondrial energy metabolism as downstream pathways of metformin-mediated cardioprotection (high dose). Pathway enrichment analysis was performed using DAVID [13].
Figure 14.
Thermogenesis and mitochondrial energy metabolism as downstream pathways of metformin-mediated cardioprotection (high dose). Pathway enrichment analysis was performed using DAVID [13].
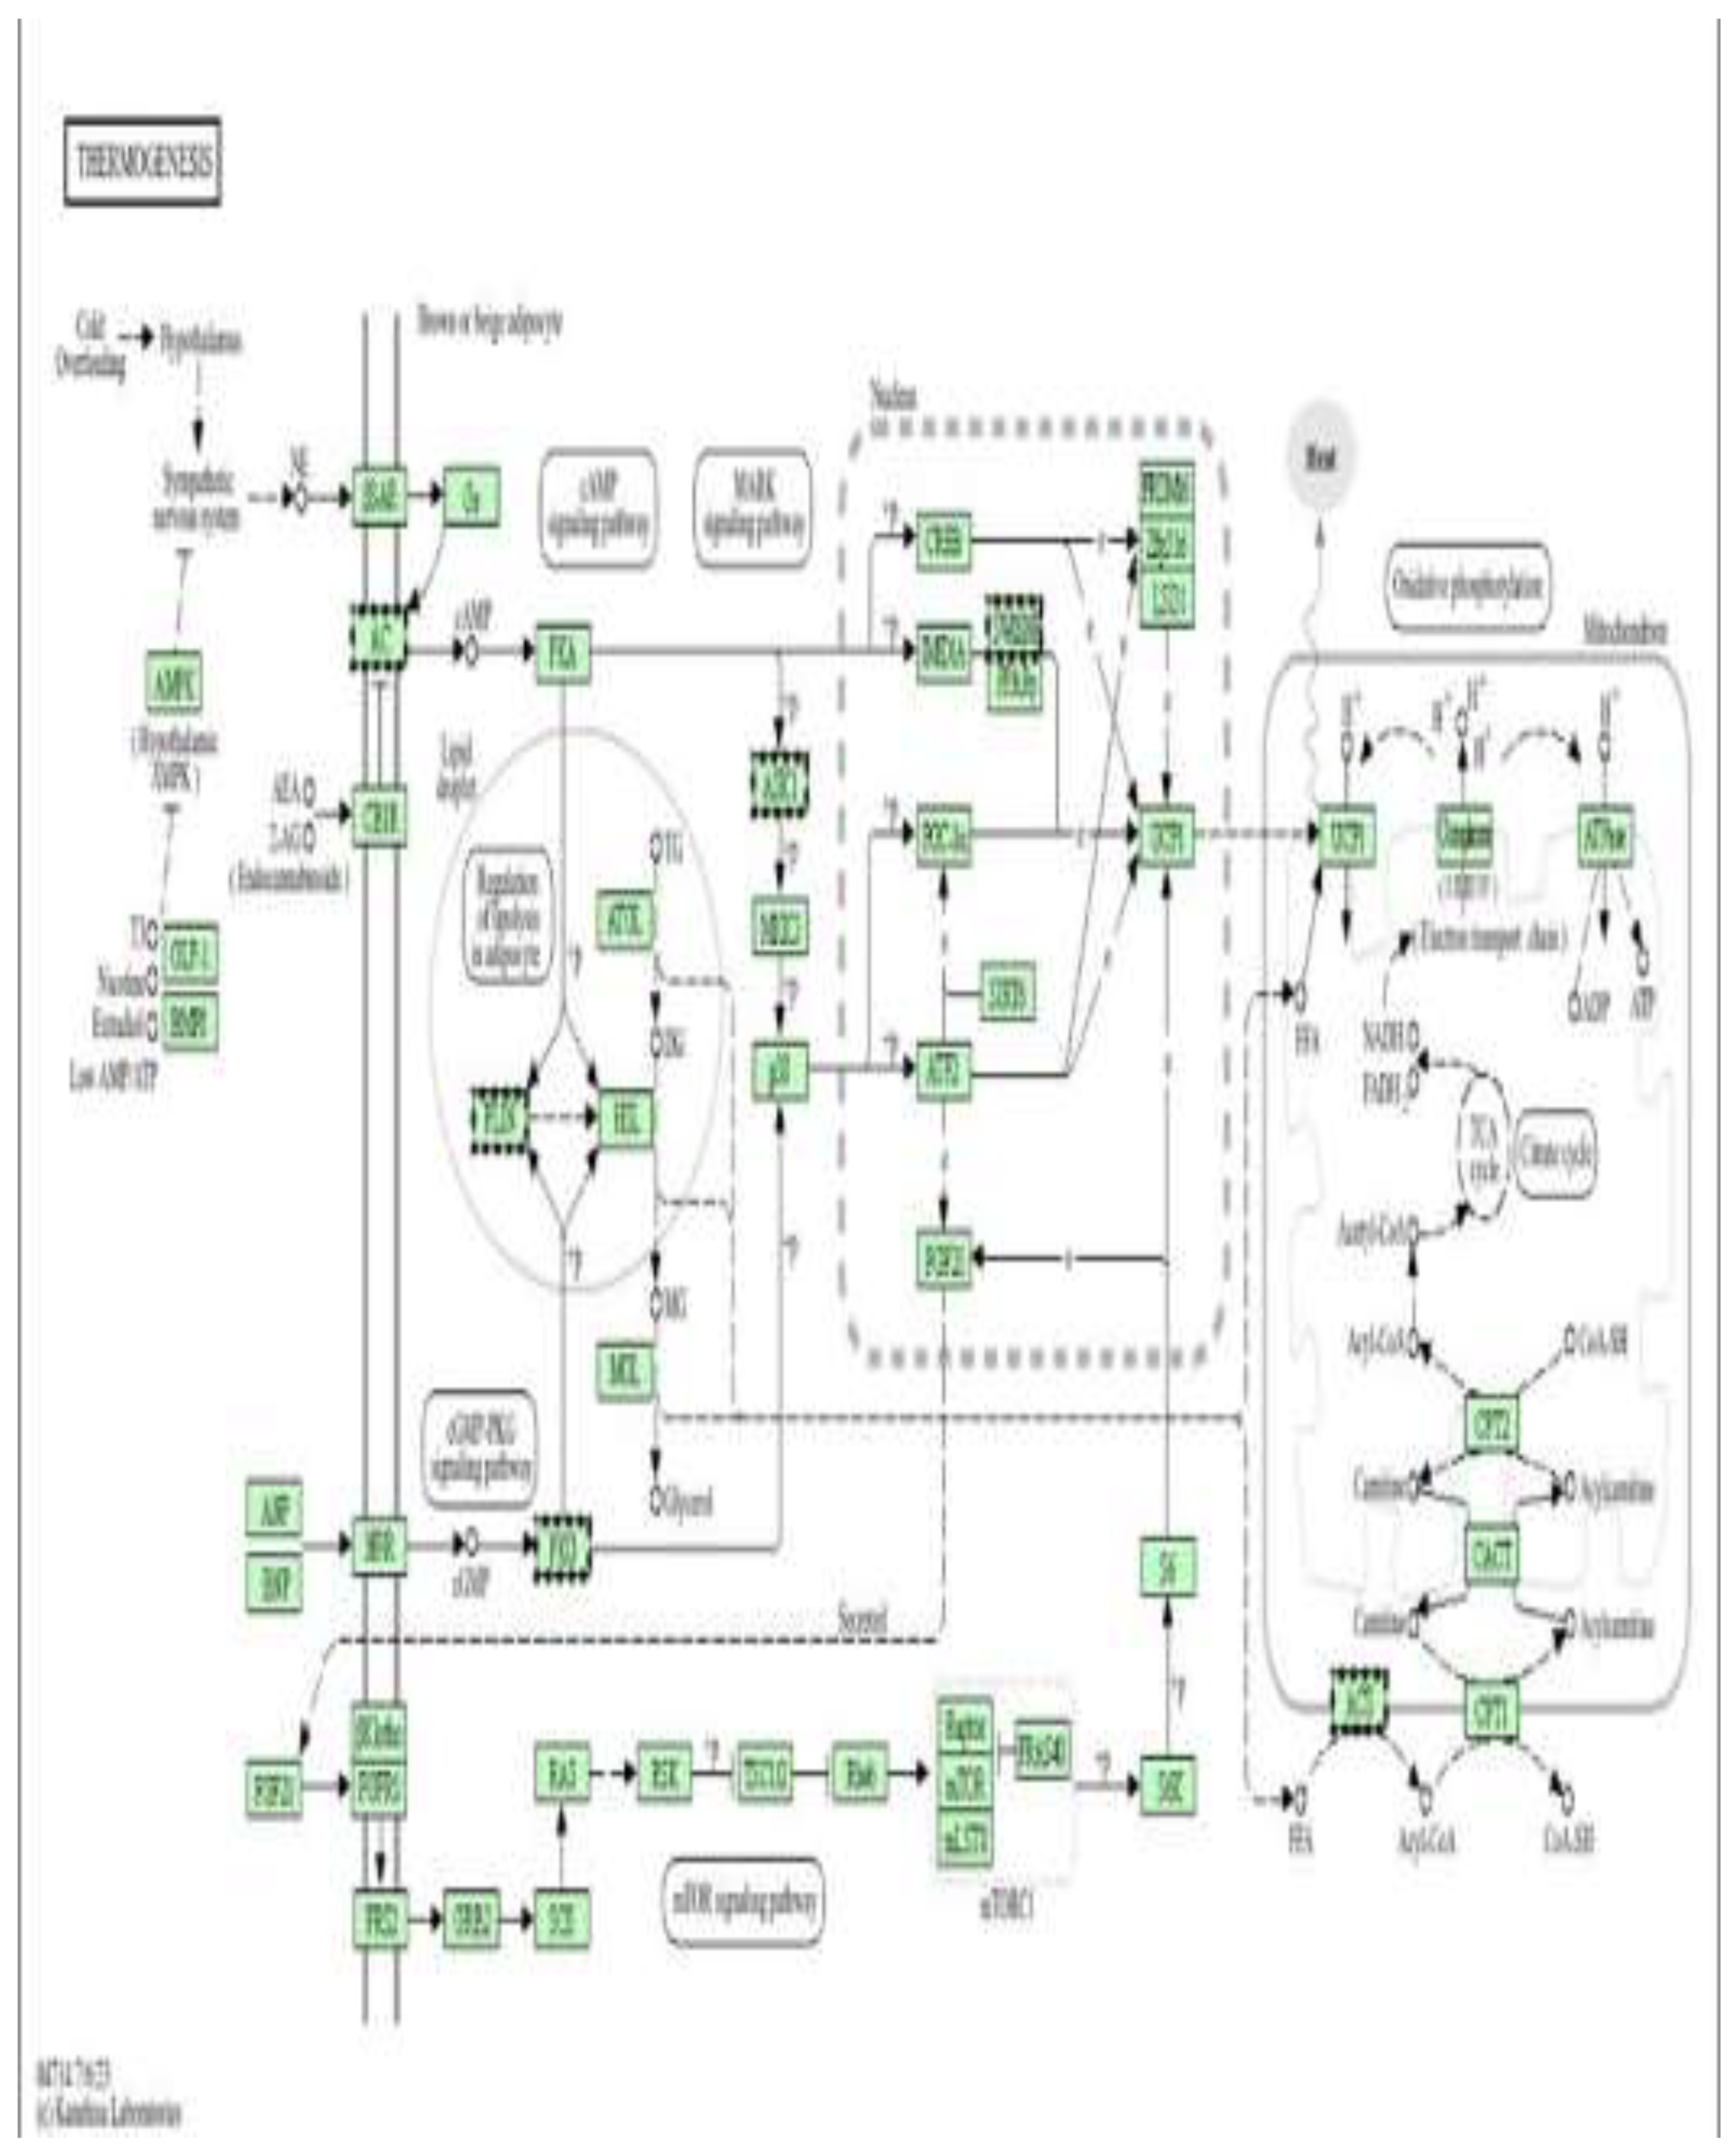

Table 1.
Most and least epigenetically affected genes in high-dose metformin–treated H9c2 cells.
| Category | Gene | nDMRs | Methylation Direction | Biological Function |
| Most affected | GAB2 | 89 | Hypomethylated | Signal transduction adaptor; regulates PI3K/AKT and MAPK pathways, cell survival and proliferation |
| Most affected | TENM4 | 87 | Hypomethylated | Neuronal development, axon guidance, and cell–cell adhesion |
| Most affected | DLG2 | 65 | Hypermethylated | Synaptic scaffolding protein; essential for neurotransmission and synapse organization |
| Most affected | NARS2 | 56 | Hypomethylated | Mitochondrial tRNA synthetase; required for mitochondrial protein synthesis and energy production |
| Most affected | ZFP536 | 47 | Hypermethylated | Transcription factor involved in neuronal differentiation and brain development |
| Most affected | CSRP3 | 1 | Hypomethylated | Cytoskeletal protein important for cardiac and skeletal muscle structure |
| Least affected | LRRC10B | 1 | Hypomethylated | Cardiac-specific protein involved in heart development and contractility |
| Least affected | Other single-DMR genes | 1 | Hypomethylated | Represent minimal epigenetic alteration with limited regulatory impact |
Table 2.
Most and least epigenetically affected genes in low-dose metformin–treated H9c2 cells.
| Category | Gene | nDMRs | Methylation Direction | Biological Function |
| Most affected | GLIS3 | 1 | Hypermethylated |
Transcription factor regulating insulin signaling, neurodevelopment, and cell differentiation |
| Most affected | ZDHHC13 | 1 | Hypomethylated | Palmitoyltransferase involved in protein lipid modification and neuronal signaling |
| Most affected | TCP1 | 1 | Hypermethylated | Molecular chaperone involved in protein folding and cytoskeleton assembly |
| Most affected | GARRE1 | 1 | Hypermethylated | Regulates cell proliferation and cytoskeletal organization |
| Most affected | TM6SF1 | 1 | Hypomethylated | Membrane protein associated with lipid metabolism and ER function |
| Least affected | Other single-DMR genes | 1 | Minor change | Show background-level methylation variation with negligible functional effect |
Disclaimer/Publisher’s Note: The statements, opinions and data contained in all publications are solely those of the individual author(s) and contributor(s) and not of MDPI and/or the editor(s). MDPI and/or the editor(s) disclaim responsibility for any injury to people or property resulting from any ideas, methods, instructions or products referred to in the content. |
© 2026 by the authors. Licensee MDPI, Basel, Switzerland. This article is an open access article distributed under the terms and conditions of the Creative Commons Attribution (CC BY) license (http://creativecommons.org/licenses/by/4.0/).
Copyright: This open access article is published under a Creative Commons CC BY 4.0 license, which permit the free download, distribution, and reuse, provided that the author and preprint are cited in any reuse.


