Submitted:
11 February 2026
Posted:
12 February 2026
You are already at the latest version
Abstract
Hypertension is a leading global health risk and requires accurate and continuous monitoring for effective management. Although photoplethysmography (PPG) is a promising non-invasive modality for cuffless blood pressure (BP) assessment, many existing approaches (especially raw-signal deep learning) are vulnerable to data leakage, overfitting on small datasets, limited interpretability, and poor performance on minority BP stages. To address these limitations, we propose a robust and physiologically grounded framework for multi-class BP stage classification based on interpretable PPG features. Our approach centers on a comprehensive multi-domain feature engineering pipeline that extracts 124 PPG features, including demographic, morphological, functional decomposition, spectral, nonlinear dynamics, and clinical composite indices. We apply rigorous preprocessing and feature selection prior to model training. We validate the framework on two datasets: PPG-BP dataset (657 segments, 4 classes) for benchmarking and PulseDB (283,773 segments, 3 classes) to assess scalability. On PPG-BP, LightGBM trained on the selected features achieved macro-F1 = 0.81 and accuracy = 0.79, outperforming comparable deep-learning models and achieving strong minority-class performance (e.g., HT2 F1score = 0.92). On the PulseDB, a custom Residual MLP achieved accuracy = 0.81 and macro-F1 = 0.79, supporting generalization at scale. These results show that the proposed feature-based approach can outperform complex end-to-end deep-learning models on small datasets while providing improved interpretability. This work establishes a reliable and transparent pathway toward clinically viable continuous BP staging, moving beyond black-box models toward physiologically grounded decision support.
Keywords:
photoplethysmography
; blood pressure
; hypertension staging
; feature engineering
; machine learning
; neural networks
; pulse wave processing
; multi-class classification
; informatics
1. Introduction
Hypertension is a critical global health challenge and a major risk factor for cardiovascular disease, stroke, and kidney failure [1]. WHO estimates that approximately 44% of adults with hypertension are unaware that they have the condition [2]. Traditional cuff-based sphygmomanometers provide intermittent measurements and are impractical for continuous monitoring, limiting early detection and long-term management [3]. Advances in photoplethysmography (PPG), a non-invasive and cost-effective optical technique, have enabled progress toward continuous BP monitoring [4,5]. The PPG waveform is a rich, complex signal that reflects volumetric changes in peripheral blood flow with each cardiac cycle. Waveform morphology reflects cardiovascular properties such as arterial stiffness, cardiac output, and peripheral resistance, which are closely linked to blood pressure [6,7]. However, extracting BP-related patterns from the PPG waveform remains challenging. A primary challenge is noise sensitivity, including motion artifacts, physiological variability (e.g., respiration and thermoregulation), and device-related differences. These issues are particularly acute for multi-class BP staging. Morphological differences between normotensive and prehypertensive pulses—and between hypertension stages—can be subtle and easily obscured by noise and inter-subject variability. Consequently, developing a classifier that generalizes across diverse populations and real-world conditions remains difficult [8]. Cuffless hypertension monitoring using PPG has driven substantial research at the intersection of signal processing and machine learning. Approaches range from handcrafted feature models to end-to-end deep-learning architecture.
Prior work exhibits recurrent methodological limitations that constrain reliability and clinical applicability. A common limitation is using raw PPG signals as direct model inputs, which often requires parameter-heavy architectures (e.g., CNNs and CNN–GRU hybrids). On small public datasets such as PPG-BP, these models are prone to overfitting, can yield implausibly high performance (e.g., 100% accuracy), and may suffer leakage when SBP/DBP values are included as inputs. Many studies further simplify the task to binary classification, which lacks the clinical granularity required for staged hypertension management. Studies that attempt multi-class classification often report low precision, recall, and F1-scores for minority classes (e.g., hypertension stages 1 and 2), suggesting inadequate handling of class imbalance. Table 1 summarizes prior PPG-based hypertension classification studies, with emphasis on machine learning and deep learning methods.
The central hypothesis driving this work is that hypertensive states induce quantifiable alterations in PPG waveform morphology, temporal dynamics, and spectral characteristics that can be systematically extracted and classified using computational methods [9]. Previous studies have demonstrated correlations between specific PPG features and blood pressure, but comprehensive multi-domain analysis encompassing morphological, functional, spectral, and nonlinear characteristics remain underexplored [10]. This gap is particularly significant given the complex pathophysiology of hypertension, which involves arterial stiffening, endothelial dysfunction, neurohormonal activation, and autonomic imbalance—all potentially manifesting in distinct PPG signal patterns.
Recent advances in deep learning have enabled end-to-end classification of blood pressure stages directly from raw PPG waveforms, utilizing architectures such as convolutional neural networks (CNNs), long short-term memory networks (LSTMs), and their hybrids [11,12]. While these methods have shown promise, they face significant limitations that hinder their clinical translation. Many models exhibit implausibly high performance on small public datasets, often attributable to data leakage, methodological oversights, or overfitting [13,14]. Furthermore, these "black-box" approaches lack physiological interpretability [15], providing little insight into the underlying cardiovascular mechanisms driving the classification. Crucially, most existing studies are confined to binary classification or report poor performance on clinically important minority classes (e.g., hypertension stages 1 and 2), failing to address the nuanced, multi-stage nature of hypertension management [16,17].
To address these gaps, we propose an interpretable and robust framework for multi-class blood pressure stage classification. We hypothesize that systematic multi-domain feature engineering—spanning morphological, functional, spectral, and nonlinear-dynamics descriptors—captures hypertension-related physiological changes more effectively and transparently than raw-signal analysis alone. This work makes three contributions: (1) we develop a structured pipeline that extracts 124 PPG features across 12 physiological domains, including functional decomposition and composite clinical indices. (2) we evaluate the methodology on two datasets: PPG-BP (657 segments, 4 classes) for benchmarking and PulseDB (283,773 segments, 3 classes) to assess scalability and generalizability. (3) We show that classical machine-learning models (notably LightGBM) trained on engineered features achieve more balanced multi-class performance than raw-signal deep-learning models, and that specialized neural architectures (e.g., Residual MLP) can effectively leverage these features at scale.
2. Materials and Methods
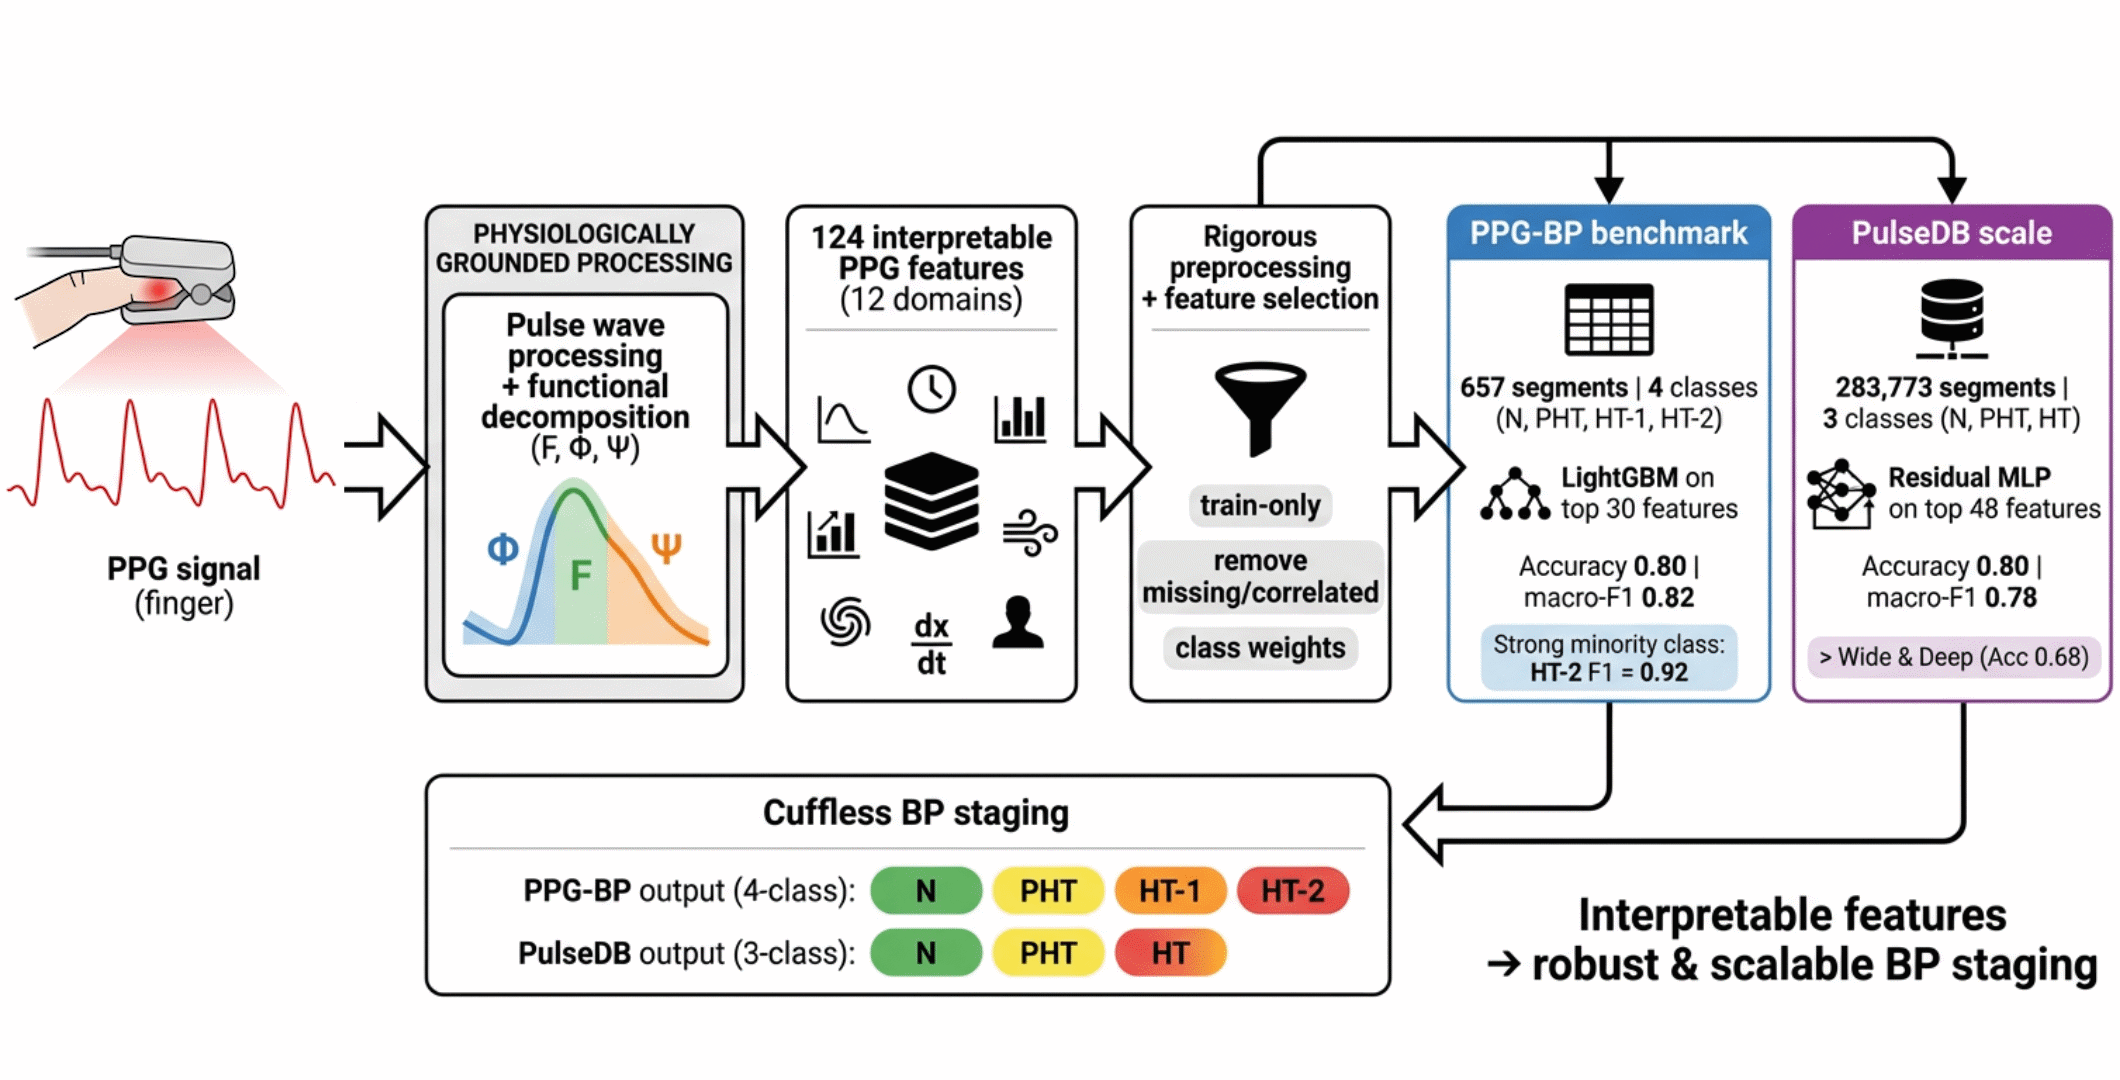
We developed and validated a machine-learning pipeline for BP staging from photoplethysmography (PPG) using a multi-dataset design. The methodology encompassed four main components: (1) utilization of two complementary datasets with different characteristics, (2) advanced pulse wave processing using functional decomposition, (3) comprehensive feature extraction across 12 physiological domains, and (4) implementation of optimized classification architectures. We used a dual-dataset strategy—PPG-BP (657 segments, 4 classes) and PulseDB (283,773 segments, 3 classes)—to test generalization under contrasting dataset sizes and class distributions (Figure 1).
2.1. Datasets
Two datasets were used. The PPG-BP dataset [24] contains 657 segments. Segments are distributed across four classes: Normal (36.5%), Prehypertension (38.8%), Hypertension Stage 1 (15.5%), and Hypertension Stage 2 (9.2%). The JNC 7 classification was adopted (Table 2) [34].
The second dataset, PulseDB [25], is a large curated dataset designed for benchmarking cuffless BP estimation methods. PulseDB is derived from the MIMIC-III Waveform Database Matched Subset and the VitalDB database. Height, weight, and BMI are available only for VitalDB-derived segments, which were used in this study. The dataset includes raw PPG signals with a sampling rate of 125 Hz. The dataset contains 283,773 segments. Segments are distributed across three classes: Normal (56.7%), Prehypertension (27.5%), and Hypertension (15.8%). The classes were defined from Table 2, where Stage 1 and Stage 2 of hypertension were combined under the hypertension class.
We used two complementary datasets to evaluate the proposed methodology under contrasting conditions: PPG-BP (657 segments, 4 classes) and PulseDB (283,773 segments, 3 classes). PPG-BP provides a widely used benchmark for direct comparison with prior studies and tests robustness under severe class imbalance and limited sample size. PulseDB supports large-scale evaluation of scalability and generalization under a different class schema. Together, these datasets reduce the risk of over-optimizing for a single dataset and provide a more balanced assessment of performance.
2.2. Pulse Wave Processing
Numerous pulse-wave processing methods have been proposed, each with distinct advantages and limitations. Recently, functional-decomposition approaches have been introduced that use mathematical basis functions to describe pulse-wave phases [26,27]. The pulse wave is partitioned into three regions (Figure 2). These regions correspond to the neighborhood of the local maximum, the rising phase, and the falling phase.
The function describes the area surrounding maximum:
where is the step duration, m denotes the step index corresponding to the local maximum, and p is an integer coefficient (default: p = 2)
The function describes the falling (decay) area:
where the following restrictions are imposed on the values of t: τm < t, τk-1 ≤ t < τk. k is the number of the decline step.
The function describes the rising area:
where denotes the step index corresponding to the local maximum, is the step duration, is the signal amplitude at step , and is the total duration of the rising edge.
2.3. Feature Extraction and Selection
A feature extraction pipeline was implemented across 12 physiological domains. Morphological features quantified pulse waveform characteristics including amplitude, slope, area, and timing parameters. Functional decomposition applied mathematical modeling, generating , , and functions representing different aspects of vascular dynamics [27]. Temporal analysis captured heart rate variability and cycle duration patterns. Spectral features were derived via Welch's power spectral density estimation, characterizing harmonic structure and frequency distribution [9]. Nonlinear dynamics were assessed through approximate entropy [28], detrended fluctuation analysis [29], Poincaré plot metrics [30], and recurrence quantification analysis [31]. All preprocessing and feature selection were fitted on the training data only and applied to validation/test data without refitting.
The 12 physiological domains are:
- Basic morphology (26 features): These features capture fundamental PPG waveform shape characteristics related to cardiac ejection and vascular properties.
- Function-based (15 features): These features are derived from functional decomposition using basis functions (, , ) that represent distinct physiological components.
- Temporal-domain analysis (4 features): These features characterize timing relationships within and between cardiac cycles.
- Beat-to-beat analysis (7 features): These features quantify the stability and consistency of waveform characteristics across consecutive pulses.
- Velocity and acceleration analysis (11 features): These features analyze the first, second, and third derivatives of the PPG signal to characterize hemodynamic dynamics.
- Frequency-domain analysis (8 features): These features decompose the PPG signal into frequency components to capture periodic patterns and harmonics.
- Nonlinear dynamics (8 features): These features quantify irregularity, unpredictability, and self-similarity in PPG signals.
- Inter-beat comparison (7 features): These features quantify beat-to-beat similarity and variation in pulse-wave shape.
- Vascular compliance (7 features): These features estimate arterial stiffness using pulse-wave-velocity proxies and reflection characteristics.
- Composite clinical indices (5 features): These features combine multiple signal characteristics into clinically interpretable indices.
- Engineered features (22 features): These features combine signal-derived characteristics with demographic variables using domain knowledge.
- Demographics and heart rate (4 features): These features include age, sex, BMI, and heart rate, which provide context for interpretation and normalization.
2.4. Classification of BP Stages
PPG-BP: We applied a comprehensive machine-learning pipeline with rigorous preprocessing. The initial dataset contained 657 samples with 124 features across four imbalanced classes. Preprocessing included removing constant features, handling infinite/missing values (dropping 15 features with >50% missingness), removing 44 highly correlated features (threshold 0.95), selecting the top 30 features via ANOVA F-test [32]. After this feature selection, all retained features are scaled using RobustScaler for outlier robustness. Critically, all transformations are fitted exclusively on the training data (via the fit method) and then applied to both training and test sets (via transform), ensuring no information from the test set contaminates the preprocessing parameters. We addressed class imbalance using class weights, assigning higher weights to the minority classes (Hypertension Stage 1: 1.610; Hypertension Stage 2: 2.737). The modeling approach compared three traditional algorithms—Random Forest, Gradient Boosting, and LightGBM—against four neural network architectures including standard MLP, Deep MLP, attention and simple networks. We evaluated all models using 5-fold stratified cross-validation and an 80/20 train–test split; primary metrics were macro-F1, accuracy, and per-class precision/recall/F1. Neural networks incorporated class weighting, batch normalization, dropout regularization, and early stopping with learning rate reduction to prevent overfitting.
PulseDB: We used 283,773 samples with the original feature set across three diagnostic classes: Normal (N), Prehypertension (PHT), and Hypertension (HT). The dataset exhibited significant class imbalance (56.7% N, 27.5% PHT, 15.8% HT). The preprocessing pipeline included missing value imputation using median values, removal of constant and highly correlated features (>0.95 correlation), and a two-stage feature selection process combining VarianceThreshold and SelectKBest to select the top 48 features. All transformations were fitted exclusively on training data and then applied to validation/test sets to prevent data leakage, followed by feature standardization using StandardScaler. Additionally, class weights were applied to mitigate class imbalance.
The Residual MLP (Figure 3) used ResNet-inspired residual connections, enabling deeper networks without vanishing gradients. The network featured two residual blocks (128 and 64 units respectively) with skip connections, BatchNorm layers, and Dropout regularization (0.3), culminating in a three-unit softmax output layer. This design contained 81,987 trainable parameters. In contrast, the Wide & Deep model (Figure 4) employed a hybrid architecture combining linear transformations (64→32 units) in its wide path with non-linear transformations (128→96→64 units) in its deep path, followed by concatenation and joint processing, totaling 36,867 trainable parameters.
Both models employed identical training protocols using the AdamW optimizer with learning rate 0.001, weight decay 0.0001, and a batch size of 384 samples. Training incorporated early stopping with a patience of 20 epochs based on validation accuracy and learning rate reduction on plateau. The models trained for up to 120 epochs, with 10% of training data reserved for validation and 20% of the original dataset held out for testing. Evaluation considered accuracy and macro-F1 score as primary metrics, supplemented by per-class precision, recall, inference time, parameter counts, confusion matrices, and training curves.
3. Results
PPG-BP: Preprocessing reduced the feature set from 124 to 30 while preserving discriminative power. Cross-validation revealed LightGBM as the most stable performer (Accuracy: 0.79, macro-F1: 0.813), followed by Gradient Boosting (Accuracy: 0.765, macro-F1: 0.766) and Random Forest (Accuracy: 0.72, macro-F1: 0.723). On the test set, LightGBM achieved accuracy = 0.79 and macro-F1 = 0.813. All evaluated neural network architectures underperformed (Figure 5, Table 4); the best model (Deep MLP) achieved a test macro-F1 of 0.563. LightGBM achieved strong minority-class performance (HT-1 F1 = 0.791; HT-2 F1 = 0.917), although the HT-2 test set contained only 12 samples (Table 3, Table 5). A weighted ensemble of the seven models (Random Forest, Gradient Boosting, LightGBM, MLP, Deep MLP, Attention NN, Simple NN) yielded 0.75 macro-F1, improving upon individual Random Forest but not surpassing LightGBM or Gradient Boosting alone (Table 4). The confusion matrix (Figure 6) shows limited misclassification; most errors occur between the majority classes (N and PHT), suggesting overlap in their feature distributions.
PulseDB: The Residual MLP achieved higher accuracy (0.81 vs 0.76) and macro-F1 (0.79 vs 0.73) than the Wide & Deep model (Table 6 and Table 7). Examining per-class performance, the Residual MLP showed high precision for Normal cases (0.92) with recall (0.85), moderate precision for PHT cases (0.67) with recall (0.75), and balanced precision/recall for HT cases (0.74/0.80). The Wide & Deep model demonstrated similar high precision for Normal cases (0.90) but with recall (0.80), along with lower precision for PHT (0.62) and HT (0.62) cases.
The confusion matrix (Figure 7) indicates that the Residual MLP correctly classified 27,246 Normal cases, 11,658 PHT cases, and 7,174 HT cases, supporting consistent performance across classes. The Wide & Deep model showed significantly more confusion between classes, particularly misclassifying PHT as N (Figure 8). Training dynamics further differentiated the models: the Residual MLP achieved peak validation accuracy of 0.816 at epoch 106 with smooth learning curves indicating stable convergence, while the Wide & Deep model reached 0.76 validation accuracy with higher variance in its training curves (Figure 9). The code is available on GitHub [33].
4. Discussion
We evaluated a feature-engineered machine-learning pipeline for BP staging using a two-dataset design to address common limitations in prior work. On the PPG-BP dataset, LightGBM outperformed the neural network models, suggesting that gradient-boosted trees are well suited to engineered-feature classification. Neural network underperformance may reflect insufficient training data for reliable parameter estimation despite regularization. Feature selection proved crucial: the 30 retained features—particularly the composite engineered features—provided strong predictive signal. The effective handling of class imbalance through weighting strategies is evidenced by the strong minority class performance, indicating that imbalance correction methods transferred well across algorithm types. Interestingly, increasing neural network complexity through attention mechanisms did not yield improvements, suggesting either inadequate architectural design or that the attention mechanisms failed to capture meaningful feature relationships for this specific problem. These findings highlight that for moderate-sized, tabular biomedical datasets with engineered features, traditional gradient boosting methods may outperform more complex neural architectures, offering both computational efficiency and superior predictive accuracy. Future work should investigate whether expanded datasets or different neural architectures could bridge this performance gap while maintaining interpretability.
For PulseDB dataset: While the Wide & Deep model used 55% fewer parameters and demonstrated 7.4% faster inference (12,097 vs 11,266 samples/second), the Residual MLP achieved substantially higher accuracy (0.81 vs 0.76) and F1 score (0.79 vs 0.73) despite only 6.5% longer training time (293.3 vs 275.3 seconds). The superior performance of the Residual MLP can be attributed to its residual connections facilitating gradient flow in deeper networks, skip connections preserving important feature representations, batch normalization stabilizing training, and strategic dropout preventing overfitting while maintaining network capacity.
The adjusted class weights proved crucial for minority class performance, with weights of 0.59 for N, 1.21 for PHT, and 2.11 for HT. This weighting strategy, combined with the Residual MLP's architecture, enabled balanced learning across all three classes despite the 3.6:1.7:1 imbalance ratio (56.7% N, 27.5% PHT, 15.8% HT). The Residual MLP achieved an overall accuracy of 0.81 and F1 score of 0.79, suggesting reasonable performance across classes.x. The Wide & Deep model's underperformance (0.76 accuracy) may indicate that its linear (wide) pathway lacks sufficient complexity for this imbalanced medical classification task, or that the architecture balance requires more careful tuning for this specific dataset.
5. Conclusions
This study demonstrates the feasibility of comprehensive multi-domain feature extraction from PPG for hypertension stage classification. The developed computational framework successfully transforms raw optical signals into physiologically interpretable features across morphological, functional, spectral, nonlinear, and clinically engineered domains. The resulting dataset provides a rich resource for developing machine learning models for non-invasive blood pressure assessment. By bridging signal processing innovations with clinical hypertension knowledge, this work advances toward accessible, continuous cardiovascular monitoring solutions with potential to transform hypertension screening, diagnosis, and management. Further validation and refinement may support PPG-based classification as an adjunct to traditional blood pressure measurement in clinical and community settings.
This study presented a robust, physiologically informed machine learning framework for the multi-class classification of blood pressure stages from PPG signals, effectively addressing critical limitations prevalent in existing literature. Departing from the common trend of using raw PPG signals as direct input to complex, opaque deep learning models, our approach was anchored in comprehensive feature engineering, extracting and selecting biomarkers across 12 domains — including morphological, spectral, nonlinear, and clinical composite features. This design improves transparency and helps mitigate overfitting and common sources of data leakage reported in prior studies.
The efficacy of the framework was demonstrated through a strategic dual-dataset validation strategy. On the standard PPG-BP benchmark (4 classes), our pipeline, powered by LightGBM, achieved strong performance (0.813 macro-F1), significantly outperforming prior works while demonstrating exceptional robustness in classifying minority hypertension stages. These results suggest that a feature-based approach can outperform raw-signal models on small, imbalanced datasets. Furthermore, the successful scalability and generalization of our method were confirmed on the large-scale PulseDB dataset (3 classes), where a tailored Residual MLP architecture maintained high accuracy (0.81) and balanced performance across classes, showcasing the adaptability of our core feature set to different data volumes and clinical staging protocols.
In summary, this work establishes that a principled, feature-centric pipeline coupled with rigorous preprocessing and imbalance handling offers a more reliable, interpretable, and clinically actionable pathway for cuffless BP staging than end-to-end deep learning on limited data. The consistent high performance across two disparate datasets underscores the transferable value of the engineered physiological features. Future work will validate the pipeline on additional datasets and extend the feature set to better capture dynamic cardiovascular regulation for personalized hypertension management.
Author Contributions
Conceptualization, S.M., R.D., and V.D.; methodology, S.M. and R.D.; software, S.M.; validation, S.M., R.D.; formal analysis, S.M.; investigation, S.M., R.D. and V.D.; resources, S.M.; data curation, S.M.; writing—original draft preparation, S.M. and R.D.; writing—review and editing, S.M. and R.D.; visualization, S.M.; supervision, R.D.; project administration, R.D.; funding acquisition, R.D. All authors have read and agreed to the published version of the manuscript.
Funding
This research received no external funding.
Institutional Review Board Statement
Not applicable.
Informed Consent Statement
Not applicable.
Data Availability Statement
Code is available at: https://github.com/souhair/Classification-BP-stages.
Conflicts of Interest
The authors declare no conflicts of interest.
Abbreviations
The following abbreviations are used in this manuscript:
| PPG | Photoplethysmography |
| SBP | Systolic blood pressure |
| DBP | Diastolic blood pressure |
| CNN | Convolutional neural network |
| GRU | Gated recurrent unit |
| SVM | Support vector machine |
| LDA | Linear discriminant analysis |
| LSVM | Linear Support Vector Machine |
| LSTM | Long Short-Term Memory |
| BMI | Body mass index |
| MLP | Multi-Layer Perceptron |
| PHT | Prehypertension |
| HT | Hypertension |
References
- World Health Organization. Cardiovascular Diseases (CVDs). Available online: https://www.who.int/health-topics/cardiovascular-diseases#tab=tab_1 (accessed on February 2026).
- World Health Organization. Hypertension. Available online: https://www.who.int/news-room/fact-sheets/detail/hypertension (accessed on 1 February 2026).
- Haugg, F.; Elgendi, M.; Menon, C. Assessment of blood pressure using only a smartphone and machine learning techniques: a systematic review. Front. Cardiovasc. Med. 2022, 9, 894224. [Google Scholar] [CrossRef] [PubMed]
- Liu, Q.; Yang, C.; Yang, S.; Kwong, C.F.; et al. Photoplethysmography-based non-invasive blood pressure monitoring via ensemble model and imbalanced dataset processing. Phys. Eng. Sci. Med. 2024, 47, 1307–1321. [Google Scholar] [CrossRef] [PubMed]
- Hu, X.; Yin, S.; Zhang, X.; et al. Blood pressure stratification using photoplethysmography and light gradient boosting machine. Front. Physiol. 2023, 14, 1072273. [Google Scholar] [CrossRef] [PubMed]
- Allen, J. Photoplethysmography and its application in clinical physiological measurement. Physiol. Meas. 2007, 28, R1–R39. [Google Scholar] [CrossRef]
- Elgendi, M. On the analysis of fingertip photoplethysmogram signals. Curr. Cardiol. Rev. 2012, 8, 14–25. [Google Scholar] [CrossRef]
- Charlton, P.H.; Paliakaitė, B.; Pilt, K.; et al. Assessing hemodynamics from the photoplethysmogram to gain insights into vascular age: a review from VascAgeNet. Am. J. Physiol. Heart Circ. Physiol. 2022, 322, H493–H522. [Google Scholar] [CrossRef]
- Mejía-Mejía, E.; Allen, J.; Budidha, K.; El Hajj, C.; Kyriacou, P.; Charlton, P. Photoplethysmography signal processing and synthesis. In Photoplethysmography; Elsevier, 2022; pp. 69–146. [Google Scholar] [CrossRef]
- Elgendi, M.; Jost, E.; Alian, A.; et al. Photoplethysmography Features Correlated with Blood Pressure Changes. Diagnostics 2024, 14, 2309. [Google Scholar] [CrossRef]
- Yen, C.-T.; Chang, S.-N.; Liao, C.-H. Deep learning algorithm evaluation of hypertension classification in less photoplethysmography signals conditions. Meas. Control 2021, 54, 439–445. [Google Scholar] [CrossRef]
- Nasir, N.; Sameer, M.; Barneih, F.; Alshaltone, O. Deep Learning Classification of Photoplethysmogram Signal for Hypertension Levels. arXiv 2024, arXiv:2405.14556. [Google Scholar] [CrossRef]
- Tjahjadi, H.; Ramli, K. Noninvasive Blood Pressure Classification Based on Photoplethysmography Using K-Nearest Neighbors Algorithm: A Feasibility Study. Information 2020, 11, 93. [Google Scholar] [CrossRef]
- Abdullah, S.; Kristoffersson, A. Machine learning approaches for cardiovascular hypertension stage estimation using photoplethysmography and clinical features. Front. Cardiovasc. Med. 2023, 10, 1285066. [Google Scholar] [CrossRef] [PubMed]
- Hassija, V.; Chamola, V.; Mahapatra, A.; et al. Interpreting Black-Box Models: A Review on Explainable Artificial Intelligence. Cogn. Comput. 2024, 16, 45–74. [Google Scholar] [CrossRef]
- Wu, J.; Liang, H.; Ding, C.; Huang, X.; Huang, J.; Peng, Q. Improving the Accuracy in Classification of Blood Pressure from Photoplethysmography Using Continuous Wavelet Transform and Deep Learning. Int. J. Hypertens. 2021, 2021, 9938584. [Google Scholar] [CrossRef] [PubMed]
- Martinez-Ríos, E.; Montesinos, L.; Alfaro-Ponce, M. A machine learning approach for hypertension detection based on photoplethysmography and clinical data. Comput. Biol. Med. 2022, 145, 105479. [Google Scholar] [CrossRef]
- Fahoum, A.A.; Al Omari, A.; Al Omari, G.; Zyout, A. Development of a novel light-sensitive PPG model using PPG scalograms and PPG-NET learning for non-invasive hypertension monitoring. Heliyon 2024, 10, e39745. [Google Scholar] [CrossRef]
- Promi, R.T.H.; Nazri, R.A.; Salim, M.S.; Raju, S.M.T.U. A Deep Learning Approach for Non-Invasive Hypertension Classification from PPG Signal. In *Proceedings of the 2023 International Conference on Next-Generation Computing, IoT and Machine Learning (NCIM), Gazipur, Bangladesh, 24–25 November 2023; pp. 1–5. [Google Scholar] [CrossRef]
- Frederick, G.; Yaswant, T.; Brintha, A. PPG Signals for Hypertension Diagnosis: A Novel Method using Deep Learning Models. arXiv 2023, arXiv:2304.06952. [Google Scholar] [CrossRef]
- Nour, M.; Polat, K. Automatic Classification of Hypertension Types Based on Personal Features by Machine Learning Algorithms. Math. Probl. Eng. 2020, 28, 1–13. [Google Scholar] [CrossRef]
- Pankaj, P.; Kumar, A.; Kumar, M.; et al. Optimized deep neural network models for blood pressure classification using Fourier analysis-based time–frequency spectrogram of photoplethysmography signal. Biomed. Eng. Lett. 2023, 13, 739–750. [Google Scholar] [CrossRef]
- Tanc, Y.H.; Ozturk, M. Hypertension Classification Using PPG Signals. In Proceedings of the 2022 Medical Technologies Congress (TIPTEKNO), Antalya, Turkey, 31 October–2 November 2022; pp. 1–4. [Google Scholar] [CrossRef]
- Liang, Y.; Chen, Z.; Liu, G.; Elgendi, M. A new, short-recorded photoplethysmogram dataset for blood pressure monitoring in China. Sci. Data 2018, 5, 180020. [Google Scholar] [CrossRef]
- Wang, W.; Mohseni, P.; Kilgore, K.L.; Najafizadeh, L. PulseDB: A large, cleaned dataset based on MIMIC-III and VitalDB for benchmarking cuff-less blood pressure estimation methods. Front. Digit. Health 2023, 4, 1090854. [Google Scholar] [CrossRef]
- Msokar, S.; Davydov, R.V.; Mazing, M.S.; Isakova, D.D. New opportunities for studying the oxygen saturation of blood hemoglobin in capillaries and tissues. St. Petersburg Polytech. Univ. J. Phys. Math. 2023, 16, 328–332. [Google Scholar] [CrossRef]
- Davydov, R.; Zaitceva, A.; Davydov, V.; Isakova, D.; Mazing, M. New Methodology of Human Health Express Diagnostics Based on Pulse Wave Measurements and Occlusion Test. J. Pers. Med. 2023, 13, 443. [Google Scholar] [CrossRef]
- Su, Y.; Li, Y.; Zhang, S.; Wang, H. Linear and Nonlinear Analysis of Photoplethysmogram Signals and Electrodermal Activity to Recognize Three Different Levels of Human Stress. Int. J. Adv. Comput. Sci. Appl. 2023, 14. [Google Scholar] [CrossRef]
- Dehkordi, P.; Garde, A.; Karlen, W.; Petersen, C.L.; Ansermino, J.M.; Dumont, G.A. Detrended fluctuation analysis of photoplethysmogram pulse rate intervals in sleep disordered breathing. In Proceedings of the 2014 IEEE Healthcare Innovation Conference (HIC), Seattle, WA, USA, 8–10 October 2014; pp. 323–326. [Google Scholar] [CrossRef]
- van Roon, A.M.; Span, M.M.; Lefrandt, J.D.; Riese, H. Overview of Mathematical Relations Between Poincaré Plot Measures and Time and Frequency Domain Measures of Heart Rate Variability. Entropy 2025, 27, 861. [Google Scholar] [CrossRef]
- Alotaiby, T.N.; Alshebeili, S.A.; Alotibi, G.; Alotaibi, G.N. Recurrence Quantification Analysis for PPG/ECG-Based Subject Authentication. In Proceedings of the 2022 4th International Conference on Data Intelligence and Security (ICDIS), Shenzhen, China, 24–26 August 2022; pp. 288–291. [Google Scholar] [CrossRef]
- Chen, D.; Liu, Z.; Ma, X.; Hua, D. Selecting genes by test statistics. J. Biomed. Biotechnol. 2005, 132–138. [Google Scholar] [CrossRef]
- Msokar, S. Classification-BP-stages. GitHub. 2026. Available online: https://github.com/souhair/Classification-BP-stages.
- Chobanian, A.V.; Bakris, G.L.; Black, H.R.; Cushman, W.C.; Green, L.A.; Izzo, J.L.; Jones, D.W.; Materson, B.J.; Oparil, S.; Wright, J.T.; et al. The seventh report of the joint national committee on prevention, detection, evaluation, and treatment of high blood pressure; the JNC 7 report. JAMA 2003, 289, 2560–2572. [Google Scholar] [CrossRef]
Figure 1.
Methodology diagram illustrating the complete pipeline.
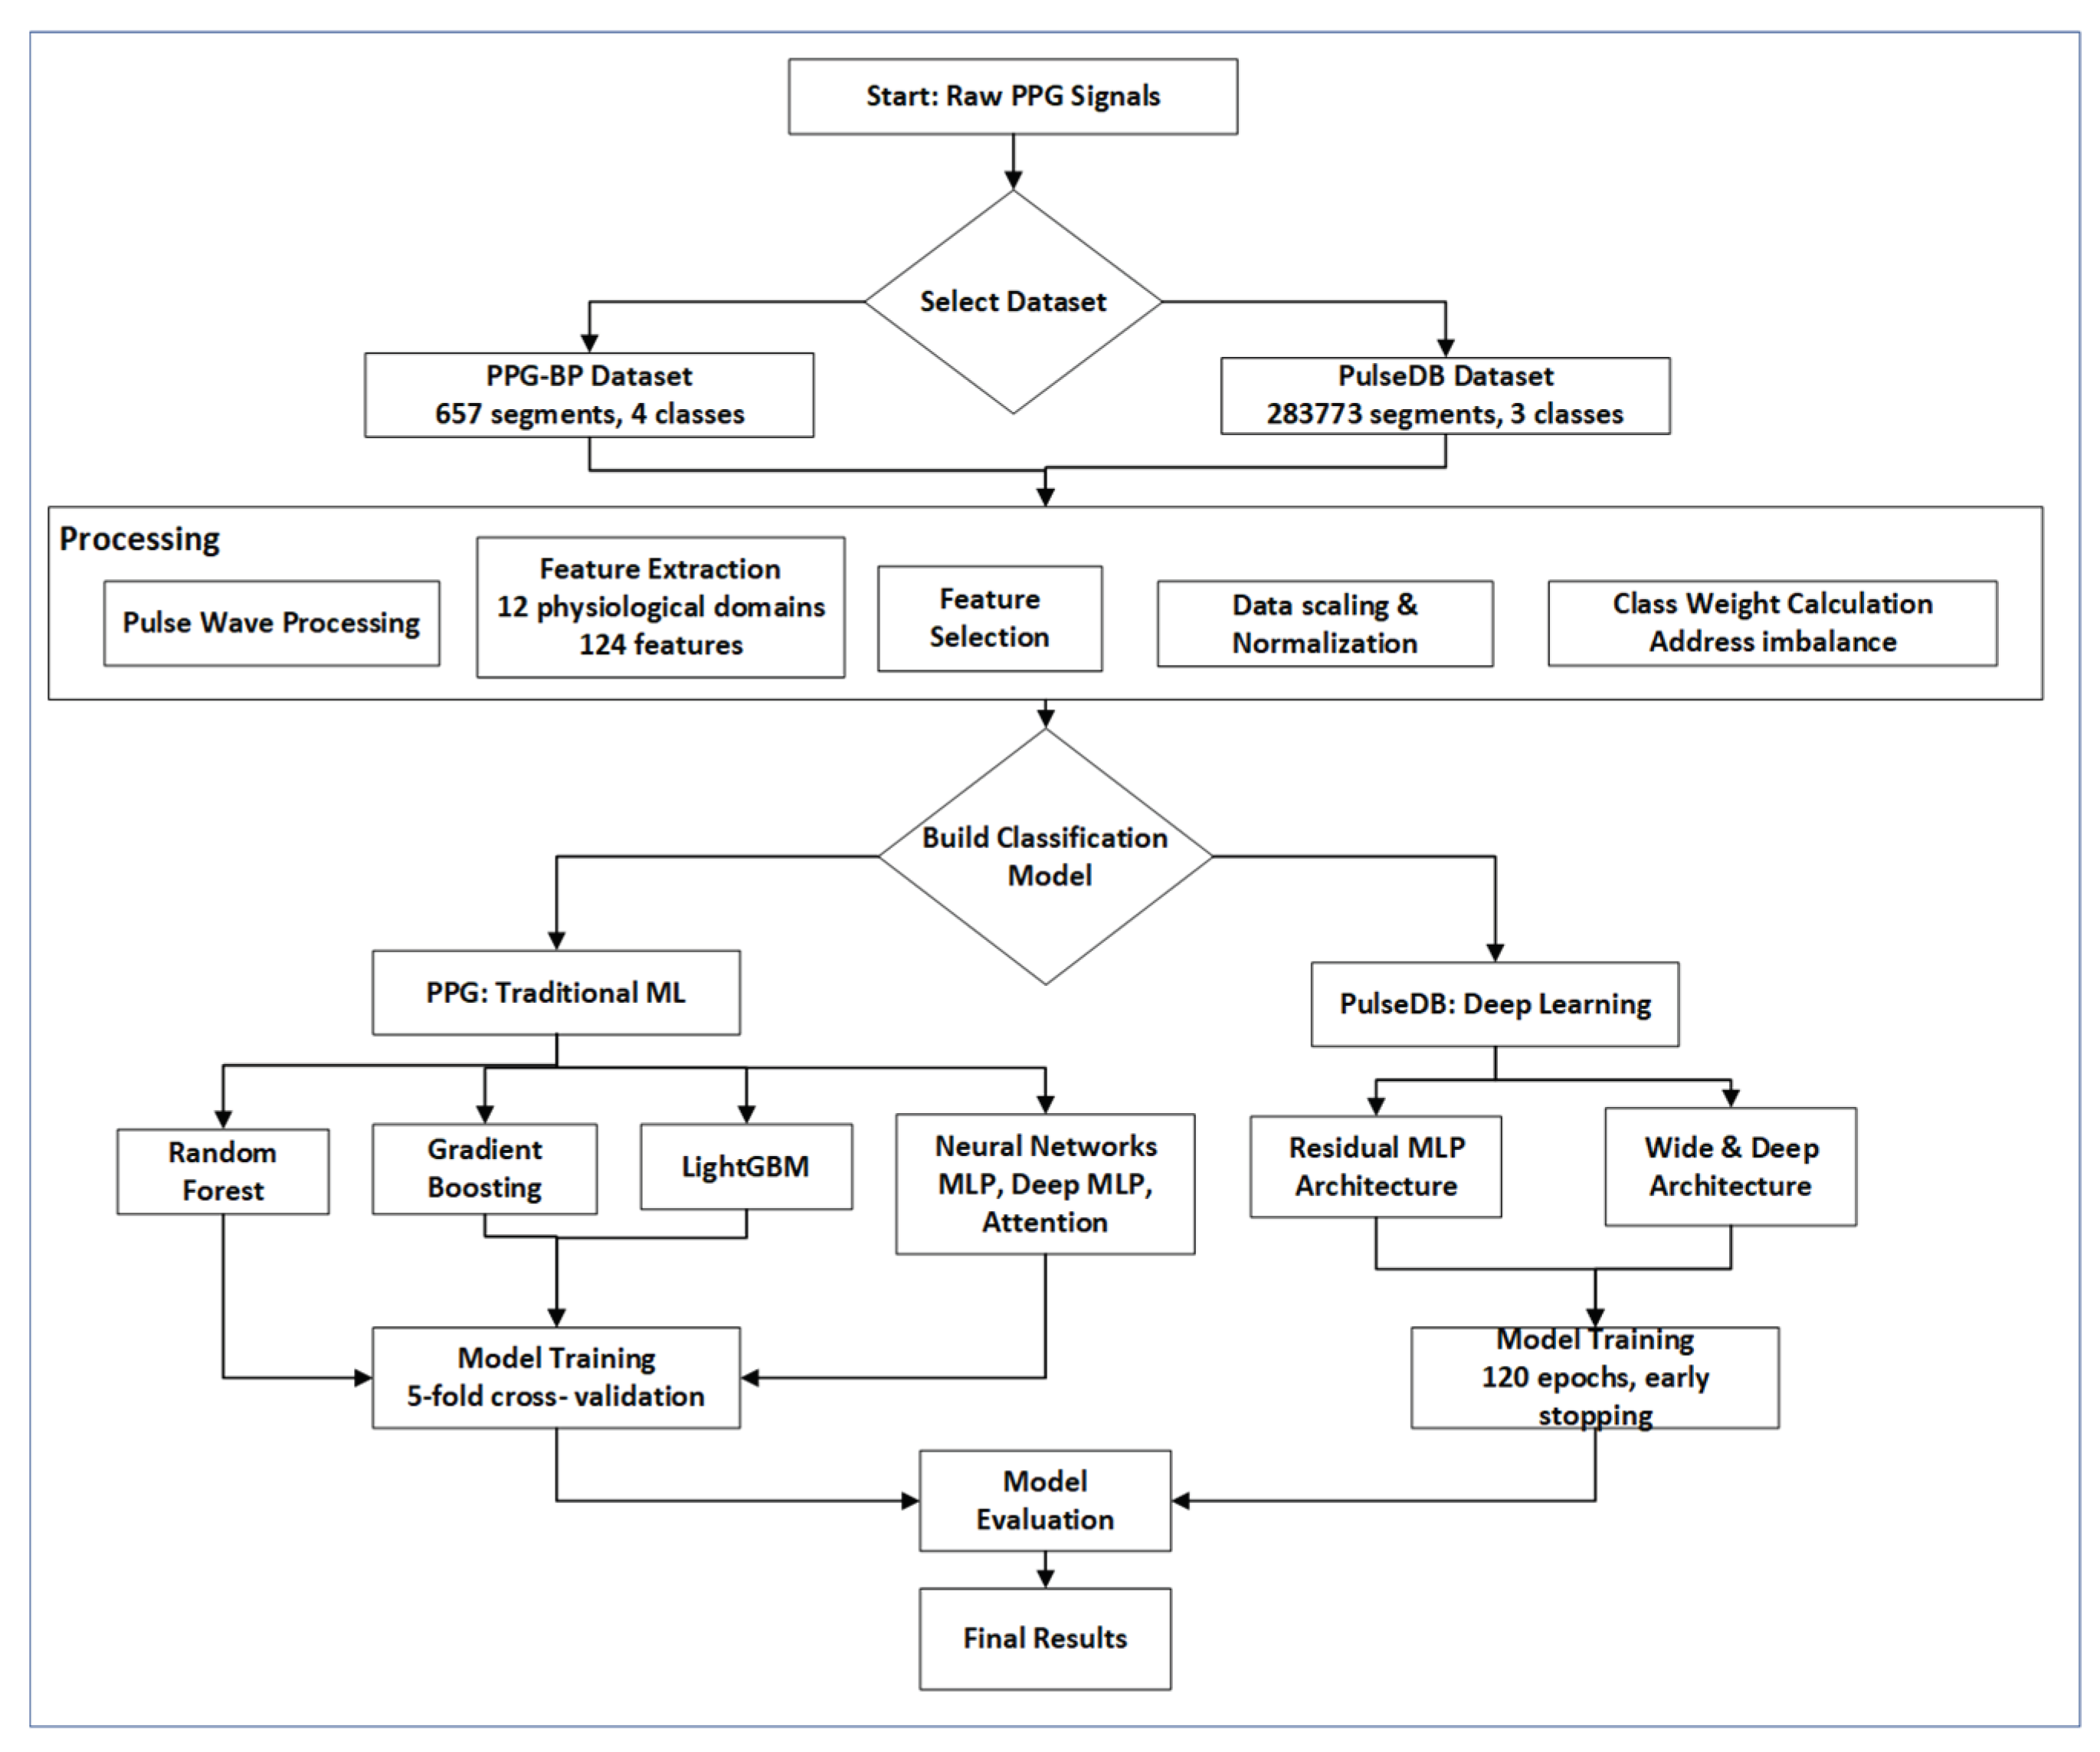
Figure 2.
The pulse waveform (one period) recorded on the finger.
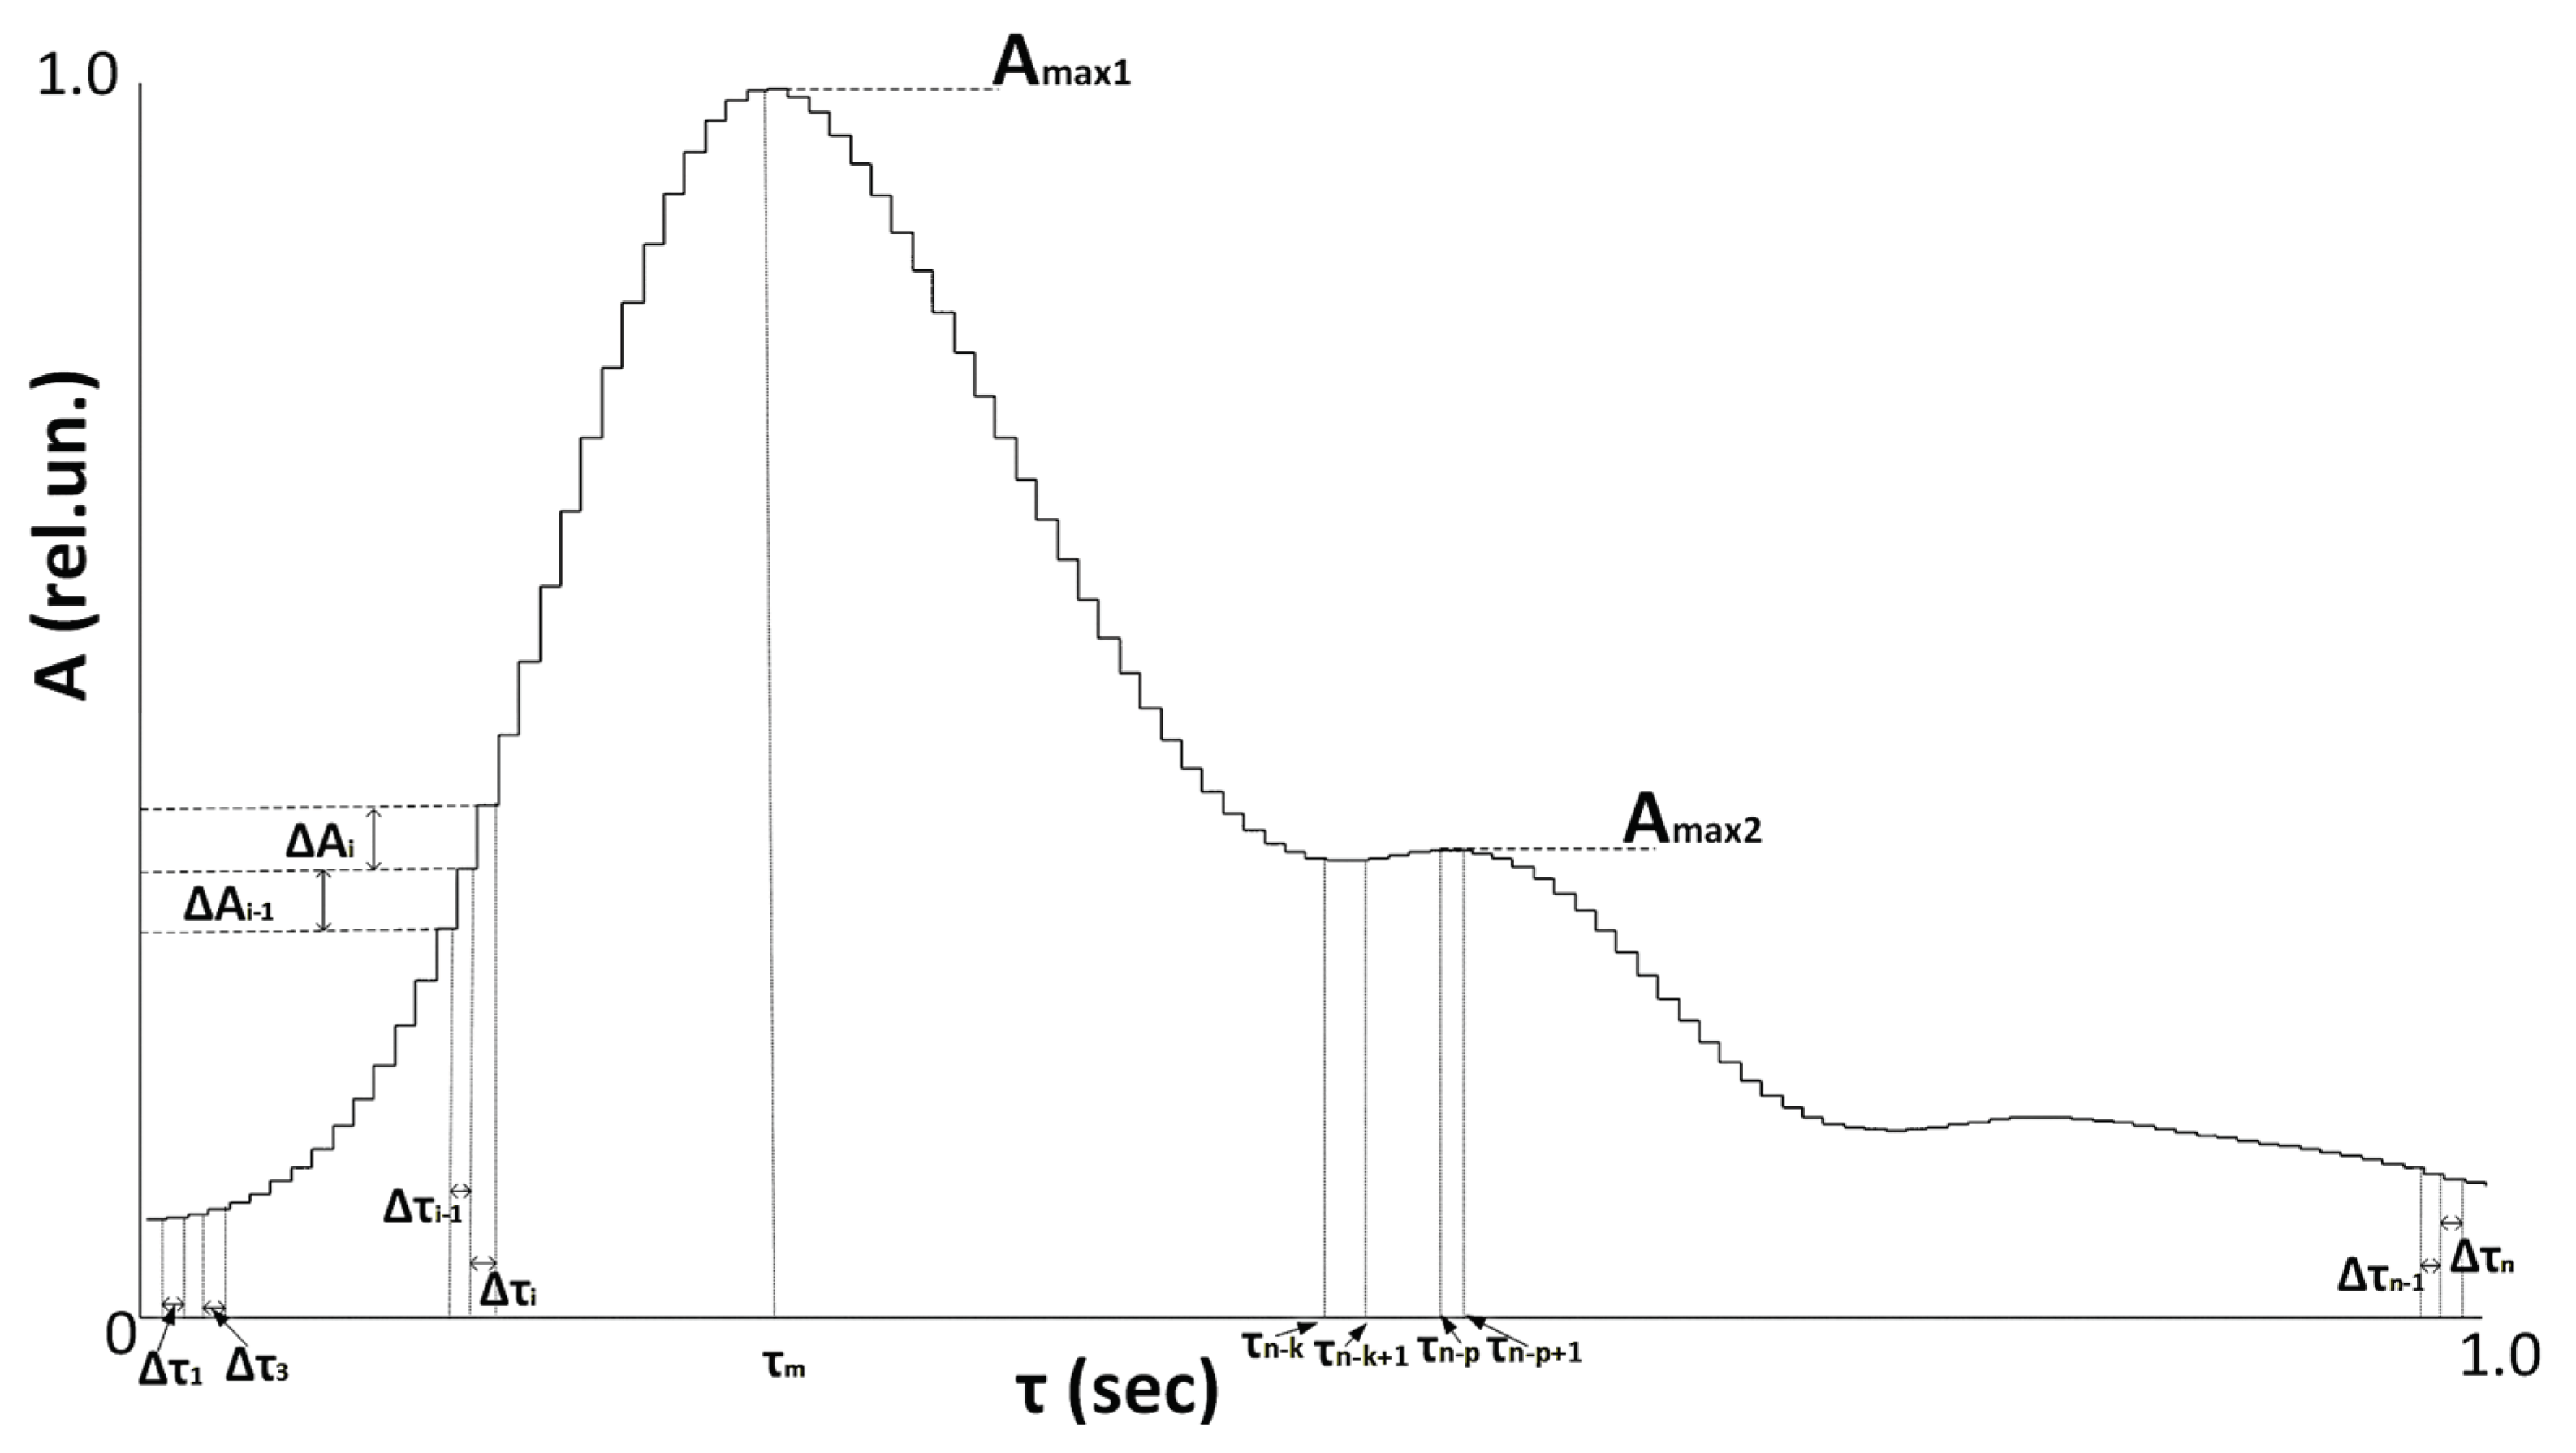
Figure 3.
Residual MLP model architecture.
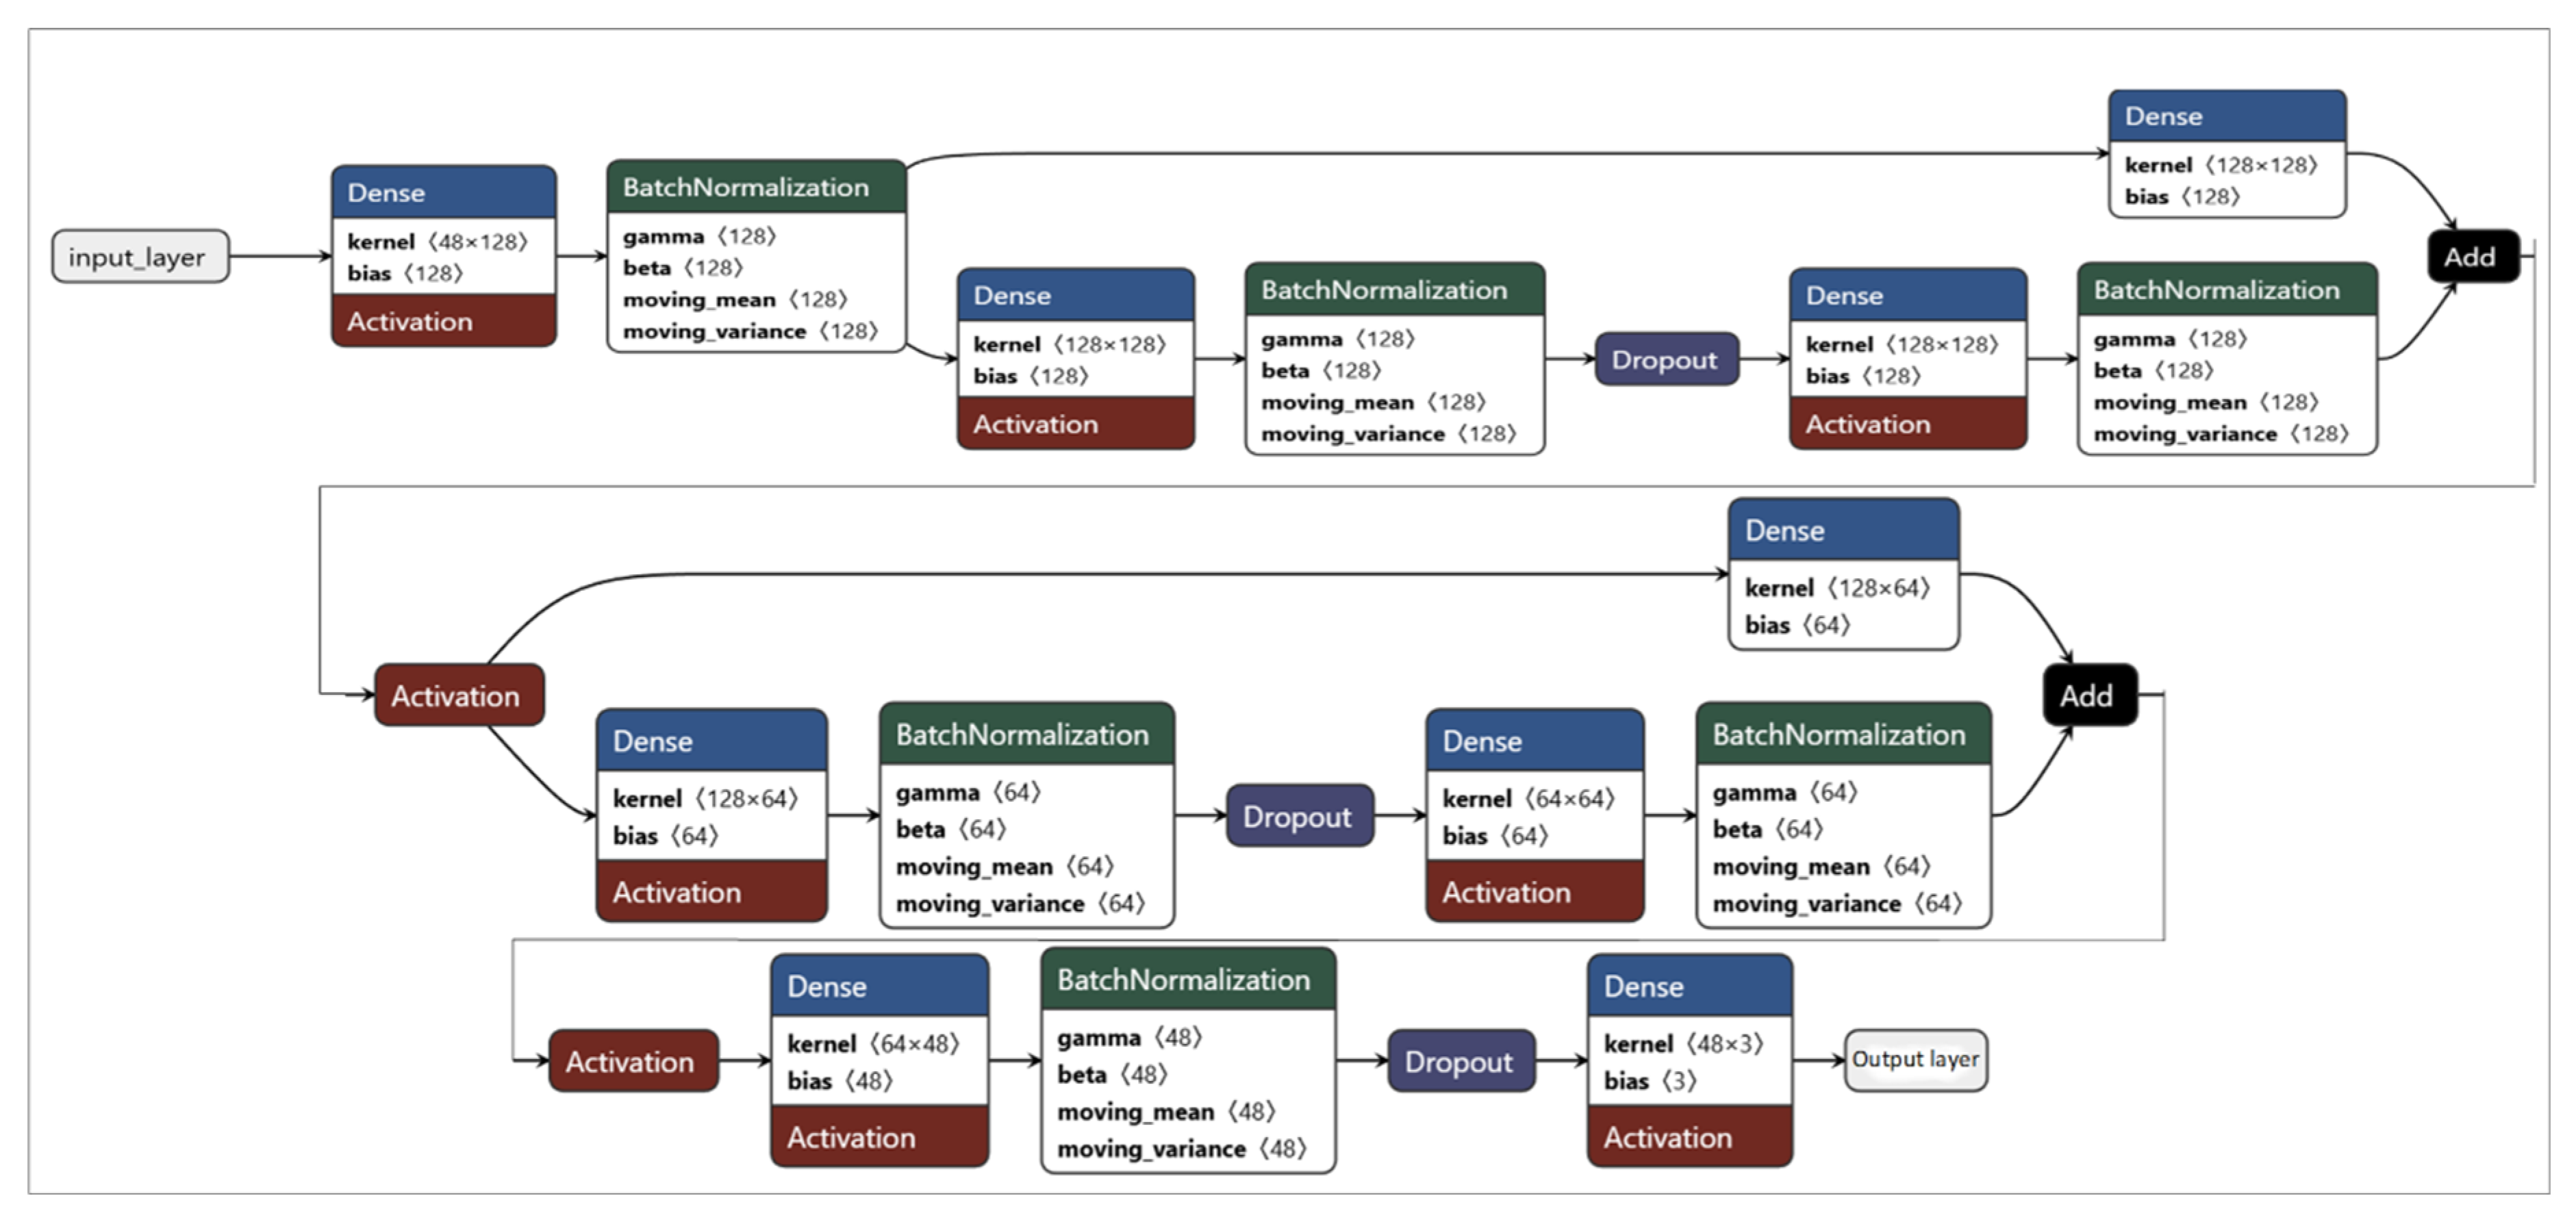
Figure 4.
Wide & Deep model architecture.
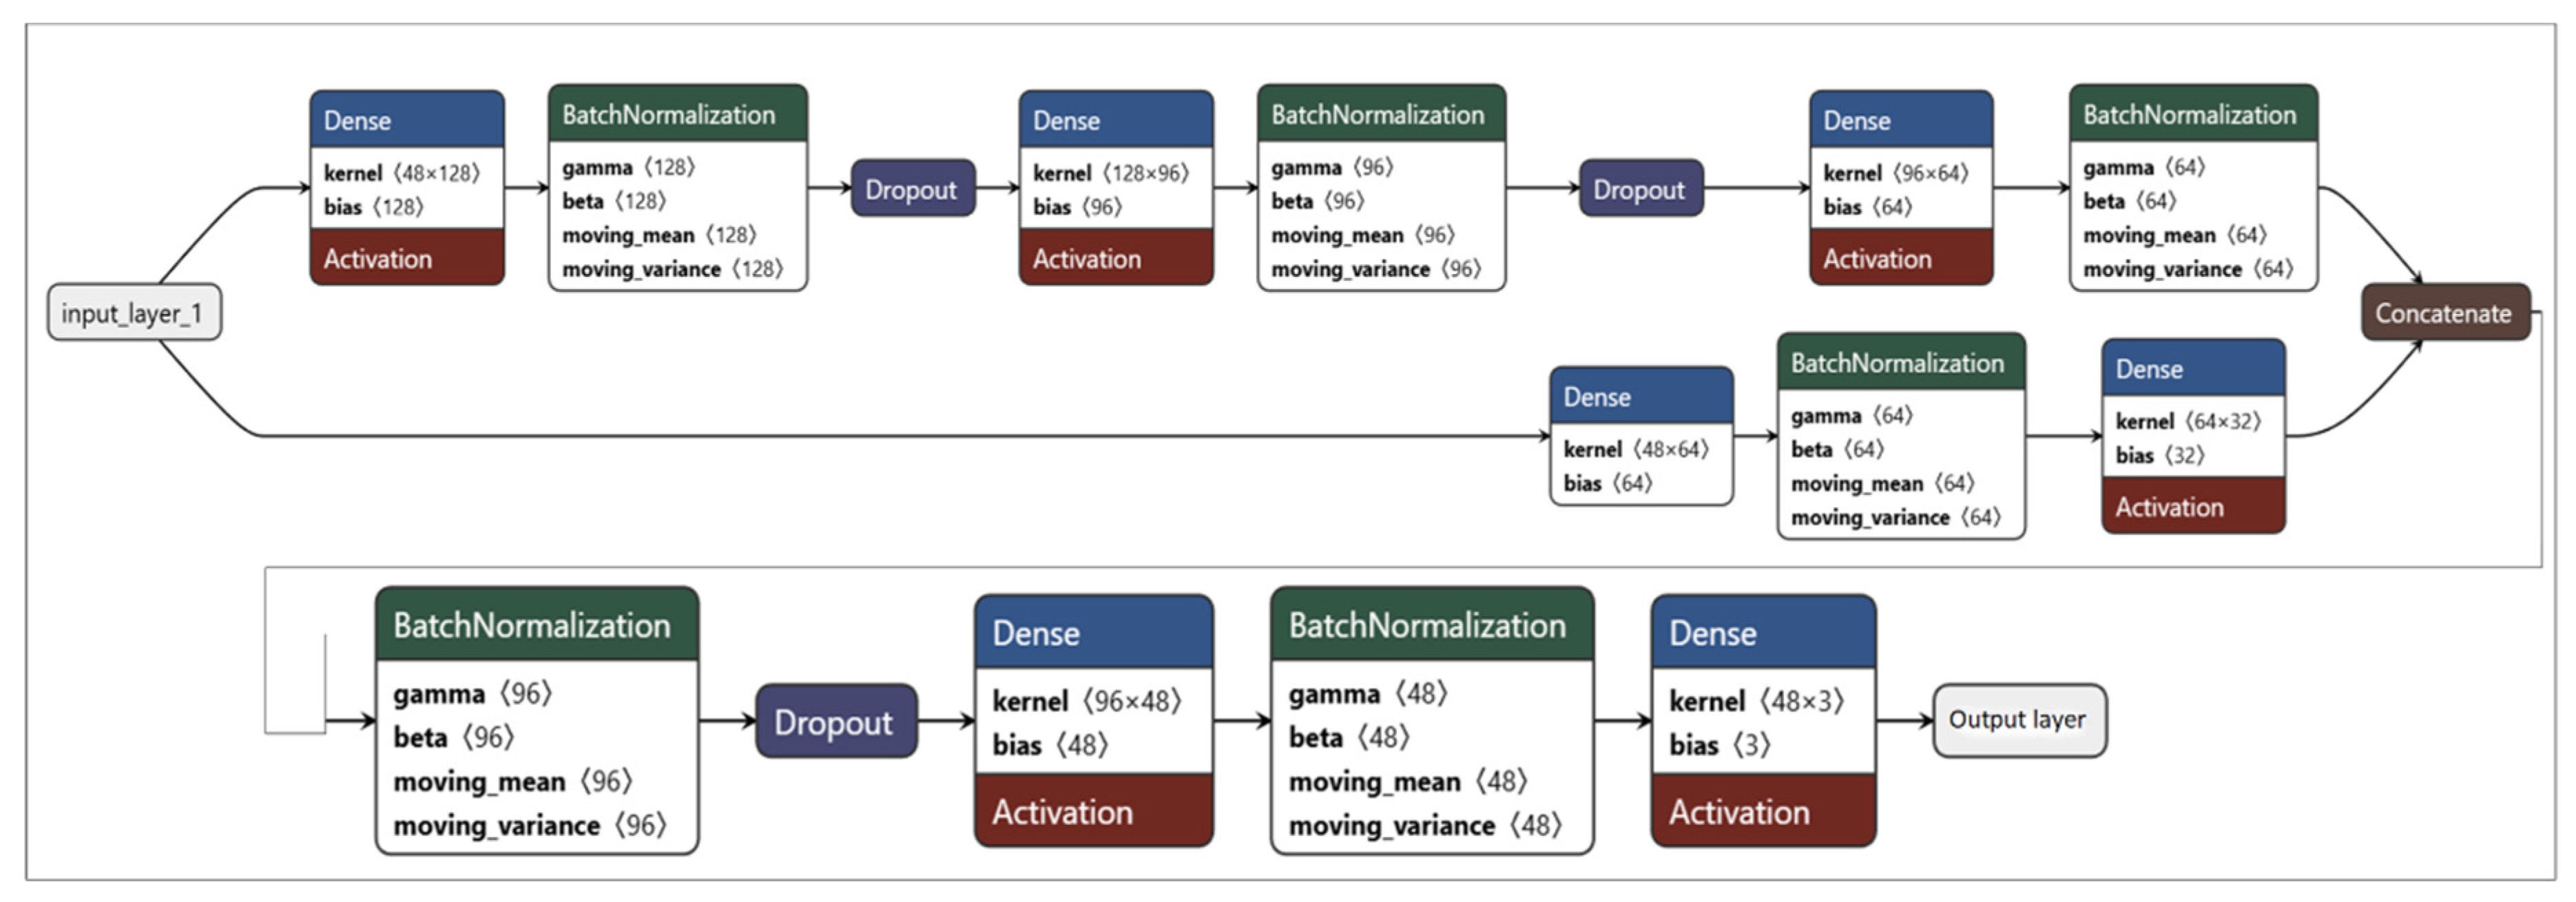
Figure 5.
(a) Training and validation loss of DL models; (b) Training and validation accuracy of DL models.
Figure 5.
(a) Training and validation loss of DL models; (b) Training and validation accuracy of DL models.
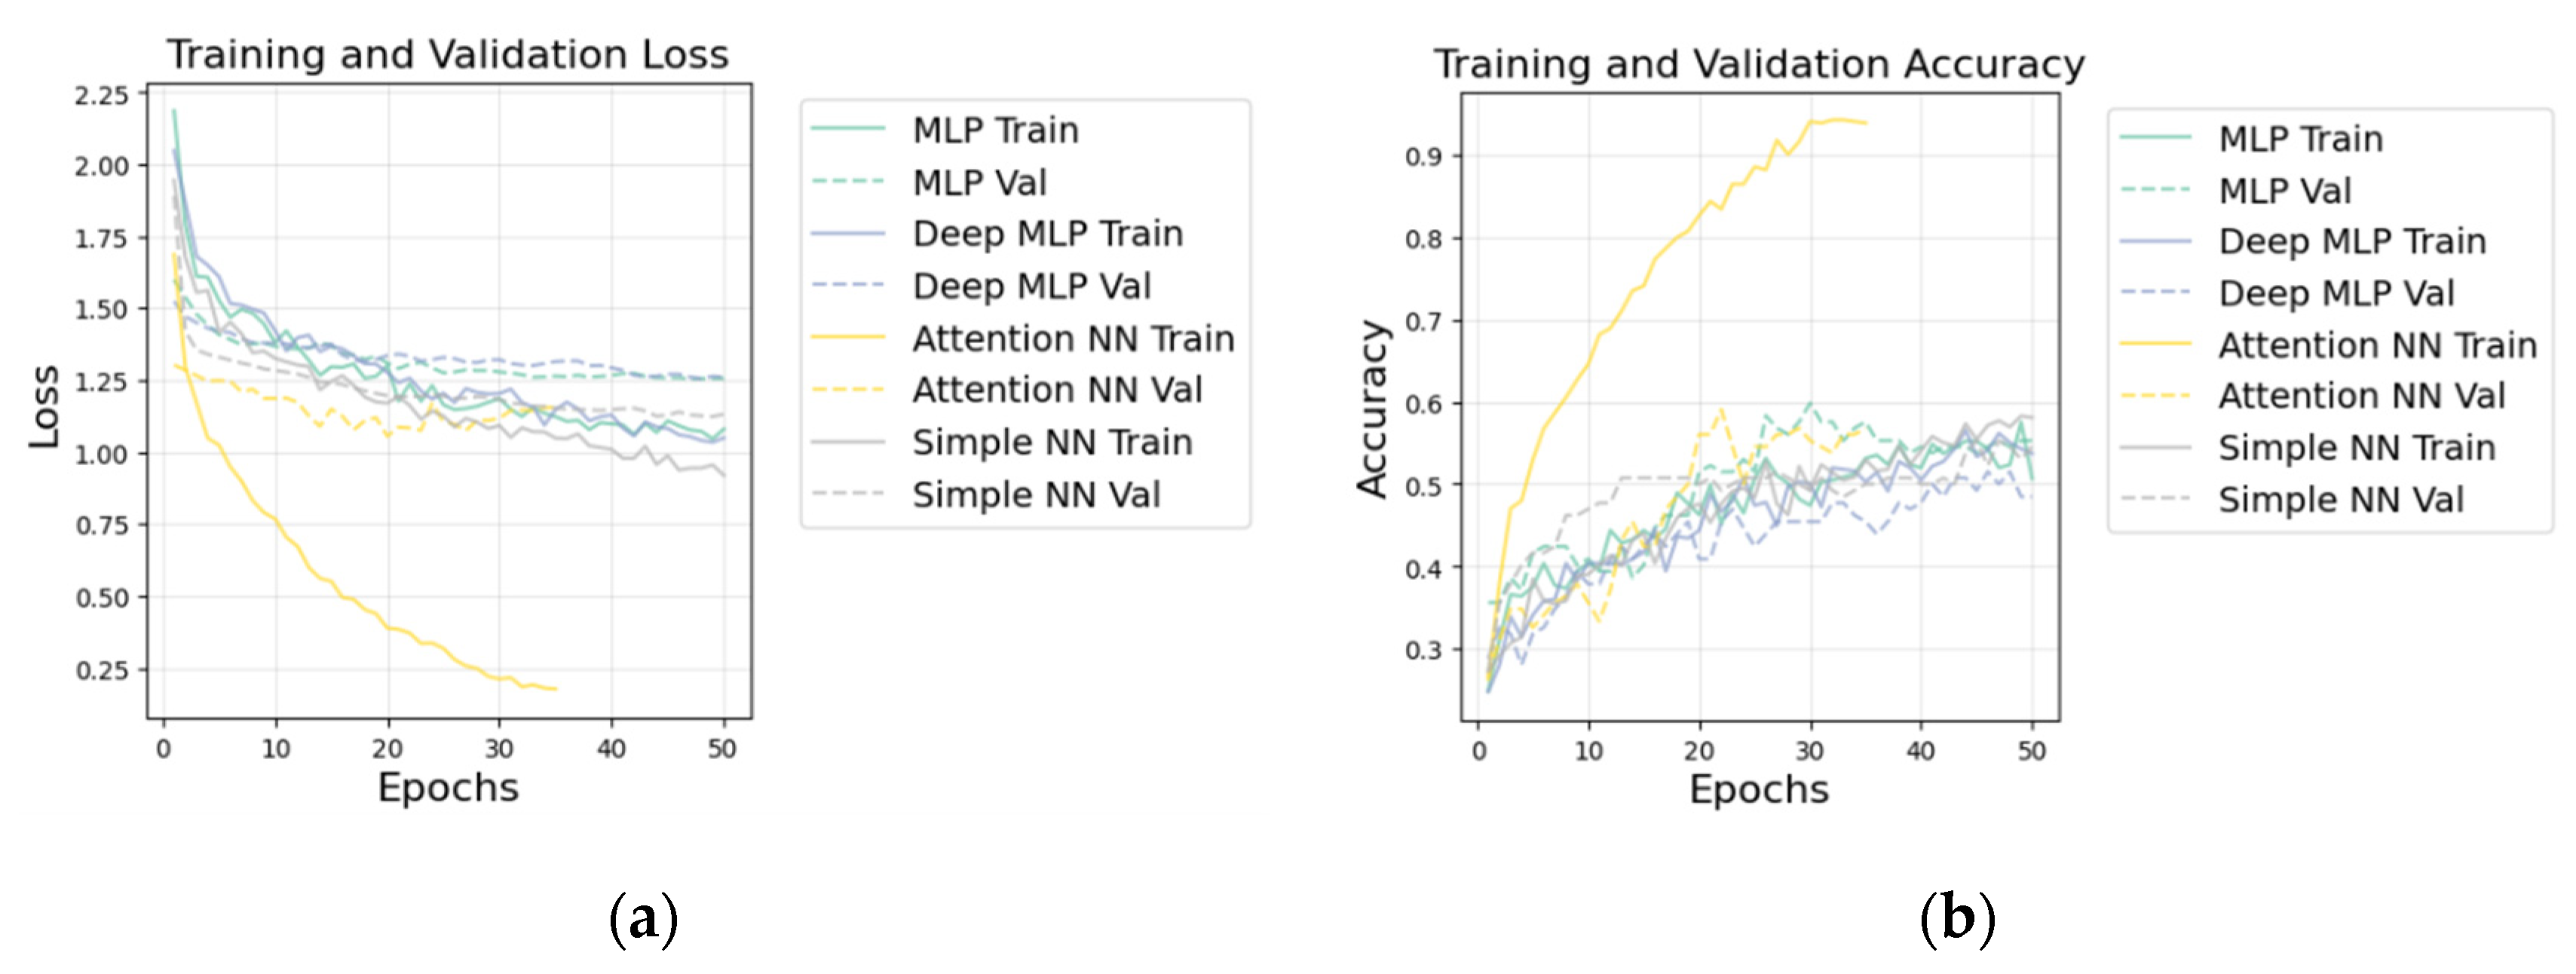
Figure 6.
Confusion matrix of best model (LightGBM).
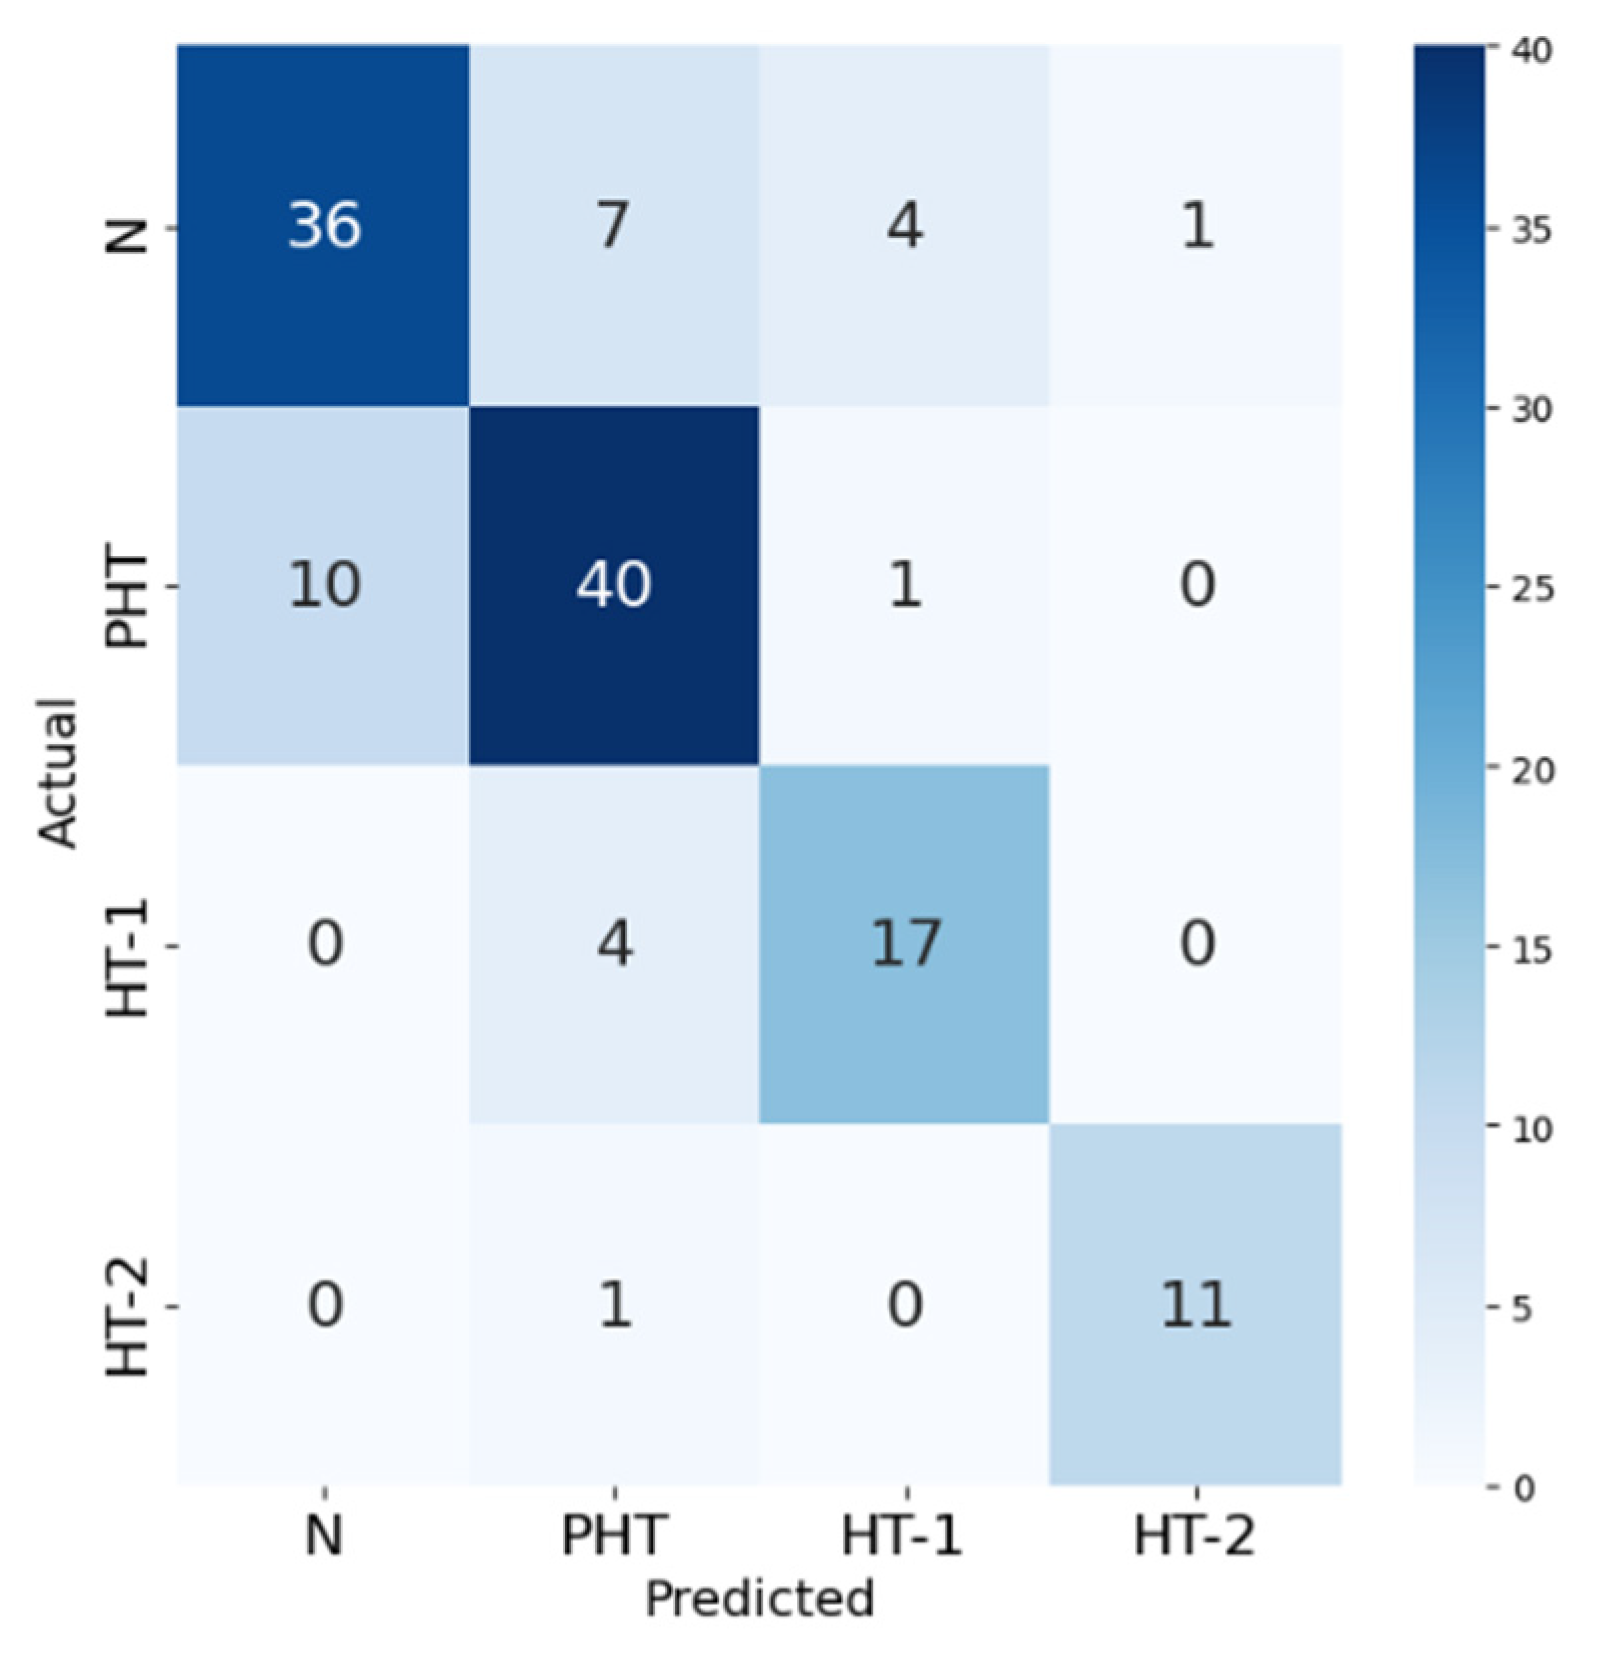
Figure 7.
Confusion matrix of Residual MLP model.
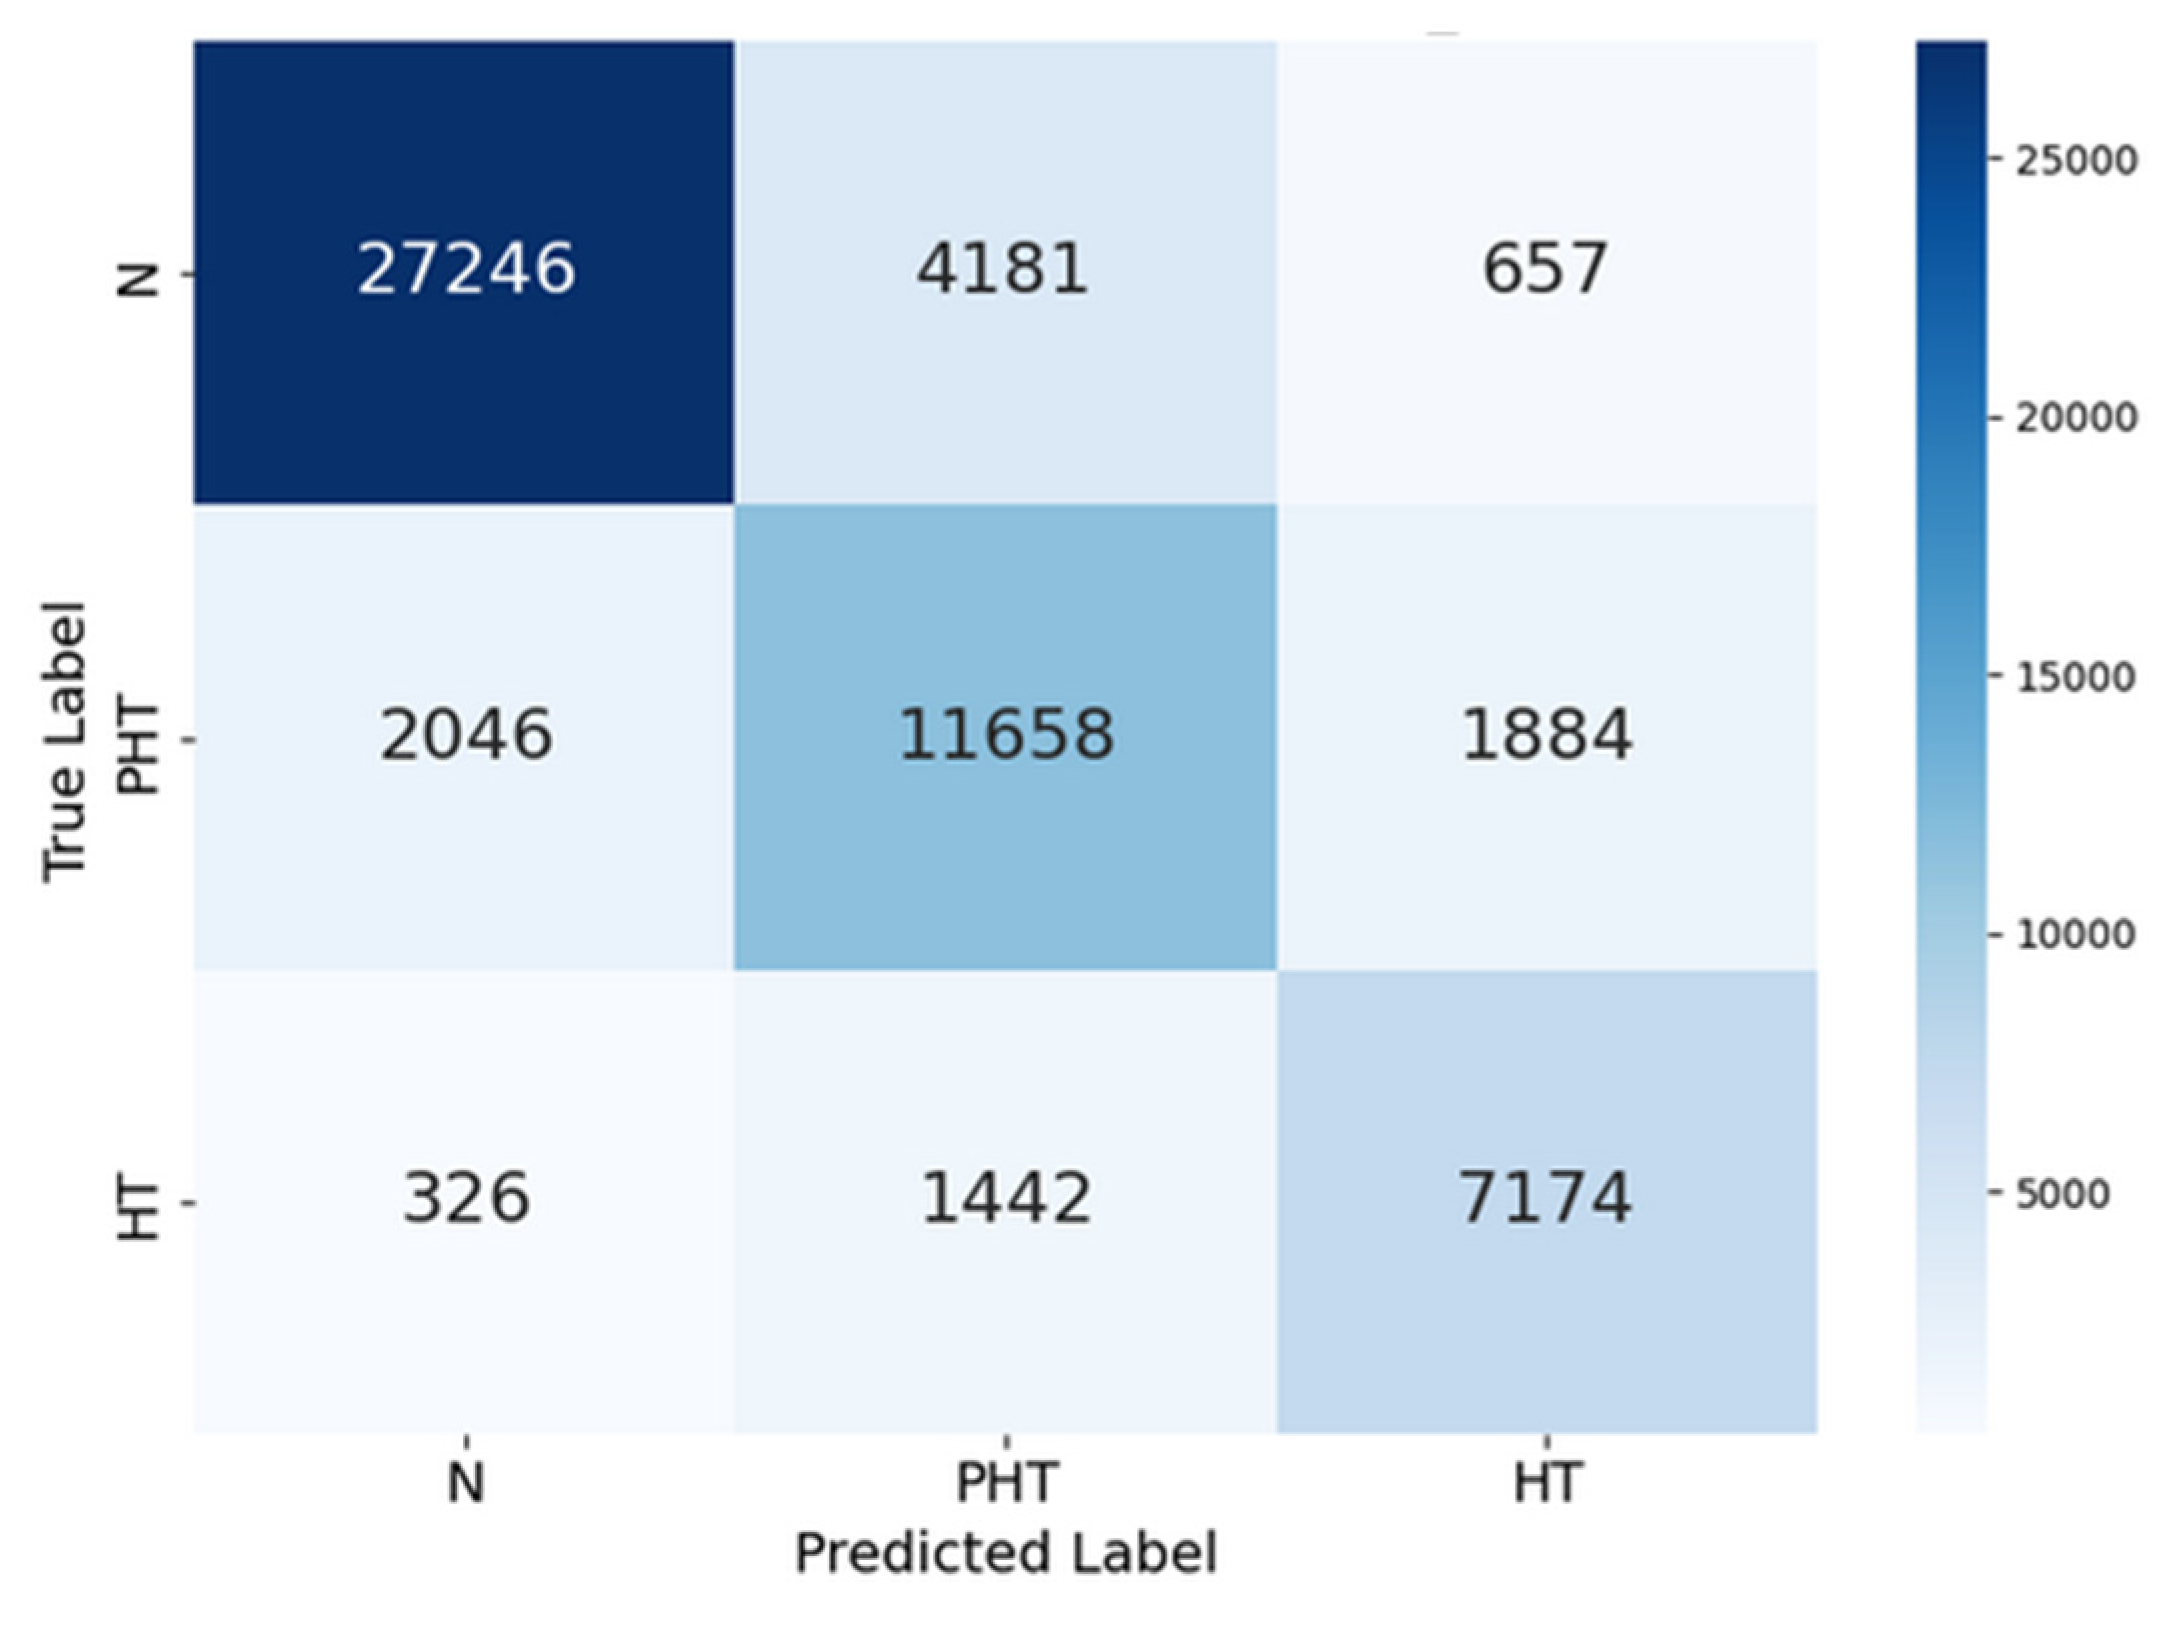
Figure 8.
Confusion matrix of Wide & Deep model.
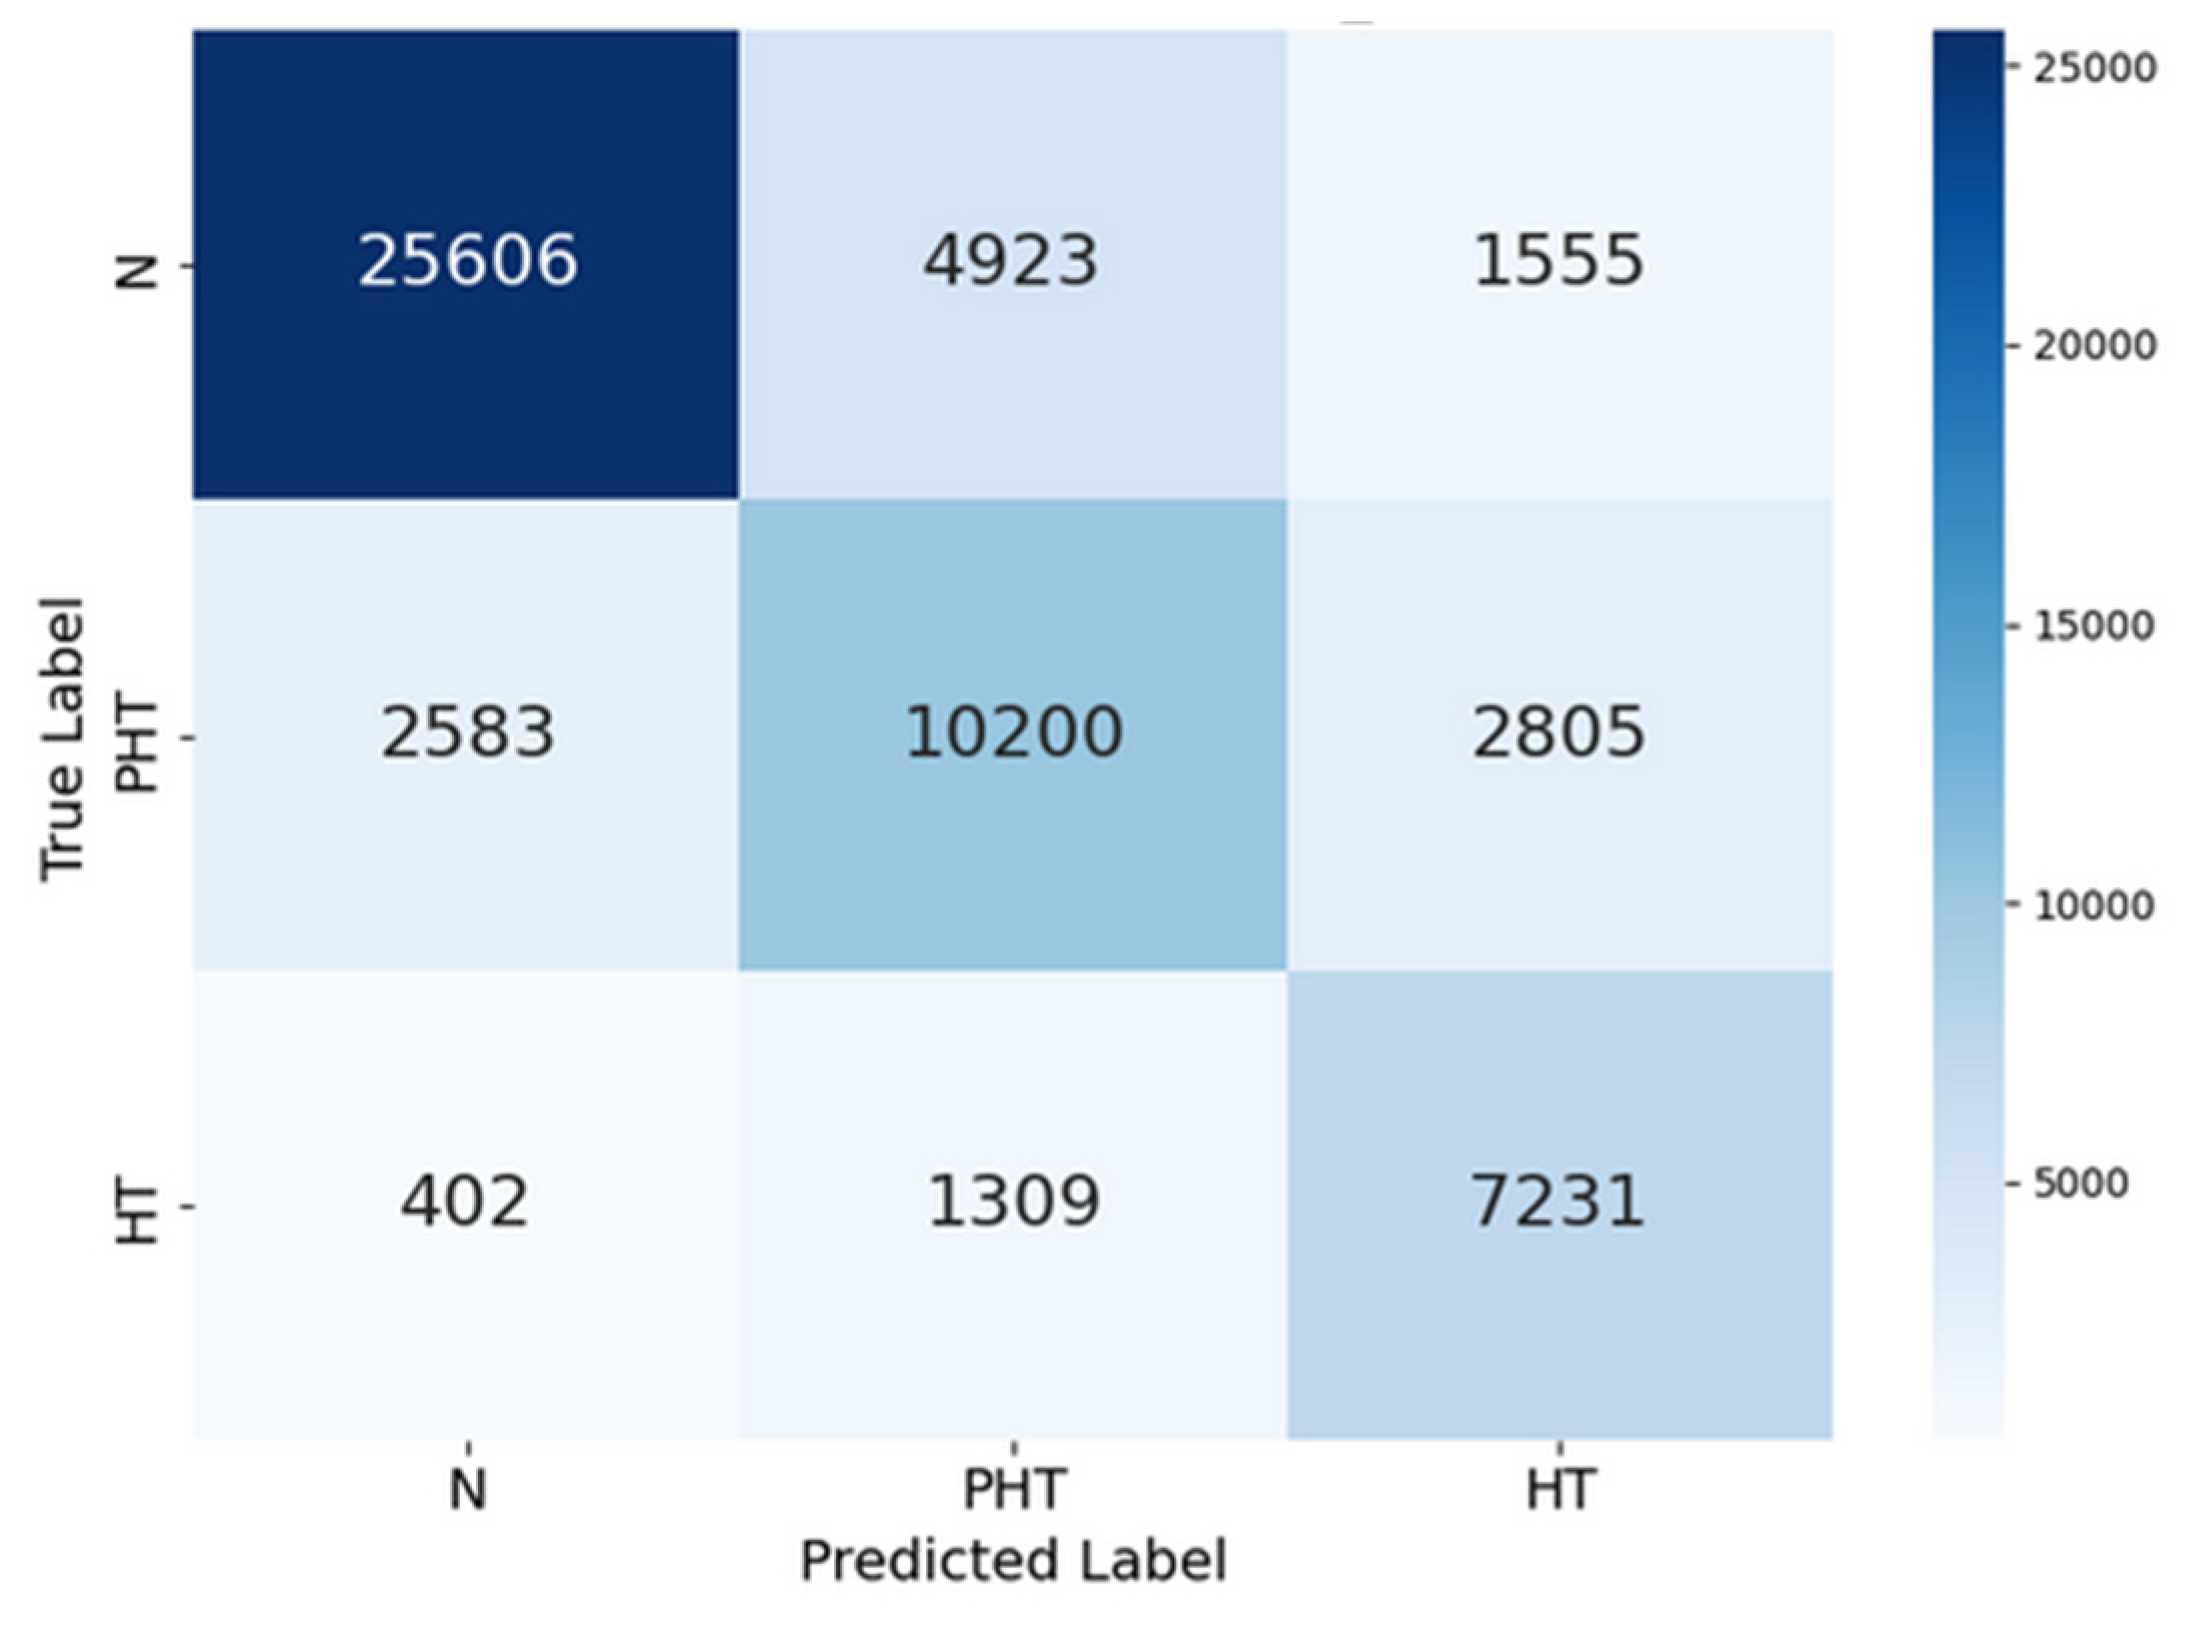
Figure 9.
(a) Training and validation loss of DL models; (b) Training and validation accuracy of DL models.
Figure 9.
(a) Training and validation loss of DL models; (b) Training and validation accuracy of DL models.
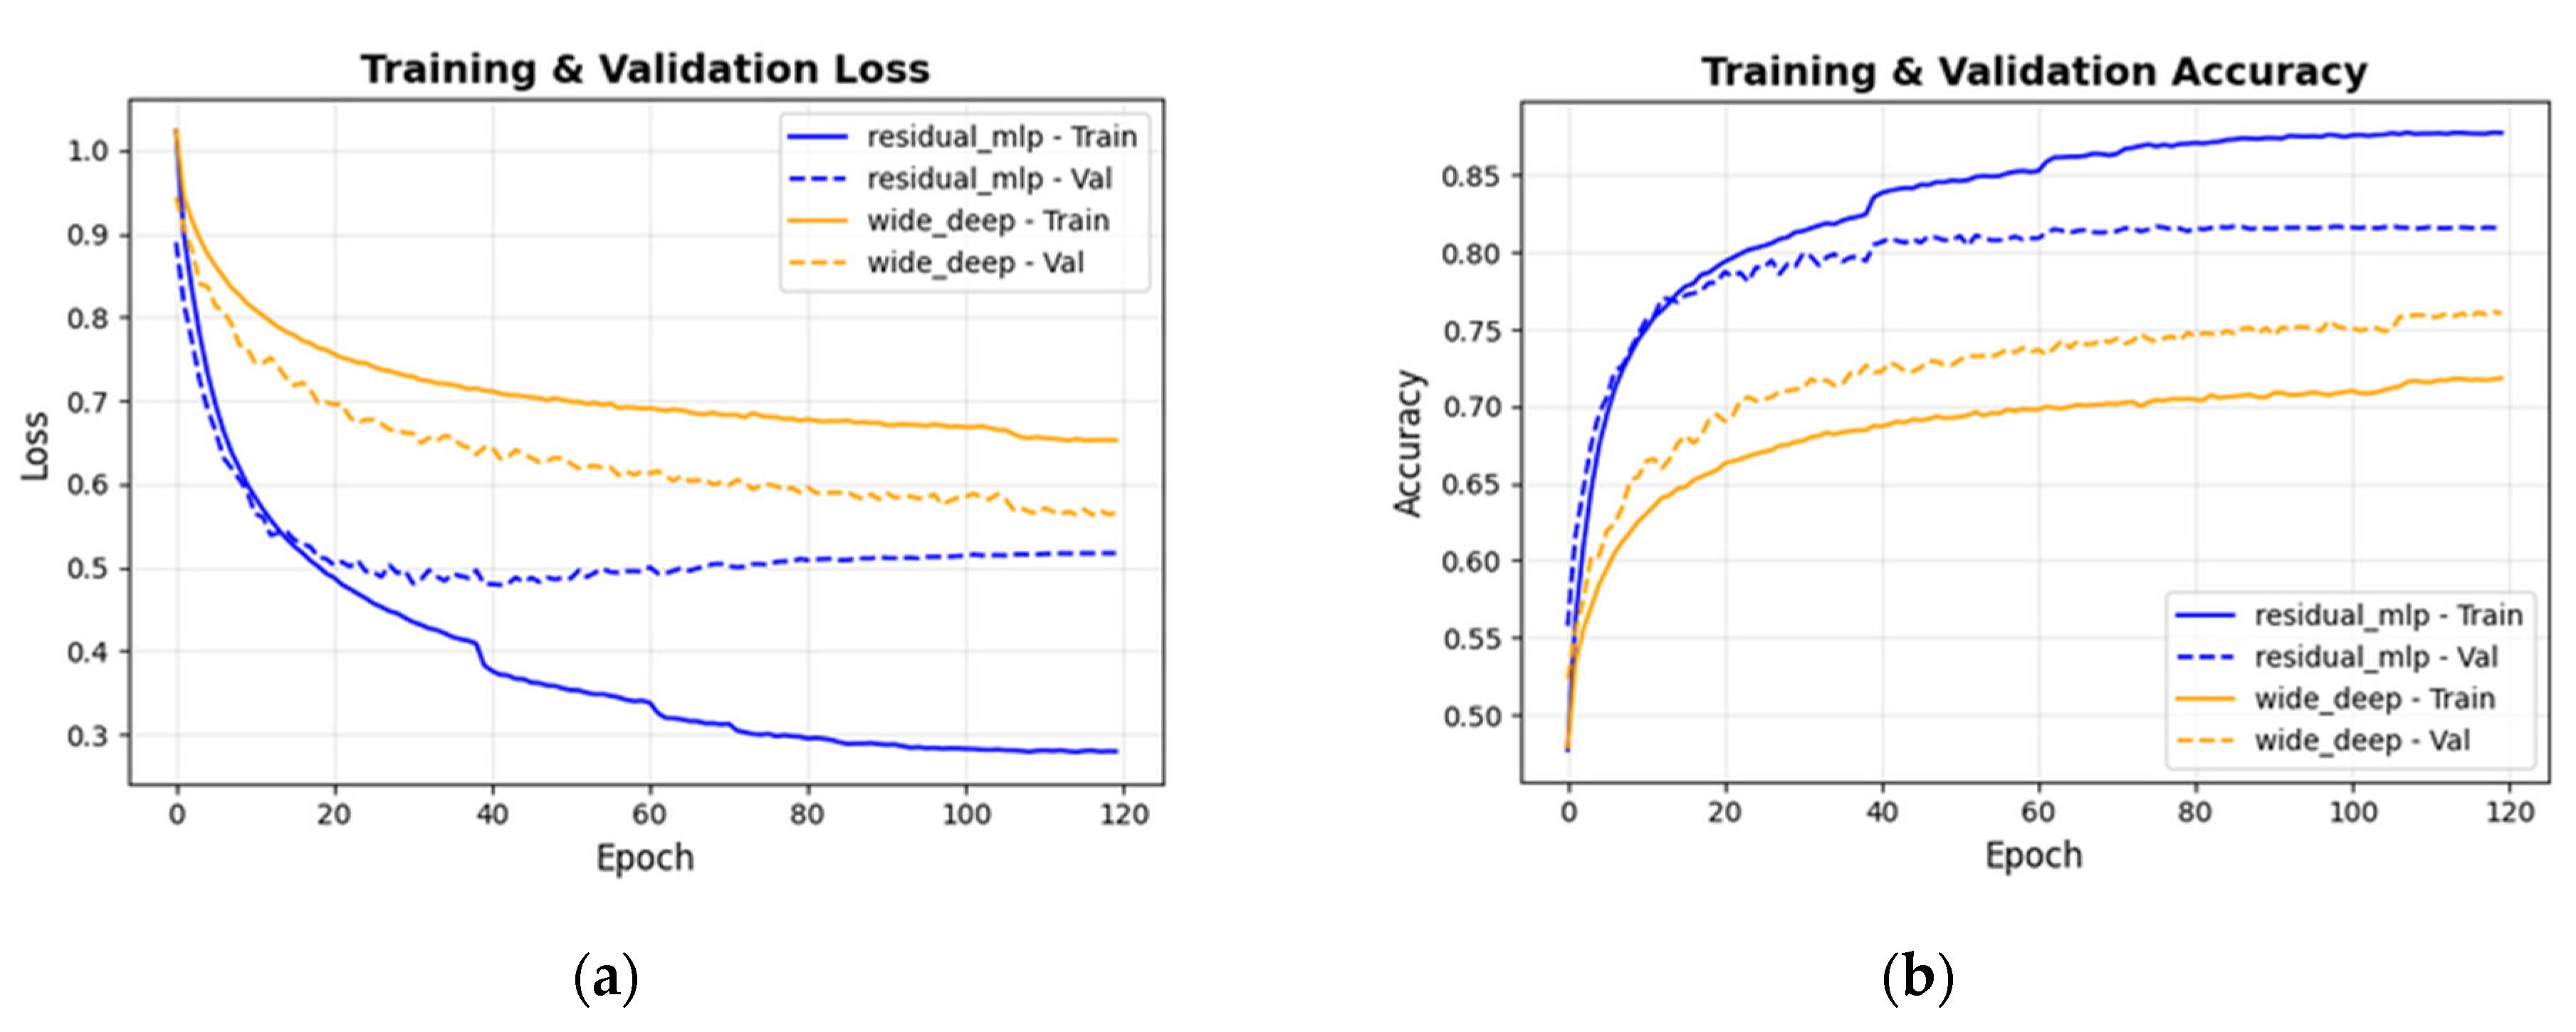

Table 1.
Previous PPG-based hypertension classification studies.
| Study | Study focus | Dataset | Methods | Results | Limitations |
|---|---|---|---|---|---|
| Martínez-Ríos et al. (2022) [17] | Hypertension detection using raw PPG and clinical data | PPG-BP | (SVM) with early/late fusion | 71.42% accuracy, 0.76 F1-score for prehypertension | Binary classification (Normal vs prehypertension) |
| Al Fahoum et al. (2024) [18] | Lightweight model for wearable deployment using raw PPG | PPG-BP | Custom PPG-NET (depthwise separable convolutions) | PPG-NET model achieving 100% across all metrics | Implausible performance, small dataset, requires validation, potential data leakage |
| Abdullah & Kristoffersson (2023) [14] | Hypertension staging with APG features (using raw PPG) | PPG-BP | Decision Tree, Linear Discriminant Analysis (LDA), (Linear Support Vector Machine) LSVM | DT model achieved training accuracy of 100% during cross-validation and accuracy of 96.87% on the test dataset | The authors used systolic BP (SBP) as an input feature, which introduces data leakage and likely overfitting. |
| Promi et al. (2023) [19] | Hybrid spatiotemporal model (using raw PPG and clinical data) | PPG-BP | CNN-GRU hybrid with 10-fold CV | 85.00% accuracy, 0.8608 F1-score | The paper does not explore the individual contributions of the CNN and GRU components, making it unclear whether both are necessary for performance gains. Although 10-fold cross-validation is used, the training and validation loss/accuracy curves (Figure 4 [19]) suggest some overfitting, as validation loss plateaus early while training loss continues to decrease. |
| Yen et al. (2021) [11] | Hybrid models for imbalanced data (using raw PPG) | PPG-BP | ResNetCNN-BiLSTM, Xception-BiLSTM | 76% accuracy 0.45 recall, and a precision of 0.48 for Xception BiLSTM | Poor precision, recall and F1-score, especially for minority classes. |
| Nasir et al. (2024) [12] | Ensemble and stacked models | PPG-BP | CNN, LSTM, BiLSTM with stacking | 71.9% accuracy (LSTM-CNN-RF), 100% with ensembles | Binary classification, potential data leakage, F1-score: 0.66 and recall: 0.60 for LSTM-CNN+SVM |
| Frederick et al. (2023) [20] | Pooling layer optimization (raw PPG) | PPG-BP | AlexNet, ResNet-50, VGG-16, AvgPool_VGG-16 | 80% accuracy with AvgPool_VGG-16 | Severe class imbalance, poor minority class performance (F1-score: 0.75 for HT-1 and 0.10 for HT-2) |
| Tjahjadi & Ramli (2020) [13] | Raw signal classification | PPG-BP | K-Nearest Neighbors (KNN) | 86.7% accuracy, 100% F1 for some binary tasks | Binary classification. Data leakage risk, overfitting with K=1, excessive accuracy for binary tasks. Requires validation. |
| Nour & Polat (2020) [21] | Hypertension type classification | PPG-BP | C4.5 Decision Tree, Random Forest, LDA, LSVM | 99.5% accuracy with tree-based models | Authors used SBP & DBP as input features of DL models and that led to data leakage. |
| Pankaj et al. (2023) [22] | BP classification using Fourier-based spectrograms (PPG raw) | MIMIC-III + Figshare databases | DenseNet-201, AlexNet, GoogLeNet (transfer learning) | 96.51% accuracy with DenseNet-201 across 3 classes of BP stages | High computational cost |
| Wu et al. (2021) [16] | CWT optimization for BP classification (PPG raw) | MIMIC-III (311,000 segments) | Custom PPG-NET (depthwise separable convolutions) | 90% accuracy with cgau1 wavelet, 2.4s segments | Binary classification, lacks clinical granularity |
| Hu et al. (2023) [5] | Automated feature extraction with LightGBM | MIMIC-III (121 records) | LightGBM with Optuna optimization | F1-scores: 0.90-0.97 across tasks | Binary classification. The feature set contains 794 features, which exceeds the number of training records. |
| Tanc & Ozturk (2022) [23] | SST-based classification | MIMIC-II (150 records) | GoogLeNet (transfer learning) | 0.968 F1-score | Binary classification oversimplification, potential data leakage. |
Table 2.
JNC 7 Blood pressure classification.
| Systolic Blood Pressure (mmHg) | Diastolic Blood Pressure (mmHg) | |
|---|---|---|
| Normal (N) | < 120, and | < 80 |
| Prehypertension (PHT) | 120-139, or | 80-89 |
| Hypertension Stage 1 (HT-1) | 140-159, or | 90-99 |
| Hypertension Stage 2 (HT-2) | ≥160, or | ≥100 |
Table 3.
Classification report for LightGBM (best model).
| precision | recall | F1-score | support | |
|---|---|---|---|---|
| Normal (N) | 0.78 | 0.75 | 0.77 | 48 |
| Prehypertension (PHT) | 0.77 | 0.78 | 0.78 | 51 |
| Hypertension Stage 1 (HT-1) | 0.77 | 0.81 | 0.79 | 21 |
| Hypertension Stage 2 (HT-2) | 0.92 | 0.92 | 0.92 | 12 |
| Accuracy | 0.79 | 132 | ||
| Macro avg | 0.81 | 0.82 | 0.81 | 132 |
| Weighted avg | 0.79 | 0.79 | 0.79 | 132 |
Table 4.
Macro-F1 performance of models.
| Models | Macro-F1 |
|---|---|
| LightGBM | 0.813 |
| Gradient Boosting | 0.766 |
| Ensemble model1 | 0.751 |
| Random Forest | 0.723 |
| Deep MLP | 0.563 |
| Simple NN | 0.528 |
| MLP | 0.462 |
| Attention NN | 0.324 |
Table 5.
F1-score performance for LightGBM.
| LightGBM model | F1-score |
|---|---|
| Normal (N) | 0.766 |
| Prehypertension (PHT) | 0.777 |
| Hypertension Stage 1 (HT-1) | 0.791 |
| Hypertension Stage 2 (HT-2) | 0.917 |
Table 6.
Classification report for Residual MLP model.
| precision | recall | F1-score | support | |
|---|---|---|---|---|
| Normal (N) | 0.92 | 0.85 | 0.88 | 32084 |
| Prehypertension (PHT) | 0.67 | 0.75 | 0.71 | 15588 |
| Hypertension (HT) | 0.74 | 0.80 | 0.77 | 8942 |
| Accuracy | 0.81 | 56614 | ||
| Macro avg | 0.78 | 0.80 | 0.79 | 56614 |
| Weighted avg | 0.82 | 0.81 | 0.82 | 56614 |
Table 7.
Classification report of Wide & Deep model.
| precision | recall | F1-score | support | |
|---|---|---|---|---|
| Normal (N) | 0.90 | 0.80 | 0.84 | 32084 |
| Prehypertension (PHT) | 0.62 | 0.65 | 0.64 | 15588 |
| Hypertension (HT) | 0.62 | 0.81 | 0.70 | 8942 |
| Accuracy | 0.76 | 56614 | ||
| Macro avg | 0.71 | 0.75 | 0.73 | 56614 |
| Weighted avg | 0.78 | 0.76 | 0.76 | 56614 |
Disclaimer/Publisher’s Note: The statements, opinions and data contained in all publications are solely those of the individual author(s) and contributor(s) and not of MDPI and/or the editor(s). MDPI and/or the editor(s) disclaim responsibility for any injury to people or property resulting from any ideas, methods, instructions or products referred to in the content. |
© 2026 by the authors. Licensee MDPI, Basel, Switzerland. This article is an open access article distributed under the terms and conditions of the Creative Commons Attribution (CC BY) license (http://creativecommons.org/licenses/by/4.0/).
Copyright: This open access article is published under a Creative Commons CC BY 4.0 license, which permit the free download, distribution, and reuse, provided that the author and preprint are cited in any reuse.


