Submitted:
10 February 2026
Posted:
11 February 2026
You are already at the latest version
Abstract
Artificial intelligence and intelligent algorithmic analysis have become important technical tools for interpreting visual information and modeling human–environment interactions in urban public spaces. As a typical form of visual intervention, public murals and graffiti reshape spatial visual structures, yet their influence on spatial cognition and public behavior has rarely been examined from a computable modeling perspective. This study aims to investigate how visual interventions affect community spatial cognition and public space behavior through quantifiable visual feature modeling.Based on mural and graffiti cases in multiple public spaces in Suzhou, a computational analysis framework is constructed by integrating visual feature encoding, spatial cognition modeling, and behavioral data analysis. Visual attributes such as thematic clarity, compositional order, and color contrast are encoded as feature vectors, while spatial cognition and public behavior are modeled using regression-based analytical methods. A quasi-experimental design with pre- and post-intervention comparisons is adopted, involving 268 participants across residential, campus-adjacent, and transitional public spaces.Experimental results show that structured visual interventions significantly enhance spatial legibility and environmental identification (p < 0.01), while public space usage frequency and behavioral normativity increase by over 20% after intervention. The findings demonstrate that visual interventions can be effectively interpreted and evaluated using computational modeling approaches, providing technical support for intelligent public space design and visual governance.
Keywords:
artificial intelligence
; visual feature modeling
; spatial cognition
; public behavior analysis
; intelligent public space
1. Introduction
Artificial intelligence and intelligent algorithms have expanded the capacity of computational systems to analyze visual information as structured, quantifiable data, enabling more precise investigations of human perception and behavior in the built environment. In urban public spaces, visual configurations constitute a primary channel through which individuals perceive spatial order, recognize functional boundaries, and regulate everyday behavior. As visual interventions become increasingly intentional and systematized, their cognitive and behavioral implications require rigorous analytical examination rather than purely descriptive interpretation.Murals and graffiti are widely employed in community renewal practices; however, prior studies have largely emphasized aesthetic value, symbolic meaning, or qualitative social narratives, offering limited insight into how specific visual attributes operate as information structures that shape spatial cognition and public behavior. This study reframes public art interventions as transformations of spatial visual information and examines their measurable effects on environmental perception and behavioral patterns. Focusing on representative community spaces in Suzhou, the research adopts a quasi-experimental framework that integrates visual feature encoding, spatial cognition modeling, and behavioral observation. Visual attributes are translated into structured feature representations, enabling statistical analysis of their relationships with cognitive and behavioral indicators. By situating the analysis within a specific cultural and urban context, the study establishes a computable pathway linking visual structure, spatial perception, and public behavior, while also providing a basis for future comparative and longitudinal investigations across different cultural settings.
2. Theoretical Foundation
2.1. Public Art and Community Space
As a vital medium embedded within community public spaces, public art has expanded its function beyond aesthetic expression to encompass spatial cognition and behavioral guidance [2]. By reconstructing spatial information structures through visual language, public art creates an interdependent relationship among environmental perception, emotional attitudes, and behavioral choices. Its influence follows a progressive pathway of "visual intervention—cognitive regulation—behavioral feedback," as illustrated in Figure 1.
From a functional hierarchy perspective, public art simultaneously fulfills multiple roles within community spaces: reinforcing spatial recognition at the physical level, strengthening emotional connections to the environment at the psychological level, and providing implicit order cues at the behavioral level. This achieves flexible guidance of public space usage patterns [3].These functions are not isolated but exhibit a layered, progressive structure from surface to depth. Their hierarchical mapping within community spaces is illustrated in Figure 2.
2.2. Visual Intervention and Spatial Cognition
Visual interventions reconstruct spatial information structures through organized visual language, influencing individuals' perception of spatial organization and order. Murals and graffiti utilize color, composition, and thematic narratives to reinforce spatial cues, making environmental information more perceptible and understandable [4]. Quantitatively, spatial cognitive intensity can be expressed as a function of visual elements and individual perceptual weighting, represented by the following equation:
where represents the comprehensive spatial cognition level of individual , denotes the perceived intensity of visual element category , is the cognitive weight assigned to the corresponding visual element, and is the number of visual element categories[5].
Visual intervention reduces cognitive load in spatial comprehension by enhancing the recognizability of spatial cues. This relationship can be expressed as:
where represents the cognitive load level, and is a constant preventing the denominator from becoming zero [6].
As spatial cognition improves, individuals' spatial direction judgments and functional understanding stabilize, thereby enhancing environmental recognition. This trend can be approximated as:
where represents environmental identification, and and denote regression coefficients.
2.3. Public Behavior and Its Influencing Factors
Treating the level of public behavior as a function of visual intervention intensity and spatial cognition state, its expression is:
where denotes the comprehensive level of public behavior, represents the individual spatial cognition score, is the visual intervention intensity indicator, and and are the corresponding influence coefficients [7].At the group level, significant differences exist in the distribution characteristics of public behavior under different visual intervention conditions. The overall trend of these changes can be described by behavioral density functions:
where denotes the probability density distribution of behavioral levels, represents the observed behavioral value of the th sample, and is the kernel function [8]. Based on this model, the distribution patterns and magnitude of change in public behavior metrics under different visual intervention conditions are compared, as shown in Figure 3. The violin plot depicts behavioral distribution characteristics, while the overlaid area plot illustrates overall trends, thereby intuitively reflecting the impact of visual interventions on the intensity and stability of public behavior.
3. Research Methodology
3.1. Research Design
This study employs a quasi-experimental design based on real-world scenarios, focusing on six public spaces in Suzhou featuring implemented mural graffiti. These spaces encompass three typical settings: residential communities, areas surrounding campuses, and public passageways (see Figure 4). The research utilizes pre- and post-intervention periods as control conditions, establishing a temporal comparison framework [9].The total sample size was N=268, comprising 46.6% residents, 31.3% students, and 22.1% other regular users. Through standardized visual element coding and behavioral observation metrics, spatial cognition and public behavior changes were systematically collected and analyzed to ensure data comparability and statistical validity across different scenarios.
3.2. Data Collection
Data collection was divided into three categories: First, wall art images were structured using a visual element coding table, covering nine metrics including thematic clarity, compositional order, and color contrast. Second, fixed-point video observation recorded usage frequency and dwell time across 36 observation periods totaling 216 hours [10].Third, a structured questionnaire was distributed, yielding 268 valid responses. Responses assessed spatial legibility, environmental identification, and behavioral inclinations, ensuring diverse sample origins and rich data dimensions.
For visual feature encoding, each mural or graffiti panel was treated as an image-level unit. Three trained coders independently rated the nine visual attributes on a five-point semantic differential scale, anchored by descriptors such as “low–high thematic clarity” and “disordered–highly ordered composition.” Ratings were averaged across coders to obtain a nine-dimensional feature vector for each image, which was then z-score normalized prior to statistical modeling. Inter-rater reliability was examined using intraclass correlation coefficients, all exceeding 0.78, while internal consistency for the composite visual structure index achieved a Cronbach’s α of 0.84, indicating satisfactory measurement stability for subsequent regression analyses.
3.3. Data Analysis
Data analysis employed a multi-level statistical approach. Descriptive statistics and normality tests were conducted for each variable to examine data distribution characteristics. Correlation analysis and linear regression models assessed relationships among visual intervention intensity, spatial cognition indicators, and public behavior variables [11]. Significance testing (p<0.05) evaluated pre- and post-intervention differences to validate the statistical efficacy and stability of visual interventions on public behavior changes.
4. Research Findings
4.1. Impact on Spatial Legibility
Quantitative comparative analysis of community spatial legibility before and after mural interventions (see Table 1) revealed significant improvements in path recognition, functional differentiation, and spatial order perception. Path recognition and order perception showed the most pronounced enhancements (p<0.01), indicating that structural murals effectively enhance spatial information legibility.
4.2. Impact of Environmental Identification
Building upon the spatial legibility analysis, we further examined the impact of wall graffiti on users' environmental identity. Environmental identity was measured primarily through emotional identification, sense of place, spatial memory, and environmental satisfaction, with results presented in Table 2.
4.3. Impact of Public Space Usage Behavior
At the behavioral level, a comparative analysis of public space usage behavior before and after the mural intervention was conducted, primarily examining indicators such as usage frequency, average dwell time, interaction occurrence rate, and behavioral compliance. Results are presented in Table 3.
5. Discussion of Results
Mural graffiti, as a structured visual intervention, reinforces a coherent cognitive–affective–behavioral chain in community public spaces. Spatial legibility indicators increased by 0.44–0.73, with the largest gain in perceived spatial order, while spatial memorability rose from 3.09 to 3.88, confirming that thematically coherent murals enhance both comprehension and attachment. Behavioral metrics likewise improved, with usage frequency and dwell time increasing by 22.2% and 35.6%, and normative behavior scores rising by 0.56, suggesting that non-coercive visual cues can stabilize everyday conduct. Nonetheless, the absence of a parallel non-intervention control group and the focus on short-term post-intervention responses limit causal and temporal generalization, highlighting the need for longitudinal and cross-cultural extensions of this framework.
6. Conclusions
Visual interventions in community public spaces can be systematically interpreted as structured modifications of spatial information that influence cognitive perception and behavioral patterns. By modeling visual attributes as quantifiable features and establishing explicit relationships among visual structure, spatial cognition, and public behavior, a formal analytical pathway is constructed to explain how murals and graffiti reshape spatial legibility and environmental identification. Empirical results demonstrate consistent improvements in spatial comprehension, place recognition, and public space usage stability following visually ordered interventions, indicating that visual structure plays a measurable role in guiding behavioral outcomes. The contribution lies in translating visually driven environmental effects into a computable analytical framework, enabling objective evaluation beyond purely descriptive or qualitative interpretations. Nevertheless, limitations remain in the granularity of visual feature representation and the temporal resolution of behavioral observations, which constrain the exploration of long-term dynamic effects. Future efforts may extend the framework by incorporating finer-grained visual descriptors, automated feature extraction, and longitudinal data analysis to support scalable assessment and adaptive optimization of visual interventions in complex urban environments.
References
- Jeong H, Hu Y. The role of public murals in street vitality[J]. Cities, 2025, 165: 106085.
- Hespanhol L. Designing media architecture for digital placemaking on campus: Motivation, implementation and preliminary insights[C]//Proceedings of the 6th Media Architecture Biennale Conference. 2023: 38-46.
- Đurić I, Medić S, Ecet D, et al. Enhancing public space experiences: Evaluating perception of digital and digitized sculptures in augmented reality[J]. Applied Sciences, 2025, 15(2): 870.
- Li L, Shukor S F A, Mat Noor M S B, et al. The Impact of Virtual Immersive Public Art on the Restorative Experience of Urban Residents[J]. Sustainability, 2024, 16(21): 9292.
- Lei X. Digital Technology Driven Transformation Of Public Art Forms: From Interactivity To Immersive Experience[J]. Journal of Roi Kaensarn Academi, 2024, 9(12): 2106-2119.
- Jiang X, Wu Q, Jia Q, et al. Research on the influential elements of user-centred digital art design for public space[J]. Scientific Reports, 2025, 15(1): 15252.
- Gorichanaz T. Engaging with public art: An exploration of the design space[C]//Proceedings of the 2020 CHI conference on human factors in computing systems. 2020: 1-14.
- Yuhan N, Kornytska L, Suchkov D, et al. Virtual reality and interactive technologies in contemporary art: an analysis of creative opportunities[J]. Journal of Theoretical and Applied Information Technology, 2024, 102(24): 9089-9106.
- Sheng K, Liu L, Wang F, et al. An eye-tracking study on exploring children’s visual attention to streetscape elements[J]. Buildings, 2025, 15(4): 605.
- Chen A, Jesus R, Vilarigues M. Synergy of Art, Science, and Technology: A Case Study of Augmented Reality and Artificial Intelligence in Enhancing Cultural Heritage Engagement[J]. Journal of Imaging, 2025, 11(3): 89.
- Liu Z, Yang T, Luo J, et al. Participatory Design Research on Community Public Art Based on AI-Generated Content and Projection Mapping[C]//Proceedings of the Twelfth International Symposium of Chinese CHI. 2024: 456-462.
Figure 1.
Multidimensional Mechanism Framework.
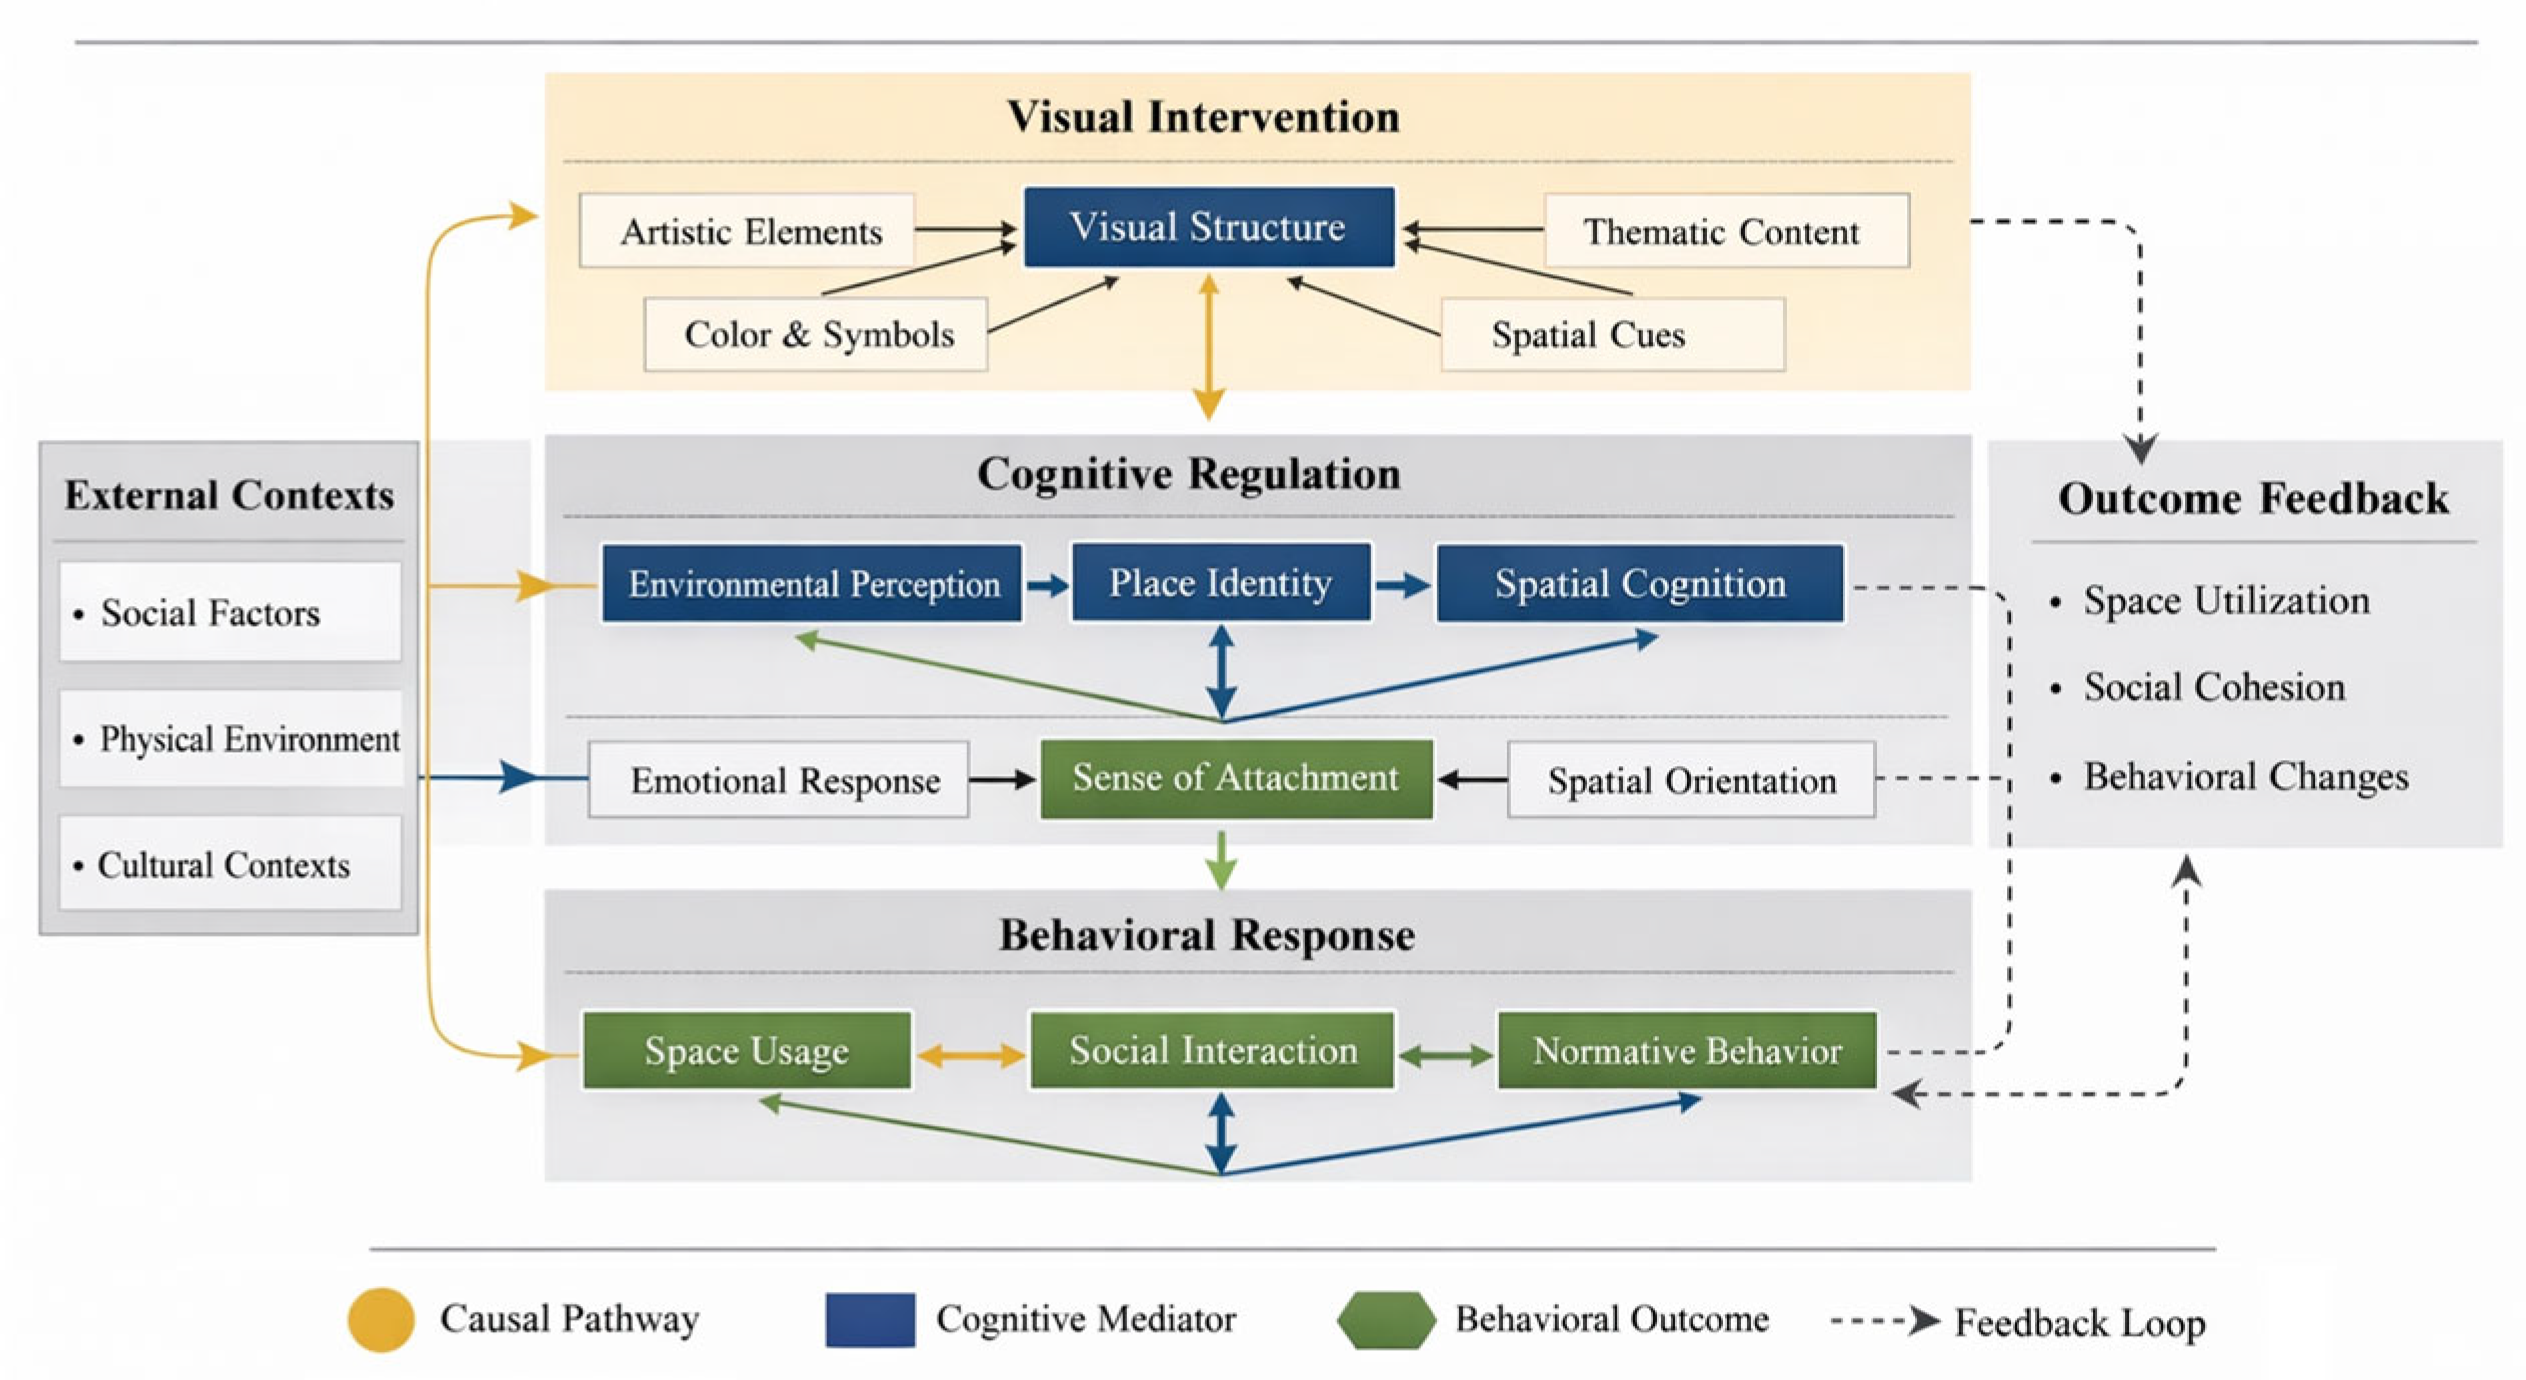
Figure 2.
Functional Hierarchy Mapping Diagram.
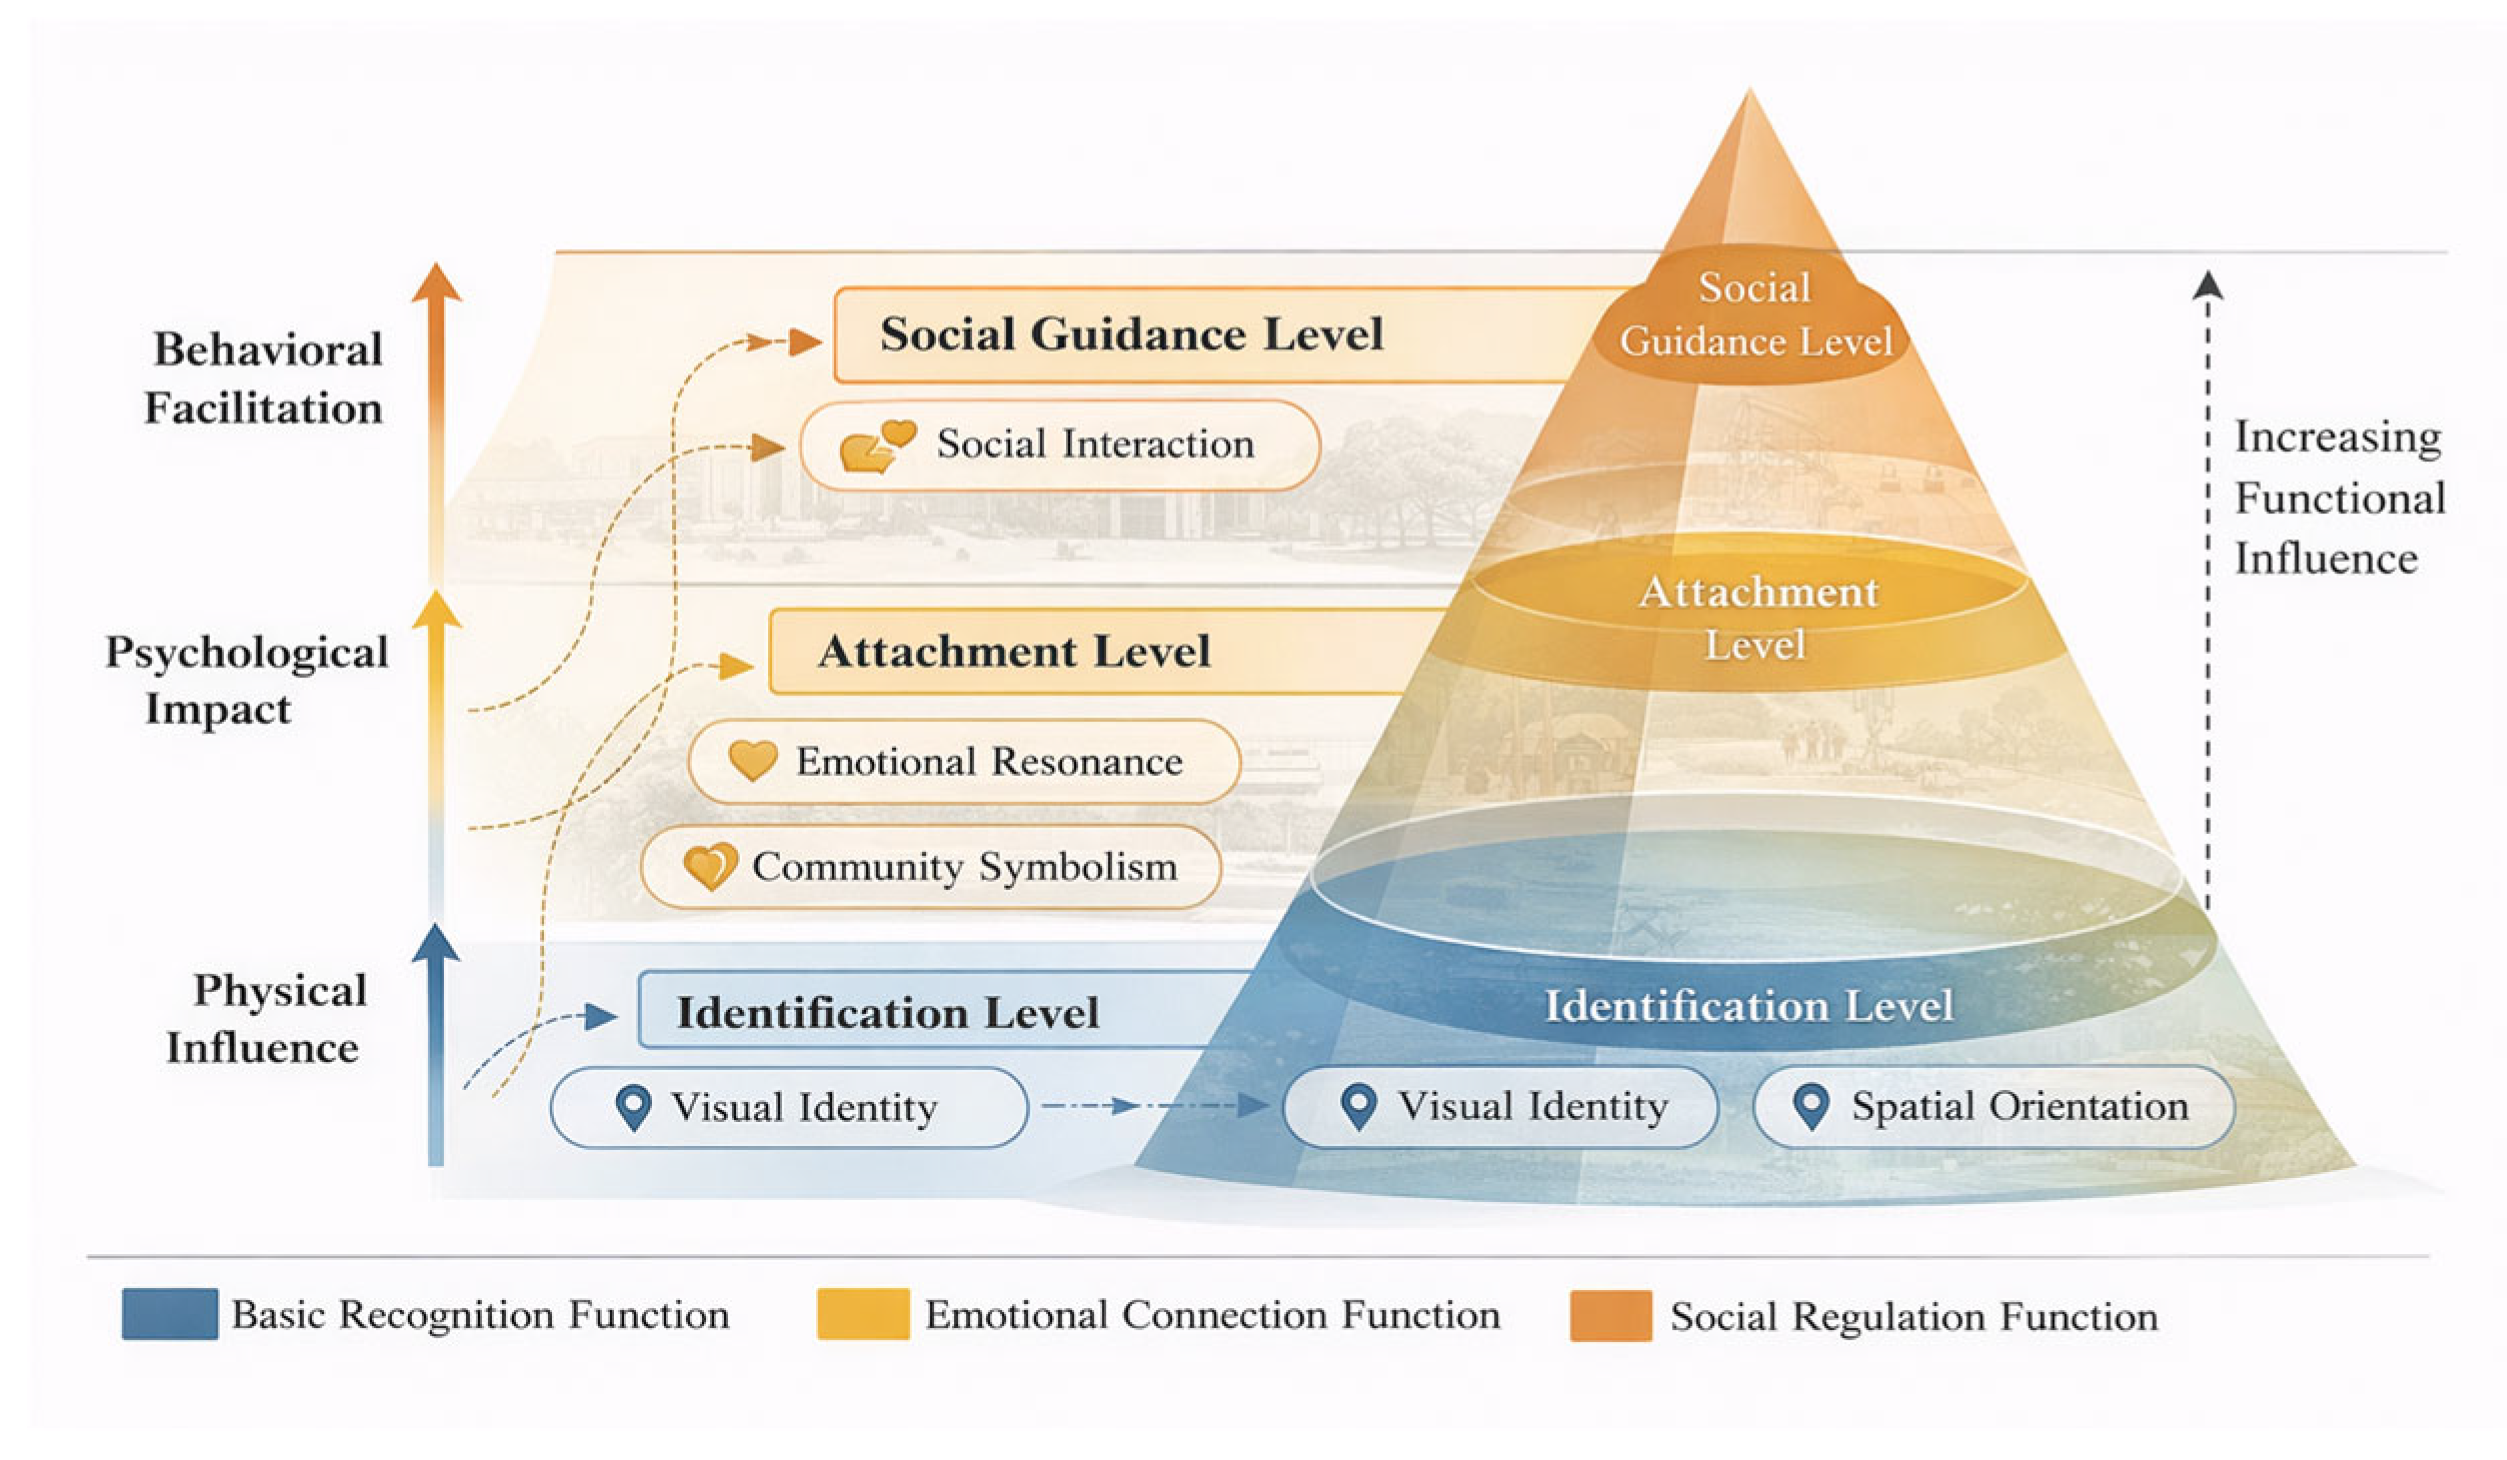
Figure 3.
Comparison of Public Behavior Metrics.
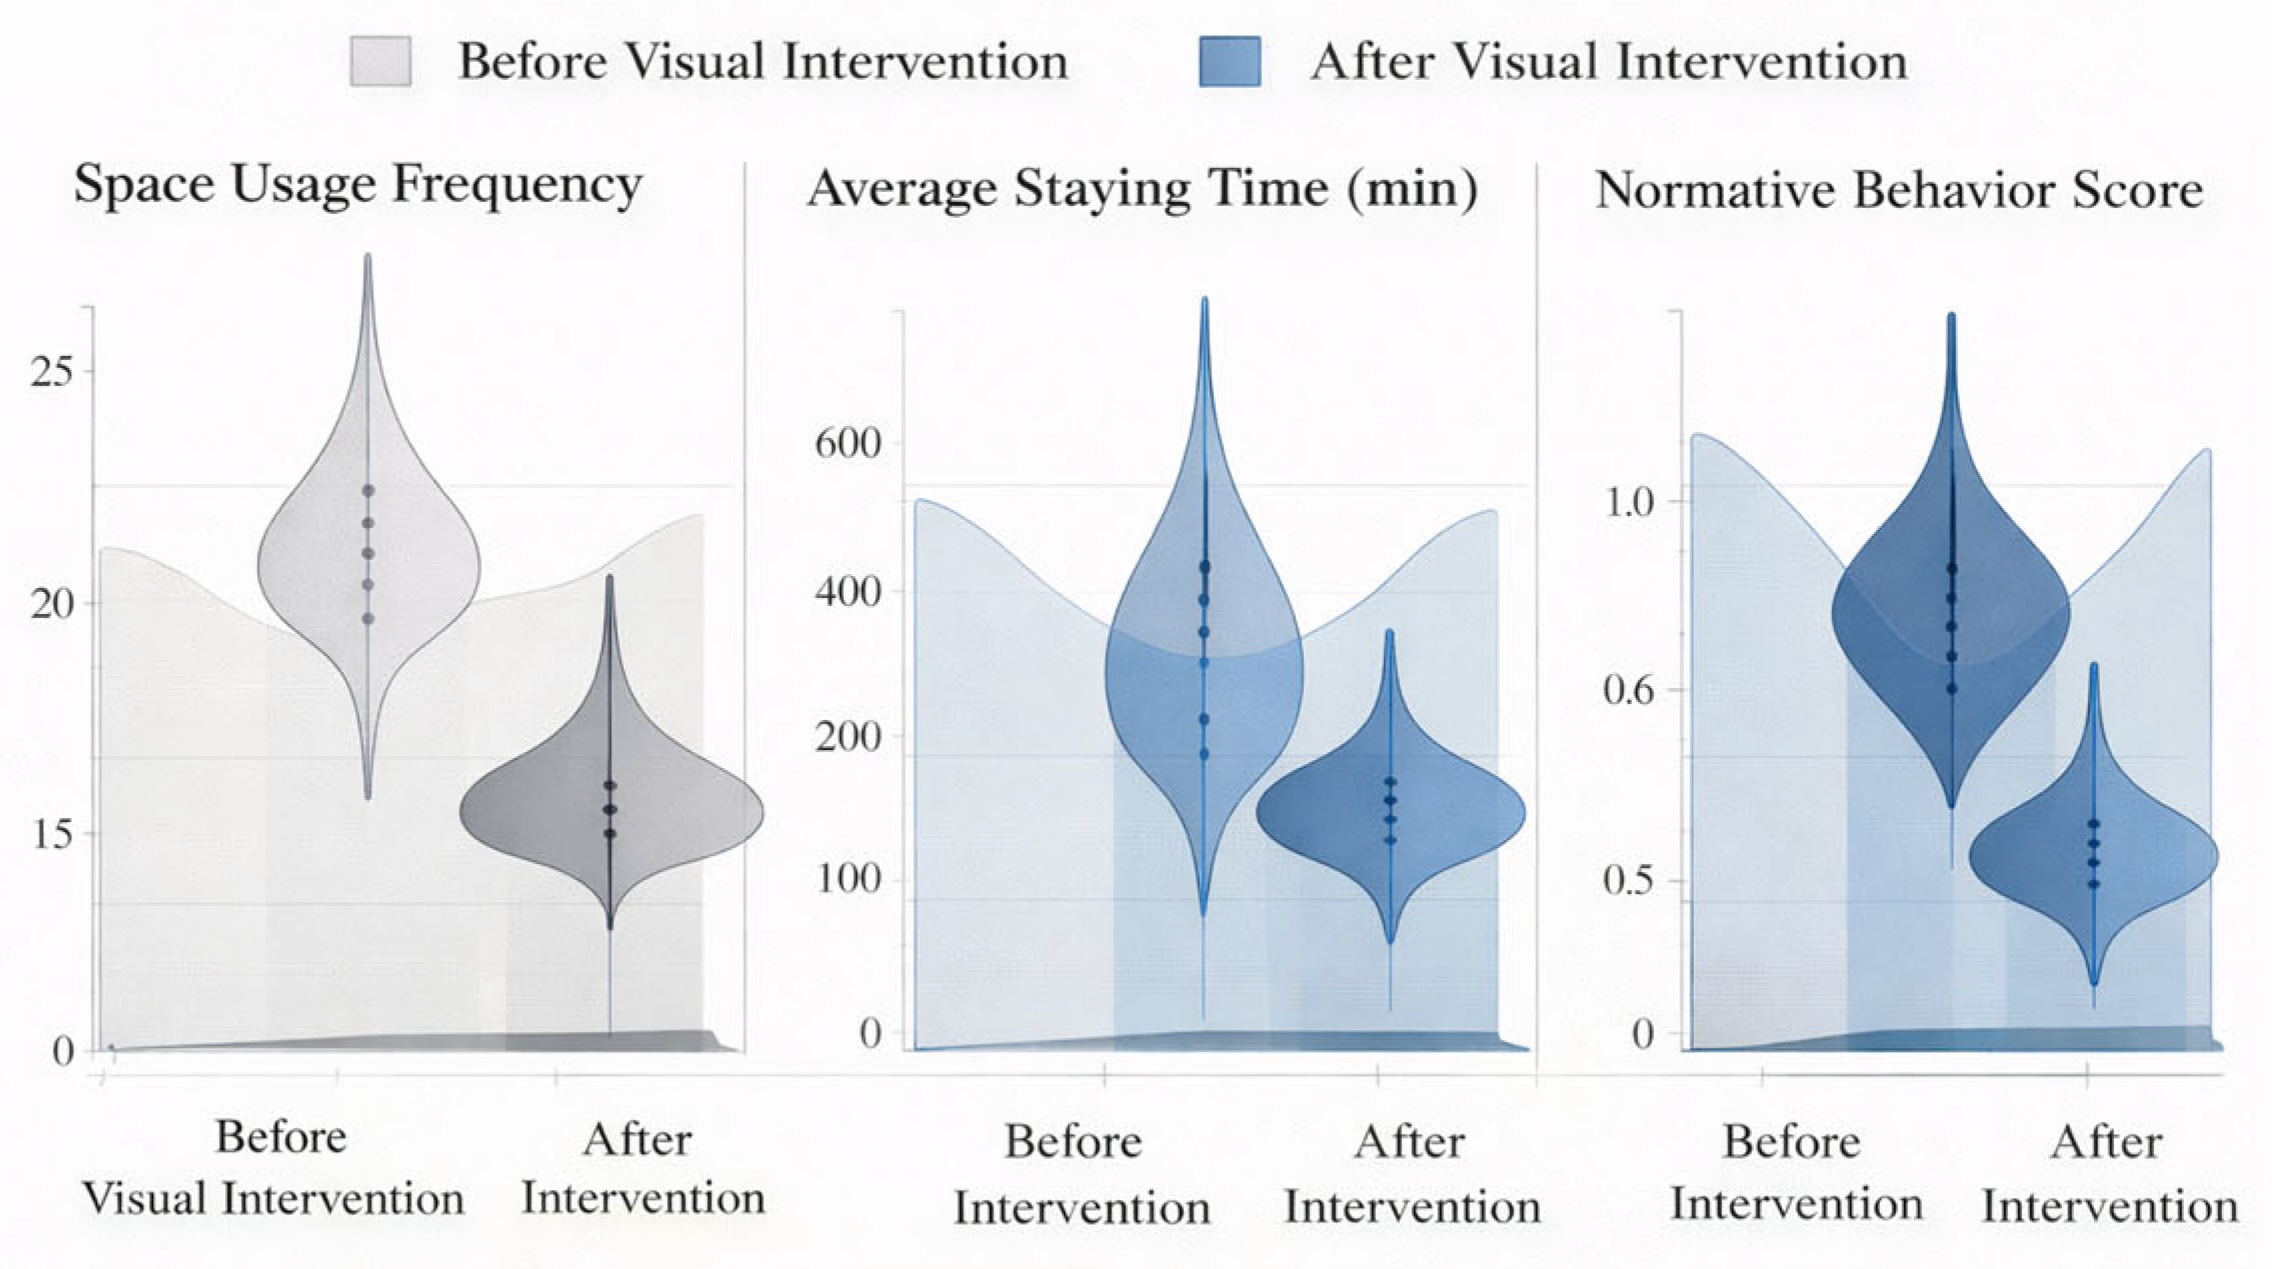
Figure 4.
Overview Diagram.
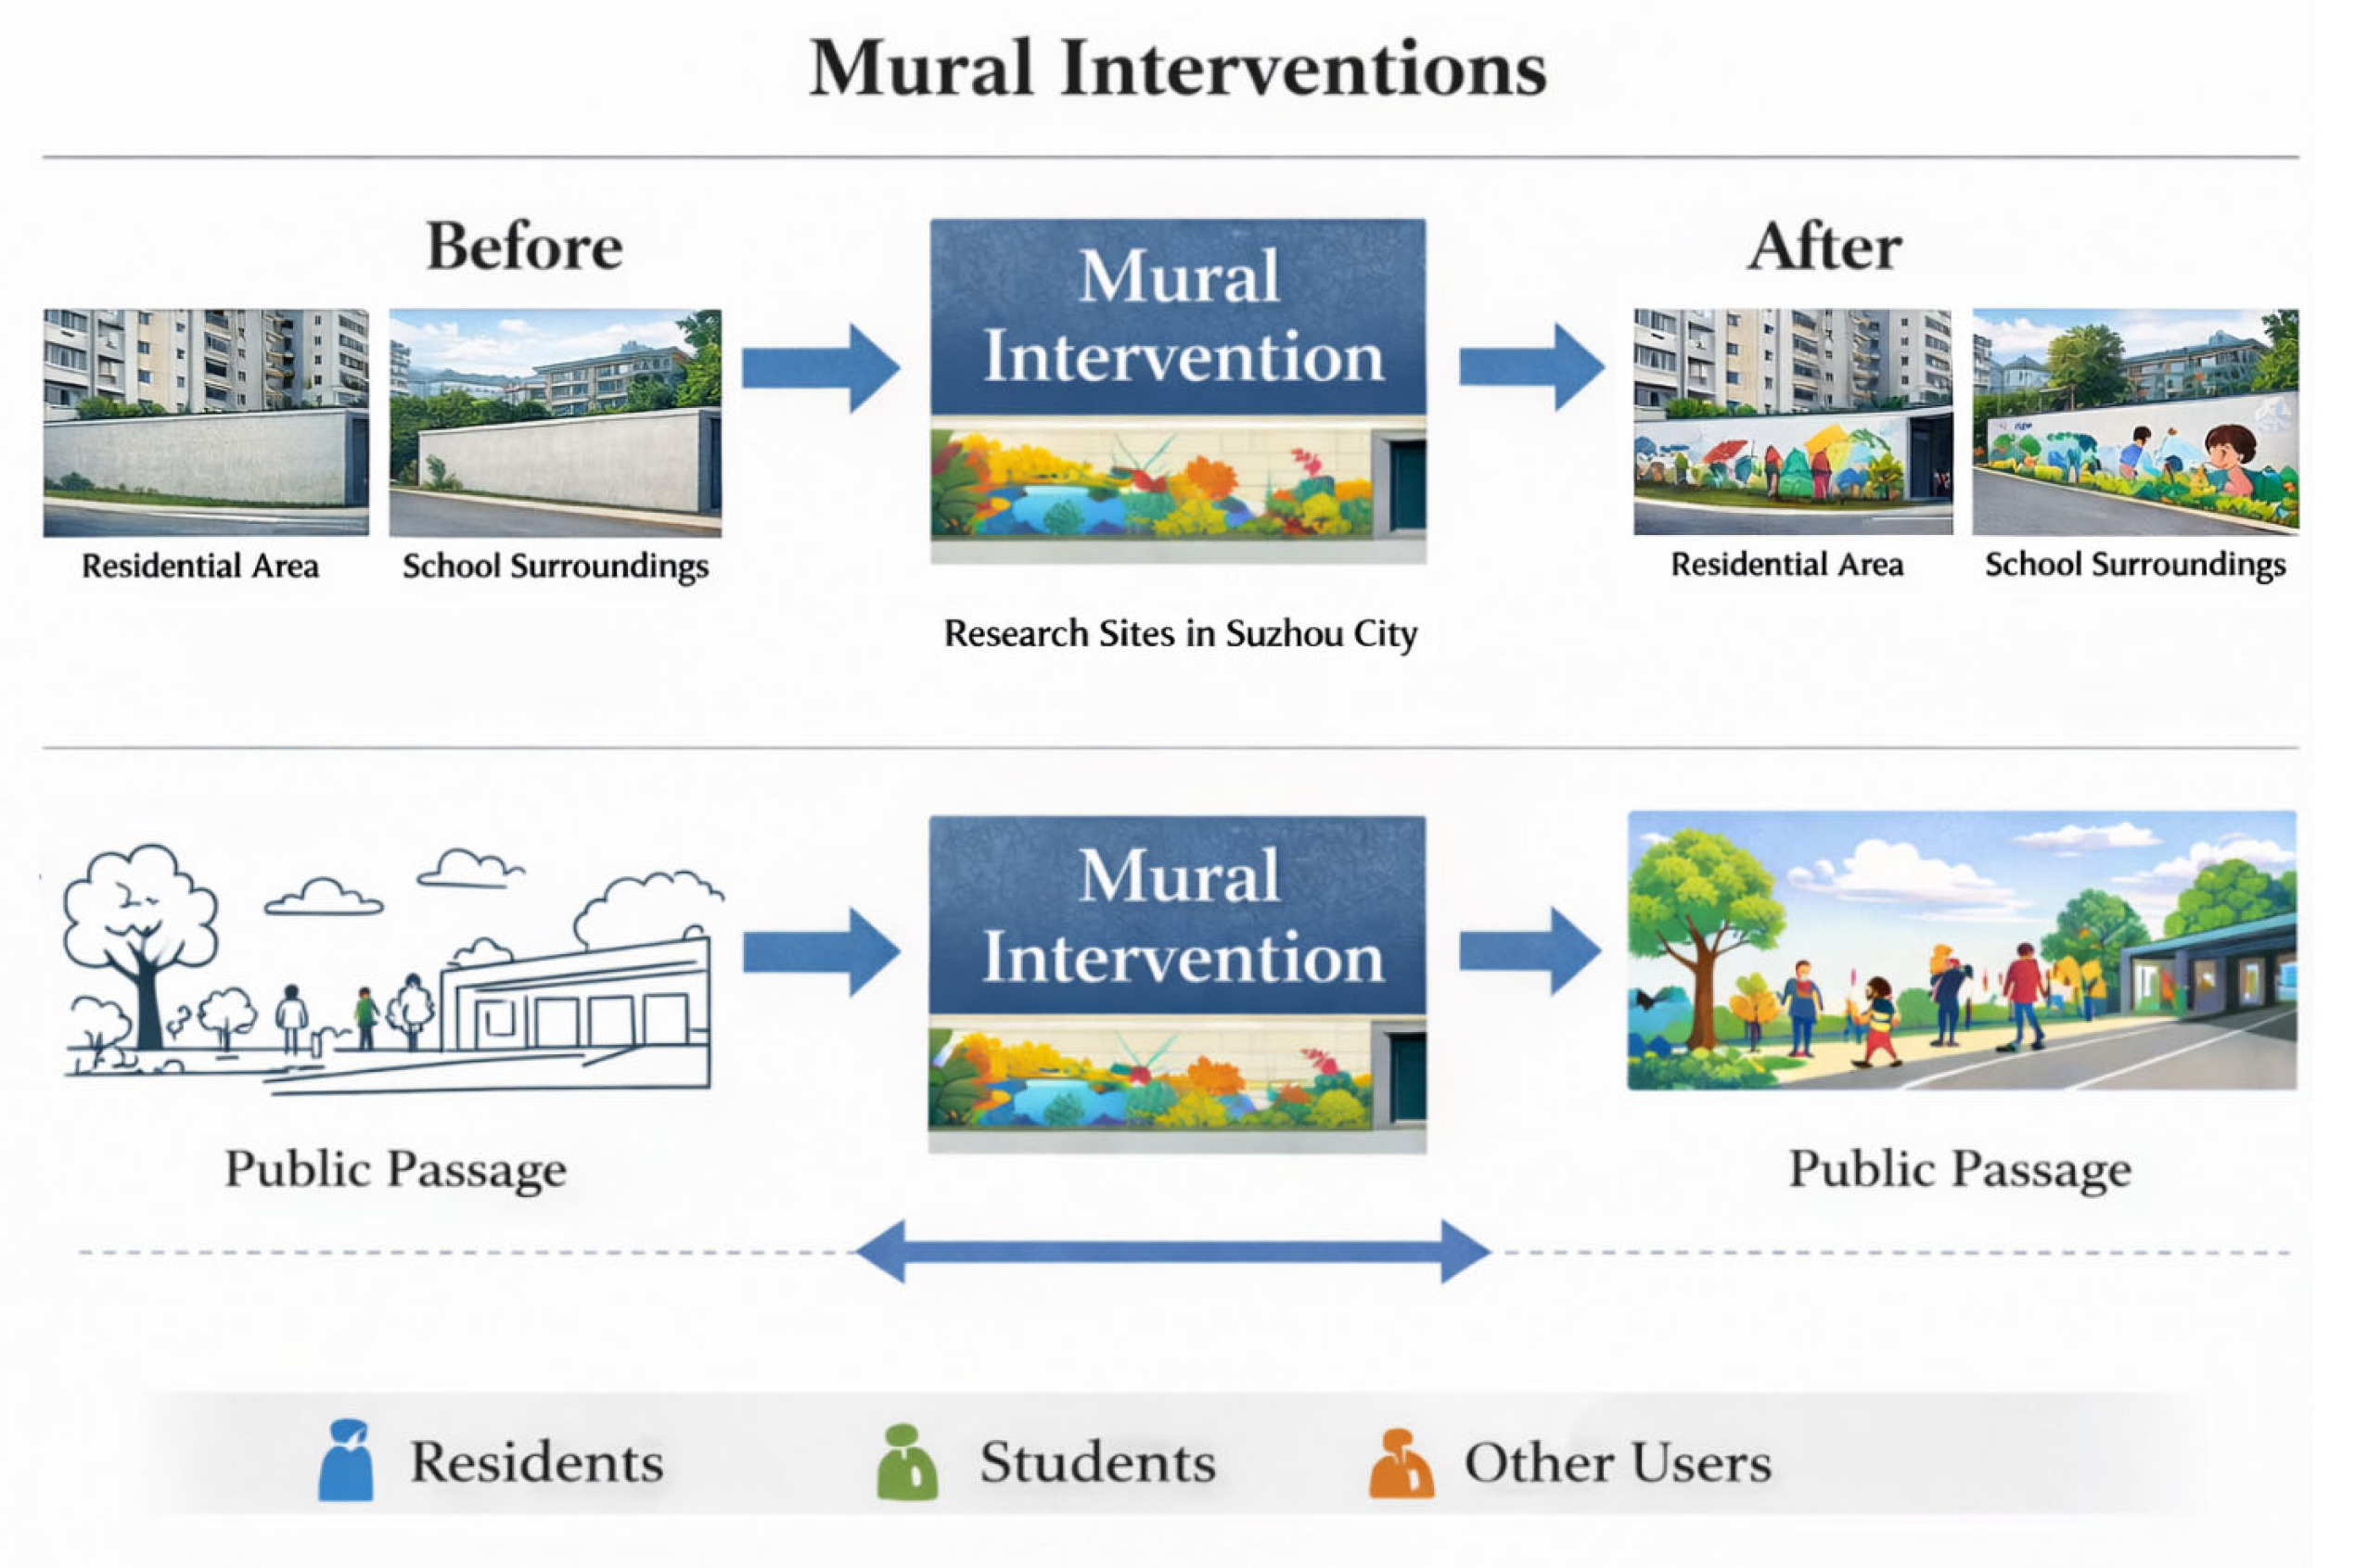

Table 1.
Comparison of Spatial Legibility (N=268).
| Indicator Dimension | Before Intervention (Mean ± SD) | After Intervention (Mean ± SD) | t-value | p-value |
| Path Recognition Clarity | 3.21 ± 0.62 | 3.89 ± 0.58 | 12.37 | < 0.01 |
| Functional Zoning Distinction | 3.34 ± 0.59 | 3.78 ± 0.61 | 8.94 | < 0.01 |
| Spatial Order Perception | 3.08 ± 0.65 | 3.81 ± 0.56 | 13.12 | < 0.01 |
| Overall Spatial Comprehension | 3.27 ± 0.60 | 3.85 ± 0.57 | 10.46 | < 0.01 |
Table 2.
Comparison of Environmental Identification (N=268).
| Indicator Dimension | Before Intervention (Mean ± SD) | After Intervention (Mean ± SD) | t-value | p-value |
| Emotional Identification | 3.15 ± 0.64 | 3.76 ± 0.60 | 11.08 | < 0.01 |
| Place Attachment | 3.22 ± 0.61 | 3.71 ± 0.58 | 9.26 | < 0.01 |
| Spatial Memorability | 3.09 ± 0.67 | 3.88 ± 0.55 | 14.02 | < 0.01 |
| Environmental Satisfaction | 3.28 ± 0.59 | 3.83 ± 0.56 | 10.71 | < 0.01 |
Table 3.
Comparison of Public Space Usage Behavior (N=268).
| Behavioral Indicator | Before Intervention (Mean ± SD) | After Intervention (Mean ± SD) | t-value | p-value |
| Usage Frequency (times/week) | 2.84 ± 1.12 | 3.47 ± 1.08 | 6.92 | < 0.01 |
| Average Staying Time (min) | 14.6 ± 6.3 | 19.8 ± 7.1 | 9.14 | < 0.01 |
| Social Interaction Occurrence Rate | 0.42 ± 0.18 | 0.56 ± 0.20 | 8.03 | < 0.01 |
| Normative Behavior Score | 3.36 ± 0.58 | 3.92 ± 0.54 | 11.27 | < 0.01 |
Disclaimer/Publisher’s Note: The statements, opinions and data contained in all publications are solely those of the individual author(s) and contributor(s) and not of MDPI and/or the editor(s). MDPI and/or the editor(s) disclaim responsibility for any injury to people or property resulting from any ideas, methods, instructions or products referred to in the content. |
© 2026 by the authors. Licensee MDPI, Basel, Switzerland. This article is an open access article distributed under the terms and conditions of the Creative Commons Attribution (CC BY) license (http://creativecommons.org/licenses/by/4.0/).
Copyright: This open access article is published under a Creative Commons CC BY 4.0 license, which permit the free download, distribution, and reuse, provided that the author and preprint are cited in any reuse.


