Submitted:
10 February 2026
Posted:
11 February 2026
You are already at the latest version
Abstract
Nowadays, most water meters are mechanical and intended to be installed on pipes completely filled with water. But the pipelines of a water supply network may contain air, which poses a metrological problem: if this air flows through the domestic intakes, it can propel the moving part of meters, resulting in an overestimation of water consumption. Of how much? There is a surprising lack of field data on this topic. So, the case of one house is reported: it is located at the top of a steep and sparsely occupied street, with water typically supplied for a few hours per day. The house's meter (multi-jet) was estimating a huge and erratic consumption: several times more than what would be normally expected on average, and with some daily peaks exceeding the built storage capacity (underground cistern plus roof tank). After one year of monitoring, including the installation of a few devices, it is concluded that: (1) the house's meter was affected by air in the water supply network (most likely for different reasons, of which three are discussed); (2) a small air-release valve installed just upstream from the meter did not solve the problem; (3) another mechanical meter (single-jet) installed just downstream was also affected by air (although to a lesser extent), and (4) reliable estimates of water consumption were finally obtained with an ultrasonic meter installed at the domestic intake (and with a mechanical meter installed at the roof tank's outlet). Thus, the case reported emphasizes the need to study more how air in pipelines affects mechanical water meters, and to sometimes consider alternatives for measuring domestic water consumption.
Keywords:
urban water
; water meter error
; over-registration
; air flow
; intermi?ent water supply
; hydraulic jump
; air-release valve
; case report
; citizen science
; legal metrology
1. Introduction
In cities, households are supplied with drinking water via pipelines; this supply can be: (1) continuous (i.e., the pipe network is always filled with water and pressurized so that water is available all the time), or (2) intermittent (i.e., the network is sometimes empty, meaning that water is only available for a few hours per day, or even less often) (Totsuka et al., 2004). Admittedly, intermittent supply poses problems, including: it becomes more difficult for water agencies to control the water quality and leaks inside the network, and it becomes necessary for households to cope with shortages by storing water at the domestic level (e.g., in an underground cistern and/or a roof tank) (Totsuka et al., 2004). Nonetheless, intermittent supply is a reality in many cities with scarce water resources (Totsuka et al., 2004) (Charalambous et al., 2007) (Abu-Madi and Trifunovic, 2013) (Kumpel et al., 2017).
Urban water agencies would like every domestic intake to be equipped with a water meter, in order to optimize water supply (from the knowledge of households’ habits) and bill for this service (Totsuka et al., 2004) (Kumpel et al., 2017) (Taylor, 2018). In this case, it is important to note that the vast majority of today’s domestic water meters are mechanical, i.e.,: they have a rotating element (rotor, piston or disc) that is supposed to be propelled only by the flow of (liquid) water, and a gear system that converts this movement into a registered water volume (Arregui et al., 2006). One condition for these meters to work properly is that the pipe on which they are installed is “completely filled with water”, as stressed by the OIML (OIML, 2024). But contrary to what happens in calibration facilities (AWWA, 2012), this condition is not always met in the field. Indeed, the pipelines of a water supply network may contain air under certain circumstances (Escarameia et al., 2005) (Pozos et al., 2010), including: (1) when a network is successively emptied and filled (which is usual with intermittent water supply, and sometimes necessary with maintenance); (2) if air is sucked by a pump (and entrained downstream in the form of air bubbles, pockets or slugs), or (3) if a hydraulic jump develops inside an inclined pipeline (which generally results in the formation of a large air pocket upstream of the jump, and a flow of air bubbles downstream). Among other issues (Escarameia et al., 2005) (Pozos et al., 2010), air in pipelines poses a metrological problem: if this air flows through the domestic intakes, it may propel the rotating element of mechanical meters, resulting in an overestimation of water consumption; at least, this concern exists since more than a century in the case of intermittent water supply (Jopling, 1857) (Foufeas and Petroulias, 2017) (admittedly, a reverse flow from domestic intakes to pipelines is also conceivable (Totsuka et al., 2004); but as will be argued, it should generally be less pronounced).
Compared to other causes of systematic error (Arregui et al., 2006) (Arregui de la Cruz, 2016) (for a short review, see Appendix B), there is little quantitative information in the literature about the possible overestimation of domestic consumption by mechanical water meters due to air in pipelines: although a growing number of tests conducted in the laboratory suggests that this could be an important issue (Miranda, 2011) (Grando-Sirtoli et al., 2016), particularly in areas with intermittent supply (Cornejo Cid, 2013) (Walter et al., 2017) (Walter et al., 2018) (Taylor, 2018) (Tavares, 2018) (Ferrante et al., 2022) (Ferrante et al., 2025) (Ferrante, 2025), there is virtually no field study on the topic. Thus, the case of one house is presented (Section 2): its mechanical water meter was estimating a huge consumption (Section 3), and this is analyzed (Section 4).
2. Materials and Methods
2.1. The Case Studied
This study was conducted in a residential house located in a city (> 100,000 inhabitants) of central Mexico. The house is: (1) in an area of intermittent water supply (the supply being typically of a few hours per day); (2) almost at the top of a steep street (average slope ≈ 5.5°, as measured with an inclinometer app for smartphone, and verified using a smartphone barometer and Google Earth), and (3) in a sparsely occupied area (≈ 10 domestic intakes over a distance of ≈ 250 m). It is useless to specify the exact location of the house, as we did not obtain detailed information on how intermittent water supply takes place there (only partial information was obtained, which will be provided in Section 4.2). Furthermore, it must be recognized that, during the study, the house’s domestic intake was modified without the permission of a water agency: consequently, certain details cannot be shared for privacy reasons (in this respect, an attempt to justify why the study was conducted in such a manner is given in Appendix A).
To cope with shortages, the studied house has two facilities (Figure 1): an underground cistern (with a capacity of ≈ 5,000 L) and a roof tank (with a capacity of ≈ 500 L). Both have a float valve to prevent them from receiving too much water from the domestic intake. Furthermore, a pump installed into the cistern allows to refill the roof tank automatically, if it does not receive water directly from the domestic intake (i.e., when pressure of the supply network is too low). Finally, all the water from the cistern is supposed to be directed to the roof tank (unless there is a leak between both).
The owner of the studied house lives there alone for two years. This person contacted us at the end of 2024, because he/she was receiving bills for a high water consumption (considering that the daily consumption of one person is normally < 250 L/d) and always for the same amount. In fact, the staff of the urban water agency was not coming to read the house’s water meter (probably because it is not visible from the street, and the house is left alone for most of the day) and, as a result, the agency was only “estimating” domestic consumption. So, the house’s owner began to take readings of the meter. And then, he/she realized that it was suggesting a very high water consumption (equivalent to ≈ 800 L/d).
2.2. Monitoring Campaign
To explain the very high consumption estimated by the water meter of the studied house, three hypotheses were considered from the beginning: (1) there was a significant water leak in the house (of ≈ 30 L/h, which is not impossible, though quite high for a residential house (Tamari and Ploquet, 2012)); (2) the water meter was damaged, and/or (3) air coming from the supply network was affecting the meter. But none of these possibilities was clearly apparent to the naked eye. So, to try to understand the situation, the owner of the studied house was asked to regularly take photos of his/her water meter and send them. It quickly became important to take photos every day (as will be emphasized in Section 4.3). As a result, a monitoring campaign began, which lasted for a year. This monitoring took place in four stages (Table 1):
- First stage of monitoring - The water meter of the studied house was a mechanical meter of the multi-jet type (it will be named “MJ” below). Figure 2a shows how this meter was originally installed. The first stage of the monitoring campaign simply consisted in reading and visualizing the daily data from this meter (based on the photos sent by the house’s owner). Then, four months of observations led to the preliminary conclusion that meter “MJ” was probably affected by air coming from the supply network (as will be argued in Section 4.1).
- Second stage of monitoring - The second stage of monitoring was an attempt to avoid the possible air flow through meter “MJ”. It began when the owner of the studied house announced that he/she had decided to hire a plumber for installing an air-release valve “AV” (model “Foset 40012” from Truper (Mexico), = 13 mm) just upstream of the meter (Figure 2b). This choice (based on commercials) was somewhat imprudent, because it can generate water hammer (Lingireddy et al., 2004) (Escarameia et al., 2005) (Zhou et al., 2020) (Ferrante et al., 2023). However, it did not cause any apparent damage to the domestic intake. On the other hand, after two months of monitoring, it became clear that the air-release valve alone was not effective (as will be discussed in Section 4.2). So, we made a suggestion, which the house’s owner agreed to implement (Figure 2c): modify the shape of the domestic intake so as to form a small inverted siphon “IS” (as suggested by a few authors (Walter et al., 2017) (Walter et al., 2018) (Taylor, 2018)). Nevertheless, it became clear after some weeks that this modification was neither effective.
- Third stage of monitoring - The third stage of monitoring began when we suggested to make an inter-comparison between meter “MJ” and two others installed at the same domestic intake: it was hoped that this would help to distinguish between the possibility of a damaged meter and that of air coming from the supply network. For this purpose, a meter of the single-jet type (named “SJ”) was first installed in series (Figure 3a): since it was mechanical, it was expected that it would behave similarly to meter “MJ” in the event of air flows, or would otherwise provide reasonable estimation of water consumption. Then, a non-mechanical meter of the ultrasonic type (named “US”) was also installed in series (Figure 3b): since this type of meter (when designed for water (Lynnworth, 2013)) is a priori not (Ferrante, 2025) or little (Yao et al., 2021) affected by air flow, it was preliminarily considered as a reference for estimating the domestic water consumption.
- Fourth stage of monitoring - Finally, the fourth stage of monitoring consisted in verifying the data provided by the non-mechanical meter “US” installed at the domestic intake. For this purpose, a mechanical meter of the multi-jet type (named “MJ-T”) was installed at the roof tank’s outlet of the studied house (as described in Section C.1). This last meter was considered as the best reference for estimating domestic water consumption, because: (1) it proved reasonable to assume that all the water supplied at the domestic intake was reaching the roof tank (since there was no significant leak between the domestic intake and the roof tank, as will be demonstrated in Section 4.1); (2) there should be no problem of air flow at the outlet of a roof tank (Charalambous et al., 2007), and (3) it was possible to carefully verify the meter accuracy in situ (as shown in Section C.2).
2.3. Used Water Meters
The accuracy class of all meters used in this study is “2” (OIML, 2024), which is common for today’s water meters (Arregui et al., 2006). It means that the maximum permissible error (MPE) for estimating a water volume should be ± 5% at flow rates between the minimum () and transitional () flow rates, and ± 2% at flow rates between the transitional () and overload () flow rates (when water temperature < 30 °C) (OIML, 2024). Otherwise, the meter error is not specified for too low flow rates (below ); but for this condition, mechanical meters tend to underestimate the volume of water passing through (Arregui et al., 2006) (see Figure C2 for an example), and ultrasonic meters can no longer detect water flow (so they stop counting the volume of water) (Lynnworth, 2013).
The technical specifications of the four water meters installed in the studied house are given in Table 2:
- Meter “MJ” - The mechanical meter “MJ” officially installed was quite new (≈ 2 years old). Its model is not specified for privacy reasons. Nevertheless, it complies with standard ISO 4064: 2014, which is similar to recommendation OIML R-49: 2013.
- Meter “SJ” - According to its data sheet (Siemens, 2021), mechanical meter “SJ” complies with recommendation OIML R-49: 2013. The best practice for installing water meters with a rotor (i.e., single-jet and multi-jet meters) is to mount them on a straight pipe that is horizontal and long enough (Arregui et al., 2006) (AWWA, 2012). But for lack of space, meter “SJ” was installed on a vertical pipe (so that water flows upwards) and with no concern for pipe length: in fact, this is possible according to the meter’s manufacturer (Siemens, 2021), but the meter then has a higher minimum flow rate, i.e.,: = 40 L/h (which is attributable to the fact that the meter’s rotor is subject to greater friction (Arregui et al., 2006)). Also note that it was not possible to purchase a meter compatible with the original diameter of the domestic intake ( = 13 mm), but with a larger diameter ( = 20 mm).
- Meter “US” - According to its certificate (SLM, 2025), ultrasonic meter “US” complies with recommendation OIML R-49: 2013. And for identification purposes, the same certificate (SLM, 2025) specifies that the meter has one pair of “wet” transducers, which operate according to the transit-time principle (Arregui et al., 2006) (Lynnworth, 2013) (Yao et al., 2021). The best practice for installing ultrasonic water meters is to mount them on a straight pipe that is horizontal and long enough (Arregui et al., 2006) (Lynnworth, 2013). But as for meter “SJ”, meter “US” was installed on a short vertical pipe: in fact, this is possible according to the meter’s manufacturer (SLM, 2025). Note that, compared to the used mechanical meters, meter “US” can reliably measure at very low flow rates (i.e., = 3 L/h).
- Meter “MJ-T” - According to its certificate (ANCE, 2025), mechanical meter “MJ-T” complies with Mexican standard NOM-012-SCFI: 1994 (DGN, 1994), which is similar to standard ISO 4064-1: 1993 (ISO, 1993). This meter was installed at the outlet of the house’s roof tank, ensuring that it was on a sufficiently long horizontal pipe portion (see Section C.1 for details). Also note that the diameter of the pipe at the roof tank’s outlet ( = 25 mm) was greater than that of the pipe at the domestic inlet ( = 13 mm): in this case, special care was taken to select a meter with a quite low minimum flow rate (i.e., similar to that of meter “MJ”).
3. Results
3.1. Data from the Officially Installed Water Meter (and from that of a Nearby House)
Before presenting the data from the water meter “MJ” of the studied house, it is appropriate to present those from another meter officially installed in a nearby residential house. This house was occupied by three persons, who agreed to take photos of their meter every day and send them (they also agreed to take photos of meter “MJ” when its owner was away). The meter was mechanical (multi-jet) and rather old (≈ 20 years). Its data reveal two trends (Figure 4):
- A first trend that looks normal - During the first 8 months of monitoring, the data of the water meter looked normal: (1) estimated daily consumptions fluctuated, but were on average of ≈ 425 L/d (Figure 4b), which is a typical value for the domestic consumption of three persons (Mazzoni et al., 2023) (please note that the slight decrease in June 2025 is attributable to the fact that one person was away), and (2) the estimated total consumption was increasing regularly (see dotted line on Figure 4a). Furthermore, daily water volumes estimated by the meter were sometimes very low (i.e., < 100 L/d: see the grey rectangle on Figure 4b): considering that the residents of the house were keeping the same lifestyle, this does not reflect a sudden decrease in their water consumption, but an intermittent supply with some days without any supply at all. So, these observations suggest that a mechanical water meter can behave normally, at least apparently, even under intermittent supply: this finding will need to be discussed together with the data from the water meter “MJ” of the studied house.
- A second trend that reflects a deterioration of the meter - Unexpectedly, from a certain date (around September 9th: see red arrow on Figure 4a), the water meter estimated a gradually lower, and finally null consumption: considering that the residents of the house were keeping the same lifestyle, this reflects a slow deterioration of the mechanical meter. Is this normal wear (Arregui et al., 2006), or accelerated damage caused by air flow in pipes during intermittent water supply (Totsuka et al., 2004) (Foufeas and Petroulias, 2017) (Ferrante et al., 2022)? Even if we have no answer to this question, the example presented shows that in a study like this, the possibility of a subtle deterioration of mechanical water meters cannot be ignored.
Compared to the data from the water meter of a nearby house (as long as it seemed to work normally), those of the meter “MJ” officially installed at the domestic intake of the studied house were quite different. Basically, this meter was estimating a very high and erratic consumption (Figure 5):
- Water consumption estimated by meter “MJ” was very high - On average, the daily water consumption estimated by meter “MJ” during the monitoring campaign (from 14/12/2024 to 09/02/2026) was 1,040 L/d: in line with the concern of the house’s owner when he/she contacted us, this is very high (≈ 6.5 times more than the usual domestic consumption of one person (Mazzoni et al., 2023)).
- The estimated water consumption was erratic - Whereas the total consumption estimated by the meter of a nearby house was increasing regularly (see Figure 4a until ≈ September 9th), that estimated by meter “MJ” was characterized by jumps (Figure 5a). These jumps correspond to huge estimations of daily consumption, some of which even exceeding the built storage capacity (i.e., ≈ 5,500 L): this is shown on Figure 5b (see peaks in the red zone).
- On occasion, the meter was estimating negative daily consumptions - Interestingly, meter “MJ” has sometimes estimated negative water consumptions: (1) the most notable case occurred on April 11th, with an estimated consumption of ≈ -1,900 L/d (one day before the installation of an air-release valve, which is a coincidence); (2) but this was not the only event (indeed, meter “MJ” estimated a daily consumption below -50 L/d on 5 occasions during the monitoring campaign).
- The meter’s behavior did not change after the installation of an air-release valve - Following the installation of an air-release valve and a small inverted siphon at the domestic intake (see yellow circle and triangle on Figure 5b), the meter’s behavior did not appear to change noticeably: indeed, meter “MJ” was still estimating huge water consumptions for certain days.
- The meter did not estimate high water consumptions when the house was unoccupied - On four occasions, the owner of the studied house was away for several days (see green lines on Figure 5a). During these periods, meter “MJ” did not estimate high water consumption: this finding will allow to discuss the hypothesis of water leaks in the studied house (Section 4.1).
3.2. Comparison with Two More Meters Installed at the Domestic Intake
By comparing the daily water consumptions estimated by the three meters installed at the domestic intake of the studied house, it was found that:
- Meter “MJ” vs. meter “SJ” - The comparison of data from mechanical meters “MJ” and “SJ” revealed that (Figure 6a): (1) meter “MJ” was tending to estimate larger consumptions; (2) however, meter “SJ” was also sometimes estimating huge consumptions (i.e., > 5,500 L/d on three occasions); (3) there was a significant nonlinear correlation between the data from both meters (Spearman correlation coefficient: = 0.95 ***), meaning that the data were tending to vary in the same way; (4) many estimates of daily consumption, at least those that were not too high (i.e., < 500 L/d), were similar (difference < 10%) for both meters, and (5) on two occasions during the inter-comparison, meter “MJ” estimated a negative consumption, whereas meter “SJ” never did (see the red dotted ellipse on Figure 6a).
- Meter “SJ” vs. meter “US” - The comparison of data from mechanical meter “SJ” and ultrasonic meter “US” revealed that (Figure 6b): (1) meter “SJ” was tending to estimate larger consumptions; (2) meter “US” was estimating a rather low daily consumption (i.e., < 500 L/d; admittedly, it estimated a consumption of ≈ 1,300 - 1,500 L/d on 18/11/2025 and 02/02/2026, but for these days, the house’s owner explained that he/she had consumed more water than usual to wash clothes and irrigate flowers); (3) there was a significant nonlinear correlation between the data from both meters (Spearman correlation coefficient: = 0.88 ***), and (4) many estimates of daily consumption, at least those that were not too high, were similar for both meters.
Figure 6.
Inter-comparison of daily consumptions estimated by the water meters installed at the domestic intake of the studied house: (a) meter “SJ” (single-jet) vs. meter “MJ” (multi-jet); (b) meter “US” (ultrasonic) vs. meter “SJ” (single-jet). The dotted green line is the first bisector.
Figure 6.
Inter-comparison of daily consumptions estimated by the water meters installed at the domestic intake of the studied house: (a) meter “SJ” (single-jet) vs. meter “MJ” (multi-jet); (b) meter “US” (ultrasonic) vs. meter “SJ” (single-jet). The dotted green line is the first bisector.
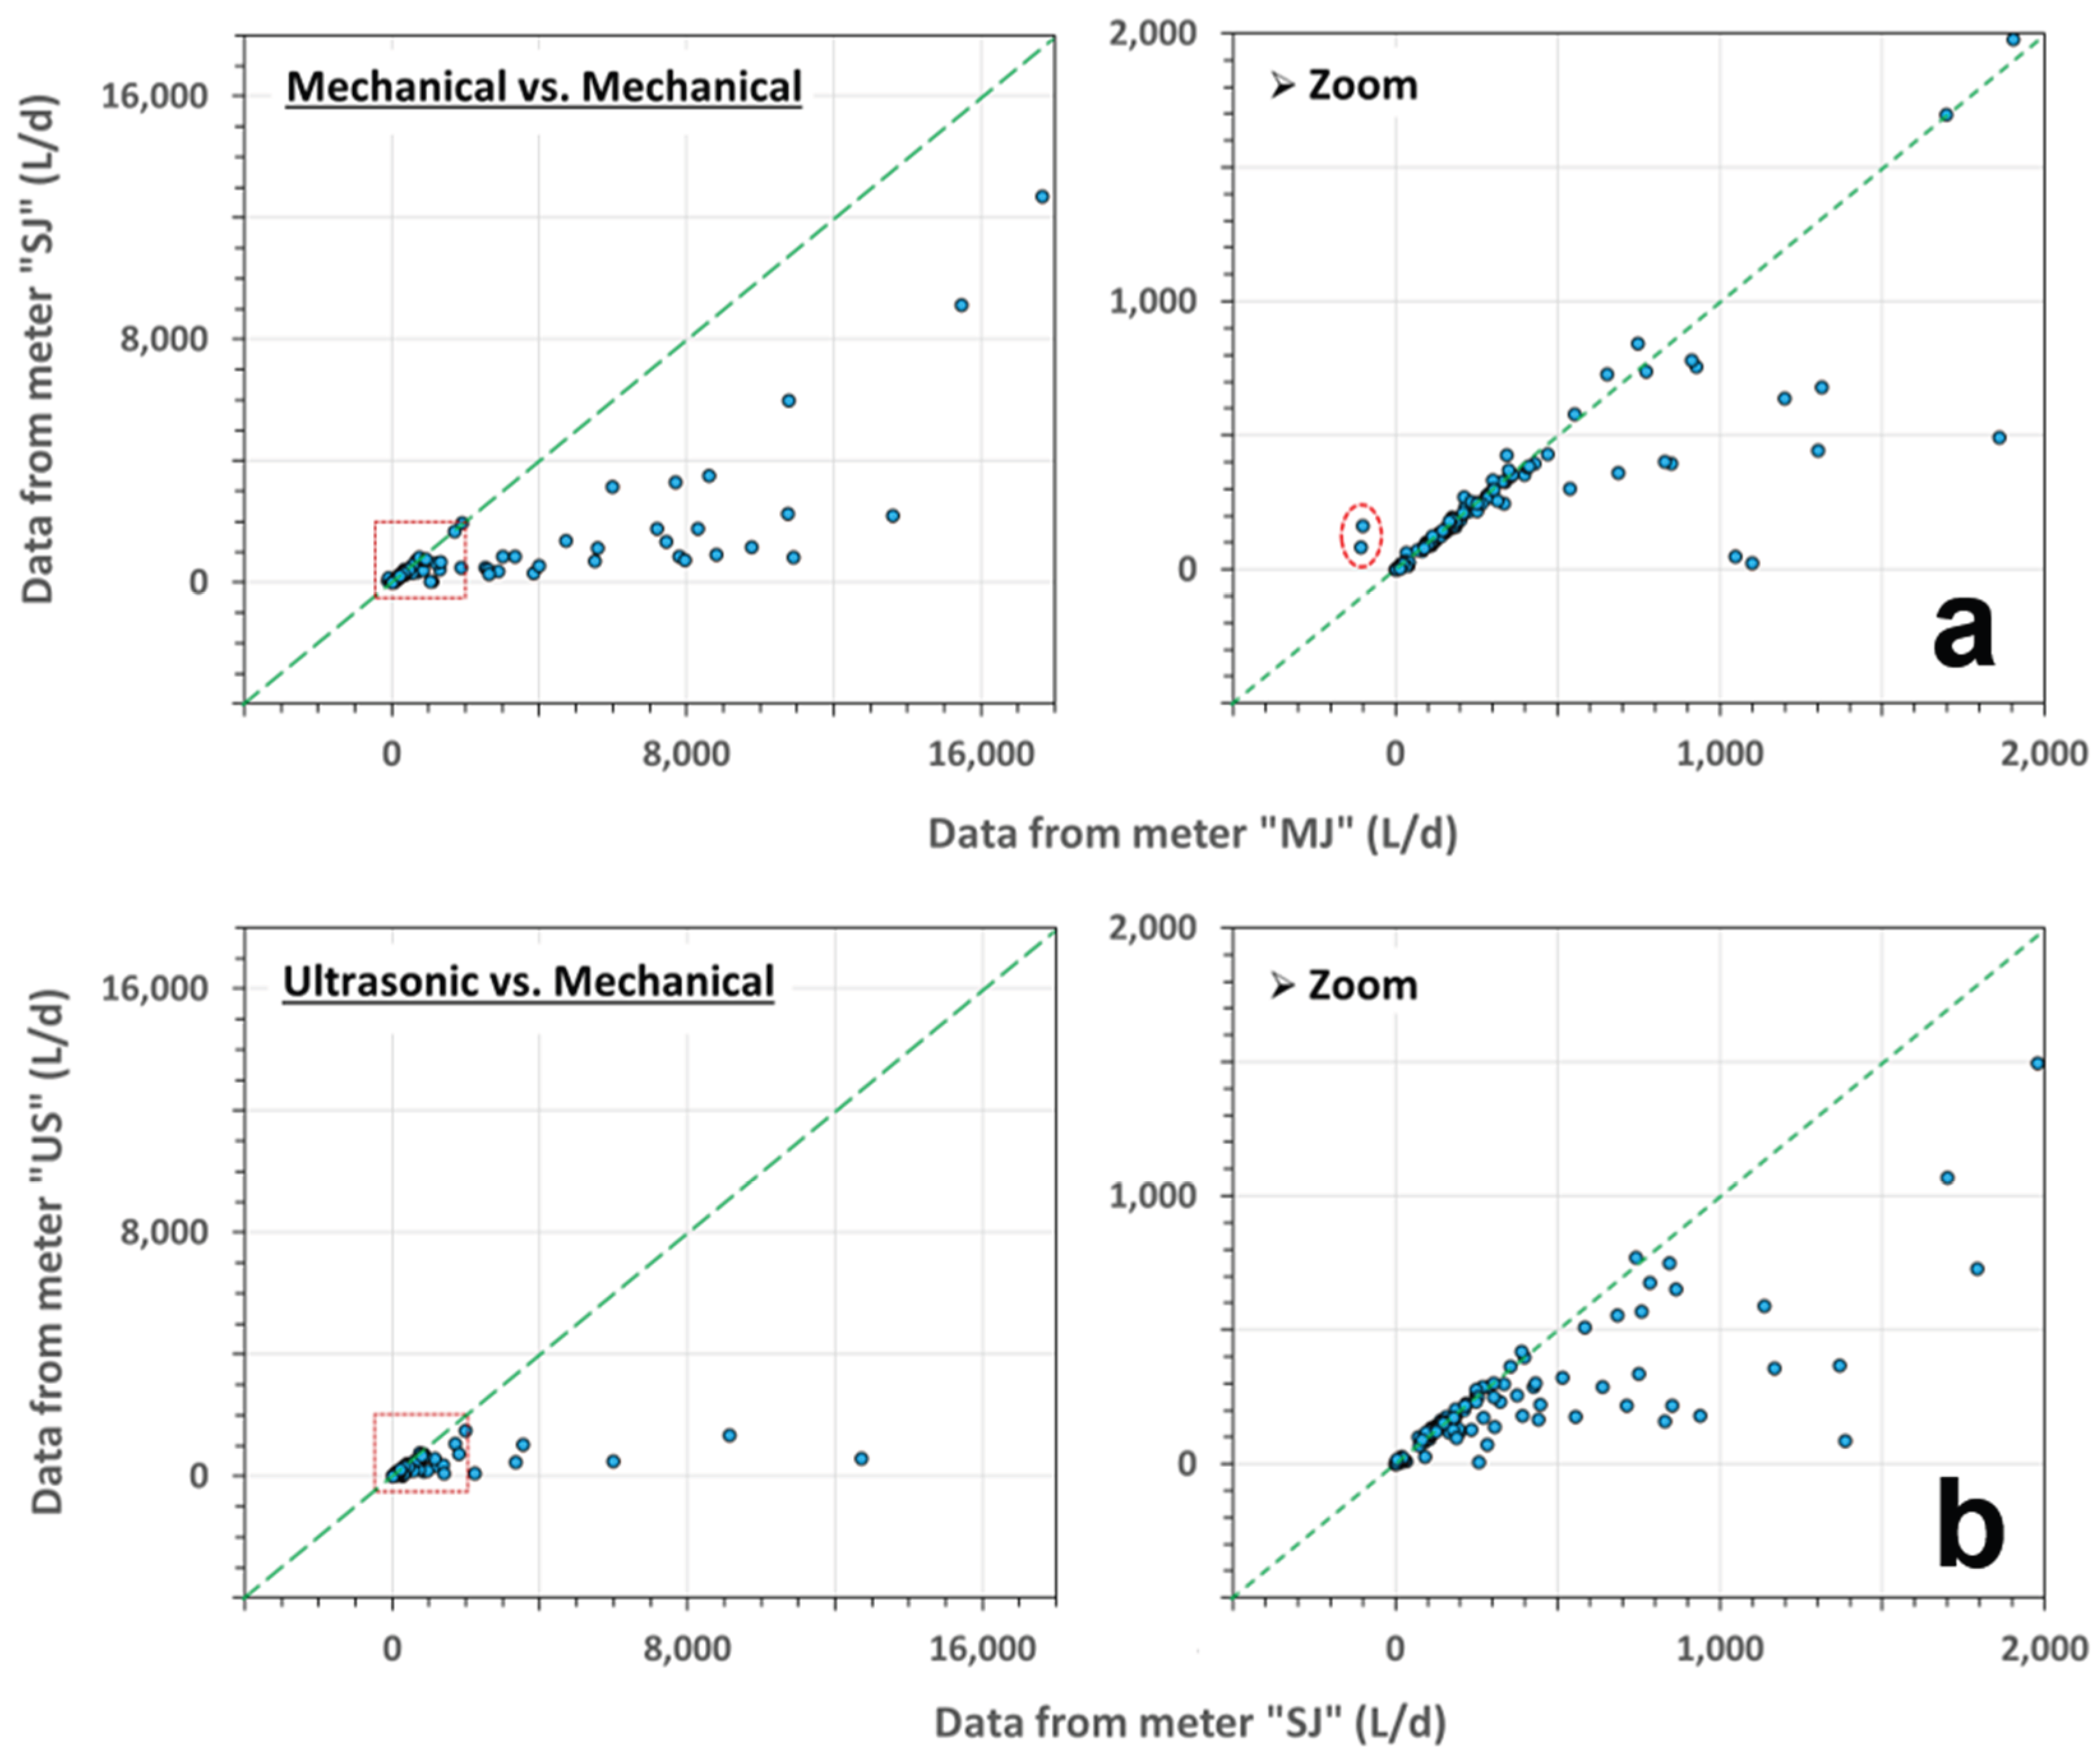
Figure 7.
Comparison of the total volumes estimated by the three water meters installed at the domestic intake of the studied house, during two periods of continuous supply: (a) at the middle of the monitoring campaign (since 27/09/2025 at 13:28); (b) at the end (since 30/11/2025 at 11:38).
Figure 7.
Comparison of the total volumes estimated by the three water meters installed at the domestic intake of the studied house, during two periods of continuous supply: (a) at the middle of the monitoring campaign (since 27/09/2025 at 13:28); (b) at the end (since 30/11/2025 at 11:38).
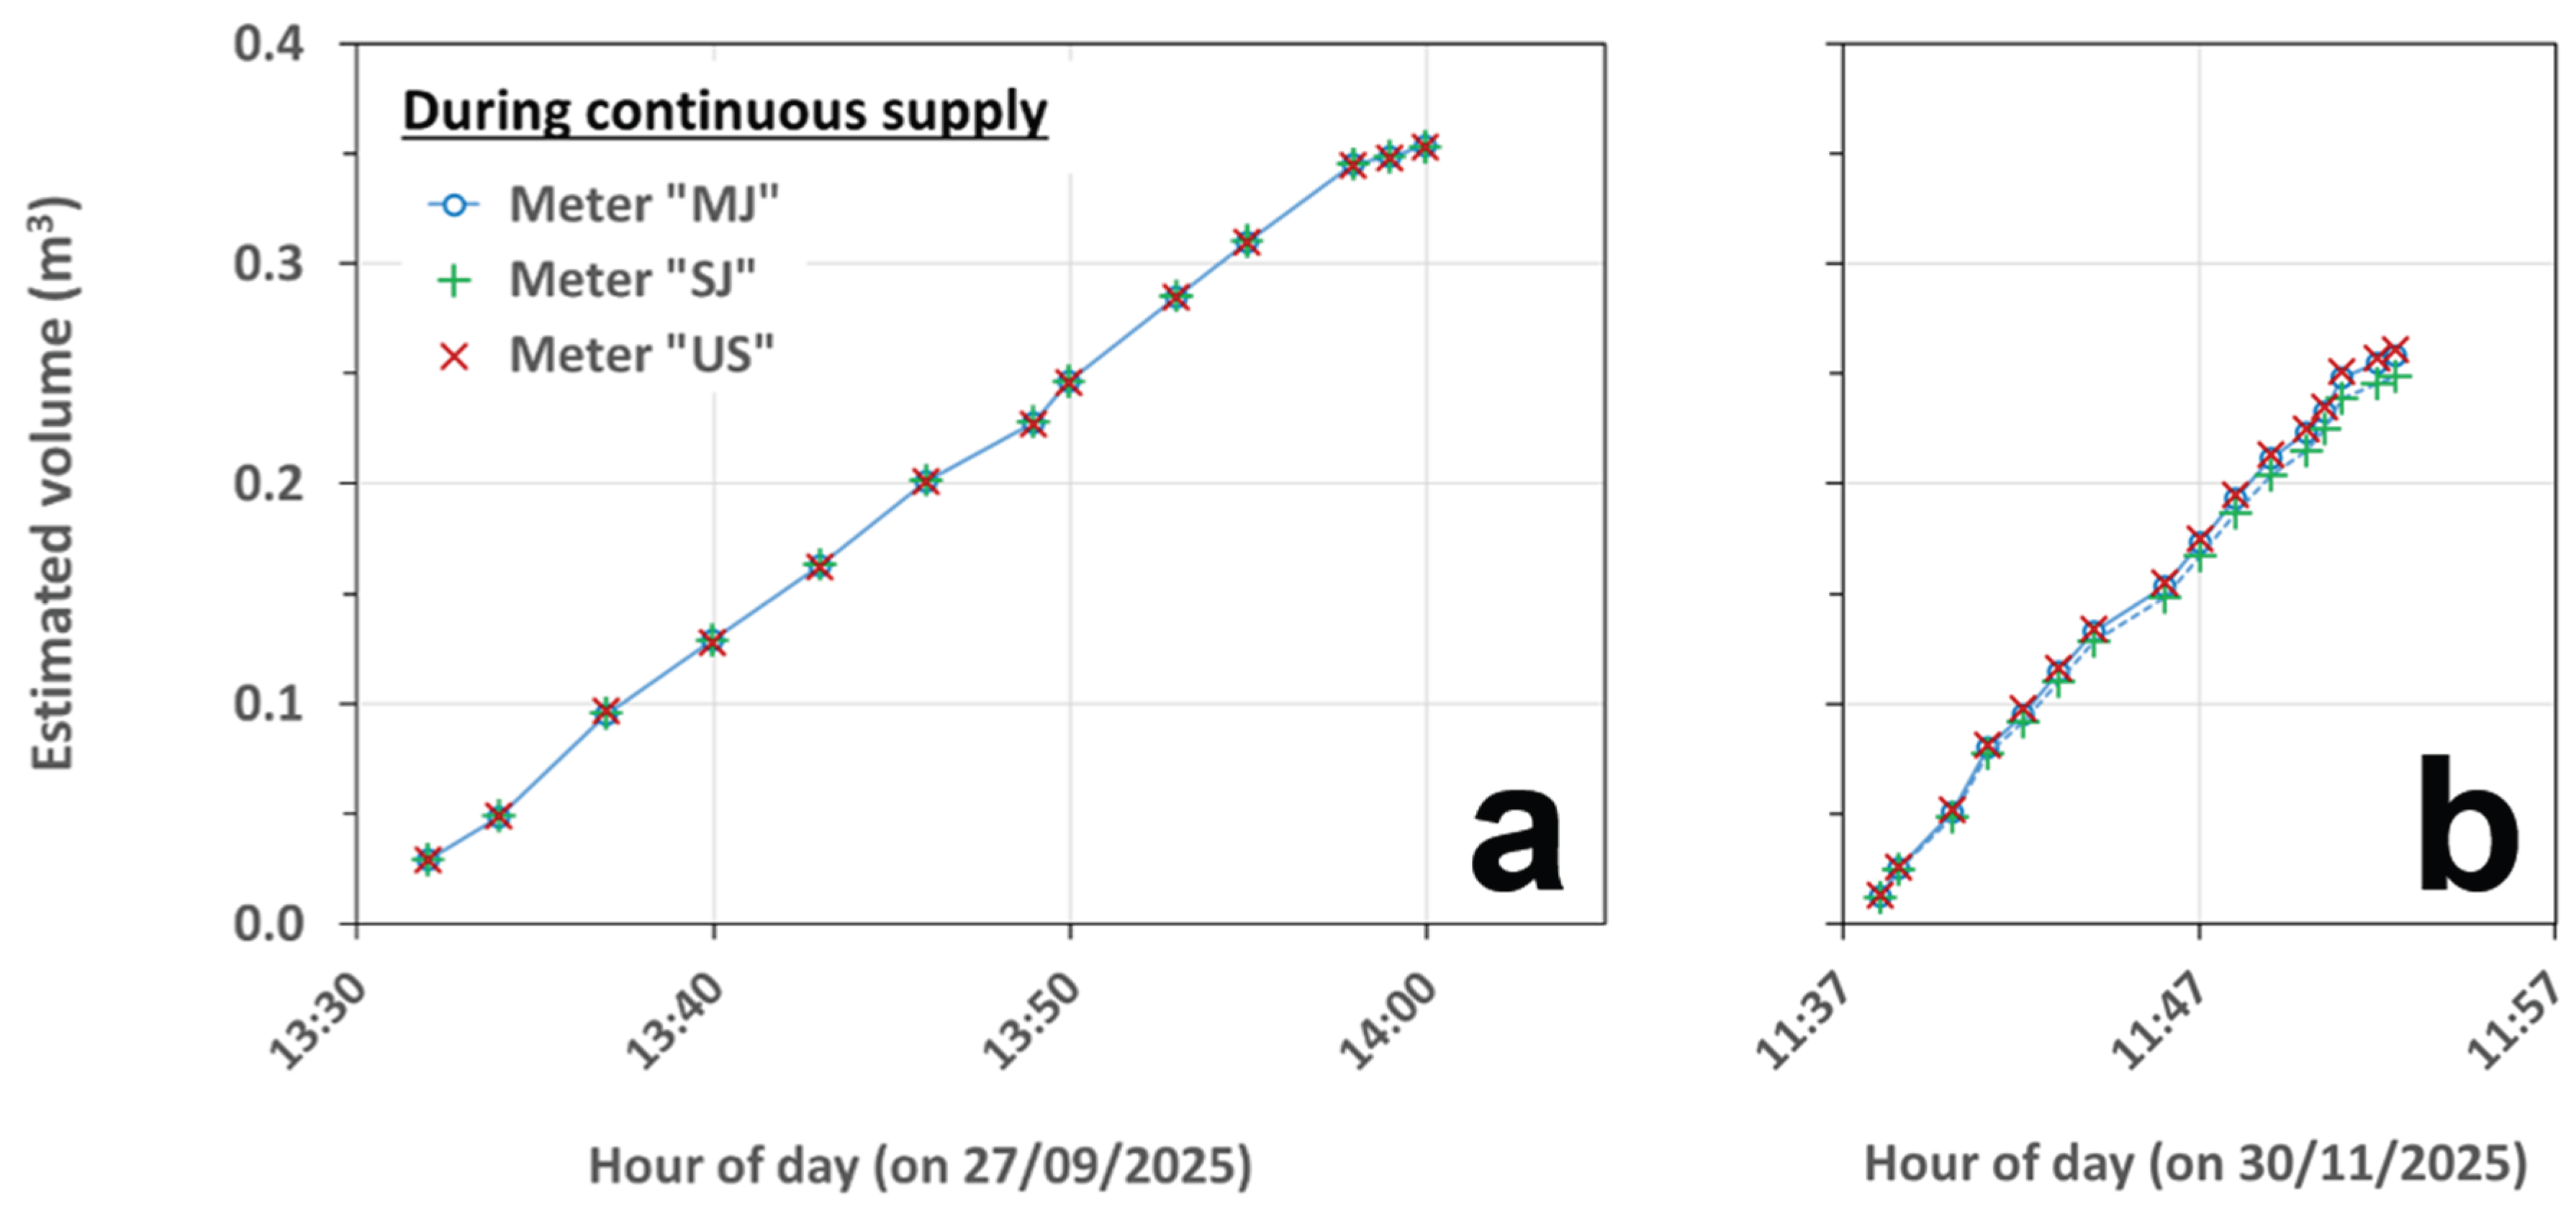
Interestingly, just after the installation of meter “US” (i.e., at the middle of the monitoring campaign), water supply at the domestic intake turned out to be continuous for some time; this was evident because: (1) the underground cistern of the studied house was seen filling up; (2) no air was heard coming out from the air-release valve “AV”, and (3) the ultrasonic meter “US” was estimating a flow rate of ≈ 700 L/h with no warning about air in pipes. This provided an opportunity to compare changes in volume displayed by the three meters “MJ”, “SJ” and “US” under continuous supply (until the cistern has filled, i.e., for ≈ 30 min). The result shows a satisfactory agreement (Figure 7a): in fact, differences between the estimation by each meter and the average value remained < 1 L during the whole test (i.e., < 0.3% of the total volume recorded at the end). A similar test was performed at the end of the monitoring campaign (on 30/11/2025), which also yielded satisfactory results (Figure 7b): in fact, differences between the estimation by each meter and the average value remained < 10 L (i.e., < 4% of the total volume recorded at the end).
3.3. Comparison with Another Meter Installed at the Roof Tank’s Outlet
For the reasons mentioned above (Section 2.2), two water meters were a priori considered as a reference during this study: (1) the ultrasonic meter “US” installed at the domestic intake (and thus strictly intended to estimate water supplied to the studied house), and (2) the mechanical meter “MJ-T” installed at the roof tank’s outlet (and thus strictly intended to estimate domestic water consumption). In this regard, the results obtained are as follows:
- Once installed, meter “MJ-T” proved to be accurate enough - According to a field verification done with a volumetric container (described in Section C.2), meter “MJ-T” proved to be accurate enough: indeed, its error was found to be within ± 5% for flow rates above the minimum flow rate (Figure C2).
- Good agreement was obtained between meters “MJ-T” and “US” - The comparison between meters “MJ-T” and “US” began once the underground cistern and the roof tank of the studied house were full. During this comparison, a satisfactory agreement was obtained (Figure 8); indeed, the difference between the readings of meters “MJ-T” and “US” was always < 560 L, which is: (1) realistic (i.e., not more than about the roof tank capacity), and (2) < 2.5% of the total volume recorded at the end of the comparison (which lasted ≈ 4 months).
Finally, Table 3 shows the domestic consumption and water leak estimated by the four meters installed in the studied house:
- Estimated domestic consumption - For a fair comparison, the average daily consumption has been computed over the same period of ≈ 4 months: (1) data from meters “US” and “MJ-T” are close and small (≈ 200 L/d), whereas (2) the data from meter “SJ” is substantial (≈ 2.5 times more), and (3) that from meter “MJ” is huge (≈ 7 times more).
- Estimated water leak - Water leak inside the studied house has been estimated over the periods of > 5 days during which the owner was away (these periods are shown on Figure 5a). Overall, the four meters estimated a low leak (even for a residential house (Tamari and Ploquet, 2012)), i.e.,: on average < 24 L/d. Admittedly, if we consider that a leak occurs at an almost constant flow rate (Tamari and Ploquet, 2012), it is worth noting that the estimated leaks (equivalent to < 1 L/h) are much lower than the minimum flow rate () from which the meters start to measure reliably.
4. Discussion
4.1. Interpretation of the Main Results
So, what would be the general cause of the very high domestic consumption estimated by mechanical meters “MJ” and “SJ”? Playing devil’s advocate, it could be argued that a tap left accidentally open is enough to explain water losses as large as ≈ 5,500 - 18,000 L in a day (see Table 3 of Mazzoni et al. (Mazzoni et al., 2023)). However, reviewing the results in reverse order leads to a different conclusion:
- Meter “MJ-T” was reliable - First, the mechanical meter “MJ-T” proved reliable for estimating the amount of water consumed from the house’s roof tank: (1) the meter was installed in an atypical but a priori correct way (i.e., on a pipe that should be always filled with water, and according to manufacturer’s specifications (ANCE, 2025), as described in Section C.1), and (2) it was verified in situ that the meter’s accuracy was acceptable (error within ± 5% for flow rates above Q1 = 35 L/h: see Figure C2).
- Meter “US” proved reliable - Next, the ultrasonic meter “US” installed at the domestic intake proved reliable for estimating the amount of water supplied to the studied house: indeed, there was a satisfactory agreement with meter “MJ-T” (Figure 8).
- There was no significant leak in the house - Since the first stage of the monitoring campaign, it was suspected that there was no significant leak in the studied house: assuming that meter “MJ” was not completely damaged (see next point), its erratic behavior (Figure 5a) was not compatible with that expected for a leak (which would ultimately have resulted in a rather regular increase in the recorded total volume) (Tamari and Ploquet, 2012). The absence of significant leak was confirmed by subsequent measurements: (1) when the house was unoccupied (Table 3), none of the used water meters estimated a large leak (at least, it is certain that the leak was < 3 L/h, i.e.,: less than the minimum flow rate of meter “US”), and (2) over the entire monitoring campaign, both meters “MJ-T” and “US” estimated a water consumption of ≈ 200 L/d on average (Table 3), which is realistic for one person (Mazzoni et al., 2023) (for more details, see Section C.3) and therefore contradicts the hypothesis of a significant leak.
- Meter “MJ” did not appear to be damaged - Contrary to the meter of a nearby house (Figure 4), meter “MJ” did not appear to be damaged over the course of the measuring campaign: (1) it was found to work properly during two periods of continuous water supply (Figure 7), and (2) it was often estimating daily volumes that were consistent with those from ultrasonic meter “US” (Figure 6). So, meter “MJ” was at least not completely destroyed.
- Air was most likely the cause of abnormal behavior of meter “MJ” - Having discarded the hypothesis of a significant leak (even hidden) and of that of a damaged meter (at least, clearly damaged), it turns out that the huge and erratic daily volumes estimated by meter “MJ” (Figure 5b) were most likely due to air sometimes coming from the supply network.
- Huge daily volumes estimated by meter “MJ” were most likely not due to a malfunction - Although it was not clearly damaged, it must be recognized that meter “MJ” has been exposed to severe conditions of use: when air was passing through it, its rotor may have sometimes been spinning extremely fast (Totsuka et al., 2004) (Foufeas and Petroulias, 2017) (for more details, see Sections B.3 and D.2), which may have caused the meter to malfunction (Sherman et al., 1923). However, meter “MJ” has a magnetic coupling between its rotor and gear system (according to its data sheet, and like most modern mechanical water meters (Arregui de la Cruz, 2016)): this coupling tends to slip when the rotor spins too fast, leading to under-registration (Arregui de la Cruz, 2016). Consequently, the huge daily volumes sometimes estimated by meter “MJ” were most likely not due to an eventual malfunction of the meter.
- Similarly, air must have been the cause of abnormal behavior of meter “SJ” - Like for meter “MJ”, the large daily volumes sometimes estimated by meter “SJ” (Figure 6) were most likely due to air in the supply network (admittedly, meters “MJ” and “SJ” did not behave in exactly the same way: this will be discussed in next Section).
- Direct observations support the idea that meters were affected by air flows - Finally, the fact that mechanical meters “MJ” and “SJ” were affected by air flows is supported by two direct observations: (1) following the installation of air-release valve “AV”, the owner of the studied house reported that he/she was often hearing air escaping from this valve (we have heard this too), and (2) on two brief occasions during which air was heard passing through the underground cistern’s inlet (whereas the roof tank was full), he/she could film the gear system of meters “MJ” and “SJ” turning in the normal direction, while meter “US” was displaying no flow (and a warning about “air in pipes”).
So, it has been shown that two mechanical water meters that do not seem to be damaged can greatly overestimate domestic consumption due to air in pipelines. To our best knowledge, this is the first time that a clear field evidence is published on this issue.
4.2. Further Discussion (with Some Numbers)
At this point, the question arises as to whether the abnormal data from mechanical meters “MJ” and “SJ” can be explained not only qualitatively (as just done), but also quantitatively (as far as possible). To this end, a few more details were obtained about the location and water supply of the studied house:
- Location of the studied house - As mentioned (Section 2.1), the studied house is almost at the top of a steep with an average slope ≈ 5.5°. More specifically, it turns out that: (1) the upper part of the street (over ≈ 50 m) has a gentle slope (≈ 1°), whereas (2) the lower part (over ≈ 200 m) has a much steeper slope (≈ 7°). Furthermore, the street is not a dead end, in the sense that it connects: (1) at the top to a street with a gentle slope, and (2) at the bottom to a larger street that is almost horizontal (according to an inclinometer app for smartphone and Google Earth).
- Water supply - According to a technician, the studied house is supplied with water as follows: (1) from the top of the street; (2) by a pipeline made of plastic (HDPE) and with diameter = 50 mm (which is quite plausible (Abu-Madi and Trifunovic, 2013)); (3) almost every day (which is consistent with the data shown on Figure 4), and (4) typically from morning until late afternoon (during the night, the underground valve that controls the supply to the street pipeline is generally closed, while the pipelines of other streets are supplied with water).
Next, three hypotheses are made; they greatly simplify the analysis that follows, and despite appearances, are not completely absurd:
- Hypothesis 1: sometimes, only air passes through a domestic intake - Admittedly, a flow of air mixed with water (unless dissolved (Kell, 1977)) should affect a mechanical water meter (Arregui de la Cruz, 2016): at least, this has been verified for water with air bubbles (Miranda, 2011) (Grando-Sirtoli et al., 2016). However, describing how a mixture of water and air can flow and affect water meters is out of the scope of this study, because it is very complicated (at least, there are different air/water regimes (Escarameia et al., 2005) (Zhou et al., 2020)). In what follows, only the case where pure air passes through a domestic intake is considered: this is sometimes plausible (Totsuka et al., 2004) (Foufeas and Petroulias, 2017) (Taylor, 2018) (Ferrante et al., 2022), and so it is appropriate to analyze this situation at a minimum.
- Hypothesis 2: sometimes, air behaves like an incompressible fluid - Furthermore, it is assumed that air can flows at an intermediate velocity: (1) fast enough, so that air easily spins the rotor of a device like meter “MJ” (Schubauer and Mason, 1937) (Alfonso-Corcuera et al., 2024), but (2) not too fast, so that air behaves almost like an incompressible fluid (Houghton and Carpenter, 2003). If so, a mechanical water meter should record the volume of air passing through it almost as if it were a volume of water; at least, this situation has been observed (to a first approximation) during certain laboratory tests (Miranda, 2011) (Grando-Sirtoli et al., 2016) (Walter et al., 2017) (Tavares, 2018) (for more details on the validity of this hypothesis, see Section D.1).
- Hypothesis 3: sometimes, the studied house was the only one receiving air from the street pipeline - Finally, it is assumed that at certain times, the studied house was virtually the only one of the street able to receive air from the supply pipeline (i.e., not the other ≈ 10 houses, if their storage facilities were full and with the float valves closed).
Based on the above considerations, three reasons that could explain how air in the street pipeline was affecting meter “MJ” are discussed:
- Possible reason 1: air flow due to fillings/emptyings of the water supply network - During the transient fillings/emptyings of a water supply network (Figure 9a), air is pushed/sucked and should therefore flow through the domestic intakes if it has no other way to escape (i.e., in the absence of air-release valves installed by the water agency at strategic locations along the network (Escarameia et al., 2005)). So, during network emptyings, there should be a reverse flow from houses to pipelines (Totsuka et al., 2004) (unless there is a check valve (ISO, 2005) (AWWA, 2012) (Arregui de la Cruz, 2016), which was not the case in the studied house); but this flow should be rather small, because the emptyings of a water supply network are usually more gradual than its fillings (Foufeas and Petroulias, 2017): (1) this seems in line with the finding that the (net) daily volumes estimated by meter “MJ” were sometimes negative, but not often (i.e., below -50 L/d on five occasions in a year; please, note that this cannot be due to a reverse flow of water, since the volume of the bypass shown on Figure 1 is < 40 L), although (2) this does not seem enough to explain why meter “MJ” has once estimated a daily volume as low as ≈ -1,900 L/d (indeed, the downstream street pipeline, which is ≈ 200 m long and ≈ 50 mm in diameter, has a volume of only ≈ 390 L; and if we consider that the emptying of the supply network was not limited to just the street pipeline, this would imply an additional length of ≈ 100 m for a pipeline with a diameter as large as 150 mm). On the other hand, during network fillings, there should be an air flow from pipelines to houses: (1) this seems in line with the fact that meter “MJ” was tending to overestimate domestic water consumption (Figure 5b), although (2) this is not enough to explain why it was sometimes estimating daily volumes > 5,500 L/d (as this would involve a considerable length of pipeline, even if considering a large diameter of 150 mm).
- Possible reason 2: reverse air flow caused by a hydraulic jump during periods of continuous water supply - During a period of continuous water supply, a hydraulic jump may develop in the lower part of an inclined pipeline (Figure 9b), and if this occurs, air can be sucked by the jump (Escarameia et al., 2005) (Pozos et al., 2010). This possibility was examined for the pipeline of the studied house: (1) a hydraulic jump can indeed take place, and (2) it could suck air at a rate of up to ≈ 180 L/h (according to the numerical application provided in Section D.3). If such a hydraulic jump remained stable for ≥ 12 hours, this could explain the (net) negative volume of ≈ -1,900 L recorded by meter “MJ” during one day.
- Possible reason 3: air flow when the street pipeline is not supplied with water - During periods when the domestic intakes of the studied street are not supplied with water (typically at night), those of the street below might be: (1) if so, air bubbles transported by water should tend to accumulate in the pipeline of the studied street (because it is sloped), and then (2) its domestic intakes could act like air-release valves (Figure 9c). In fact, a typical domestic intake (if considered as a pipe of diameter: o 13 mm) can easily release thousands of liters of air in a few hours (according to the numerical application provided in Section D.2). Unfortunately, due to the lack of details about the water supply network, we cannot estimate the amount of air that could be transported and released by the pipeline located in the street below.
- Summary - To sum up, the fact that meter “MJ” was affected by air in pipelines does not appear to be due to a single mechanism, but to at least three: (1) transient fillings/emptyings of the street pipeline (but this does not explain everything); (2) hydraulic jump in the street pipeline during periods of continuous supply (which can explain the lowest negative daily volume recorded once), and (3) accumulation of air during periods with no water supply of the street pipeline (which could potentially explain the huge positive daily volumes recorded quite often).
It is now necessary to try explaining the data from the two other studied mechanical meters:
- Meter “SJ” (single-jet): why were its data less dramatic? - Despite the fact that both meters “MJ” and “SJ” were affected by the presence of air in the street pipeline (Section 4.1), they did not behave in exactly the same way: (1) the overestimation of consumption by meter “SJ” was less pronounced, and (2) on some days, meter “MJ” estimated a negative consumption, whereas meter “SJ” never did (Figure 6a). Considering that both meters were installed at the same domestic intake, how can these two differences be explained? At least, this could be due to three reasons: (1) air had less chance to spin the rotor of meter “SJ” because it has a larger diameter (i.e., = 20 mm instead of= 13 mm, in which case air should pass through at lower velocity due to Bernoulli’s principle); (2) air also had more difficulty to spin the rotor of meter “SJ” because it was installed vertically (in which case the rotor’s pivot was exposed to greater friction (Arregui et al., 2006), resulting in a rather high minimum flow rate: = 40 L/h (Siemens, 2021)), and (3) unlike most single-jet meters (including “SJ”), multi-jet meters (like “MJ”) have a bypass (Arregui et al., 2006), which would make them more sensitive to air flow at rather low velocity (Walter et al., 2018) (for more details, see Section D.1).
- Meter of a nearby house (multi-jet): why was it apparently unaffected by air flows? - Unlike meters “MJ” and “SJ”, the meter from a nearby house did not seem to overestimate consumption during the monitoring campaign (Figure 4b). But if we consider that there was sometimes air coming from the street pipeline, why was no effect noticed on the meter during the measuring campaign? At least, this could be due to two reasons: (1) the device was worn out (in fact, it ended up completely stopped) (Arregui de la Cruz, 2016), and (2) a different location of the domestic intake relative to the street pipeline (see Figure 9). In any case, one observation suggests that the meter of the nearby house has been affected by air flows in the past: in the spring of 2025, its owner noticed once (at ≈ 3 o’clock in the morning) that the meter was making a lot of noise and that its display was changing very fast.
Finally, it remains to try explaining why the small air-release valve “AV” and inverted siphon “IS” installed at the domestic intake of the studied house proved ineffective:
- Why was the air-release valve ineffective? - An air-release valve installed just upstream of a water meter can let air escape to the atmosphere, but without preventing flow toward the meter. In this case, the air-release valve “AV” installed by the owner of the studied house (Figure 10) was virtually ineffective because its orifice (diameter ≈ 1 mm) is small compared to that of meter “MJ” ( = 13 mm). The ineffectiveness of small air-release valves installed at domestic intakes is commented by Arregui (Arregui de la Cruz, 2016) and Taylor (Taylor, 2018). It is true that a valve with a larger orifice can be effective, but then there will be more risk of water hammer during valve closures (Lingireddy et al., 2004) (Zhou et al., 2020) (Ferrante et al., 2023) (for more details on air-release valves, see Section D.2).
- Why was the inverted siphon ineffective? - By modifying the shape of a domestic intake so as to form a small inverted siphon “IS” (Figure 2c), it was hoped that air would have more difficulty to pass through; this proposal was based on laboratory tests (Walter et al., 2017) (Walter et al., 2018) and a suggestion from an author who confesses: “despite the apparent efficacy of this simple solution, the author has never seen the recommended configuration used” (Taylor, 2018). But it turned out that the inverted siphon was ineffective: it must then be admitted that air pressure in the supply pipeline was usually high enough to overcome the small hydrostatic pressure in the siphon (of ≈ 300 Pa, which is equivalent to 30 cm of water column) (Weston et al., 2023). In fact, according to the owner of the studied house, pressure in the supply pipeline was sometimes high enough for water to rise directly to the roof tank.
4.3. Significance of the Case Reported
To assess the significance of this study, it is worth recalling the context in which it was conducted:
- Concern of citizens about air in pipelines - In many areas with intermittent supply, citizens worry that their water meter overestimates domestic consumption due to air in pipelines (Totsuka et al., 2004); this concern is reflected by: (1) comments in the non-academic literature (in the form of newspaper articles, blogs on the Internet, and commercials for supposedly simple remedies) (Tavares, 2018), and (2) air-release valves installed at domestic intakes (Figure 11).
- Previous studies about air in pipelines - It is known for a long time (at least since Woltmann, at the end of the 18th century (AWWA, 2012)) that meters with a light rotor designed to measure water velocity in open channels (Schubauer and Mason, 1937) or in closed pipes (AWWA, 2012) are sensitive to an air flow: in short, these meters can behave like a cup anemometer. But surprisingly, the fact that this could be an issue for domestic water meters (Arregui de la Cruz, 2016), especially in areas with intermittent supply (Jopling, 1857) (Totsuka et al., 2004) (Foufeas and Petroulias, 2017), has been little studied (according to the published literature). Yet, the concern of citizens tends to be supported by a growing number of laboratory studies (Miranda, 2011) (Cornejo Cid, 2013) (Grando-Sirtoli et al., 2016) (Walter et al., 2017) (Walter et al., 2018) (Tavares, 2018) (Ferrante et al., 2022) (Ferrante et al., 2025): indeed, they have shown that when a volume of air (defined at normal conditions for temperature and pressure) passes through a mechanical water meter (at least, single-jet or multi-jet), it can record ≈ 0 - 150% of this volume (depending mainly on air velocity, as argued in Section D1). But then, if we consider, for example, that the filling of a water supply network pushes towards a domestic intake an air volume of ≈ 100 L (i.e., the volume of the pipeline upstream of the studied house; for other houses, this volume can be very different (Taylor, 2018) (Ferrante et al., 2025)), it should produce a meter error of ≈ 0 - 150 L (equivalent to ≈ 0 - 0.9 time the typical daily water consumption of one person (Mazzoni et al., 2023)).
- This study - Compared to previous laboratory studies, this field study reports a very high overestimation for at least two mechanical water meters installed at the same house: on average ≈ 2.5 times the real water consumption in the case of meter “SJ”, and ≈ 7 times in the case of meter “MJ” (Table 3). Admittedly, the meters have most likely been affected by air flows for several reasons, due to: (1) intermittent supply; (2) sloppy street, and (3) sparsely occupied area. Furthermore, the city’s water agency may have operated the supply network in an unusual manner: we have no information on this (which is a major limitation of the study). So, it could be that the case reported is uncommon, but to find out, further studies are needed.
Otherwise, the study shows that in areas with intermittent water supply, it is not so easy to diagnose an effect of air flow on mechanical water meters:
- The effect of air in pipelines can vary greatly over time - Compared to other reasons that could explain a high water bill (i.e., hidden leak inside a house (Tamari and Ploquet, 2012), or bypass of a multi-jet meter that gets clogged (Arregui et al., 2006)), the effect of air in pipelines on a mechanical water meter should vary greatly over time (e.g., Figure 5): indeed, it will at least depend on the status of houses’ storage facilities (i.e., with float valves open or closed). But to what extent can this temporal variability be distinguished from that of normal water consumption (e.g., Figure 4)?
- To detect an effect of air in pipelines, water meters must be read often - A high temporal variability implies that to understand the abnormal behavior of a meter, it is necessary to take readings often (at least, every day). But when they have doubts about their water meter, citizens generally take readings from time to time, which may not be enough: for example, if readings of meter “MJ” were taken only once a month (Figure 12), it would not be possible to understand what was happening (apart a high estimated consumption, as noted by the owner of the studied house).
- The effect of air in pipelines should vary greatly in space - Furthermore, mechanical water meters should be affected by air in pipelines quite differently from one house to another: (1) not only because air tends to accumulate in the upper parts of water supply networks (Totsuka et al., 2004) (Pozos et al., 2010) (Weston et al., 2023), but also (2) because the rotating element of meters can spin more or less easily (as argued in Section 4.2, it depends on the meter’s minimum flow rate ).
- Air in pipelines can flow through water meters for different reasons - Finally, it is worth noting that most previous studies about the effect of air on water meters (Cornejo Cid, 2013) (Walter et al., 2017) (Walter et al., 2018) (Tavares, 2018) (Ferrante et al., 2022) (Ferrante et al., 2023) (Ferrante et al., 2025) (Ferrante, 2025) focus on a specific reason: the fact that air in pipelines is pushed/sucked during the fillings/emptyings of a supply network (Figure 9a). However, this study suggests that air in pipelines can flow through meters for at least two other reasons, i.e.,: (1) a hydraulic jump that may develop in a steep pipeline during periods of continuous supply (Figure 9b), and (2) a pipeline that remains a dead end during the continuous supply of downstream pipelines (Figure 9c); although these phenomena have been studied extensively (both the hydraulic jump (Escarameia et al., 2005) (Pozos et al., 2010) and the dead end (Totsuka et al., 2004) (Weston et al., 2023)), their practical importance from a metrological point of view has not yet been examined in detail.
5. Recommendations
A condition for conventional water meters (mechanical) to work properly is that the pipe on which they are installed is completely filled with water (OIML, 2024). But this condition is not always met in the field, especially in areas with intermittent water supply. In this context, the case reported allows to make three recommendations:
- Do not fully trust the cheap devices supposed to avoid air passing through water meters - When there is air in pipelines (which depends on the operation by water agencies), there does not seem to be a simple way for citizens to efficiently prevent it from passing through domestic intakes (Arregui de la Cruz, 2016): as seen, installing a small air-release valve and an inverted siphon did not solve the problem of the studied house.
- Study more how air affects mechanical water meters - So, there is a need to study more how air in pipelines can affect mechanical water meters; it should depend on: (1) not only the characteristics of the water supply network (including its topography, density of domestic intakes, and filling speed) (Totsuka et al., 2004) (Weston et al., 2023), but also (2) the consumption habits of households (which impact the status of their storage facilities, i.e.,: with float valves open or closed), and (3) the actual minimum flow rate of meters (which depends on the device’s installation and wear).
- Consider alternatives for measuring water consumption - Otherwise, some non-mechanical meters can be considered as an alternative for measuring domestic water consumption: (1) electromagnetic meters are now formally accepted by the OIML (OIML, 2024), and (2) ultrasonic meters might soon become popular (Arregui et al., 2020) (Ferrante, 2025). Admittedly, these new water meters can be affected by air in pipelines (Arregui de la Cruz, 2016), but to a lesser extent (Miranda, 2011) (Yao et al., 2021). And although they are more expensive than conventional meters (≈ 2 to 4 times more) (Foufeas and Petroulias, 2017), this is negligible when considering the benefits in situations like the one just described.
Author Contributions
Conceptualization, S.T.; methodology, S.T. and V.A.-C.; investigation, S.T.; formal analysis, S.T. and V.A.-C.; writing, S.T. Authors have read and agreed to the published version of the manuscript.
Funding
This research was conducted outside of working hours as a private (non-profit) investigation: it was funded by the owner of the studied house, who bought the necessary accessories (including three extra water meters) and paid a plumber for the work done.
Data Availability Statement
The main data supporting the reported results are digital photos taken during the monitoring campaign: each photo shows the display and ID of water meters, and has an EXIF header (Soni, 2025) with the date and geolocation. They are not shared for privacy reasons.
Acknowledgments
Many thanks to the owner of the studied house for allowing this research, taking photos of water meters every day, and sharing observations. Thanks also to the owners of a nearby house for taking photos of their own water meter, and of the others on some occasions.
Conflicts of Interest
The authors declare no conflicts of interest. Brand names are mentioned for identification purposes only.
Appendix A - Ethical Justification of the Study
A.1. Why the Study was Conducted in this Manner
It is not allowed to modify a domestic intake without the permission of a water agency. So, it is necessary to justify why this was done during the study (Thomas et al., 2017) (Ienca and Vayena, 2021). Fundamentally, there was an interest in understanding the strange behavior of a water meter and finding a technical solution:
- Decision to install an air-release valve - When, after four months of daily observations, it appeared that there was very likely a problem of air coming from the water supply network, the owner of the studied house became convinced by commercials that an air-release valve would be the remedy. But in the list of services offered by the city’s water agency, he/she found no information about air-release valves. So, he/she decided to hire a plumber for installing one.
- Decision to further modify the domestic intake - Then, when it became apparent that the air-release valve was not effective, the house’s owner asked us for technical suggestions and agreed to implement them. Since the staff of the water agency was not coming (unless asked to perform a service, like taking a reading before the sale of a house or replacing a damaged meter), this turned out to be a rare opportunity to investigate how water meters behave under real conditions of intermittent supply.
A.2. Potential Harms and Benefits
It should be stressed that the activities described in this study have been carried out with no bad intention:
- No intention to steal water - The house’s owner had no intention to steal water. In the end, there was no meter tampering, nor any water extraction upstream of it.
- No intention to cause damage - The activities described in the study have been carried out with no intention to cause damage. Admittedly, the decision of the house’s owner to install an air-release valve was somewhat imprudent, because it could have damaged the domestic intake (i.e., its pipe and water meter) due to water hammer (as discussed in Section D.2). In this regard, he/she trusted the plumber, who argued that similar valves were installed in the neighborhood.
Yet, it is necessary to assess whether this study could cause harm or benefit to society (i.e., people and institutions) (Thomas et al., 2017) (Ienca and Vayena, 2021). In this regard, it appears necessary to focus primarily on water agencies:
- For water agencies, the eventual harm would not be new - This study could harm some water agencies, as it could prompt consumers to complain more about their water bills. But this type of complaint is not new, according to the many comments in the non-academic literature (Totsuka et al., 2004) (Taylor, 2018) (Tavares, 2018). In such a context, this study tries to address a technical issue objectively (through the acquisition and analysis of experimental data) and to suggest practical solutions (like the use of non-mechanical water meters).
- For water agencies, the potential benefit would be a better knowledge of water meters - Urban water agencies want domestic intakes to be equipped for optimizing water supply and for billing purposes (Totsuka et al., 2004) (Kumpel et al., 2017). In both cases, it is important to know well the magnitude of water meter errors (Lambert, 2002); in fact, this is a matter of legal metrology (Taylor, 2018) (OIML, 2024). Such knowledge may require specific research on the behavior of meters (Arregui et al., 2006), which is the topic of this study.
Otherwise, the study seems valuable for citizens: indeed, they have the right to be informed about how their water meter works, including the measurement issues and possible remedies.
A.3. Decision to Publish the Study
Given that this study appears to offer more benefits than harms for the society, as it contributes to a better knowledge of water meters, it was decided to make it public. But to protect the privacy of the owner of the studied house, it was also decided not to reveal certain details (Thomas et al., 2017) (Ienca and Vayena, 2021). The house’s owner then gave his/her written consent for the publication of the study.
Appendix B - Review on Water Meters’ Errors
B.1. Categories of Water Meters
From a practical point of view, today’s water meters designed for domestic intakes can be classified into three categories; the first two refer to conventional devices, and the third to prototypes:
- Mechanical meters - Mechanical water meters can be divided into two sub-categories: (1) “velocity meters”, which are either single-jet or multi-jet (in both cases, they have a rotor whose angular speed increases with the velocity of water passing through the meter), and (2) “volumetric meters”, which have either an oscillating piston or a nutating disc (Sherman et al., 1923) (Arregui et al., 2006) (AWWA, 2012). Whereas both sub-categories are common in areas with continuous supply, only the first one is common in areas with intermittent supply (Arregui et al., 2006) (Walter et al., 2018) (Taylor, 2018).
- Non-mechanical meters - Nowadays, non-mechanical water meters are: (1) ultrasonic (and based on the “transit time” principle (Lynnworth, 2013)), or (2) electromagnetic (Arregui et al., 2006). To date, these meters are much less common than mechanical meters: in fact, their ability to measure domestic water consumption is still being evaluated (Arregui et al., 2020) (Yao et al., 2021). Nevertheless, they are growing in popularity (Arregui et al., 2020) (OIML, 2024) (Ferrante, 2025).
- Prototypes - Apart from the meters previously mentioned, it is possible that others will become available to citizens in the future: (1) mechanical prototypes (like the one proposed by Taylor (Taylor, 2018) with a brake acting on the meter rotor, or the one proposed by Ahmed & Abdullah (Ahmed and Abdullah, 2023) with electrodes supposed to detect air in pipes), and also (2) non-mechanical meters based on other physical principles (e.g., (Lynnworth, 2013) (Ejeian et al., 2019)).
When everything works normally, water meters are expected to estimate the total volume of water supplied to households with an error better than ± 5% (OIML, 2024). However, these devices can sometimes exhibit errors out of this range (Arregui et al., 2006). Given the popularity of (conventional) mechanical meters, the rest of this Appendix discusses their systematic errors, when water supply is either continuous or intermittent.
B.2. Commonly Reported Errors of Mechanical Meters
One condition for mechanical water meters to work properly is that the pipe on which they are installed is “completely filled with water” (OIML, 2024). But even when pipes are filled with water, a mechanical meter can underestimate or overestimate the volume of water that passes through it. Without considering those due to an improper meter installation (Arregui et al., 2006) (Arregui de la Cruz, 2016), the commonly reported systematic errors of mechanical meters are:
- Low flows cause under-registration - When water flows slower than the “minimum flow rate” () of the device (OIML, 2024), a mechanical meter tends to underestimate the volume of water that passes through it (Arregui et al., 2006) (Arregui de la Cruz, 2016) (see Figure C2 for an example). This low flow and associated under-registration can be due to: (1) a low pressure in the supply network (something common in areas with intermittent supply) (OIML, 2024); (2) a leak inside a house (hidden leak or tap left slightly open) (Arregui et al., 2006) (Tamari and Ploquet, 2012), or (3) an effect of the closure of certain valves inside houses (especially those float valves that controls the filling of underground cisterns and roof tanks, which are common in areas with intermittent supply) (Lambert, 2002) (Arregui et al., 2006) (Charalambous et al., 2007) (Criminisi et al., 2009) (Taha et al., 2020).
- Very high flows generally result in under-registration - When water flows faster than the “overload flow rate” () of the device (OIML, 2024), a mechanical meter generally tends to underestimate the volume of water passing through it (Arregui et al., 2006). This is mainly due to the fact that most mechanical meters have now a magnetic coupling between their rotating element and gear system, which Arregui (Arregui de la Cruz, 2016) considers as “one of the weak points of modern [mechanical] water meters”: indeed, the coupling may slip when the rotating element moves very fast, leading to under-registration.
- Partial clogging of velocity meters usually produces over-registration - When its inlet gets partially clogged, a velocity meter tends to overestimate the volume of water passing through it (Sherman et al., 1923) (Arregui et al., 2006) (Arregui de la Cruz, 2016): (1) this is particularly noticeable if the meter has a bypass (as is the case with multi-jet meters, and with some single-jet meters) and if said bypass is obstructed (Arregui et al., 2006), and (2) over-registration due to partial clogging can be as high as ≈ 25% of the recorded volume (Arregui et al., 2006). However, if clogging becomes severe, a water meter may then: (1) tend to under-register, and (2) ultimately stop water from passing through (Arregui et al., 2006) (Arregui de la Cruz, 2016).
- A worn meter tends to under-register - A mechanical meter generally tends to under-register when its moving parts have worn out (Arregui et al., 2006) (Arregui de la Cruz, 2016) (see Figure 4 for an example). For this reason, many water agencies have a policy of replacing domestic water meters after ≈ 10 years (Lambert, 2002).
B.3. Possible Effect of Air on Mechanical Meters
Since this is the focus of this study, it is now necessary to consider what could happen with a mechanical water meter when it is exposed to an air flow:
- Mechanical meters tend to get worn faster due air flow - Air passing through a mechanical water meter fast enough so as to propel its rotating element (normally in contact with water) can damage the device for two reasons: (1) wear of the rotating element due to increased friction (because air does not lubricate as well as water (Ferrante et al., 2022) (Ferrante et al., 2025)), and (2) wear of the gear system if it rotates at excessive speed (Sherman et al., 1923) (Arregui de la Cruz, 2016) (because air is compressible, it can indeed flow very fast in a pipeline: at first, it tends to compress, even if only slightly, and then it tends to escape fast if there is an opening (Foufeas and Petroulias, 2017) (Weston et al., 2023) (Ferrante et al., 2023); for more details, see Section D.2). Accordingly, mechanical water meters tend to get worn rapidly in areas with intermittent water supply (Totsuka et al., 2004) (Foufeas and Petroulias, 2017).
- Possible under-registration during the emptying of a supply network - During the emptying of a water supply network, air is pulled from domestic intakes (unless there is a check valve (ISO, 2005) (AWWA, 2012)). Then, one might expect this reverse flow of air to propel the moving part of mechanical meters so as to cause under-registration (Totsuka et al., 2004). But of how much? This is not said in the literature (to our best knowledge). In this regard, it should be noted that the emptying of a supply network is usually more gradual than its filling (Foufeas and Petroulias, 2017): thus, the under-registration by mechanical water meters during the emptying of a supply network should be less pronounced than the over-registration during the network filling (mentioned next). Based on the results from this study, such a hypothesis is examined in Section 4.2.
- Possible over-registration during the filling of a supply network - Conversely, during the filling of a supply network, air inside pipelines is pushed towards domestic intakes (if it has no other way to escape). Then, one might expect the air to propel the moving part of mechanical meters, resulting in an over-registration (Foufeas and Petroulias, 2017). But of how much? The literature on this topic is scarce, as argued below.
The eventual over-registration by mechanical water meters due to air flow is a concern for households in many areas with intermittent supply (Totsuka et al., 2004) (Taylor, 2018) (Tavares, 2018). However, this issue is not much discussed in the (scientific) literature:
- Rough estimates - Some authors provide a rough estimate for the over-registration; it is obtained by assuming that the over-registration is: (1) only due to the air pushed during the filling of a supply network, and (2) equal to the internal volume of pipelines in the supply network (at least, those that are not too large, i.e.,: with a diameter < 100 mm (Ferrante et al., 2025) or < 300 mm (Taylor, 2018)) divided by the number of domestic intakes within a given area. In this way, the over-registration was estimated for several water supply networks: on average, it should represent ≈ 0.03 - 0.3 time the daily consumption of households (Ferrante et al., 2022) (Taylor, 2018) (Ferrante et al., 2025). However, it is important to note that there should be large disparities between houses (Taylor, 2018) (Weston et al., 2023).
- Laboratory studies - A growing number of studies support the idea that mechanical water meters (at least, single-jet and multi-jet) can sometimes significantly over-register due to air passing through them, whether in the form of (Table B1): (1) air pushed by water during a pipeline filling, or (2) air mixed with water (but without being dissolved). Overall, these studies show that meters can record ≈ 5 - 90% of the air volume (defined at normal conditions for temperature and pressure), and even up to ≈ 150% for multi-jet meters exposed to certain flow rates (Walter et al., 2018). Such over-registration should depend primarily on air velocity (as argued in Section D.1). Nevertheless, the mentioned studies are based on laboratory tests, not on real-life situations.
- Field studies - One author (Tavares, 2018) cites the case of a household whose water meter appeared to over-register very much due to air in pipelines, but the results are not presented. Otherwise, a recent field study (Ahmed and Abdullah, 2023) also suggests that mechanical water meters can over-register under intermittent supply: according to its authors, the volume of supplied water can be overestimated ≈ 0.2 - 0.6 time due to air in pipelines; however, this study is poorly detailed and debatable: it is based on a prototype with an electrical sensor (presumably resistive or capacitive) supposed to detect air in pipes (but this has not been clearly verified), and it compares water volumes estimated before and after the prototype’s installation (which may have had a psychological effect on the studied households).
To sum up: (1) whereas the causes of under-registration by mechanical meters (which affects water agencies when it comes to billing for supply (Lambert, 2002)) have been extensively studied (Lambert, 2002) (Arregui et al., 2006) (Criminisi et al., 2009) (Taha et al., 2020), the potential over-registration due to an air flow (which would primarily affect citizens) has been little studied; (2) yet, a growing number of laboratory tests suggest that this could be an important issue (Miranda, 2011) (Grando-Sirtoli et al., 2016), particularly in areas with intermittent supply (Cornejo Cid, 2013) (Walter et al., 2017) (Walter et al., 2018) (Taylor, 2018) (Tavares, 2018) (Ferrante et al., 2022) (Ferrante et al., 2025) (Ferrante, 2025), but (3) in the end, there is a surprising lack of field studies on the metrological implication of air in pipelines (apart from a debatable test (Ahmed and Abdullah, 2023)).

Table B1.
Laboratory studies about the effect of an air flow on mechanical water meters.
| Reference | Tested meters | Type of flow | Air volume (%) recorded by water meter 1 |
|---|---|---|---|
| Miranda (Miranda, 2011), Brazil | multi-jet( = 40 mm) | Constant / Bubbles (3 rates) |
➢ High (≈ 85%) for the tested flow rates |
| Cornejo Cid (Cornejo Cid, 2013), Chile | multi-jet( = 13 mm) | Constant / Bubbles (5 rates) |
➢ Increase (from ≈ 5 to 50%) with flow rate, but air effect was probably underestimated 2 |
| Taylor (Taylor, 2018), USA | multi-jet( = 13 mm) | Constant / Bubbles (> 10 rates) |
➢ n/a 3 |
| Grando-Sirtoli et al. (Grando-Sirtoli et al., 2016), Brazil | single-jet( = 13 mm) | Constant / Pure air (1 rate) |
➢ High (≈ 80%) for the tested flow rate |
| Tavares (Tavares, 2018), Brazil | single/multi-jet( = 13 mm) | Constant / Pure air (8 rates) |
➢ Increase (from ≈ 0 to 90%) with flow rate |
| Walter et al. (Walter et al., 2017), Germany | single-jet( = 13 mm) | Transient / Pure air (10 initial rates) |
➢ High (≈ 90%) if initially dry meter ➢ Usually high (≈ 70%) if initially wet meter |
| Walter et al. (Walter et al., 2018), Germany | multi-jet( = 13 mm) | Transient / Pure air (10 initial rates) |
➢ Decrease (from ≈ 150 to 60%) with flow rate, if initially dry meter 4 ➢ Usually low (≈ 15%) if initially wet meter |
| Ferrante et al. (Ferrante et al., 2022), Italy | single/multi-jet( = 13 mm) | Transient / Pure air (1 initial rate) |
➢ Variable (between ≈ 30 and 60%), while air was flowing very fast through meters |
1 Recorded air volume divided by the injected air volume. 2 Indeed, a mechanical meter (of the oscillating piston type) was used as a reference. 3 The tests described are to assess whether a meter prototype can impede an air flow. 4 Flow rate data are not available.
Appendix C - Water Meter at Roof Tank’s Outlet
C.1. Meter Installation
Provided that all the water supplied at the domestic intake is sent to a roof tank (either directly or from a cistern), it is attractive to install a water meter at its outlet for measuring (unofficially) domestic consumption: (1) there should be no problem with air flow (which is the topic of this study); (2) the meter accuracy can be easily verified (see Section C.2), and (3) there is no legal issue with water agencies. However, it should be remembered that: (1) the meter will still underestimate slow water consumption events (i.e., occurring at a flow rate below the meter’s minimum flow rate ) (Charalambous et al., 2007) (Criminisi et al., 2009), and (2) in practice, an installation on a roof tank may not be advisable for personal safety reasons.
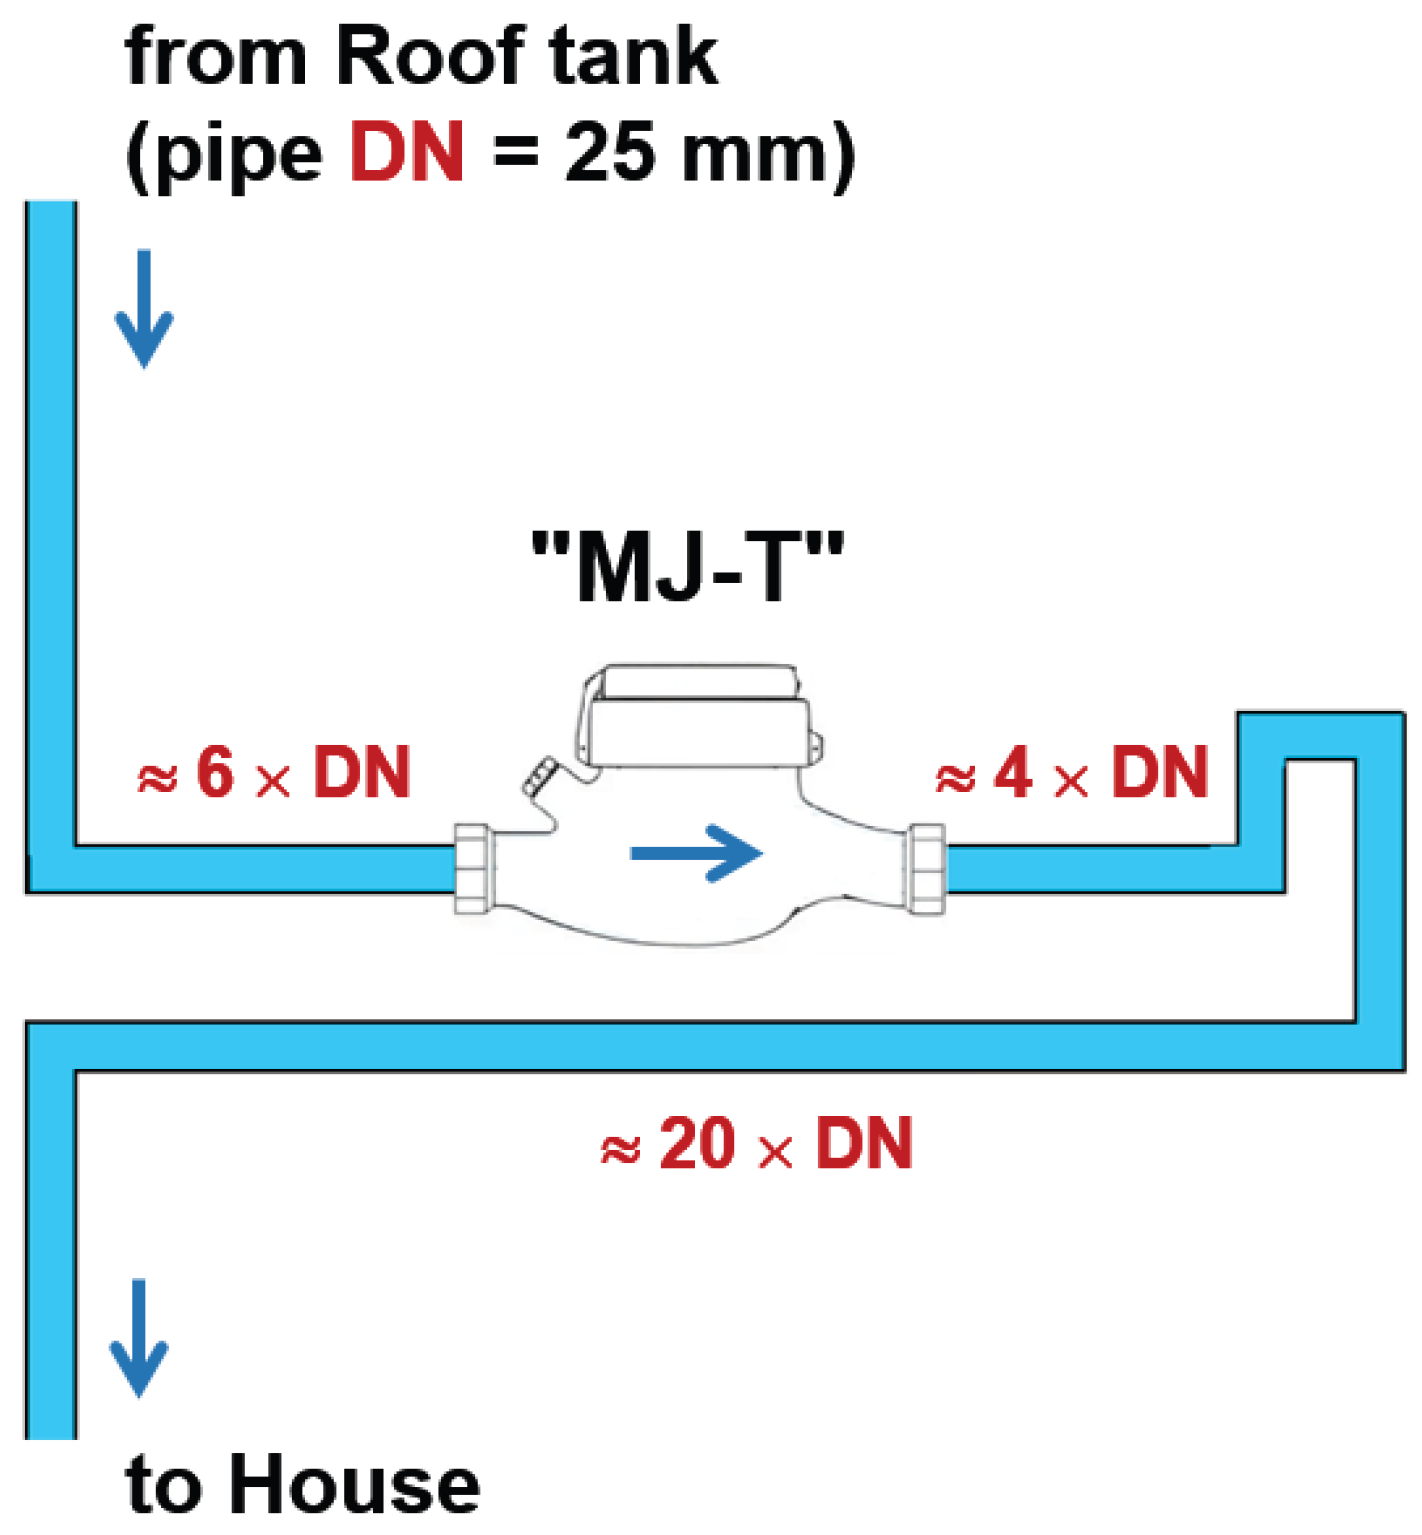
A regards the outlet of the roof tank from the studied house, there was originally only space for installing a meter on a vertical pipe with water flowing downwards. In this case, a direct installation is not recommended: at least, this is because the vertical flow of a liquid is strongly influenced by gravity and can therefore be very heterogeneous (to our best knowledge, there is no water meter that can provide reliable measurements in such conditions). Therefore, the roof tank’s outlet was modified so as to install meter “MJ-T” on a horizontal segment (and long enough so as to comply with manufacturer’s specifications (ANCE, 2025)); furthermore, a small siphon was added downstream, to ensure that the meter was on a pipe segment always filled with water (Figure C1).
Figure C1.
Diagram showing the installation of meter “MJ-T” at the roof tank’s outlet of the studied house (not shown on drawing, support elements were used to hold the meter).
Figure C1.
Diagram showing the installation of meter “MJ-T” at the roof tank’s outlet of the studied house (not shown on drawing, support elements were used to hold the meter).
C.2. Field Verification
After being installed, meter “MJ-T” was verified; to this end, a usual procedure consisting of two steps was used:
- Calibration of a volumetric container - A load scale (model “PM6000” from Mettler-Toledo) with a range of 6 kg and an error < 1 g (according to a check made with reference weights) was used to mark two reference points on the transparent tube of a volumetric container (made of zinc and with a capacity of ≈ 20 L). The container was filled with tap water, and assuming that its density is 997 kg/m³ (at 26 °C), the marks were for volumes of 9.898 and 19.048 L.
- Field verification of the water meter - The volumetric container was then transported to the studied house and placed below a tap. To facilitate the work, a piece of flexible hose was attached to the tap outlet. The tap was then opened so as to deliver water at a given flow rate, and it was left until the container was filled to one of its reference marks: (1) to determine the flow rate of water, a stopwatch was used for measuring the time necessary to fill the container, and (2) to know the volume of water estimated by meter “MJ-T”, its display was read before and after each filling. Finally, the volume data estimated by meter “MJ-T” were corrected: (1) to compensate for the “leak” recorded by the meter when the tap was closed (i.e., ≈ 0.1 L/h; see Table 3), and (2) to subtract the dead volume of the flexible hose attached to the tap (i.e., 0.085 L).
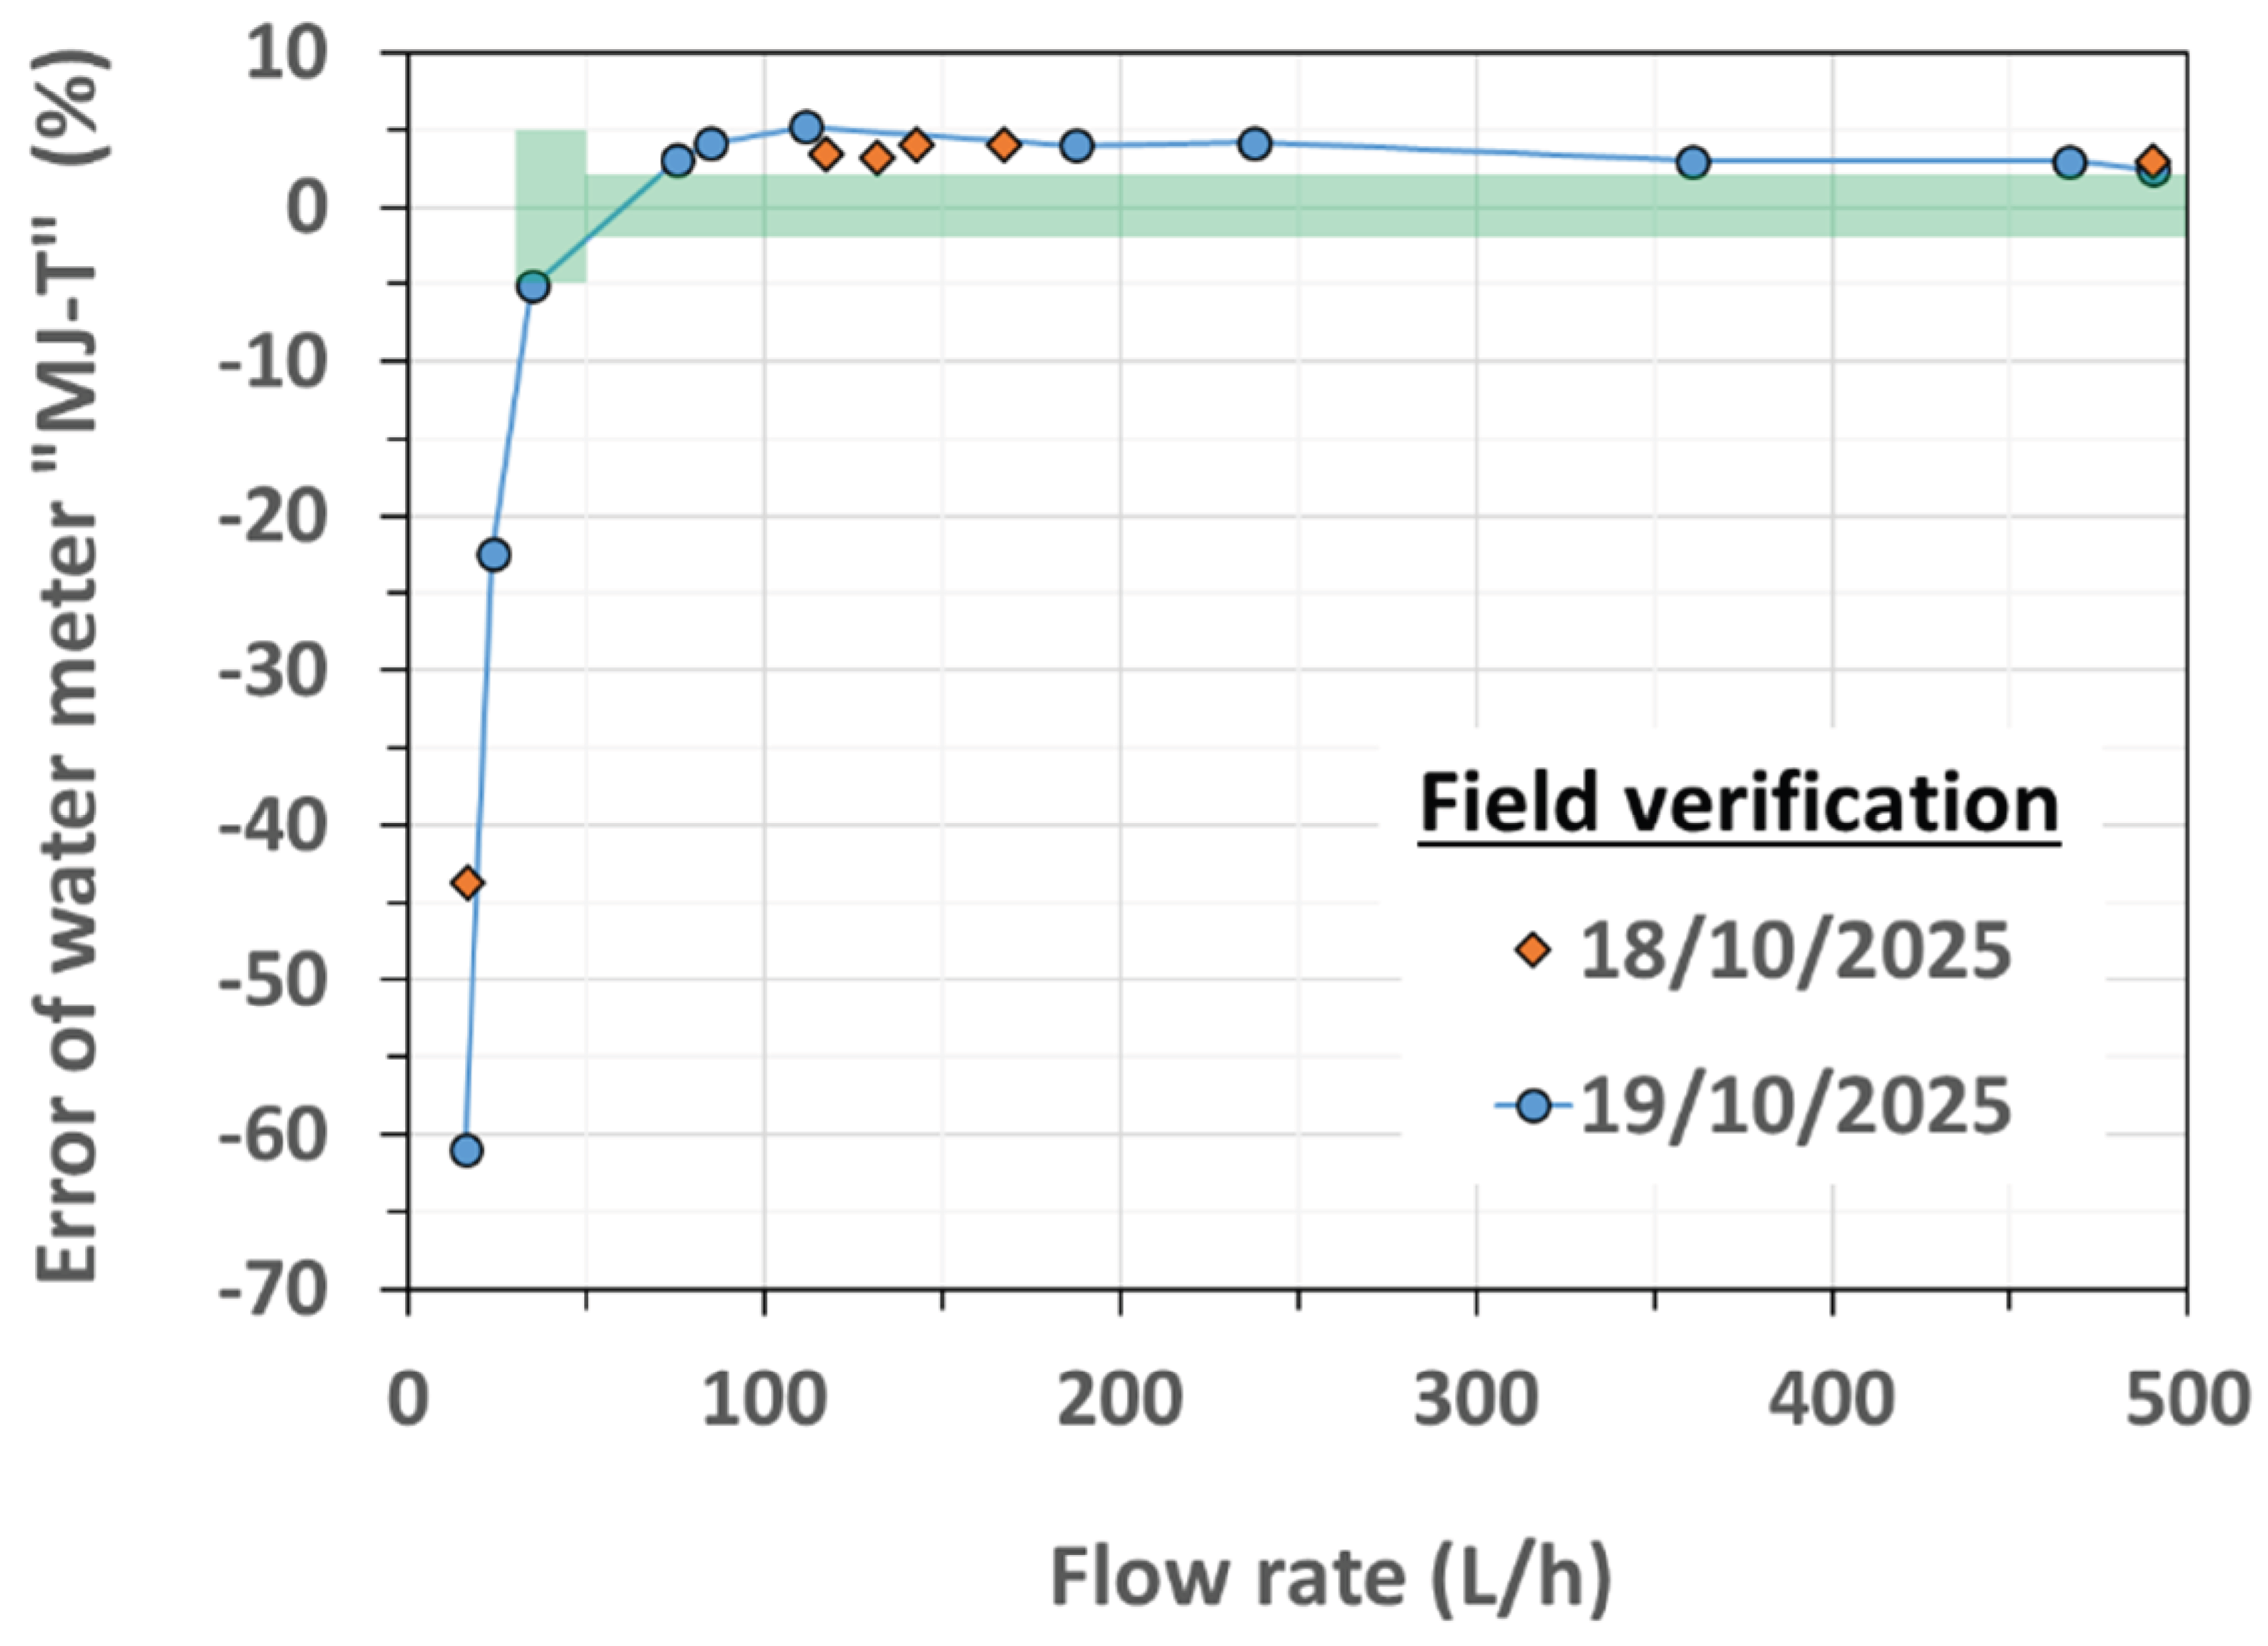
Figure C2 shows the results of field verification. On the one hand, it is not as good as what would be expected according to meter’s specification (Table 2): indeed, one would expect an error better than ± 2% for flow rates above the transitional flow rate ( = 53 L/h). But on the other hand, the results are not so bad: indeed, the meter error estimated in situ is within ± 5% for flow rates above the minimum flow rate ( = 35 L/h). The fact that the error is not better (i.e., within ± 2%) above the transitional flow rate () could be due to an effect of installation conditions (which are uncommon): as stressed by AWWA (AWWA, 2012), “the piping in a meter installation can have a definite influence on a meter’s accuracy, and this irregularity can be detected by the on-site tests”.
Figure C2.
Result of the verification of meter “MJ-T” (multi-jet, at roof tank’s outlet). Symbols (diamonds and circles) are experimental data obtained at two different days. The green area shows what should be expected according to meter specifications (see Table 2).
Figure C2.
Result of the verification of meter “MJ-T” (multi-jet, at roof tank’s outlet). Symbols (diamonds and circles) are experimental data obtained at two different days. The green area shows what should be expected according to meter specifications (see Table 2).
C.3. Estimation of Specific Water Uses
The installation of meter “MJ-T” made it possible to estimate certain specific water uses in the studied house: a shower, flusher (toilet), and washing machine (for this, it was simply necessary to read the meter before and after each consumption). The obtained results (Table C1) are consistent with the literature (Mazzoni et al., 2023). They can then be used to estimate a lower bound for the water consumption of the house’s owner: assuming one shower per day, four toilet flushes per day and one washing machine per week (Mazzoni et al., 2023), this would give a minimum consumption of 98 L/d for this person.
As expected, the daily water consumption estimated by meter “MJ-T” was higher, i.e.,: ≈ 200 L/d on average (see Table 3), which is most likely due to other types of use, especially taps and watering flowers. In any case, this is still a realistic domestic water consumption for one person (indeed, it should typically be ≈ 160 L/d, and within ≈ 60 - 350 L/d, according to studies conducted in cities of several countries (Mazzoni et al., 2023), excluding those conducted in very poor areas (Kumpel et al., 2017)).
Table C1.
Specific water uses estimated during this study and according to the literature.
| Amount of water (L per use) 1 | Shower | Flusher (toilet) | Washing machine |
|---|---|---|---|
| Estimated during this study 2 | 38 | 10 | 140 |
| (21 -51) | (7 - 13) | (136 - 144) | |
| According to the literature 3 | 61 | 9 | 91 |
| (21 - 150) | (5 - 20) | (33 - 155) |
1 Average and range (min./max.); 2 From “MJ-T” data, with three repetitions; 3 From Table 3 of Mazzoni et al. (Mazzoni et al., 2023).
Appendix D - Simple Computations Behind the Discussion
D.1. Air Effect on a Meter with Light Rotor
In this Section, an attempt is made to roughly analyze how an air flow could affect a meter with light rotor (as is the case of water meter “MJ”). To begin with, it must be acknowledged that three main categories of flow can pass through a water meter:
- Water - On the one hand, the flow can be of (liquid) water. It is worth noting that this case includes water with dissolved air: indeed, dissolved air has virtually no effect on water density (Kell, 1977), and so, it should have no effect on the performance of mechanical water meters (unless air is released and/or water cavitates, which admittedly is easier when the amount of dissolved air is large (Tamari et al., 1993)).
- Mixture of water and air - On the other hand, the flow can be of water and air (in the form of air bubbles, pockets or slugs) (Escarameia et al., 2005) (Pozos et al., 2010) (Walter et al., 2017). However, describing how a two-phase flow can affect a water meter is out of the scope of this study, because it is very complicated (Escarameia et al., 2005) (Pozos et al., 2010) (Zhou et al., 2020) (Ferrante et al., 2025).
- Air - Finally, the flow can be of just (gaseous) air. This is sometimes plausible (Totsuka et al., 2004) (Foufeas and Petroulias, 2017) (Taylor, 2018) (Ferrante et al., 2022) (also see Figure 9), and so it is appropriate to analyze this situation at a minimum: below, it is assumed that the flow passing through a meter is either water or air, but not a heterogeneous mixture of both.
Then, what would be the effect of a fluid (water or air) flowing through a meter with light rotor? Basically, the rotor may spin if the fluid has enough kinetic energy per unit volume, a quantity known as “dynamic pressure” (, Pa); for an incompressible fluid, this quantity is (Houghton and Carpenter, 2003):
where is fluid density (kg/m3), and is fluid velocity (m/s). Of course, air cannot generally be considered as incompressible; however, “it is often convenient to regard the effects of [air] compressibility as negligible if the flow speed nowhere exceeds ≈ 100 m/s” (Houghton and Carpenter, 2003). Thus, three main flow regimes can be distinguished to describe the air effect on a meter with light rotor:
- Regime 1: low velocities - At very low velocity, air does not have enough kinetic energy to spin the rotor (because it is subject to a frictional torque). At slightly higher velocity, air can start to spin the rotor, but there is still a noticeable effect of rotor friction (qualitatively, the same thing happens with water: this is what defines the so-called “starting flow rate” of water meters (Arregui de la Cruz, 2016)).
- Regime 2: intermediate velocities - At intermediate velocity (up to ≈ 100 m/s (Houghton and Carpenter, 2003)), the kinetic energy of air becomes such, that the friction exerted on the rotor becomes negligible. If friction is not too high (which seems reasonable for a light rotor), air should not have to compress too much: if so, air should behave almost like an incompressible fluid.
- Regime 3: high velocities - At high velocity (up to ≈ 300 m/s, which is the speed of sound in air), air can still spin the meter’s rotor, but can no longer be considered incompressible.
In this context, the question arises as to what would be the lowest air velocity () required to easily spin the rotor of a device like meter “MJ” (i.e., so that the effect of rotor friction is negligible). For this, the dynamic pressure of air should be equal to that required for water to achieve the meter’s minimum flow rate ():
- Estimation of the minimum air velocity for meter “MJ” - Like many others (Arregui et al., 2006), meter “MJ” has a diameter: = 13 mm and a minimum flow rate (for water): ≈ 30 L/h, which corresponds to the following minimum water velocity: ≈ 0.06 m/s. Since air is less dense ( ≈ 1.2 kg/m3 for normal temperature and pressure, i.e.,: ≈ 25 °C and ≈ 100 kPa) than water ( ≈ 1,000 kg/m3), its minimum velocity must be higher. Under the assumption that air is incompressible (Equation D1), the ratio will be: ≈ 30 (Schubauer and Mason, 1937). So, the minimum air velocity required to easily spin the rotor of meter “MJ” should be: ≈ 1.8 m/s.
- Conclusion about the minimum air velocity - The estimated minimum air velocity is very small compared to the speed of sound in air: at this velocity, air can be considered as almost incompressible, and a water meter like “MJ” should start to record the volume of air passing through it almost as if it were a volume of water.
The above distinction between low, intermediate and high air velocities is more or less in line with the results of tests about the air effect on meters with light rotor, including mechanical water meters (Figure D1):
- Effect of air flow at low velocities - When air flows at low velocity (< 1.8 m/s for devices like “MJ”), it was found that a water meter (single-jet or a multi-jet) does not register all the volume of air passing through it (Walter et al., 2017) (Tavares, 2018).
- Effect of air flow at intermediate velocities - When air flows at intermediate velocity, it was found that a water meter (single-jet or a multi-jet) can register a volume of air (defined at normal conditions for temperature and pressure) almost as if it would be a volume of water (Miranda, 2011) (Grando-Sirtoli et al., 2016) (Walter et al., 2017) (Tavares, 2018). Interestingly, similar results have been obtained with Price meters (i.e., mechanical devices designed to measure water velocity in open channels) (Schubauer and Mason, 1937) and cup anemometers (Alfonso-Corcuera et al., 2024), i.e.,: when a fluid flows fast enough (typically above ≈ 3 - 4 m/s), these meters record the same fluid velocity regardless of whether it is air or water (admittedly, a fluid does not flow exactly in the same way through these devices as it flows through a water meter, but this is considered a detail within the scope of this study).
- Effect of air flow at high velocities - When air flows at high velocity (> 100 m/s), it was found that a water meter (single-jet or a multi-jet) does not register all the volume of air passing through it (Ferrante et al., 2022) (Ferrante et al., 2025).
Figure D1.
A simple model to describe the proportion of air volume recorded by a mechanical meter (velocity meter with = 13 mm and ≈ 30 L/h) as a function of the velocity of air passing through: comparison between the model (grey line) and experimental data from the literature (symbols). For studies with a transient air flow (Walter et al., 2017) (Ferrante et al., 2022), the air velocity chosen is that measured at the start of the test. Results of Walter et al. (Walter et al., 2018) on multi-jet meters are not shown, because flow rate data are not provided in their study.
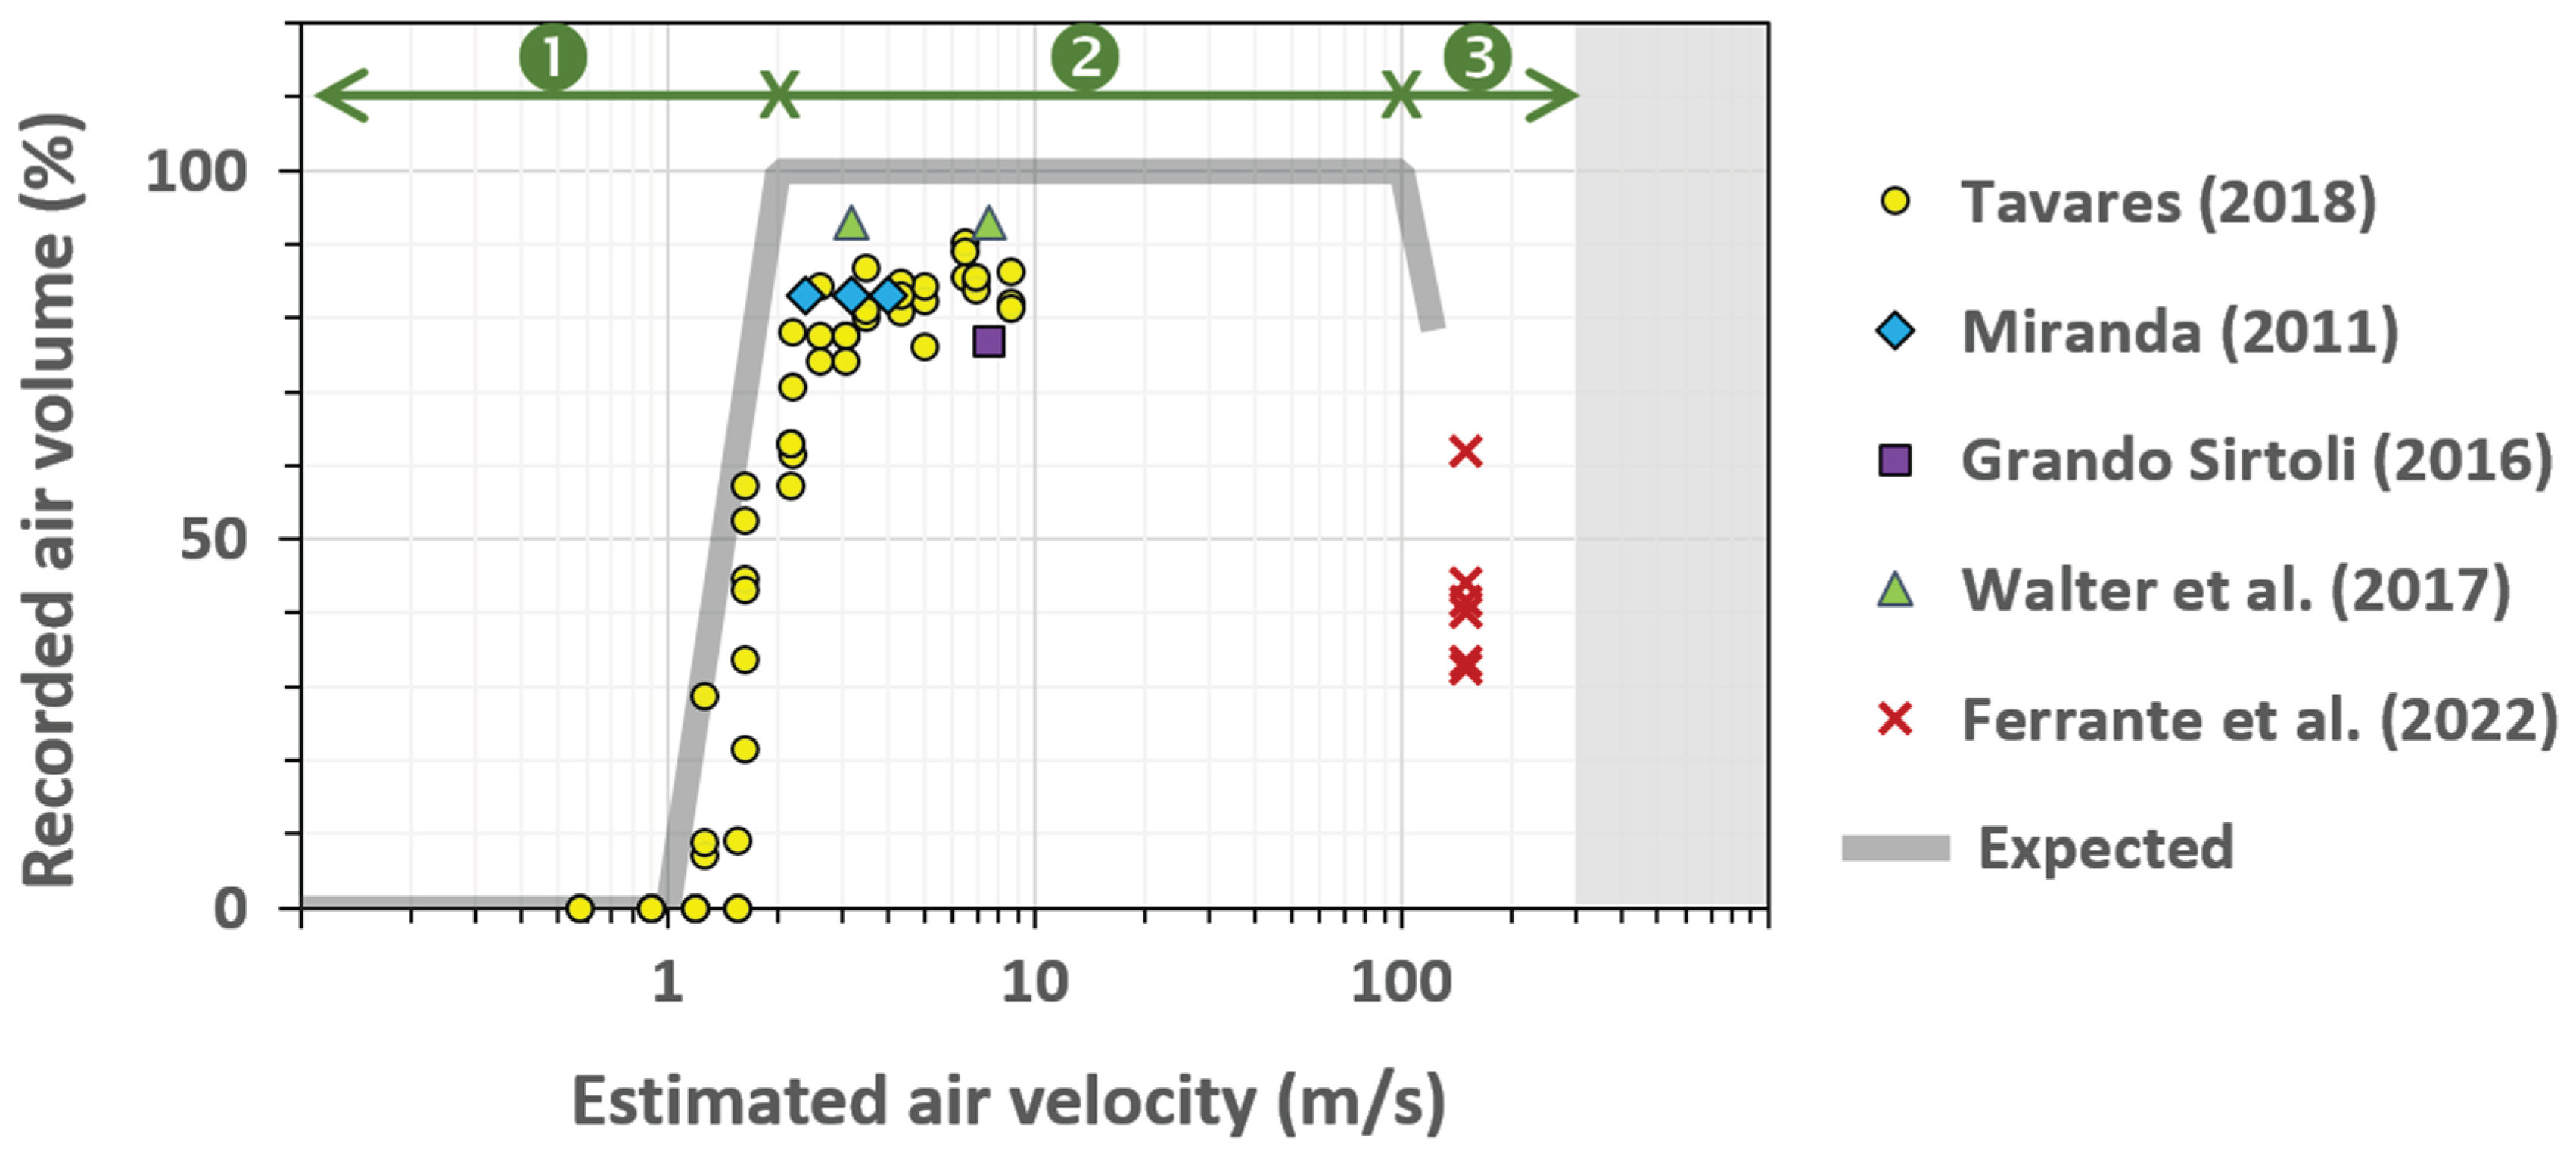
Thus, it seems reasonable to consider that the effect of air (not only in the form of a single gas phase (Grando-Sirtoli et al., 2016) (Walter et al., 2017) (Tavares, 2018) (Ferrante et al., 2022), but also in the form of bubbles transported by water (Miranda, 2011)) on a mechanical water meter (at least single-jet or multi-jet) depends primarily on the velocity of air passing through it. However, other factors can also have an impact, including:
- Flow direction - According to Tavares (Tavares, 2018), single-jet and multi-jet meters tend to register less air when the flow is reverse (in practice, the same trend is generally observed when water flows through meters (Arregui et al., 2006)).
- Bypass of some mechanical meters - Compared to single-jet meters, multi-jet meters could have a more complex behavior: (1) at intermediate but rather low air velocities, they could overestimate the volume of air passing through (up to ≈ 150%) (Walter et al., 2018); (2) at intermediate but rather high air velocities, they would underestimate the air volume (down to ≈ 60%) (Walter et al., 2018), and (3) at high air velocities, they seem to behave like single-jet meters (Ferrante et al., 2022). The complex behavior of multi-jet meters at intermediate air velocities has been interpreted by Walter et al. (Walter et al., 2018) as an effect of their bypass (Figure D2).
Figure D3.
Diagram (vertical cross-section) of two mechanical water meters with rotor (Arregui et al., 2006): (a) typical single-jet meter (with no bypass); (b) multi-jet meter.
Figure D3.
Diagram (vertical cross-section) of two mechanical water meters with rotor (Arregui et al., 2006): (a) typical single-jet meter (with no bypass); (b) multi-jet meter.
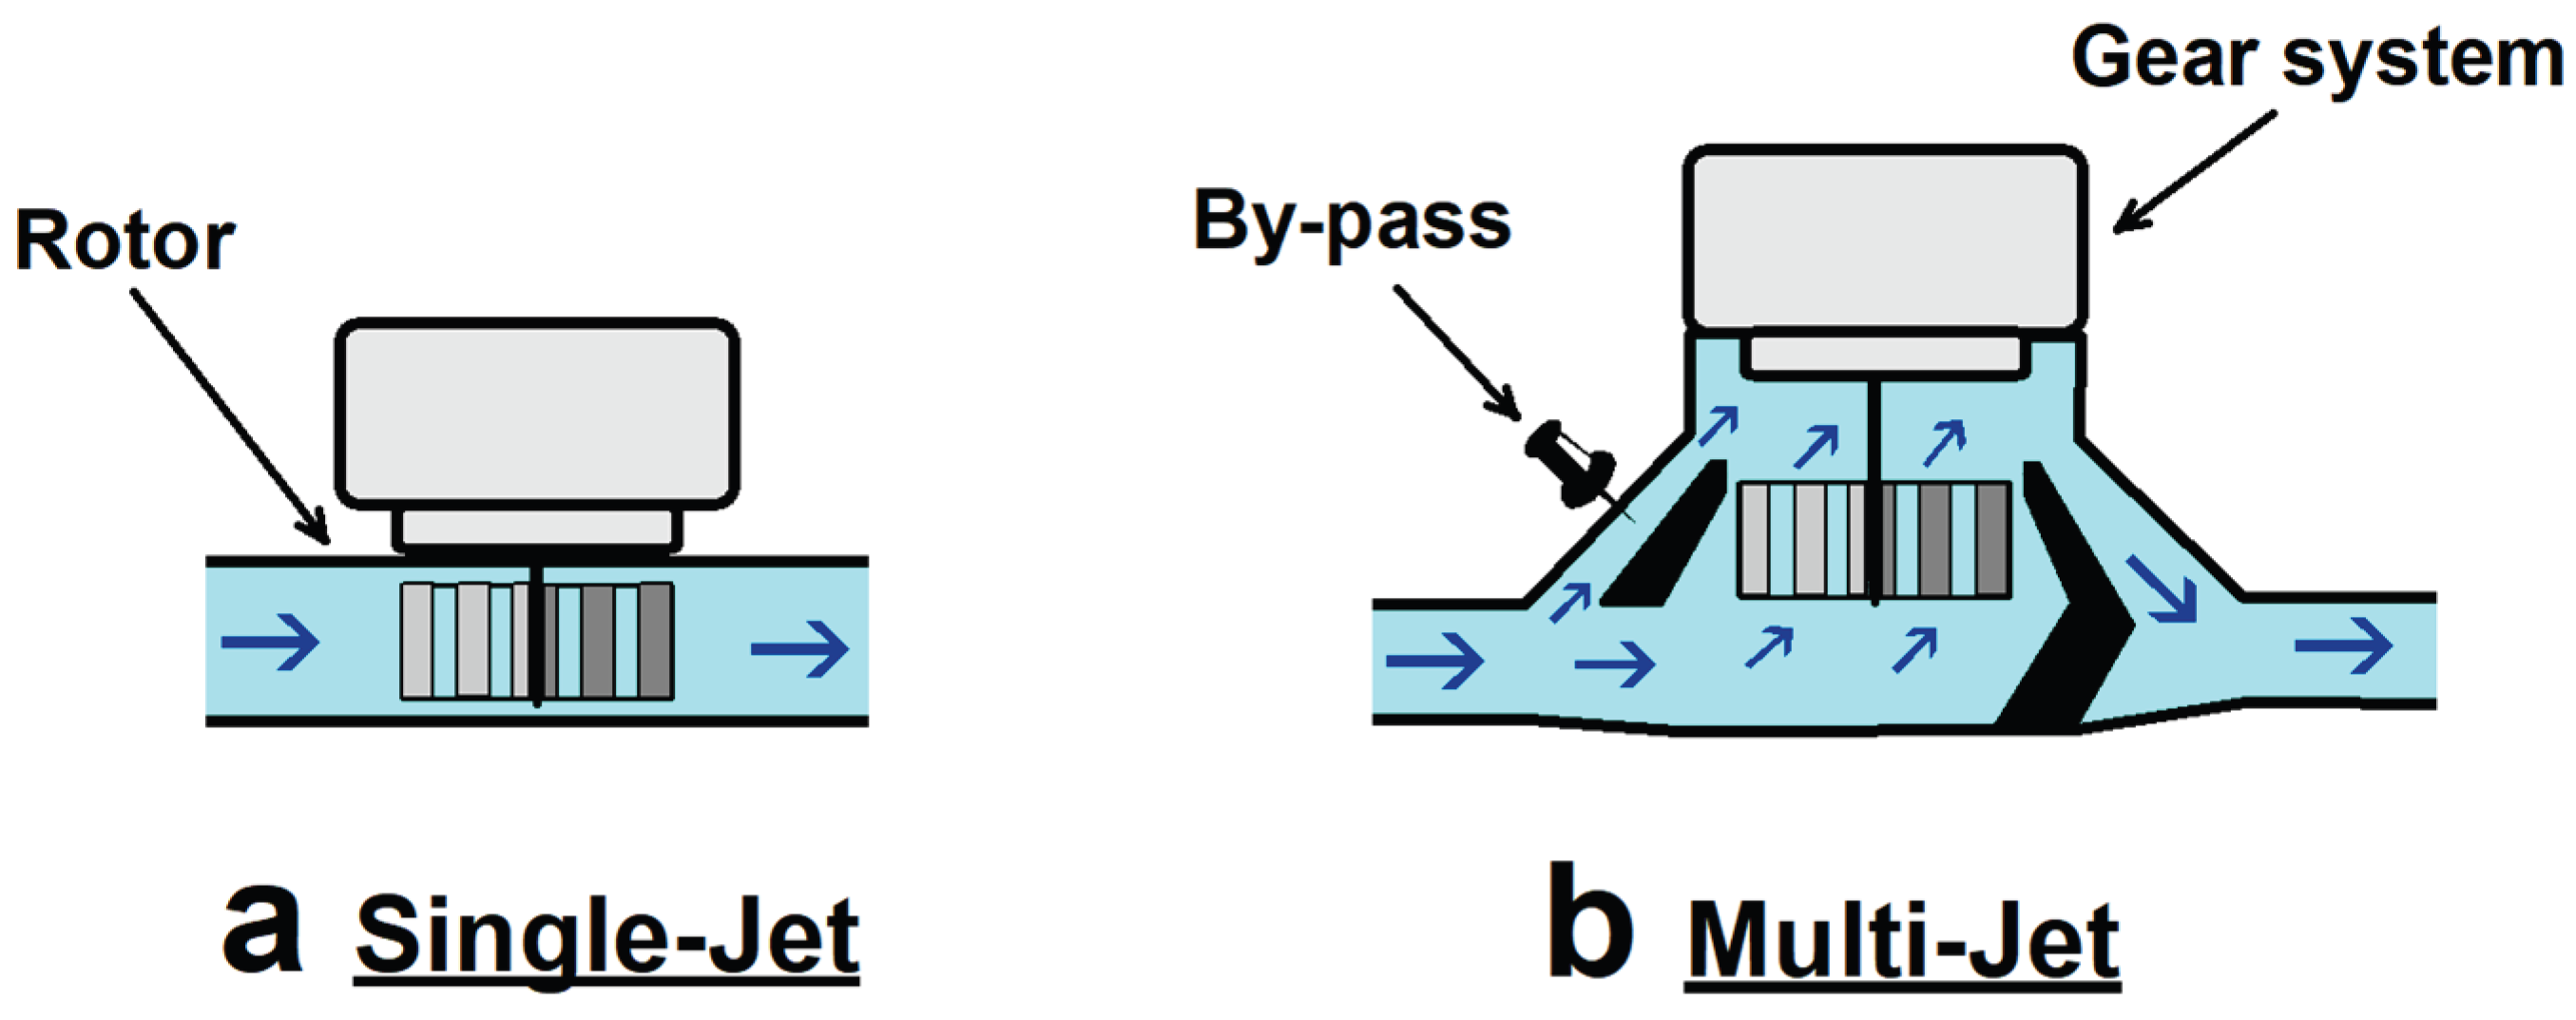
D.2. Air Flow Through an Orifice
In this Section, an attempt is made to estimate the amount of air that can pass through a water meter like “MJ”, and then through an air-release valve like “AV”. For this purpose, it is proposed to use the theoretical equation that describes a flow of air through a circular orifice (Lingireddy et al., 2004) (Ferrante et al., 2025):
where is air flow (m3/s), is the discharge coefficient of orifice ( ≈ 0.62 in practice (Lingireddy et al., 2004)), is the flow area for the orifice (m2), is the density of air upstream (kg/m3), is the absolute pressure of air upstream (Pa), is atmospheric pressure ( ≈ 100 kPa), and is a constant defining the politropic expansion process ( ≈ 1.2 in practice (Lingireddy et al., 2004)). Please, note that this formula is for a pressure that is not too large (so that air velocity does not reach the speed of sound in air).
So, what would be the air velocity () and flow rate () through a mechanical meter like “MJ”?
- Numerical application - Considering that meter “MJ” has a diameter: ≈ 13 mm and that air density is: ≈ 1.2 kg/m3, Equation D2 indicates that: (1) for a pressure difference: > 6 Pa, air should flow at a velocity: > 2 m/s (see green area on Figure D3), and (2) when the pressure difference reaches: > 75 Pa, air should pass at a flow rate: > 3,300 L/h (see red area on Figure D3).
- Conclusion of the numerical application - A pressure difference of up to: = 100 Pa (equivalent to 10 mm of water column) is most likely very small for the street pipeline of the studied house: (1) at least during periods when it is not supplied with water while the pipeline of the street below is (Figure 9c), most of the air inside the street pipeline should then be trapped and compressed to some degree (Weston et al., 2023), and (2) the small inverted siphon “IS” (equivalent to ≈ 300 mm of water column) proved ineffective during this study (as argued in Section 4.2). Thus, the numerical application suggests that air in a pipeline can flow fast through a device like meter “MJ”: (1) fast enough so as to easily spin its rotor (i.e., > 2 m/s as considered in Section D.1), and including (2) so fast that the meter would sometimes exceed its overload flow rate ( = 3,130 L/h).
- Comment - Admittedly, the previous numerical application has probably overestimated the amount of air that can pass through meter “MJ”, because the internal part of a multi-jet meter is not exactly like that of a circular pipe (thus, a lower but unknown value for the discharge coefficient should be expected). Nevertheless, the conclusion that air from pipelines can sometimes flow very fast through a water meter is in line with laboratory observations (Ferrante et al., 2022) and practical experience (Totsuka et al., 2004) (Foufeas and Petroulias, 2017).
Figure D3.
Estimated amount of air that can pass through water meter “MJ” (assuming that it behaves like a circular orifice: Equation D2) as a function of the pressure difference between air in the supply pipeline and atmospheric pressure. Note that 10 Pa is equivalent to 1 mm of water column.
Figure D3.
Estimated amount of air that can pass through water meter “MJ” (assuming that it behaves like a circular orifice: Equation D2) as a function of the pressure difference between air in the supply pipeline and atmospheric pressure. Note that 10 Pa is equivalent to 1 mm of water column.
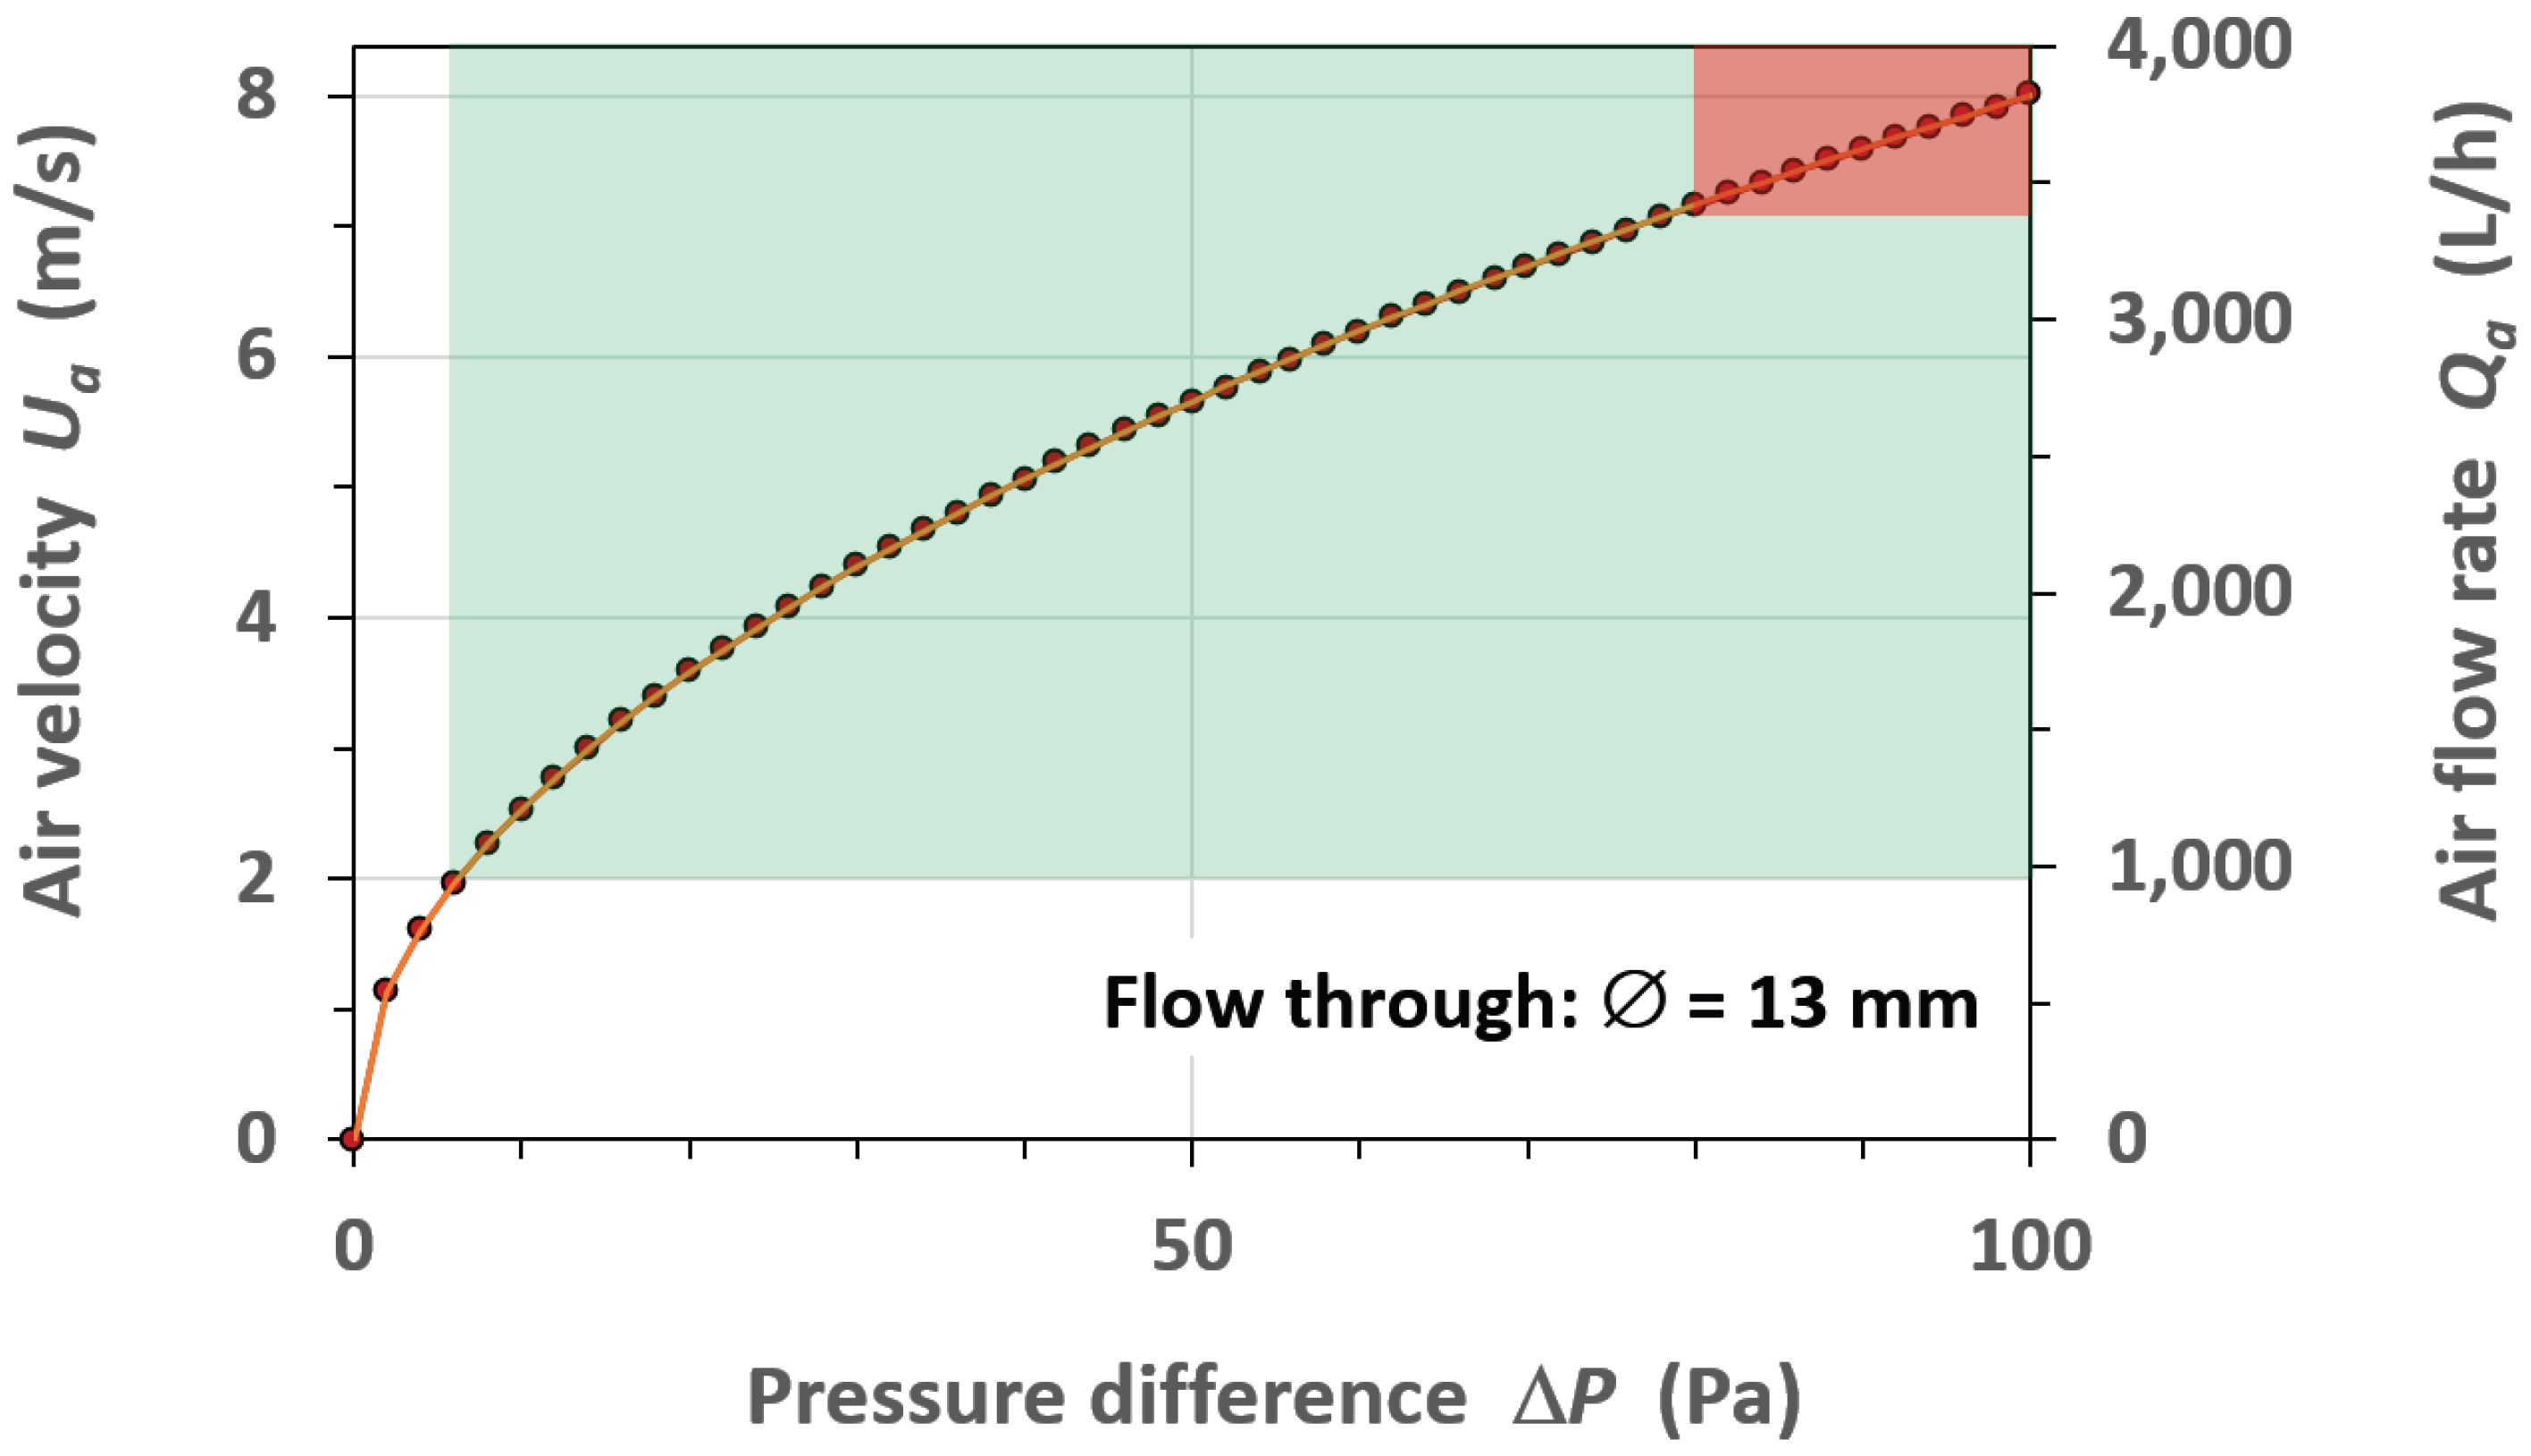
Then, what would be the amount of air that can pass through an air-release valve like the valve “AV” installed at the domestic intake of the studied house (Figure 2b)?
- Preliminary comment - It should be noted that some authors have considered the use of an air-release valve just upstream of a water meter (Ferrante et al., 2023); including, the old standard ISO 40464-2 (ISO, 2005) states that “if there is a risk of air entering the meter [...], an upstream air release valve shall be incorporated”. Furthermore, air-release valve “AV” was apparently similar to others seen in the neighborhood and in other cities (Figure 11). At first sight, this suggests that an air-release valve like “AV” would be useful.
- Numerical application - However, according to Equation D2 (and assuming the same discharge coefficient ), air should flow much more easily (i.e., ≈ 10 times faster) through water meter “MJ” (with an orifice of diameter: ≈ 13 mm) than through air-release valve “AV” (with an orifice of diameter: ≈ 1 mm, as shown on Figure 10c): indeed, the flow through an orifice is theoretically proportional to its area.
- Conclusion of the numerical application - Thus, a small air-release valve like “AV” installed just upstream of a water meter should be ineffective when it comes to preventing air from passing through the meter (this conclusion is in line with comments by Arregui (Arregui de la Cruz, 2016) and Taylor (Taylor, 2018)).
Finally, it is necessary to discuss the risk of water hammer due to the installation of an air-release valve like “AV”:
- The valve can produce two types of pressure transients - An air-release valve can produce two main types of pressure transient: (1) when it is open and when water reaches the pipe were it is installed (Lingireddy et al., 2004) (Zhou et al., 2020), and (2) when it closes (Ferrante et al., 2023). If the magnitude of the pressure transient is large, it could potentially damage the domestic intake (i.e., its pipe and water meter): this is the phenomenon known as water hammer.
- Classical estimation of water hammer magnitude - To estimate the magnitude of water hammer, it is generally assumed that the water flow in a pipe is suddenly stopped (due to the closure of a valve, or the arrival of a water front at an orifice with a smaller diameter than that of pipe), in which case the maximum increase in pressure (, Pa) is given by the Joukowsky’s equation (Lingireddy et al., 2004) (Ghidaoui et al., 2005): , where is water density (≈ 1,000 kg/m3), is the speed of pressure waves (m/s) and is water velocity before it drops to zero (m/s). Regarding the domestic intake of the studied house, water could flow at least at a rate: ≈ 1,800 L/h (see Figure 7b), which corresponds to a water velocity: ≈ 3.8 m/s. With: ≈ 1,300 m/s (according to Korteweg’s equation (Ghidaoui et al., 2005)), this gives: ≈ 5,000 kPa (equivalent to 500 m of water column), which is huge in practice.
- Final comment about the risk of water hammer - The above estimate of water hammer magnitude calls for caution. However, it will probably be less pronounced in reality for several reasons, including: (1) the water flow does not stop instantaneously; (2) the air that remains inside the valve (even when it is closed: see Figure 10a) and in the pipe downstream should act as a cushion, and (3) the water front arriving at the valve is in practice mixed with air, which may also produce a cushioning effect (Zhou et al., 2020). Ultimately, it proves very difficult to predict the risk of water hammer in the case of valve “AV” (Escarameia et al., 2005). At the very least, it should be noted that its orifice is rather small (diameter: ≈ 1 mm, which gives a ratio: < 0.08), in which case the laboratory experiments by Zhou et al. (Zhou et al., 2020) suggest that the cushioning effect should be dominant over the water hammer effect.
D.3. Air Sucked by a Hydraulic Jump
In an attempt to explain the notable negative daily volume (≈ -1,900 L/d) recorded once by meter “MJ” (Figure 5b), it was suggested that this could be due to air being sucked by a hydraulic jump: this jump would have developed in the lower part of the supply pipeline during periods of continuous supply (see Figure 9b). But is it quantitatively possible? In this respect, the amount of air sucked by a hydraulic jump that has developed in an inclined circular pipeline with water coming from upstream can be estimated by the following set of equations; they describe what would happen upstream of the jump, where the pipeline is only partly-full (i.e., condition of free-surface flow):
where is the flow rate of sucked air (m3/s), is the flow rate of water (m3/s), is Froude number (-), is the (average) water velocity (m/s), is the (cross-sectional) flow area (m2), is the hydraulic radius (m), is the stream slope (m/m), is the Manning coefficient (s/m1/3), is the surface width of flow (m), is the pipeline diameter (m), and is the acceleration of gravity (≈ 9.8 m/s2). Please, note that:
- Flow depth was used as an input value - To begin with, different values were chosen for the flow depth of water inside the partly-full pipeline (, m). The knowledge of makes it possible to compute the flow area (), hydraulic radius () and surface width of flow (); these simple geometric calculations are not detailed, but can be found for a circular pipe in other studies (e.g., (Bengtson, 2012)).
- Amount of air sucked - Equation D3 is an experimental equation proposed by Escarameia et al. (Escarameia et al., 2005) for the amount of air sucked by a hydraulic jump and entrained downstream in the form of bubbles; it has been established in the laboratory, for the following conditions: (1) circular pipe full with water downstream of the hydraulic jump; (2) range for pipe slope: , and (3) range of Froude number: .
- Manning’s equation - Equation D4 is just the definition of flow rate , and Equation D5 is Manning’s equation.
- Froude number - Equation D6 is the usual definition of the Froude number for a channel whose cross-section is not necessarily rectangular (e.g., (Escarameia et al., 2005)). For a hydraulic jump to develop, at least the following condition must be met in the steepest part of the pipeline: > 1.
- Condition for air to be sucked and entrained downstream - Equation D7 is a condition formulated by Pozos et al. (Pozos et al., 2010) for air to be sucked and entrained downstream of a hydraulic jump (otherwise, due to buoyancy, air tends to remains upstream of the jump in the form of a large pocket).
On this basis, a simulation was made for the supply pipeline of the studied house. To this end, it was considered that this pipeline has: (1) a diameter: = 50 mm; (2) a slope: = 0.123 m/m (equivalent to 7°) that is taken as an estimate for the stream slope, and (3) a Manning coefficient: ≈ 0.010 (i.e., a typical value for a plastic pipe; e.g., (Bengtson, 2012)). Figure D4 shows the results obtained over the range covering all possible values of flow depth (i.e., ):
- Comment 1: a hydraulic jump can indeed develop - As shown on Figure D4b, the calculated Froude number was always: > 1, meaning that the water flow is supercritical: this confirms that, when the pipeline is supplied with not too much water (so that the flow is not pressurized), a hydraulic jump can develop inside it (Escarameia et al., 2005) (Pozos et al., 2010). More precisely, this is possible for flow depths smaller than ≈ 40 mm, i.e.,: as long as the so-called “critical flow depth” (calculation not detailed) is less than the pipe diameter.
- Comment 2: air can indeed be sucked and entrained downstream - Except for extremely small depths of flow (i.e., < 0.5 mm), it was found that the condition of Pozos et al. (Pozos et al., 2010) (Equation D7) is met, meaning that the water flow is fast enough for a hydraulic jump to suck air upstream and entrain it downstream.
- Comment 3: the experimental relationship of Escarameia has been extrapolated a little - Furthermore, the calculated Froude number was often: > 3 (see the red rectangle on Figure D4b): therefore, it must be recognized that we have used the experimental relationship (Equation D3) proposed by Escarameia et al. (Escarameia et al., 2005) outside of the limits for which it was established. Nevertheless, this is probably not a big deal: in fact, the relationship is smooth, so it does not seem too risky to extrapolate it a little. By the way, note that according to calculations, the proportion of air that could be sucked and entrained by the hydraulic jump was always < 2.5%, which is quite small: indeed, it is only slightly more than the amount of air that can dissolve in water (Escarameia et al., 2005) (Pozos et al., 2010).
- Conclusion of numerical application - In the end, the simulation suggests that a hydraulic jump can develop in the supply pipeline and suck air at a rate of up to ≈ 180 L/d (Figure D4d). If the jump remains stable for ≥ 12 hours, this could explain the (net) negative volume of ≈ -1,900 L recorded by meter “MJ” during one day.
Figure D4.
Simulation results for the pipeline downstream of the studied house: (a) water velocity as a function of flow depth; (b) Froude number; (c) water flow rate, and (d) air flow rate that could be sucked and entrained downstream by a hydraulic jump. Please, note that for a flow depth above ≈ 0.04 m, the condition of free surface flow is no longer plausible.
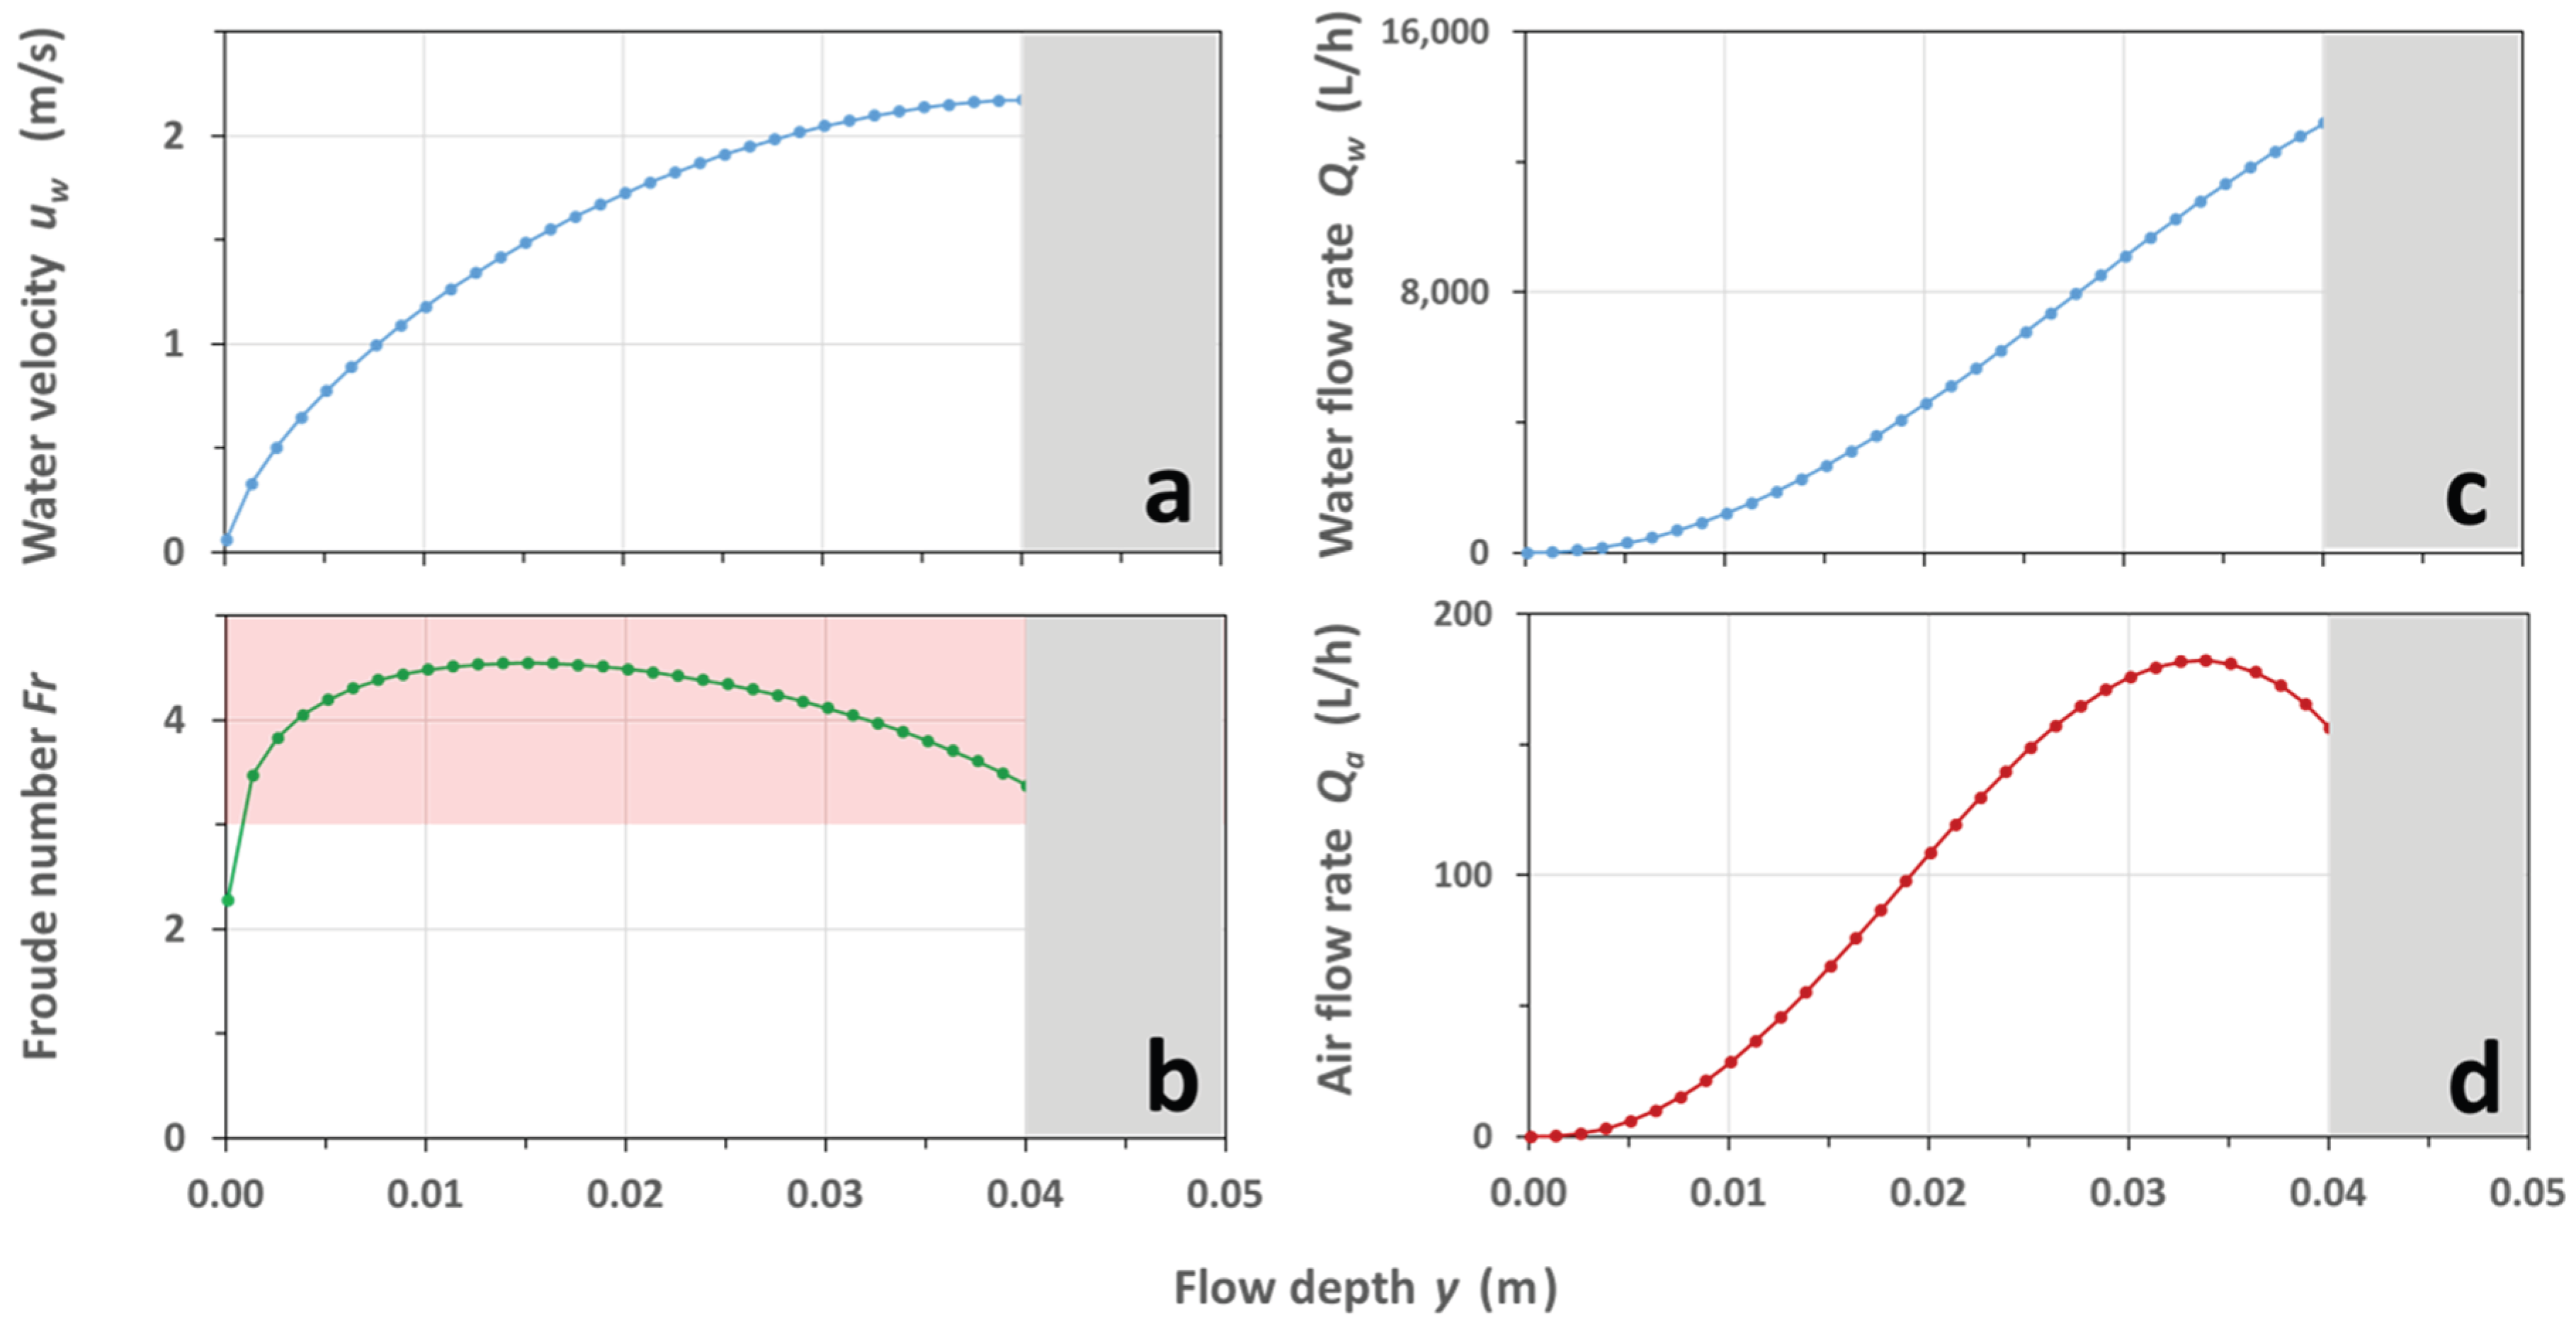
References
- Abu-Madi, M., Trifunovic, N., 2013. Impacts of supply duration on the design and performance of intermittent water distribution systems in the West Bank. Water Int. 38, 263–282. [CrossRef]
- Ahmed, M.M., Abdullah, A.I., 2023. Full-Smart Intermittent Water Supply Monitoring, Managing, and Distributing System Based on IoT: Case Study at Soran City. Cihan Univ.-Erbil Sci. J. 7, 8–20.
- Alfonso-Corcuera, D., Meseguer-Garrido, F., Torralbo-Gimeno, I., Pindado, S., 2024. On the Variation of Cup Anemometer Performance Due to Changes in the Air Density. Appl. Sci. 14, 1843. [CrossRef]
- ANCE, 2025. Certificado: no. ANC2501A00001628. Asociación de Normalización y Certificación (ANCE), México.
- Arregui de la Cruz, F., 2016. Customer Metering Inaccuracies, in: Guidance Notes on Apparent Losses and Water Loss Reduction Planning. IWA Water Loss Specialist Group (WLSG), p. 43.
- Arregui, F., Cabrera Jr, E., Cobacho, R., 2006. Integrated water meter management, IWA publishing. ed. IWA publishing, London.
- Arregui, F.J., Pastor-Jabaloyes, L., Mercedes, A.V., Gavara, F.J., 2020. Accuracy of solid-state residential water meters under intermittent flow conditions. Sensors 20, 5339. [CrossRef]
- AWWA, 2012. Water Meters - Selection, Installation, Testing, and Maintenance, 5th Edition. ed. American Water Works Association (AWWA), Denver, CO.
- Bengtson, H.H., 2012. Spreadsheet use for partially full pipe flow calculations (No. Couse No. C02-037). Continuing Education and Development (CED), Inc., Stony Point, NY.
- Charalambous, B., Charalambous, S., Ioannou, I., 2007. Meter under-registration caused by ball valves in roof tanks. WATER LOSS.
- Cornejo Cid, R.A., 2013. La presencia de aire en las redes de agua potable y su efecto en la calidad de la medición de consumos (Engineering Thesis). Universidad Diego Portales (UDP), Santiago de Chile.
- Criminisi, A., Fontanazza, C., Freni, G., Loggia, G.L., 2009. Evaluation of the apparent losses caused by water meter under-registration in intermittent water supply. Water Sci. Technol. 60, 2373–2382. [CrossRef]
- DGN, 1994. NOM-012-SCFI, Medición de flujo de agua en conductos cerrados de sistemas hidráulicos - Medidores para agua potable fría - Especificaciones.
- Ejeian, F., Azadi, S., Razmjou, A., Orooji, Y., Kottapalli, A., Warkiani, M.E., Asadnia, M., 2019. Design and applications of MEMS flow sensors: A review. Sens. Actuators Phys. 295, 483–502. [CrossRef]
- Escarameia, M., Burrows, R., Little, Murray, S., 2005. Air problems in pipelines-a design manual. HR Wallingford Ltd., Wallingford, UK.
- Ferrante, M., 2025. Comparison of the behaviour of ultrasonic, single-and multi-jet water meters during intermittent water supply.
- Ferrante, M., Casinini, F., Meyer, D., 2025. Laboratory-Validated Model of Air Discharge at User Connections under Intermittent Water Supply. Water Resour. Manag. 1–16. [CrossRef]
- Ferrante, M., Rogers, D., Mugabi, J., Casinini, F., 2023. Addressing water meter inaccuracies caused by intermittent water supply: A laboratory investigation of remedial measures. Water Resour. Manag. 37, 3921–3933. [CrossRef]
- Ferrante, M., Rogers, D., Mugabi, J., Casinini, F., 2022. Impact of intermittent supply on water meter accuracy. AQUA—Water Infrastruct. Ecosyst. Soc. 71, 1241–1250. [CrossRef]
- Foufeas, D., Petroulias, N., 2017. Metering under IWS. Deal. Complex Interrelat. Intermittent Supply Water Losses 69.
- Ghidaoui, M.S., Zhao, M., McInnis, D.A., Axworthy, D.H., 2005. A review of water hammer theory and practice. Appl Mech Rev 58, 49–76. [CrossRef]
- Grando-Sirtoli, V.G., Sato, A.A.W., Bertemes Filho, P., 2016. Medição do volume de ar em hidrômetro residencial: resultados preliminares. Ing. Solidar. 12, 73–79.
- Houghton, E.L., Carpenter, P.W., 2003. Aerodynamics for engineering students. Elsevier.
- Ienca, M., Vayena, E., 2021. Ethical requirements for responsible research with hacked data. Nat. Mach. Intell. 3, 744–748. [CrossRef]
- ISO, 2005. 4064-2, Measurement of water flow in fully charged closed conduits - Meters for cold potable water - Part 2: Installation requirements.
- ISO, 1993. 4064-1, Measurement of water flow in closed conduits - Meters for cold potable water - Part 1: Specifications.
- Jopling, T., 1857. On recent improvements in water meters. Presented at the Minutes of the Proceedings of the Institution of Civil Engineers, Manby C., Institution of Civil Engineers (ICE), London, pp. 46–64. [CrossRef]
- Kell, G.S., 1977. Effects of isotopic composition, temperature, pressure, and dissolved gases on the density of liquid water. J. Phys. Chem. Ref. Data 6, 1109–1131.
- Kumpel, E., Woelfle-Erskine, C., Ray, I., Nelson, K.L., 2017. Measuring household consumption and waste in unmetered, intermittent piped water systems. Water Resour. Res. 53, 302–315. [CrossRef]
- Lambert, A.O., 2002. International report: water losses management and techniques. Water Sci. Technol. Water Supply 2, 1–20. [CrossRef]
- Lingireddy, S., Wood, D.J., Zloczower, N., 2004. Pressure surges in pipeline systems resulting from air releases. Journal-American Water Works Assoc. 96, 88–94. [CrossRef]
- Lynnworth, L.C., 2013. Ultrasonic measurements for process control: theory, techniques, applications. Academic press. [CrossRef]
- Mazzoni, F., Alvisi, S., Blokker, M., Buchberger, S.G., Castelletti, A., Cominola, A., Gross, M.-P., Jacobs, H.E., Mayer, P., Steffelbauer, D.B., 2023. Investigating the characteristics of residential end uses of water: A worldwide review. Water Res. 230, 119500. [CrossRef]
- Miranda, I. dos S.L., 2011. Presença de ar no sistema de abastecimento de água: influências na macro e micromedição (Engineering Thesis). Universidad Federal do Rio Grande do Sul, Porto Alegre, Brazil.
- OIML, 2024. R 49-1, Water meters for cold potable water and hot water - Part 1: Metrological and technical requirements.
- Pozos, O., Gonzalez, C.A., Giesecke, J., Marx, W., Rodal, E.A., 2010. Air entrapped in gravity pipeline systems. J. Hydraul. Res. 48, 338–347. [CrossRef]
- Schubauer, G.B., Mason, M.A., 1937. Performance characteristics of a water current meter in water and in air. J Res Natl Bur Stand 18, 351–360. [CrossRef]
- Sherman, C.W., Brush, W.W., Saville, C.M., Macksey, H.V., Gwinn, D.R., Brown, A., McMurry, J.A., Thomas, R., Walsh, J.H., Van Loan, S.M., 1923. Report of the joint committee on standard specifications for water meters. J. Am. Water Works Assoc. 1093–1118.
- Siemens, 2021. Data sheet: Mechanical water meters WF.240.
- SLM, 2025. Certificate: no. R49/2013-A-SK1-23.02 Rev. 3. Slovak Legal Metrology (SLM), Slovakia.
- Soni, N., 2025. Forensic Value of Exif Data: An Analytical Evaluation of Metadata Integrity across Image Transfer Methods. Perspect. Leg. Forensic Sci. 2, 10006. [CrossRef]
- Taha, A.-W., Mahardani, M., Sharma, S., Arregui, F., Kennedy, M., 2020. Impact of float-valves on water meter performance under intermittent and continuous supply conditions. Resour. Conserv. Recycl. 163, 105091. [CrossRef]
- Tamari, S., Gaudu, J.-C., Simonneau, T., 1993. Tensiometric measurement and metastable state of water under tension. Soil Sci. 156, 149–155. [CrossRef]
- Tamari, S., Ploquet, J., 2012. Determination of leakage inside buildings with a roof tank. Urban Water J. 9, 287–303. [CrossRef]
- Tavares, W.A., 2018. Sistema de medição de ar em pontos de abastecimiento de água (Master Thesis). Universidade Federal Fluminense, Niterói, Brazil.
- Taylor, D.D.J., 2018. Tools for managing intermittent water supplies (PhD Thesis). Massachusetts Institute of Technology.
- Thomas, D.R., Pastrana, S., Hutchings, A., Clayton, R., Beresford, A.R., 2017. Ethical issues in research using datasets of illicit origin. Presented at the Proceedings of the 2017 Internet Measurement Conference, pp. 445–462.
- Totsuka, N., Trifunovic, N., Vairavamoorthy, K., 2004. Intermittent urban water supply under water starving situations, in: 30th WEDC International Conference. Presented at the People-centred approaches to water and environmental sanitation, Godfrey, S (Ed.), Vientiane, Lao PDR, 25-29 October 2004, pp. 505–512.
- Walter, D., Mastaller, M., Klingel, P., 2018. Accuracy of single-jet and multi-jet water meters under the influence of the filling process in intermittently operated pipe networks. Water Sci. Technol. Water Supply 18, 679–687. [CrossRef]
- Walter, D., Mastaller, M., Klingel, P., 2017. Accuracy of single-jet water meters during filling of the pipe network in intermittent water supply. Urban Water J. 14, 991–998. [CrossRef]
- Weston, S., Loubser, C., Jacobs, H., Speight, V., 2023. Short-term impacts of the filling transition across elevations in intermittent water supply systems. Urban Water J. 20, 1482–1491. [CrossRef]
- Yao, S., Yang, M., Zhang, P., Zhang, K., Fang, J., Huang, J., Chen, J., Zhao, Y., 2021. A small diameter ultrasonic water meter with self-diagnosis function and self-adaptive technology. IEEE Access 9, 80703–80715. [CrossRef]
- Zhou, L., Cao, Y., Karney, B., Bergant, A., Tijsseling, A.S., Liu, D., Wang, P., 2020. Expulsion of entrapped air in a rapidly filling horizontal pipe. J. Hydraul. Eng. 146, 04020047. [CrossRef]
Figure 1.
Diagram of the studied house, with its water meter at the domestic intake, underground cistern, and roof tank. Both the cistern and tank have float valves at their inlets to avoid overflow.
Figure 1.
Diagram of the studied house, with its water meter at the domestic intake, underground cistern, and roof tank. Both the cistern and tank have float valves at their inlets to avoid overflow.
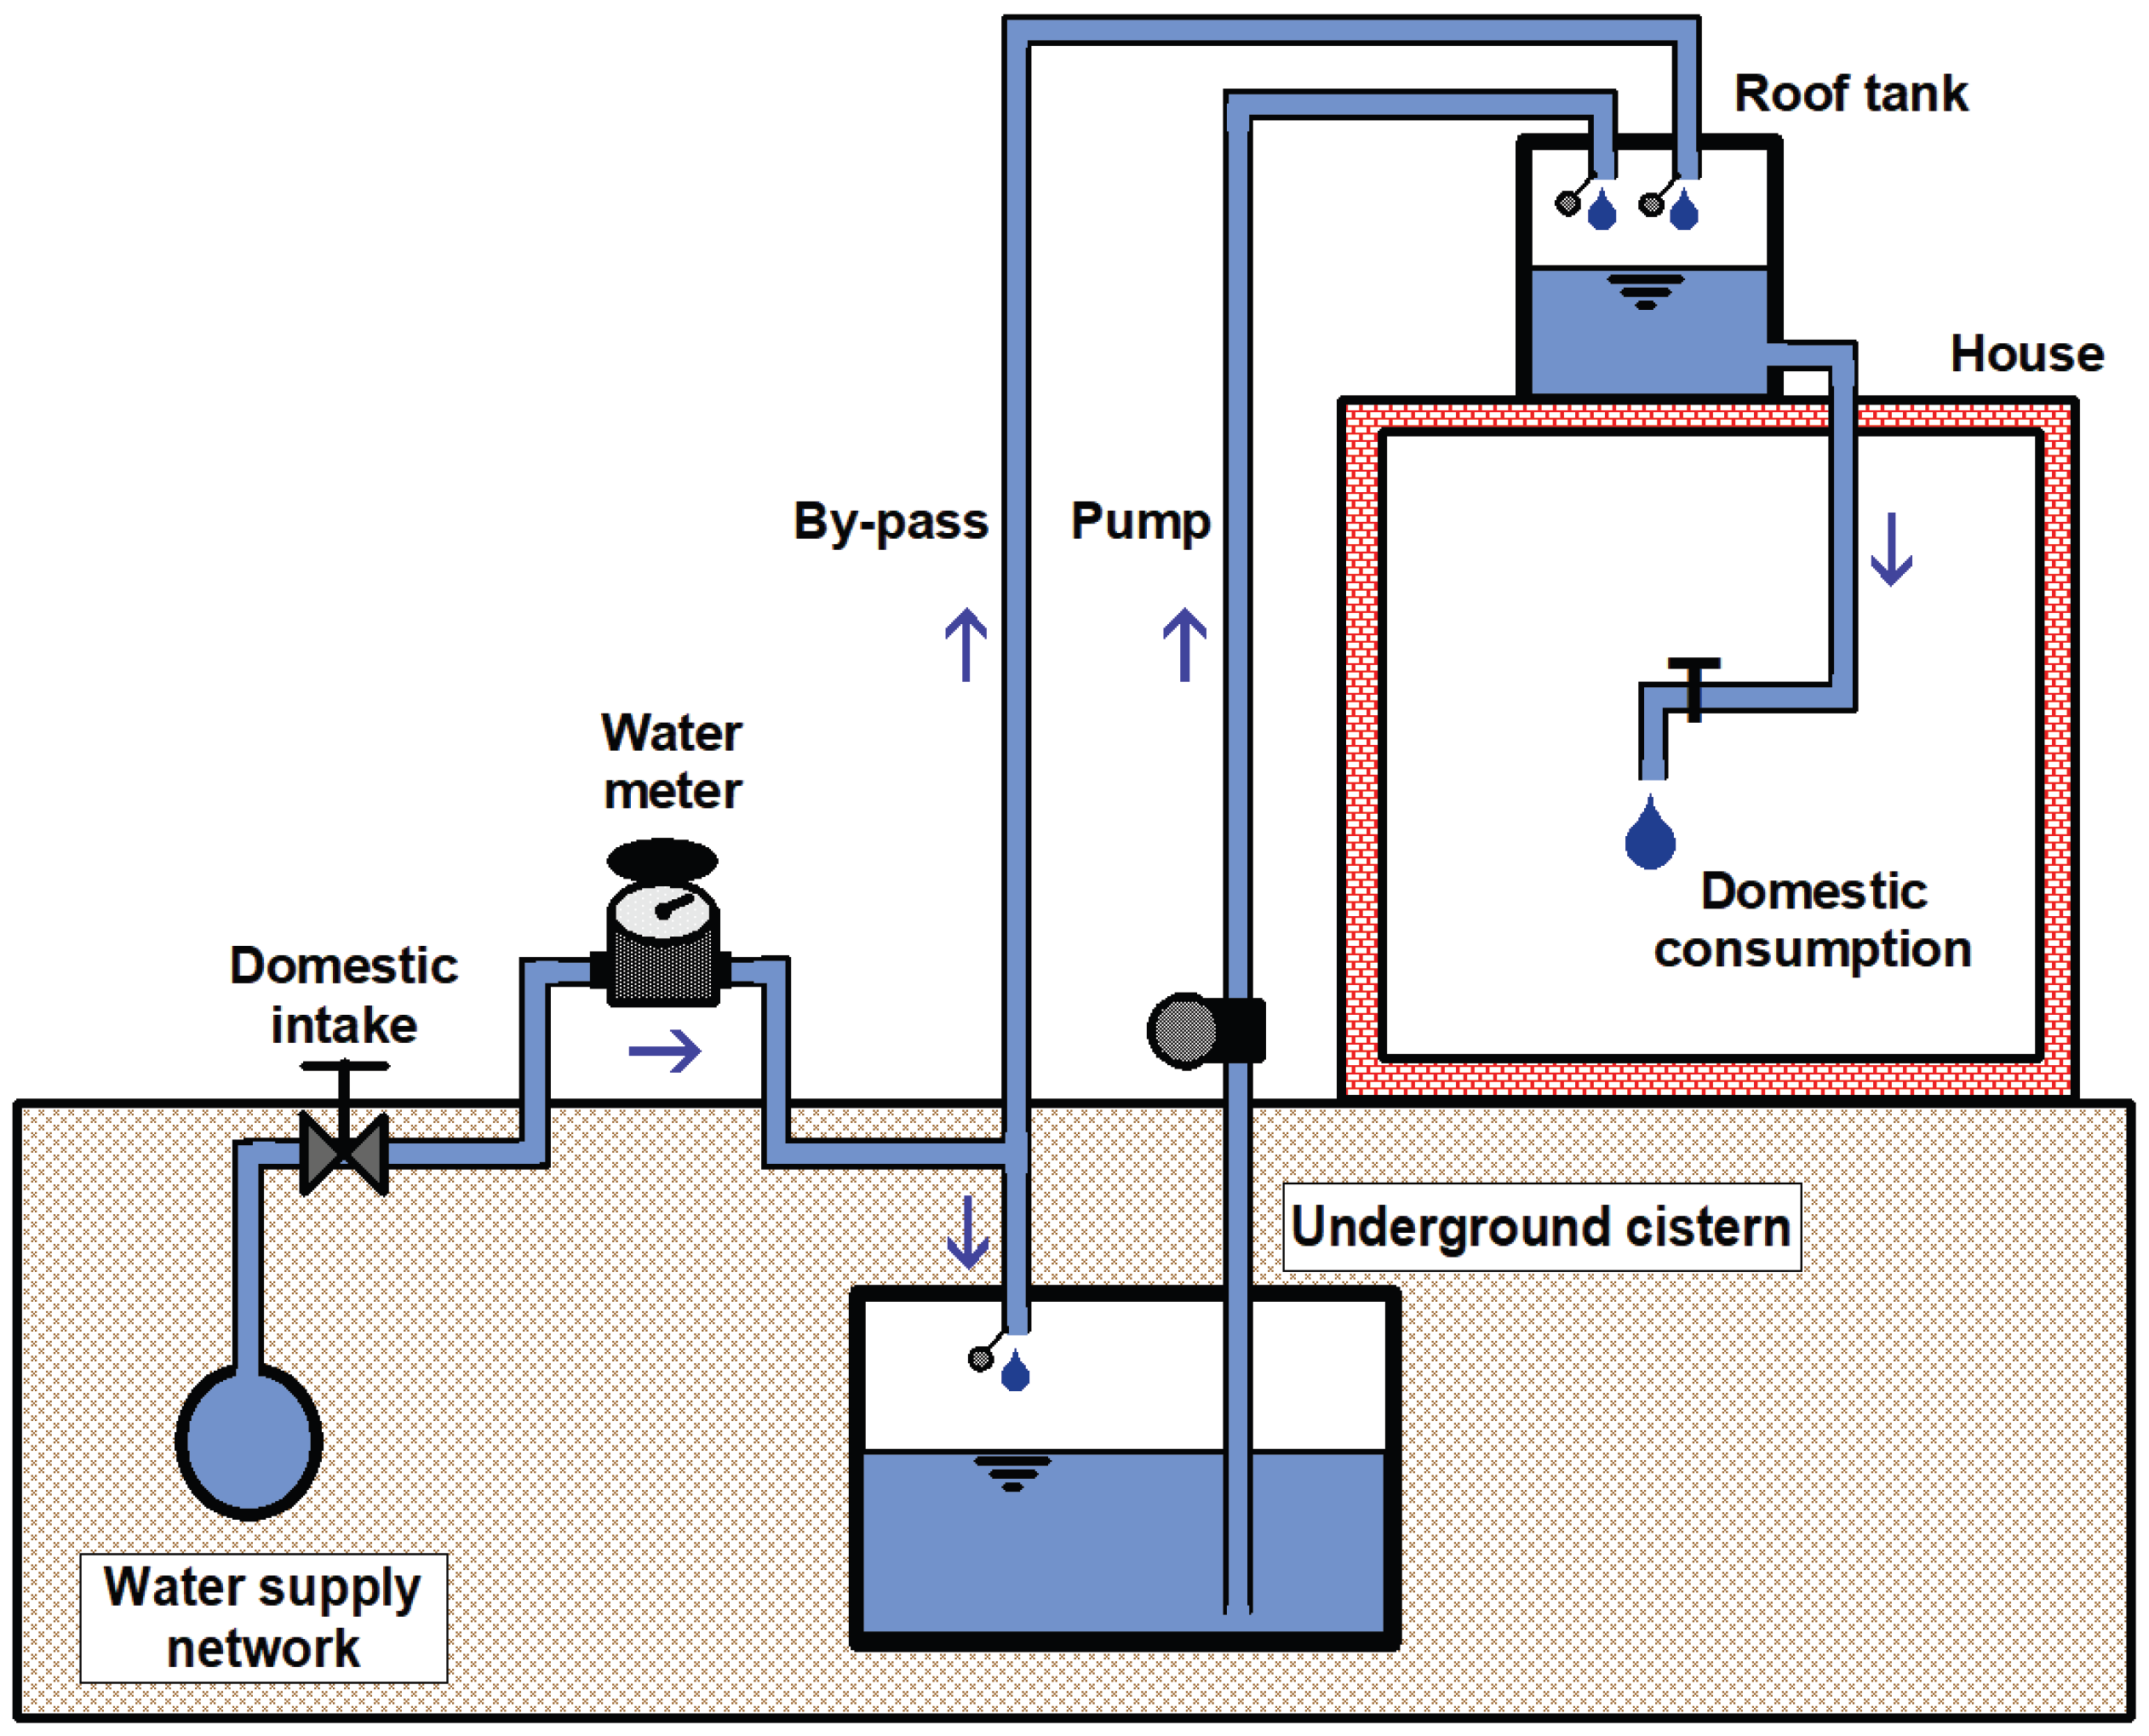
Figure 2.
Second stage of the monitoring campaign, consisting in modifying the domestic intake (in an attempt to control eventual air flows): (a) original configuration of the intake with its officially installed mechanical water meter “MJ” (multi-jet); (b) installation of an air-release valve “AV” just upstream; (c) modification of the intake so as to form a small inverted siphon “IS”. The arrow shows the normal direction of flow through the intake (i.e., from the supply network to the house).
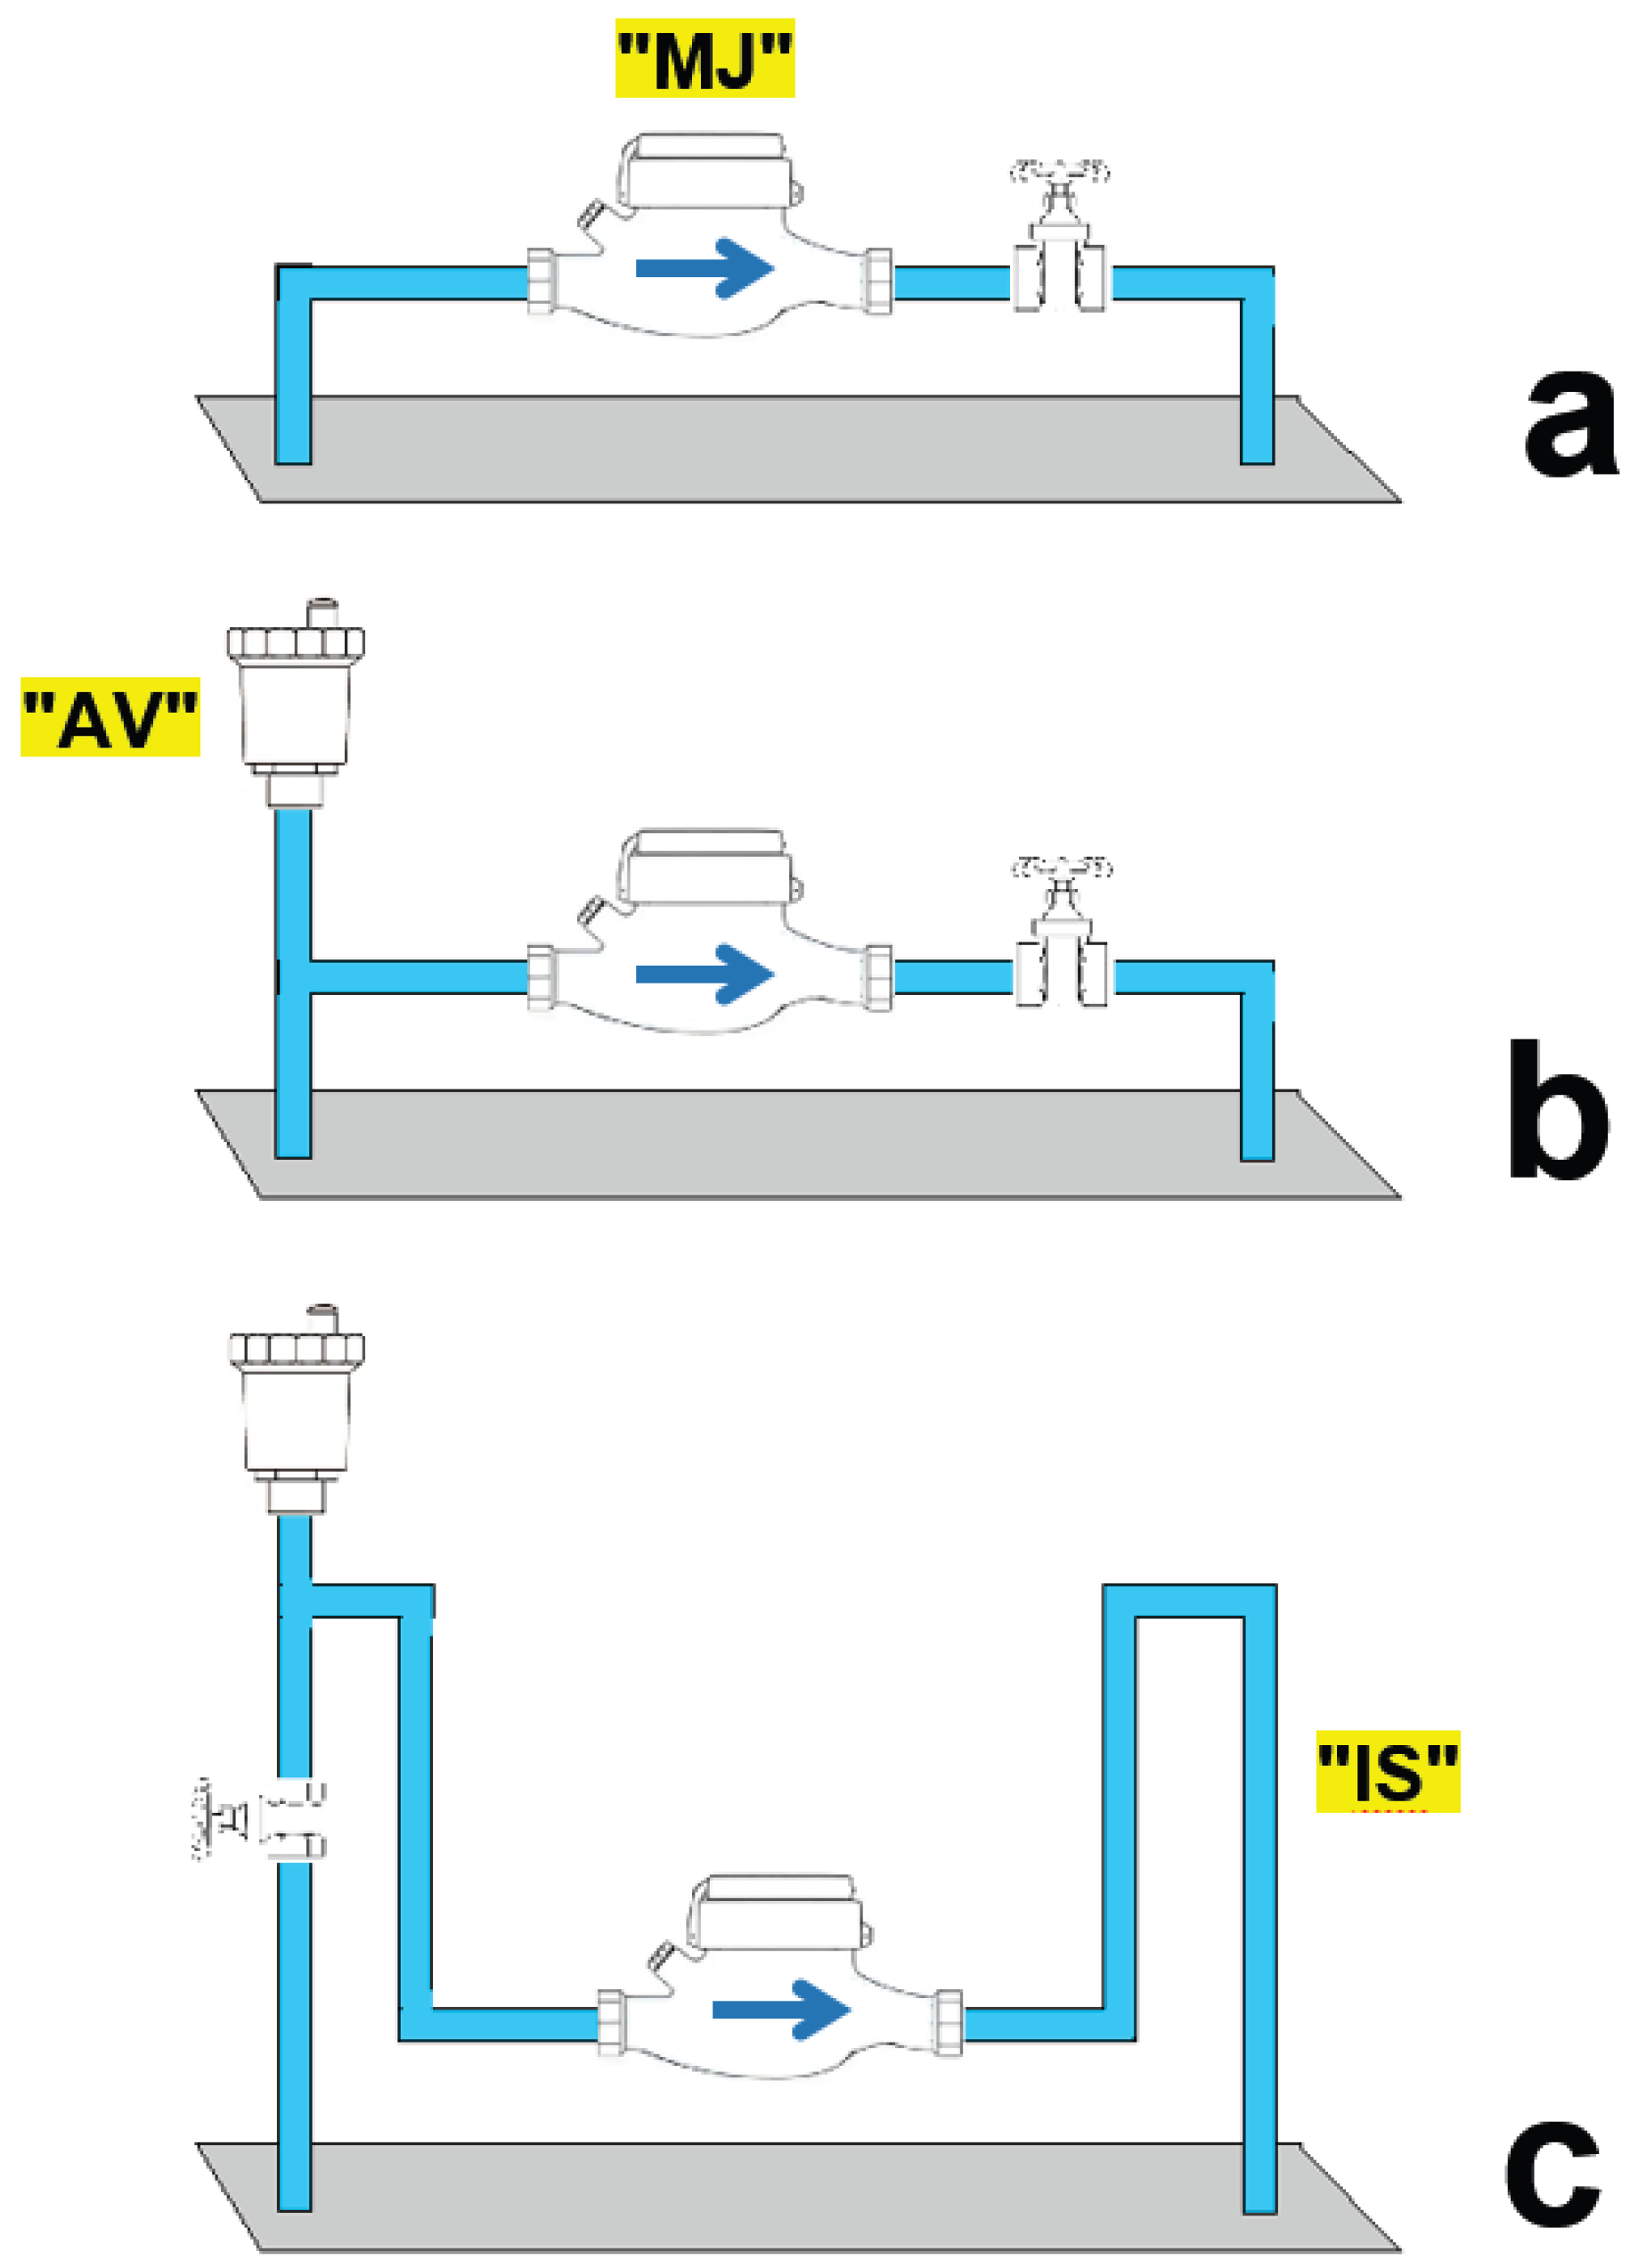
Figure 3.
Third stage of the monitoring campaign, consisting in adding two water meters at the domestic intake (for the purpose of inter-comparison): (a) installation of another mechanical meter “SJ” (single-jet), and (b) installation of a non-mechanical meter “US” (ultrasonic). Please, note that both meters “SJ” and “US” can be installed vertically, with no concern for pipe length (i.e., meters are specified as “U0/D0” (OIML, 2024)).
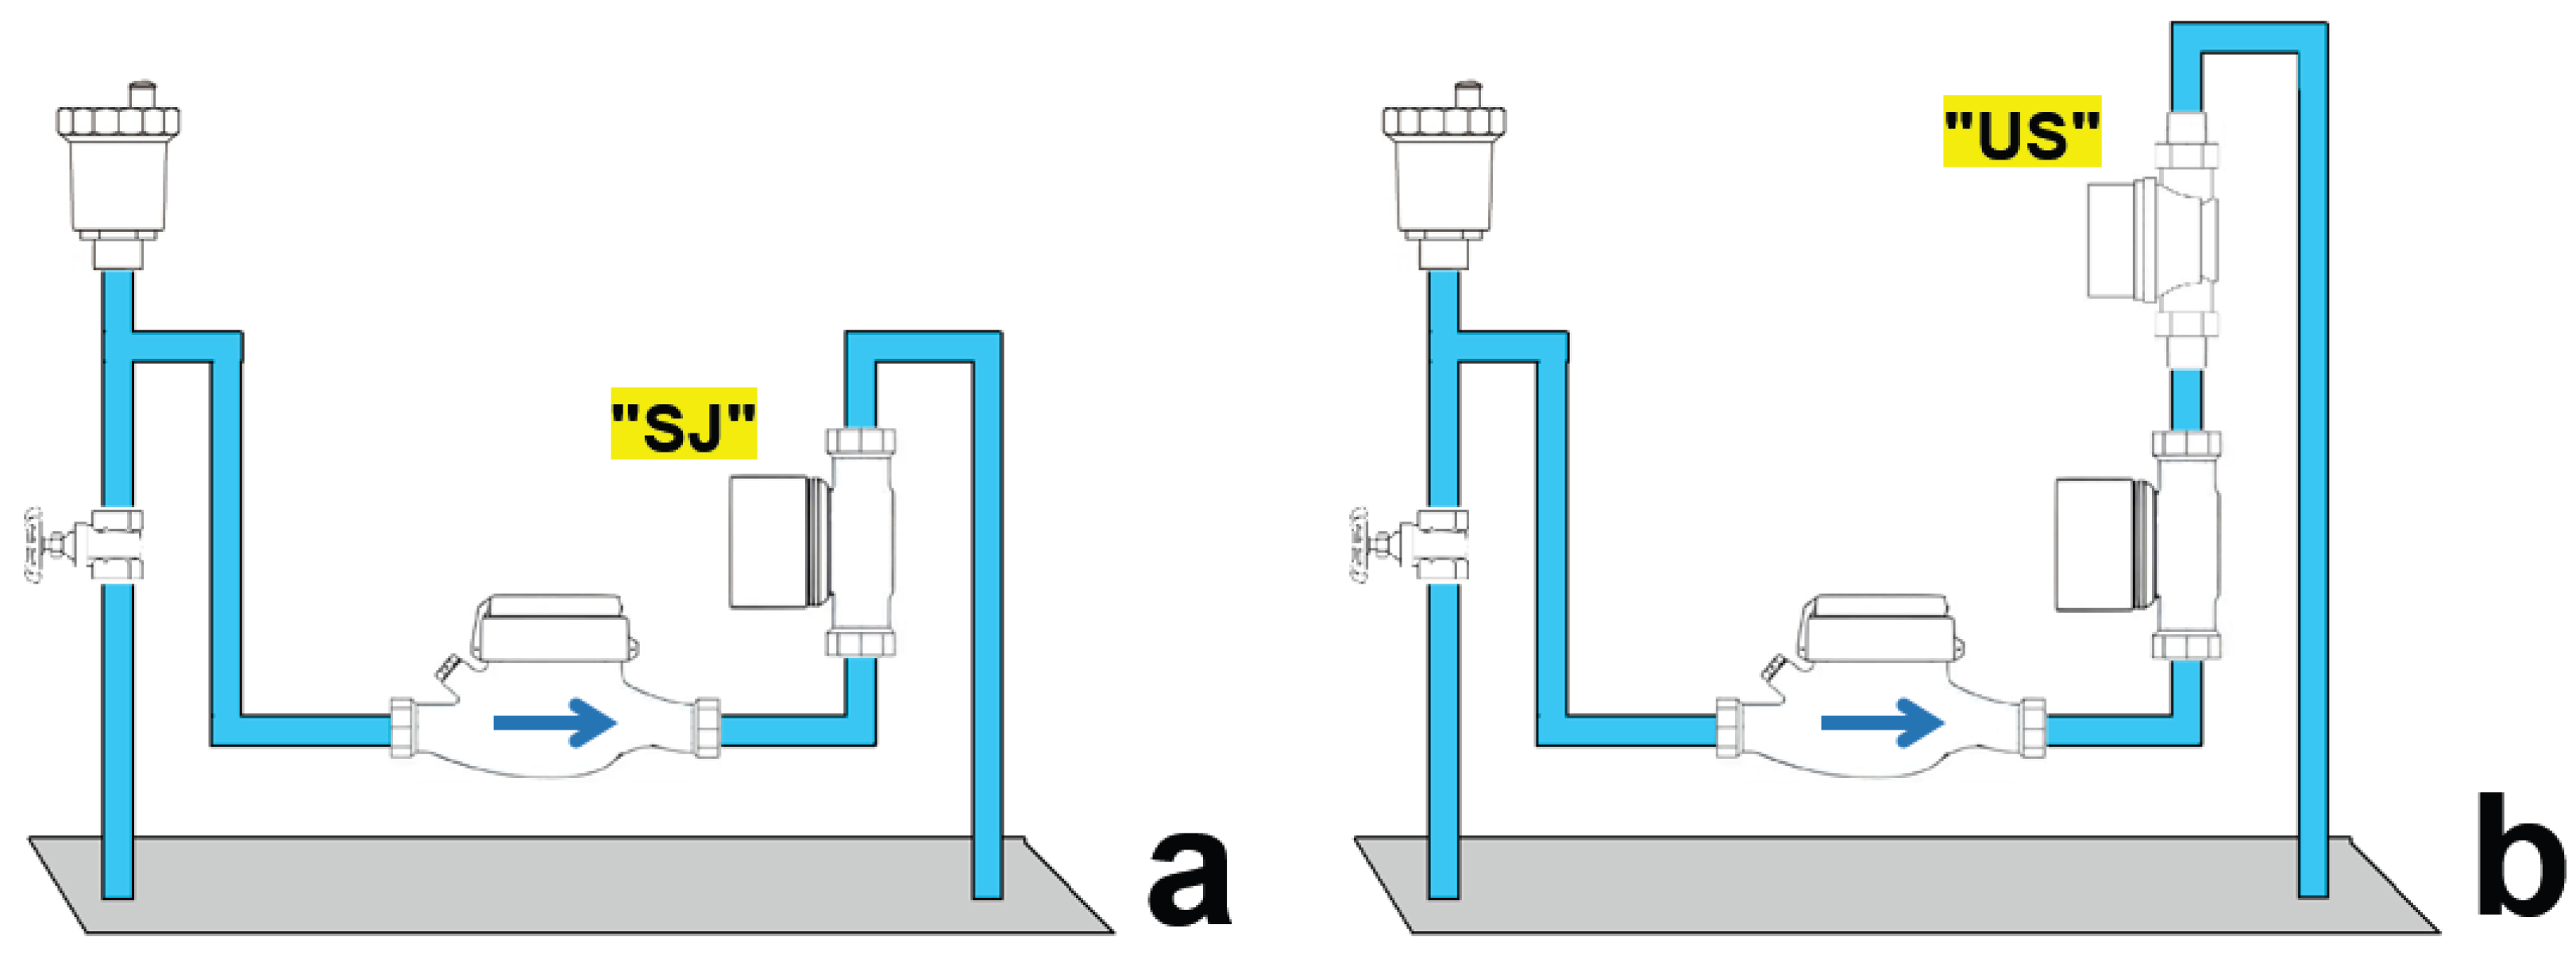
Figure 4.
Domestic consumption estimated by the water meter (multi-jet, ≈ 20 years old) of a nearby house: (a) total consumption (since 15/01/2025); (b) daily consumption. The rather regular pattern of water consumption (until ≈ 09/09/2025) is underlined by the dotted red line on the top plot (based on a visual fit) and by the smooth red curve on the bottom plot (smoothing obtained by running average on 13 points, with one repetition).
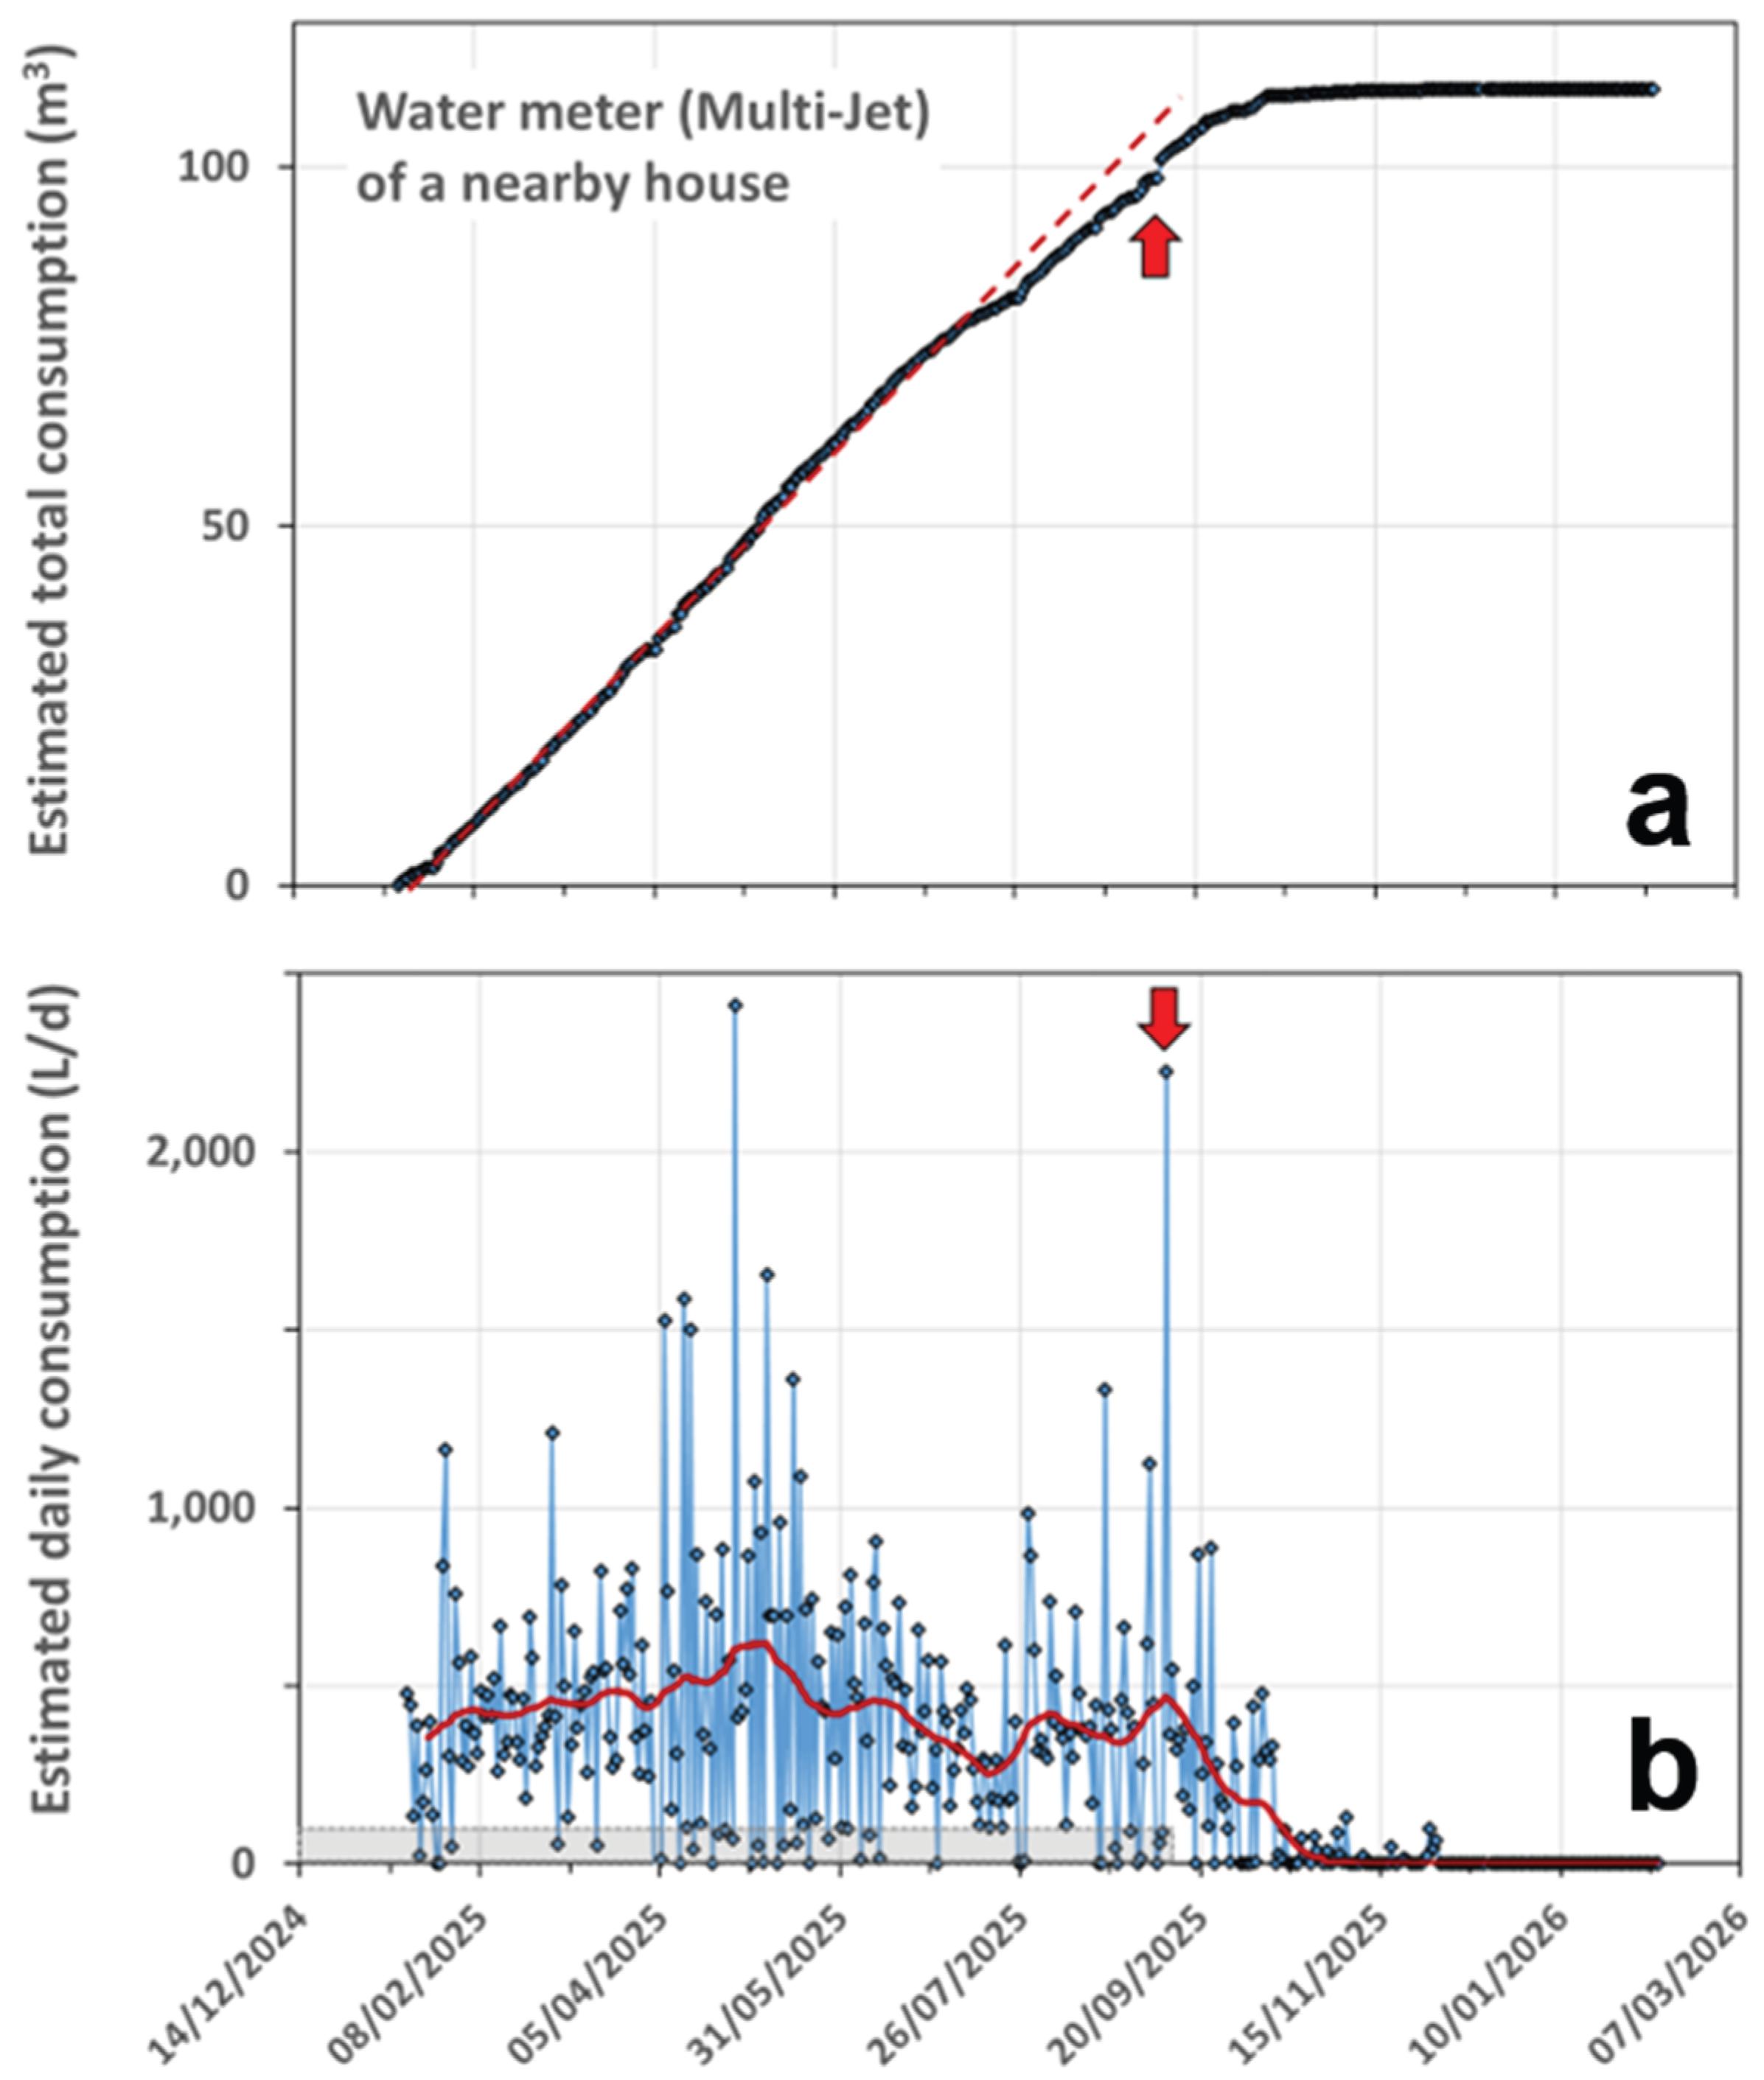
Figure 5.
Domestic consumption estimated from the mechanical water meter “MJ” officially installed at the domestic intake of the studied house: (a) total consumption (since 14/12/2024); (b) daily consumption. On the top plot, the green lines show periods with no water consumption (the house’s owner was away). On the bottom plot, the yellow circle shows when an air-release valve was installed at the domestic intake (see Figure 2b), and the yellow triangle shows when the intake was modified into a small inverted siphon (see Figure 2c).
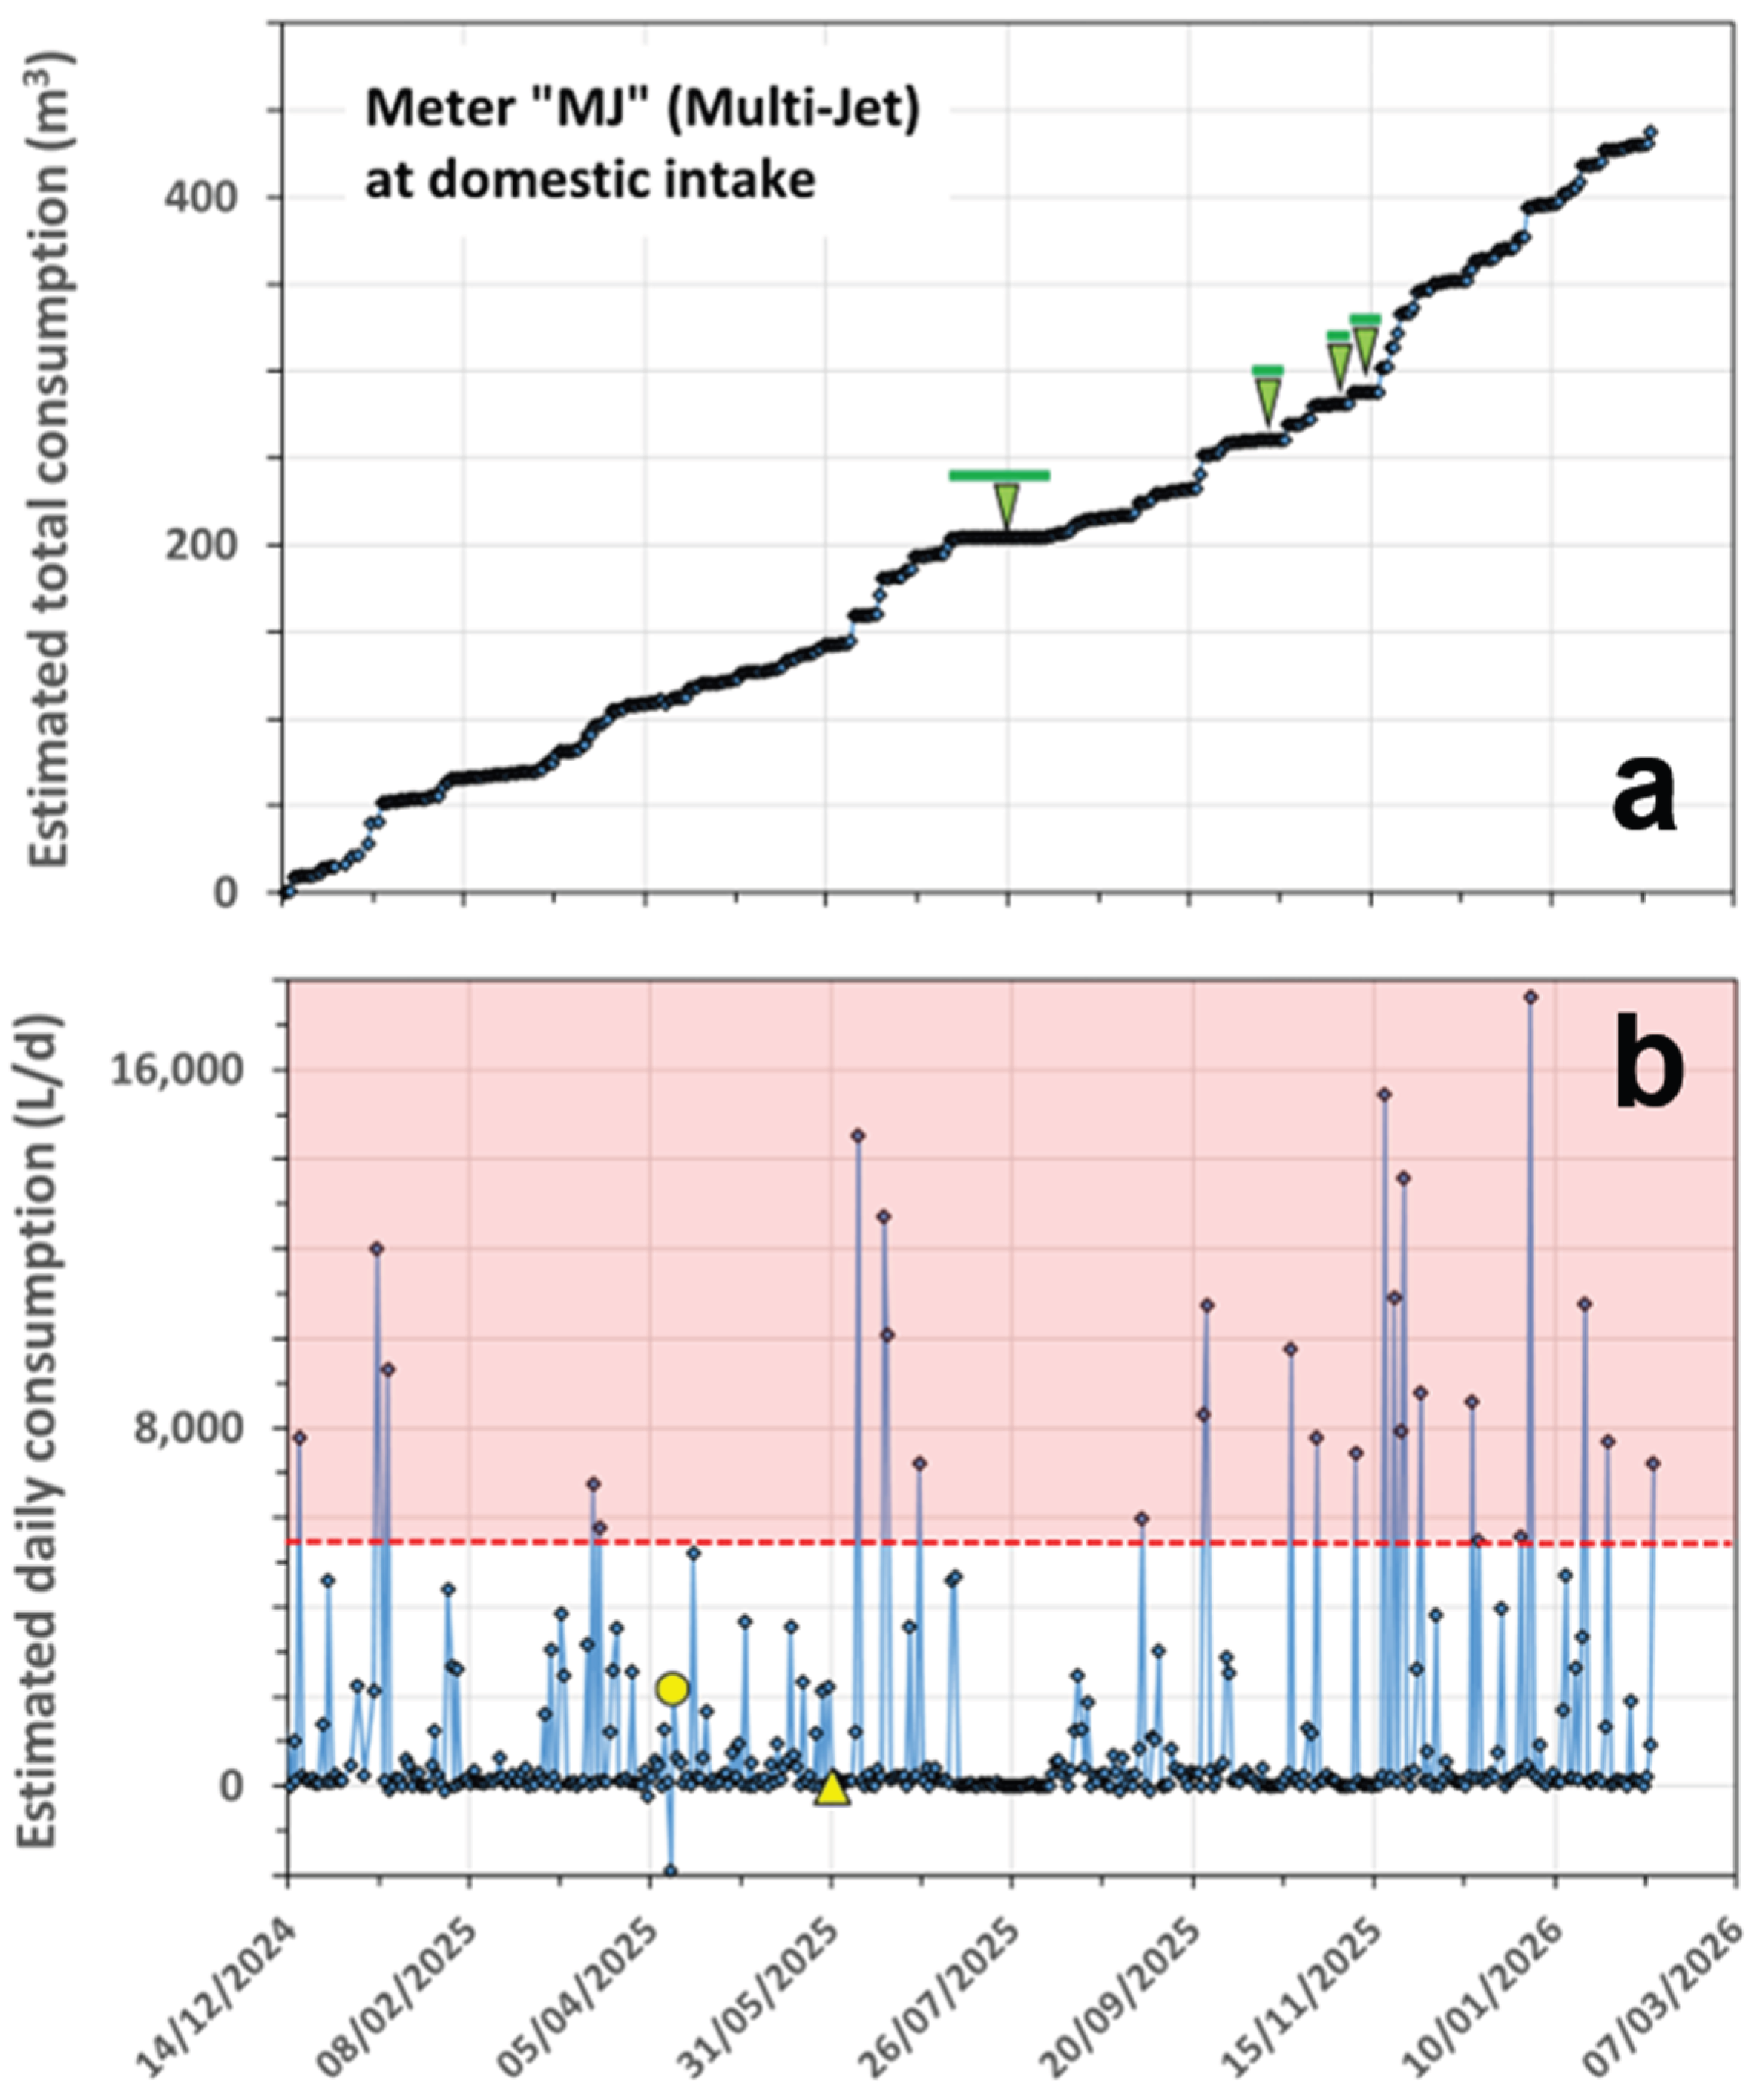
Figure 8.
Comparison of total consumption (since 11/10/2025) estimated by meters “US” and “MJ-T”.
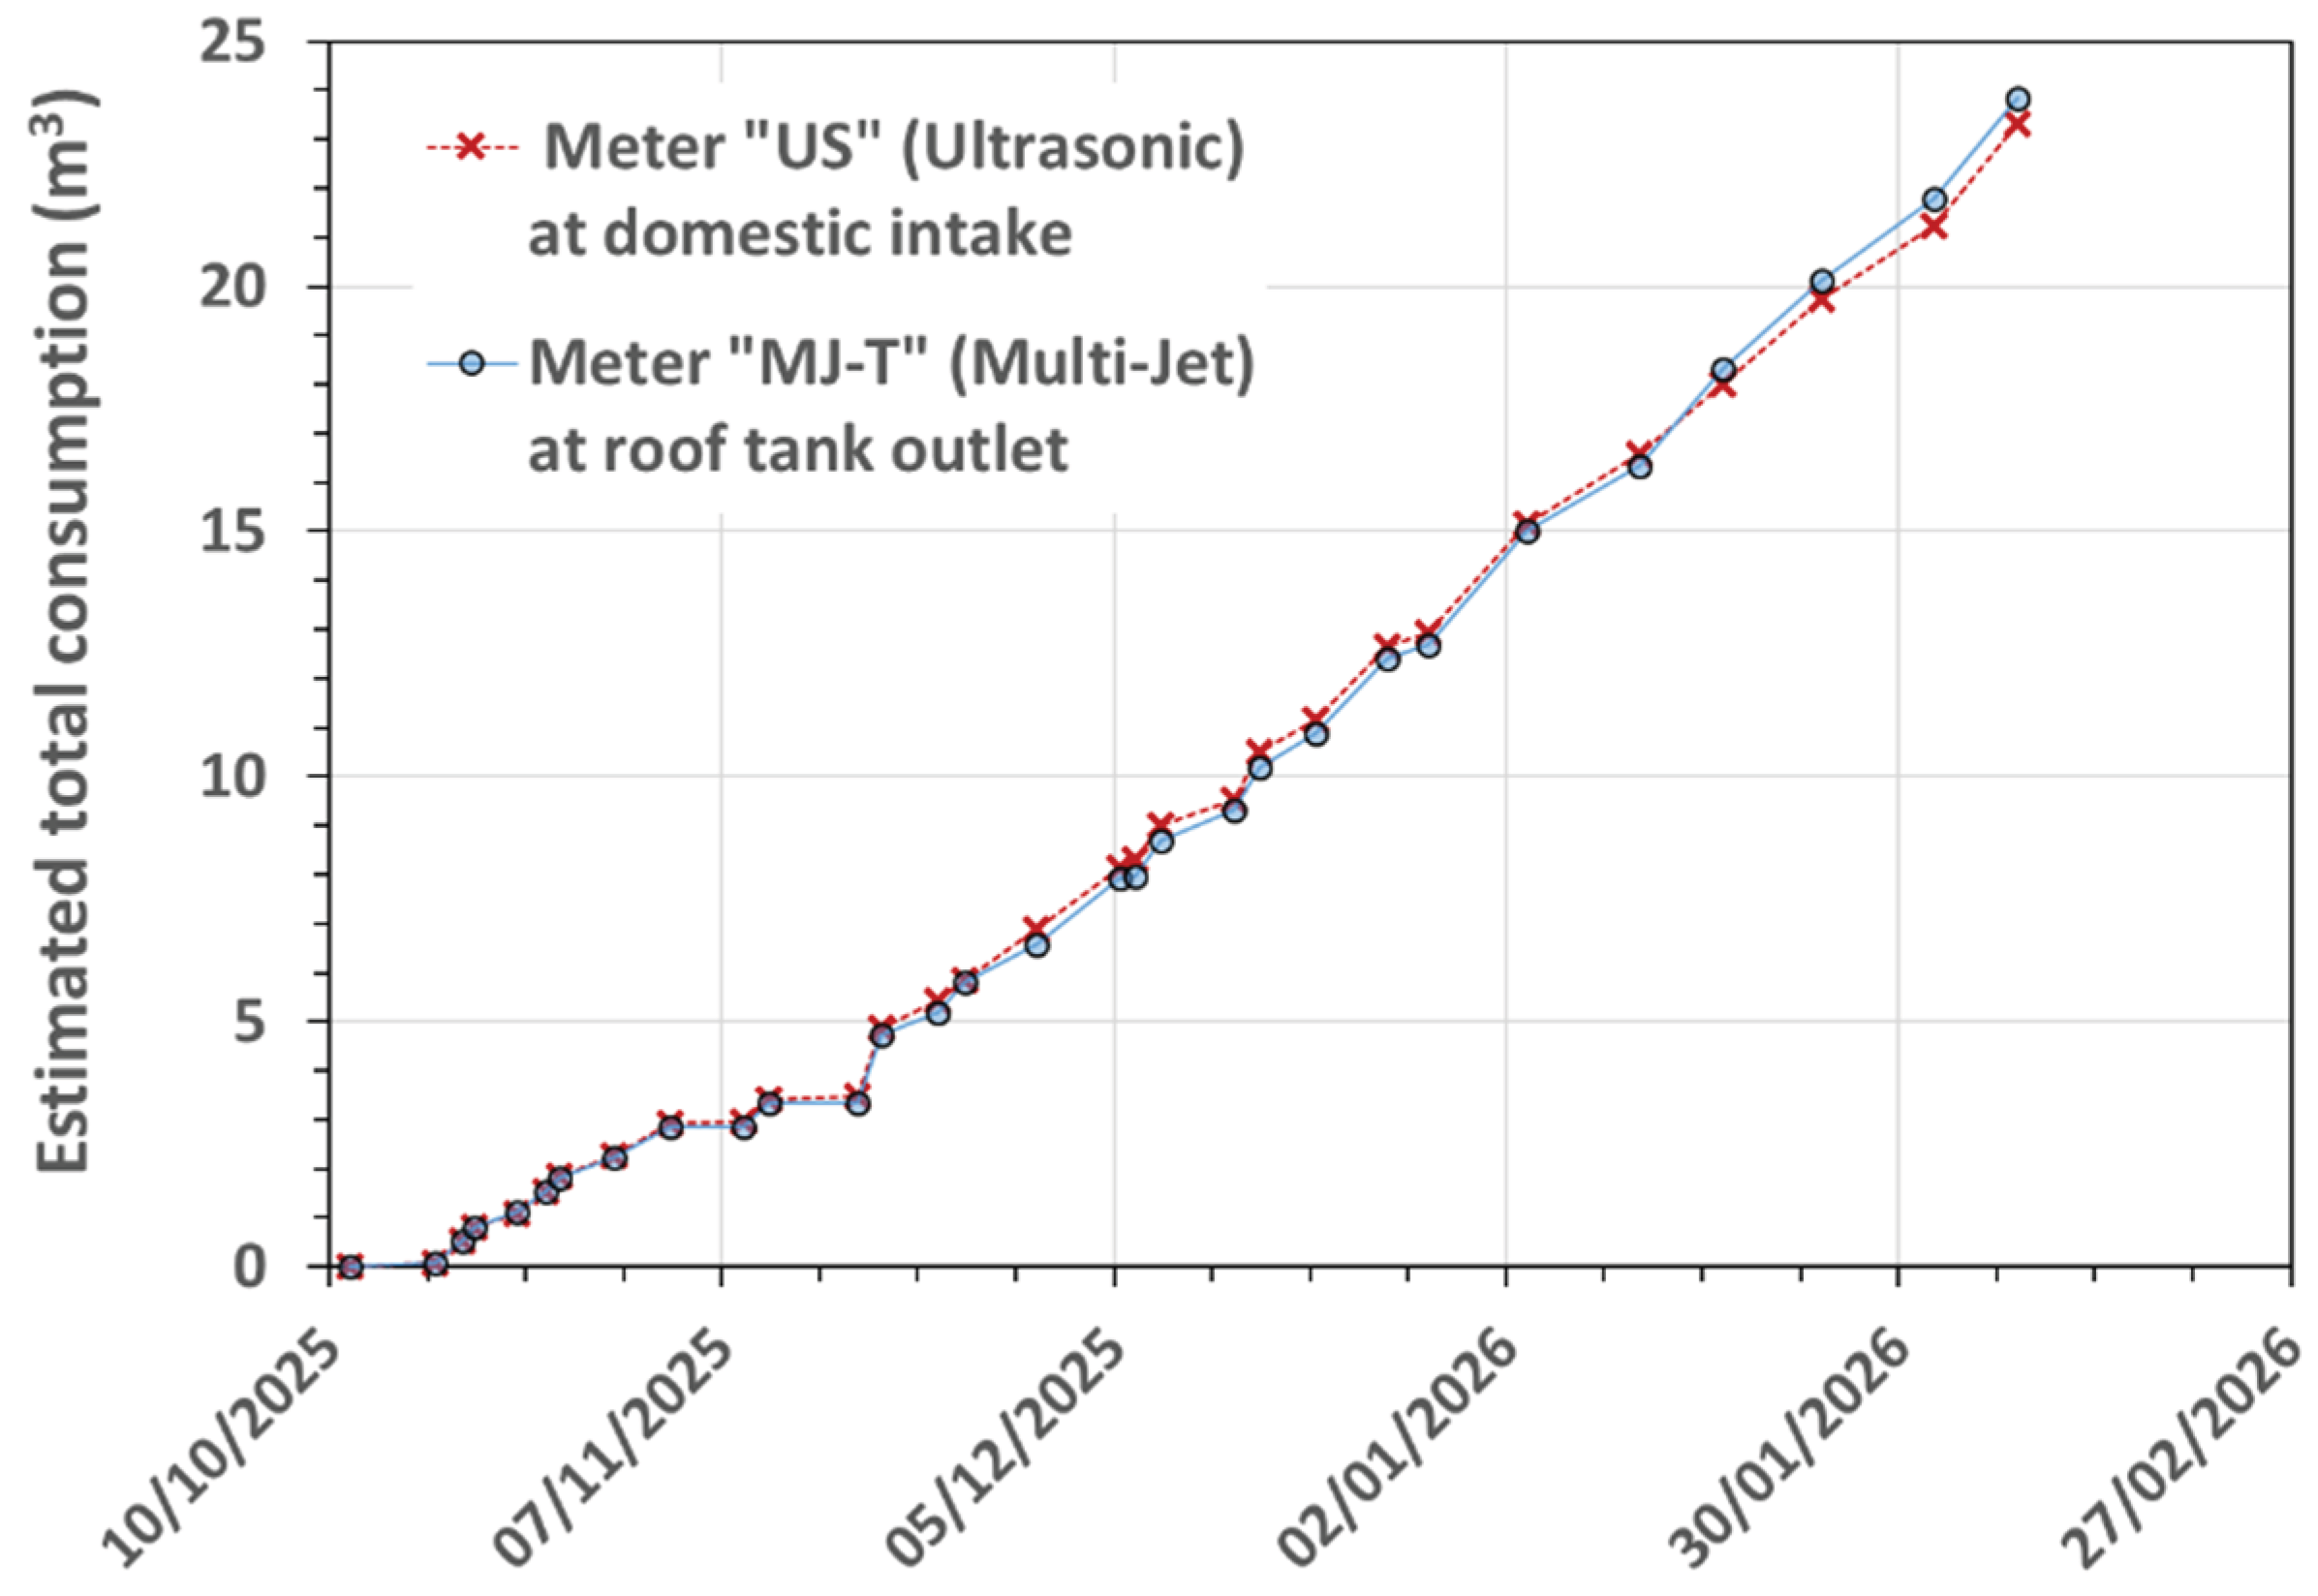
Figure 9.
Three mechanisms that could produce air flows through the domestic intake of the studied house: (a) transients occurring during intermittent supply (air is pushed during the pipeline fillings, and sucked during the emptyings); (b) hydraulic jump (due to street slope) that may develop during periods of continuous supply (air tends to be sucked and entrained downstream in the form of bubbles); (c) period with no supply of the street pipeline, while that of the street below continuously receives water (and transports air bubbles that tend to accumulate in the street pipeline).
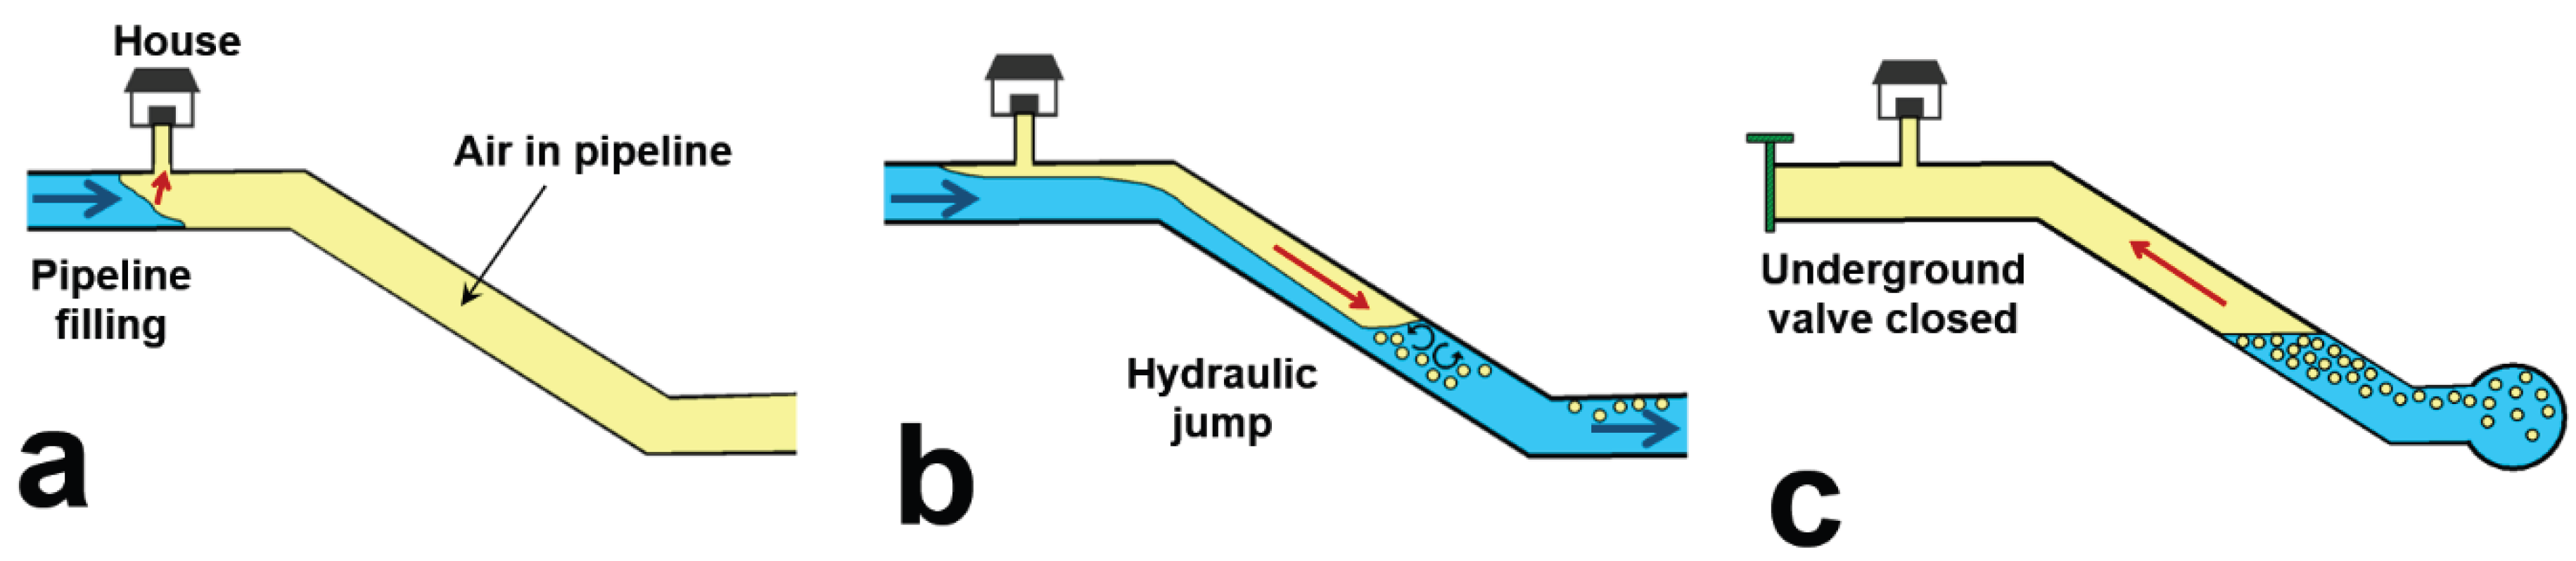
Figure 10.
Working principle of the air-release valve “AV” installed at the domestic intake: (a) valve closes when water is supplied, so that water can only flows towards the water meter; (b) valve opens when air is coming, so that air can escape to the atmosphere, but without preventing flow towards the water meter; (c) view of valve components (the orifice has a diameter of 1 mm).
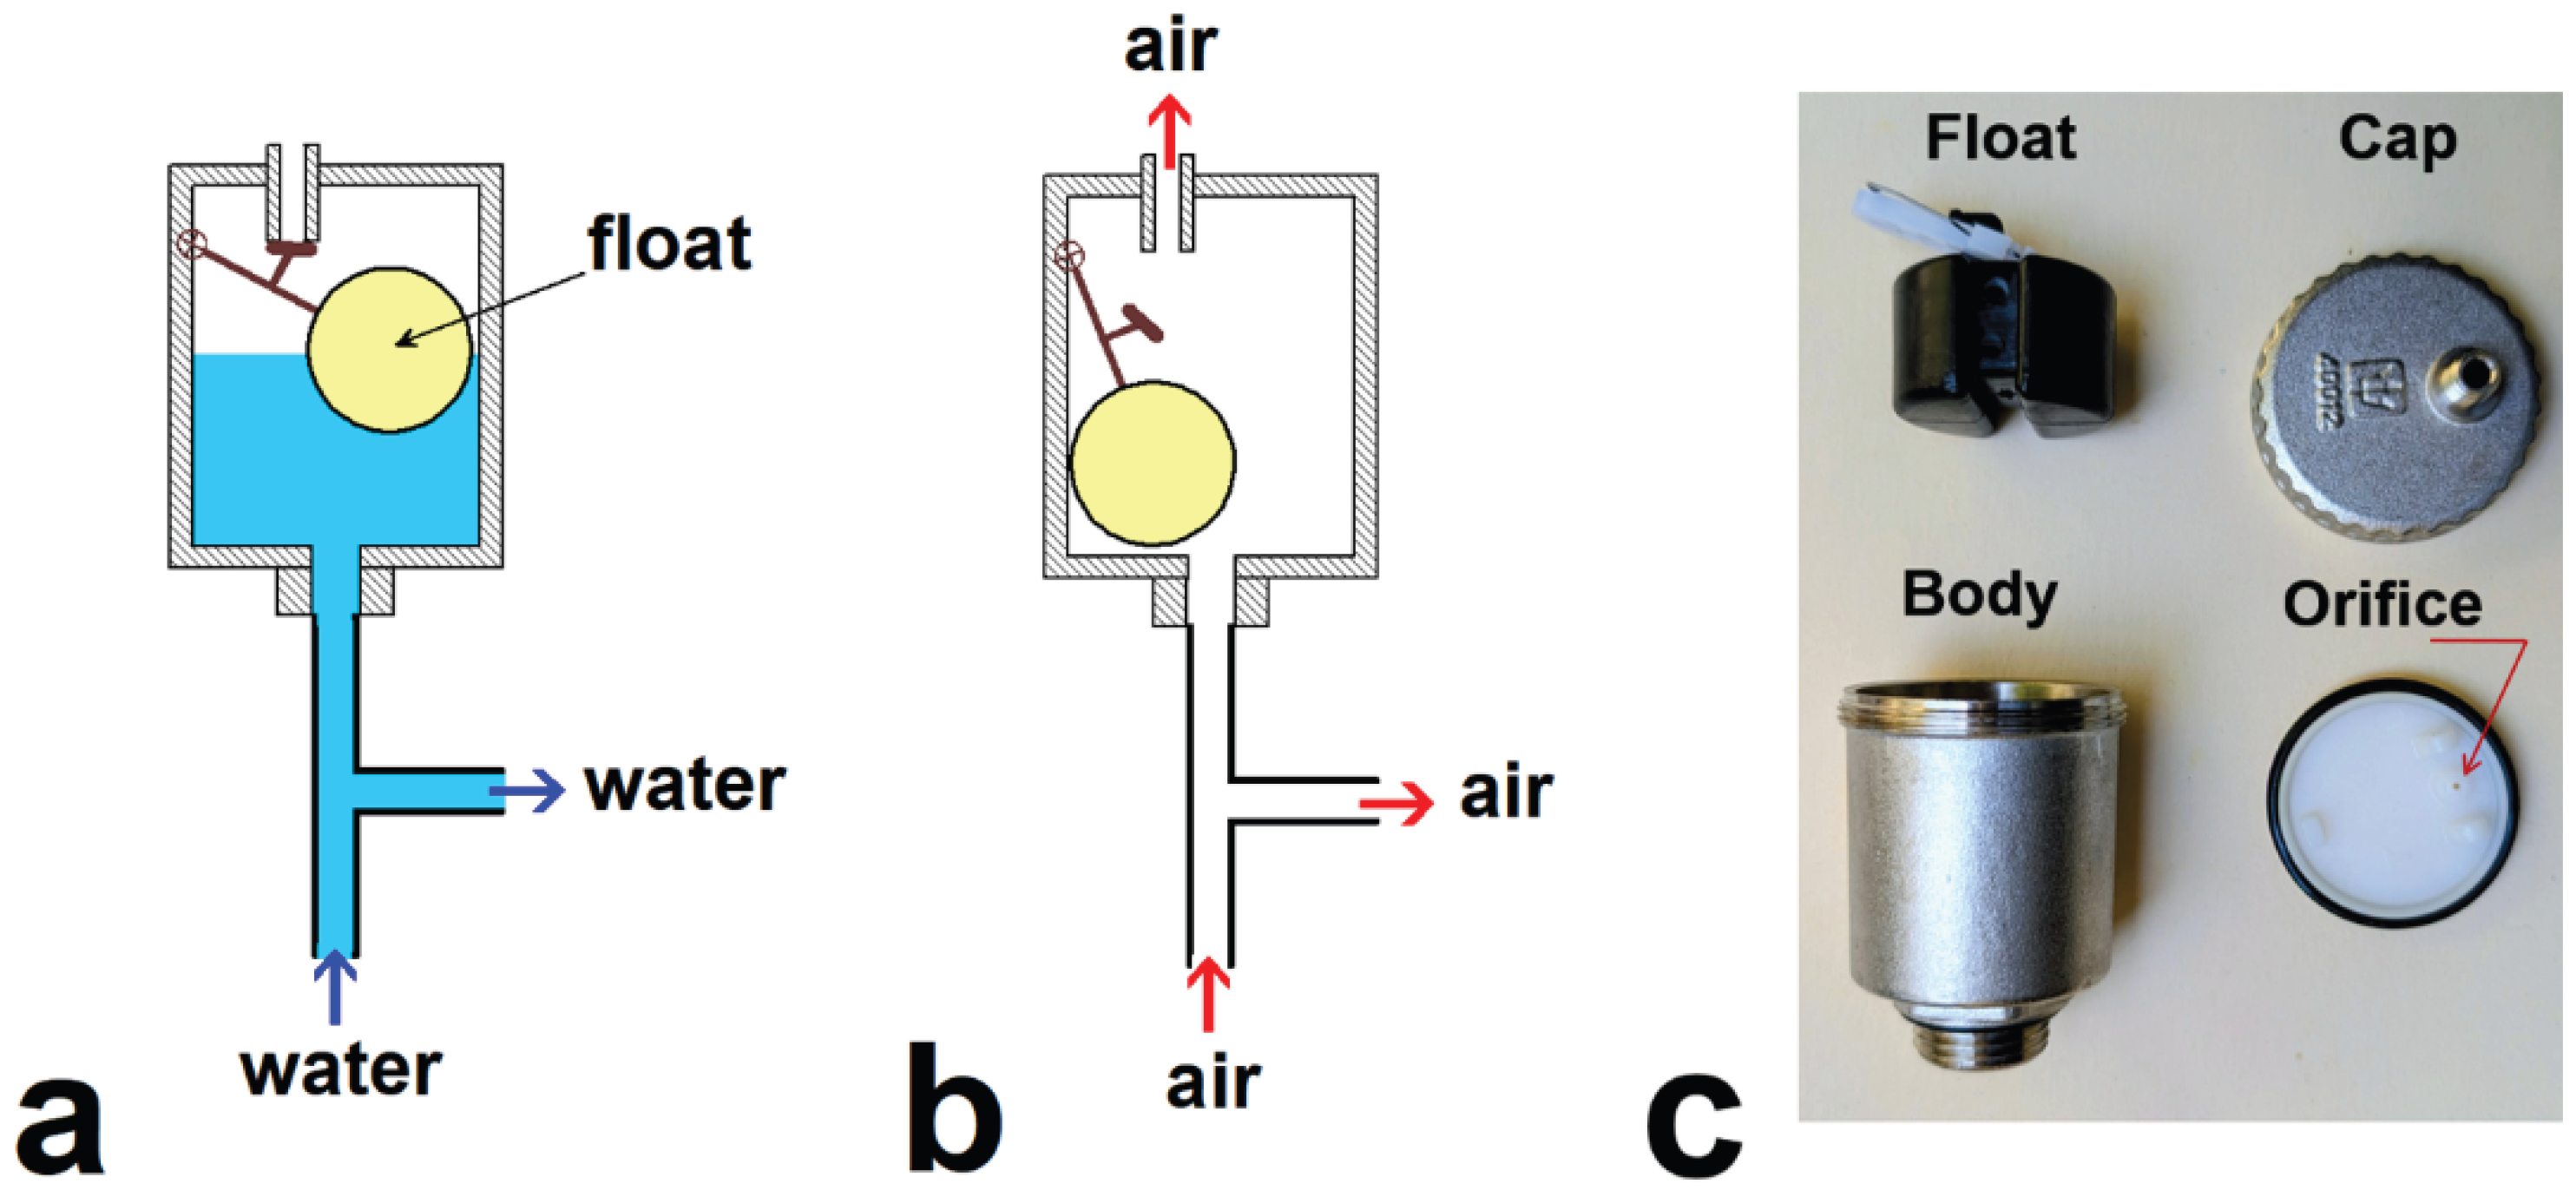
Figure 11.
Air-release valves installed at domestic intakes in the neighborhood of the studied house, and in other cities of central Mexico.
Figure 11.
Air-release valves installed at domestic intakes in the neighborhood of the studied house, and in other cities of central Mexico.
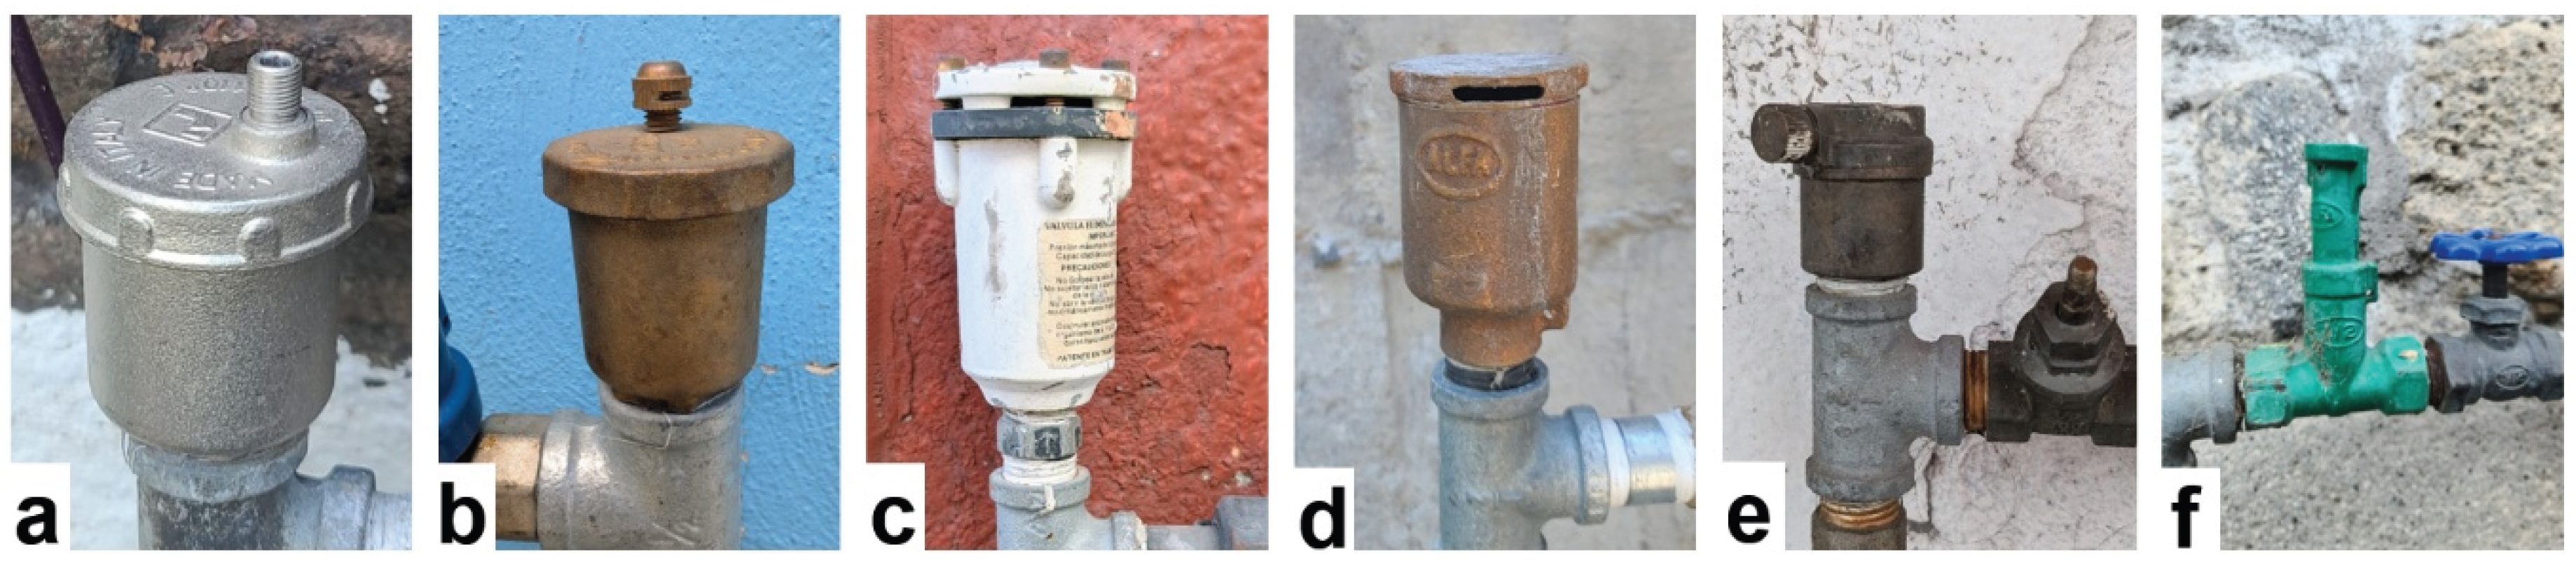
Figure 12.
Appearance of data provided by meter “MJ”, if readings were taken only once a month: (a) total consumption; (b) daily consumption (for comparison, see Figure 5). On the top plot, the dotted red line shows a linear regression (with its linear coefficient of regression ).
Figure 12.
Appearance of data provided by meter “MJ”, if readings were taken only once a month: (a) total consumption; (b) daily consumption (for comparison, see Figure 5). On the top plot, the dotted red line shows a linear regression (with its linear coefficient of regression ).
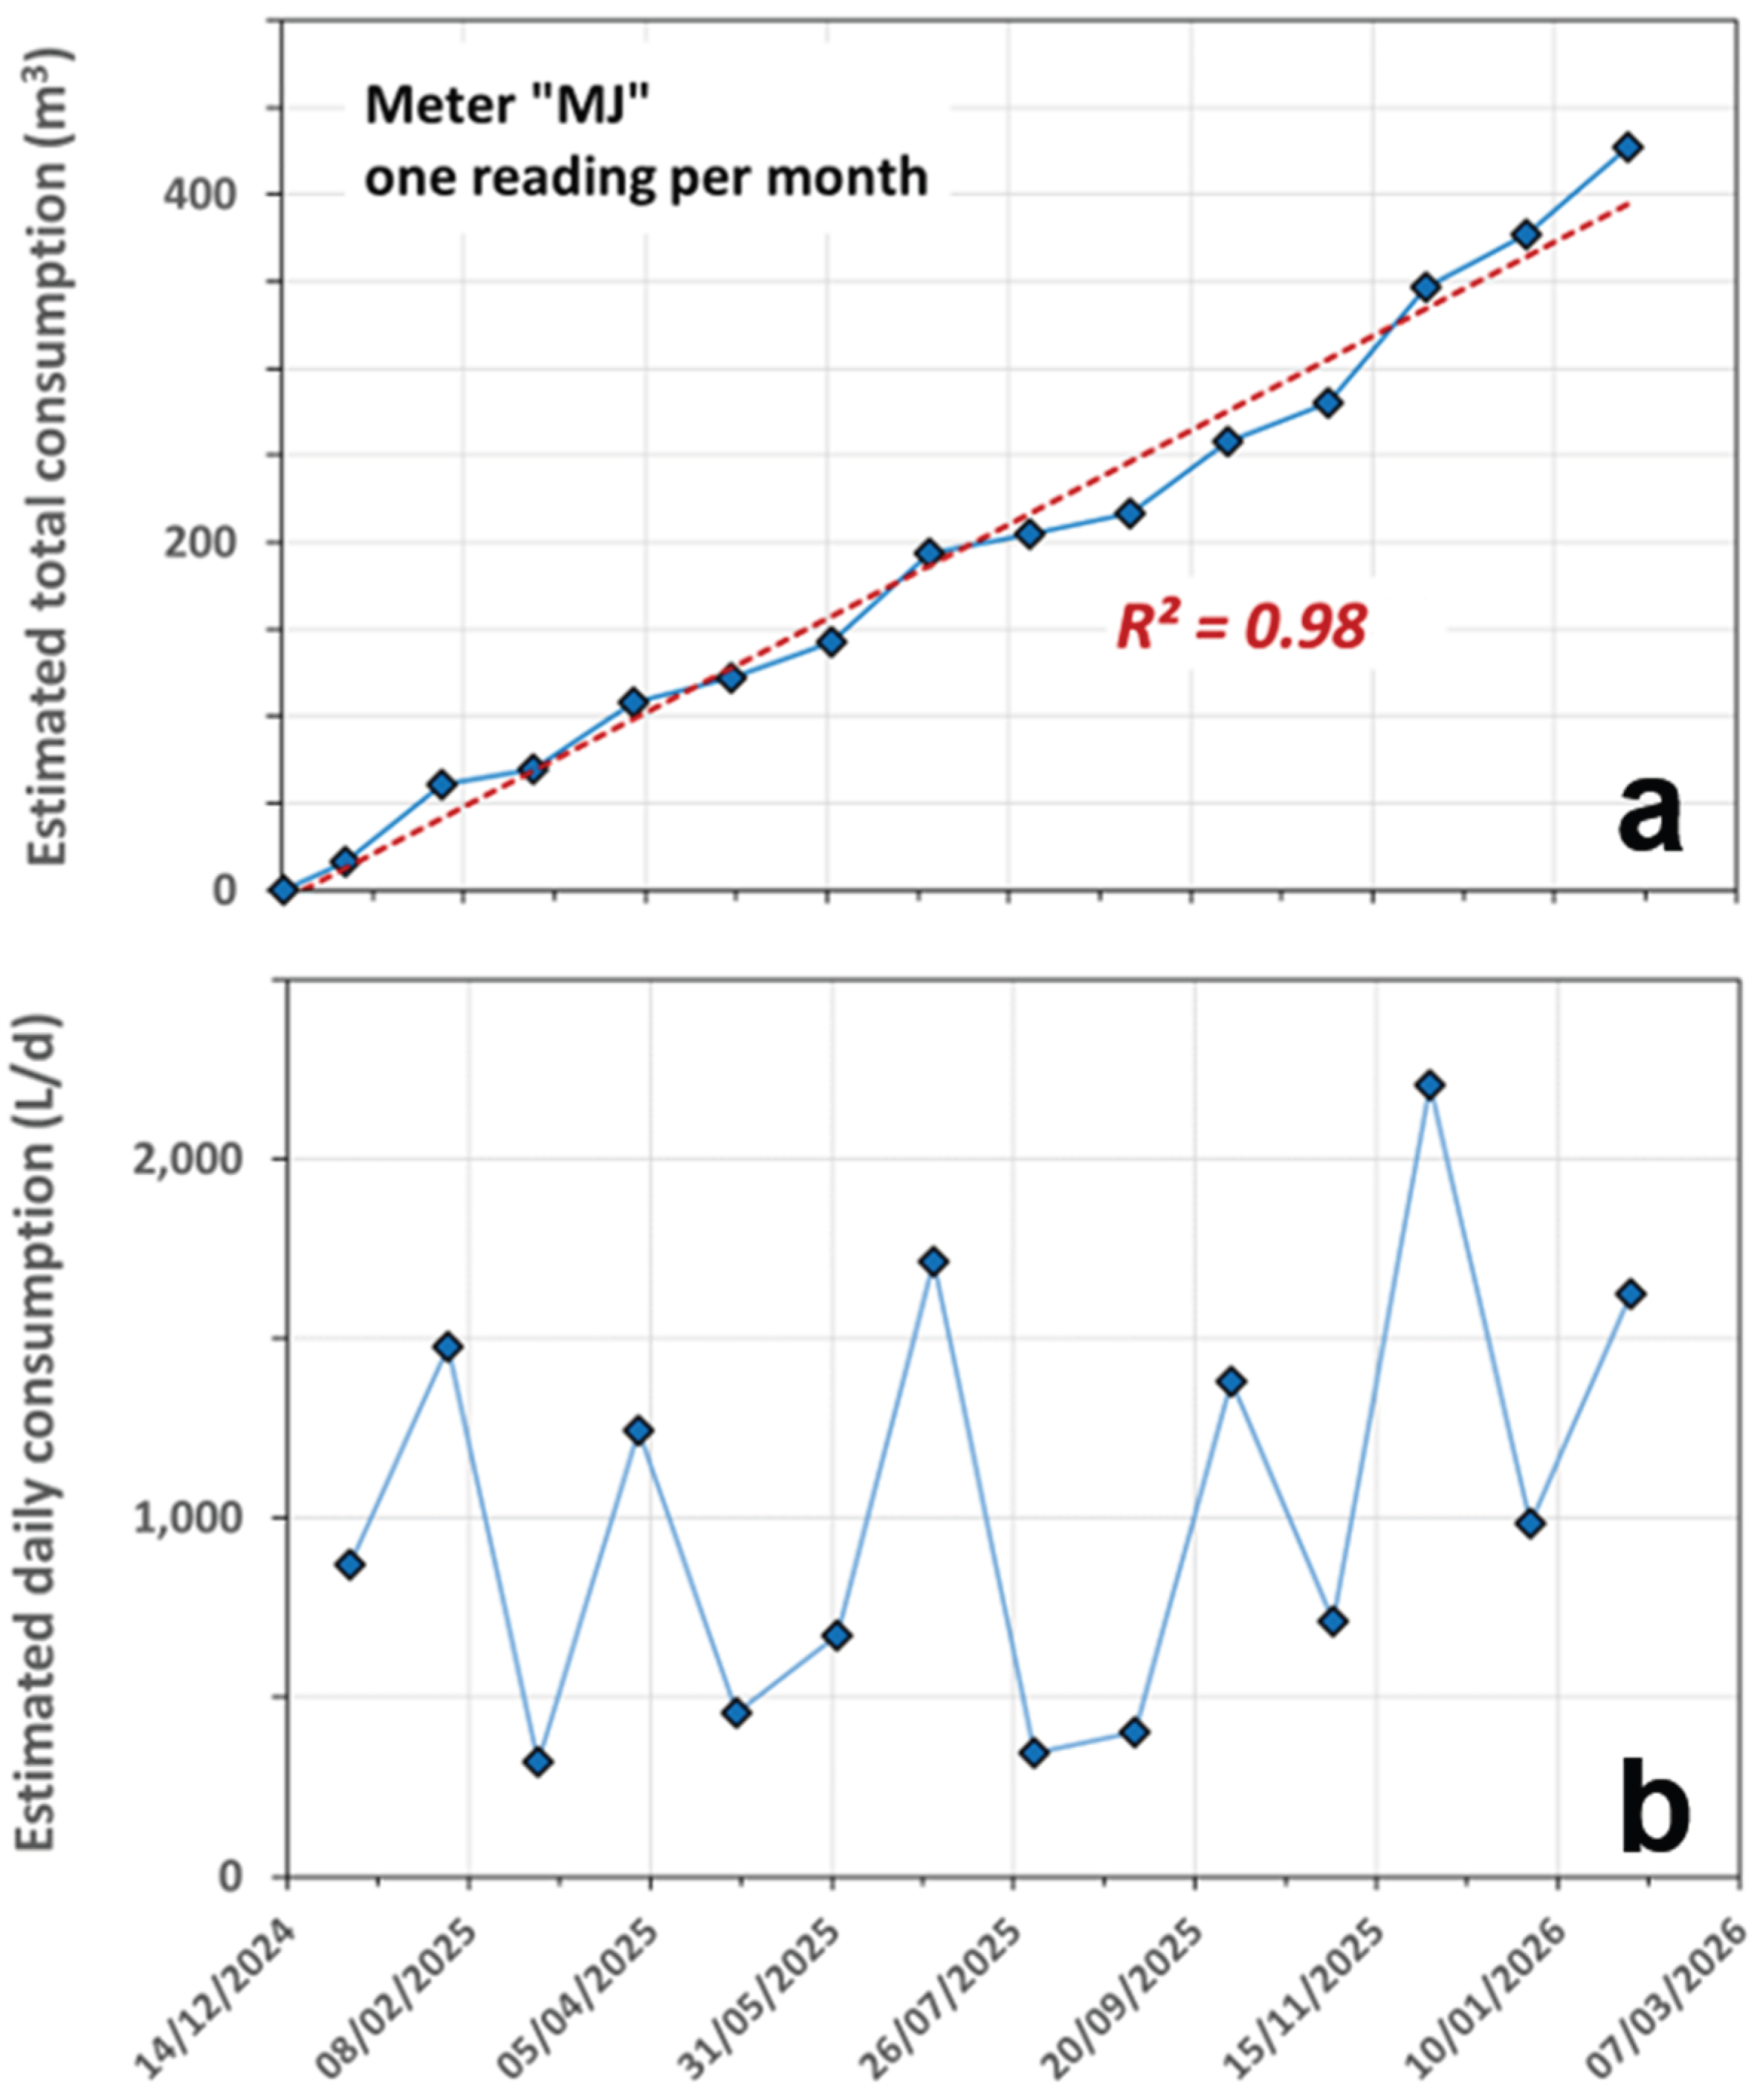
Table 1.
Time line of the monitoring campaign.
| Stage | Date | Activity |
|---|---|---|
| 1 | 14/12/2024 | ➢ Start daily monitoring of meter “MJ” (multi-jet) installed at the domestic intake |
| 2 | 12/04/2025 | ➢ Add an air-release valve “AV” at the domestic intake |
| 31/05/2025 | ➢ Modify domestic intake so as to form an inverted siphon “IS” | |
| 3 | 16/08/2025 | ➢ Add meter “SJ” (single-jet) at the domestic intake |
| 27/09/2025 | ➢ Add meter “US” (ultrasonic) at the domestic intake | |
| 4 | 10/10/2025 | ➢ Install meter “MJ-T” (multi-jet) at the roof tank’s outlet |
| 09/02/2026 | ➢ End of the monitoring campaign |
Table 2.
Technical specifications of the four water meters installed in the studied house.
| Meter location | Domestic intake | Roof tank | ||
| Type | Multi-jet | Single-jet | Ultrasonic | Multi-jet |
| Code | “MJ” | “SJ” | “US” | “MJ-T” |
| Meter brand | ... | Siemens | Axioma | Equysis |
| Model | ... | WFK240.D080 | Qalcosonic W1 | MPC-25 |
| Approval | ISO 4064: 2014 | OIML R-49: 2013 | OIML R-49: 2013 | NOM-012: 1994 |
| Installation conditions: | ||||
| Vertical mount 1 | No | Yes | Yes | No |
| Pipe length 2 | n/a | U0 / D0 | U0 / D0 | U5 / D3 |
| Pipe | 13 mm (1/2”) | 20 mm (3/4”) | 13 mm (1/2”) | 25 mm (1”) |
| Flow rates (L/h): | ||||
| Minimum () | 31 | 40 3 | 3 | 35 |
| Transitional () | 50 | 64 | 5 | 53 |
| Permanent () | 2,500 | 2,500 | 2,500 | 3,500 |
| Overload () | 3,130 | 3,130 | 3,130 | 7,000 |
| Accuracy: | ||||
| Class | “2” | “2” | “2” | “2” |
| Ratio (R = ) | 80 | 63 | 800 | 100 |
1 This refers to the possibility of installing the meter on a vertical pipe, provided that water flows upwards. 2 This means that the meter must be installed on a straight pipe that is longer than a specified number of times the nominal diameter (), either upstream (U) or downstream (D) (OIML, 2024). 3 This rather high minimum flow rate (and low accuracy ratio) is for a vertical mount.
Table 3.
Water consumption and leak estimated by the four meters installed at the studied house.
| Water meter | “MJ” | “SJ” | “US” | “MJ-T” |
|---|---|---|---|---|
| Consumption (L/d) 1 | 1,427 | 531 | 196 | 200 |
| Leak (L/d) 2 | 13 | 9 | 8 | 2 |
| (4 - 29) | (2 - 21) | (5 - 11) | (1 - 3) |
1 Average domestic consumption computed over ≈ 3 months (from 11/10/2025 to 07/02/2026); 2 Average and range (min./max.) computed over the periods of > 5 days, during which the house’s owner was away (4 periods for meter “MJ”, and 3 periods for meters “SJ”, “US” and “MJ-T”).
Disclaimer/Publisher’s Note: The statements, opinions and data contained in all publications are solely those of the individual author(s) and contributor(s) and not of MDPI and/or the editor(s). MDPI and/or the editor(s) disclaim responsibility for any injury to people or property resulting from any ideas, methods, instructions or products referred to in the content. |
© 2026 by the authors. Licensee MDPI, Basel, Switzerland. This article is an open access article distributed under the terms and conditions of the Creative Commons Attribution (CC BY) license (http://creativecommons.org/licenses/by/4.0/).
Copyright: This open access article is published under a Creative Commons CC BY 4.0 license, which permit the free download, distribution, and reuse, provided that the author and preprint are cited in any reuse.


