

Submitted:
10 February 2026
Posted:
12 February 2026
You are already at the latest version
Abstract
This study aims to bridge the gap between the high predictive accuracy of machine learning models and the transparency requirements of public policies for sustainable mobility by analyzing technological adoption within the national vehicle fleet of Ecuador. To this end, a methodological framework grounded in Design Science Research (DSR) and CRISP-DM was applied to a real administrative dataset of 482,754 vehicle registration records from the Ecuadorian Internal Revenue Service (SRI, 2025), comparing the performance and interpretability of two state-of-the-art gradient boosting algorithms, XGBoost and LightGBM, for multiclass classification of internal combustion engine (ICE), hybrid, and electric vehicles (EV) under severe class imbalance. The results demonstrate that both models achieve near-perfect predictive performance, with a consolidated Macro F1-score of 0.987, confirming their robustness and suitability for large-scale, policy-relevant administrative data even when electric vehicles represent only 1.3\% of the observed fleet. Beyond global performance metrics, the integration of explainable artificial intelligence through SHAP values reveals that fiscal appraisal value and engine capacity are the primary determinants of EV adoption, while territorial factors exhibit greater influence in the case of hybrid vehicles, highlighting qualitatively distinct adoption mechanisms across technologies. These findings show that advanced ``black-box'' models can be transformed into auditable and interpretable analytical tools capable of linking predictions to concrete economic, technical, and spatial variables relevant for decision-making. The study concludes that XAI-enabled gradient boosting provides a rigorous and transparent framework to support the design of targeted fiscal incentives, fleet electrification strategies, and evidence-based transport decarbonization policies in emerging economies, where data-driven governance is critical for accelerating the transition toward sustainable mobility.
Keywords:
1. Introduction
2. Background
2.1. Sustainable Mobility and Transport Decarbonization
2.2. Predictive Modeling and Gradient Boosting Algorithms
2.3. Explainable Artificial Intelligence (XAI) and Evidence-Based Policy

| Author | Main Algorithm | Study Objective | Identified Limitation |
|---|---|---|---|
| [36] | Descriptive models | Analyze structural barriers to sustainable mobility in urban environments | Lack of predictive modeling and large-scale analysis |
| [37] | XGBoost | Predict the adoption of vehicle technologies | Limited interpretability and weak linkage to public policy |
| [38] | LightGBM | Classification of vehicle fleets using tabular data | Absence of temporal validation and XAI-based analysis |
| [39] | Hybrid boosting | Fleet and emissions analysis | Limited applicability in emerging markets |
| [40] | XGBoost / LightGBM + SHAP | Identify explainable determinants of vehicle technology adoption at the national level | — |
3. Methodology
3.1. Relevance Phase and Literature Review Based on PRISMA
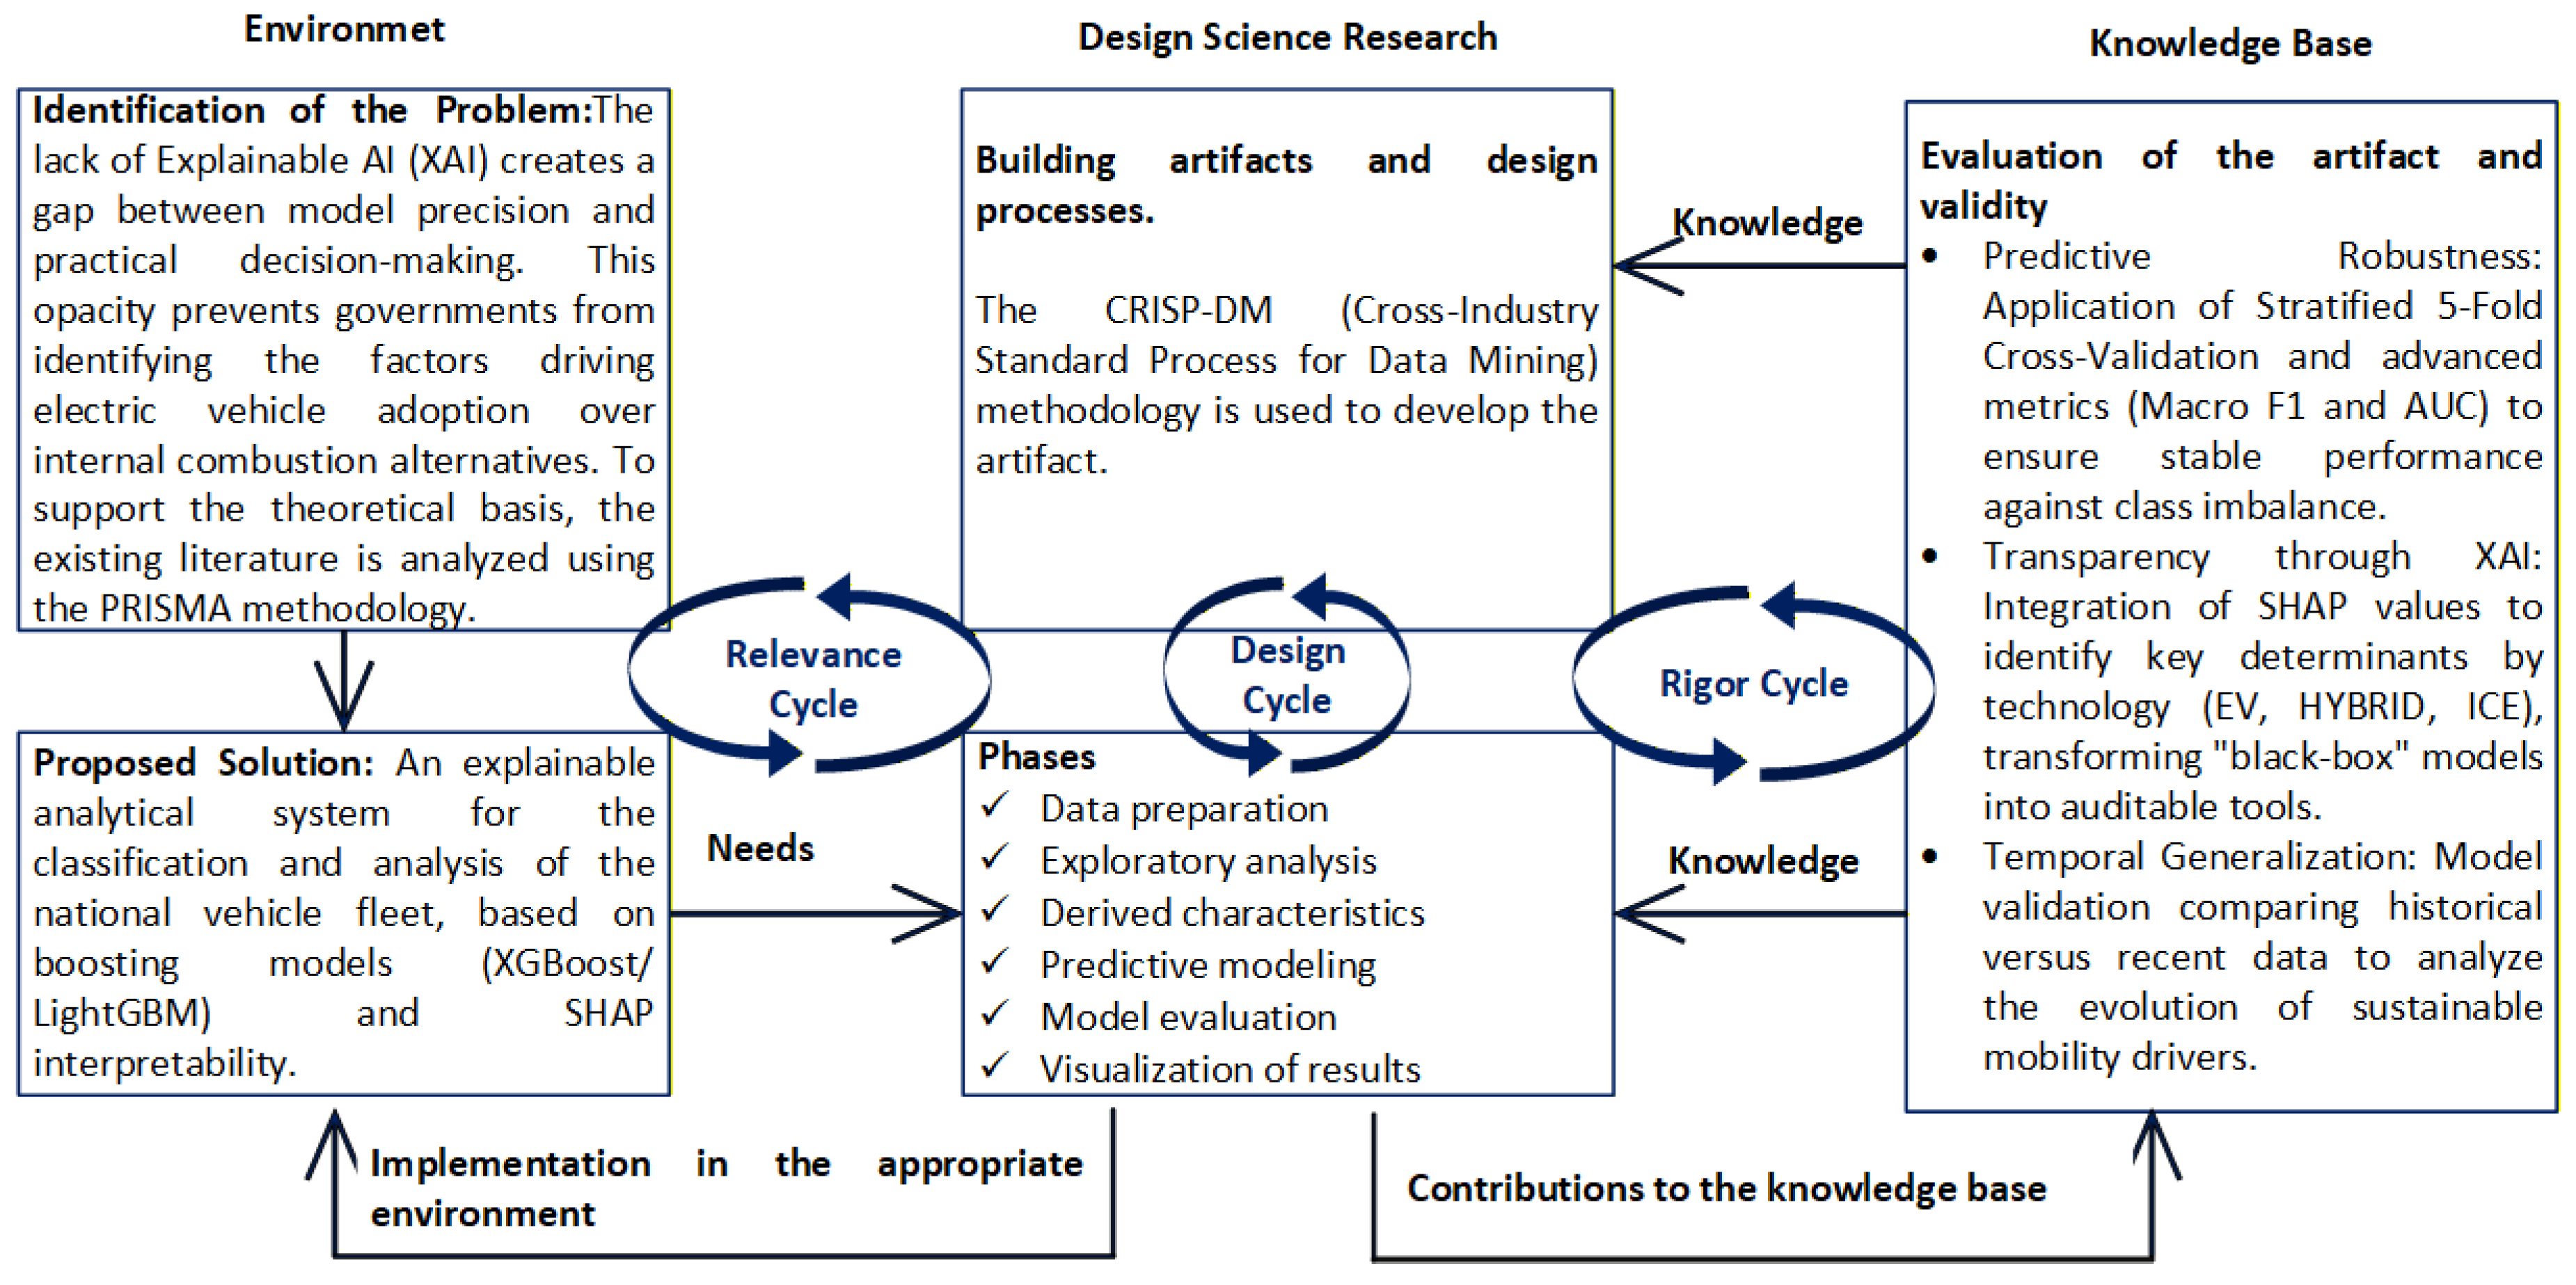
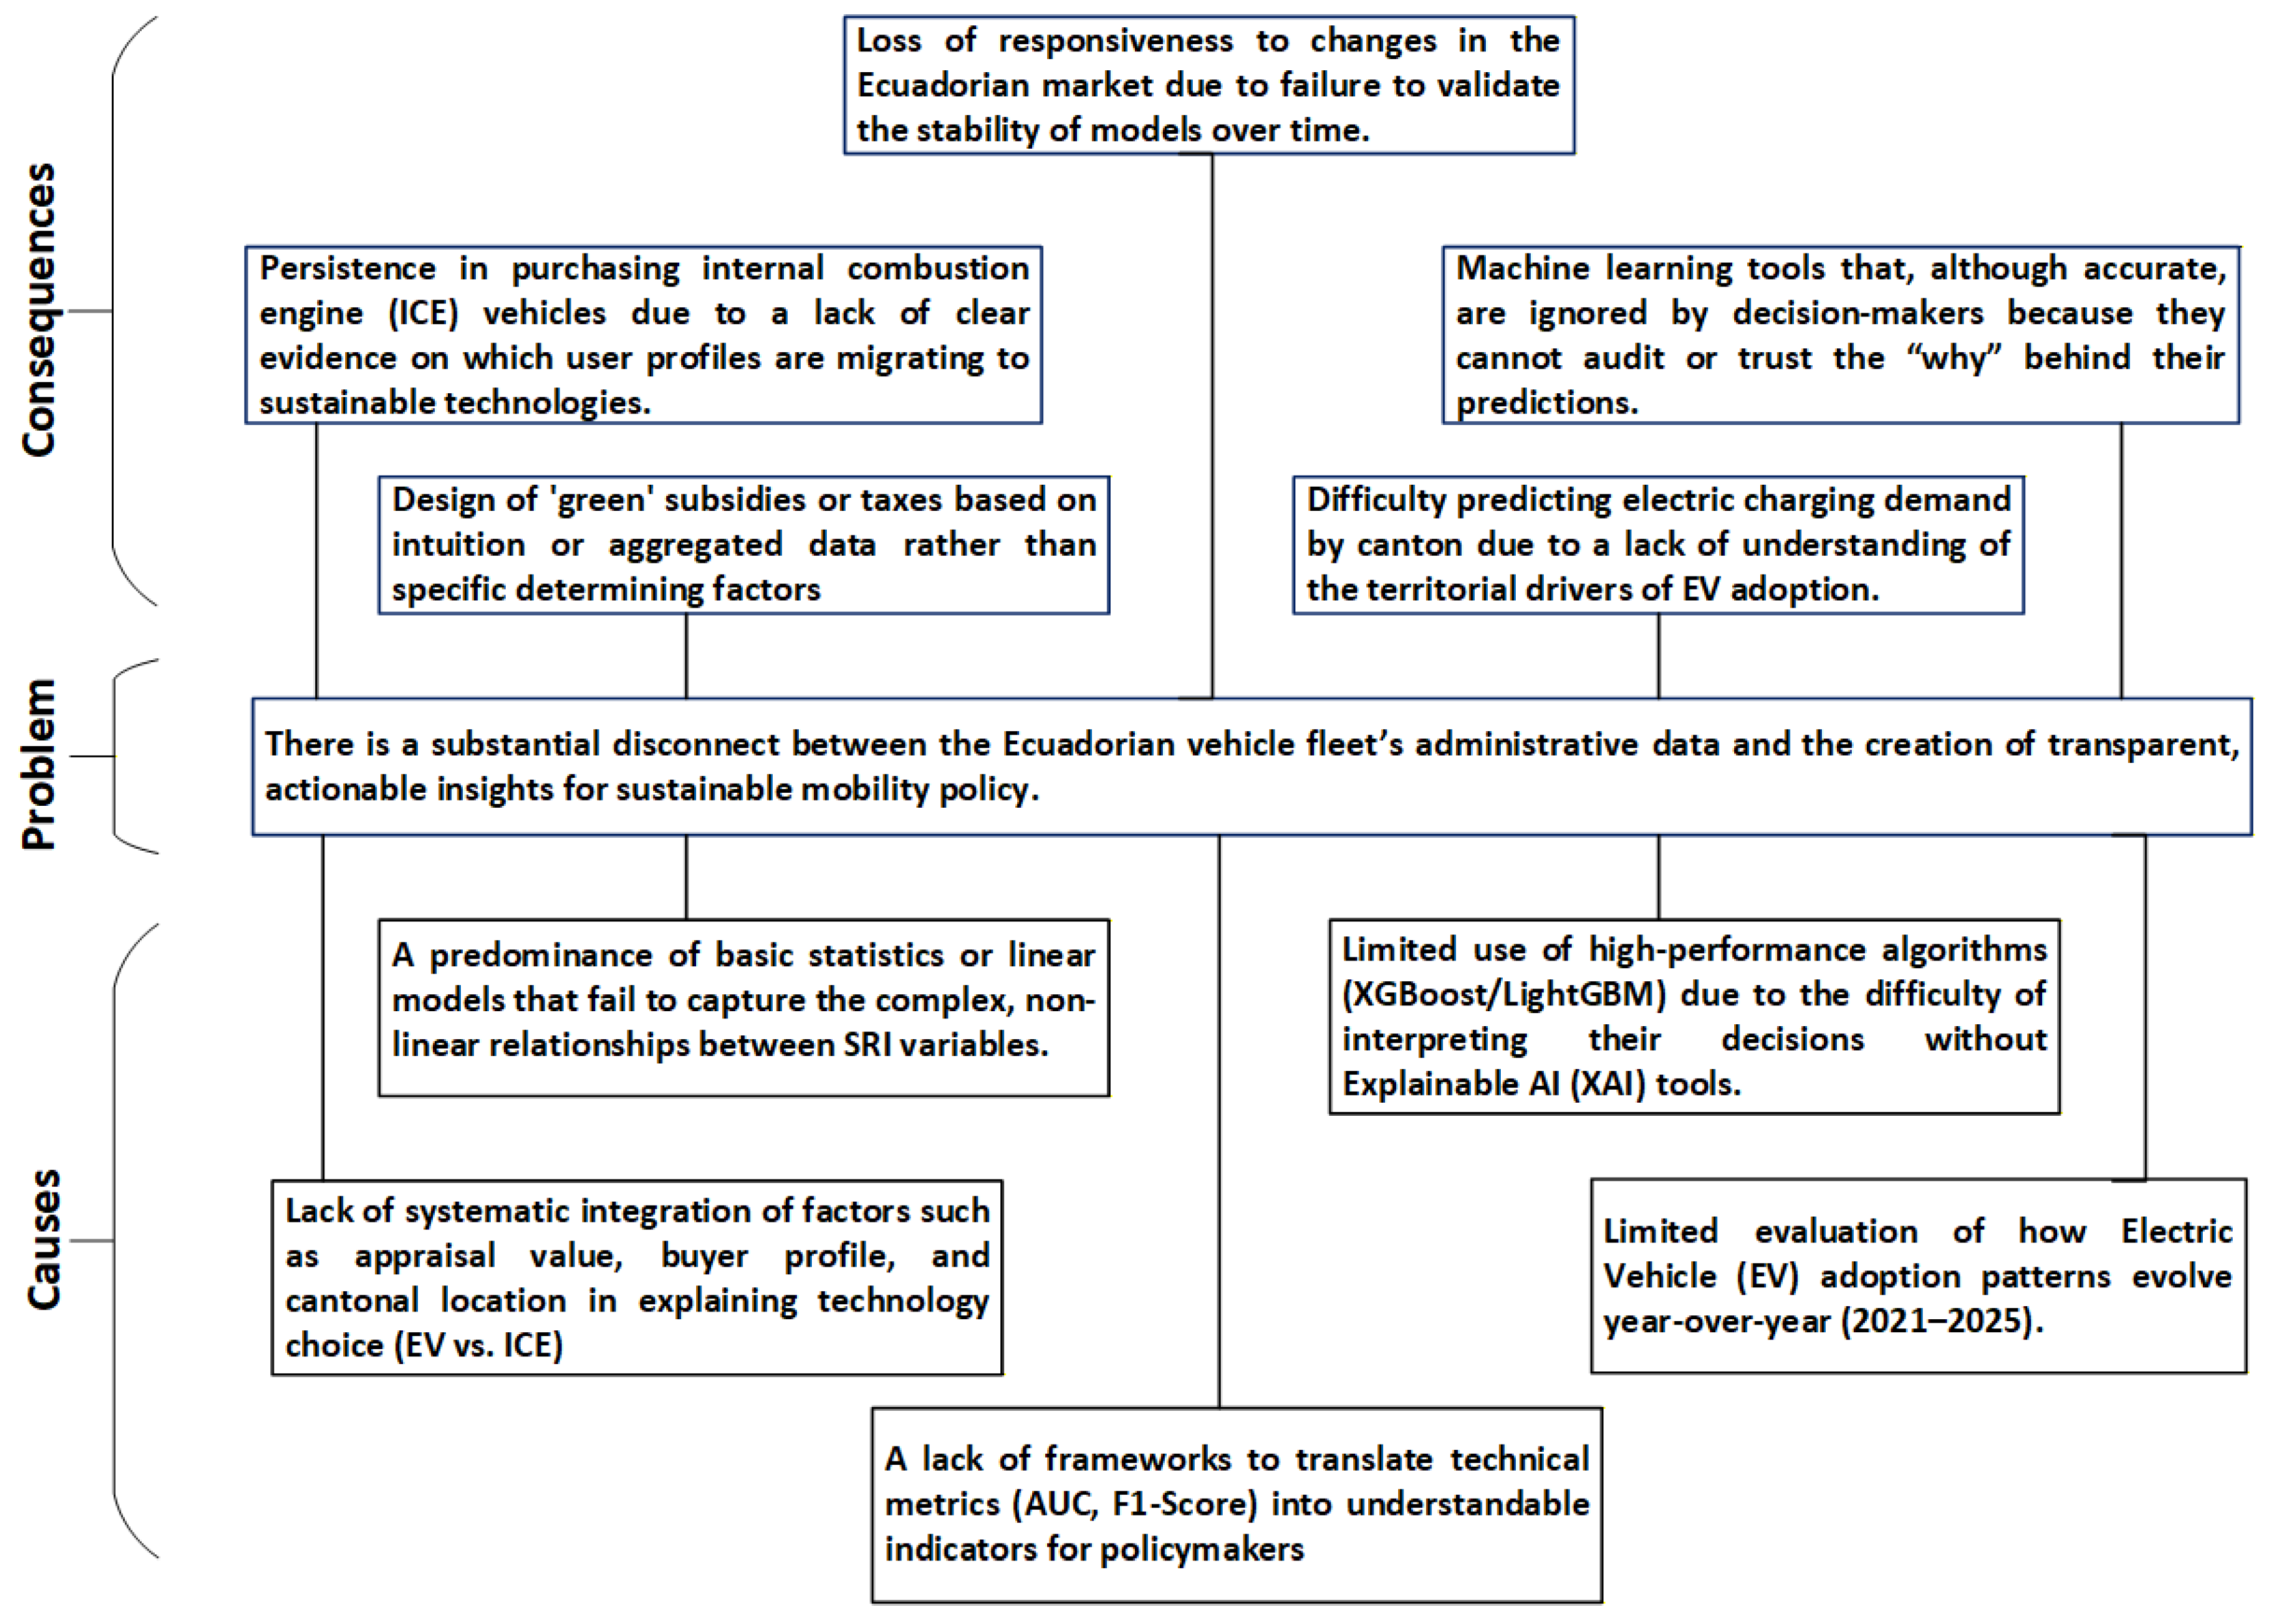
3.1.1. Problem Identification
3.1.2. Proposed Solution
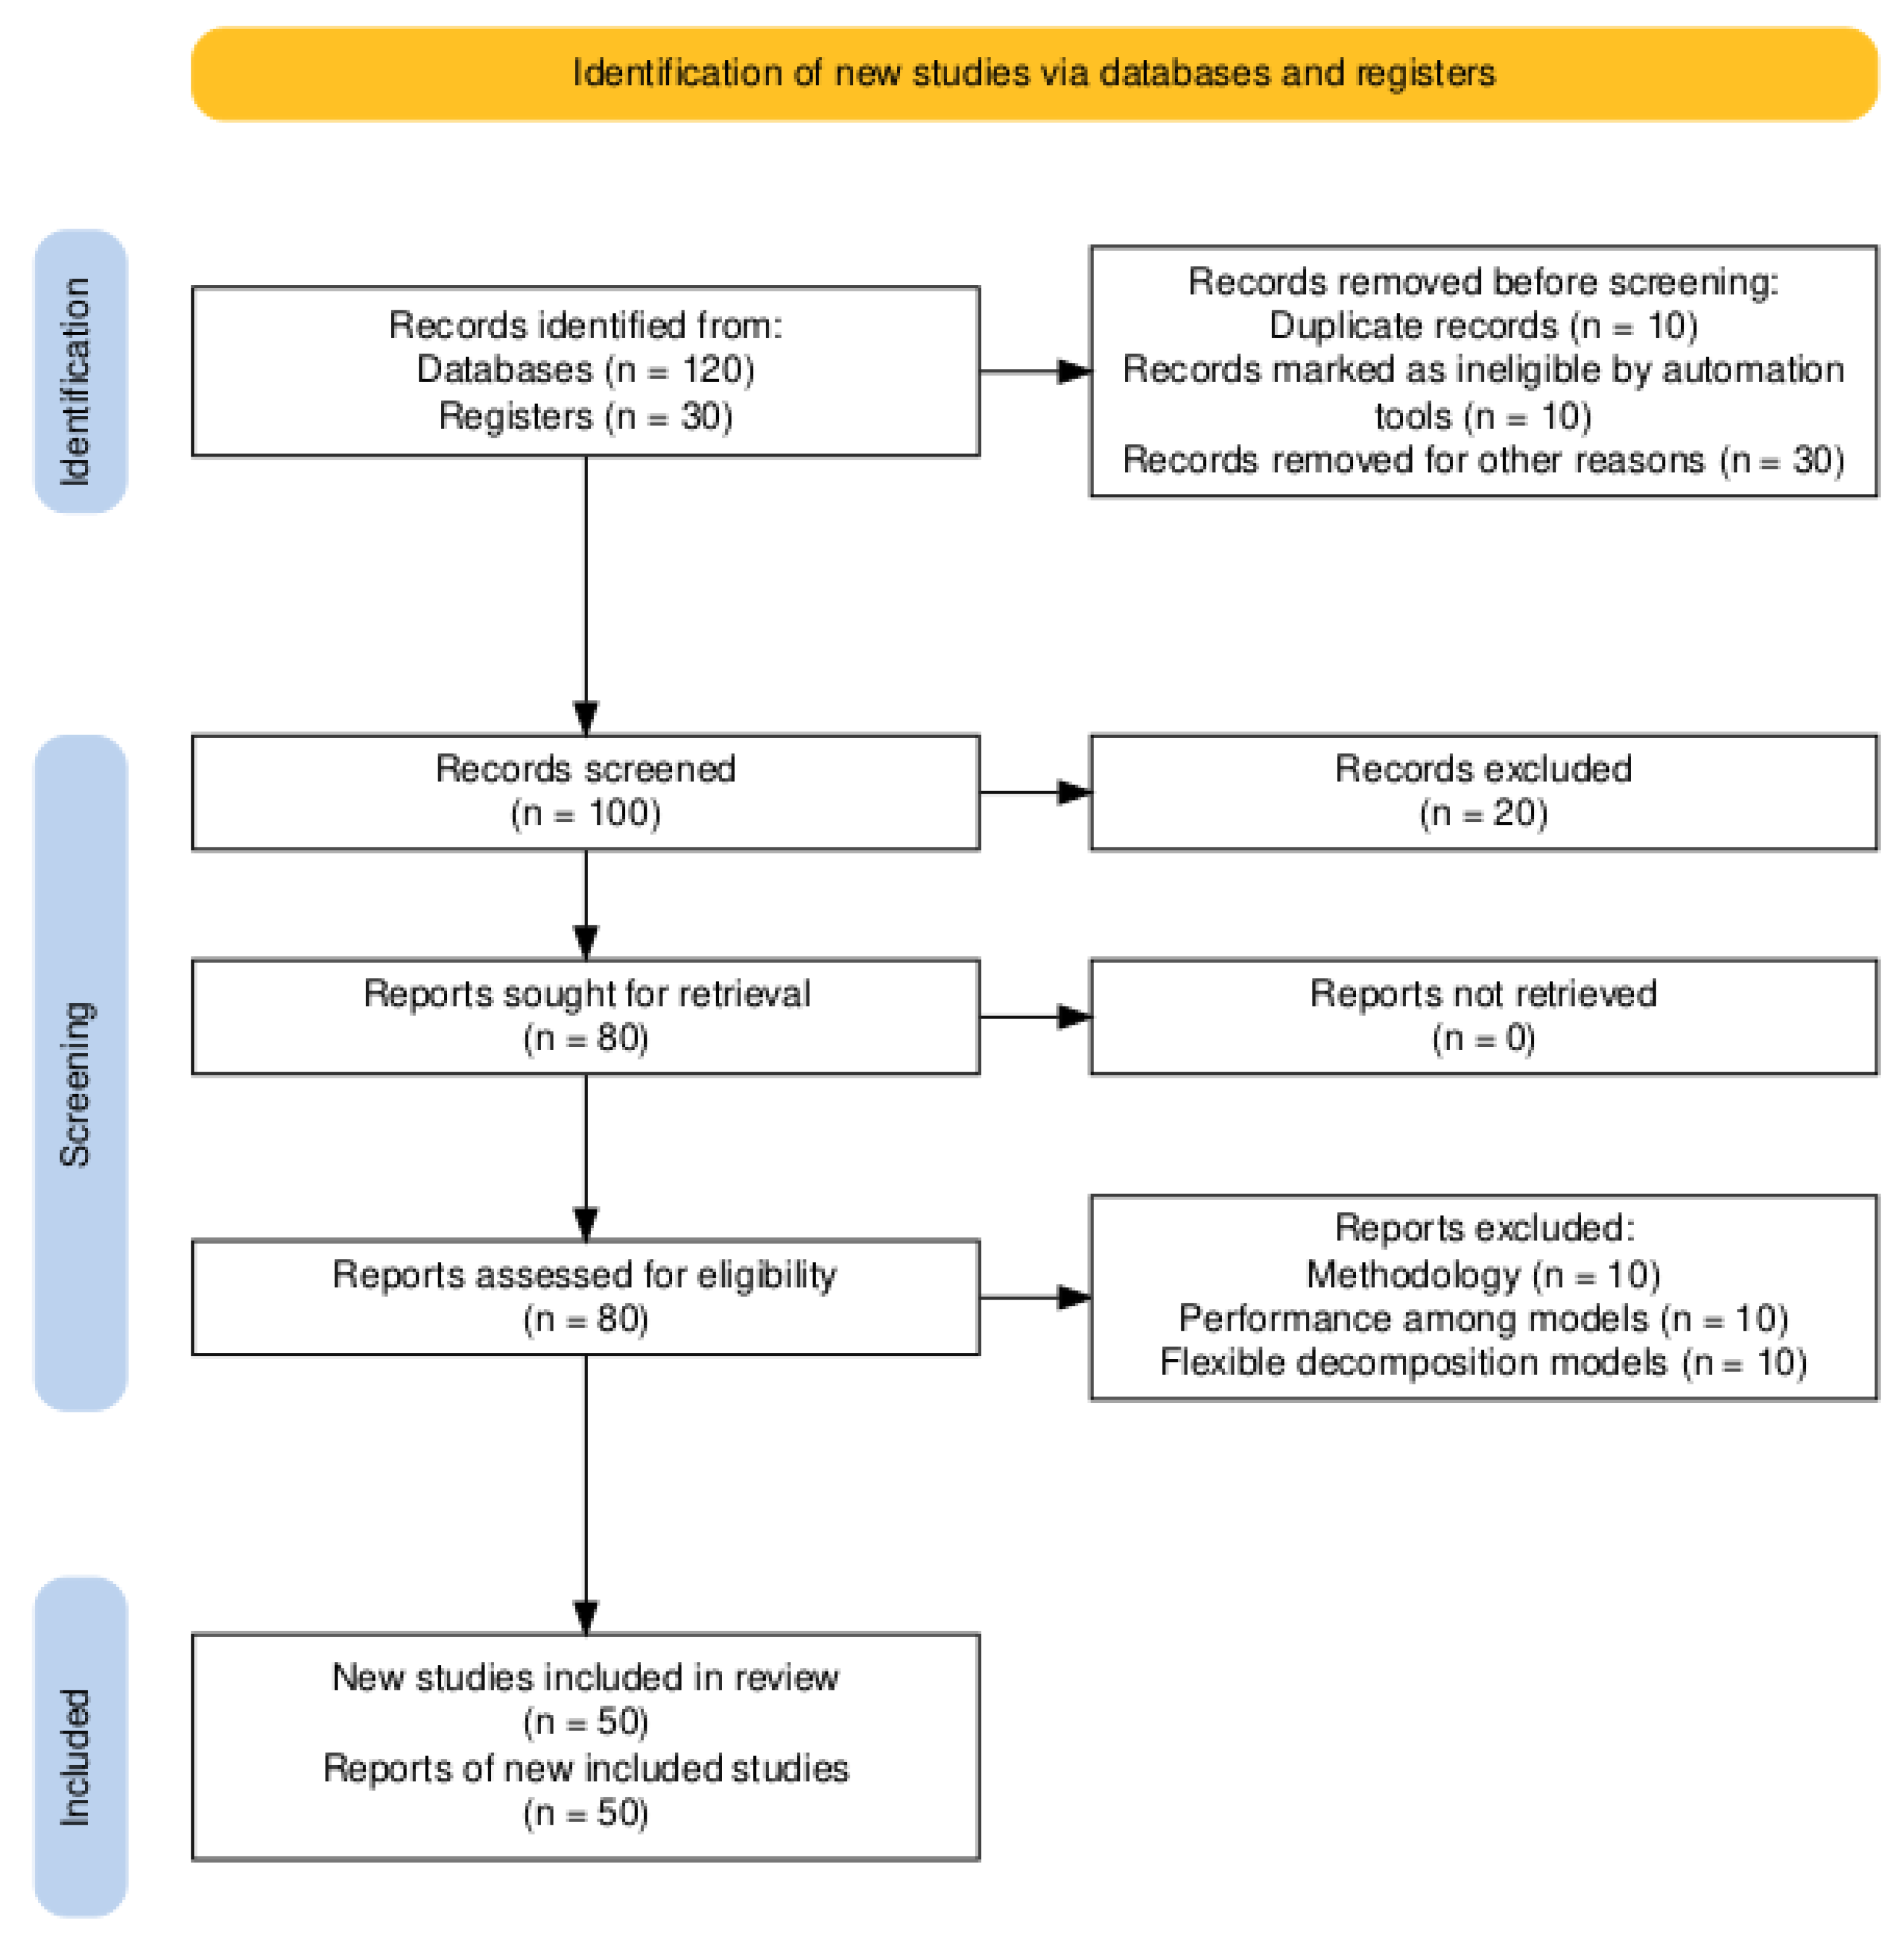
3.1.3. Systematic Literature Review (PRISMA)
- Identification: Searches were performed in Scopus, Web of Science, IEEE Xplore, and Google Scholar using combinations of the keywords XGBoost”, LightGBM”, vehicle fleet analysis”, electric vehicle adoption”, transportation machine learning”, explainable AI”, and “SHAP”.
- Screening: Duplicate records were removed, and titles and abstracts were screened to exclude studies not related to vehicle technology classification, mobility analytics, or explainable machine learning approaches.
- Eligibility: Full-text articles were assessed based on methodological rigor, the use of gradient boosting or tree-based models, the incorporation of explainability techniques, and empirical relevance to vehicle technology adoption, fleet composition, or transport policy analysis.
- Inclusion: Only studies presenting validated machine learning models or empirical evaluations of vehicle fleet dynamics, including comparisons between internal combustion, hybrid, and electric vehicles, were retained for qualitative synthesis.
3.2. Design Phase: Implementation Through CRISP-DM
3.2.1. Business Understanding
3.2.2. Data Understanding
- Economic: APPRAISAL (appraisal value),
- Technological: MODEL YEAR (model year), ENGINE SIZE (engine capacity), MAKE (brand),
- Institutional: TYPE OF TRANSACTION (transaction type), INDIVIDUAL–LEGAL ENTITY (individual/company),
- Territorial: CANTON (canton/region).
3.2.3. Data Preparation
3.2.4. Modeling
3.2.5. Evaluation
- Accuracy:
- Macro F1:
- AUC:
3.2.6. Deployment and Interpretation (XAI)
- Class-specific explanations (EV, HYBRID, ICE),
- Differential comparisons across vehicle technologies,
- Identification of policy-relevant variables.
3.3. Rigor Phase
- 1.
-
Predictive Robustness and Algorithmic Fairness. Evaluation goes beyond superficial metrics. A Stratified 5-Fold Cross-Validation is employed to ensure model generalization despite inherent class imbalance. Performance is assessed using the Macro F1 metric:This metric ensures a balanced measurement not biased by majority classes (ICE), validating the ability to accurately classify electric (EV) and hybrid (HYBRID) vehicles.
- 2.
-
Technological Differentiation and Semantic Coherence. To ensure the model captures distinct determinants for each technology, the Kullback-Leibler Divergence () is used between feature importance distributions:A significant value () corroborates that the factors driving EV adoption are qualitatively distinct from those of ICE vehicles.
- 3.
- Algorithmic Explainability and Transparency. The framework integrates SHAP (SHapley Additive exPlanations) based on the additivity axiom:where is the expected value and the contribution of feature j. This allows for a complete audit of model decisions against economic theory.
- 4.
- Temporal Stability and External Validity. Robustness is quantified using a Feature Importance Stability index by comparing historical vs. recent data:where . A stability index indicates transferable patterns.
- 5.
-
Relevance for Public Policy Design. The Mean Absolute Impact (MAI) of each feature is calculated as:A high MAI for appraisal or displacement in EVs provides quantitative evidence for the design of fiscal incentives or green taxes.
- 6.
- Scientific Reproducibility. Traceability is guaranteed through standardized code and deterministic randomness control (RANDOM_STATE = 42), ensuring that the analytical pipeline is fully replicable.
4. Results
4.1. Dataset and Class Structure (Ground Truth)
4.2. Predictive Performance: Consolidated LightGBM Results
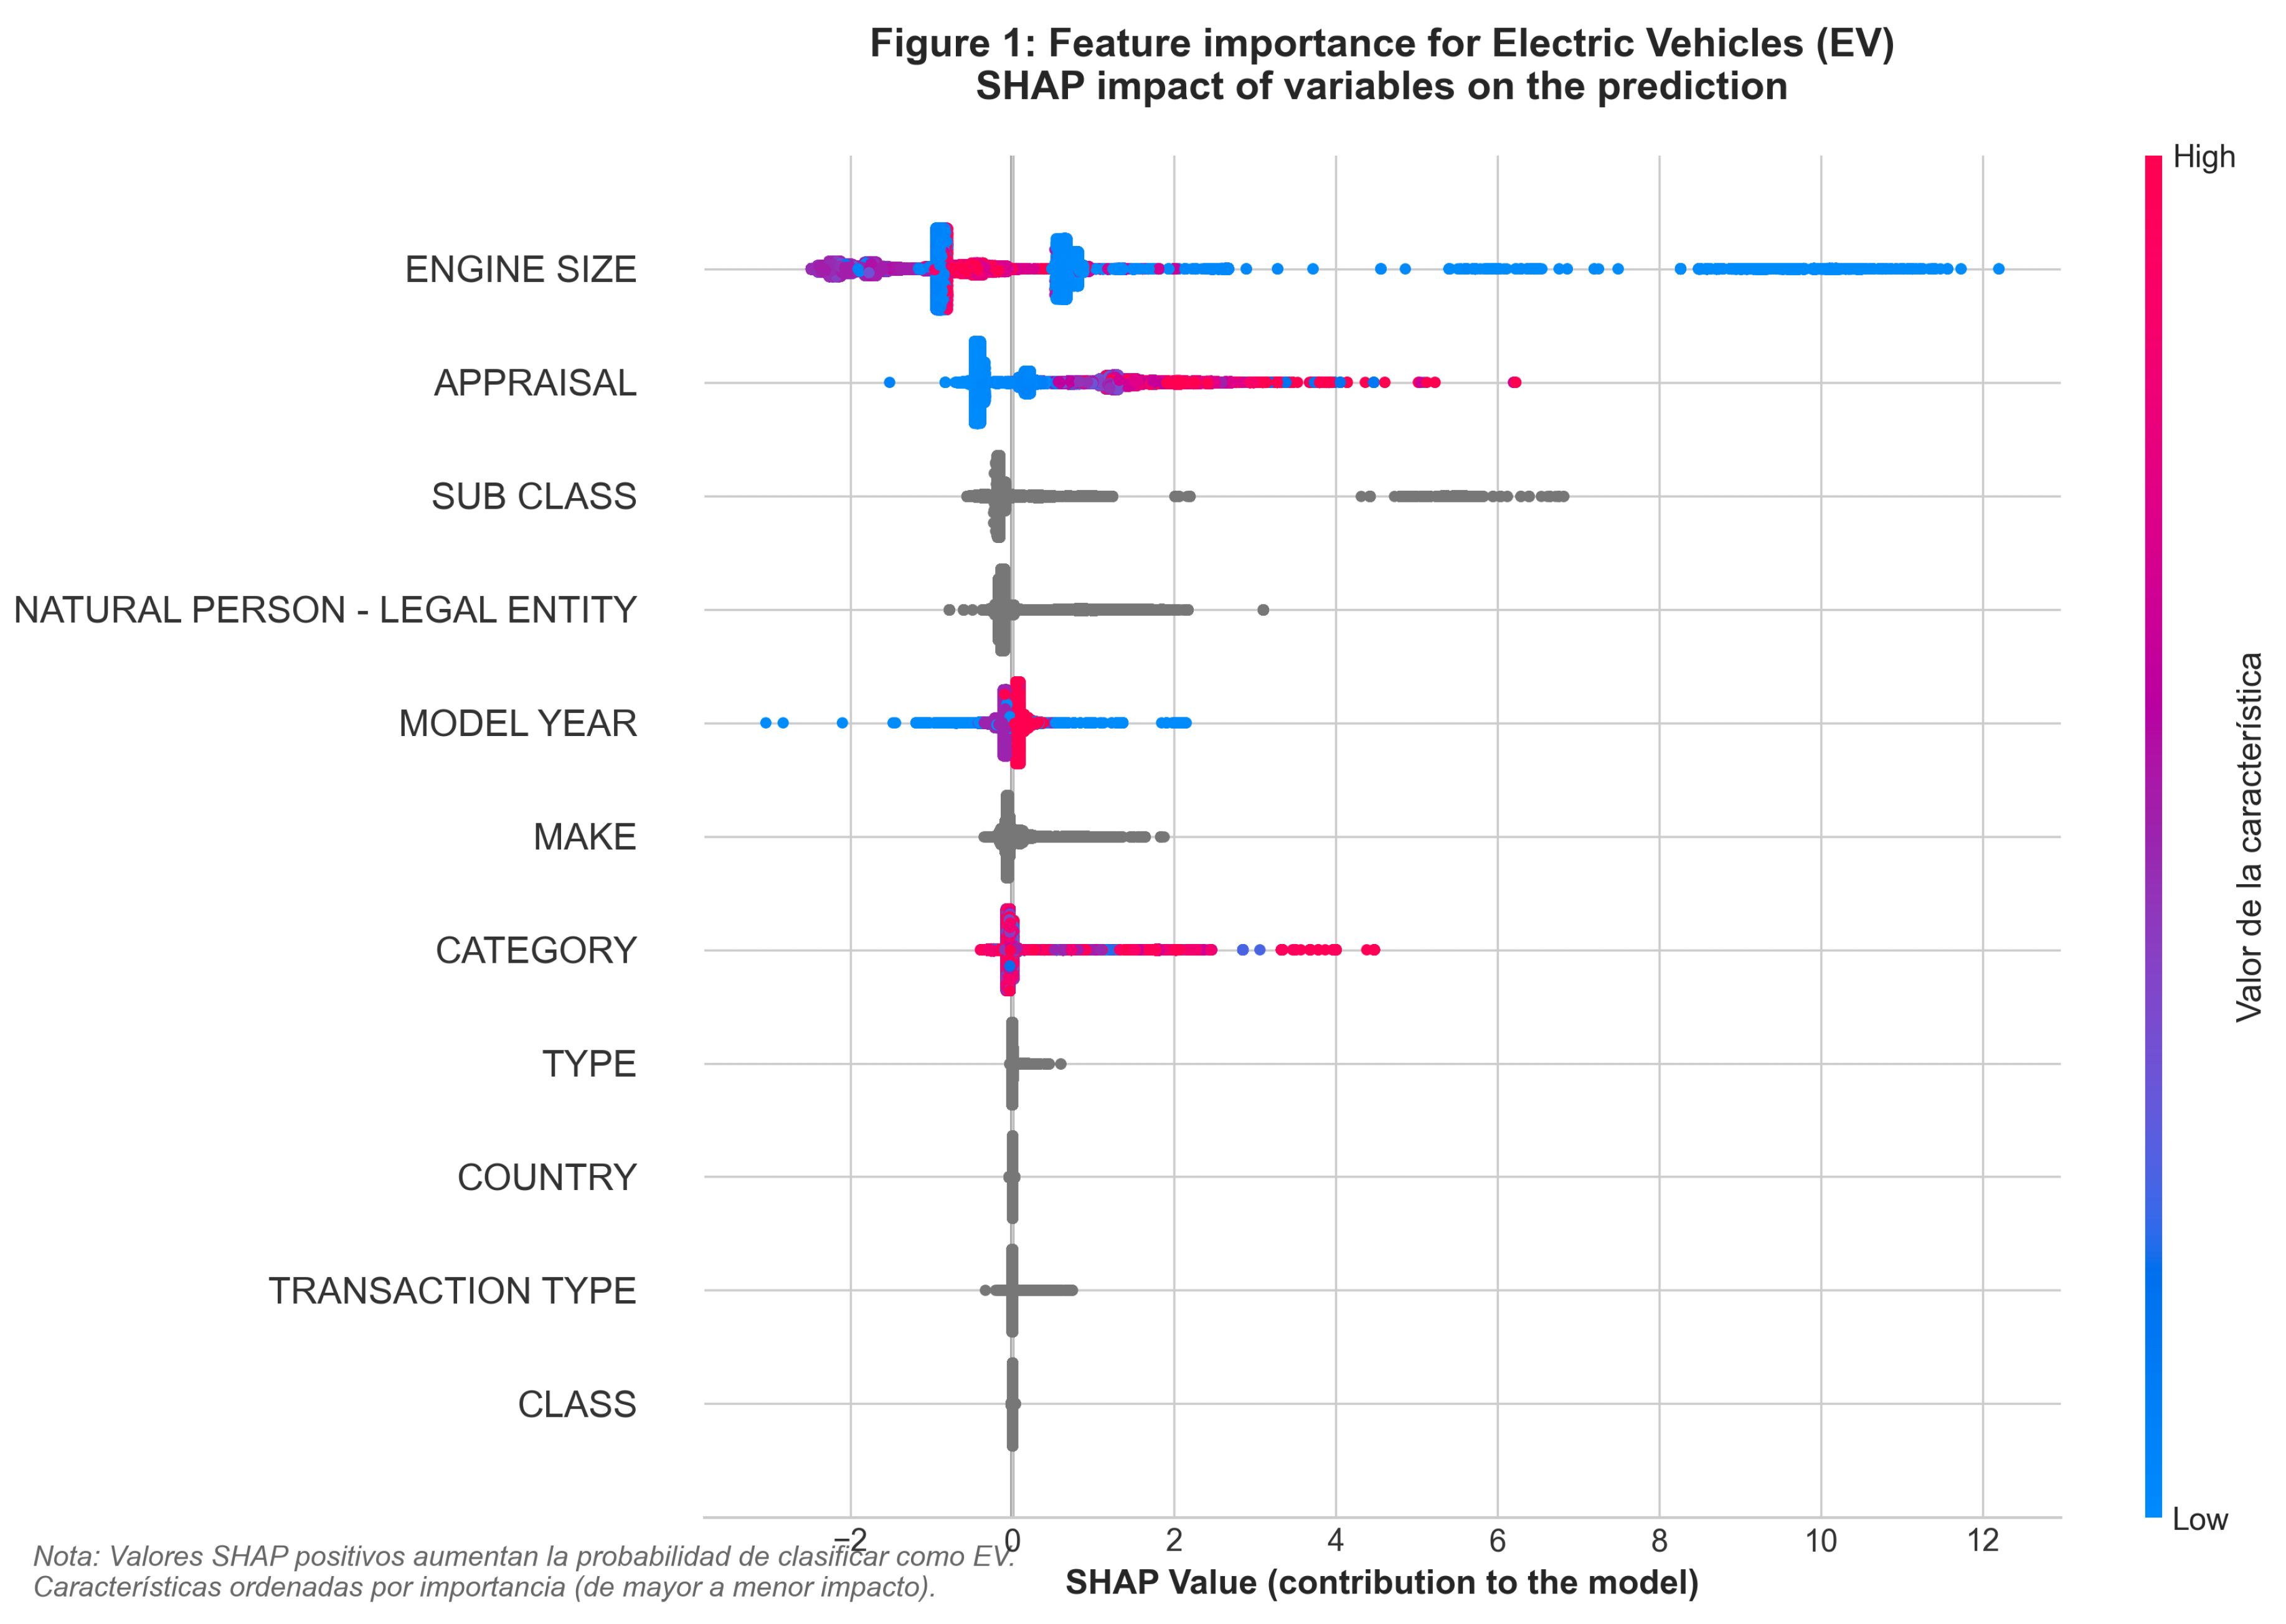
4.3. SHAP Explainability: Unified Cross-Class Comparison
4.4. Directional SHAP Effects (Policy-Relevant)
4.5. Unified Public Policy Implications
4.6. Temporal Validation: Reconciled Interpretation
5. Discussion
6. Conclusions
Author Contributions
Funding
Data Availability Statement
Acknowledgments
Conflicts of Interest
References
- Pojani, D.; Stead, D. Sustainable Urban Transport in the Developing World: Beyond Megacities. Sustainability 2015, 7, 7784–7805. [Google Scholar] [CrossRef]
- Gu, W.; Zhang, Z.; Liu, O. Social Factors Influencing Healthcare Expenditures: A Machine Learning Perspective on Australia’s Fiscal Challenges. Smart Cities 2025, 8, 97. [Google Scholar] [CrossRef]
- Mahto, M.K. Explainable artificial intelligence: Fundamentals, Approaches, Challenges, XAI Evaluation, and Validation. Explainable Artificial Intelligence for Autonomous Vehicles: Concepts, Challenges, and Applications 2024, 25–49. [Google Scholar] [CrossRef]
- Madanchian, M.; Taherdoost, H. A Narrative Review and Gap Analysis of Blockchain for Transparency, Traceability, and Trust in Data-Driven Supply Chains. Applied Sciences 2025, 15, 9571. [Google Scholar] [CrossRef]
- Rajasekaran, V.A.; Gopu, M.; Brahmam, M.G.; Grover, V. ML Techniques for Business Intelligence and Decision-Making. Artificial Intelligence, Machine Learning and IoT for Smart Business Management 2025, 34–64. [Google Scholar] [CrossRef]
- Sultana, R. ARTIFICIAL INTELLIGENCE IN DATA VISUALIZATION: REVIEWING DASHBOARD DESIGN AND INTERACTIVE ANALYTICS FOR ENTERPRISE DECISION-MAKING. International Journal of Business and Economics Insights 2025, 5, 01–29. [Google Scholar] [CrossRef]
- Guo, X.; Kou, R.; He, X. Towards Carbon Neutrality: Machine Learning Analysis of Vehicle Emissions in Canada. Sustainability 2024, 16, 10526. [Google Scholar] [CrossRef]
- Handayani, M.P.; Kim, H.; Lee, S.; Lee, J. Navigating Energy Efficiency: A Multifaceted Interpretability of Fuel Oil Consumption Prediction in Cargo Container Vessel Considering the Operational and Environmental Factors. Journal of Marine Science and Engineering 2023, 11, 2165. [Google Scholar] [CrossRef]
- Li, Y.; Badulescu, A.; Badulescu, D. Modeling and Analyzing Critical Policies for Improving Energy Efficiency in Manufacturing Sector: An Interpretive Structural Modeling (ISM) Approach. Energies 2025, 18, 893. [Google Scholar] [CrossRef]
- Niazi, A.M.K.; Danielis, R.; Scorrano, M.; Masutti, M. Cross-Country Assessment of Total Cost of Ownership for Light Commercial Vehicles: Insights from Italy and Pakistan. Future Transportation 2025, 5, 126. [Google Scholar] [CrossRef]
- Mehrabi, M.; Polya, D.A.; Han, Y. Machine Learning Models of the Geospatial Distribution of Groundwater Quality: A Systematic Review. Water (Switzerland) 2025, 17, 2861. [Google Scholar] [CrossRef]
- Wen, Y.; Guo, R.; Duan, Z.; Tong, Y.; Tang, X.; Pan, T.; Fu, C. Machine learning model optimization with optuna for accurate prediction of strength and crack behavior in prestressed concrete beams. Scientific Reports 2026. [Google Scholar] [CrossRef] [PubMed]
- Öğütlü, A.S. National-Scale Electricity Consumption Forecasting in Turkey Using Ensemble Machine Learning Models: An Interpretability-Centered Approach. Sustainability 2025, 17, 9829. [Google Scholar] [CrossRef]
- Blanco, J.P.; Windisch, E.; Perkins, S.; Ito, A.; Leape, J. Decarbonising Transport in Latin American Cities: A Review of Policies and Key Challenges. In Decarbonising Transport in Latin American Cities: A Review of Policies and Key Challenges; 2022. [Google Scholar] [CrossRef]
- Uol, R.Z. The Future of Transportation: Sustainable Mobility Solutions. Journal of Social Signs Review 2023, 01, 1. [Google Scholar]
- Timilsina, R.R.; Zhang, J.; Rahut, D.B.; Patradool, K.; Sonobe, T. Global drive toward net-zero emissions and sustainability via electric vehicles: an integrative critical review. Energy, Ecology and Environment 2025, 10, 125–144. [Google Scholar] [CrossRef]
- Jing, Q.L.; Liu, H.Z.; Yu, W.Q.; He, X. The Impact of Public Transportation on Carbon Emissions—From the Perspective of Energy Consumption. Sustainability 2022, 14, 6248. [Google Scholar] [CrossRef]
- Briand, Y.; Pye, S.; D’Agosto, M.d.A.; Goes, G.V.; Neves Schmitz-Gonçalves, D.; Garg, A.; Gupta, D.; Vishwanathan, S.S.; Siagian, U.W.; Ahjum, F.; et al. Passenger transport decarbonization in emerging economies: policy lessons from modelling long-term deep decarbonization pathways. Climate Policy 2023. [Google Scholar] [CrossRef]
- Adamashvili, N.; Thrassou, A. Towards Sustainable Decarbonization: Addressing Challenges in Electric Vehicle Adoption and Infrastructure Development. Energies 2024, 17, 5443. [Google Scholar] [CrossRef]
- Pillai, A. A Cross-Country Analysis of the Determinants of International Competitiveness in the Global Electric Vehicles Market. 2024. [Google Scholar]
- Abouelela, M.; Lyu, C.; Antoniou, C. Exploring the Potentials of Open - Source Big Data and Machine Learning in Shared Mobility Fleet Utilization Prediction. Data Science for Transportation 2023, 5, 1–26. [Google Scholar] [CrossRef]
- Raparthi, M.; Dhabliya, D.; Kumari, T.; Upadhyaya, R.; Sharma, A. Implementation and Performance Comparison of Gradient Boosting Algorithms for Tabular Data Classification; 2024; pp. 461–479. [Google Scholar] [CrossRef]
- Sibindi, R.; Mwangi, R.W.; Waititu, A.G. A boosting ensemble learning based hybrid light gradient boosting machine and extreme gradient boosting model for predicting house prices. Engineering Reports 2023, 5, e12599. [Google Scholar] [CrossRef]
- Neves, J.C.G.D.; Carvalho, V.O.D. The Use of Data Mining in Public Budgeting: A Systematic Literature Mapping. IEEE Access 2025, 13, 14891–14907. [Google Scholar] [CrossRef]
- Liu, R.; Li, H.; Yoon, K.; Vasarhelyi, M.A. Using Machine Learning Algorithms to Improve Fiscal Distress Prediction Models: The Case of U.S. Local Governments. Journal of Information Systems 2025, 39, 131–155. [Google Scholar] [CrossRef]
- Bolikulov, F.; Nasimov, R.; Rashidov, A.; Akhmedov, F.; Cho, Y.I. Effective Methods of Categorical Data Encoding for Artificial Intelligence Algorithms. Mathematics 2024, 12, 2553. [Google Scholar] [CrossRef]
- Murdoch, Z.; MacCarthaigh, M.; Geys, B. It’s about time! Temporal dynamics and longitudinal research designs in public administration. Public Administration Review 2023, 83, 1727–1736. [Google Scholar] [CrossRef]
- Hocherman, T.; Trop, T.; Ghermandi, A. Time lags in environmental governance: A critical review. Ambio 2025, 2042–2059. [Google Scholar] [CrossRef]
- Zentner, A. From Opacity to Transparency: Advancing Explainable AI Through Black-Box, White-Box, and Glass-Box Models. SSRN 2025. [Google Scholar] [CrossRef]
- Buthelezi, S.; Hungwe, T.; Seeletse, S.; Mbirimi-Hungwe, V. Legislative and Regulatory Frameworks: Regulatory Issue of Black Box Algorithms in Motor Insurance Pricing. SSRN 2025. [Google Scholar] [CrossRef]
- Makumbura, R.K.; Mampitiya, L.; Rathnayake, N.; Meddage, D.P.; Henna, S.; Dang, T.L.; Hoshino, Y.; Rathnayake, U. Advancing water quality assessment and prediction using machine learning models, coupled with explainable artificial intelligence (XAI) techniques like shapley additive explanations (SHAP) for interpreting the black-box nature. Results in Engineering 2024, 23, 102831. [Google Scholar] [CrossRef]
- Salih, A.M.; Raisi-Estabragh, Z.; Galazzo, I.B.; Radeva, P.; Petersen, S.E.; Lekadir, K.; Menegaz, G. A Perspective on Explainable Artificial Intelligence Methods: SHAP and LIME. Advanced Intelligent Systems 2025, 7, 2400304. [Google Scholar] [CrossRef]
- Dey, M.T. Explainable Artificial Intelligence (XAI): Integration, Policy Frameworks, and Applications in Critical Domains and Renewable Energy. igi-global 1, 333–362. [CrossRef]
- Baset, A.; Jradi, M. Data-Driven Decision Support for Smart and Efficient Building Energy Retrofits: A Review. Applied System Innovation 2025, 8, 5. [Google Scholar] [CrossRef]
- de Gaspi, R.H. Developmental channels: (Incomplete) development strategies in democratic Latin America. Regulation and Governance 2024, 18, 1210–1231. [Google Scholar] [CrossRef]
- Ullah, I.; Zheng, J.; Ullah, S.; Bhattarai, K.; Almujibah, H.; Alawad, H. Unraveling the Complex Barriers to and Policies for Shared Autonomous Vehicles: A Strategic Analysis for Sustainable Urban Mobility. Systems 2024, 12, 558. [Google Scholar] [CrossRef]
- Bas, J.; Zou, Z.; Cirillo, C. An interpretable machine learning approach to understanding the impacts of attitudinal and ridesourcing factors on electric vehicle adoption. Transportation Letters 2023, 15, 30–41. [Google Scholar] [CrossRef]
- Nwakanma, C.I.; Ahakonye, L.A.C.; Njoku, J.N.; Odirichukwu, J.C.; Okolie, S.A.; Uzondu, C.; Ndubuisi Nweke, C.C.; Kim, D.S. Explainable Artificial Intelligence (XAI) for Intrusion Detection and Mitigation in Intelligent Connected Vehicles: A Review. Applied Sciences 2023, 13, 1252. [Google Scholar] [CrossRef]
- Yang, H.; He, X.; Shamsuddoha, M.; Nasir, T. The Road Ahead for Hybrid or Electric Vehicles in Developing Countries: Market Growth, Infrastructure, and Policy Needs. World Electric Vehicle Journal 2025, 16(Page 180 2025, 16), 180. [Google Scholar] [CrossRef]
- Wang, K.; De Vos, J.; Smart, M.; Wang, S. Explaining Youth Driver Licensing Determinants Using XGBoost and SHAP. Transport Policy 2025, 168, 87–100. [Google Scholar] [CrossRef]
- Ahmed, U.; Jiangbin, Z.; Almogren, A.; Sadiq, M.; Rehman, A.U.; Sadiq, M.T.; Choi, J. Hybrid bagging and boosting with SHAP based feature selection for enhanced predictive modeling in intrusion detection systems. Scientific Reports 2024, 14, 30532. [Google Scholar] [CrossRef]
- Haque, M.E.; Zabin, M.; Uddin, J. EnsembleXAI-Motor: A Lightweight Framework for Fault Classification in Electric Vehicle Drive Motors Using Feature Selection, Ensemble Learning, and Explainable AI. Machines 2025, 13, 314. [Google Scholar] [CrossRef]
- Thi, T.; Thuy, T. Key Adoption Drivers for Electric Vehicles in Vietnam. 2024. [Google Scholar]
- Nsan, N.; Obi, C.; Etuk, E. Bridging Policy, Infrastructure, and Innovation: A Causal and Predictive Analysis of Electric Vehicle Integration Across Africa, China, and the EU. Sustainability 2025, 17, 5449. [Google Scholar] [CrossRef]
- Ullah, I.; Liu, K.; Yamamoto, T.; Al Mamlook, R.E.; Jamal, A. A comparative performance of machine learning algorithm to predict electric vehicles energy consumption: A path towards sustainability. Energy and Environment 2022, 33, 1583–1612. [Google Scholar] [CrossRef]
- Samerei, S.A.; Aghabayk, K.; Montella, A. Analyzing Pile-Up Crash Severity: Insights from Real-Time Traffic and Environmental Factors Using Ensemble Machine Learning and Shapley Additive Explanations Method. Safety 2024, 10, 22. [Google Scholar] [CrossRef]
- Ertelt, S.M.; Kask, J.; Breslin, D. From Carbon Lock-In to Climate Neutrality?Exploring the Coevolution between Path Creation and Path Destabilization in the Net-Zero Transition of the EU Heavy-Duty Vehicle Sector. SSRN Electronic Journal 2024. [Google Scholar] [CrossRef]
- Harun, I.; Yigitcanlar, T. Urban Land Use and Value in the Digital Economy: A Scoping Review of Disrupted Activities, Behaviours, and Mobility. Land 2025, 14, 1647. [Google Scholar] [CrossRef]
- Penmetsa, P.; Dhondia, S.; Adanu, E.K.; Harper, C.; Nambisan, S.; Jones, S. Incentives to Encourage the Adoption of Connected and Automated Vehicles: Lessons Learned from Hybrid-Electric Vehicle Incentive Programs. Future Transportation 2023, 3, 986–995. [Google Scholar] [CrossRef]
- Marcos, A.; Hartmann, P.; Barrutia, J.M.; Apaolaza, V. Carbon Taxes Beyond Emissions’ Reduction: Co-benefits and Behavioural Failures in Emerging Markets. Approaches to Global Sustainability, Markets, and Governance 2022, Part F174, 243–262. [Google Scholar] [CrossRef]
- Kekelekis, A.; Musa, R.M.; Nikolaidis, P.T.; Clemente, F.M.; Kellis, E. Hamstring Strain Injury Risk in Soccer: An Exploratory, Hypothesis-Generating Prediction Model. Muscles 2025, 4, 50. [Google Scholar] [CrossRef]
- Eugenia Rivas, M.; Calatayud, A.; Hansz, M.; Pablo Brichetti, J.; Sánchez Jesús Manuel Rodríguez, S.; León-Gómez, C.; Navas, C.; Pereyra, A.; Alem, M.; Eugenia Rivas, M.; et al. Funding and Financing of Public Transport in Latin America and the Caribbean. Idb 2025. [Google Scholar]
- Mondal, S.; Das, S.; Vrana, V.G. Exploring the Role of Artificial Intelligence in Achieving a Net Zero Carbon Economy in Emerging Economies: A Combination of PLS-SEM and fsQCA Approaches to Digital Inclusion and Climate Resilience. Sustainability 2024, 16, 10299. [Google Scholar] [CrossRef]
- Mili, K.; Aldossari, S.A. Smartphone based usage based insurance implementation feasibility in Saudi Arabia insurance market: A mixed methods assessment of technological readiness and stakeholder perceptions. Computers in Human Behavior Reports 2026, 21, 100928. [Google Scholar] [CrossRef]
- Khamis, A. Smart Mobility Education and Capacity Building for Sustainable Development: A Review and Case Study. Sustainability 2025, 17, 7999. [Google Scholar] [CrossRef]
- Oluwaseun, A.; Senior, J.; Examiner, B. Machine Learning for Systemic Risk Prediction in FinTech Lending: A Cross-Country Analysis Using Public Data. International Journal of Research in Social Science and Humanities (IJRSS) ISSN:2582-6220 7, 110–136. [CrossRef]
| Technology | Observations | Share (%) |
|---|---|---|
| ICE | 449,937 | 93.2 |
| HYBRID | 26,372 | 5.5 |
| EV | 6,445 | 1.3 |
| Total | 482,754 | 100.0 |
| Metric | Run A | Run B | Consolidated |
|---|---|---|---|
| Accuracy | 0.9951 | 0.9971 | |
| Macro F1 | 0.9838 | 0.9901 | |
| Weighted F1 | 0.9952 | 0.9972 | |
| Log-loss | 0.0214 | 0.0093 | |
| AUC (OvR) | 0.9995 | 0.9999 |
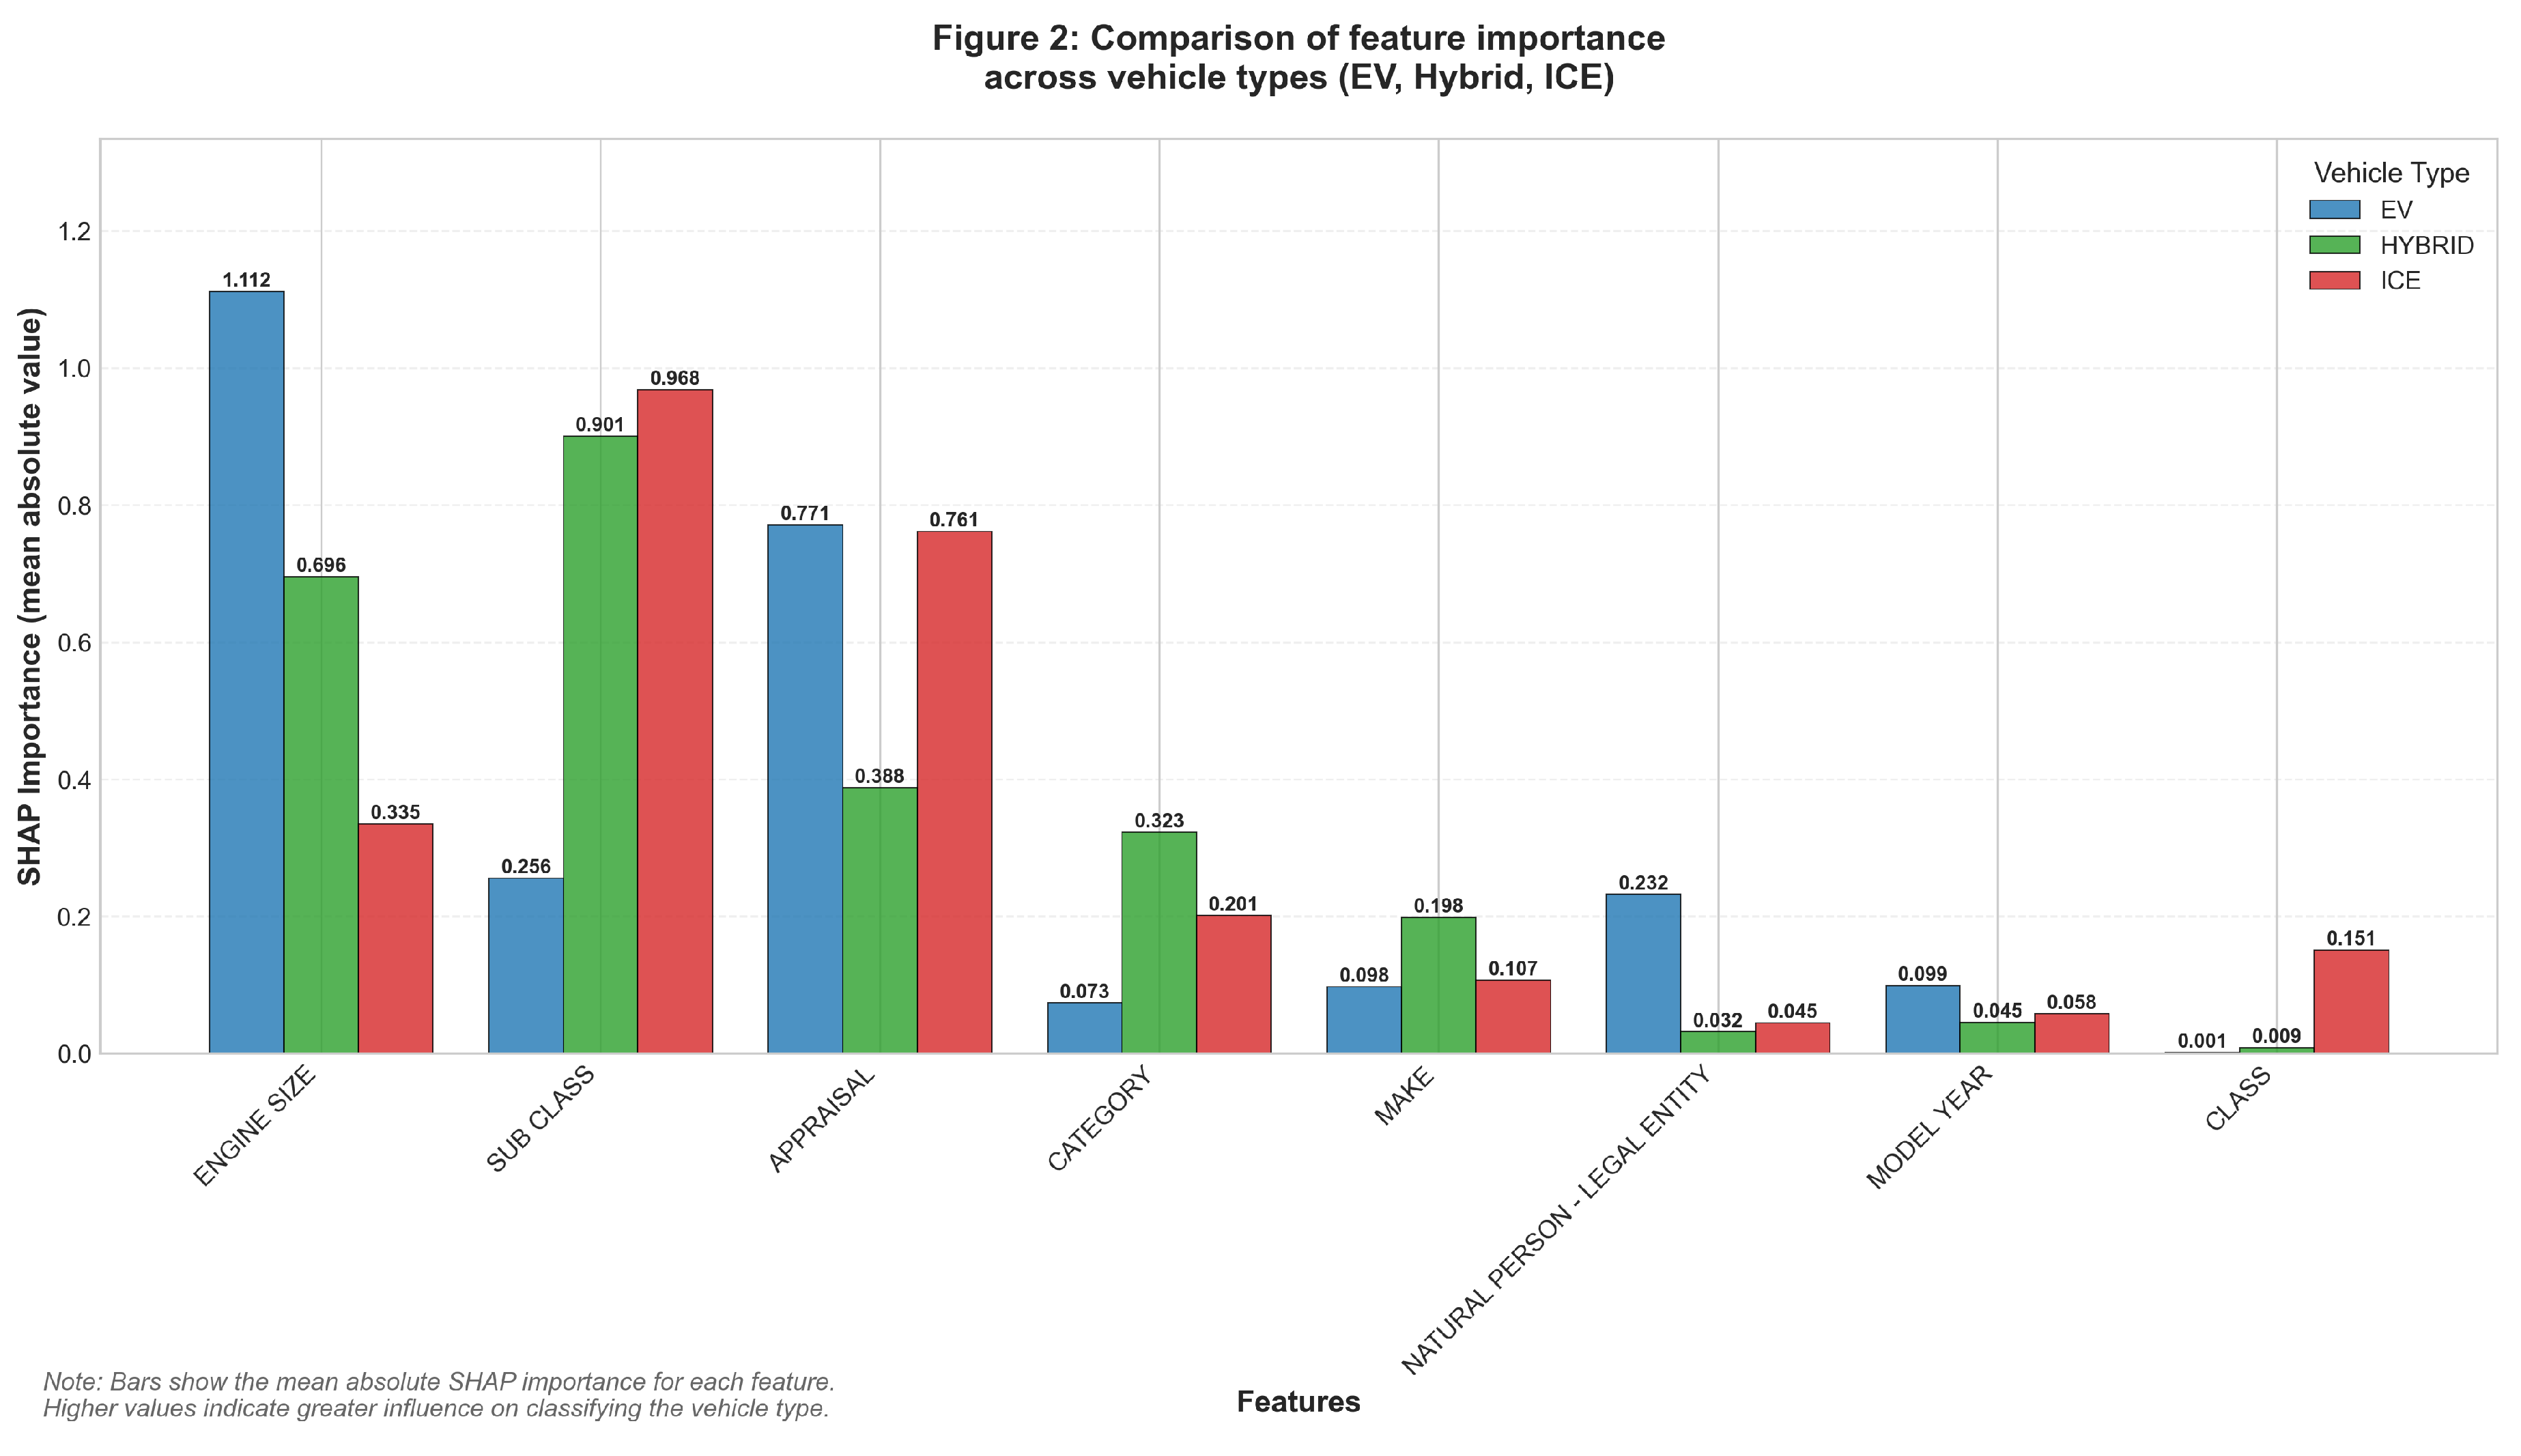
| Rank | EV | HYBRID | ICE |
|---|---|---|---|
| 1 | Engine capacity | Subclass | Subclass |
| 2 | Appraisal value | Engine capacity | Appraisal value |
| 3 | Subclass | Brand | Engine capacity |
| 4 | Buyer type | Appraisal value | Canton |
| 5 | Canton / Model year | Canton | Class |
| Variable | EV | HYBRID | ICE |
|---|---|---|---|
| Appraisal value | + | + | + |
| Engine capacity | – | ± | – |
| Model year | – | + | |
| Buyer type (legal entity) | + | + | – |
| Canton | ± | – | ± |
| Brand | – | – | – |
| Rank | EV | HYBRID | ICE |
|---|---|---|---|
| 1 | Appraisal value | Appraisal value | Appraisal value |
| 2 | Engine capacity | Engine capacity | Engine capacity |
| 3 | Buyer type | Canton | Canton |
| 4 | Model year | Brand | Brand |
| 5 | Canton | Model year | Model year |
| Metric | Value |
|---|---|
| Accuracy | 0.96 – 1.00 |
| Macro F1 | 0.96 – 1.00 |
| Log-loss | 0.00 – 0.09 |
| AUC (OvR) |
| Variable | Importance |
|---|---|
| Engine capacity | +0.45 – +0.49 |
| Appraisal value | +0.32 |
| Canton | +0.10 |
| Brand | +0.07 |
| Model year | +0.03 |
Disclaimer/Publisher’s Note: The statements, opinions and data contained in all publications are solely those of the individual author(s) and contributor(s) and not of MDPI and/or the editor(s). MDPI and/or the editor(s) disclaim responsibility for any injury to people or property resulting from any ideas, methods, instructions or products referred to in the content. |
© 2026 by the authors. Licensee MDPI, Basel, Switzerland. This article is an open access article distributed under the terms and conditions of the Creative Commons Attribution (CC BY) license (http://creativecommons.org/licenses/by/4.0/).


