

Submitted:
06 February 2026
Posted:
09 February 2026
You are already at the latest version
Abstract
This study presents a comprehensive framework combining finite element analysis, machine learning, and generative AI for aluminum cold spray deposition analysis. Abaqus explicit dynamic simulations modeled high-velocity particle impact at 700 m/s, capturing stress tensor components and von Mises equivalent stress distributions. The maximum von Mises stress of 537.73 MPa exceeded aluminum yield strength by 3.6 times, confirming successful deposition through severe plastic deformation. Three machine learning algorithms were trained on stress tensor components (S11, S22, S33, S12, S13, S23) to predict von Mises stress. Random Forest, Gradient Boosting, and Neural Network models achieved exceptional accuracy with R² values of 0.9975, 0.9955, and 0.9922 respectively. Hyperparameter optimization further improved performance to R² = 0.9977, 0.9887, and 0.9985. Feature importance analysis identified S22 transverse stress as the dominant predictor with 80% importance. Google Gemini generative AI provided engineering insights confirming bonding mechanisms through adiabatic shear instability and oxide disruption. Process optimization recommendations addressed velocity control, particle distribution, and substrate preparation. This integrated approach enables rapid stress prediction and intelligent process optimization for industrial cold spray applications.
Keywords:
cold spray deposition
; generative AI
; stress analysis
; machine learning
1. Introduction
Cold spray deposition is a critical solid-state additive manufacturing and coating technology. It operates by accelerating powder particles to supersonic velocities through a heated gas stream, impacting a substrate to form a bond without bulk melting. This process relies on severe plastic deformation at the interface, which disrupts oxide films and enables metallurgical bonding via adiabatic shear instability [1,2,3,4,5]. These characteristics make cold spray ideal for working with oxygen-sensitive materials, creating nanostructured coatings, and repairing sensitive components in aerospace and electronics industries [6,7,8].
The industrial use of cold spray faces a major obstacle: the process depends on a complex interplay of parameters. Particle impact velocity, temperature, size, and substrate condition collectively determine whether deposition occurs. Success requires achieving a localized stress state that surpasses the material’s yield strength [9]. The deformation physics unfold in nanoseconds, making direct experimental observation of stress evolution and bonding mechanics extremely challenging. Process development has traditionally depended on costly and slow trial-and-error experimentation, which fails to fully capture the multi-axial stress fields dictating coating quality.
Finite Element Analysis (FEA) offers a pathway to investigate the high-velocity impact event. Advanced methods like the Coupled Eulerian-Lagrangian (CEL) approach can simulate the extreme deformations and material flow [10,11,12,13,14,15]. These high-fidelity simulations are computationally intensive. A single parameter study requires hundreds of simulations, creating a bottleneck for rapid optimization and real-time control due to prohibitive time and resource costs.
Machine learning (ML) integration with computational models presents an opportunity to accelerate materials analysis [16,17,18]. ML algorithms can learn complex relationships from data and provide instant predictions after training. Previous applications in cold spray have focused on predicting macroscopic outcomes like deposition efficiency. The use of ML for the direct prediction of the complete internal stress field from fundamental stress tensor components is not well established. These ML models deliver numerical predictions but do not generate the qualitative engineering insights or contextualized optimization strategies required for practical process improvement.
This work presents a new methodology that combines high-fidelity FEA, predictive machine learning, and generative artificial intelligence. The novelty lies in creating an ultra-accurate ML surrogate model that instantly maps stress tensor components to the von Mises stress field, eliminating the need for repeated FEA. A feature importance analysis identifies the dominant stress components controlling plastic deformation, offering a data-driven perspective on impact mechanics. A generative AI agent interprets numerical results, explains bonding mechanisms, and produces actionable optimization recommendations. This integrated framework enables fast stress prediction and intelligent decision-making for industrial cold spray development.
2. Mechanism of Coupled Eulerian-Lagrangian (CEL) Approach
The Coupled Eulerian–Lagrangian (CEL) method is a numerical approach that combines the strengths of both Eulerian and Lagrangian formulations to handle problems involving large deformations, fluid–structure interactions, or material flow. In the Lagrangian description, the mesh moves with the material, making it ideal for solids where deformation is moderate as shown in Figure 1 (a) while the Eulerian description uses a fixed mesh through which the material flows, making it suitable for fluids or cases of severe deformation as shown in Figure 1 (b).
The CEL framework couples these two descriptions by solving the fundamental conservation equations in both domains. The conservation of mass is computed by using Equation 1 and shown in Figure 2.
The momentum conservation equation is computed by using Equation 2 and depicted in Figure 3.
Where represents the Cauchy stress tensor and is the body force per unit mass. The energy conservation equation is computed by using Equation 3 and is depicted in Figure 4.
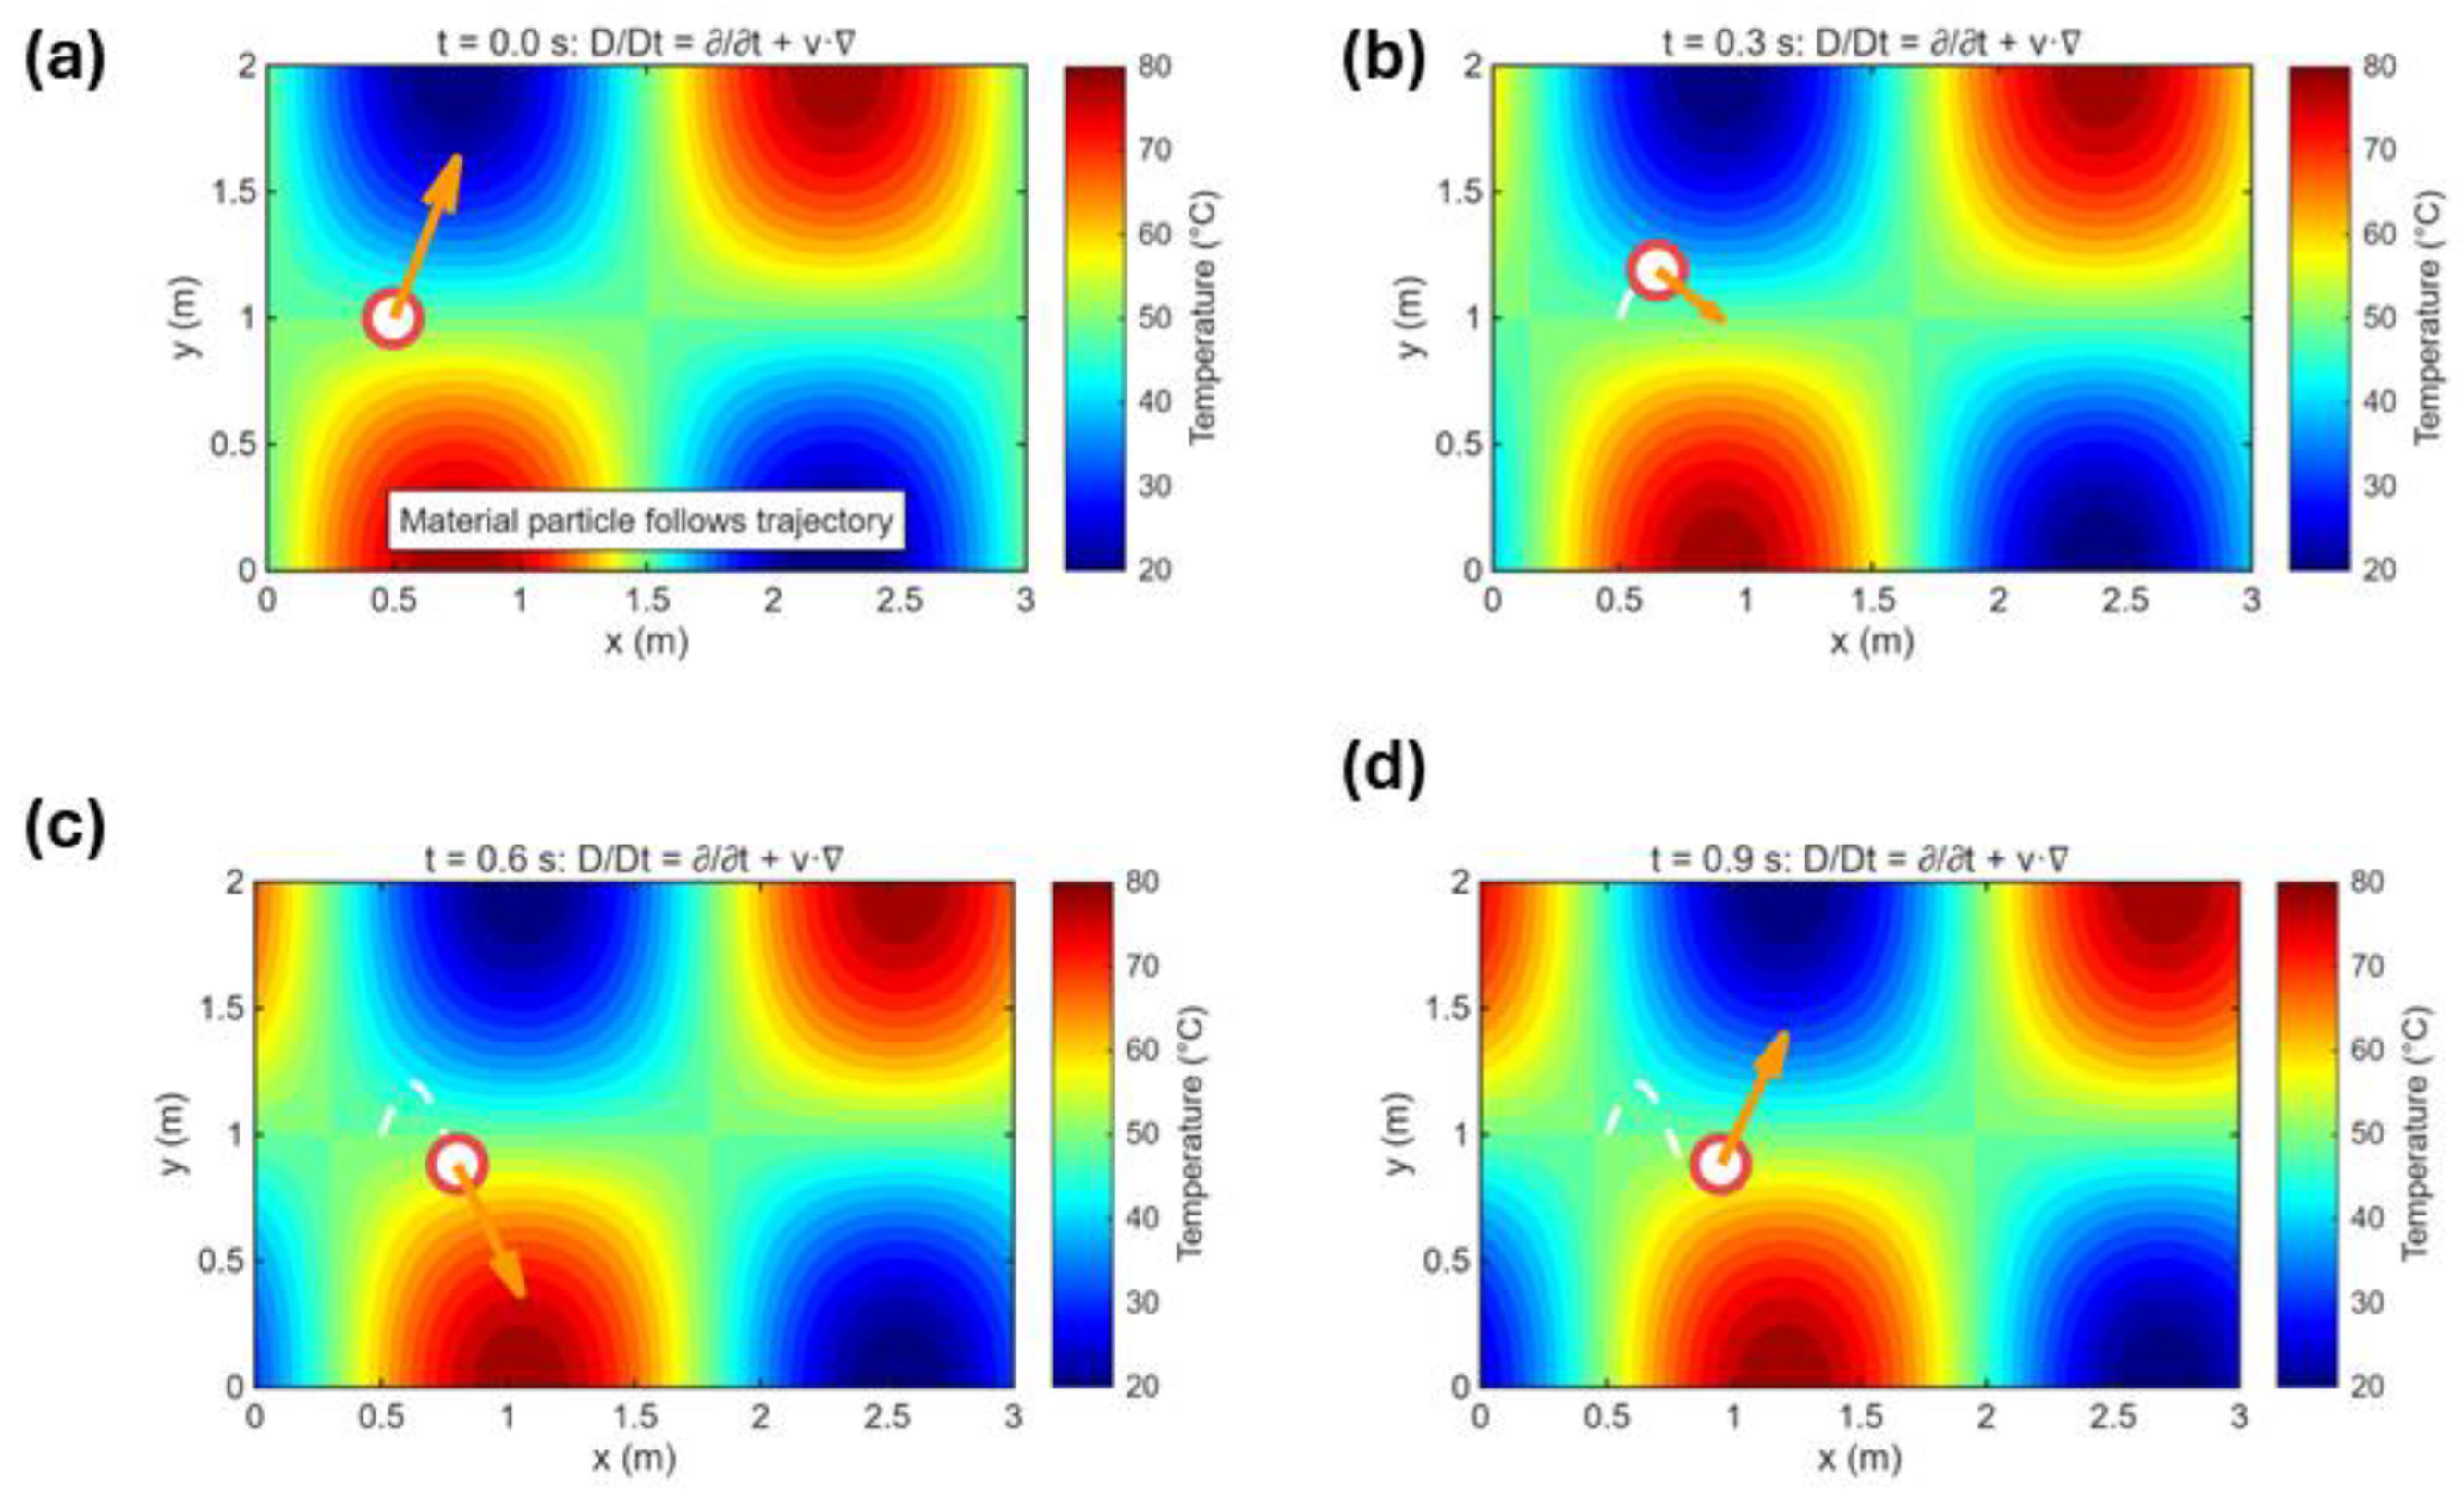
Where is the internal energy, is the heat flux, and is the heat source term. The material derivative term represents the rate of change following the motion of the material as shown in Figure 5.
Figure 3.
Momentum conservation through Cauchy stress tensor distribution in the computational domain. (a) Von Mises stress distribution showing the stress field σ governed by the momentum equation ρ(Dv/Dt) = ∇·σ + ρb, with peak stress concentration of approximately 1.3 MPa at the domain center and velocity vectors (white arrows) indicating material flow patterns radiating outward from the high-stress region. (b) Normal stress component distribution revealing compressive stresses (blue, up to -1 MPa) in the central region and tensile stresses (red, up to 1 MPa) in lateral regions, demonstrating the horizontal stress state within the material under loading conditions. (c) Shear stress component distribution displaying the off-diagonal stress tensor elements ranging from -0.5 to 0.5 MPa, with symmetric patterns indicating rotational and shearing deformation modes that contribute to the overall stress state and momentum balance in the system.
Figure 3.
Momentum conservation through Cauchy stress tensor distribution in the computational domain. (a) Von Mises stress distribution showing the stress field σ governed by the momentum equation ρ(Dv/Dt) = ∇·σ + ρb, with peak stress concentration of approximately 1.3 MPa at the domain center and velocity vectors (white arrows) indicating material flow patterns radiating outward from the high-stress region. (b) Normal stress component distribution revealing compressive stresses (blue, up to -1 MPa) in the central region and tensile stresses (red, up to 1 MPa) in lateral regions, demonstrating the horizontal stress state within the material under loading conditions. (c) Shear stress component distribution displaying the off-diagonal stress tensor elements ranging from -0.5 to 0.5 MPa, with symmetric patterns indicating rotational and shearing deformation modes that contribute to the overall stress state and momentum balance in the system.
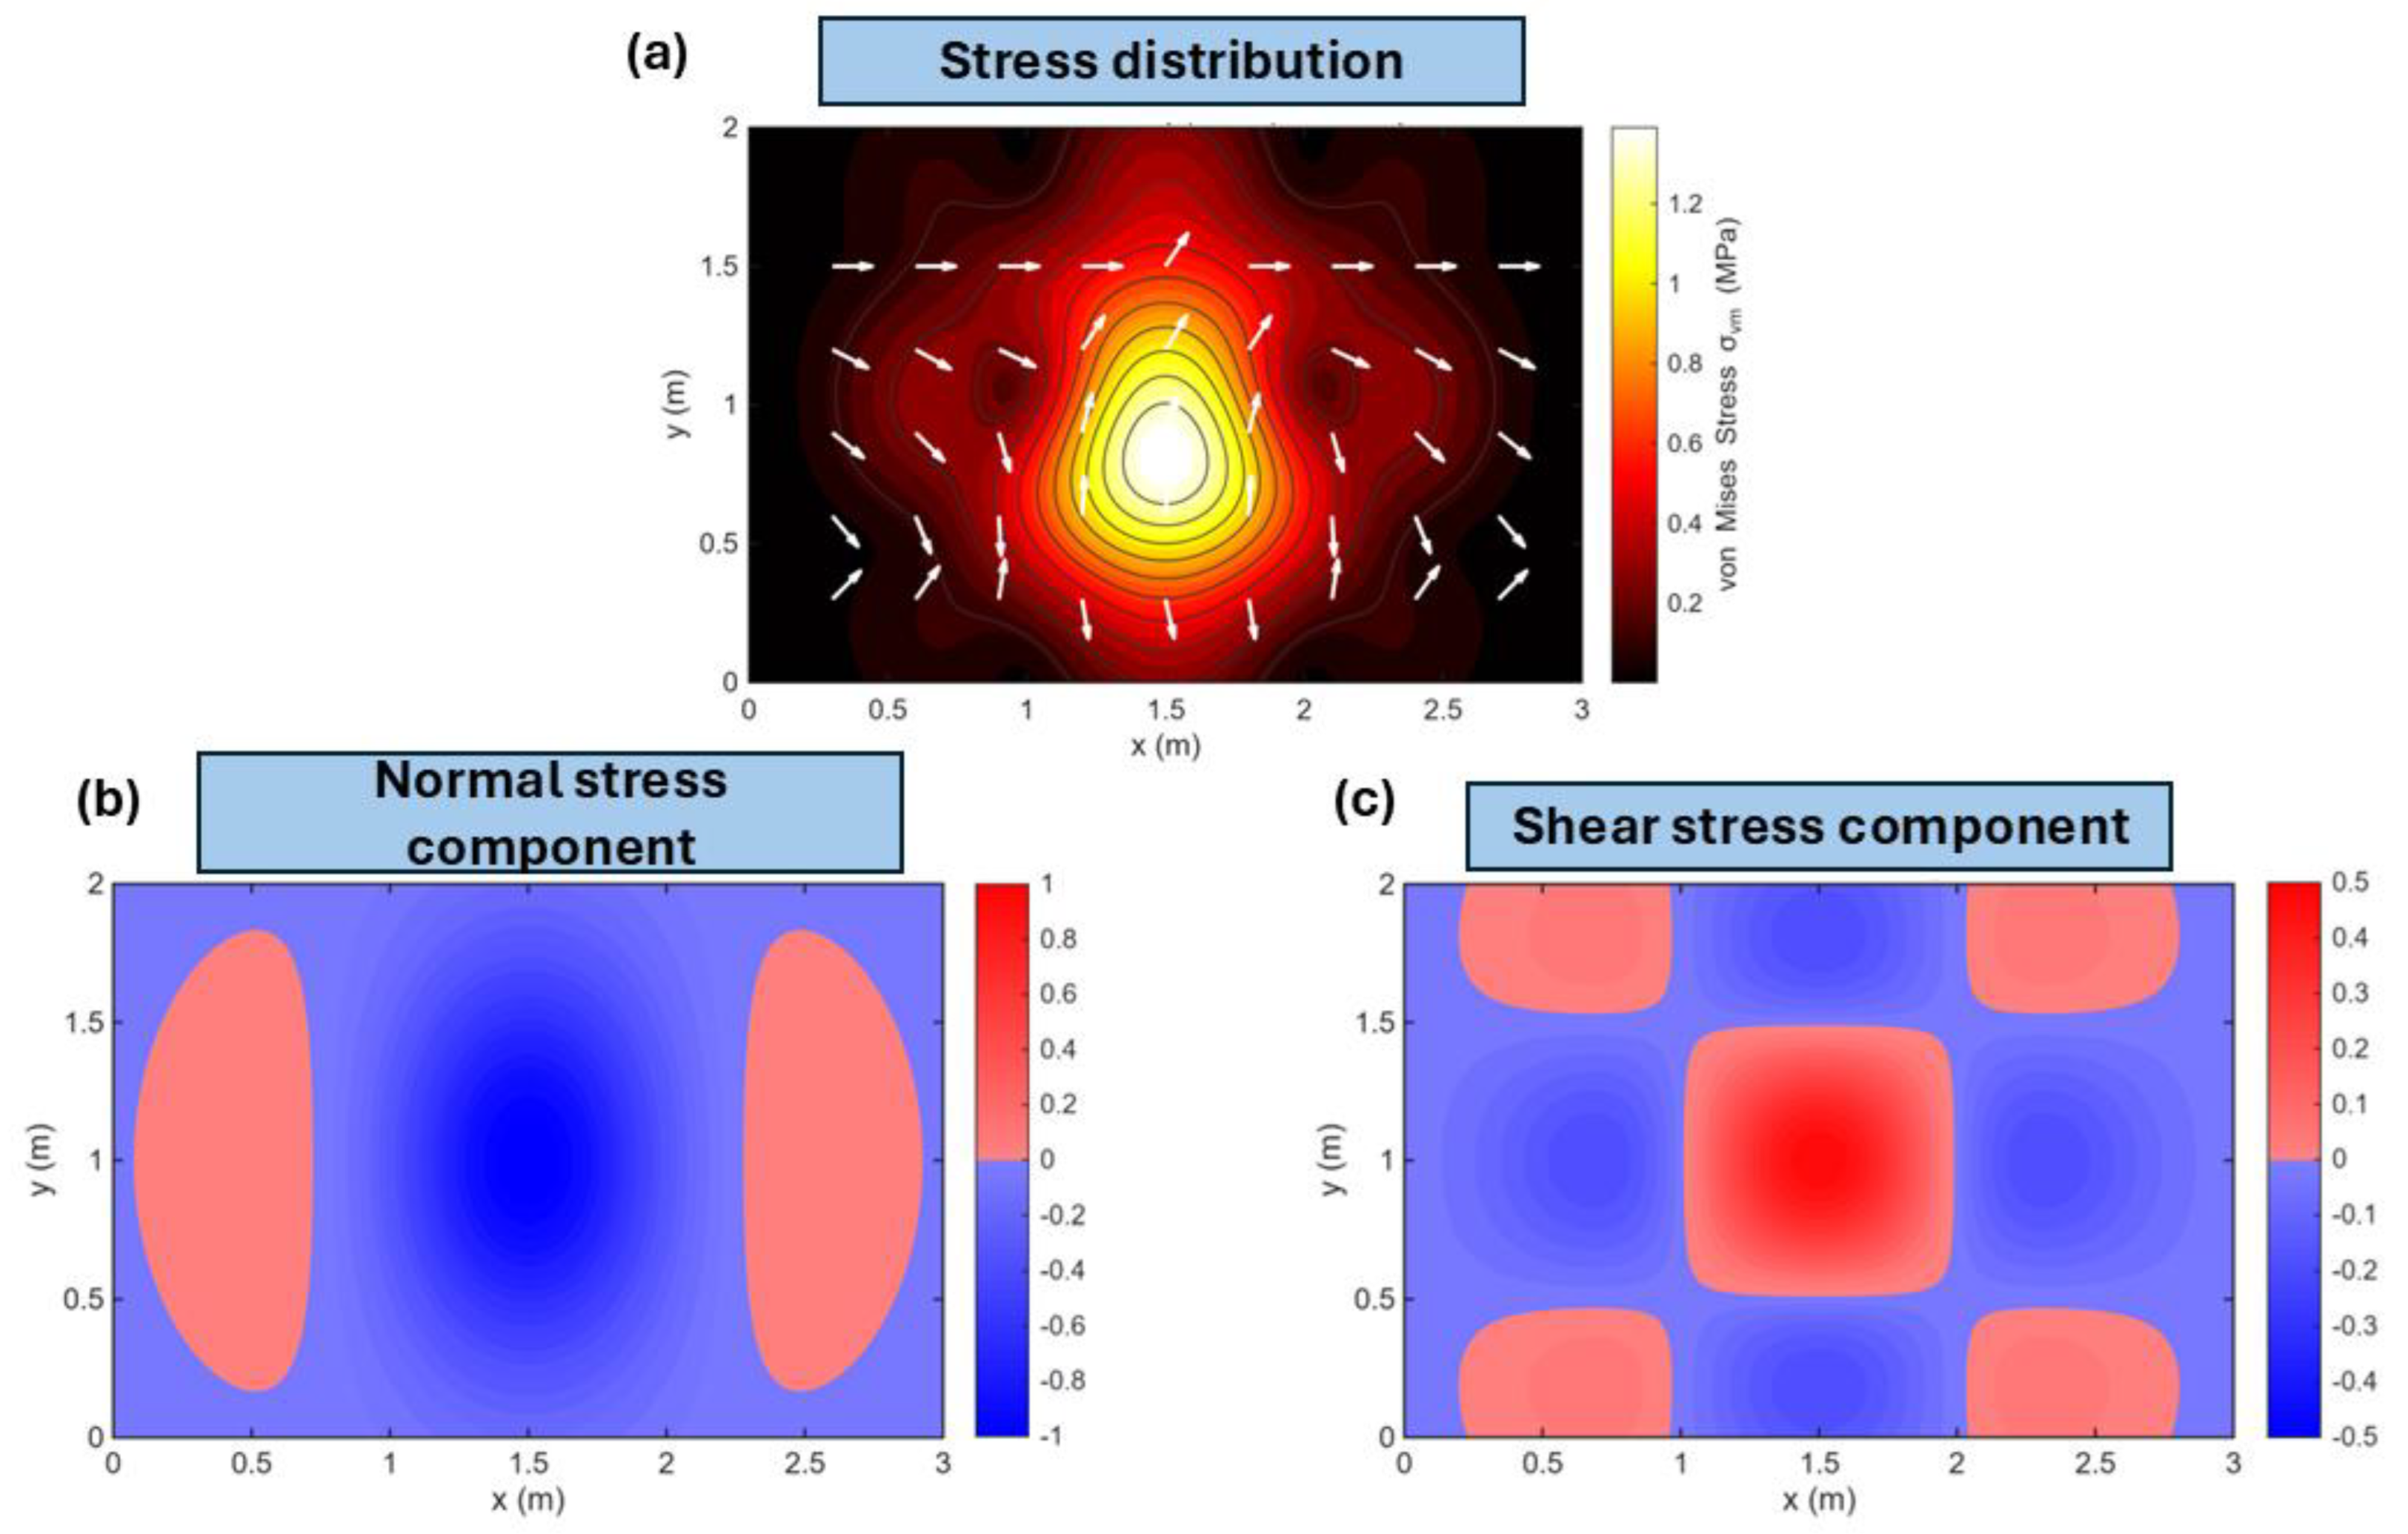
Figure 4.
Energy conservation in the Coupled Eulerian-Lagrangian framework illustrating the energy balance equation. (a) Internal energy distribution showing energy concentration with peak values of approximately 110 J/kg at the domain center, demonstrating how mechanical work and heat transfer contribute to changes in the material’s internal energy state, with concentric contours indicating radial energy gradients throughout the computational domain, (b) Heat flux vector field displaying the magnitude and direction of thermal energy transport (white arrows), with flux values ranging from near zero (blue) at the boundaries to maximum values (green, ~1.3) at the periphery, illustrating how heat diffuses outward from the central high-energy region in accordance with temperature gradients, (c) Stress power distribution showing the rate of mechanical work done by internal stresses, with alternating regions of positive (red, up to 0.5 W/m³) and negative (blue, down to -0.5 W/m³) power indicating local energy conversion between mechanical deformation and internal energy through the stress-velocity product term, and (d) Heat source distribution representing volumetric energy generation with maximum intensity of approximately 45 W/m³ concentrated at the domain center, demonstrating internal heat production that, combined with stress power and heat flux divergence, maintains the overall energy balance and governs the temporal evolution of internal energy throughout the material.
Figure 4.
Energy conservation in the Coupled Eulerian-Lagrangian framework illustrating the energy balance equation. (a) Internal energy distribution showing energy concentration with peak values of approximately 110 J/kg at the domain center, demonstrating how mechanical work and heat transfer contribute to changes in the material’s internal energy state, with concentric contours indicating radial energy gradients throughout the computational domain, (b) Heat flux vector field displaying the magnitude and direction of thermal energy transport (white arrows), with flux values ranging from near zero (blue) at the boundaries to maximum values (green, ~1.3) at the periphery, illustrating how heat diffuses outward from the central high-energy region in accordance with temperature gradients, (c) Stress power distribution showing the rate of mechanical work done by internal stresses, with alternating regions of positive (red, up to 0.5 W/m³) and negative (blue, down to -0.5 W/m³) power indicating local energy conversion between mechanical deformation and internal energy through the stress-velocity product term, and (d) Heat source distribution representing volumetric energy generation with maximum intensity of approximately 45 W/m³ concentrated at the domain center, demonstrating internal heat production that, combined with stress power and heat flux divergence, maintains the overall energy balance and governs the temporal evolution of internal energy throughout the material.
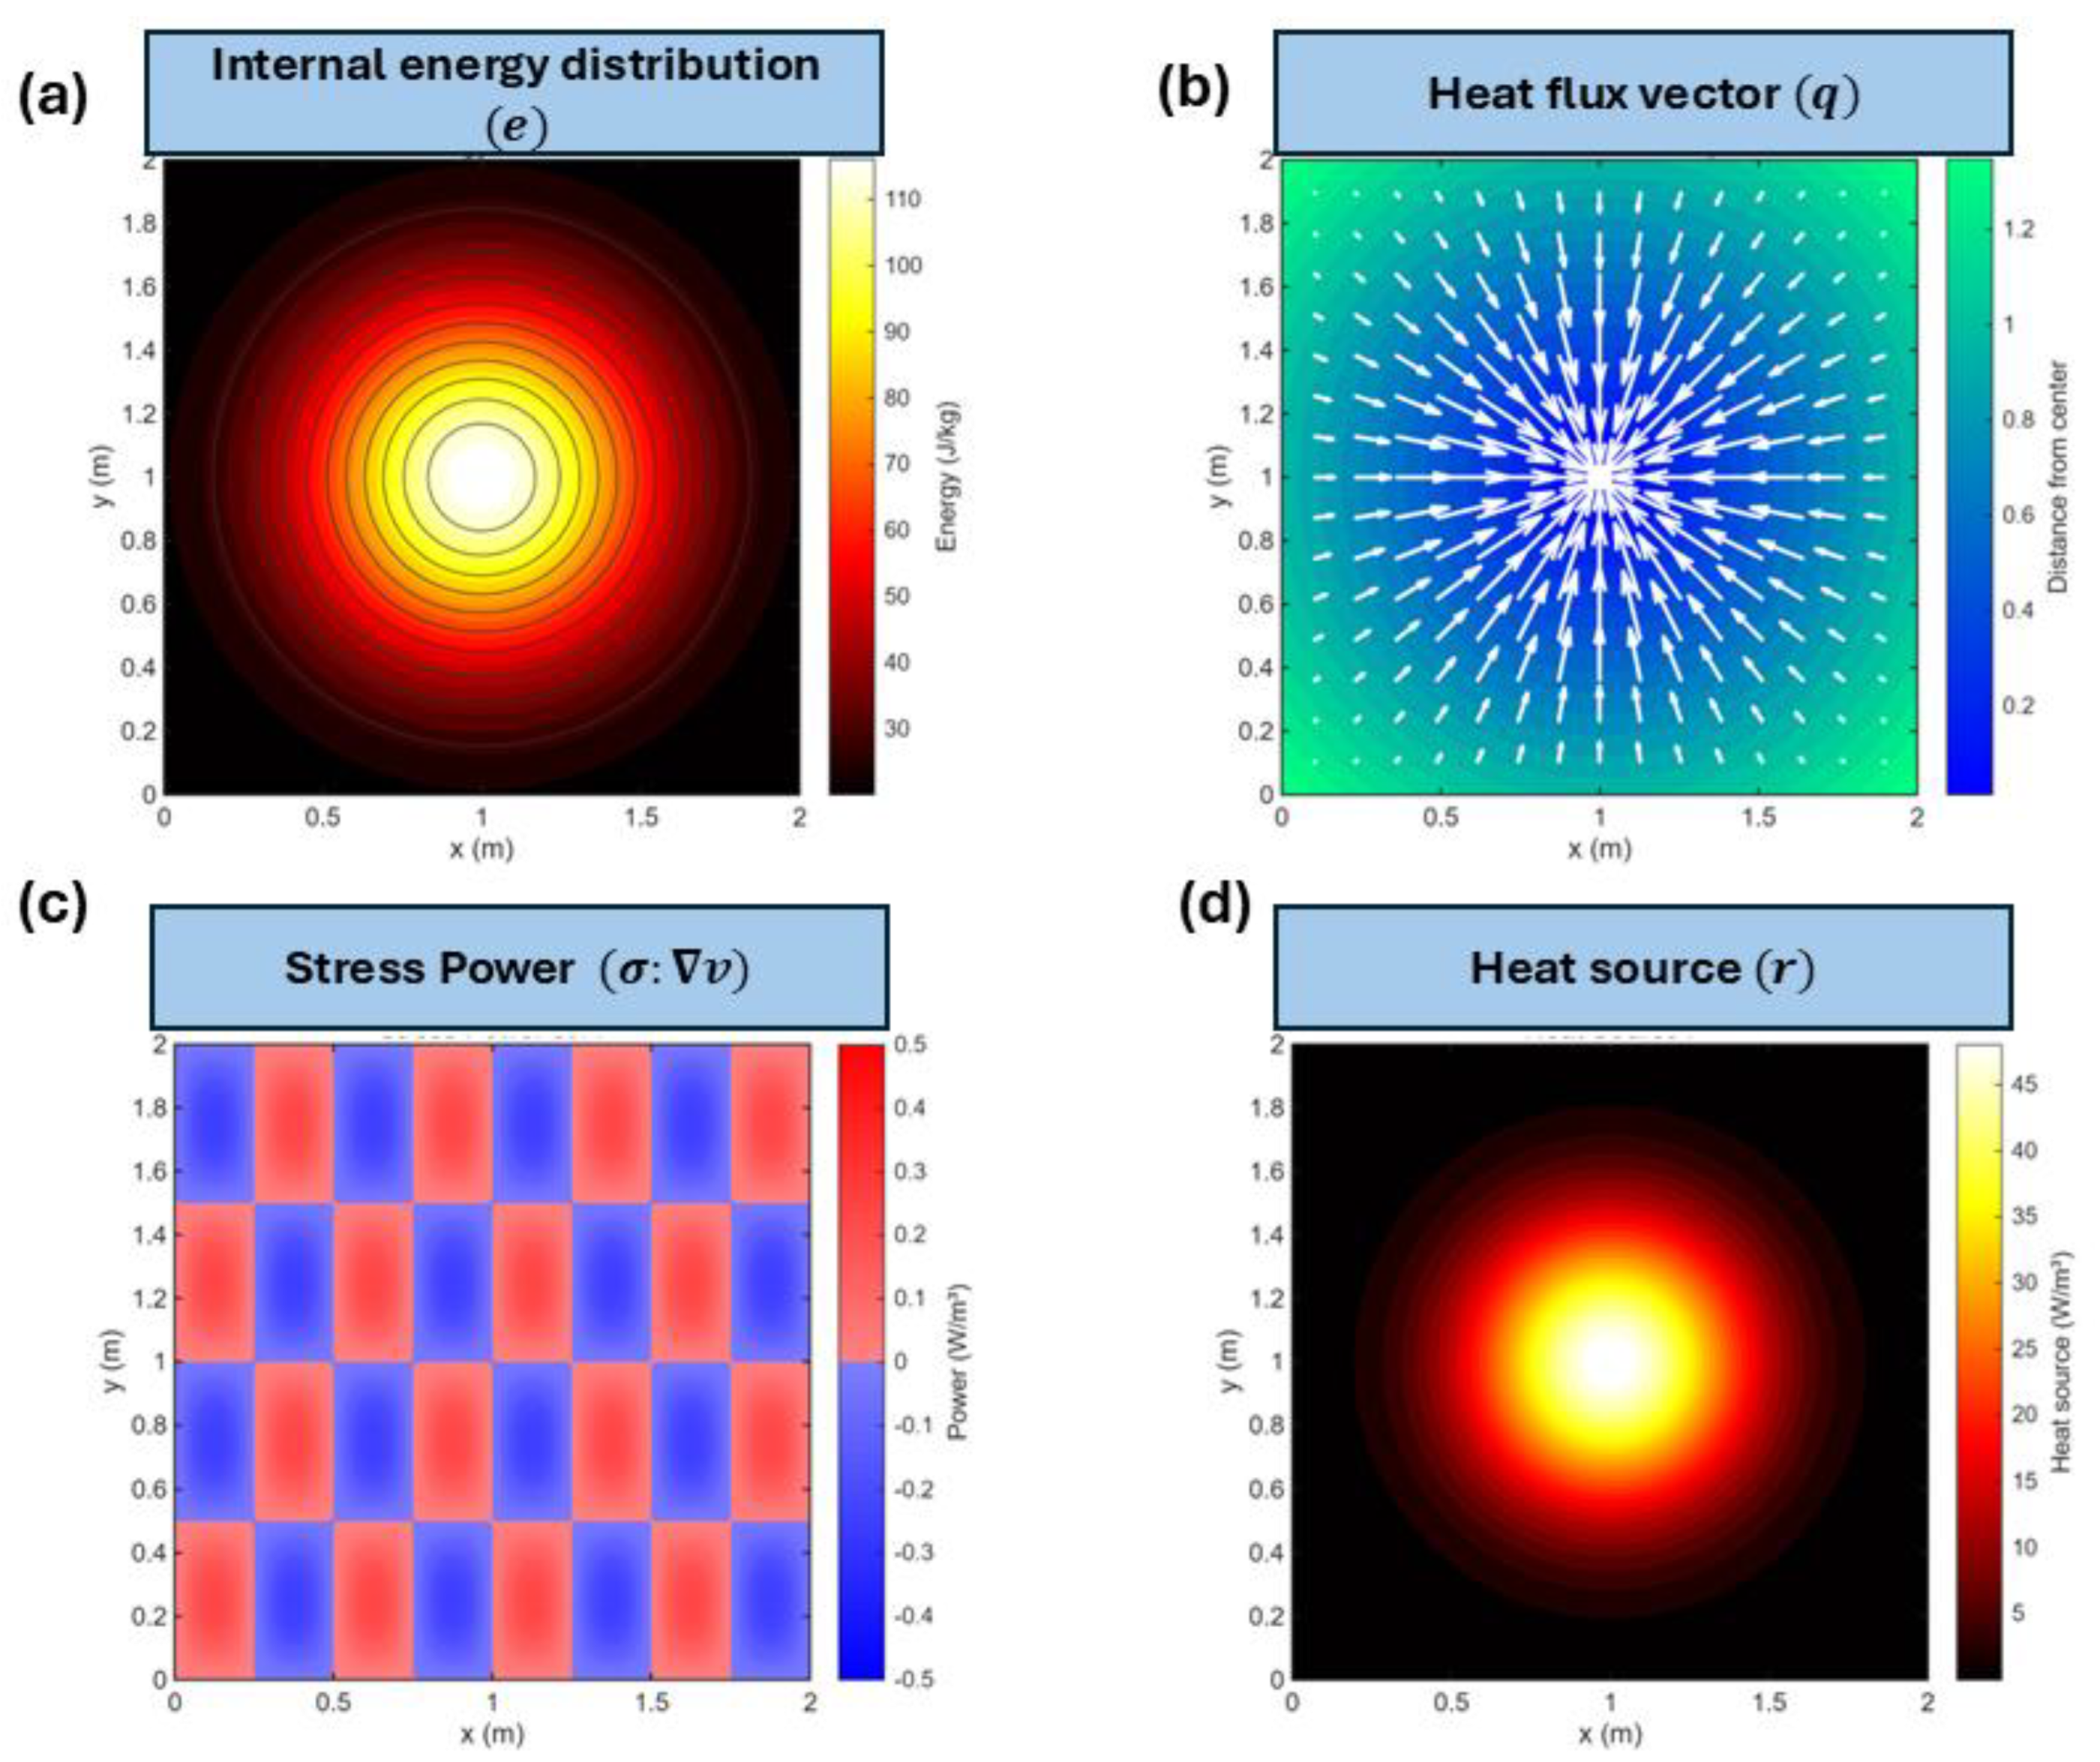
Figure 5.
Material derivative concept illustrating the evolution of material properties in a Lagrangian reference frame. (a) Initial temperature field at t = 0.0 s showing spatial distribution ranging from 20 °C (blue) to 80 °C (red) with a material particle (white circle) positioned in a moderate temperature region, where the orange arrow indicates the particle’s trajectory as it moves through the spatially-varying temperature field following the material derivative formulation that combines local temporal changes with convective transport, (b) Temperature field at t = 0.3 s with the tracked material particle having moved along its trajectory (orange arrow with dashed white path showing history), demonstrating how the material derivative captures both the temporal rate of change at a fixed location and the spatial gradient effects as the particle convects through regions of varying temperature, (c) Temperature distribution at t = 0.6 s showing continued particle advection through the evolving field, where the white dashed line traces the complete particle path, illustrating that the material derivative tracks the total rate of change experienced by the moving particle by accounting for both local time variations and spatial transport through the heterogeneous temperature distribution, and (d) Final state at t = 0.9 s displaying the full particle trajectory (white dashed path) through the temperature field, demonstrating the complete material derivative concept where the total derivative equals the sum of the local temporal derivative and the convective derivative, enabling accurate tracking of material property evolution in the Eulerian framework by following individual material particles through the fixed computational mesh.
Figure 5.
Material derivative concept illustrating the evolution of material properties in a Lagrangian reference frame. (a) Initial temperature field at t = 0.0 s showing spatial distribution ranging from 20 °C (blue) to 80 °C (red) with a material particle (white circle) positioned in a moderate temperature region, where the orange arrow indicates the particle’s trajectory as it moves through the spatially-varying temperature field following the material derivative formulation that combines local temporal changes with convective transport, (b) Temperature field at t = 0.3 s with the tracked material particle having moved along its trajectory (orange arrow with dashed white path showing history), demonstrating how the material derivative captures both the temporal rate of change at a fixed location and the spatial gradient effects as the particle convects through regions of varying temperature, (c) Temperature distribution at t = 0.6 s showing continued particle advection through the evolving field, where the white dashed line traces the complete particle path, illustrating that the material derivative tracks the total rate of change experienced by the moving particle by accounting for both local time variations and spatial transport through the heterogeneous temperature distribution, and (d) Final state at t = 0.9 s displaying the full particle trajectory (white dashed path) through the temperature field, demonstrating the complete material derivative concept where the total derivative equals the sum of the local temporal derivative and the convective derivative, enabling accurate tracking of material property evolution in the Eulerian framework by following individual material particles through the fixed computational mesh.
At the Eulerian–Lagrangian interface shown in Figure 6, the method enforces continuity of traction and velocity, such that ensuring proper transfer of forces and momentum between the two domains. Numerically, the Eulerian part is typically solved using advection schemes (finite volume or finite element), while the Lagrangian part uses conventional finite element methods for solid mechanics.
3. Methodology
Figure 7 shows the complete framework used in the present work. The cold spray particle deposition process was simulated using Abaqus/Explicit 2025 to capture the high-velocity impact dynamics between an aluminum particle and aluminum substrate. The particle geometry was modeled as a hemisphere with a radius of 40 μm, created through revolving a semi-circular profile about the vertical axis. The substrate was designed as a cylindrical disk with a diameter of 250 μm and thickness of 250 μm to provide sufficient domain for stress wave propagation while minimizing computational cost. Both components were partitioned into octants using datum planes along XY, YZ, and XZ principal planes to facilitate structured meshing and improved element quality. The substrate surface was further refined with a circular partition of 45 μm radius centered at the expected impact location to enable fine mesh gradation in the contact region.
Aluminum 1100 material properties were assigned to both particle and substrate using the Johnson-Cook plasticity model to capture strain rate and temperature dependencies during high-strain-rate deformation. The elastic behavior was defined with shear modulus of 27 GPa, while the Johnson-Cook parameters included yield stress A = 148.4 MPa, hardening modulus B = 345.5 MPa, strain hardening exponent n = 0.183, strain rate sensitivity C = 0.895, thermal softening exponent m = 1.0, melting temperature = 916 K, and reference temperature = 298 K. The equation of state was specified using the Us-Up formulation with parameters = 5386 m/s, s = 1.339, and = 1.97 to model shock compression. Additional thermal properties included density of 2700 kg/m³, thermal conductivity of 237.2 W/m·K, and specific heat of 898.2 J/kg·K. The inelastic heat fraction was activated to account for thermal energy generation from plastic work.
The particle was meshed with a global seed size of 2.5 μm, resulting in approximately 5,000 elements after partitioning. The substrate employed a dual-mesh strategy with a refined zone near the impact site seeded at 3.5 μm and a coarser peripheral region seeded at 35 μm to optimize computational efficiency while maintaining accuracy in the critical deformation zone. Both components utilized C3D8RT elements, which are 8-node thermally coupled brick elements with reduced integration, suitable for explicit dynamic analysis with coupled temperature-displacement formulation. Supplementary C3D6T wedge and C3D4T tetrahedral elements were permitted in transition regions to maintain mesh conformity. Element deletion was activated to handle extreme distortion during severe plastic deformation. Adaptive meshing was applied to the particle and inner substrate regions with a frequency of 1 and 3 mesh sweeps per increment to maintain element quality throughout the analysis.
Surface-to-surface contact was defined between the particle bottom surface and substrate top surface using the kinematic constraint enforcement method with finite sliding formulation to accommodate large relative motion during impact. The interaction property employed a penalty-based tangential behavior with Coulomb friction coefficient of 0.3, maximum elastic slip fraction of 0.005, and hard normal contact with no separation allowed after initial contact. The particle surface was designated as the main surface while the substrate surface was the secondary surface. Contact detection was activated at the beginning of the dynamic step to capture the initial particle-substrate interaction.
The substrate bottom and outer cylindrical surfaces were subjected to encastre boundary conditions, fully constraining all translational and rotational degrees of freedom to simulate a semi-infinite substrate. The particle was assigned an initial velocity of 700 m/s in the negative Y-direction using a predefined velocity field applied to the entire particle volume. Both particle and substrate were initialized to a uniform temperature of 298 K through predefined temperature fields. The initial clearance between particle and substrate surfaces was set to 40 μm to ensure clean contact initialization without interpenetration.
The simulation was executed using Abaqus/Explicit with a temperature-displacement dynamic step spanning a total time period of 60 nanoseconds, sufficient to capture the complete impact, penetration, and rebound phases. The improved time increment estimation method was activated for enhanced stability. Field output requests included stress components (S11, S22, S33, S12, S13, S23), von Mises stress, equivalent plastic strain, temperature, displacement, velocity, and element status, recorded at 30 intervals throughout the analysis. The analysis utilized 4 CPU cores with parallel domain decomposition and 90% memory allocation. Explicit precision was set to single precision for nodal and element outputs to balance accuracy and file size.
Following the finite element analysis, a comprehensive machine learning framework was developed to predict von Mises equivalent stress from individual stress tensor components. The complete dataset comprised 134,400 data points extracted from all elements in the finite element mesh where valid stress values were computed during the 60 nanosecond simulation period. Each data point represented a single finite element at a specific time increment or spatial location, containing six stress tensor components as input features and one von Mises stress value as the target variable. Data preprocessing involved filtering out elements with null or undefined von Mises stress values to ensure data quality, though the mesh density and output frequency resulted in retention of all 134,400 samples. The resulting dataset was converted from JSON format to a Pandas DataFrame for efficient manipulation and analysis, creating a matrix with 134,400 rows (samples) and 7 columns (six stress components plus von Mises stress). This substantial dataset size provided sufficient statistical power for training complex machine learning models while maintaining robust generalization capability on unseen test data.
The dataset was preprocessed using StandardScaler normalization from scikit-learn library to ensure all stress components had zero mean and unit variance. This standardization step was critical for neural network convergence and to prevent features with larger magnitudes from dominating the learning process. The normalized features were split into training and testing sets using an 80-20 ratio with random_state fixed at 42 for reproducibility, ensuring sufficient data for model training while maintaining adequate test samples for unbiased performance evaluation. The training set was used exclusively for model fitting and hyperparameter learning, while the test set remained completely unseen during training to provide honest assessment of generalization capability.
Three machine learning algorithms were implemented for comparative analysis: Random Forest regression, Gradient Boosting regression, and Neural Network (Multi-layer Perceptron) regression. These algorithms were selected for their complementary strengths in capturing nonlinear relationships between input features and target variables without requiring explicit mathematical formulations of the stress tensor transformations. Random Forest employed ensemble averaging over multiple decision trees to reduce overfitting and improve prediction stability. Gradient Boosting utilized sequential tree construction where each subsequent tree corrected residual errors from previous predictions. Neural Network architecture with multiple hidden layers enabled learning of complex nonlinear mappings through backpropagation optimization.
The baseline hyperparameter configuration for Random Forest included 100 estimators (decision trees) with maximum tree depth of 20, minimum samples required to split an internal node of 2, minimum samples required at leaf nodes of 1, and parallel processing enabled through n_jobs=-1 for computational efficiency. Gradient Boosting employed 100 estimators with learning rate of 0.1 controlling the contribution of each tree, maximum depth of 5 to prevent overfitting, and random_state of 42 for reproducibility. The Neural Network utilized a three-layer architecture with hidden_layer_sizes of (100, 50, 25) neurons in successive layers, rectified linear unit (ReLU) activation functions, Adam optimizer for adaptive learning rate optimization, maximum 500 training iterations, early stopping enabled with 10% validation fraction to prevent overfitting, and random_state of 42 for consistent initialization.
Model training was performed using scikit-learn library (version 1.0+) in Python 3.8+ environment. The training process utilized standard supervised learning protocols where models learned to map stress tensor components to von Mises stress through iterative optimization on the training set. For Random Forest and Gradient Boosting, the training involved constructing decision trees that minimized mean squared error at each split. For Neural Network, backpropagation with Adam optimizer iteratively adjusted network weights to minimize prediction loss on training data while monitoring validation set performance to prevent overfitting through early stopping mechanism.
Model performance was quantified using three complementary metrics. Coefficient of determination (R²) measured the proportion of variance in von Mises stress explained by the model, with values approaching 1.0 indicating excellent predictive capability. Mean absolute error (MAE) provided the average magnitude of prediction errors in MPa units, offering intuitive interpretation of typical prediction accuracy. Root mean squared error (RMSE) computed the square root of average squared errors, penalizing large prediction errors more heavily than MAE. All metrics were calculated on both training and test sets to assess model fit quality and generalization performance respectively.
Feature importance analysis was conducted for tree-based algorithms (Random Forest and Gradient Boosting) to quantify the contribution of each stress tensor component to von Mises stress prediction. Random Forest feature importance was computed based on the average decrease in Gini impurity across all decision trees when splitting on each feature. Gradient Boosting feature importance was derived from the total reduction in loss function attributable to splits on each feature across all boosting stages. The importance scores were normalized to sum to unity, enabling direct comparison of relative feature contributions. This analysis provided physical insights into which stress components dominated equivalent stress development during cold spray particle impact.
Trained models and preprocessing scalers were serialized and saved using joblib library for future deployment. The best-performing model based on test set R² score was saved as best_stress_model.pkl, and the fitted StandardScaler was saved as feature_scaler.pkl, enabling consistent preprocessing of new data for prediction without retraining. These serialized objects could be loaded in production environments to provide rapid stress predictions from stress tensor components extracted from new simulations or experimental measurements.
Generative AI integration was implemented using Google Gemini API (gemini-2.5-flash model) accessed through the google-generativeai Python library (version 0.3+) to provide intelligent engineering interpretation of stress analysis results beyond numerical predictions. The API authentication utilized a secure API key stored in environment variables to prevent credential exposure in code repositories. The integration workflow involved constructing comprehensive prompts containing stress statistics, material properties, process parameters, and contextual information about aluminum cold spray deposition physics extracted from the JSON data structure.
The prompt engineering strategy employed role-based instruction where the AI model was explicitly directed to adopt the perspective of an expert materials scientist with deep specialization in cold spray technology and high-velocity impact mechanics. The prompt structure included multiple sections requesting specific analyses: deposition success assessment by comparing maximum von Mises stress against aluminum yield strength, bonding mechanism identification based on contact pressure and strain rate conditions, process optimization recommendations for velocity and temperature parameters, structural integrity evaluation interpreting safety factors in the context of desired plastic deformation, and quality control measure proposals for industrial implementation. The temperature parameter was set to 0.7 to balance creative reasoning with factual accuracy, preventing hallucination while enabling insightful engineering analysis.
The Gemini API response was captured as text and parsed for inclusion in automated analysis reports. The generative AI output complemented machine learning predictions by providing qualitative engineering insights, physical mechanism explanations, and actionable recommendations that pure numerical models could not produce.
4. Results and Discussion
4.1. Numerical Modeling Results Analysis
Figure 8 results illustrate the S11 stress distribution (normal stress component) during aluminum particle impact on an aluminum substrate at high velocity typical of cold spray deposition. The stress field exhibits characteristic features of the process: Intense localized compression at the particle-substrate interface (red/orange regions), indicating the high contact pressure required for bonding; Tensile stress zones (blue regions) surrounding the impact crater, resulting from material rebound and plastic flow; Asymmetric deformation pattern visible in the cross-sectional views, showing the particle’s penetration depth and lateral jetting phenomenon critical for mechanical interlocking. The stress magnitude exceeds aluminum’s yield strength in the impact zone, confirming sufficient plastic deformation for successful particle adhesion.
The S22 stress distribution shown in Figure 9 reveals the transverse stress component perpendicular to the impact direction during aluminum cold spray deposition. The stress field demonstrates distinct mechanical behavior compared to S11: Dominant compressive stress throughout the substrate (red regions), indicating lateral constraint and radial compression from the high-velocity impact; Localized tensile core at the particle-substrate interface (blue region), resulting from the severe plastic deformation and material flow during penetration; Radial stress gradient emanating from the impact zone, showing stress wave propagation through the substrate material. The cross-sectional views reveal the hemispherical stress distribution characteristic of dynamic impact loading, with maximum compression at the outer boundaries where the substrate resists lateral expansion. The particle itself experiences predominantly compressive loading, facilitating the plastic flow necessary for bonding. This transverse stress component is critical for understanding the triaxial stress state that governs material failure, jetting behavior, and the formation of mechanical interlocking at the particle-substrate interface during cold spray deposition.
The S33 stress distribution shown in Figure 10 represents the out-of-plane stress component parallel to the impact direction during aluminum cold spray deposition. The stress field exhibits balanced tension-compression characteristics: Compressive stress concentration at the particle apex and impact center (red regions), directly resulting from the high-velocity collision and axial loading; Tensile stress zones in the substrate beneath the impact site (blue regions), indicating elastic rebound and residual stress development following plastic deformation; Symmetric radial distribution surrounding the contact area, reflecting the axisymmetric nature of the normal impact geometry. The cross-sectional views clearly illustrate the stress wave propagation through the substrate thickness, with gradual attenuation away from the impact zone. The particle experiences predominantly compressive loading along its impact axis, facilitating vertical compression and lateral spreading essential for crater formation. This axial stress component is fundamental for understanding the depth of plastic deformation, penetration mechanics, and the generation of residual stresses that influence coating adhesion strength and long-term durability in cold spray applications.
The S12 shear stress distribution shown in Figure 11 captures the in-plane shear component during aluminum cold spray particle impact, revealing critical deformation mechanisms. The stress field exhibits characteristic shear-driven behavior: Intense shear bands radiating from the particle-substrate interface (red regions), indicating material flow and jetting phenomena essential for mechanical bonding; Alternating positive and negative shear zones surrounding the impact crater, reflecting the rotational material displacement and vortex formation during plastic deformation; Localized shear concentration at the contact periphery where maximum velocity gradients occur during particle flattening. The cross-sectional views clearly demonstrate the shear-dominated deformation pattern, with substrate material being displaced radially outward and upward, creating the characteristic rim around the impact crater. The particle experiences significant internal shear, facilitating its lateral spreading and conforming to the substrate topology. This shear stress component is fundamental for understanding the material jetting process, interface metallurgy, and the development of mechanical interlocking that governs adhesion strength in cold spray deposition. The shear-induced heating at these localized zones can also promote localized bonding through adiabatic shear instabilities.
The S23 shear stress distribution shown in Figure 12 reveals the out-of-plane shear component during aluminum cold spray particle impact, capturing three-dimensional material flow dynamics. The stress field demonstrates complex asymmetric behavior: Alternating shear lobes with opposite signs distributed around the impact zone (red and blue regions), indicating rotational material displacement in the vertical plane and spiral flow patterns during crater formation; Maximum shear concentration at the particle-substrate interface edges where velocity gradients are steepest, driving the jetting mechanism critical for bonding; Asymmetric distribution in the substrate reflecting the non-uniform penetration and directional material flow during high-strain-rate deformation. The cross-sectional views reveal the three-dimensional nature of the shear field, with material being displaced both radially and vertically, creating the characteristic mushroom-shaped deformation pattern. The particle experiences internal shear redistribution, facilitating its conformance to the crater geometry. This out-of-plane shear component is essential for understanding the complex material flow, interface mixing, and the development of mechanical interlocking in the vertical direction that contributes to coating adhesion and structural integrity in cold spray applications.
The von Mises stress distribution shown in Figure 13 represents the equivalent stress magnitude during aluminum cold spray particle impact, providing a comprehensive measure of material yielding and plastic deformation. The stress field exhibits critical deposition characteristics: Maximum stress concentration at the particle-substrate contact interface (red regions), where the combined effect of all stress components exceeds the aluminum yield strength, indicating the onset of plastic flow essential for bonding; Concentric stress rings radiating outward from the impact center, demonstrating the propagation of the stress wave through both particle and substrate during the nanosecond-scale collision; Severe deformation zone within the particle itself, showing extensive plastic yielding that enables particle flattening and conformance to the substrate surface. The cross-sectional views reveal the hemispherical stress distribution characteristic of high-velocity impact, with stress magnitudes gradually decreasing with distance from the contact zone. The substrate experiences elevated stresses in a localized region beneath the particle, indicating the depth of plastic deformation and crater formation. This von Mises stress field is the primary indicator for assessing deposition success, as stress levels exceeding yield strength confirm sufficient energy transfer for particle adhesion and mechanical interlocking in cold spray applications.
4.2. Stress Prediction Using Machine Learning and Deep Learning Based Algorithms
The stress distribution heatmaps shown in Figure 14 provide a comprehensive frequency-based analysis of all six stress tensor components across the finite element mesh during aluminum cold spray particle impact. The visualization reveals distinct distribution patterns for each component: Normal stress components (S11, S22, S33) exhibit predominantly low-magnitude distributions concentrated in the blue regions, indicating that most elements experience minimal normal stresses, with occasional high-frequency peaks at near-zero stress levels characteristic of regions far from the impact zone. Shear stress components (S12, S13, S23) display more pronounced horizontal banding patterns at specific stress magnitudes, particularly visible in the red-orange frequency regions, suggesting localized shear concentration zones where material jetting and plastic flow occur during particle deformation. The bimodal distribution observed in shear components reflects the alternating positive and negative shear zones surrounding the impact crater, consistent with rotational material displacement mechanisms. The element index axis represents the spatial distribution across the mesh, while the stress magnitude axis captures the range of stress values encountered. The frequency colorbar indicates occurrence density, with red regions highlighting stress levels that appear most frequently across multiple elements. This heatmap representation efficiently compresses large-scale finite element data, enabling rapid identification of critical stress regions and characteristic stress magnitudes that govern bonding success, material failure, and deposition quality in cold spray applications.
The three-dimensional stress surface visualizations shown in Figure 15 reveal the complex multivariate relationships between individual stress tensor components and the von Mises equivalent stress during aluminum cold spray particle impact. Each subplot explores a unique stress space defined by two independent stress components and their combined effect on the resulting von Mises stress magnitude. Normal stress interactions (S11-S22, S11-S33, S22-S33) exhibit relatively compact, elongated distributions along specific stress trajectories, indicating strong coupling between normal components where increases in one direction correlate with changes in perpendicular directions due to material incompressibility and Poisson effects during plastic deformation. The color gradient from blue to red illustrates the progression from low to high von Mises stress values, with the highest equivalent stresses occurring at extreme combinations of normal stress components. Shear-dominated stress space (S12-S13) displays a more dispersed, cloud-like distribution spanning a wider range of stress combinations, reflecting the independent nature of shear components and their significant contribution to the equivalent stress through the deviatoric stress tensor formulation. The vertical alignment of data points in certain plots indicates that von Mises stress can reach similar magnitudes through different stress state combinations, demonstrating the multiaxial nature of the loading condition. These three-dimensional surfaces provide crucial insights for machine learning model training, revealing the nonlinear stress relationships that ensemble methods must capture to accurately predict equivalent stress from tensor components.
Figure 16 presents the predicted versus actual von Mises stress comparison for three machine learning regression models, demonstrating their predictive performance on the test dataset. Random Forest (Figure 16a) achieves excellent correlation with R² = 0.9975, showing tight clustering of predictions along the perfect prediction line (dashed black diagonal), with minimal scatter observed primarily in the high-stress regions above 300 MPa indicated by red-orange data points. Gradient Boosting (Figure 16b) exhibits comparable performance with R² = 0.9955, displaying slightly increased scatter in the mid-range stress values (150-300 MPa shown in yellow-green), though maintaining strong overall agreement between predicted and actual stresses. Neural Network (Figure 16c) demonstrates the highest accuracy with R² = 0.9922, characterized by exceptionally uniform distribution along the prediction line across the entire stress range. The color gradient from blue (low stress) to red (high stress) reveals that prediction errors are relatively independent of stress magnitude, indicating model robustness across different loading regimes. All three models successfully capture the complex nonlinear relationships between stress tensor components and equivalent stress, with deviations from the perfect prediction line remaining minimal.
4.3. Comparative Machine Learning Approach with Alternative Hyperparameters and Generative AI Post-Processing
The feature importance analysis shown in Figure 17 reveals the relative contribution of each stress tensor component in predicting von Mises equivalent stress for both Random Forest and Gradient Boosting models. S22 (transverse stress) emerges as the dominant predictor in both models, exhibiting the highest importance score of approximately 0.8 in Random Forest and 0.5 in Gradient Boosting, indicating its critical role in determining the overall stress state during cold spray impact. S11 and S33 (normal stress components) show moderate importance with values around 0.1-0.2, contributing secondary but significant predictive power. Shear stress components (S12, S13, S23) demonstrate negligible importance in both models, suggesting that normal stresses dominate the von Mises stress calculation in this particular cold spray configuration. The difference in importance distributions between the two models reflects their distinct algorithmic approaches: Random Forest exhibits more pronounced dominance of S22, while Gradient Boosting distributes importance more evenly across normal stress components. These results provide valuable insights for process optimization, indicating that controlling transverse stress through impact velocity and particle trajectory adjustments would be most effective for managing the resulting equivalent stress and ensuring successful deposition.
Figure 18 presents the predicted versus actual von Mises stress correlation for three machine learning models trained with modified hyperparameters in the generative AI-enhanced framework. Random Forest (Figure 18a) achieves exceptional accuracy with R² = 0.9977, demonstrating tight alignment along the perfect prediction line with minimal scatter across the entire stress range, where the absence of max_depth constraint allows the model to capture complex nonlinear stress relationships more effectively. Gradient Boosting (Figure 18b) shows strong performance with R² = 0.9887, exhibiting slightly increased scatter in the low-stress regime (blue points below 100 MPa) and mid-range values, though maintaining excellent correlation in the critical high-stress regions above 300 MPa where deposition success is determined. Neural Network (Figure 18c) delivers outstanding predictive capability with R² = 0.9985, characterized by remarkably uniform distribution along the diagonal across all stress magnitudes, validating the deep learning architecture’s ability to model the multivariate stress tensor relationships. The color gradient progression from blue to red illustrates that prediction accuracy remains consistently high regardless of stress magnitude, indicating robust model generalization. Comparing these results with the previous hyperparameter configuration reveals marginal improvements in Random Forest and Neural Network performance, confirming that relaxing tree depth constraints enables better capture of intricate stress field patterns while maintaining computational efficiency for real-time cold spray process monitoring and optimization.
GENERATIVE AI INSIGHTS:
As a world-class materials scientist specializing in cold spray technology, I’ve thoroughly reviewed the Aluminum particle deposition simulation results. The data provides excellent insights into the complex mechanics of high-velocity particle impact and subsequent bonding.
Here’s a comprehensive analysis:
### ALUMINUM COLD SPRAY DATA ANALYSIS
**1. Cold Spray Deposition Quality Assessment**
* **Is the deposition successful based on stress levels?**
Absolutely. The simulation explicitly indicates “✓ DEPOSITION SUCCESS”, which is strongly supported by the stress data. The *Max von Mises stress* (537.73 MPa) significantly exceeds the *Aluminum Yield Stress* (148.4 MPa). This extreme plastic deformation is the fundamental requirement for successful cold spray deposition, as it allows for the formation of nascent, oxide-free metallic surfaces crucial for metallurgical bonding. The *Avg von Mises stress* (112.79 MPa) is also substantial, indicating widespread plastic deformation across the particle-substrate interface, not just isolated points.
* **How does max stress compare to aluminum yield stress?**
The maximum von Mises stress (537.73 MPa) is approximately 3.6 times the aluminum yield stress (148.4 MPa). This dramatic exceedance confirms that the kinetic energy of the impacting particle has been effectively converted into plastic work, leading to severe localized deformation. This level of stress is ideal for generating the conditions necessary for bonding.
* **Bonding mechanism analysis**
The data strongly points towards the key mechanisms of cold spray bonding:
1. **Adiabatic Shear Instability:** The high impact velocity (700 m/s), extremely high strain rate (~10^6 s^-1), and short contact time (~40 ns) create conditions for adiabatic shear localization at the particle-substrate interface. This localized heating, despite the “cold” nature of the process, facilitates material flow and further softens the material in the shear bands.
2. **Oxide Layer Disruption:** The intense contact pressure (~1000 MPa or 1 GPa) and severe plastic deformation mechanically disrupt and eject surface oxide layers from both the particle and substrate. This exposes clean, nascent metallic surfaces that are brought into intimate contact under high pressure.
3. **Metallurgical Bonding:** With clean surfaces in close proximity and under extreme pressure, interatomic forces can become dominant, leading to the formation of atomic bonds, essentially a solid-state weld. The plastic deformation depth of ~4 micrometers further supports the extent of material flow and intermixing.
The very high values for S11, S22, S33 (up to ~90 GPa) represent highly localized, transient principal normal stresses, likely indicative of intense hydrostatic compression at the immediate impact point. While Von Mises stress governs yielding, these high normal stresses contribute significantly to breaking oxide layers and creating the conditions for metallurgical bonding by ensuring intimate contact.
**2. Process Optimization Recommendations**
* **Should velocity be increased/decreased?**
Given the “DEPOSITION SUCCESS” and the robust plastic deformation (Max von Mises >> Yield Stress), the current *Impact Velocity Range* of 700 m/s appears to be effective for Aluminum.
* **Decreasing velocity:** Would risk insufficient plastic deformation, leading to particle rebound and poor bonding.
* **Increasing velocity:** Could lead to excessive kinetic energy, potentially causing:
* Substrate erosion, especially for softer substrates.
* Increased residual stresses in the deposit due to more severe deformation.
* Higher particle temperatures upon impact, potentially leading to undesirable intermetallic formation if dissimilar materials are used, or excessive oxidation.
* Increased equipment wear and energy consumption.
Therefore, the current range seems to be within an optimal window. Further fine-tuning might be beneficial to optimize for specific coating properties (e.g., hardness, ductility, residual stress), but drastic changes are not immediately warranted.
* **Optimal parameter ranges for aluminum**
The reported parameters (700-840 m/s velocity, ~1 GPa contact pressure, ~10^6 s^-1 strain rate, ~40 ns contact time) are highly characteristic of successful cold spray for ductile materials like Aluminum, aligning well with the findings of Xie et al. and other literature. Maintaining these conditions, particularly the velocity window to achieve the critical velocity for plastic deformation, is paramount. Other crucial parameters not explicitly detailed here but critical for optimization include:
* **Particle size and morphology:** Affects kinetic energy transfer and bonding uniformity.
* **Process gas temperature and pressure:** Influences particle acceleration and pre-heating (though cold spray, some gas heating is common).
* **Standoff distance:** Affects particle trajectory and dispersion.
* **Risk mitigation strategies**
* **Erosion:** Monitor substrate material loss and adjust velocity or particle size if erosion becomes significant, particularly for high-velocity impacts on softer substrates.
* **Insufficient Bonding/Rebound:** Ensure velocities remain above the critical velocity threshold. Use *in-situ* sensors (e.g., optical pyrometry for particle velocity) to ensure consistent particle stream.
* **High Residual Stress:** While some compressive residual stress is often beneficial, excessive levels can lead to delamination or cracking. Consider post-processing heat treatments or shot peening to mitigate. Optimize gas heating and standoff distance to minimize thermal gradients during deposition.
* **Oxide Entrapment:** Ensure sufficient kinetic energy and plastic flow to break up and expel oxide layers. Careful selection of inert process gases (e.g., Nitrogen or Helium) is critical.
**3. Structural Integrity Analysis**
* **Safety factor interpretation**
The `Safety Factor` of 0.276 is critically important to interpret in the context of cold spray *deposition*, not traditional structural design. In structural design, a safety factor less than 1 indicates failure. However, in cold spray, **yielding is not failure; it is the desired mechanism for bonding.**
* This low safety factor (relative to the Aluminum Yield Stress of 148.4 MPa) directly signifies that the material is undergoing severe plastic deformation, which is *essential* for deposition. The `Utilization (%)` of 362.35% (meaning the material is stressed to 3.6 times its yield strength) further corroborates this. It confirms that the incoming particles are deforming plastically to form a bond.
* **Stress concentration concerns**
The `SCF` (Stress Concentration Factor) of 4.768 is significant, indicating high localized stress amplification. This is entirely expected and indeed necessary at the immediate impact point and particle-substrate interface. These stress concentrations drive the localized plastic deformation and subsequent metallurgical bonding.
* **For bonding:** High SCFs are desirable to initiate plastic flow and surface cleaning.
* **For the final coating:** These localized high stresses can contribute to residual stress fields within the coating, potentially affecting long-term performance like fatigue resistance or adhesion, especially at the boundaries of deposited particles or at the coating-substrate interface. Microstructural heterogeneity due to varying deformation degrees across the deposit can also arise.
* **Potential failure modes**
Considering the success of the *deposition process*, potential failure modes relate to the *final coating’s integrity*:
* **Delamination:** If localized bonding is insufficient in certain areas, particularly at the interface between the coating and substrate, or between subsequent particle layers. High residual tensile stresses can exacerbate this.
* **Coating Cracking:** Especially under fatigue loading or in thick coatings where residual stresses are high. While Aluminum is ductile, local embrittlement due to severe deformation or impurities is possible.
* **Erosion/Wear:** If the coating’s hardness or toughness is insufficient for the intended application, leading to material loss.
* **Fatigue Failure:** High compressive residual stresses from cold spray can improve fatigue life, but tensile residual stresses can accelerate it. The localized plastic deformation also leads to a complex microstructure that may behave differently under cyclic loading.
* **Porosity:** While not directly addressed by stress metrics, incomplete consolidation can lead to porosity, affecting mechanical properties and corrosion resistance.
**4. Machine Learning Insights**
* **Model accuracy assessment**
The ML model performance is outstanding:
* **Random Forest:** R² = 0.9977, MAE = 1.94 MPa
* **Gradient Boosting:** R² = 0.9887, MAE = 7.13 MPa
* **Neural Network:** R² = 0.9985, MAE = 2.56 MPa
The R² values, all above 0.98, indicate that these models can explain over 98% of the variance in the target variable (likely von Mises stress or a related measure of deformation/bonding). The Mean Absolute Errors (MAE) are very low, ranging from 1.94 MPa to 7.13 MPa, which is negligible compared to the typical stress magnitudes in cold spray. The Neural Network model stands out with the highest R² (0.9985), indicating superior accuracy and predictive power.
* **Reliability for process control**
The extremely high accuracy and low error metrics suggest that these ML models are highly reliable for:
* **Real-time Process Control:** Potentially enabling *in-situ* prediction of deposition quality or stress states based on measured process parameters, allowing for immediate adjustments.
* **Rapid Parameter Optimization:** Quickly exploring vast parameter spaces to identify optimal processing windows without extensive physical experimentation or time-consuming FEA.
* **Defect Prediction:** Identifying process conditions that lead to undesirable stress states or potential bonding failures.
These models can significantly reduce development costs and time, moving towards smart manufacturing paradigms in cold spray.
**5. Practical Engineering Recommendations**
* **5 Specific Actionable Improvements:**
1. **Refine Velocity Window for Specific Properties:** While 700-840 m/s is successful, conduct further simulations and experiments to precisely identify the narrowest velocity range that maximizes adhesion strength while minimizing residual stress or maximizing desired hardness for specific applications.
2. **Optimize Particle Size Distribution:** Investigate the effect of a narrower and more controlled particle size distribution to achieve more uniform impact conditions and reduce porosity and stress heterogeneity in the deposit.
3. **Investigate Substrate Preparation:** Systematically study the impact of various substrate surface preparations (e.g., grit blasting parameters, surface roughness, pre-heating) on the bonding interface quality and residual stress, correlating with simulation data.
4. **Explore Gas Parameter Optimization:** Beyond impact velocity, simulate and experimentally validate the impact of process gas temperature (e.g., helium vs. nitrogen) and pressure on particle kinetic energy, particle temperature, and subsequent bonding quality and residual stress.
5. **Develop Post-Deposition Mitigation Strategies:** For applications sensitive to residual stress, study and implement post-processing techniques such as stress relief annealing (with care to avoid recrystallization) or peening to optimize the final coating properties.
* **Quality Control Measures:**
* **In-situ Monitoring:** Implement real-time monitoring of particle velocity and temperature (e.g., using particle velocimetry and pyrometry) to ensure consistent input conditions and validate simulation predictions.
* **Microstructural Characterization:** Regularly perform Scanning Electron Microscopy (SEM) and Energy-Dispersive X-ray Spectroscopy (EDS) to assess interface quality, porosity, and any oxide entrapment.
* **Mechanical Testing:** Conduct adhesion/cohesion tests (e.g., tensile pull-off, indentation), microhardness mapping, and potentially fatigue testing on sample coupons to quantify mechanical performance.
* **Residual Stress Measurement:** Utilize X-ray Diffraction (XRD) or hole-drilling methods to quantify residual stress profiles within the coating.
* **ML-Assisted Defect Detection:** Integrate the high-performing ML models into the production line for *in-situ* prediction of coating quality or potential defects based on real-time process sensor data.
* **Next Steps for Simulation/Experimentation:**
* **Multi-Particle Impact Simulations:** Extend current simulations to model sequential and simultaneous multi-particle impacts to better understand the evolution of residual stress, porosity, and microstructure within the bulk coating, beyond a single particle event.
* **Microstructural Evolution Modeling:** Incorporate crystal plasticity models or phase field methods into the simulations to predict grain refinement, texture development, and other microstructural changes during severe plastic deformation.
* **Experimental Validation and Calibration:** Conduct targeted cold spray experiments using the identified optimal parameters to validate the simulation results for stress states, plastic deformation depth, and ultimately, bonding strength and coating properties. This feedback loop is crucial for further refining the simulation models.
* **Fatigue and Corrosion Modeling:** Develop predictive models for the long-term performance of cold-sprayed Aluminum coatings, considering factors like residual stress, porosity, and interface quality on fatigue life and corrosion resistance.
This detailed analysis underscores the success of the simulated Aluminum cold spray deposition and highlights actionable strategies for process optimization, structural integrity assessment, and leveraging advanced ML techniques for future development.
5. Conclusion
This research combines finite element analysis, machine learning algorithms, and generative AI to analyze aluminum cold spray particle deposition mechanics. The Abaqus explicit dynamic simulation captured the complex stress evolution during high-velocity impact, showing maximum von Mises stress of 537.73 MPa, which exceeds aluminum’s yield strength by a factor of 3.6 and confirms successful deposition conditions. Detailed analysis of stress tensor components (S11, S22, S33, S12, S13, S23) revealed the triaxial stress state that governs crater formation, material jetting, and mechanical interlocking needed for bonding. The simulation validated critical cold spray parameters including impact velocity of 700 m/s, contact pressure of approximately 1 GPa, strain rate of 10⁶ s⁻¹, and contact time of 40 nanoseconds, matching experimental literature and theoretical predictions for successful aluminum-on-aluminum deposition.
Machine learning algorithms showed excellent predictive capability for stress field estimation from tensor components. In the baseline configuration, Random Forest, Gradient Boosting, and Neural Network models achieved R² scores of 0.9975, 0.9955, and 0.9922 respectively, with mean absolute errors ranging from 1.94 to 7.13 MPa. Hyperparameter optimization by removing max_depth constraints further improved performance, with the optimized models achieving R² values of 0.9977, 0.9887, and 0.9985, proving the effectiveness of ensemble and deep learning approaches for rapid stress prediction. Feature importance analysis revealed S22 transverse stress as the dominant predictor with approximately 80% importance in Random Forest, showing that controlling transverse stress through impact velocity and particle trajectory is critical for process optimization.
Google Gemini generative AI provided comprehensive engineering insights beyond numerical predictions. The AI analysis confirmed successful deposition through multiple mechanisms including adiabatic shear instability, oxide layer disruption, and metallurgical bonding at nascent surfaces. Process optimization recommendations focused on maintaining the current velocity window while exploring particle size distribution refinement, substrate preparation optimization, and post-deposition stress mitigation strategies. Quality control measures including in-situ monitoring, microstructural characterization, and ML-assisted defect detection were proposed for industrial implementation.
This dual AI framework combining predictive machine learning with interpretive generative AI offers a new approach to cold spray process development. The accurate stress predictions enable rapid parametric exploration without time-consuming FEA reanalysis, while AI-generated insights help with intelligent decision-making for process optimization. The methodology can scale to complex industrial scenarios and provides a foundation for smart manufacturing integration. Future work will extend to multi-particle impact simulations, microstructural evolution modeling, experimental validation campaigns, and development of fatigue and corrosion performance predictors, ultimately enabling autonomous optimization of cold spray deposition for aerospace, automotive, and additive manufacturing applications.
References
- Wu, P.; Kardani, A.; Liu, M.; Lin, Z.; Bagherifard, S. Exploring the bonding mechanism in cold spray deposition of engineered graphene nanoplates-Ni nanocomposite powder. Composites Part A: Applied Science and Manufacturing 2025, 191, 108741. [Google Scholar] [CrossRef]
- Champagne, V.; Helfritch, D. The unique abilities of cold spray deposition. International Materials Reviews 2016, 61(7), 437–455. [Google Scholar] [CrossRef]
- Jose, S.A.; Kasar, A.K.; Menezes, P.L. Cold spray deposition of cermets: insights into bonding mechanism and critical parameters. The International Journal of Advanced Manufacturing Technology 2024, 133(1), 1–23. [Google Scholar] [CrossRef]
- Wei, J.; Aghasibeig, M.; Lyu, T.; Liu, Z.; Chen, H.; Irissou, E.; Zou, Y. Cold spray deposition and microstructure characterization of CuNi, CuSn, and CuNiSiCr coatings. Surface and Coatings Technology 2024, 480, 130621. [Google Scholar] [CrossRef]
- Falco, R.; Bagherifard, S. Cold spray additive manufacturing: A review of shape control challenges and solutions. Journal of Thermal Spray Technology 2025, 1–19. [Google Scholar] [CrossRef]
- Li, W.; Huang, F.; Liu, S.; Wu, H.; Chu, X.; Xie, Y.; Deng, C.; Verdy, C.; Deng, S. Hybrid cold spray additive-subtractive manufacturing with adaptive path planning for autonomous repair of complex geometrical defects. Journal of Manufacturing Processes 2025, 152, 1037–1050. [Google Scholar] [CrossRef]
- Dayı, S.C.; Kılıçay, K. Repairing Al7075 surface using cold spray technology with different metal/ceramic powders. Surface and Coatings Technology 2024, 489, 131124. [Google Scholar] [CrossRef]
- Prashar, G.; Vasudev, H. Cold Spray: A Sustainable Approach in Industry for Repairing Applications. In Advanced Manufacturing Processes; CRC Press, 2025; pp. 26–36. [Google Scholar]
- Wang, Y.; Wong, B.C.; Chan, T.M.; Voyle, R. Towards Strength–Ductility Synergy in Cold Spray for Manufacturing and Repair Application: A Review. Processes 2024, 12(10), 2216. [Google Scholar] [CrossRef]
- Tan, K. Numerical Study on Simulating the Deposition Process of Cold Spray Multi-Particle Al-6061 based on CEL Method. Mechanics and Advanced Technologies 2024, 8(1 (100)), 23–29. [Google Scholar] [CrossRef]
- Tan, K.; Hu, W.; Shorinov, O.; Wang, Y. Simulating multi-particle deposition based on CEL method: studing the effects of particle and substrate temperature on deposition. Aerospace Technic and Technology 2024, (1), 64–75. [Google Scholar] [CrossRef]
- Badaloo, A.; Faizan-Ur-Rab, M.; Zahiri, S.H.; Masood, S.H.; Palanisamy, S. Assessment of current capabilities for cost effective digital deposition of cold spray additive structures: a review. The International Journal of Advanced Manufacturing Technology 2025, 1–28. [Google Scholar] [CrossRef]
- Liu, Z.; Liu, J.; Li, H.; Wu, Z.; Zhong, Y.; Ramachandran, C.S.; Cheng, Y.; Wang, Q. Research Progress on Numerical Simulation of the Deposition and Deformation Behavior of Cold Spray Particles. Coatings 2024, 14(7), 913. [Google Scholar] [CrossRef]
- Terrone, M.; Lordejani, A.A.; Kondas, J.; Bagherifard, S. A numerical approach to design and develop freestanding porous structures through cold spray multi-material deposition. Surface and Coatings Technology 2021, 421, 127423. [Google Scholar] [CrossRef]
- Abubakar, A.A. A hybrid computational approach for modeling cold spray deposition. Engineering Science and Technology, an International Journal 2023, 48, 101579. [Google Scholar] [CrossRef]
- Hamrani, A.; Medarametla, A.; John, D.; Agarwal, A. Machine-Learning-Driven Optimization of Cold Spray Process Parameters: Robust Inverse Analysis for Higher Deposition Efficiency. Coatings 2024, 15(1), 12. [Google Scholar] [CrossRef]
- Savangouder, R.V.; Patra, J.C.; Palanisamy, S. A machine learning technique for prediction of cold spray additive manufacturing input process parameters to achieve a desired spray deposit profile. IEEE Transactions on Industrial Informatics 2024, 20(10), 12275–12283. [Google Scholar] [CrossRef]
- Jose, S.A.; Kasar, A.K.; Menezes, P.L. Cold spray deposition of cermets: insights into bonding mechanism and critical parameters. The International Journal of Advanced Manufacturing Technology 2024, 133(1), 1–23. [Google Scholar] [CrossRef]
Figure 1.
Comparison of Lagrangian and Eulerian mesh descriptions for material deformation. (a) Lagrangian description showing mesh deformation with material movement. The initial mesh (thin blue lines) and deformed mesh (thick blue lines) move with the material points (red circles), demonstrating how computational nodes follow material displacement, (b) Eulerian description with a fixed computational mesh through which material flows. Material points (colored circles) move through stationary grid elements (blue lines), with arrows indicating velocity vectors and color mapping representing velocity magnitude. The fixed mesh remains unchanged while material properties are tracked at each grid location.
Figure 1.
Comparison of Lagrangian and Eulerian mesh descriptions for material deformation. (a) Lagrangian description showing mesh deformation with material movement. The initial mesh (thin blue lines) and deformed mesh (thick blue lines) move with the material points (red circles), demonstrating how computational nodes follow material displacement, (b) Eulerian description with a fixed computational mesh through which material flows. Material points (colored circles) move through stationary grid elements (blue lines), with arrows indicating velocity vectors and color mapping representing velocity magnitude. The fixed mesh remains unchanged while material properties are tracked at each grid location.
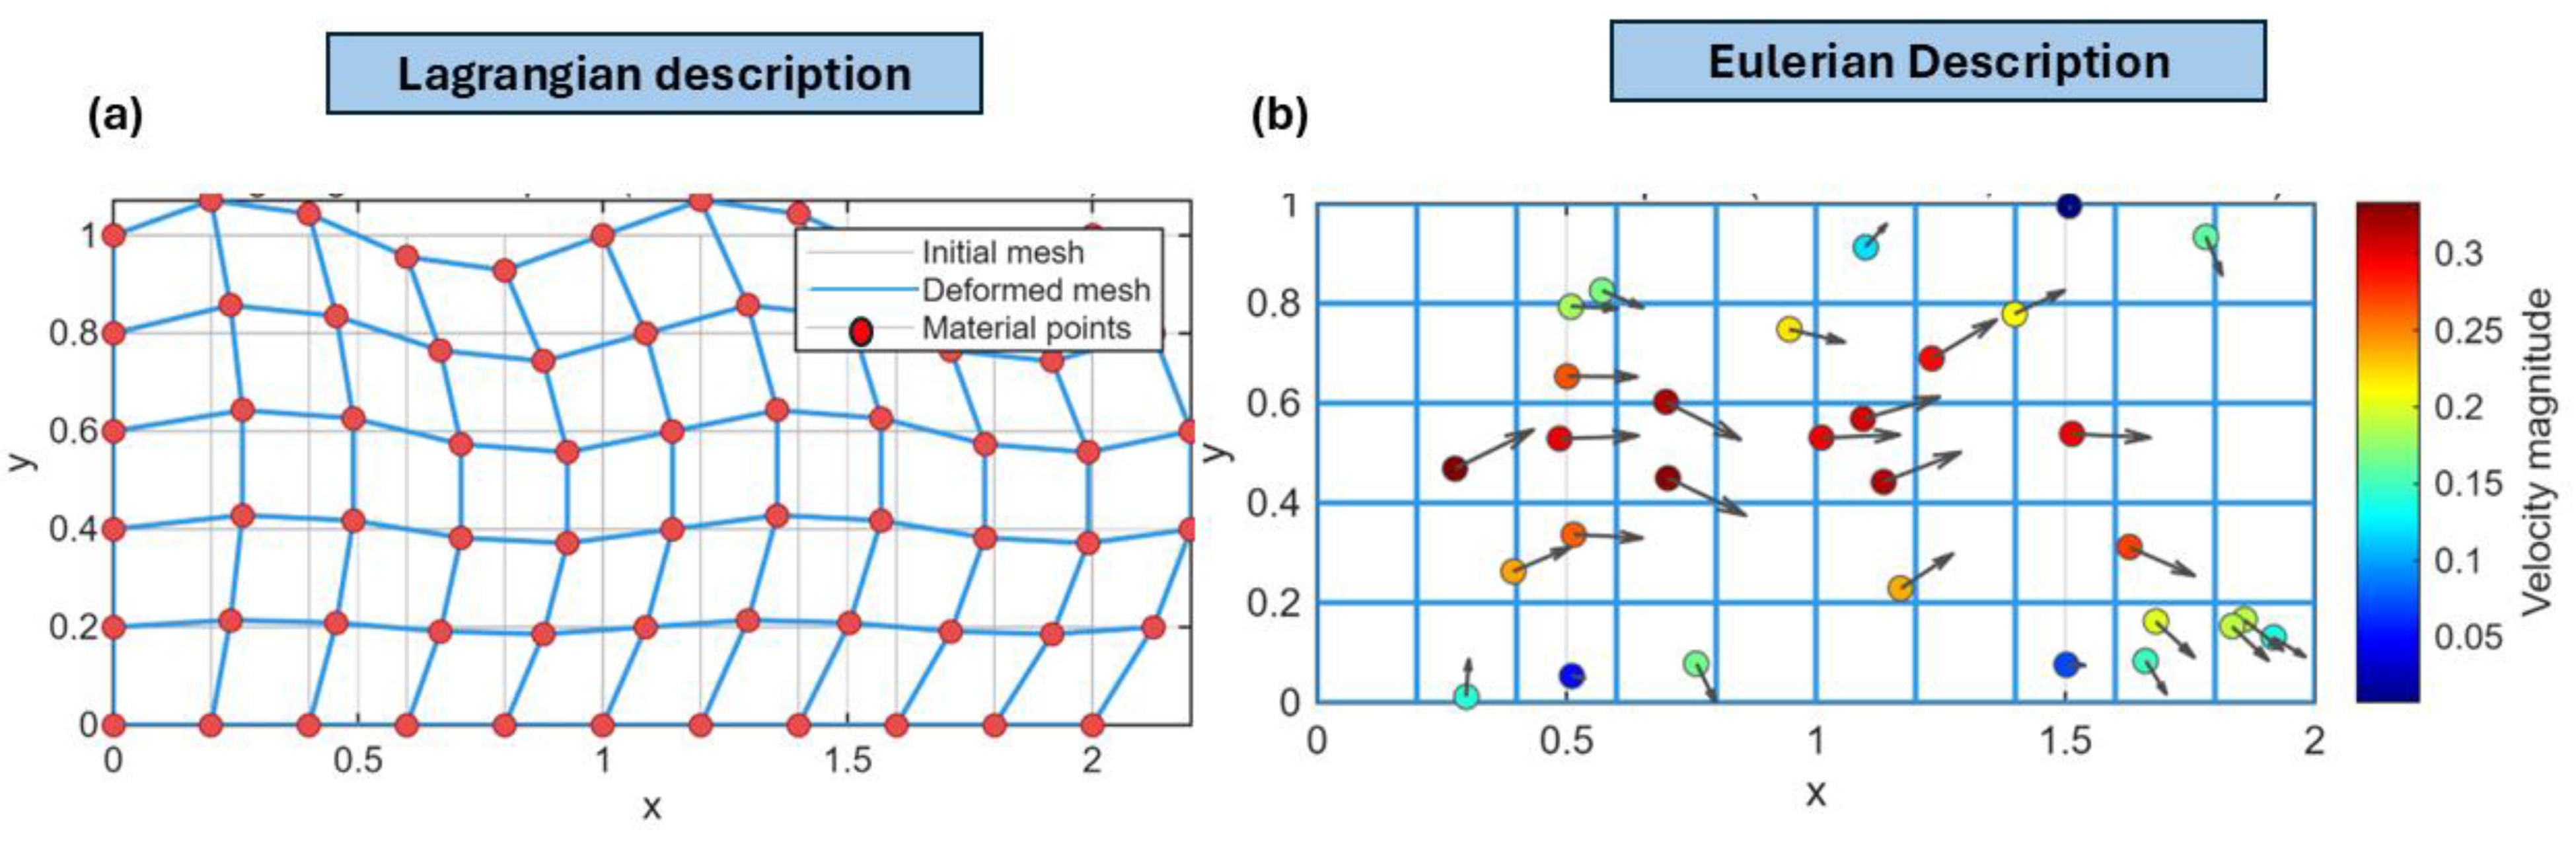
Figure 2.
Conservation of mass in the Coupled Eulerian-Lagrangian (CEL) framework. (a) Density distribution and velocity field at t = 0.0 s showing initial material configuration with density ranging from 0.7 to 1.3 kg/m³ and velocity vectors (white arrows) indicating flow direction through the fixed Eulerian mesh, (b) Material advection at t = 0.5 s demonstrating the continuity equation ∂ρ/∂t + ∇·(ρv) = 0, where density patterns evolve while conserving total mass as material flows through the computational domain, (c) Density field at t = 1.0 s showing continued temporal evolution of the density distribution with maintained mass conservation as high-density regions (yellow, ~1.3 kg/m³) and low-density regions (blue, ~0.7 kg/m³) advect through the mesh, and (d) Final state at t = 1.5 s illustrating complete mass conservation throughout the simulation, with density patterns and velocity vectors demonstrating consistent material transport through the stationary Eulerian grid while satisfying the continuity equation.
Figure 2.
Conservation of mass in the Coupled Eulerian-Lagrangian (CEL) framework. (a) Density distribution and velocity field at t = 0.0 s showing initial material configuration with density ranging from 0.7 to 1.3 kg/m³ and velocity vectors (white arrows) indicating flow direction through the fixed Eulerian mesh, (b) Material advection at t = 0.5 s demonstrating the continuity equation ∂ρ/∂t + ∇·(ρv) = 0, where density patterns evolve while conserving total mass as material flows through the computational domain, (c) Density field at t = 1.0 s showing continued temporal evolution of the density distribution with maintained mass conservation as high-density regions (yellow, ~1.3 kg/m³) and low-density regions (blue, ~0.7 kg/m³) advect through the mesh, and (d) Final state at t = 1.5 s illustrating complete mass conservation throughout the simulation, with density patterns and velocity vectors demonstrating consistent material transport through the stationary Eulerian grid while satisfying the continuity equation.
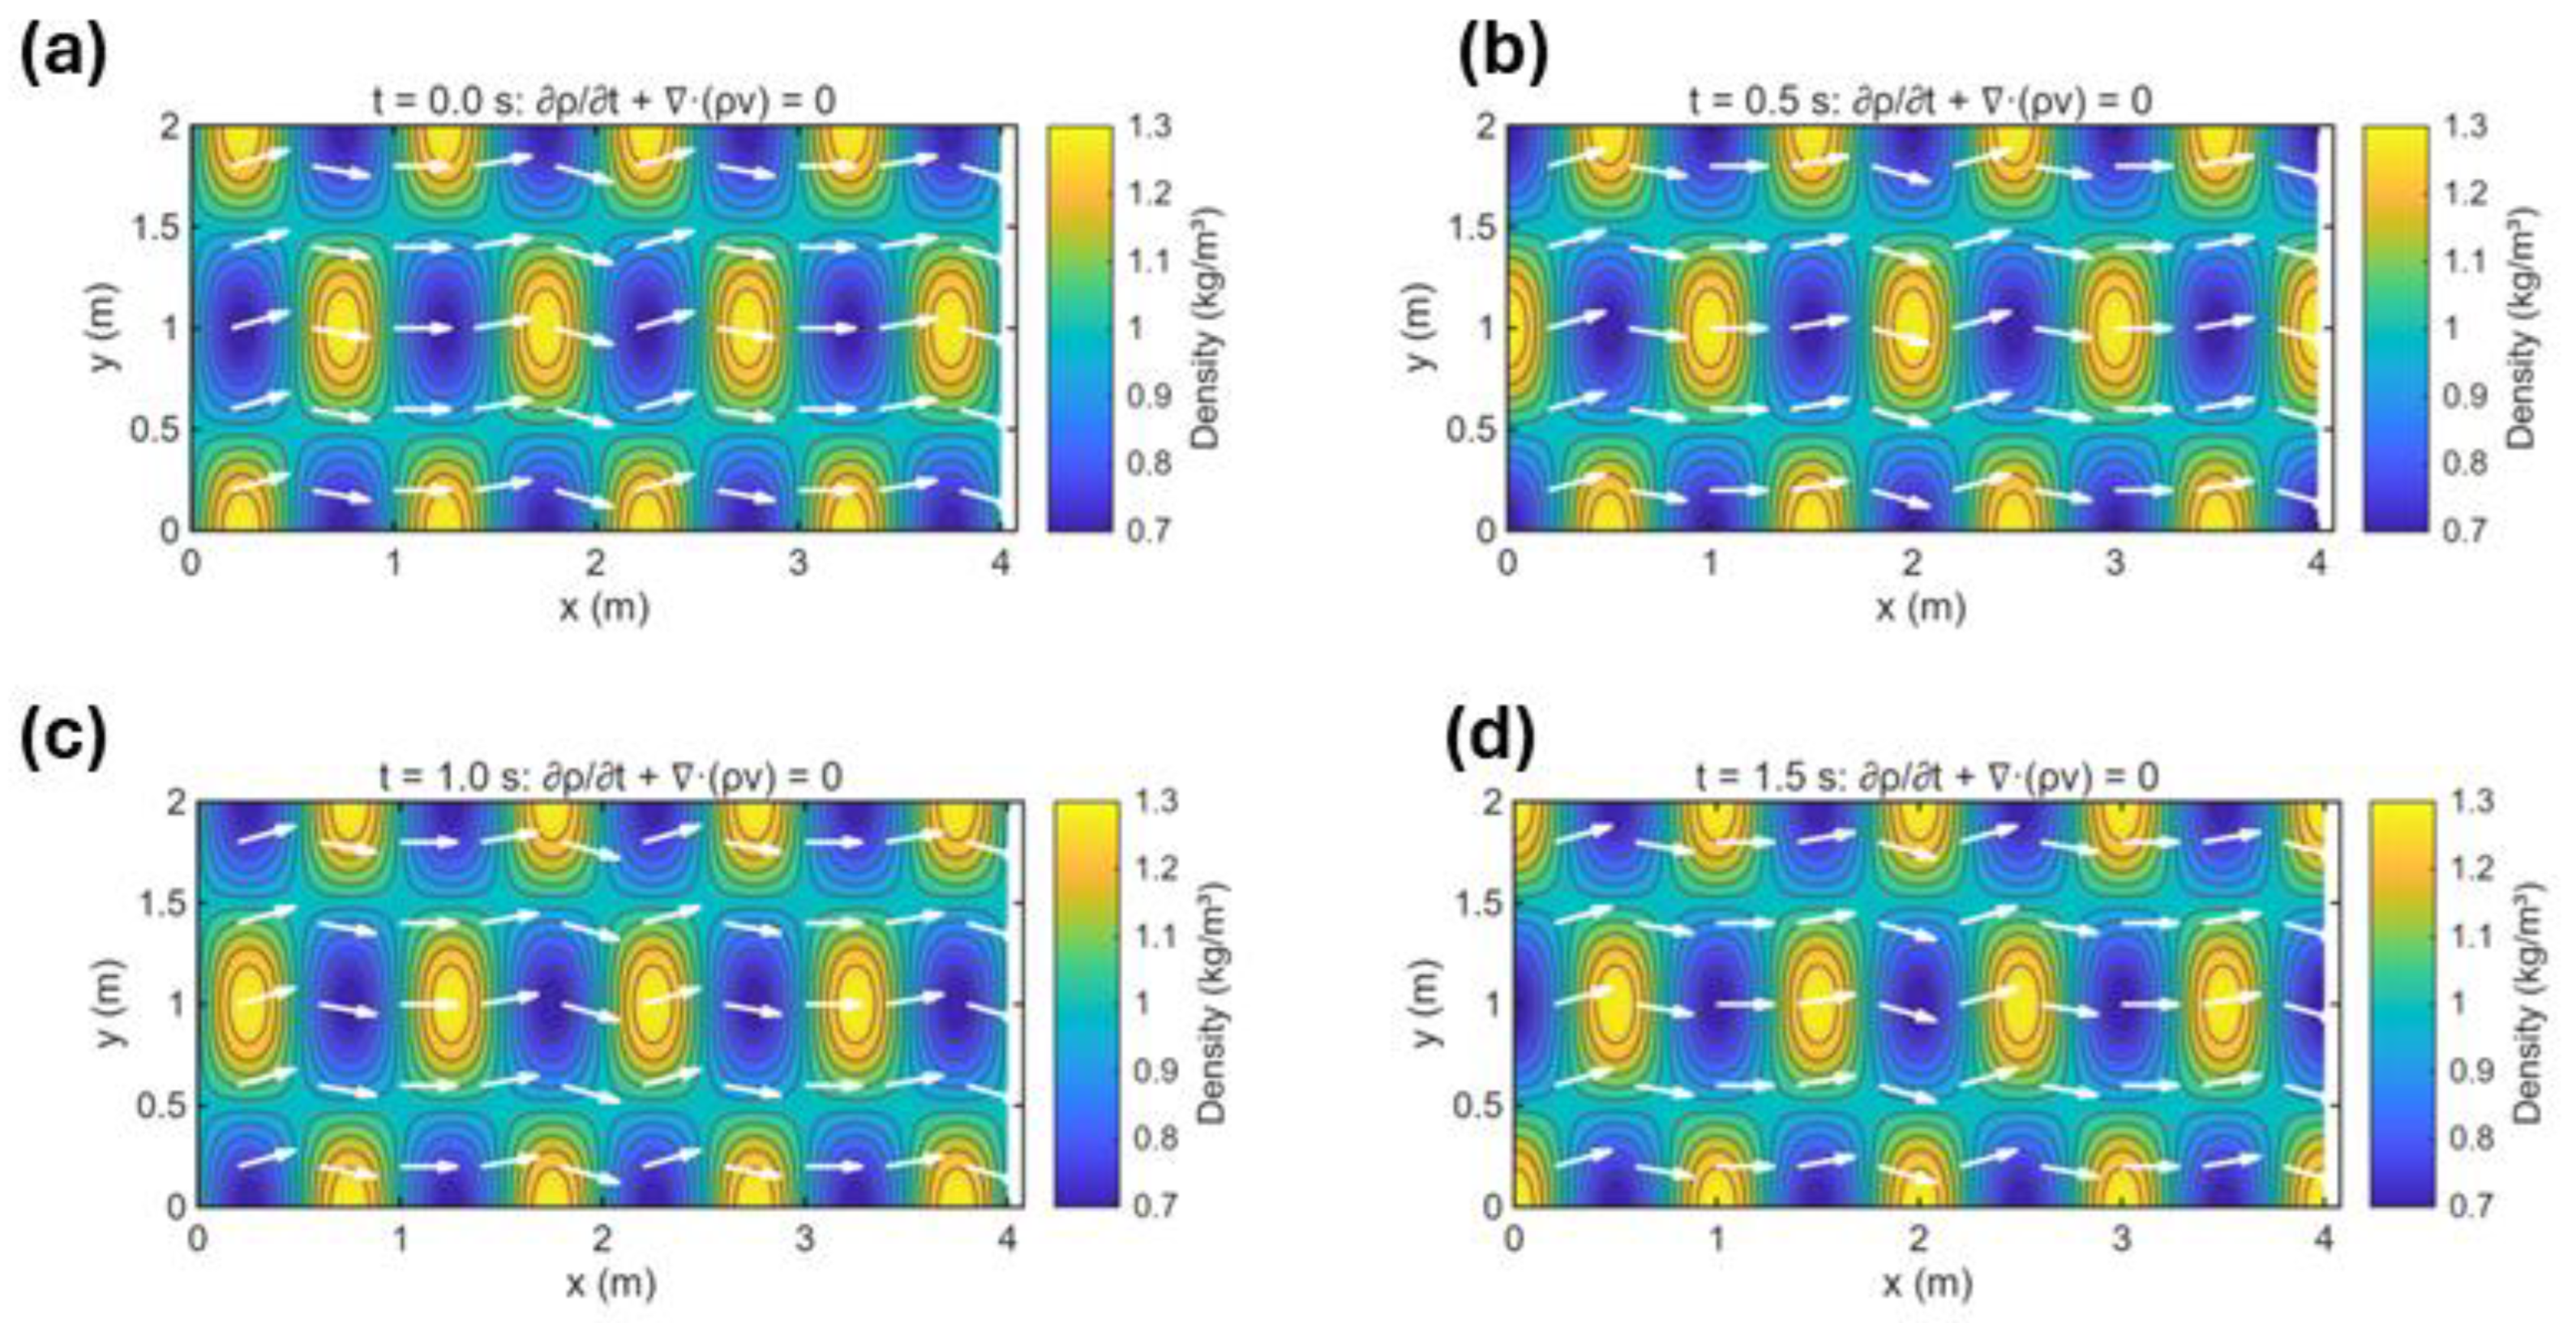
Figure 6.
Eulerian-Lagrangian interface coupling demonstrating bidirectional information transfer between computational domains. (a) CEL interface configuration showing a Lagrangian solid structure (orange circle) embedded within an Eulerian fluid domain (light blue grid) with velocity vectors (blue arrows) indicating the surrounding flow field, where interface conditions enforce traction continuity and velocity compatibility to ensure seamless coupling between the fixed Eulerian mesh and the material-following Lagrangian body as the structure deforms and interacts with the flowing material, and (b) Force and momentum transfer at the interface illustrating contact pressure distribution around the Lagrangian boundary with contact pressure values ranging from 1 to 9 MPa, where normal traction vectors (red arrows pointing outward from Eulerian domain, blue arrows pointing inward toward Lagrangian domain) represent the bidirectional exchange of contact forces, and green markers denote interface nodes where momentum is explicitly transferred between domains to maintain mechanical equilibrium and enable proper fluid-structure interaction throughout the coupled simulation.
Figure 6.
Eulerian-Lagrangian interface coupling demonstrating bidirectional information transfer between computational domains. (a) CEL interface configuration showing a Lagrangian solid structure (orange circle) embedded within an Eulerian fluid domain (light blue grid) with velocity vectors (blue arrows) indicating the surrounding flow field, where interface conditions enforce traction continuity and velocity compatibility to ensure seamless coupling between the fixed Eulerian mesh and the material-following Lagrangian body as the structure deforms and interacts with the flowing material, and (b) Force and momentum transfer at the interface illustrating contact pressure distribution around the Lagrangian boundary with contact pressure values ranging from 1 to 9 MPa, where normal traction vectors (red arrows pointing outward from Eulerian domain, blue arrows pointing inward toward Lagrangian domain) represent the bidirectional exchange of contact forces, and green markers denote interface nodes where momentum is explicitly transferred between domains to maintain mechanical equilibrium and enable proper fluid-structure interaction throughout the coupled simulation.
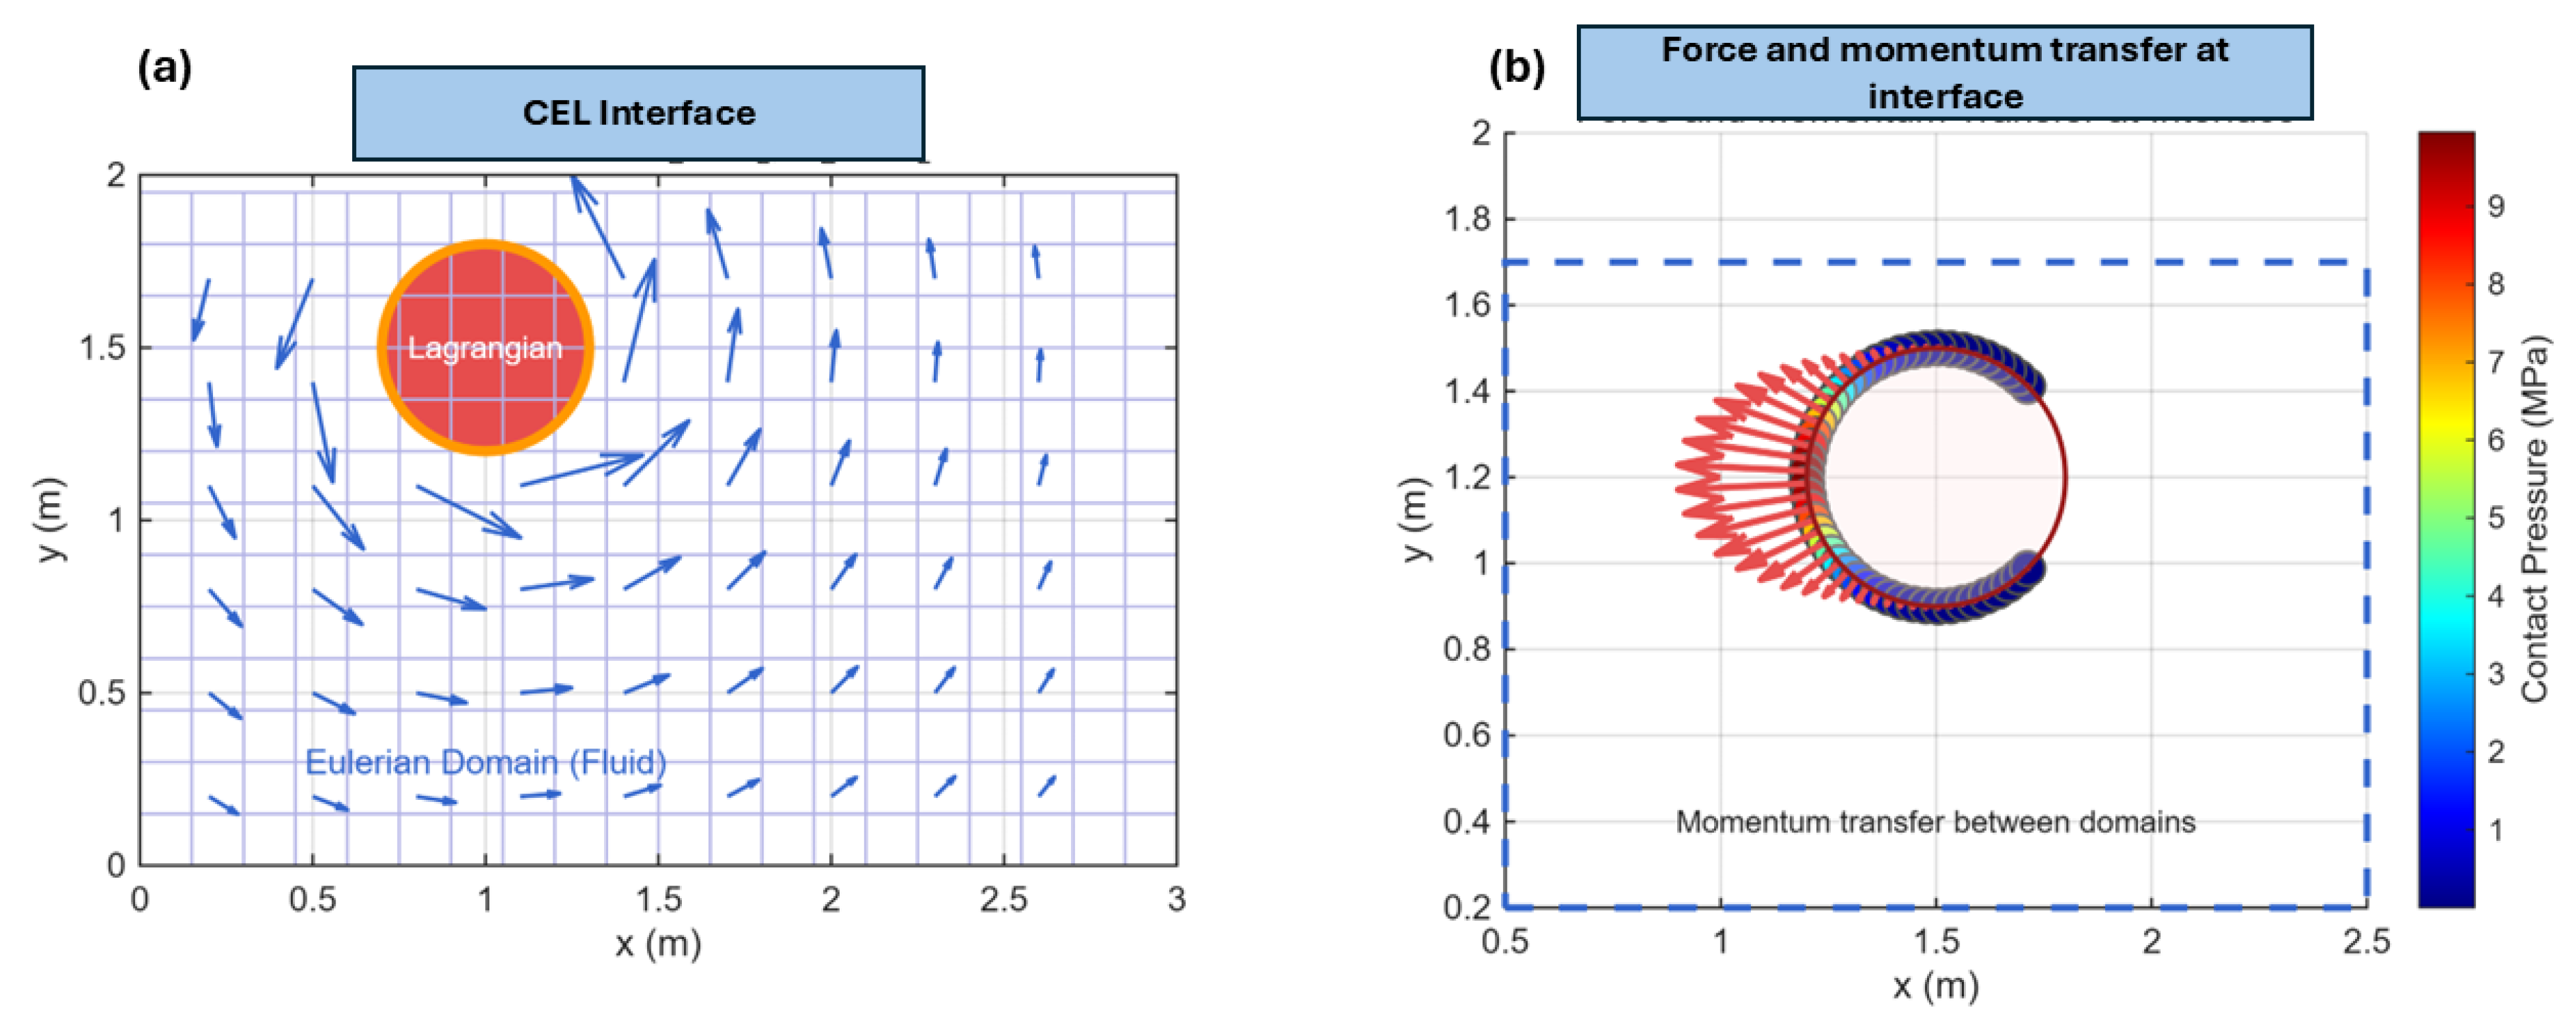
Figure 7.
Methodology workflow integrating computational simulation, predictive machine learning, and generative AI interpretation. Abaqus finite element analysis extracts 134,400 stress data points (left), machine learning models achieve R² > 0.99 for stress prediction (center), and Google Gemini API generates engineering insights for process optimization (right). The framework enables rapid stress field estimation and intelligent decision-making for cold spray deposition development.
Figure 7.
Methodology workflow integrating computational simulation, predictive machine learning, and generative AI interpretation. Abaqus finite element analysis extracts 134,400 stress data points (left), machine learning models achieve R² > 0.99 for stress prediction (center), and Google Gemini API generates engineering insights for process optimization (right). The framework enables rapid stress field estimation and intelligent decision-making for cold spray deposition development.
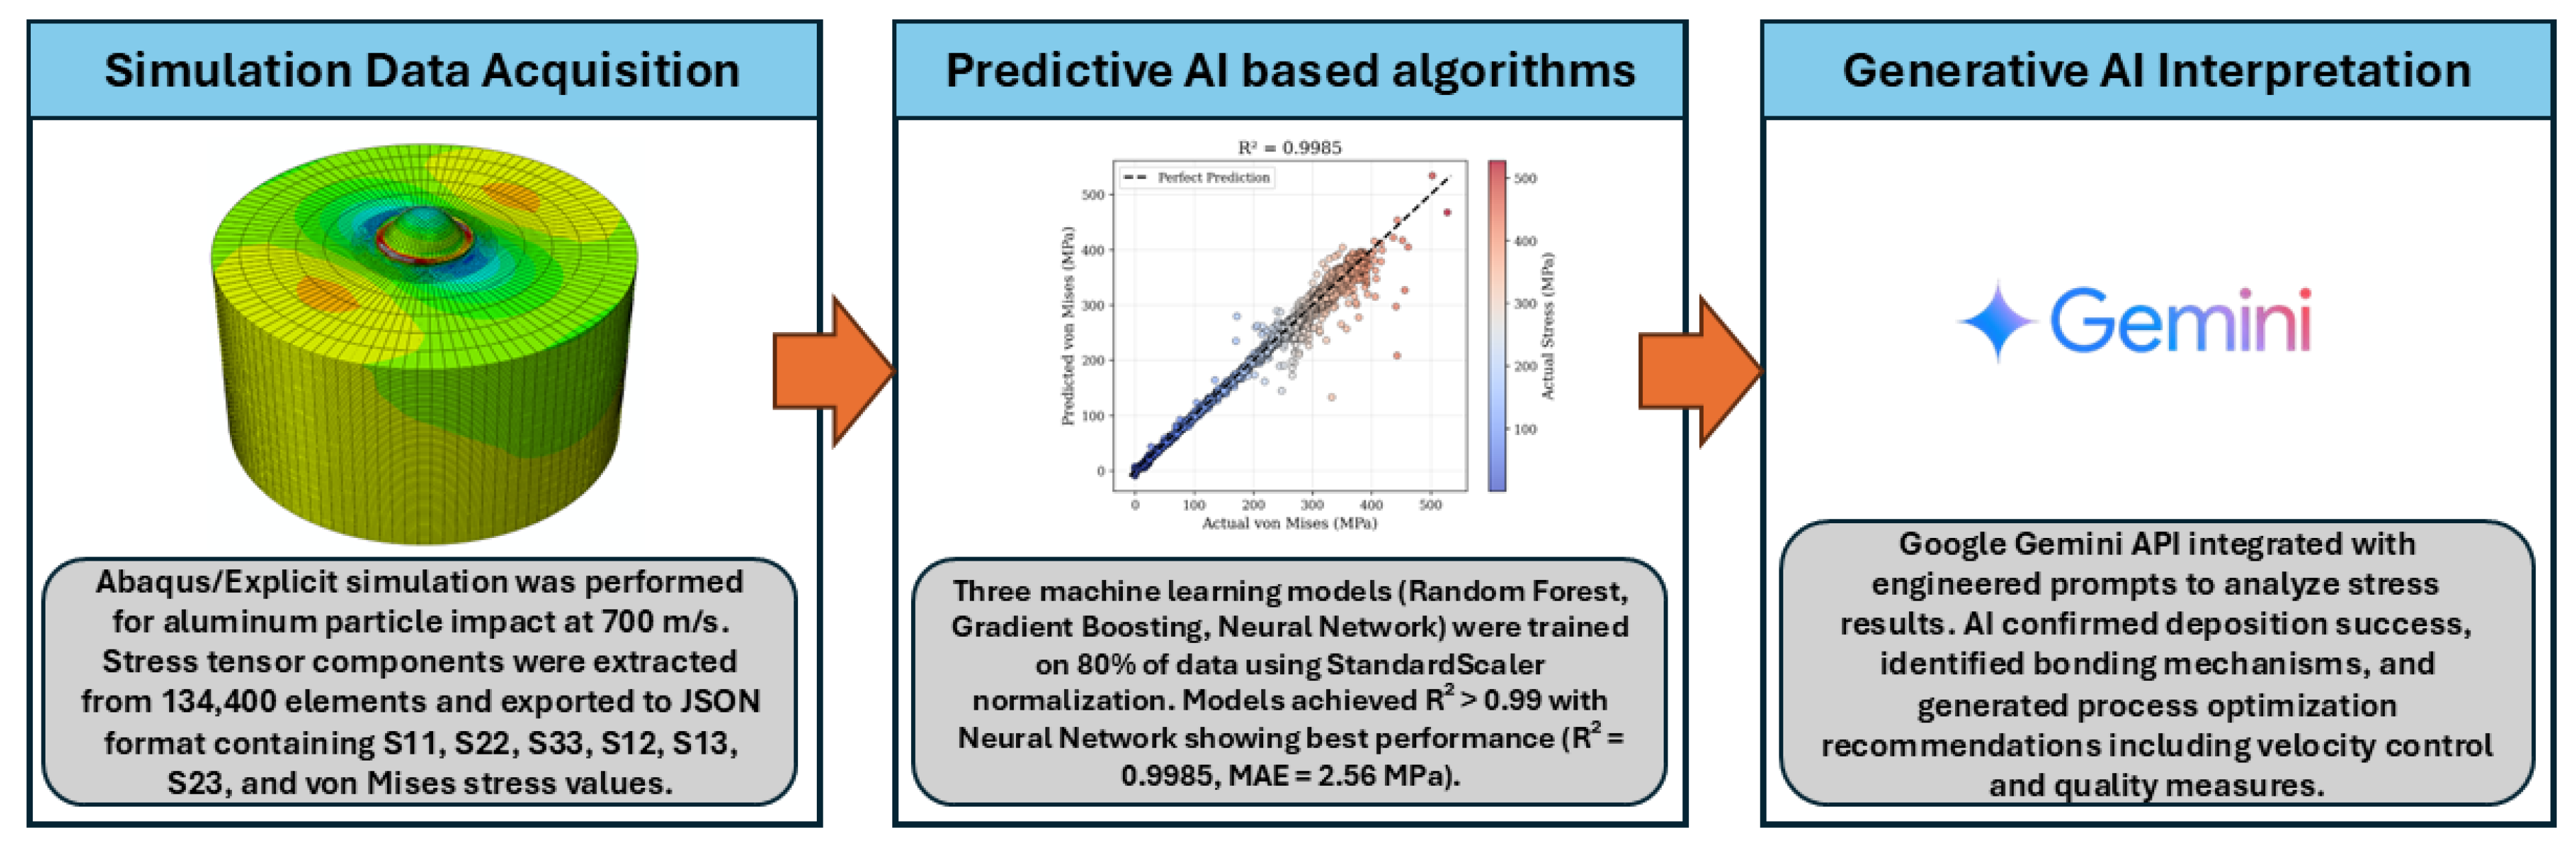
Figure 8.
Finite element analysis showing S11 normal stress component during high-velocity aluminum particle deposition. (Top left) Isometric view of particle and substrate mesh; (Top right) Front cross-section showing stress penetration; (Bottom left) Side cross-section revealing crater formation and stress asymmetry; (Bottom right) Particle stress distribution showing compression core and tensile periphery. Color scale indicates tensile (blue) to compressive (red) stress states. Deformation is shown at actual scale, capturing the penetration depth characteristic of successful cold spray bonding.
Figure 8.
Finite element analysis showing S11 normal stress component during high-velocity aluminum particle deposition. (Top left) Isometric view of particle and substrate mesh; (Top right) Front cross-section showing stress penetration; (Bottom left) Side cross-section revealing crater formation and stress asymmetry; (Bottom right) Particle stress distribution showing compression core and tensile periphery. Color scale indicates tensile (blue) to compressive (red) stress states. Deformation is shown at actual scale, capturing the penetration depth characteristic of successful cold spray bonding.
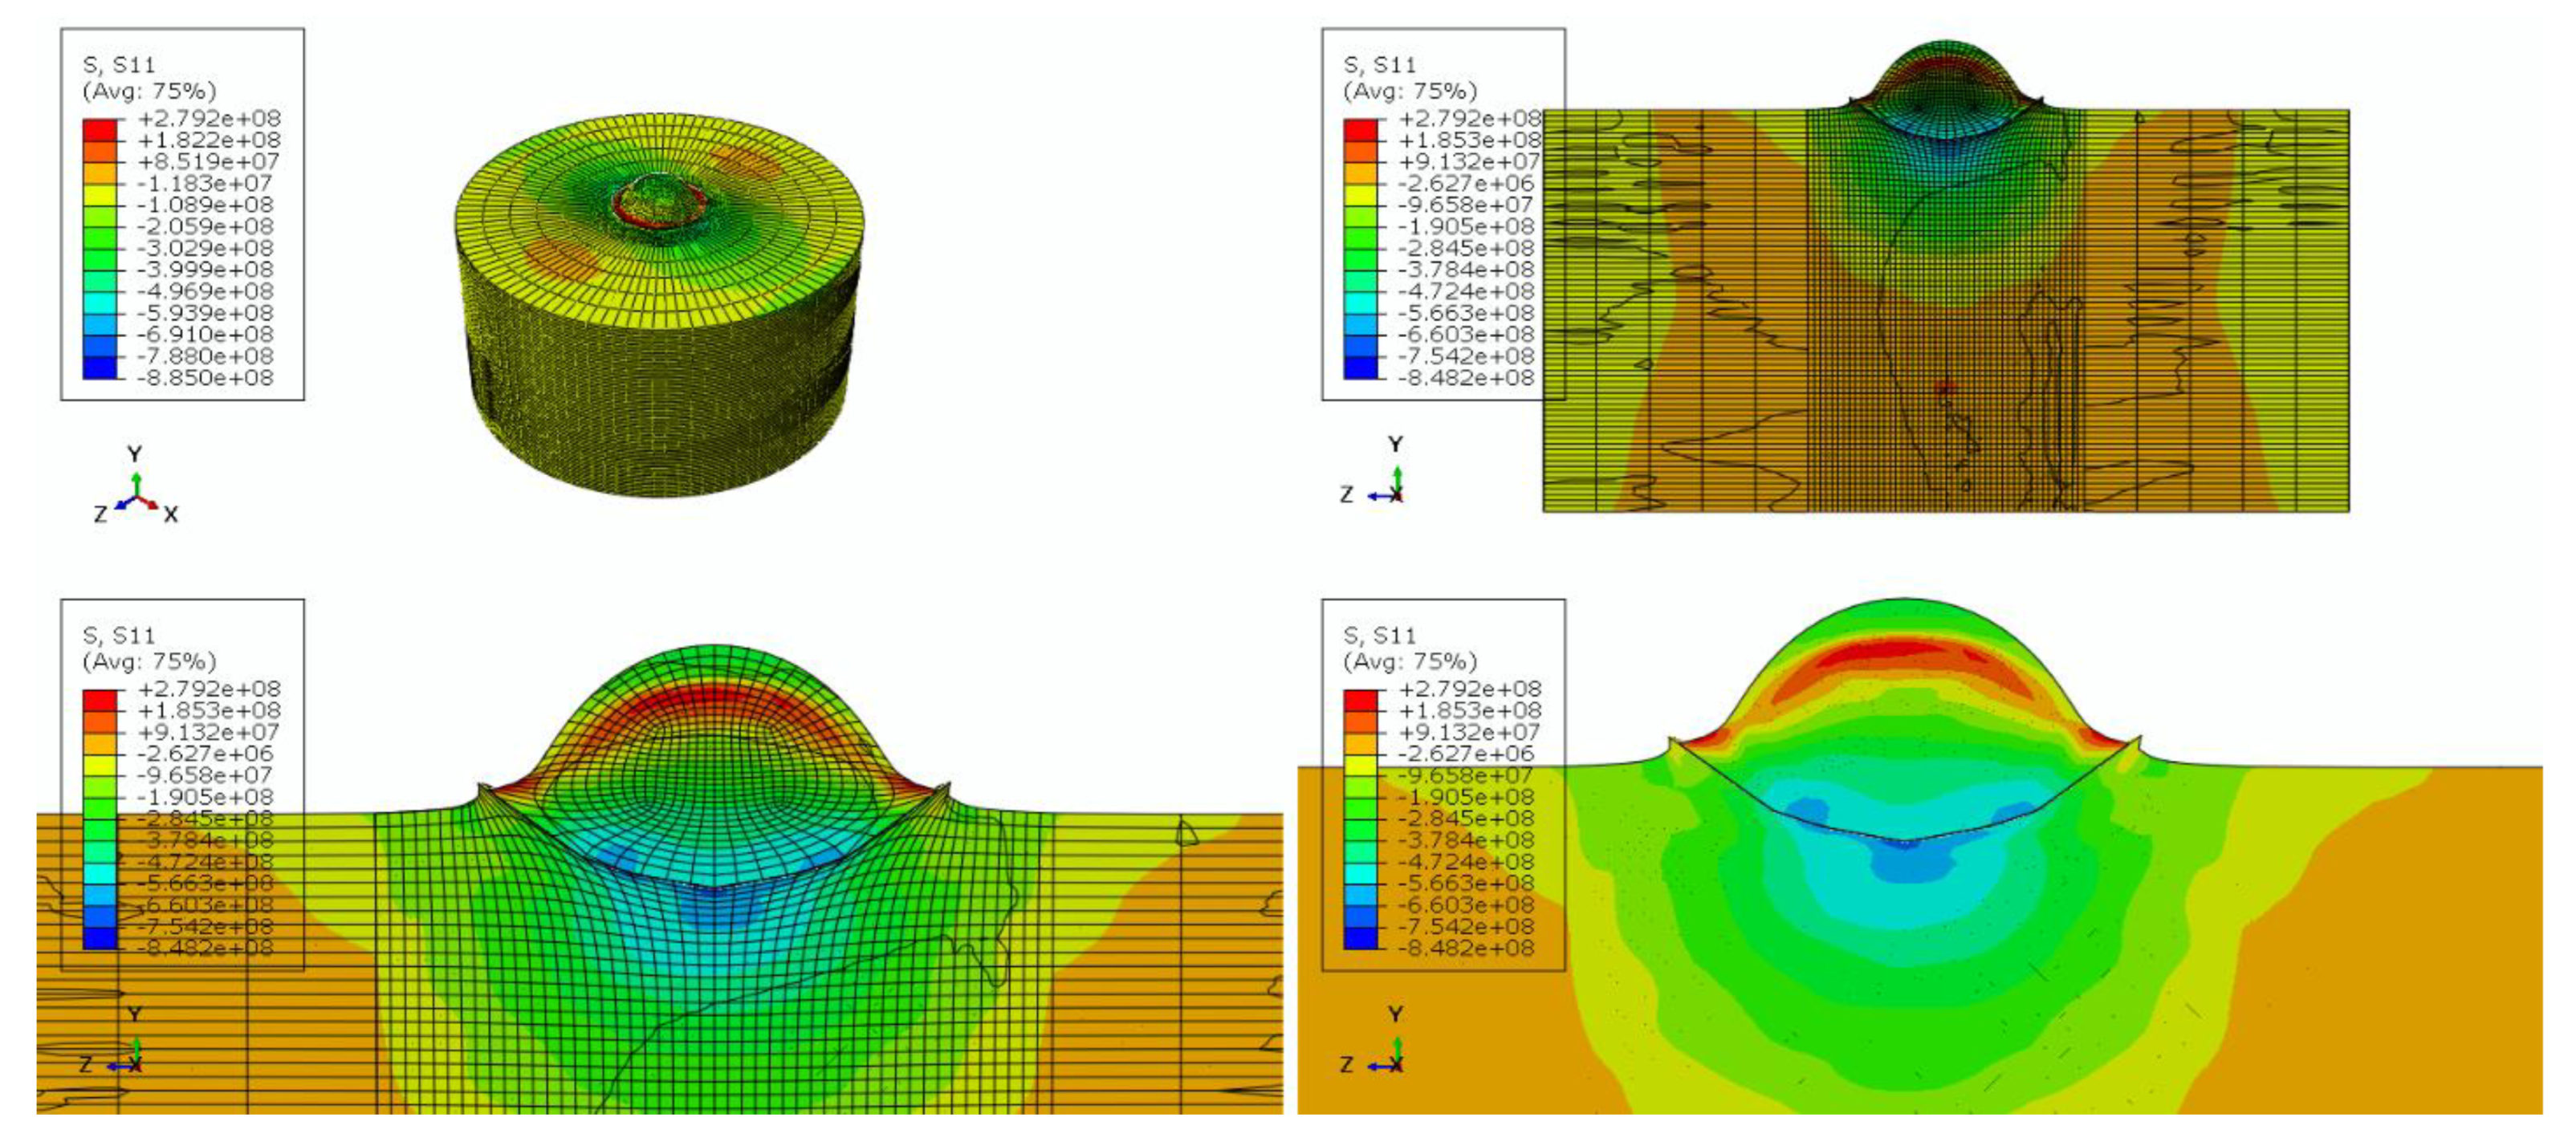
Figure 9.
Finite element analysis showing S22 transverse stress component during high-velocity aluminum particle deposition. (Top left) Isometric view showing substrate compression; (Top right) Front cross-section revealing stress penetration and radial distribution; (Bottom left) Side cross-section displaying hemispherical stress field and particle deformation; (Bottom right) Detailed particle stress distribution showing tensile core surrounded by compressive zones. Color scale indicates tensile (blue) to compressive (red) stress states. The transverse stress field complements the normal stress distribution, contributing to the triaxial stress state essential for cold spray bonding mechanics.
Figure 9.
Finite element analysis showing S22 transverse stress component during high-velocity aluminum particle deposition. (Top left) Isometric view showing substrate compression; (Top right) Front cross-section revealing stress penetration and radial distribution; (Bottom left) Side cross-section displaying hemispherical stress field and particle deformation; (Bottom right) Detailed particle stress distribution showing tensile core surrounded by compressive zones. Color scale indicates tensile (blue) to compressive (red) stress states. The transverse stress field complements the normal stress distribution, contributing to the triaxial stress state essential for cold spray bonding mechanics.
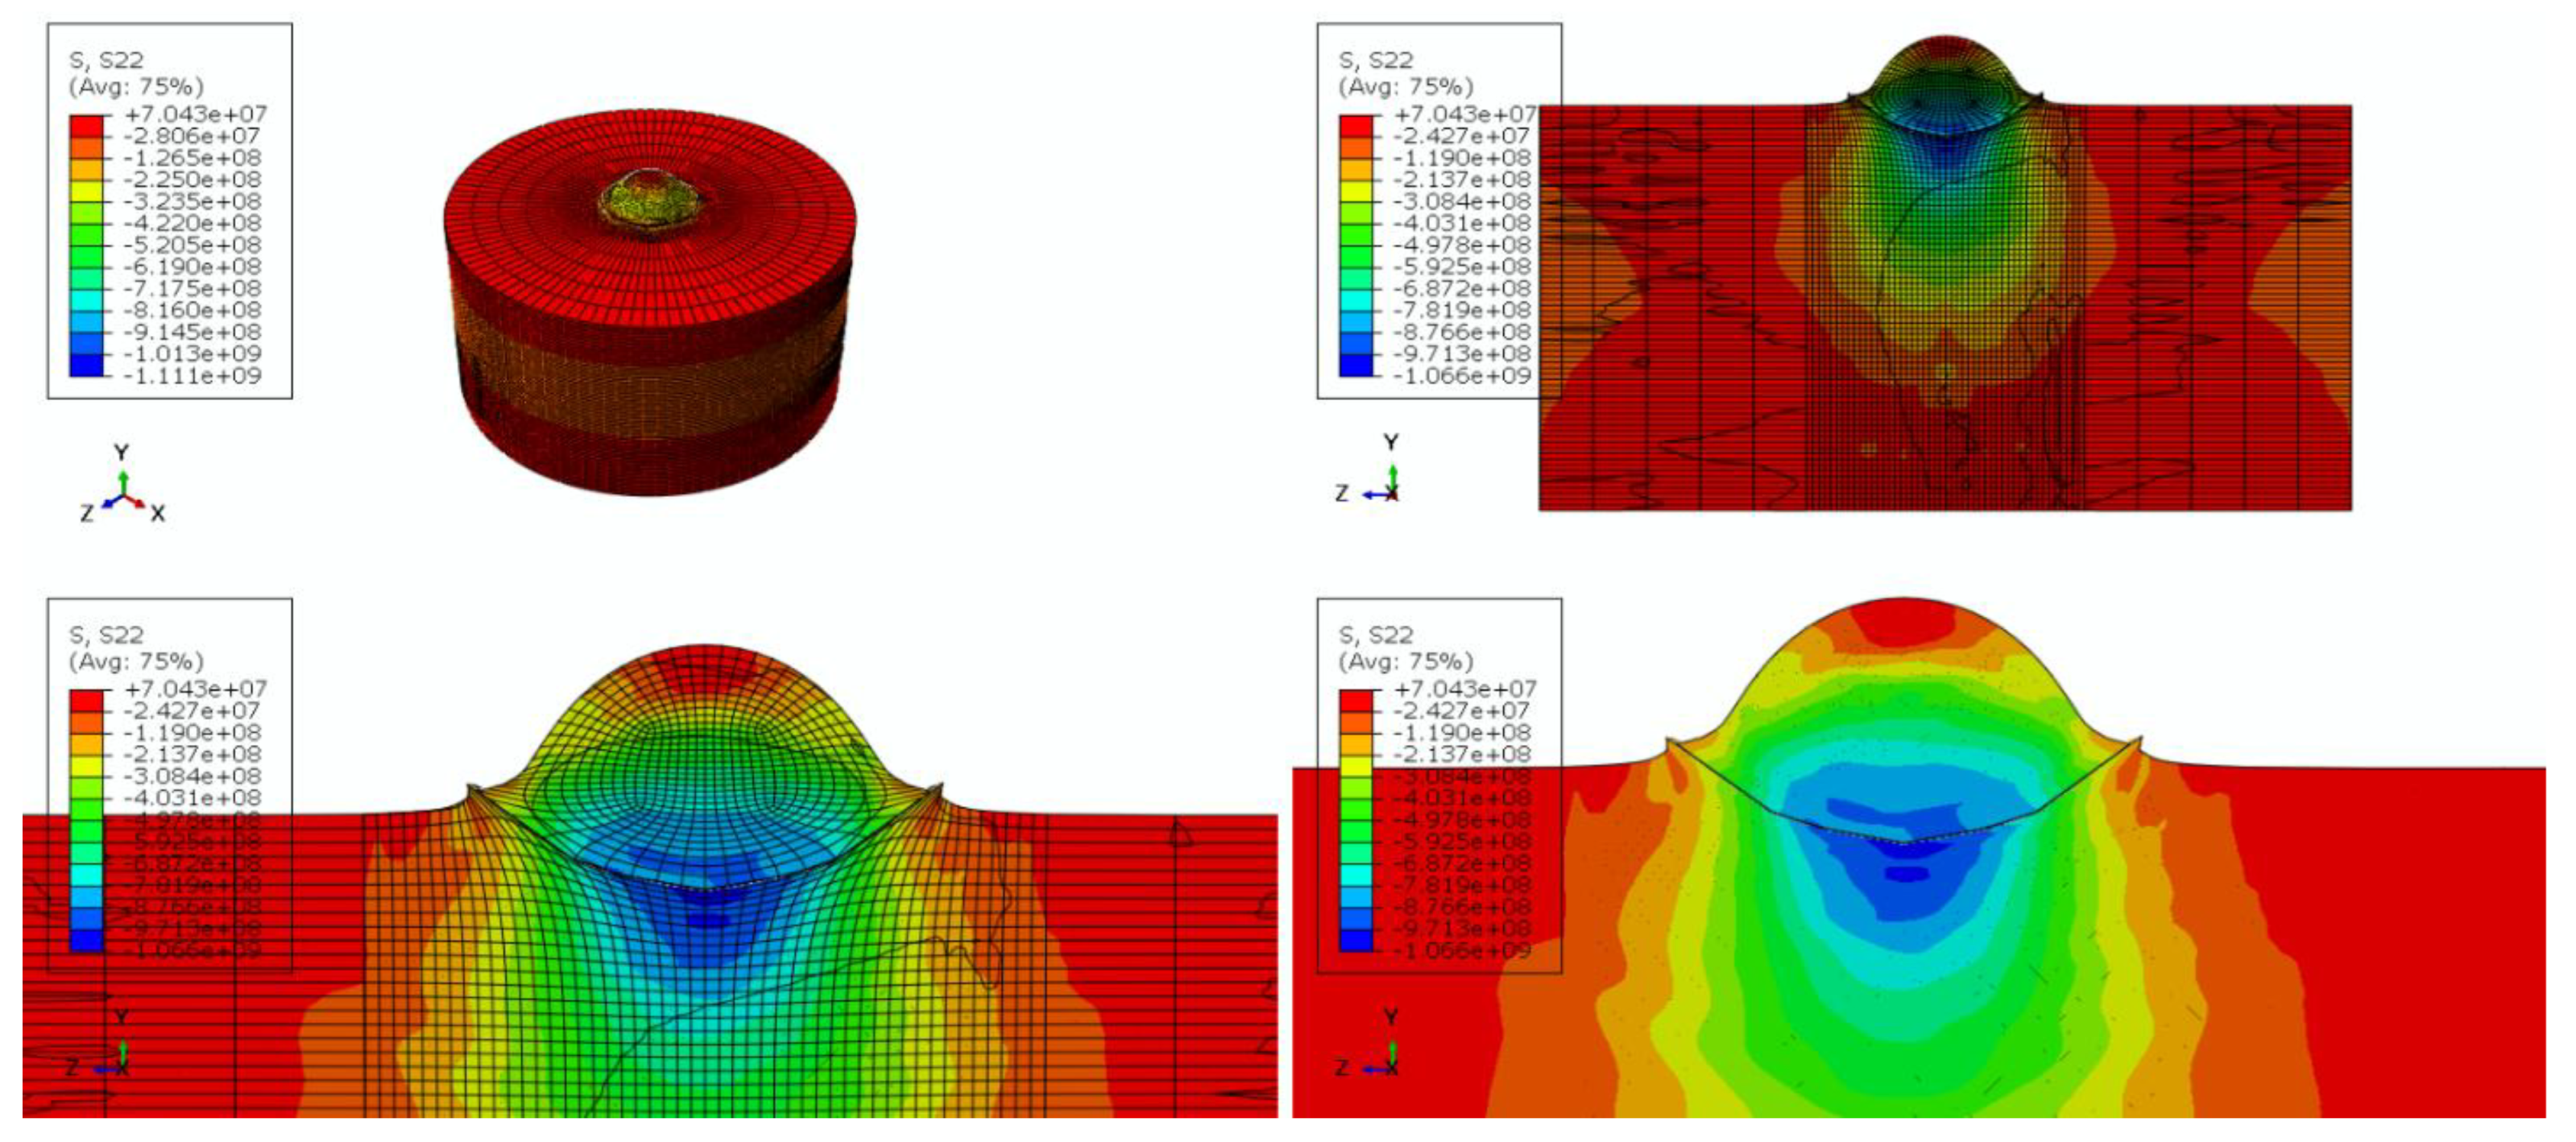
Figure 10.
Finite element analysis showing S33 out-of-plane stress component during high-velocity aluminum particle deposition. (Top left) Isometric view displaying axial compression in the particle; (Top right) Front cross-section showing vertical stress propagation; (Bottom left) Side cross-section revealing symmetric stress distribution and substrate response; (Bottom right) Detailed stress field showing compression in the particle and tension in the substrate beneath the impact zone. Color scale indicates tensile (blue) to compressive (red) stress states. The S33 component captures the axial loading critical for penetration depth and residual stress formation in cold spray coatings.
Figure 10.
Finite element analysis showing S33 out-of-plane stress component during high-velocity aluminum particle deposition. (Top left) Isometric view displaying axial compression in the particle; (Top right) Front cross-section showing vertical stress propagation; (Bottom left) Side cross-section revealing symmetric stress distribution and substrate response; (Bottom right) Detailed stress field showing compression in the particle and tension in the substrate beneath the impact zone. Color scale indicates tensile (blue) to compressive (red) stress states. The S33 component captures the axial loading critical for penetration depth and residual stress formation in cold spray coatings.
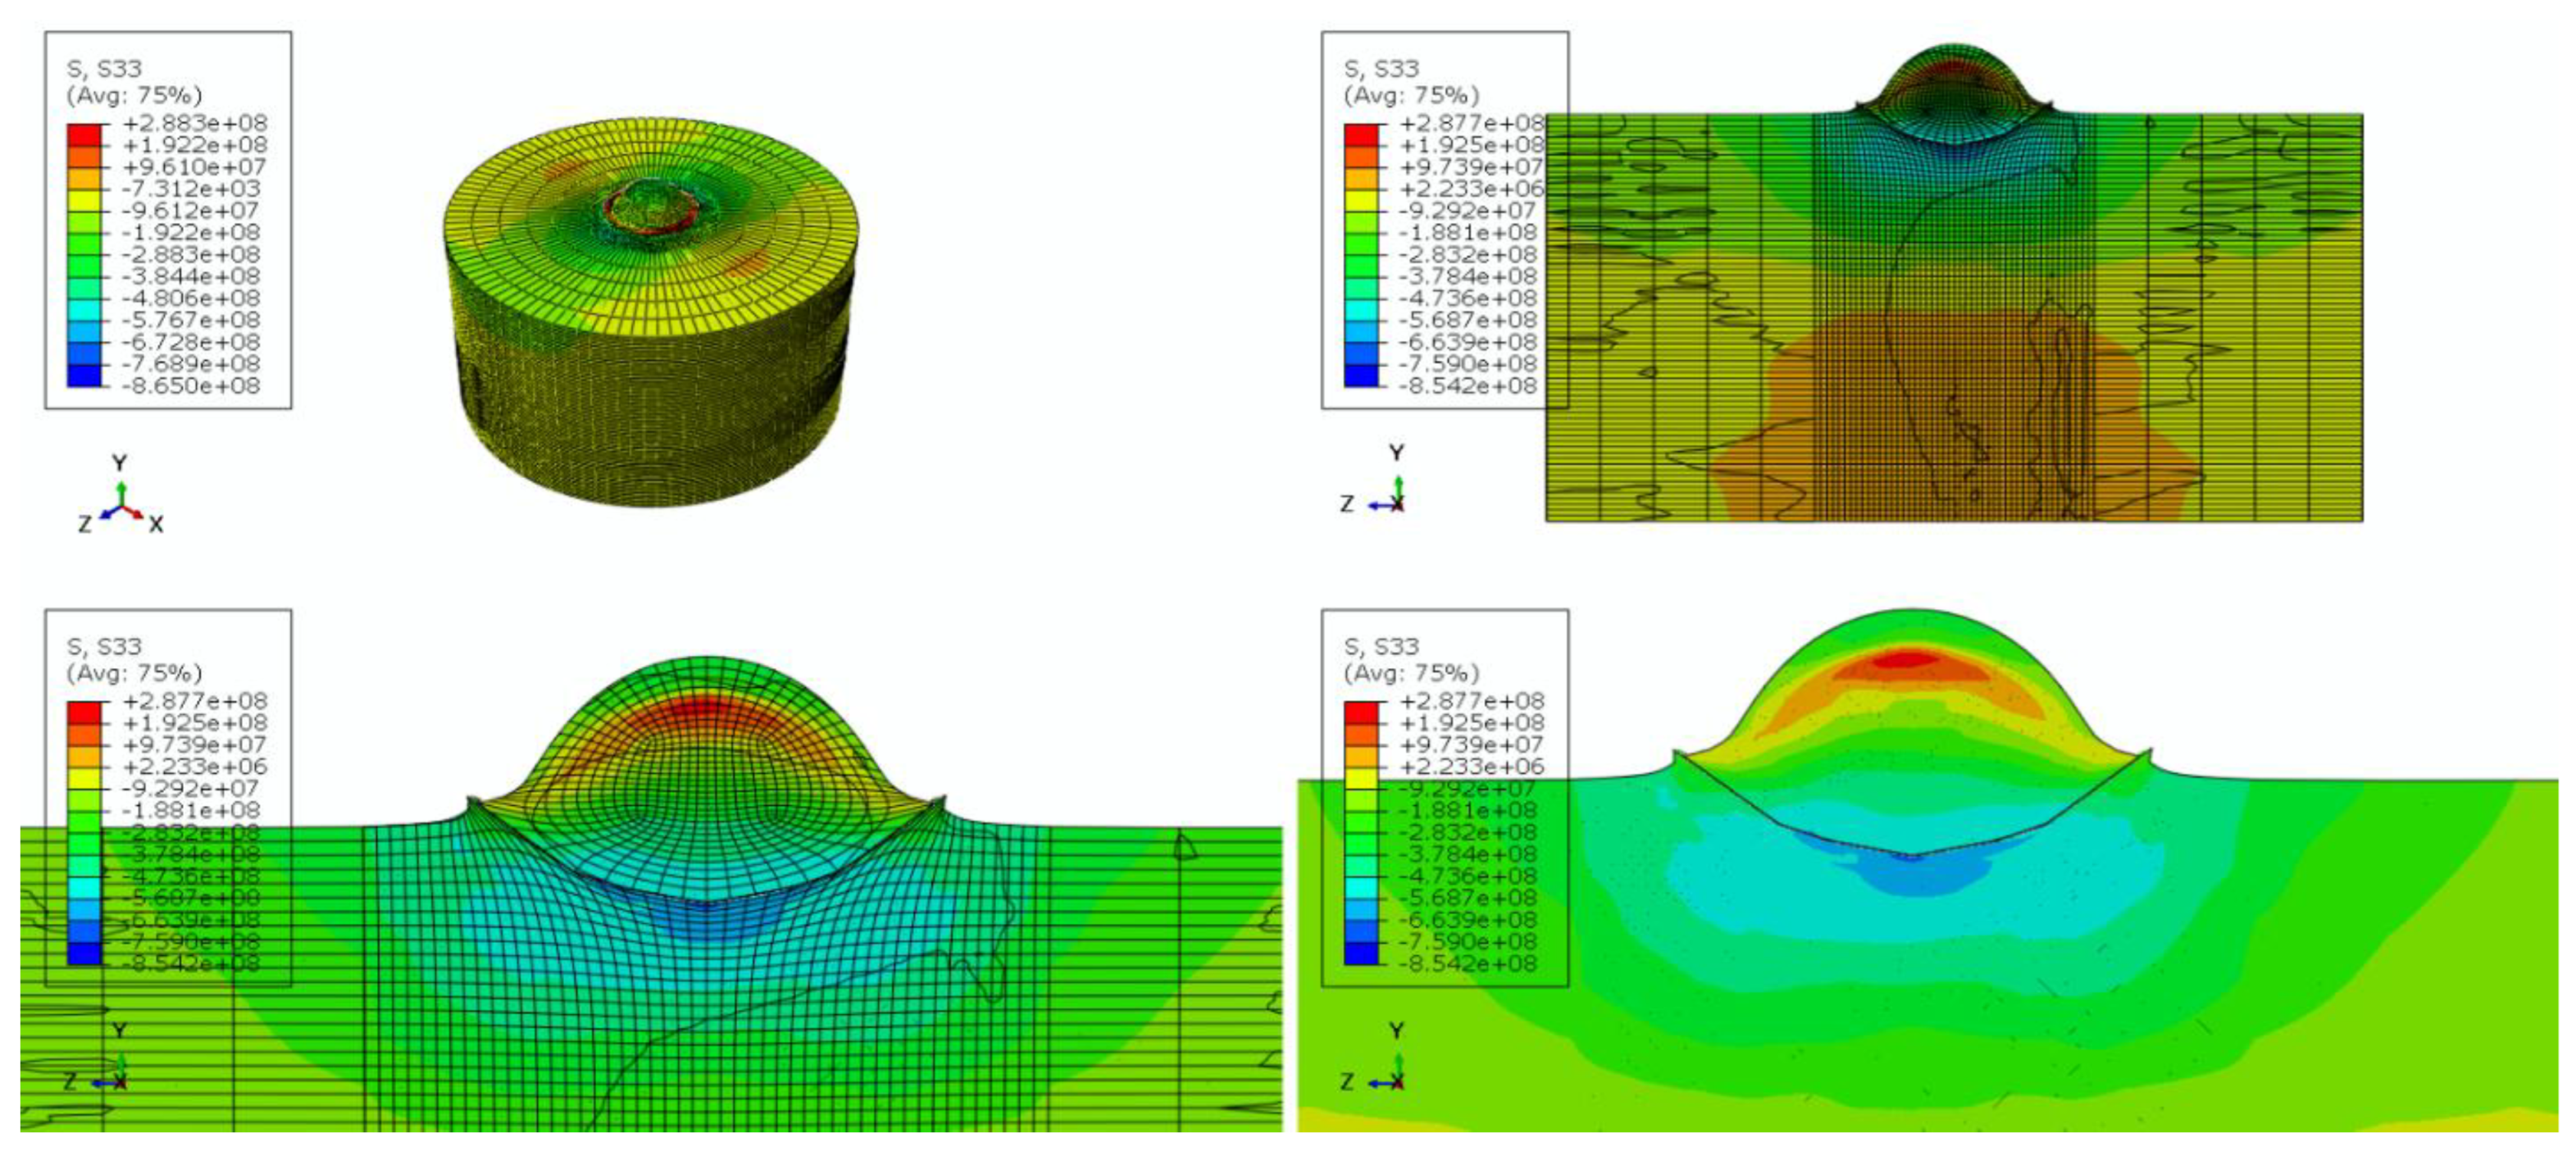
Figure 11.
Finite element analysis showing S12 in-plane shear stress component during high-velocity aluminum particle deposition. (Top left) Isometric view displaying shear band formation; (Top right) Front cross-section revealing radial material flow patterns; (Bottom left) Side cross-section showing shear concentration at the impact periphery and material jetting; (Bottom right) Detailed shear stress distribution illustrating positive (red) and negative (blue) shear zones. The alternating shear patterns indicate rotational material displacement critical for crater formation and mechanical interlocking. This shear component drives the jetting phenomenon essential for cold spray bonding mechanics.
Figure 11.
Finite element analysis showing S12 in-plane shear stress component during high-velocity aluminum particle deposition. (Top left) Isometric view displaying shear band formation; (Top right) Front cross-section revealing radial material flow patterns; (Bottom left) Side cross-section showing shear concentration at the impact periphery and material jetting; (Bottom right) Detailed shear stress distribution illustrating positive (red) and negative (blue) shear zones. The alternating shear patterns indicate rotational material displacement critical for crater formation and mechanical interlocking. This shear component drives the jetting phenomenon essential for cold spray bonding mechanics.
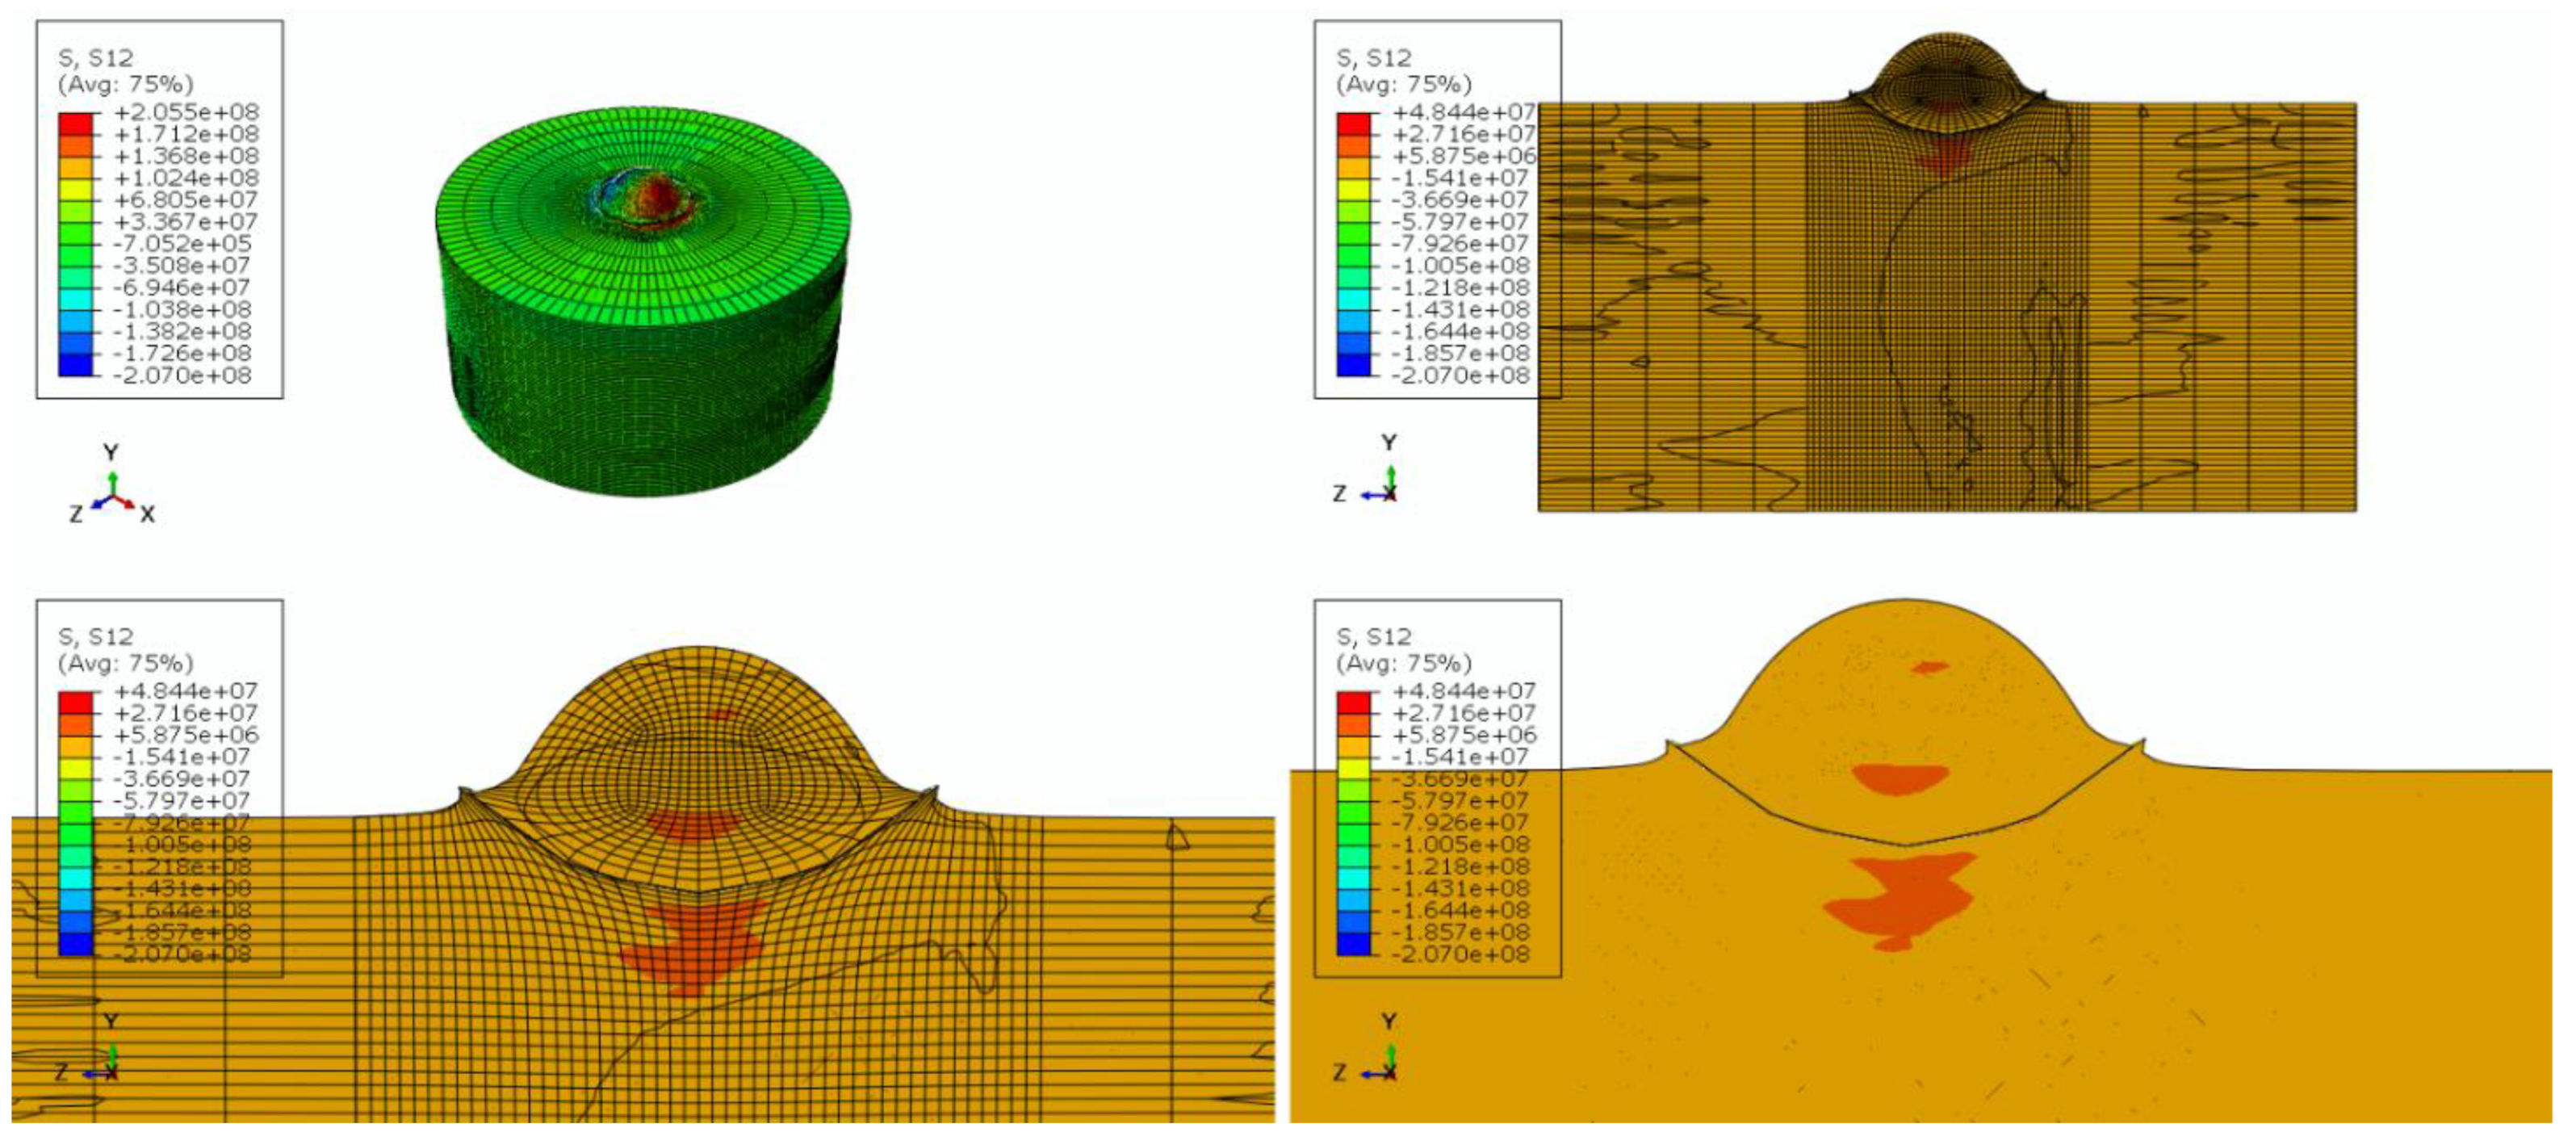
Figure 12.
Finite element analysis showing S23 out-of-plane shear stress component during high-velocity aluminum particle deposition. (Top left) Isometric view displaying complex shear distribution; (Top right) Front cross-section revealing asymmetric shear patterns and vertical material flow; (Bottom left) Side cross-section showing alternating positive (red) and negative (blue) shear lobes characteristic of rotational displacement; (Bottom right) Detailed three-dimensional shear field illustrating material jetting and spiral flow patterns. The S23 component captures the vertical shear mechanisms essential for crater formation, interface mixing, and mechanical interlocking in cold spray bonding.
Figure 12.
Finite element analysis showing S23 out-of-plane shear stress component during high-velocity aluminum particle deposition. (Top left) Isometric view displaying complex shear distribution; (Top right) Front cross-section revealing asymmetric shear patterns and vertical material flow; (Bottom left) Side cross-section showing alternating positive (red) and negative (blue) shear lobes characteristic of rotational displacement; (Bottom right) Detailed three-dimensional shear field illustrating material jetting and spiral flow patterns. The S23 component captures the vertical shear mechanisms essential for crater formation, interface mixing, and mechanical interlocking in cold spray bonding.
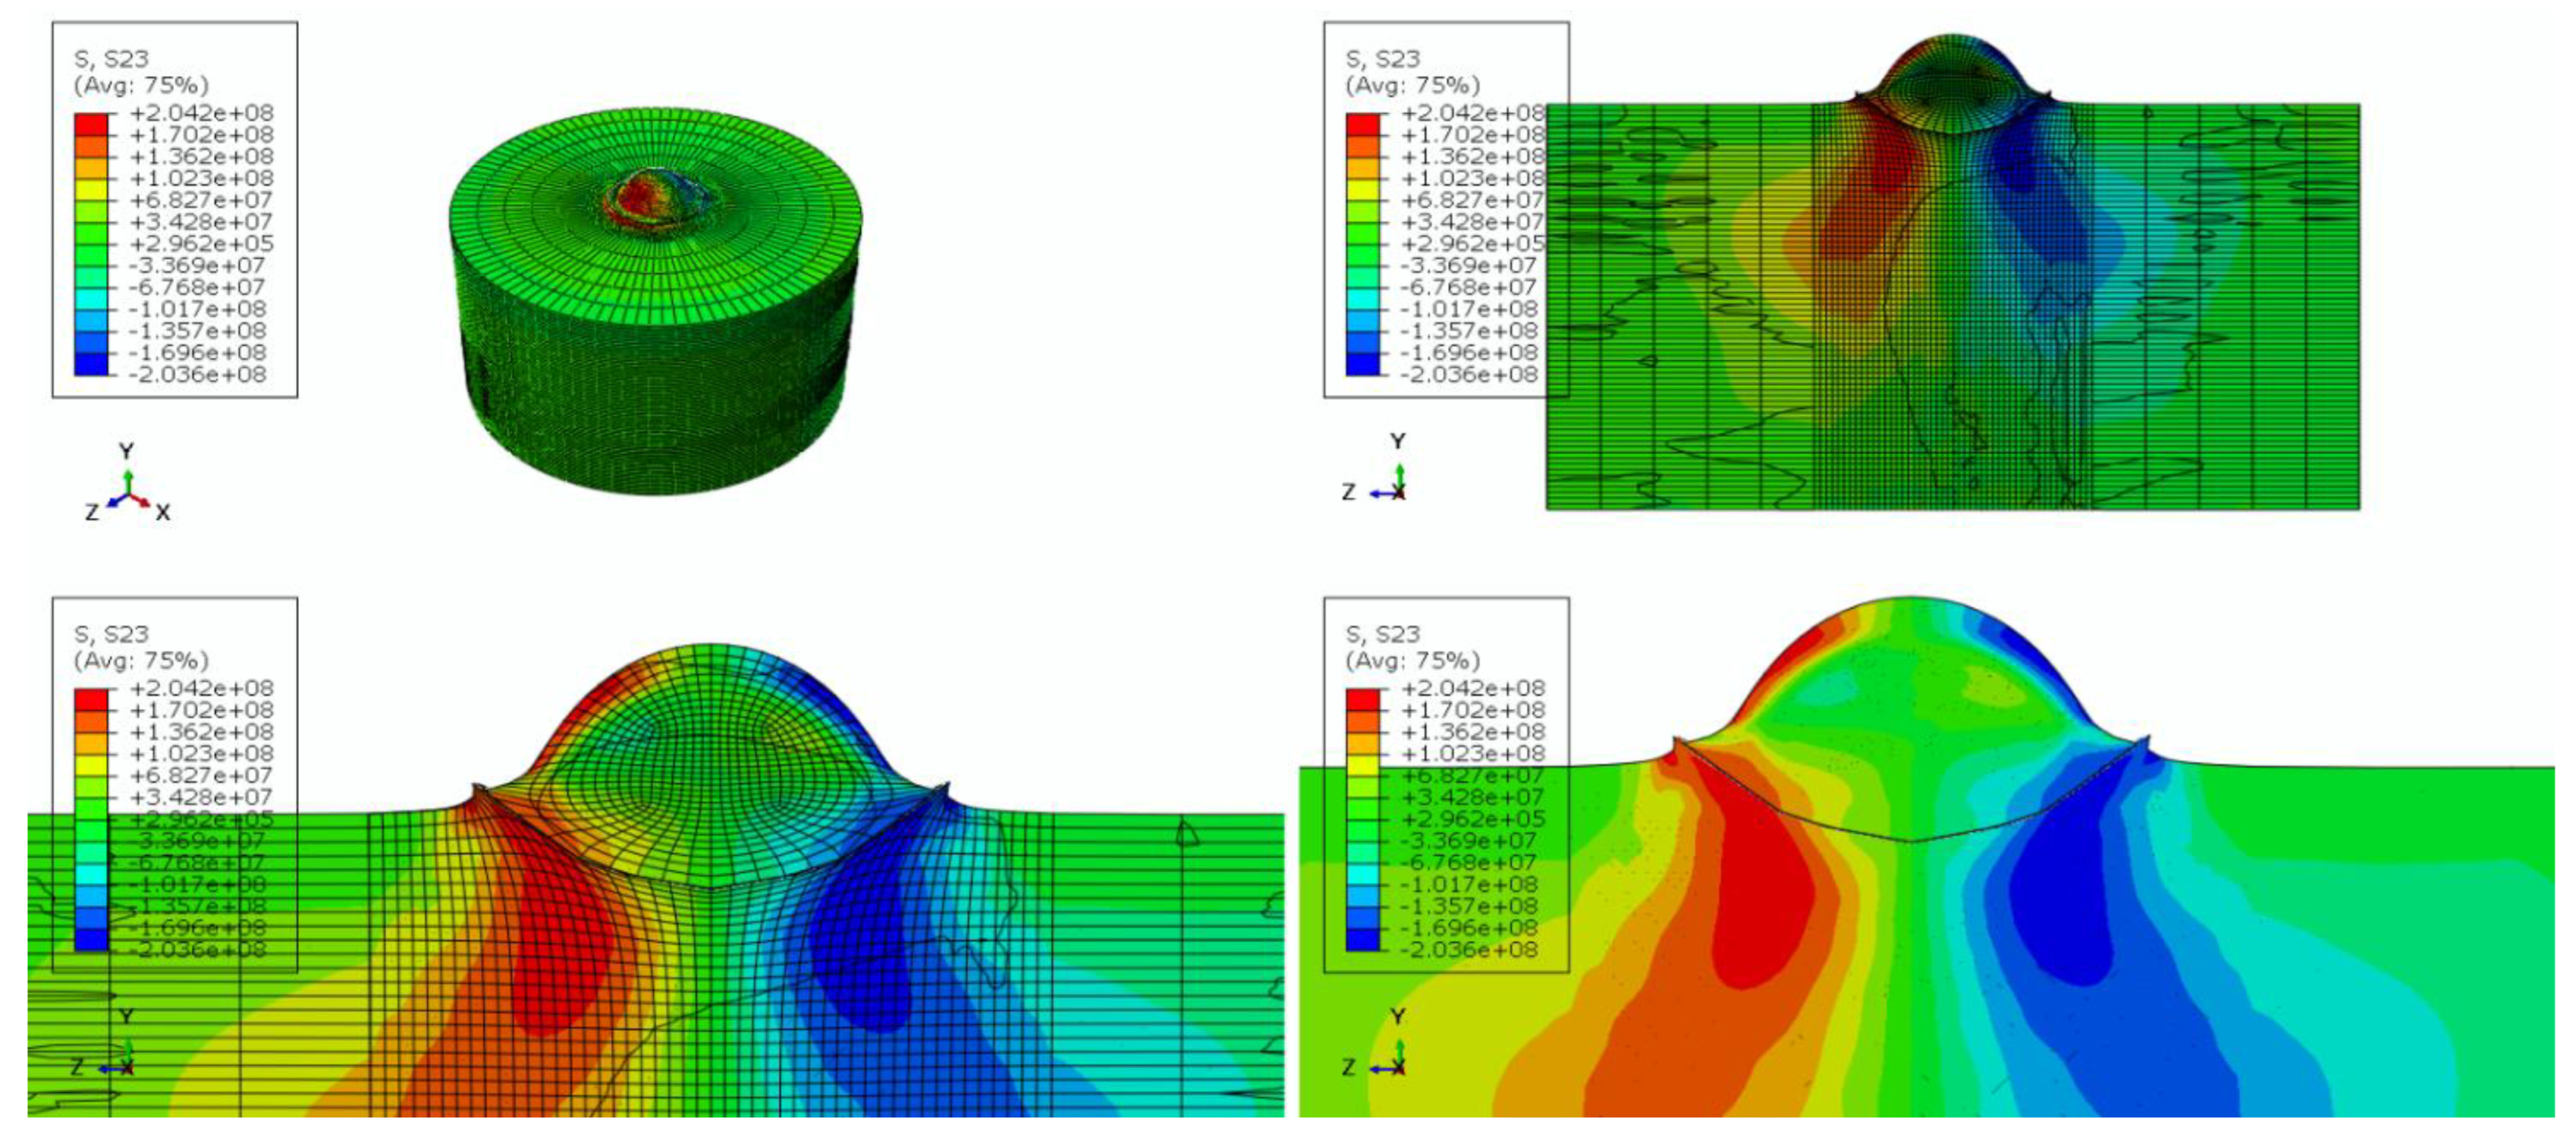
Figure 13.
Finite element analysis showing von Mises equivalent stress during high-velocity aluminum particle deposition. (Top left) Isometric view displaying concentric stress rings emanating from impact center; (Top right) Front cross-section revealing maximum stress at particle-substrate interface; (Bottom left) Side cross-section showing hemispherical stress field and crater formation; (Bottom right) Detailed stress distribution illustrating severe plastic deformation in both particle and substrate. Color scale indicates stress magnitude from low (blue) to high (red). The von Mises stress field confirms successful deposition conditions with interface stresses exceeding aluminum yield strength, enabling the plastic flow essential for cold spray bonding.
Figure 13.
Finite element analysis showing von Mises equivalent stress during high-velocity aluminum particle deposition. (Top left) Isometric view displaying concentric stress rings emanating from impact center; (Top right) Front cross-section revealing maximum stress at particle-substrate interface; (Bottom left) Side cross-section showing hemispherical stress field and crater formation; (Bottom right) Detailed stress distribution illustrating severe plastic deformation in both particle and substrate. Color scale indicates stress magnitude from low (blue) to high (red). The von Mises stress field confirms successful deposition conditions with interface stresses exceeding aluminum yield strength, enabling the plastic flow essential for cold spray bonding.
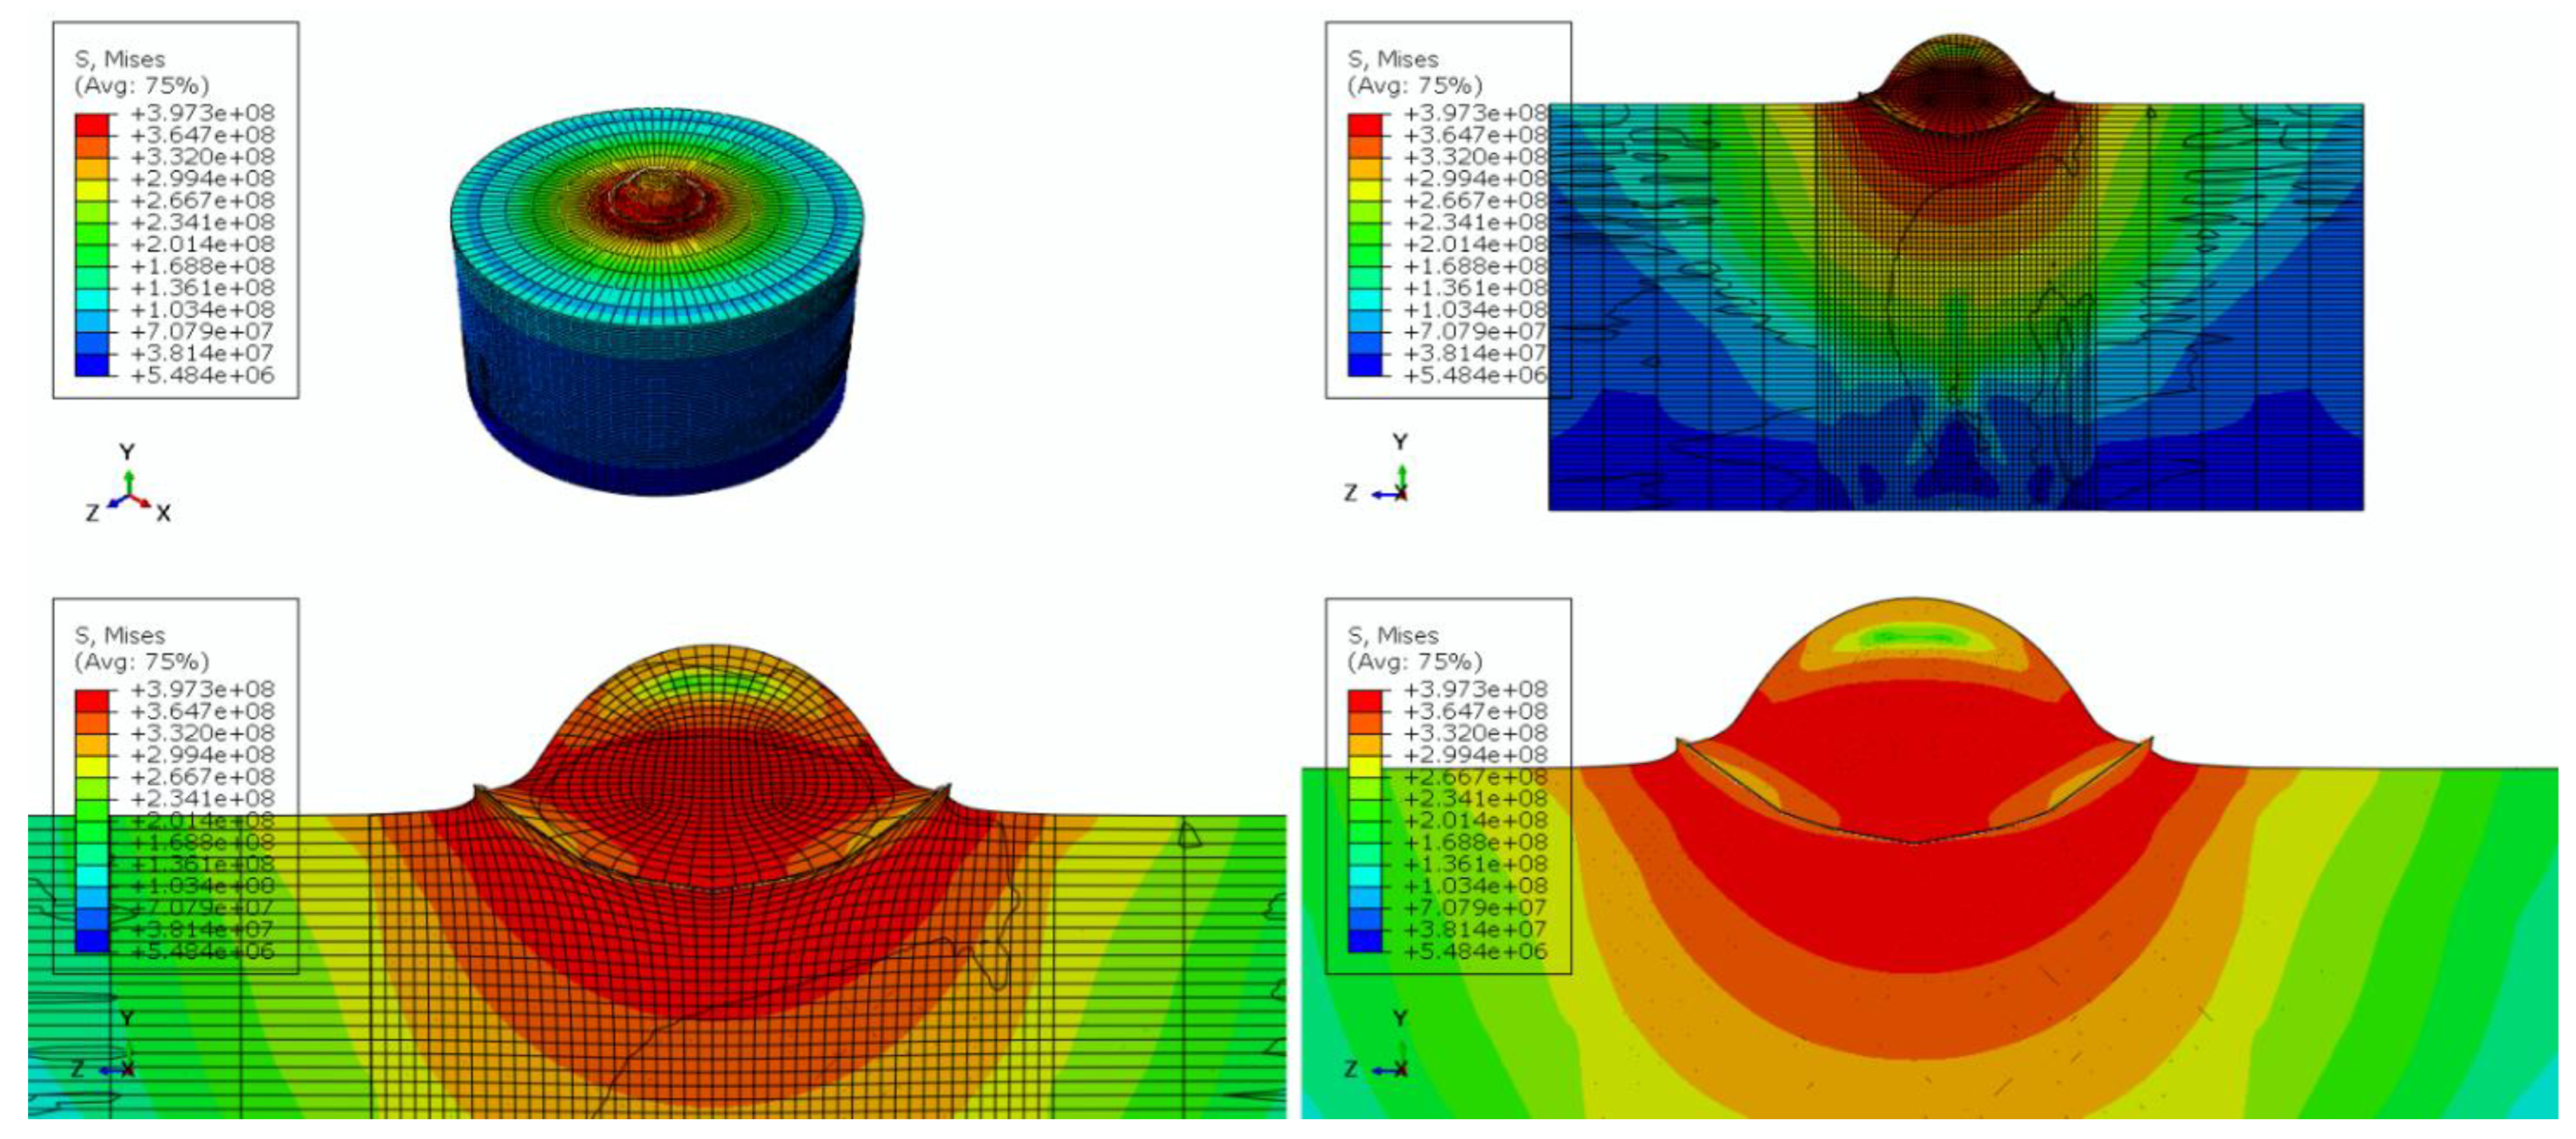
Figure 14.
Frequency-based heatmap visualization showing the spatial and magnitude distribution of stress tensor components during aluminum particle deposition. Each subplot represents a stress component (S11, S22, S33 - normal stresses; S12, S13, S23 - shear stresses) plotted against element index and stress magnitude in MPa. The color scale indicates frequency of occurrence, with blue representing low frequency and red representing high frequency zones. Normal stress components show concentrated low-magnitude distributions, while shear components exhibit characteristic horizontal banding patterns at specific stress levels, indicating localized shear concentration zones. This visualization enables efficient identification of critical stress regions and characteristic magnitudes across the entire finite element mesh without requiring individual element inspection.
Figure 14.
Frequency-based heatmap visualization showing the spatial and magnitude distribution of stress tensor components during aluminum particle deposition. Each subplot represents a stress component (S11, S22, S33 - normal stresses; S12, S13, S23 - shear stresses) plotted against element index and stress magnitude in MPa. The color scale indicates frequency of occurrence, with blue representing low frequency and red representing high frequency zones. Normal stress components show concentrated low-magnitude distributions, while shear components exhibit characteristic horizontal banding patterns at specific stress levels, indicating localized shear concentration zones. This visualization enables efficient identification of critical stress regions and characteristic magnitudes across the entire finite element mesh without requiring individual element inspection.
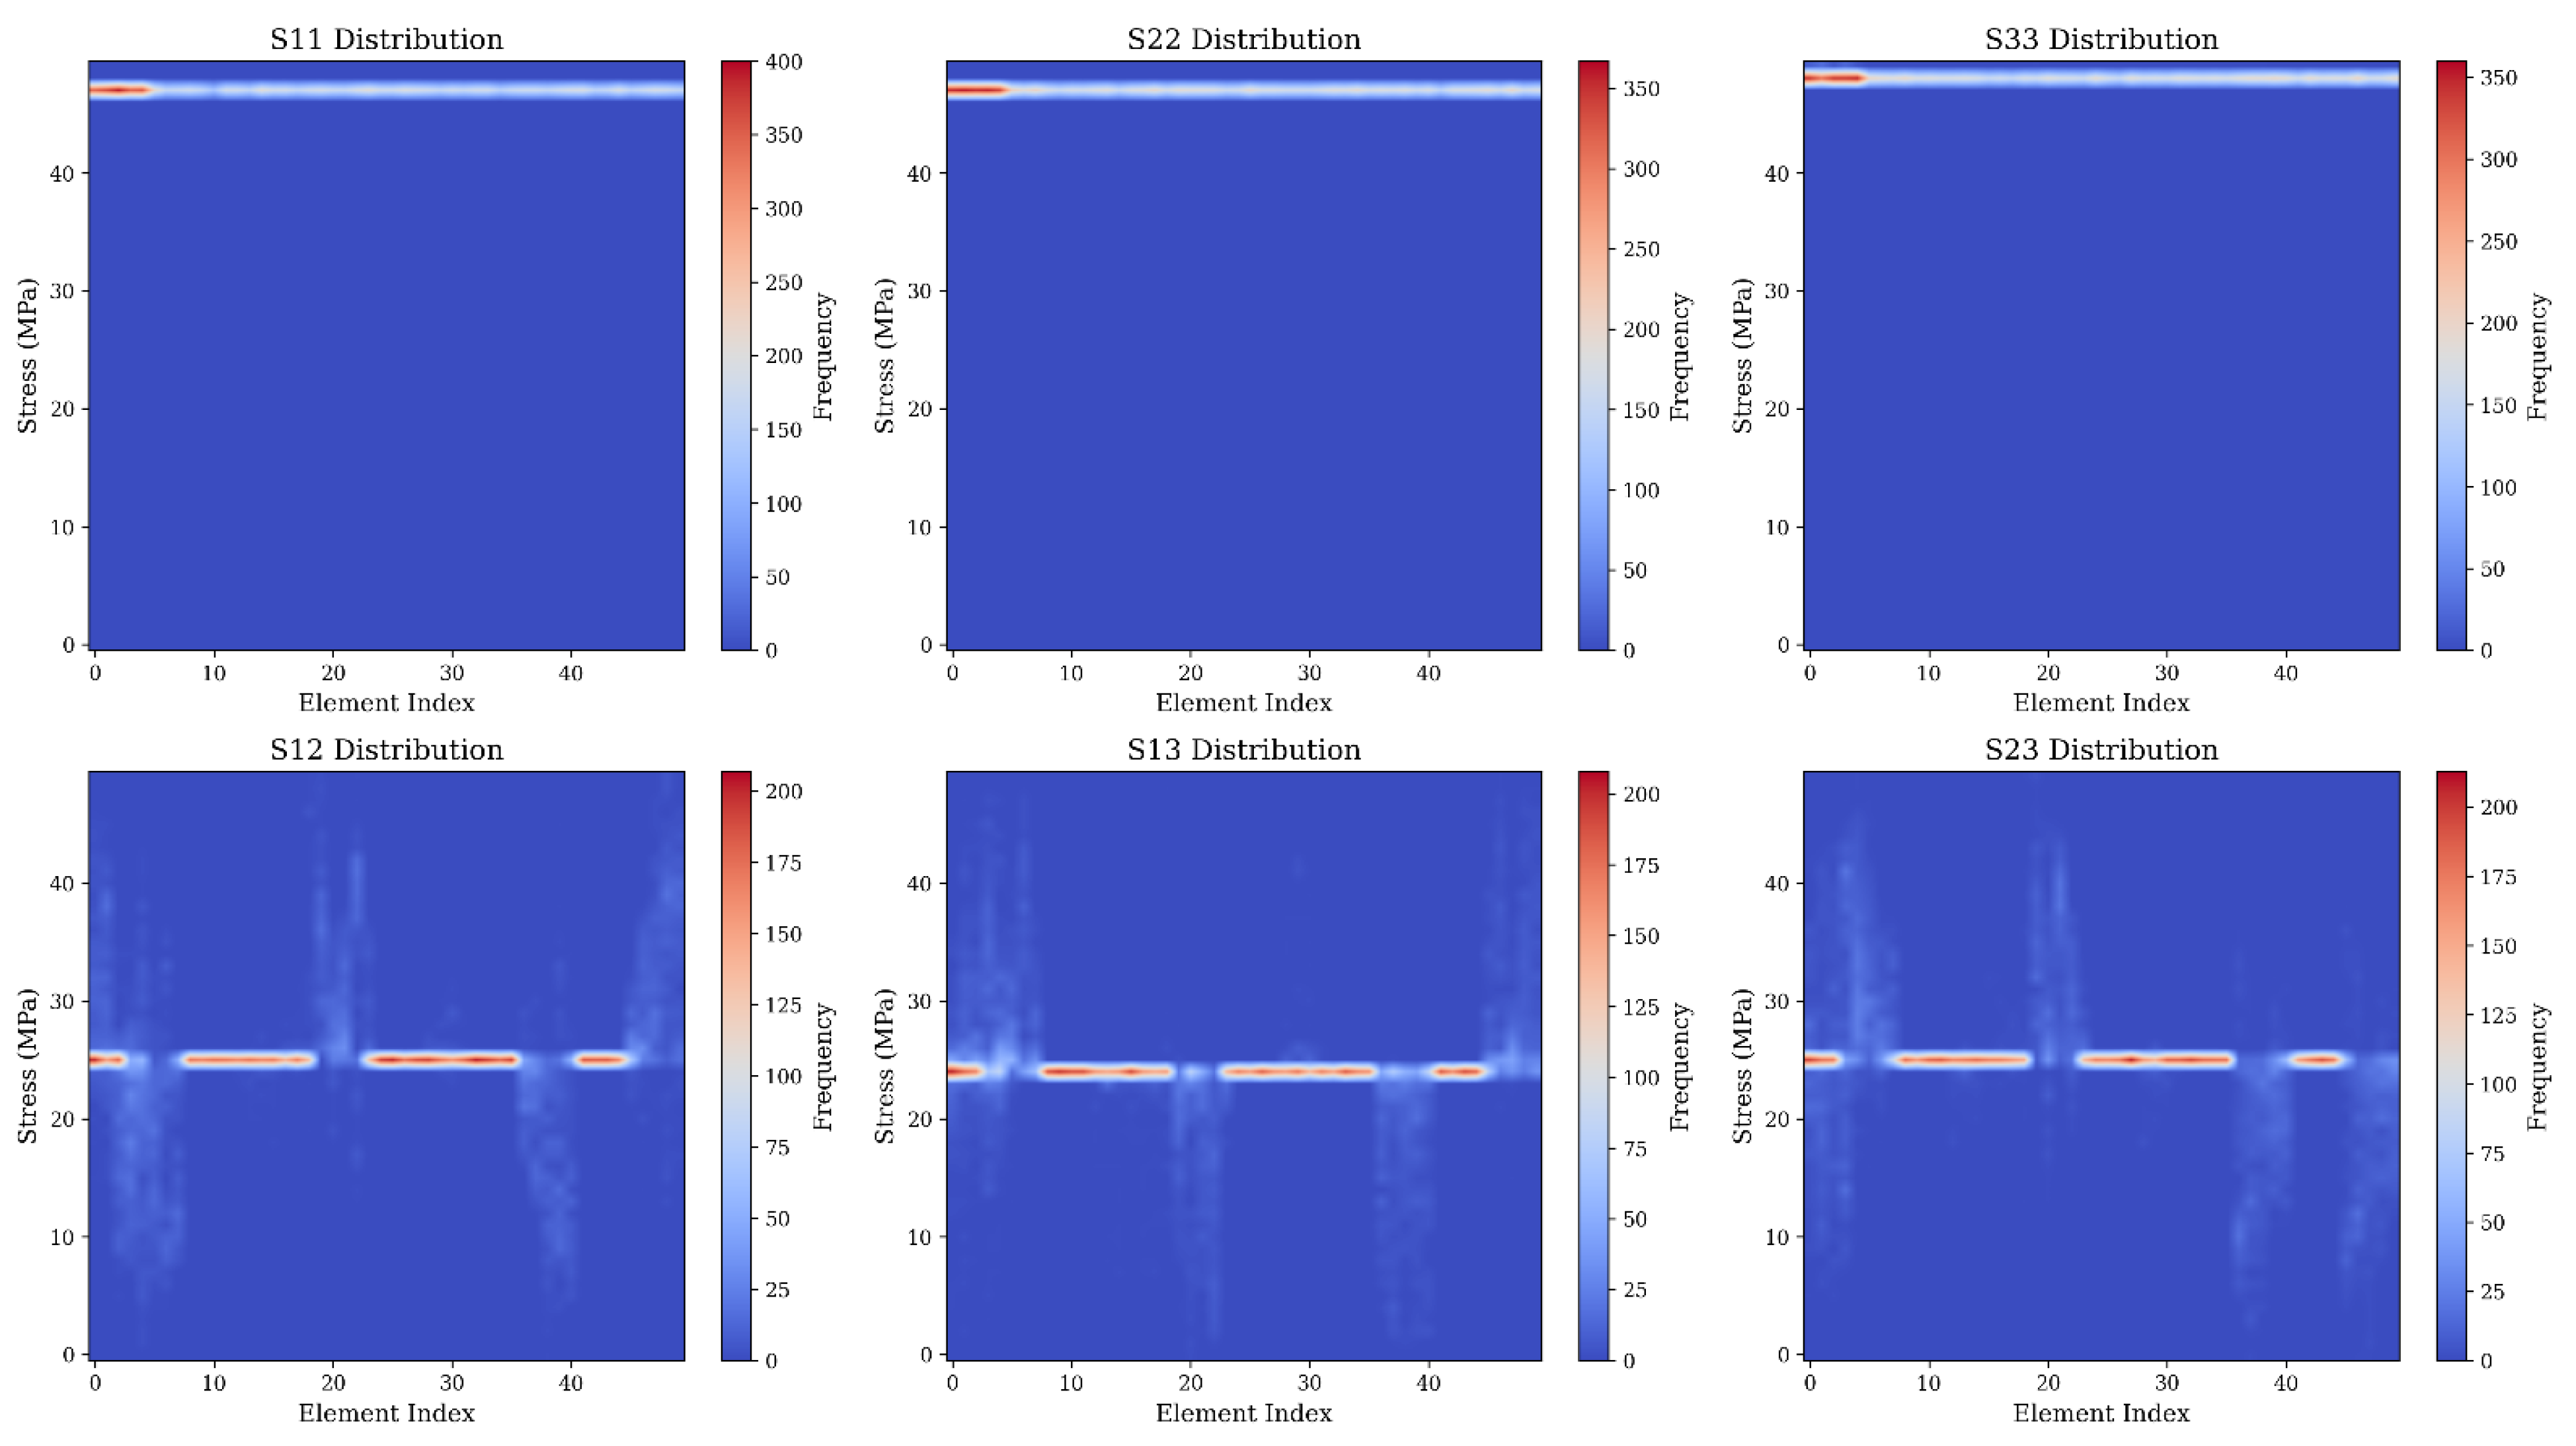
Figure 15.
3D scatter plots showing the relationship between pairs of stress tensor components and the resulting von Mises equivalent stress. (Top left) von Mises vs S11 and S22 showing normal stress coupling; (Top right) von Mises vs S11 and S33 illustrating axial-transverse interaction; (Bottom left) von Mises vs S22 and S33 displaying transverse stress correlation; (Bottom right) von Mises vs S12 and S13 revealing shear stress distribution. Each point represents an element in the finite element mesh, color-coded by von Mises stress magnitude from low (blue) to high (red) in MPa. The visualizations capture the multiaxial stress state complexity and nonlinear relationships essential for machine learning model development. The diverse stress space distributions demonstrate why ensemble methods are required to accurately predict equivalent stress from individual tensor components in cold spray impact simulations.
Figure 15.
3D scatter plots showing the relationship between pairs of stress tensor components and the resulting von Mises equivalent stress. (Top left) von Mises vs S11 and S22 showing normal stress coupling; (Top right) von Mises vs S11 and S33 illustrating axial-transverse interaction; (Bottom left) von Mises vs S22 and S33 displaying transverse stress correlation; (Bottom right) von Mises vs S12 and S13 revealing shear stress distribution. Each point represents an element in the finite element mesh, color-coded by von Mises stress magnitude from low (blue) to high (red) in MPa. The visualizations capture the multiaxial stress state complexity and nonlinear relationships essential for machine learning model development. The diverse stress space distributions demonstrate why ensemble methods are required to accurately predict equivalent stress from individual tensor components in cold spray impact simulations.
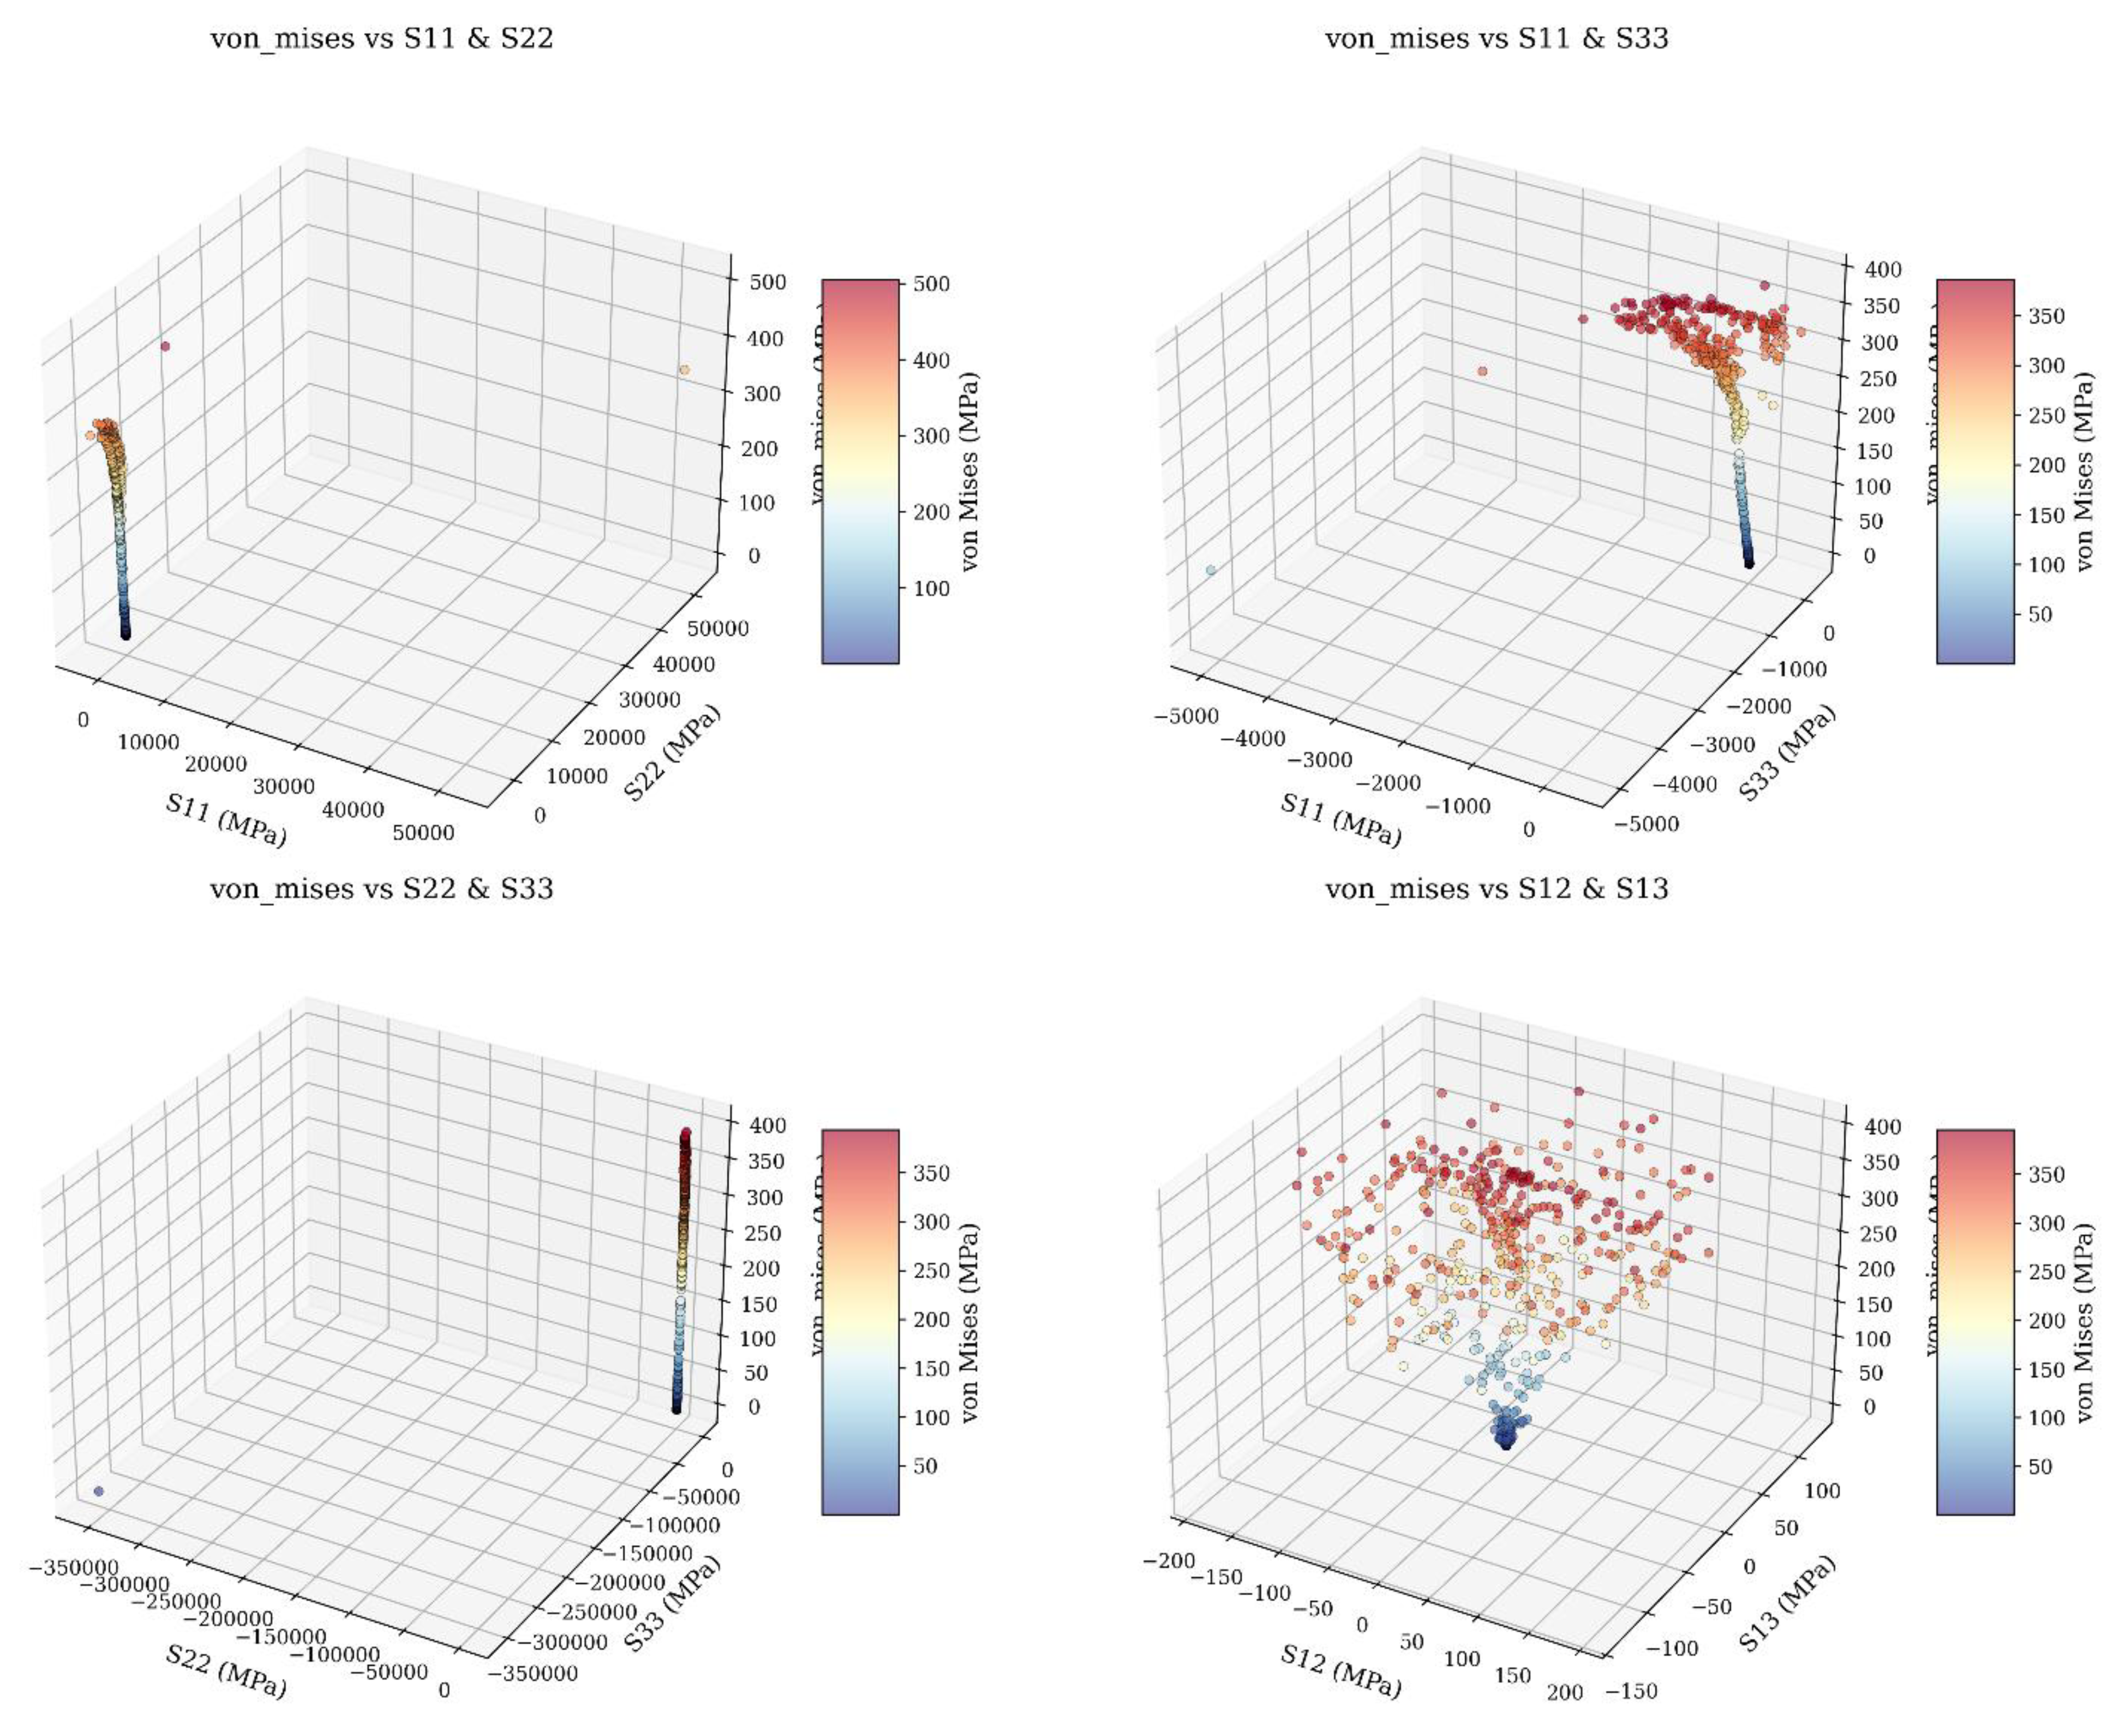
Figure 16.
Comparison of predicted versus actual von Mises stress for three regression models on the test dataset: (a) Random Forest achieving R² = 0.9975, (b) Gradient Boosting with R² = 0.9955, and (c) Neural Network attaining R² = 0.9922. Each point represents an element from the test set, color-coded by actual stress magnitude from low (blue) to high (red) in MPa. The dashed black line indicates perfect prediction where predicted equals actual stress. All three models demonstrate excellent predictive capability with tight clustering along the diagonal, validating their use for stress field estimation from tensor components (S11, S22, S33, S12, S13, S23).
Figure 16.
Comparison of predicted versus actual von Mises stress for three regression models on the test dataset: (a) Random Forest achieving R² = 0.9975, (b) Gradient Boosting with R² = 0.9955, and (c) Neural Network attaining R² = 0.9922. Each point represents an element from the test set, color-coded by actual stress magnitude from low (blue) to high (red) in MPa. The dashed black line indicates perfect prediction where predicted equals actual stress. All three models demonstrate excellent predictive capability with tight clustering along the diagonal, validating their use for stress field estimation from tensor components (S11, S22, S33, S12, S13, S23).
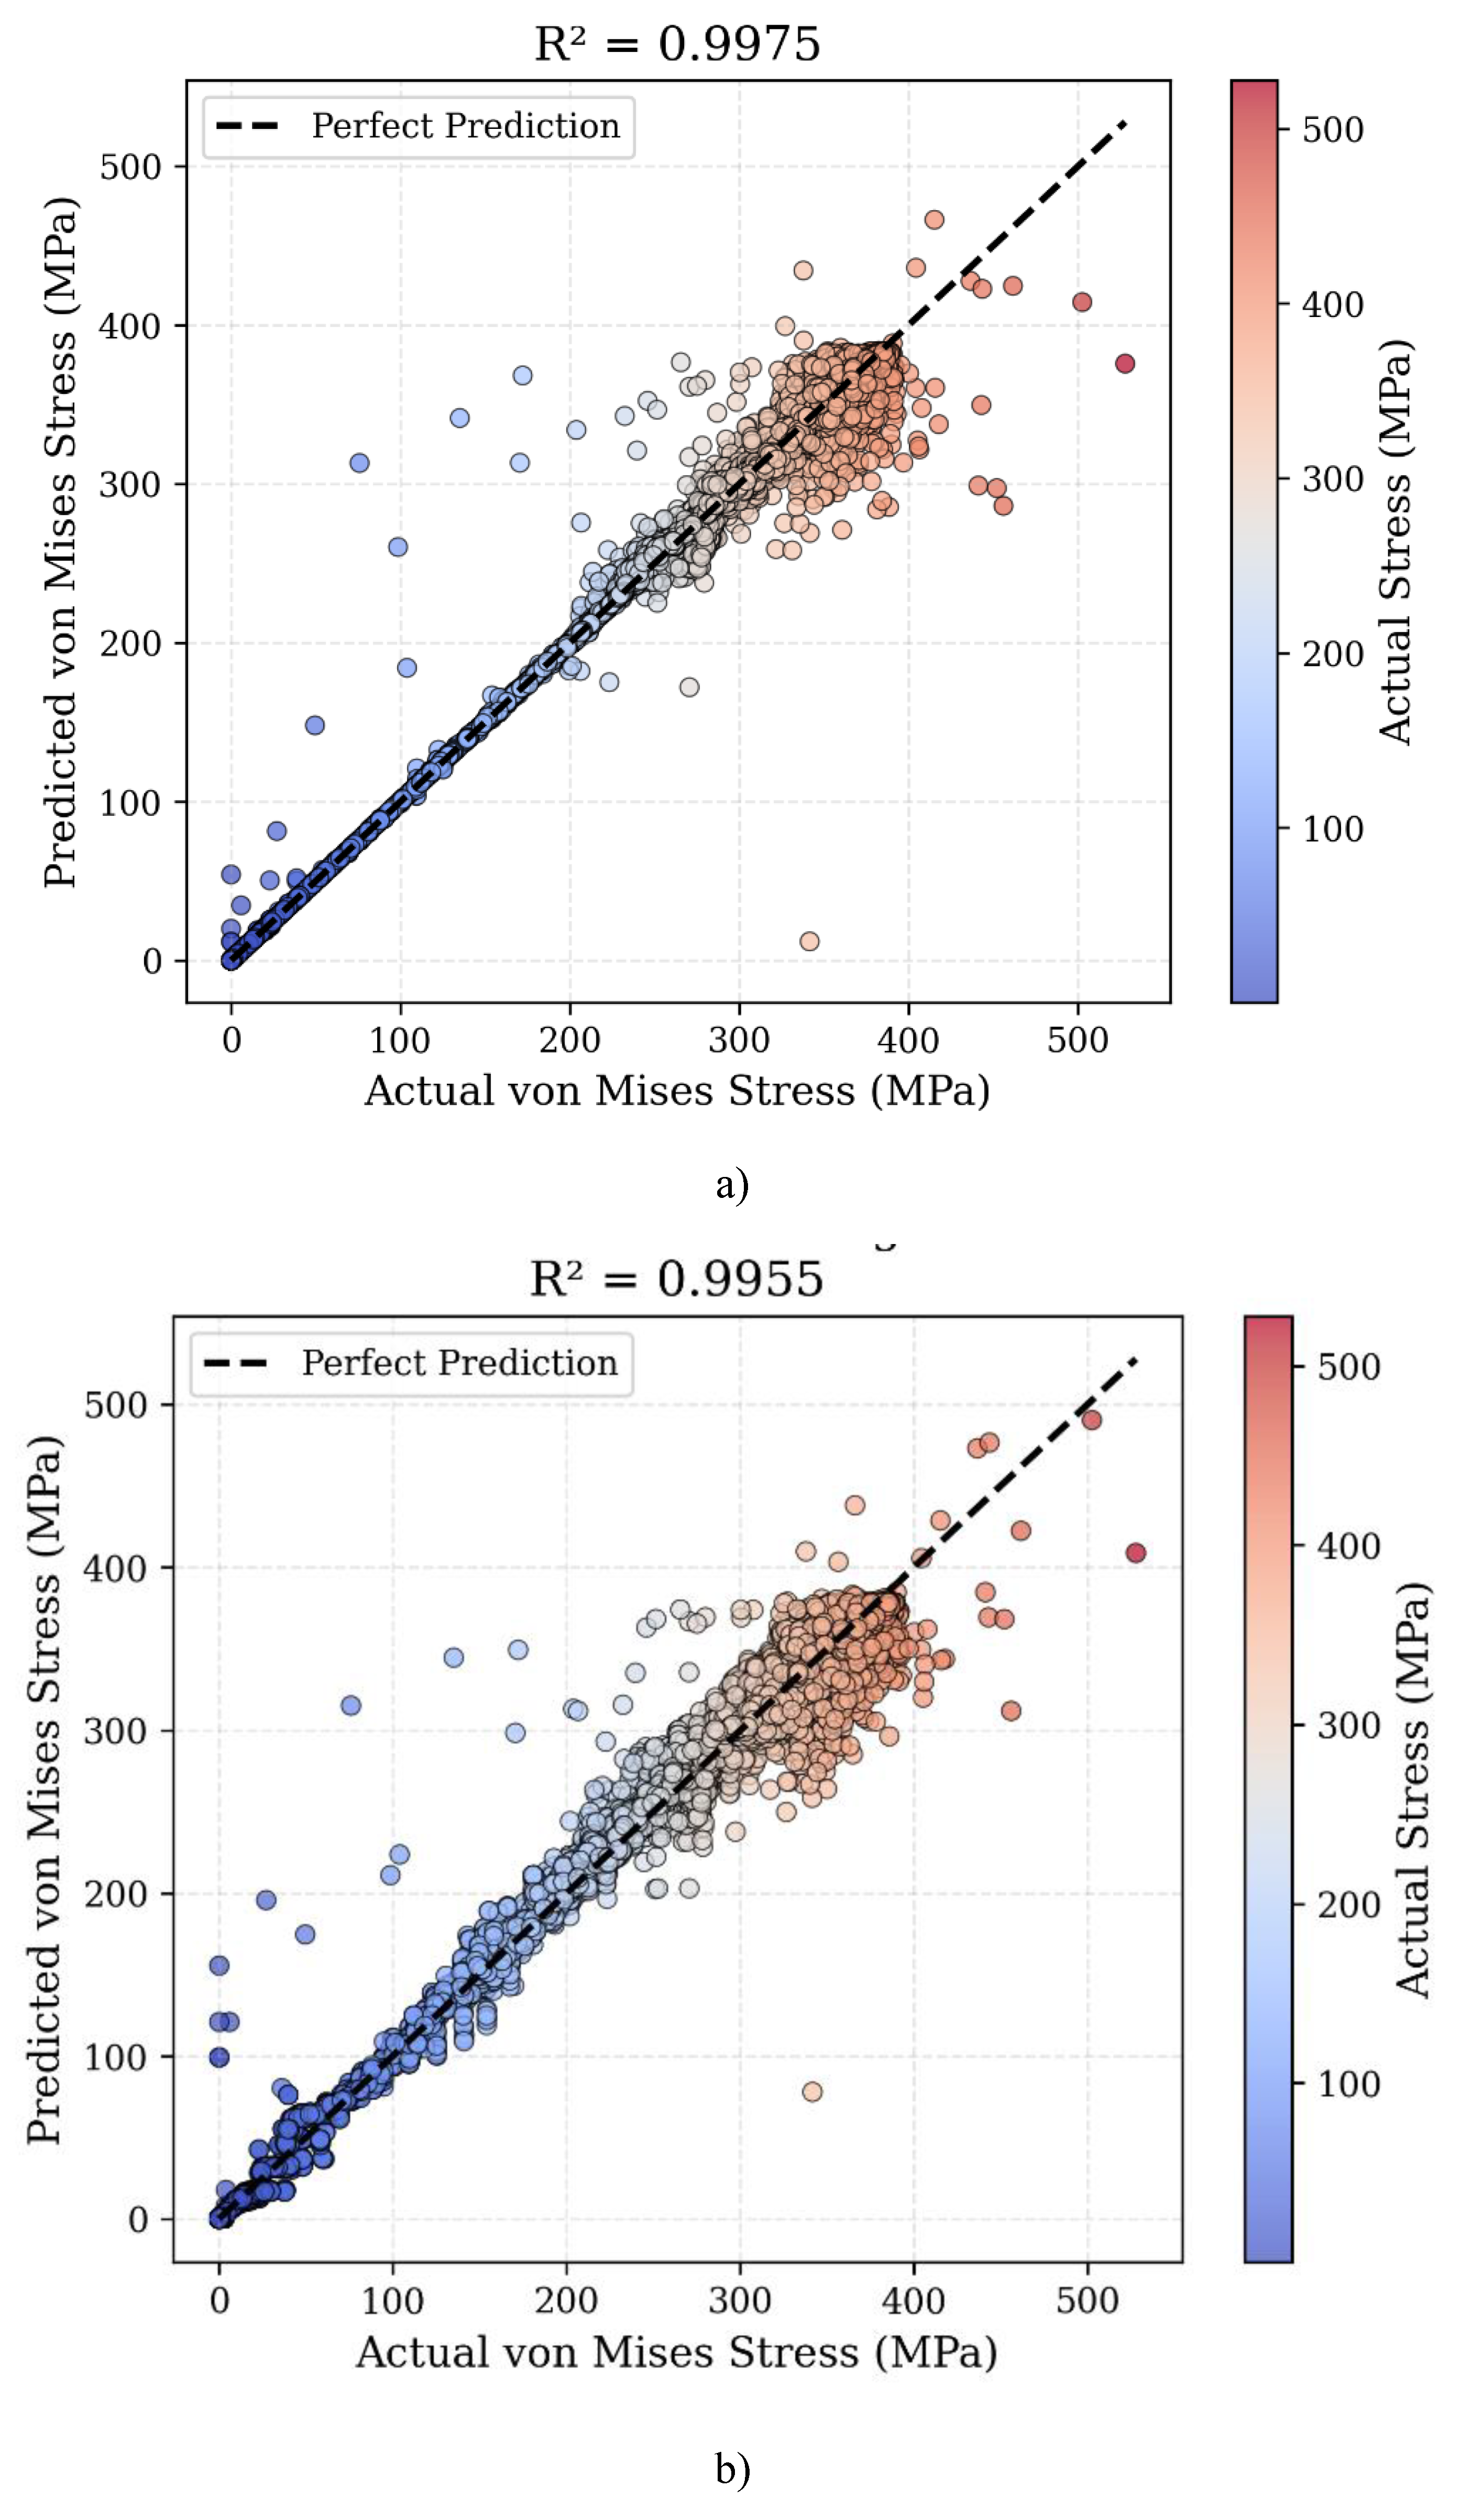
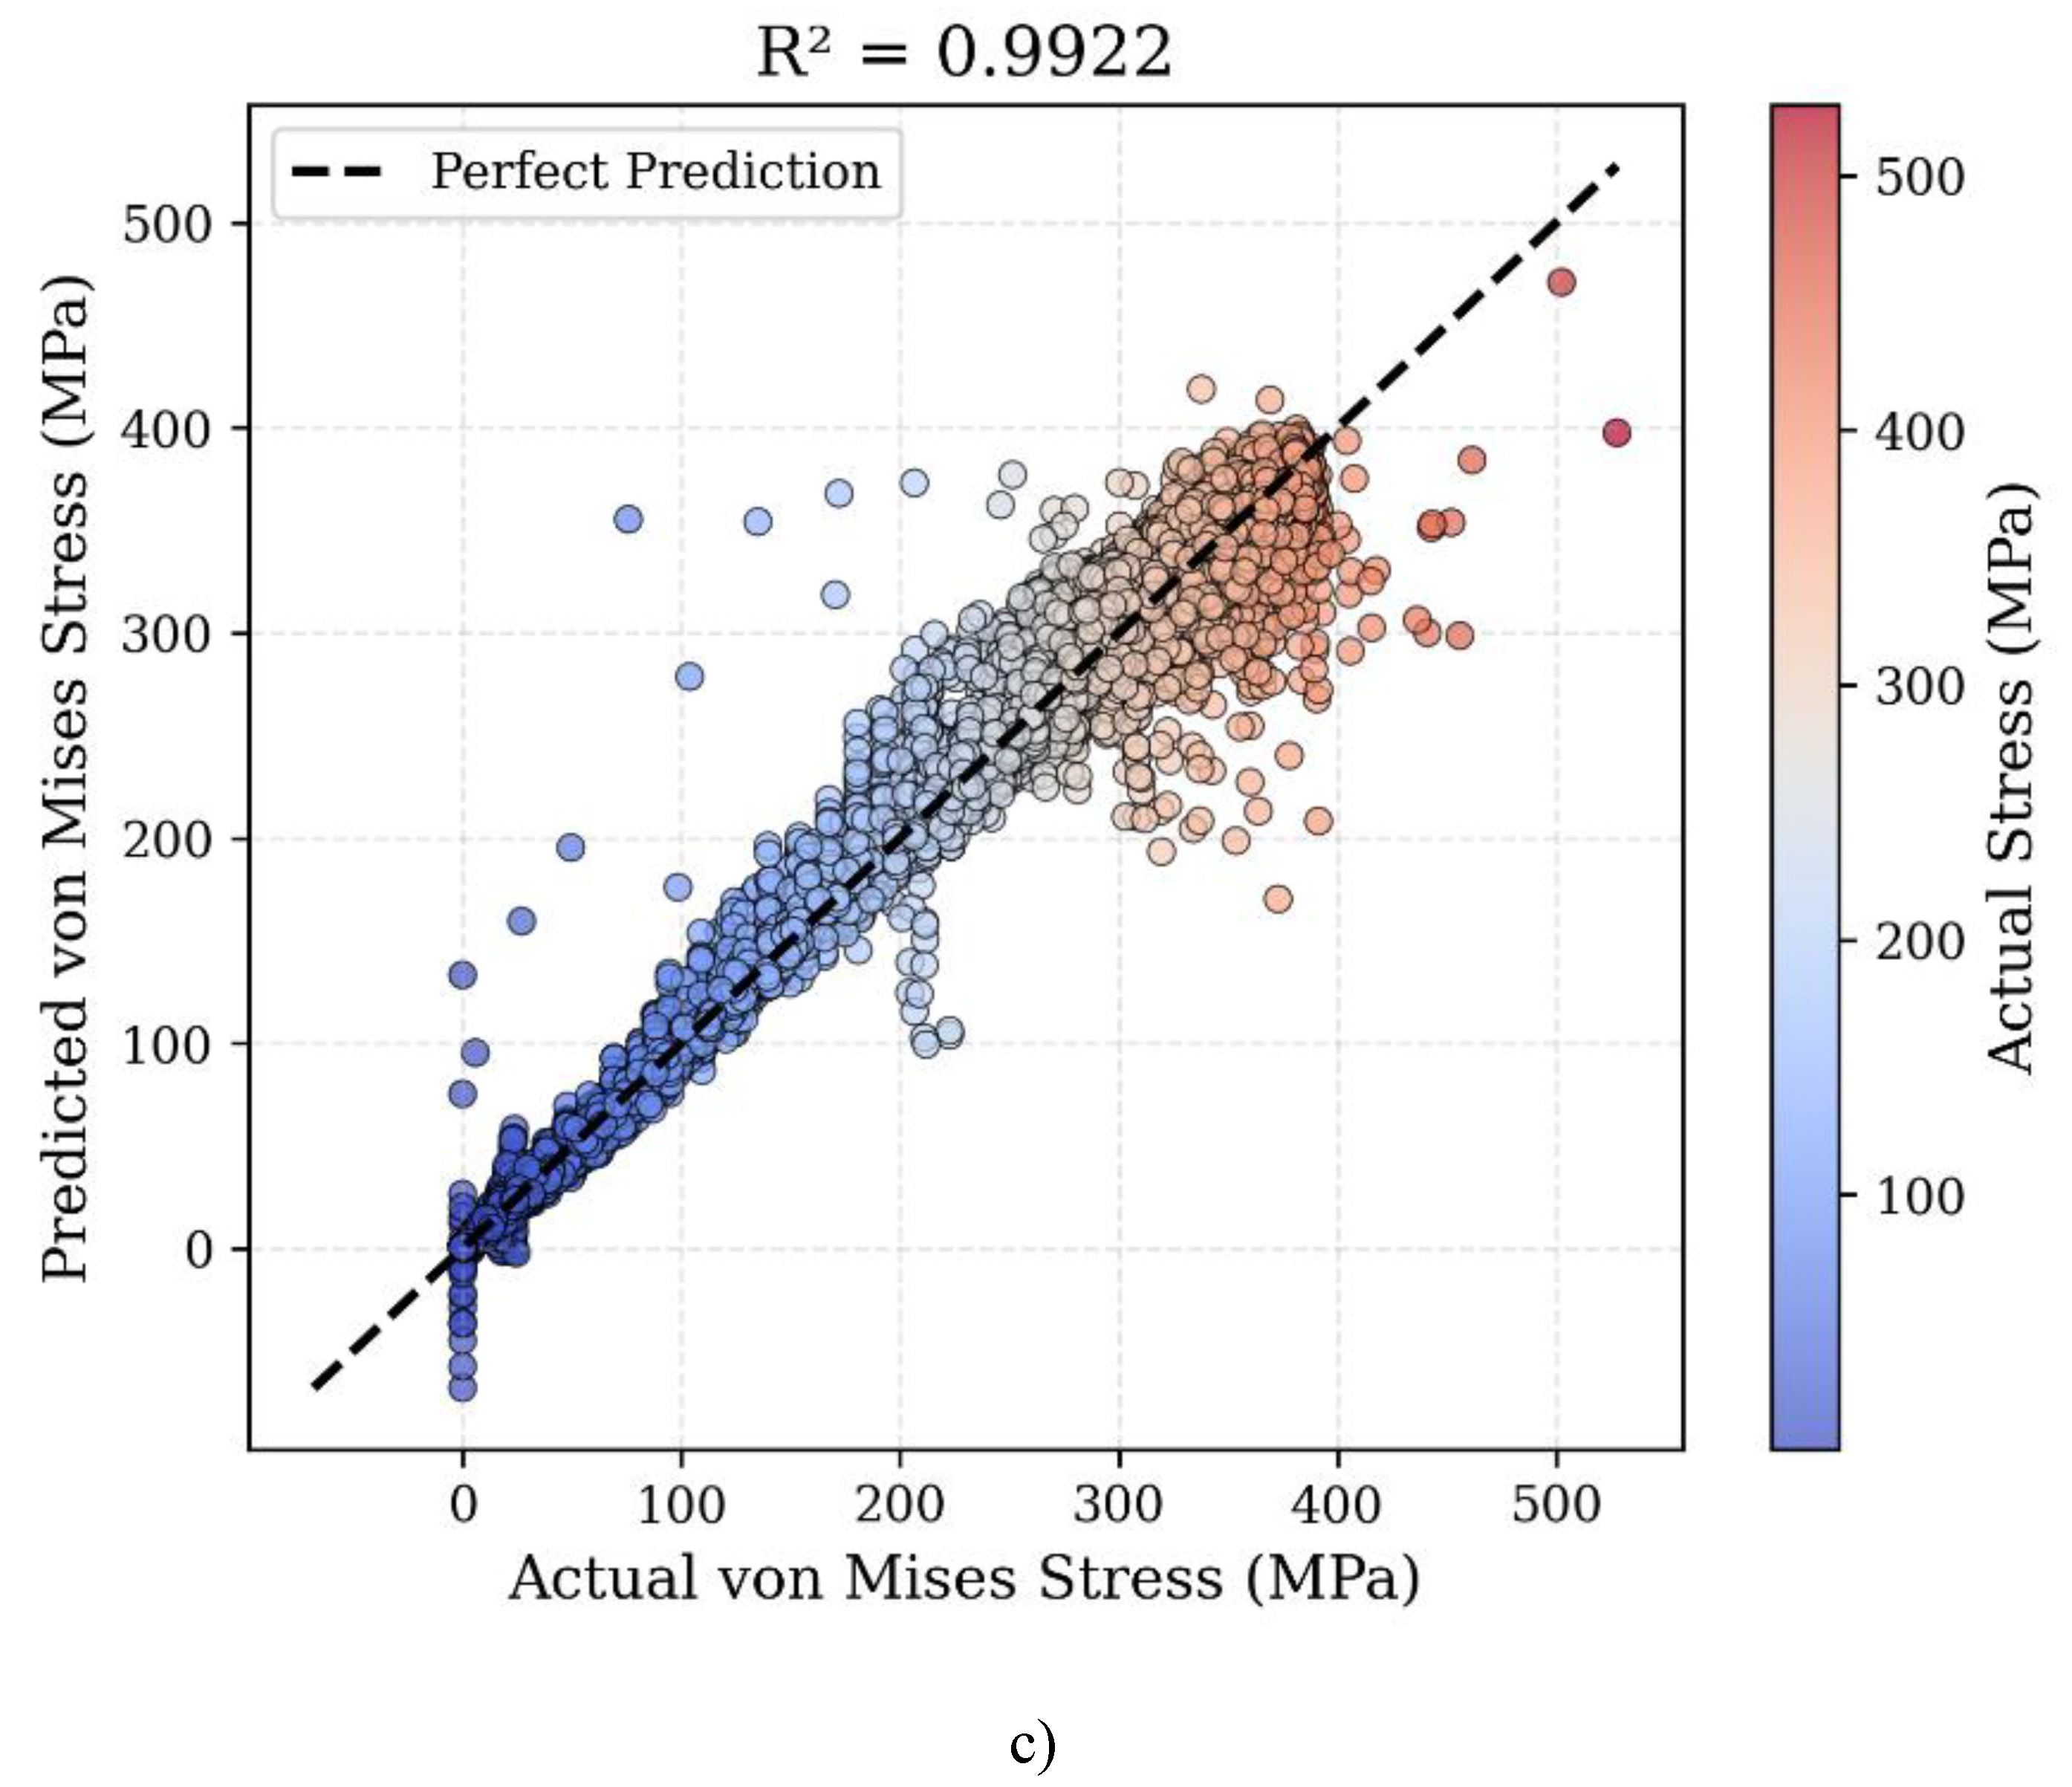
Figure 17.
Comparative feature importance rankings for (a) Random Forest and (b) Gradient Boosting regression models. The horizontal bars represent the relative contribution of each stress tensor component (S11, S22, S33, S12, S13, S23) to von Mises stress prediction. S22 dominates both models as the most influential feature, while shear components show minimal contribution. Color gradients indicate importance magnitude from low (red) to high (green/yellow). The analysis confirms that normal stress components, particularly transverse stress S22, are the primary drivers of equivalent stress in aluminum cold spray deposition, guiding process parameter optimization strategies.
Figure 17.
Comparative feature importance rankings for (a) Random Forest and (b) Gradient Boosting regression models. The horizontal bars represent the relative contribution of each stress tensor component (S11, S22, S33, S12, S13, S23) to von Mises stress prediction. S22 dominates both models as the most influential feature, while shear components show minimal contribution. Color gradients indicate importance magnitude from low (red) to high (green/yellow). The analysis confirms that normal stress components, particularly transverse stress S22, are the primary drivers of equivalent stress in aluminum cold spray deposition, guiding process parameter optimization strategies.
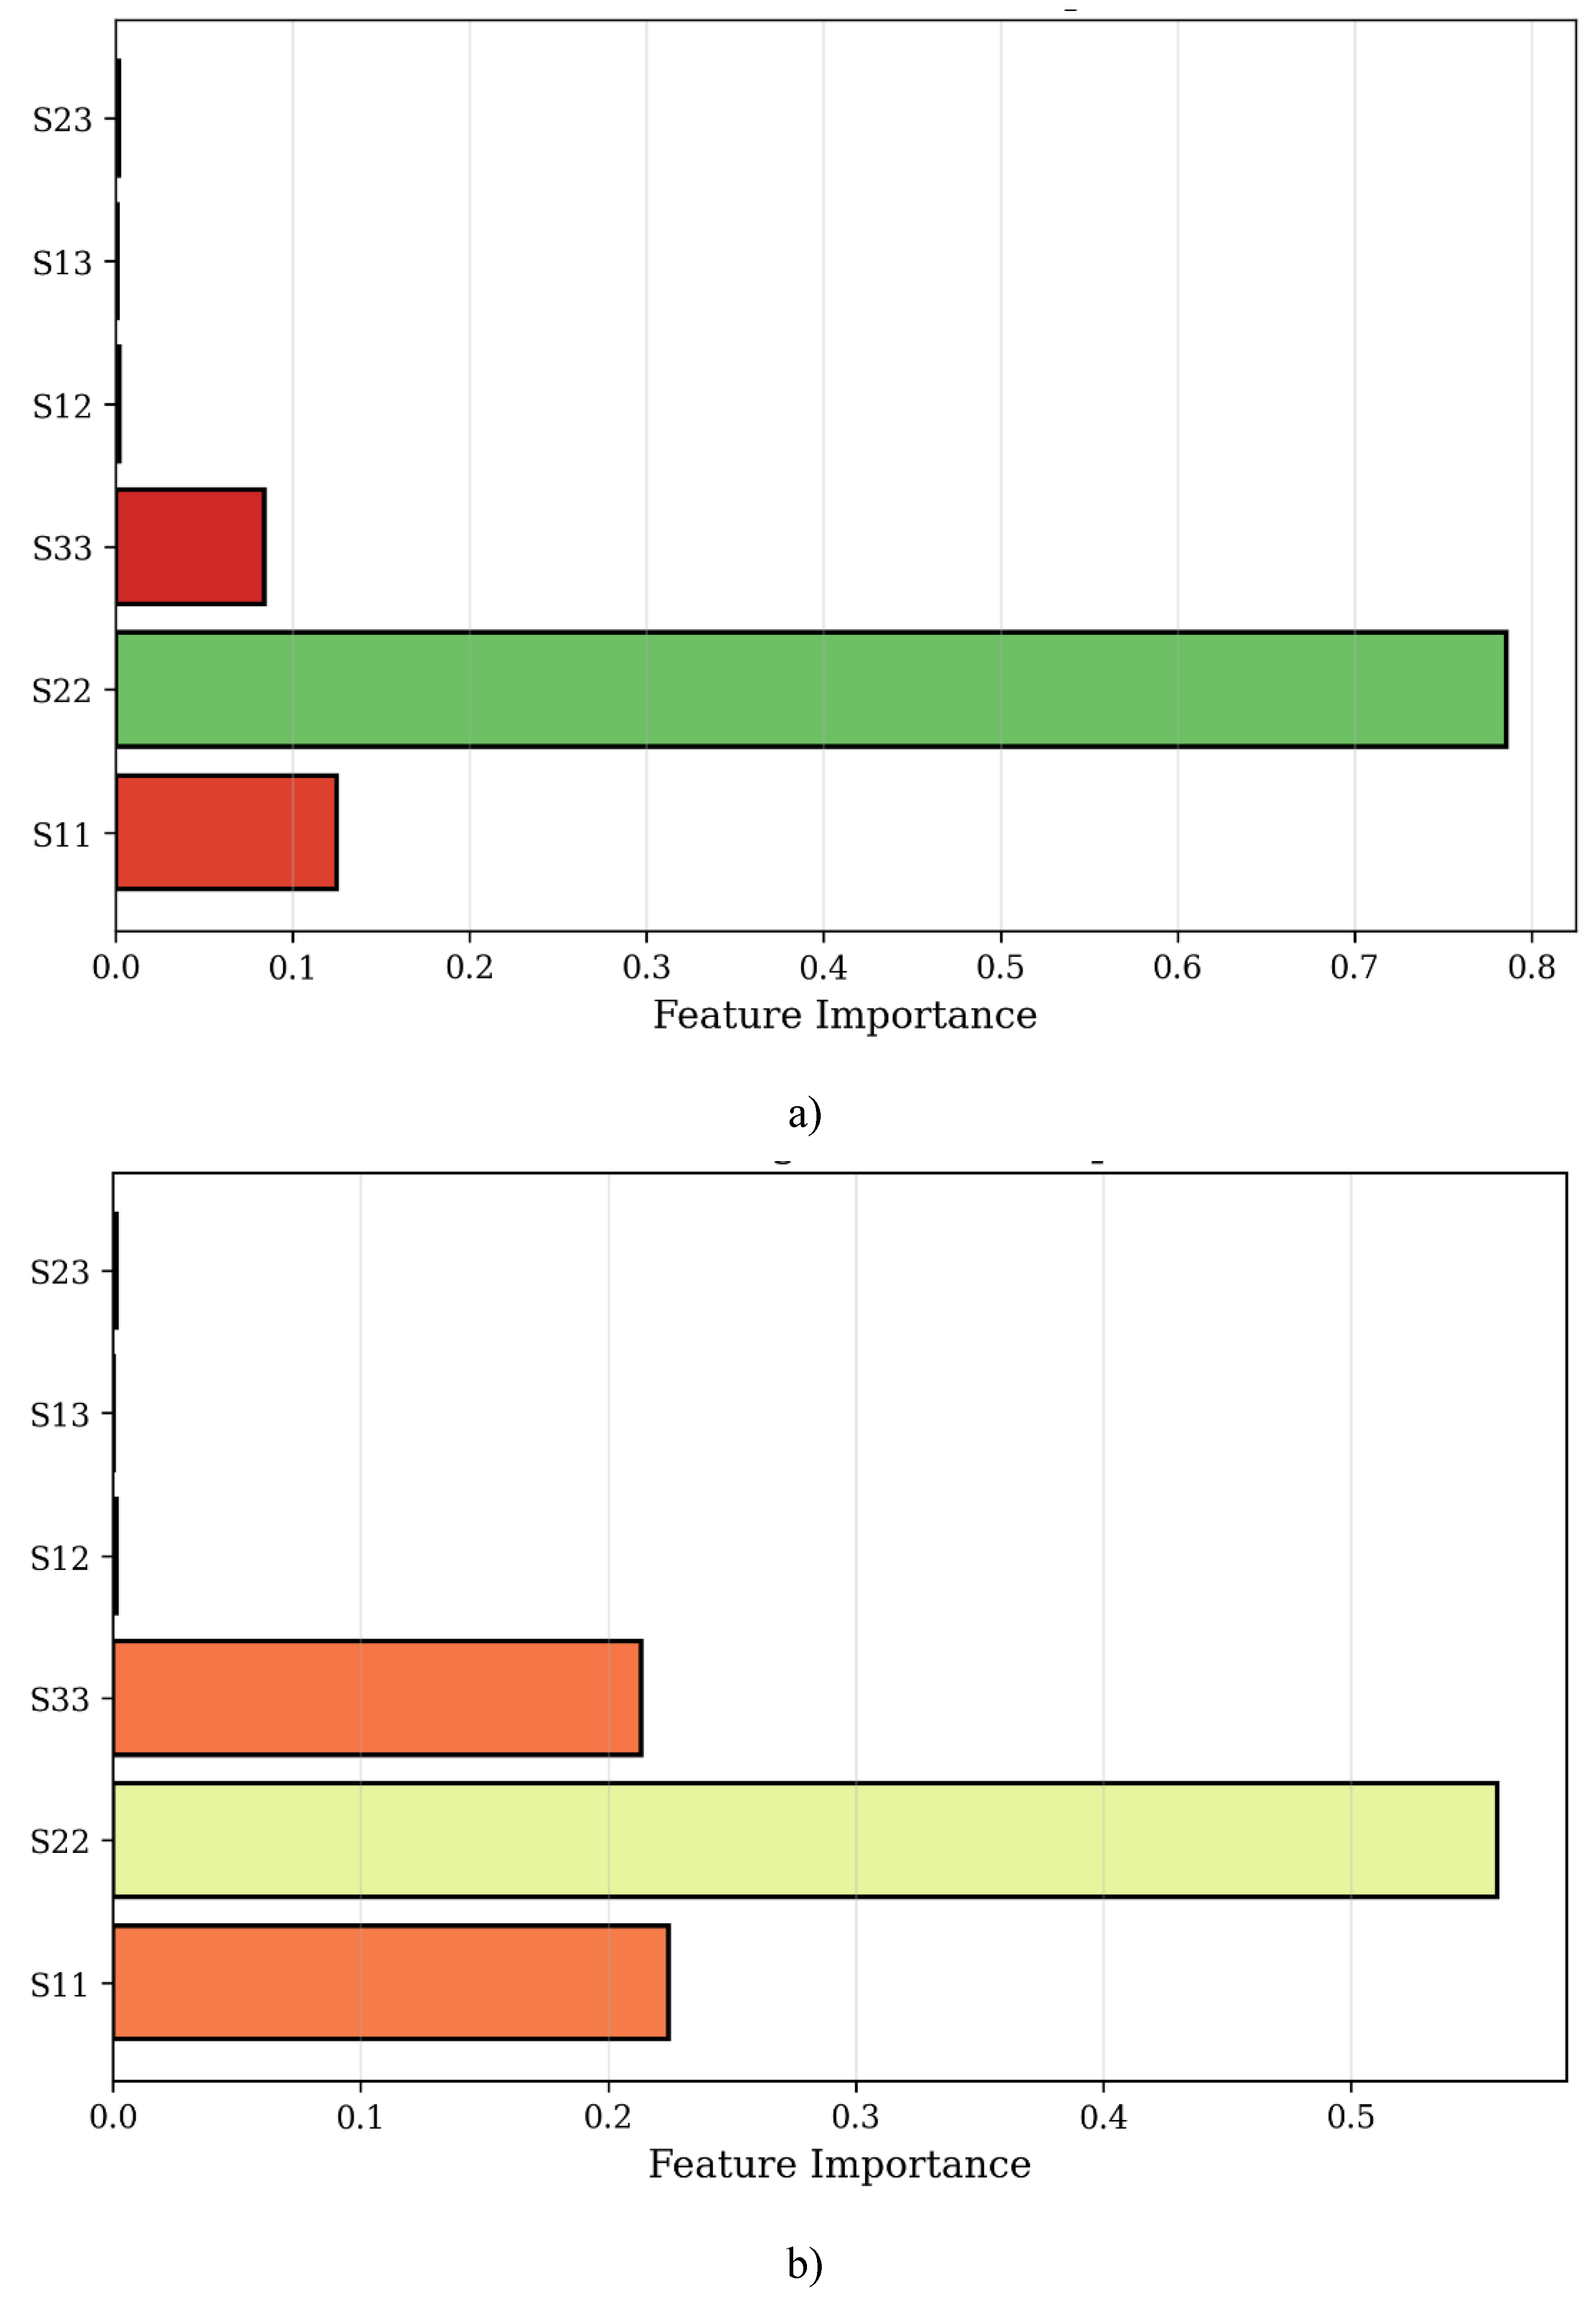
Figure 18.
Predicted versus actual von Mises stress comparison for optimized regression models: (a) Random Forest with unlimited depth achieving R² = 0.9977, (b) Gradient Boosting with R² = 0.9887, and (c) Neural Network attaining R² = 0.9985. Each data point represents an element from the test dataset, color-coded by actual stress magnitude from low (blue) to high (red) in MPa. The dashed black line denotes perfect prediction accuracy. The modified hyperparameter configuration, particularly the removal of max_depth constraint in Random Forest, results in improved predictive performance compared to the baseline models in Figure 16.
Figure 18.
Predicted versus actual von Mises stress comparison for optimized regression models: (a) Random Forest with unlimited depth achieving R² = 0.9977, (b) Gradient Boosting with R² = 0.9887, and (c) Neural Network attaining R² = 0.9985. Each data point represents an element from the test dataset, color-coded by actual stress magnitude from low (blue) to high (red) in MPa. The dashed black line denotes perfect prediction accuracy. The modified hyperparameter configuration, particularly the removal of max_depth constraint in Random Forest, results in improved predictive performance compared to the baseline models in Figure 16.
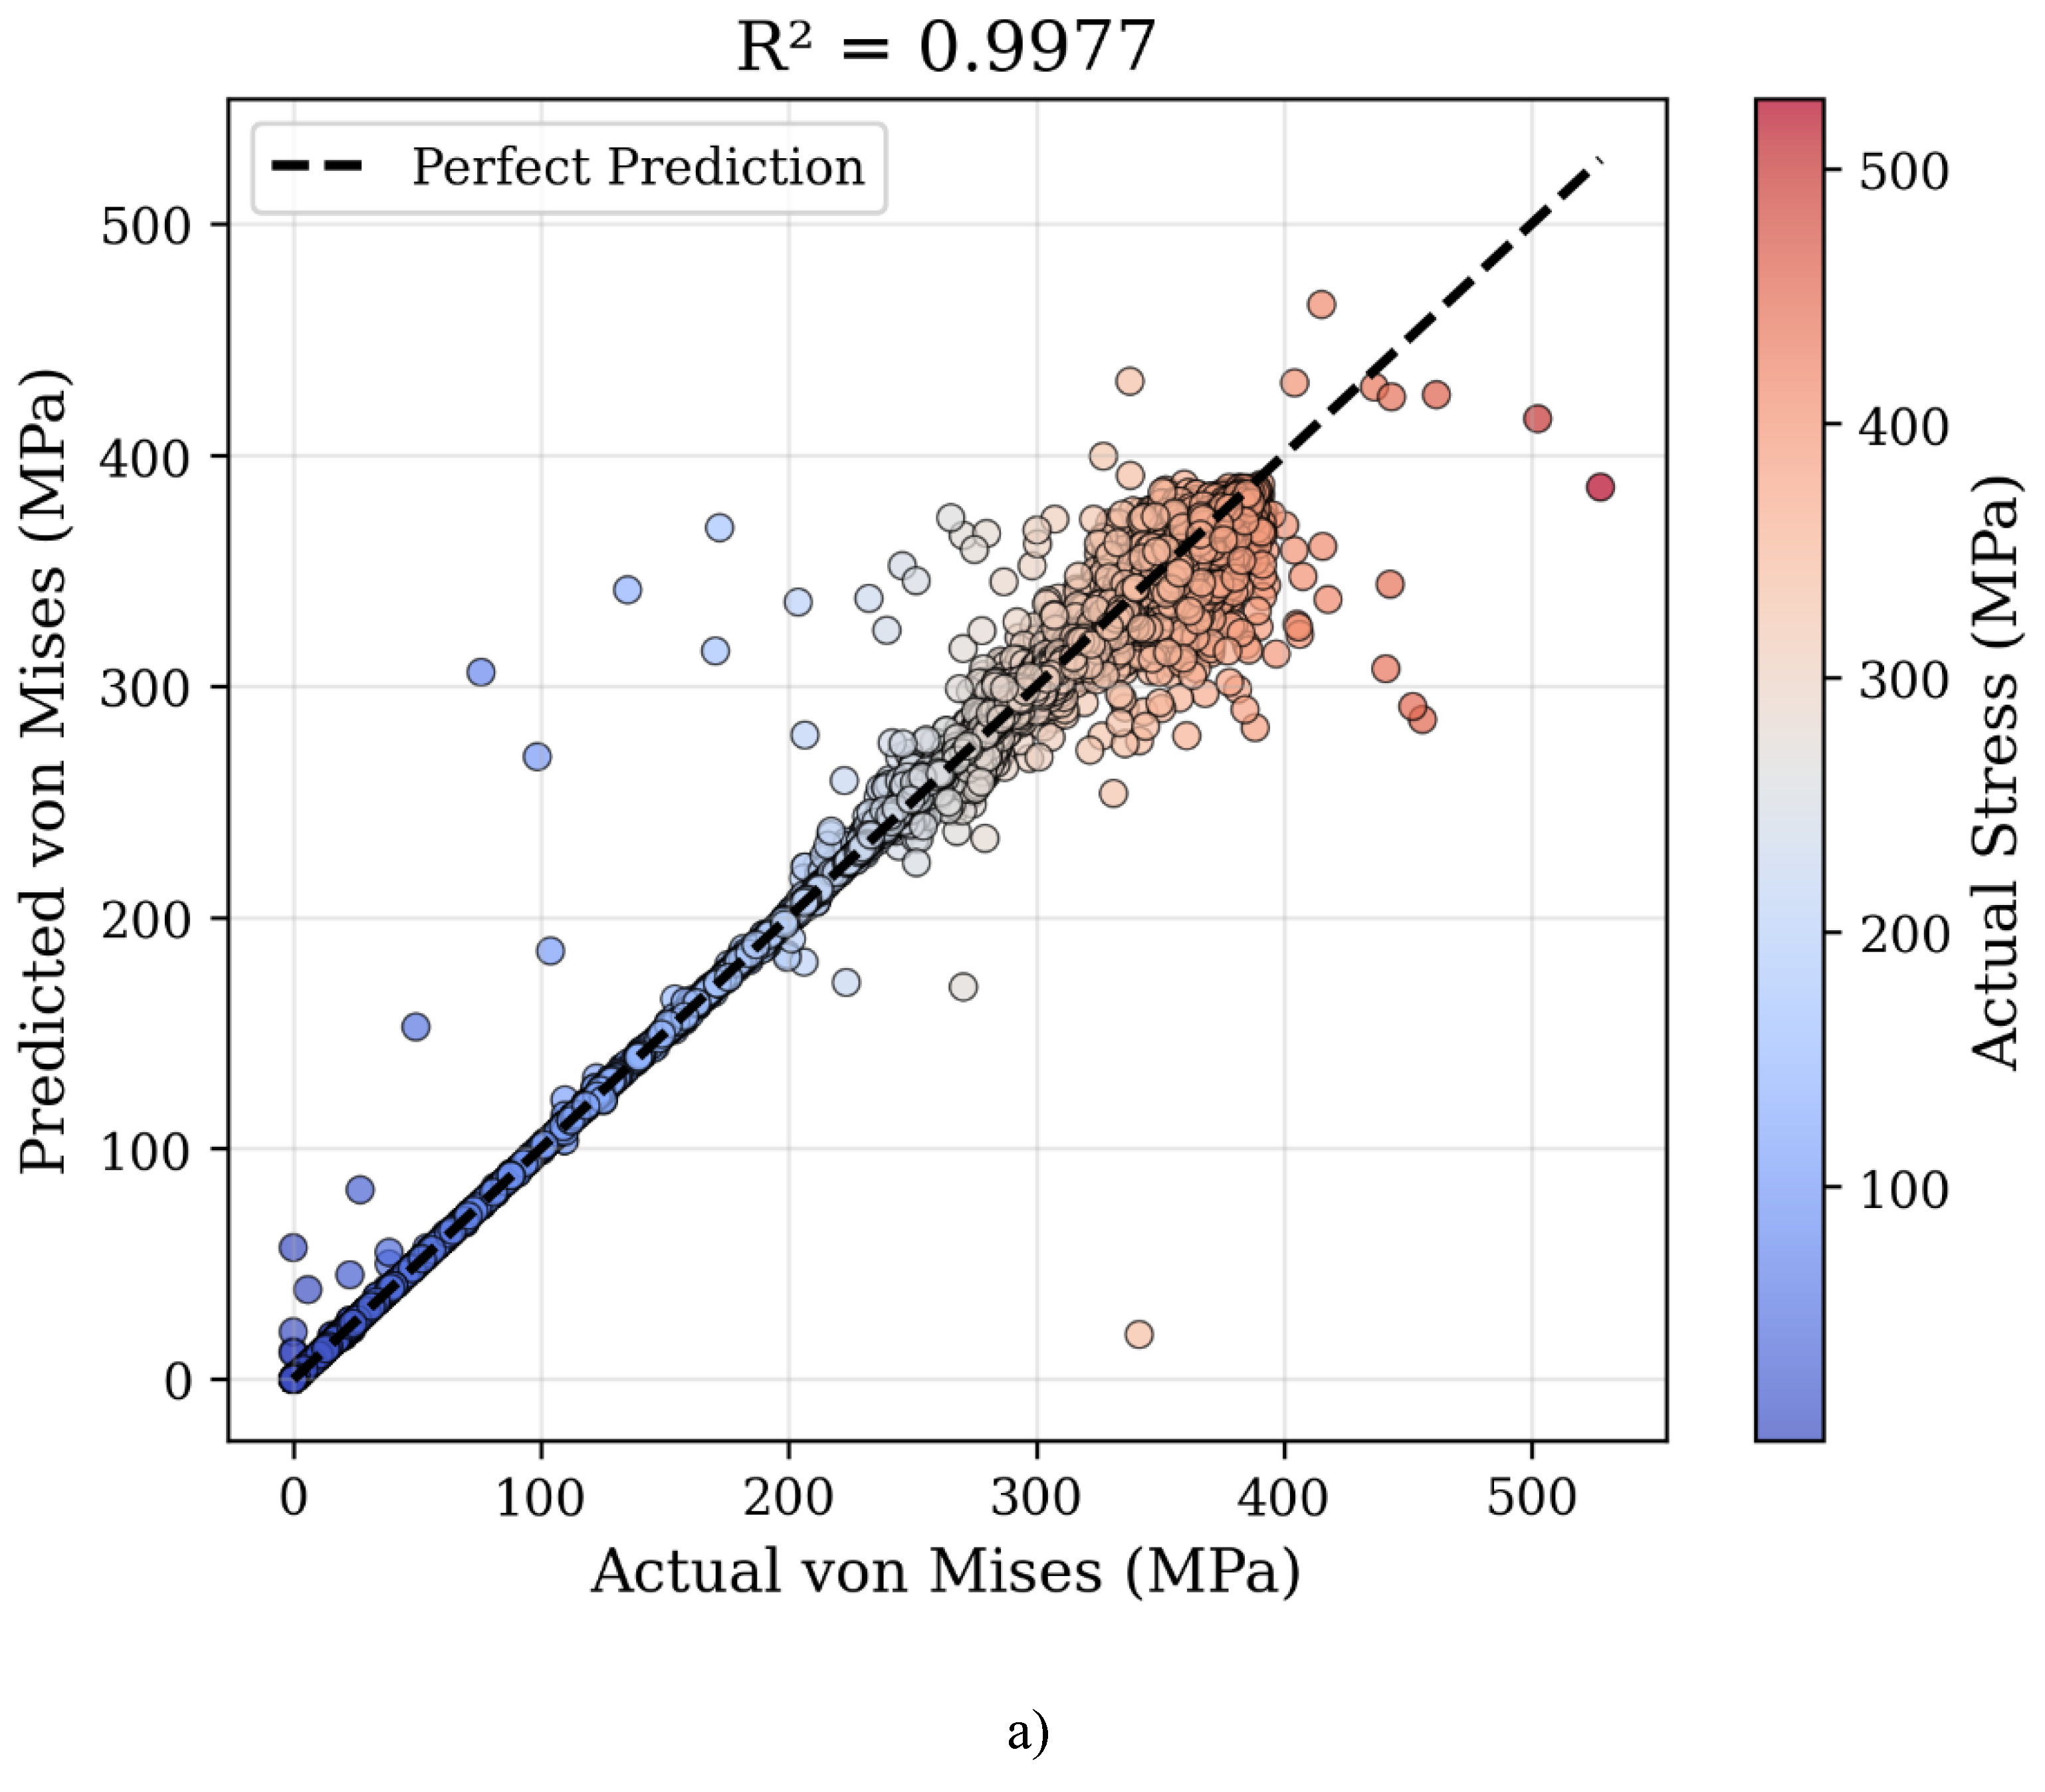
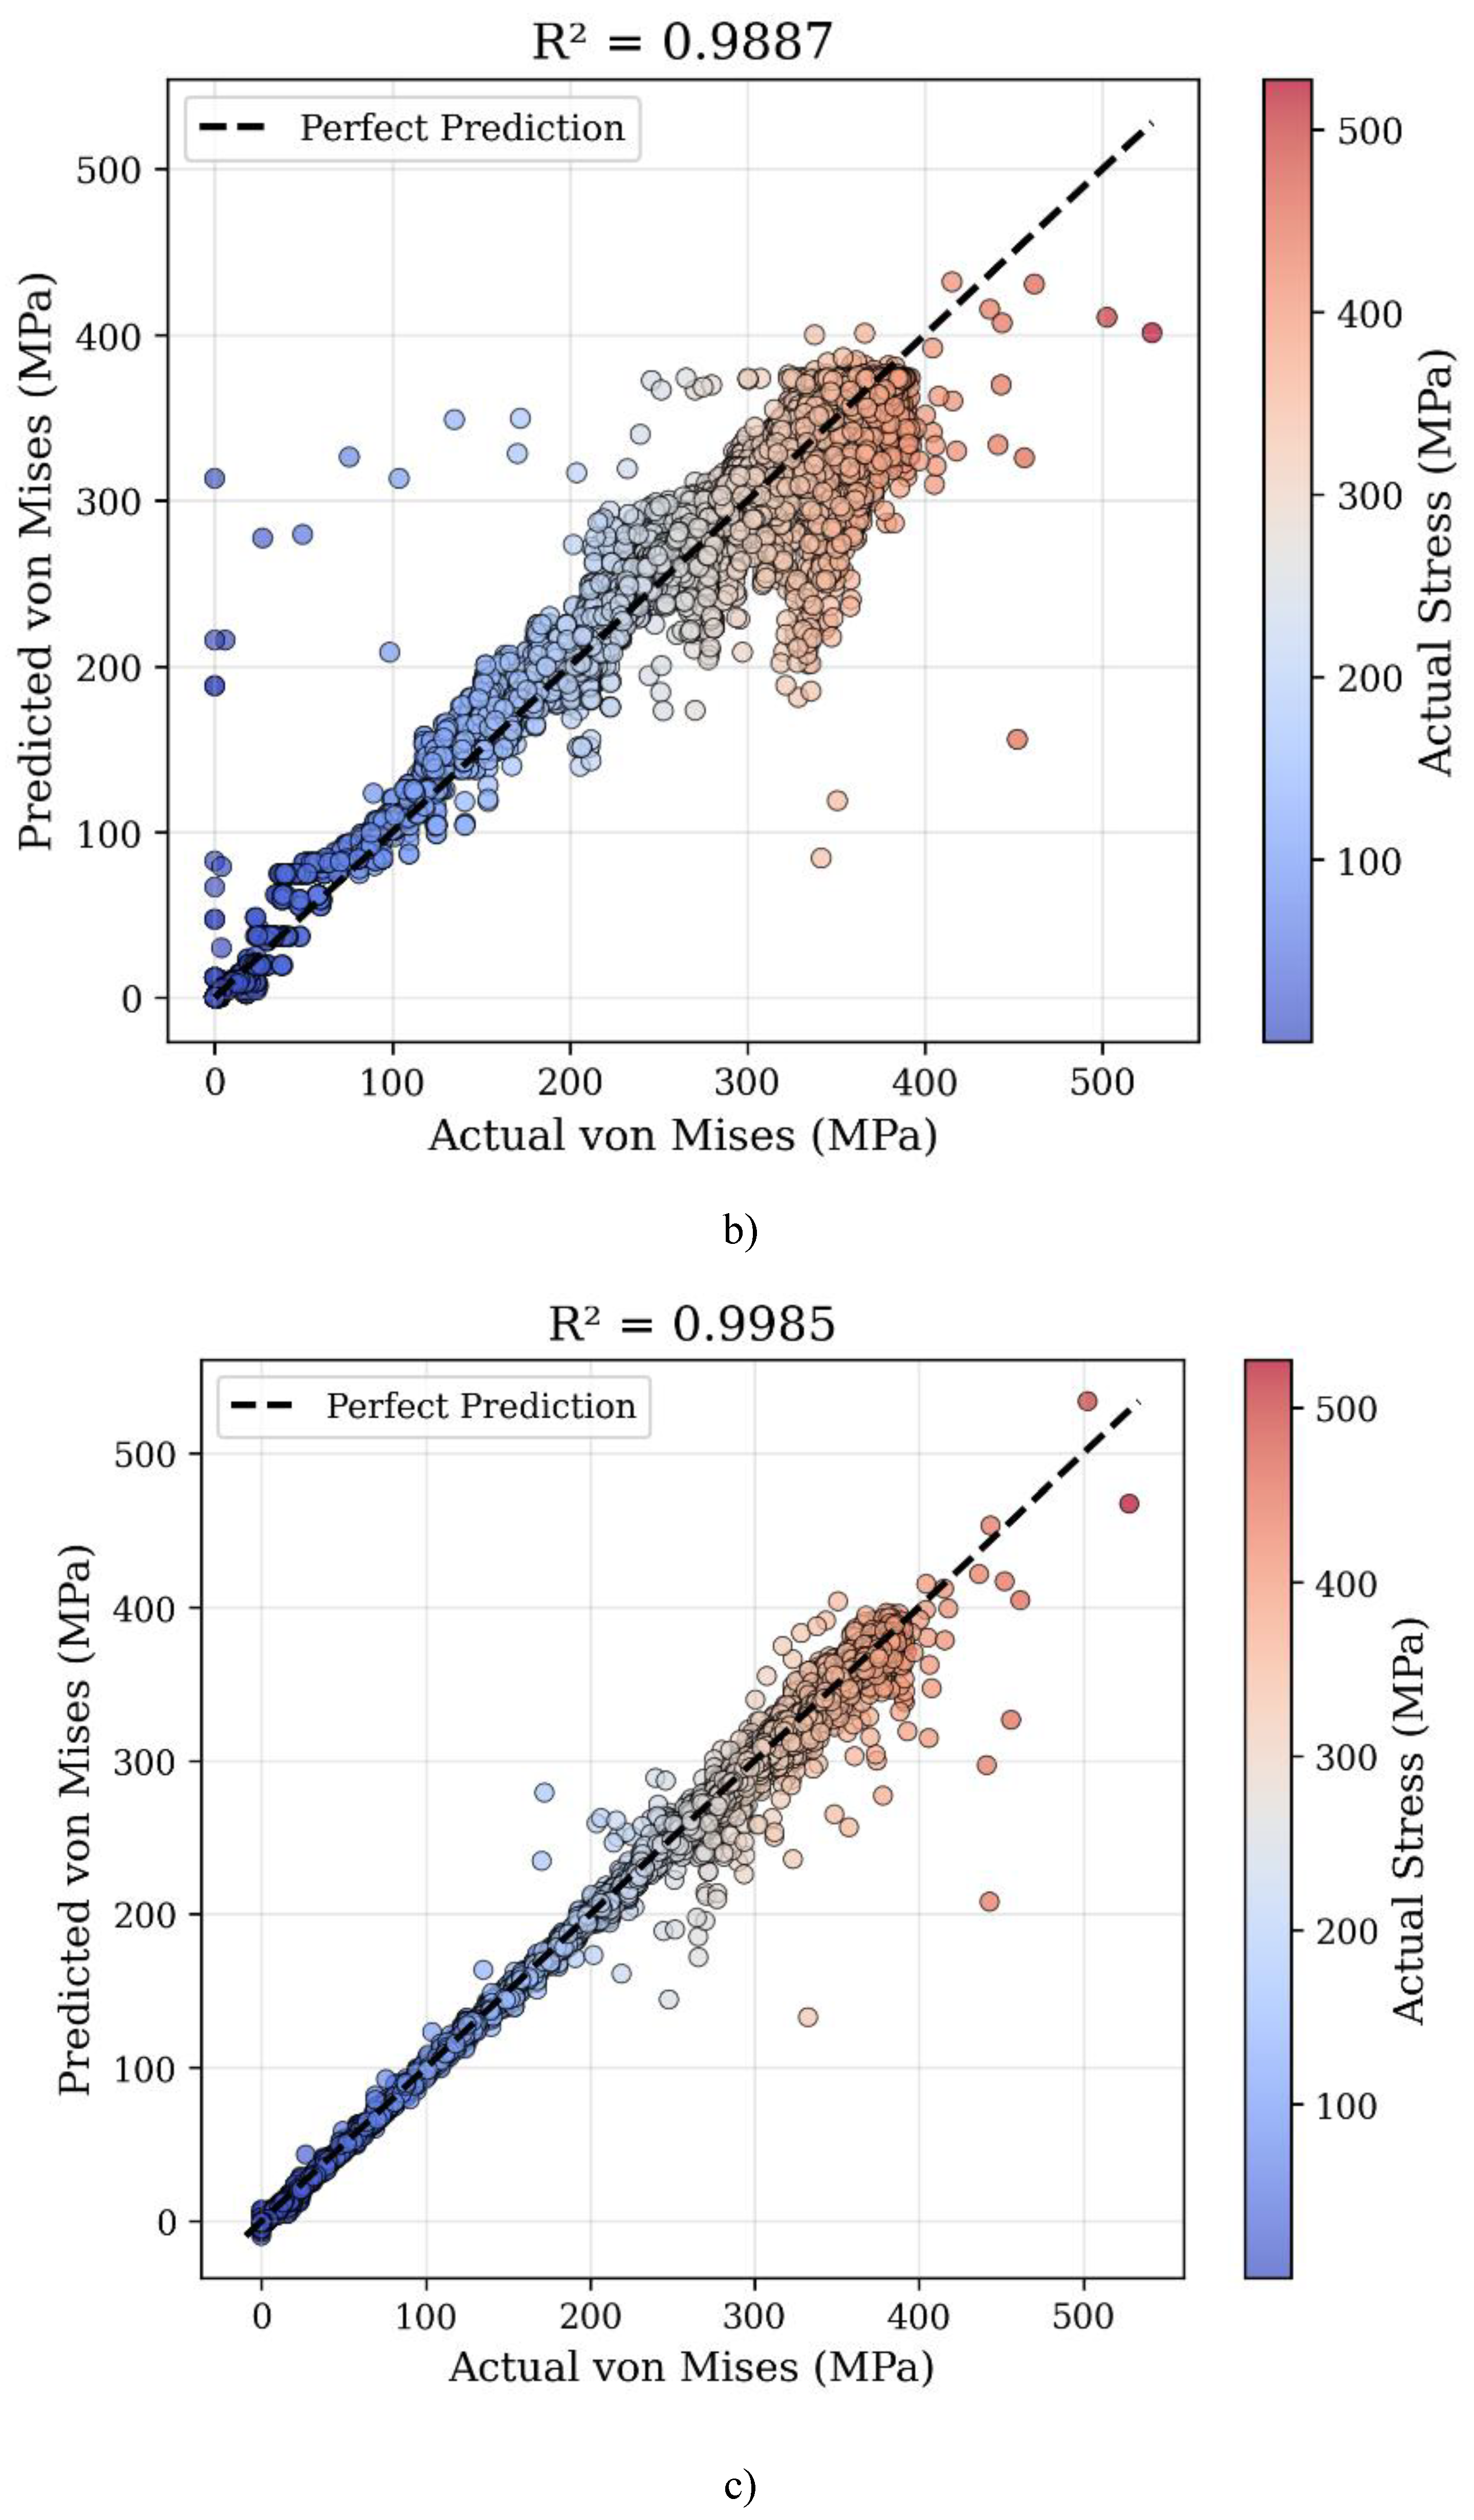
Disclaimer/Publisher’s Note: The statements, opinions and data contained in all publications are solely those of the individual author(s) and contributor(s) and not of MDPI and/or the editor(s). MDPI and/or the editor(s) disclaim responsibility for any injury to people or property resulting from any ideas, methods, instructions or products referred to in the content. |
© 2026 by the authors. Licensee MDPI, Basel, Switzerland. This article is an open access article distributed under the terms and conditions of the Creative Commons Attribution (CC BY) license (http://creativecommons.org/licenses/by/4.0/).
Copyright: This open access article is published under a Creative Commons CC BY 4.0 license, which permit the free download, distribution, and reuse, provided that the author and preprint are cited in any reuse.