Submitted:
06 February 2026
Posted:
09 February 2026
You are already at the latest version
Abstract
This work presents the first in-depth investigation of Theodor Aman’s paintings that focuses on three of his heritage artworks: „Hora de peste Olt” (1866), „Teleleice in Harem” (1879), and „Regimul vechi” (1881), and that relies on both elemental and spectroscopic analytical techniques. Non-destructive Raman spectroscopy was employed on all three works of art to identify the pigments used by the Romanian master. In addition, micro-samples were available from "Hora de peste Olt" and "Teleleice in Harem", which were further analyzed using XRD, micro-Raman, ATR-FTIR, and SEM-EDS techniques to provide complementary information on the pigments. SEM-EDS was also applied to study the structure of the preparation layers. The analyses revealed significant differences between the artworks in terms of both the pigments employed and the preparation of the canvas, suggesting that the earlier artwork belongs to one creative phase, while the newer pieces can be attributed to a later phase in the artist’s career.
Keywords:
Theodor Aman
; pigments
; spectroscopy
; degradation phenomena
1. Introduction
Since the first radiographs of paintings were recorded by Walter König, the study of cultural heritage objects has always benefited from the advancement of new spectroscopic techniques applicable in materials science. The main difference that arises in the application of these techniques, as opposed to other research fields, is that the items under investigation present unique cultural value that imposes great care in their protection. As such, researchers generally rely on in situ, non-destructive or micro-destructive techniques in the analysis of cultural heritage artefacts [1]. These techniques include X-ray-based methods such as XRD, XRF, XPS, PIXE, etc., UV-VIS and fibre-optic reflectance spectroscopy, vibrational spectroscopy such as Raman and IR, to complex hyphenated chromatographic and mass spectrometry techniques, etc. The landscape of analytical techniques is always advancing, allowing for greater understanding at the macro, micro, and nano levels of the various components of the works of art. Current techniques have allowed researchers to study works of art in depth, allowing them to investigate their composition, provenance, the interaction between their composing materials, and the degradation processes that affect them. However, the intrinsic complexity of most artifacts forces researchers to rely on a multitude of investigative techniques that complement each other in order to fully characterize them.
Theodor Aman (1831–1891) can be considered the architect of modernity in Romanian painting, as he was the one who ensured the synchronization of national visual arts with the European value system through his dual mission as a visionary artist and an institutional founder. His work constitutes an effervescent junction between the rigors of Parisian academic canons and the first pulsations of modernity, foreshadowing plastic solutions that would become benchmarks for subsequent generations [2]. Through his masterful command of traditional genres—ranging from historical composition to genre painting and engraving—Aman succeeded in crystallizing a national visual identity under the auspices of exceptional technical refinement. His originality lies in his capacity to infuse descriptive realism with a unique luminous sensibility, transforming historical or social documents into artistic facts of high aesthetic standing.
In the present study, the first in-depth analysis of Aman’s works, which relies on a combination of vibrational techniques p-Raman, μ-Raman and FTIR, elemental, SEM-EDS, and mineralogical, XRD, is performed. Three important works of art by Aman were selected that are both emblematic of the master’s thematic versatility, capturing everything from social and historical critique to rural idyll and Orientalist exoticism and that also display a wide range of hues and pigments indicative of his color palette. “Hora de peste Olt”(1866) (Figure 1 a) is part of the famous "Hore" cycle and, in this work, Aman idealizes rural life as a pillar of national identity. Unlike his salon scenes, the master adopts a solar and dynamic perspective here, marking his opening toward plein-air painting [3]. From a technical standpoint, one observes a more fragmented freedom of brushwork, intended to capture the circular movement of the dance. The artist partially abandons the rigor of the line in favor of patches of color that vibrate under natural light. The chromatic palette is dominated by warm, earthy tones, punctuated by the brilliant white of the traditional folk costume (i.e, catrință), rendered with a precision that betrays the artist’s love for authentic picturesque detail. Through this luminous effervescence, Aman foreshadows the interest in light that would later be perfected by Nicolae Grigorescu [4].
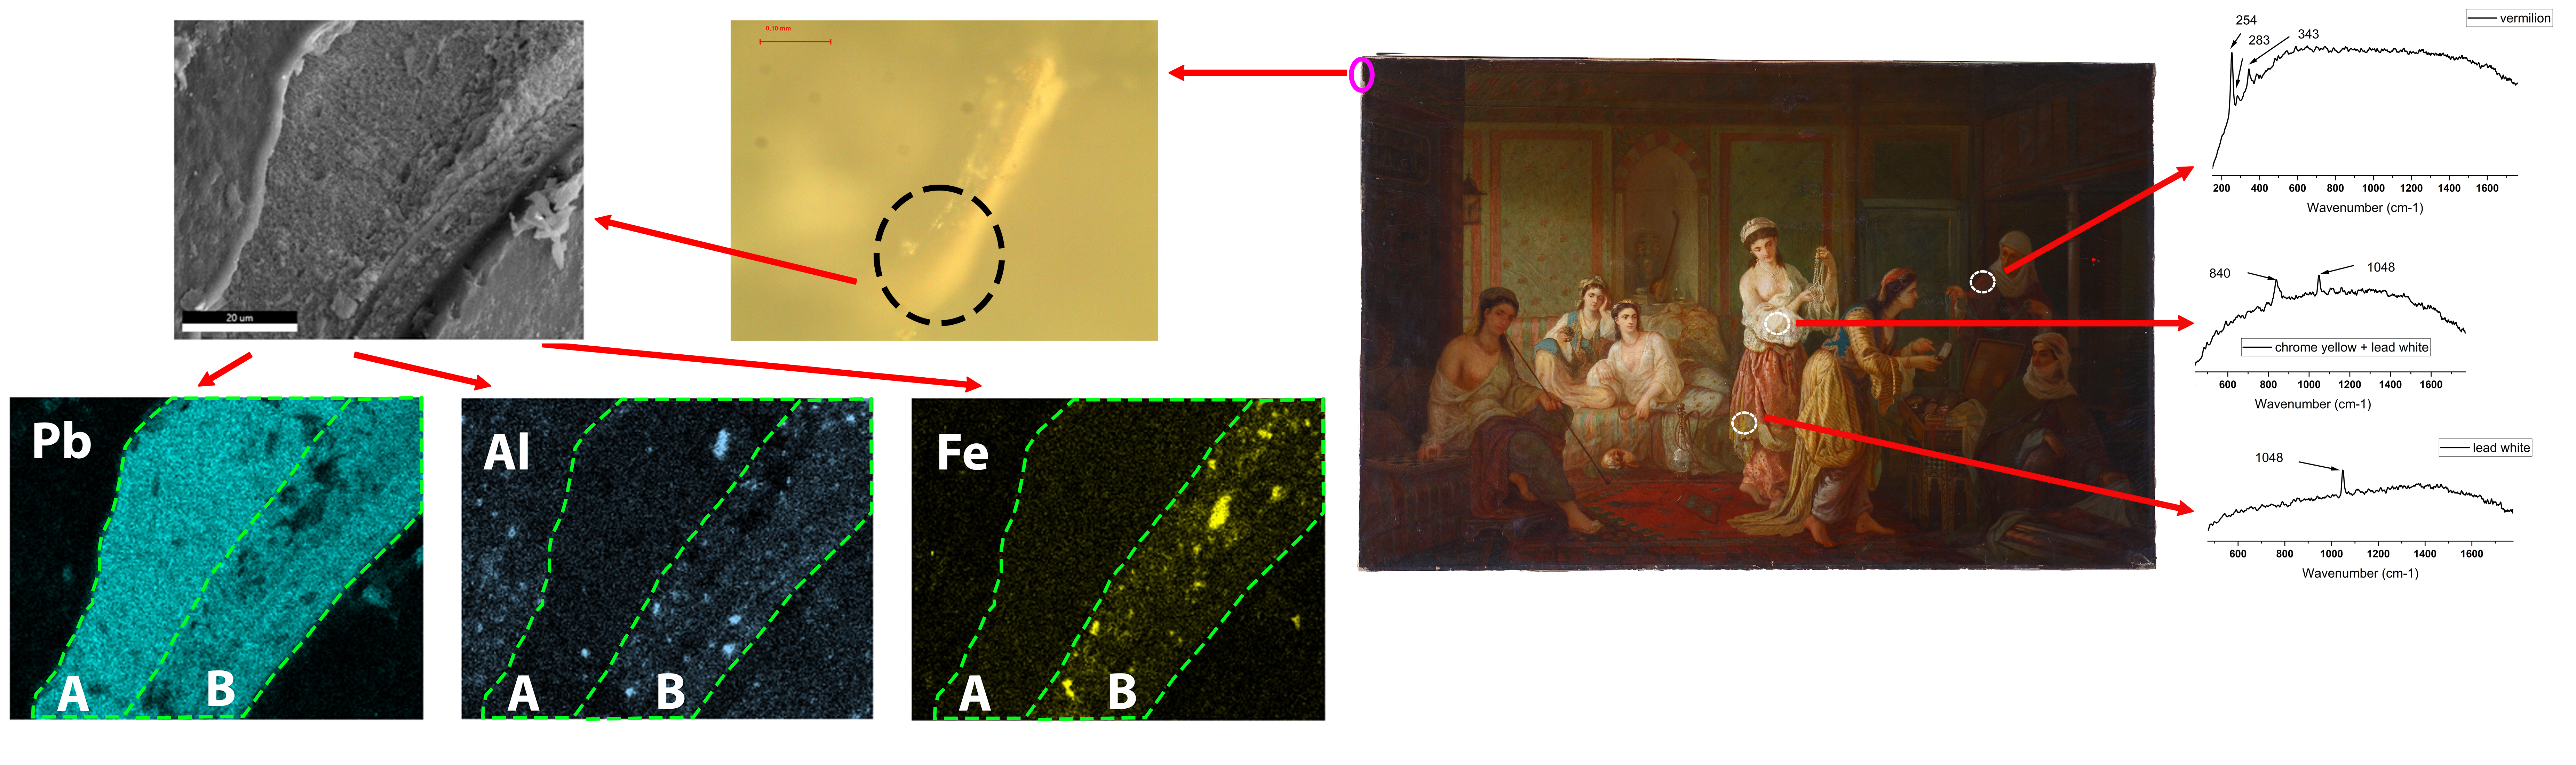
“Teleleice în Harem” (1879) (Figure 1 b) is an interior scene that reflects Aman's fascination with the "Near East," transposed into an atmosphere of siesta and controlled sensuality. Unlike his historical paintings, the composition here is relaxed, often unfolding horizontally, suggesting the characters' surrender to the enclosed space of the harem [5]. Aman does not seek documentary truth, but rather creates an atmosphere of oneiric reverie, emphasizing tactile contrasts. His refined technique succeeds in differentiating the density of Oriental carpets from the fineness of transparent veils and the metallic reflections of copper vessels. Color thus becomes the primary instrument for suggesting a warm and mysterious ambiance, transforming the "exotic" into a demonstration of technical modernity and chromatic virtuosity [6].
“Regimul Vechi” (1881) (Figure 1 c) is a piece of strong narrative and critical character, reflecting the structural transformations of 19th-century Romanian society through the contrast between the old feudal-Phanariote order and the new modernizing currents [7]. Aman utilizes a technique based on chiaroscuro and a rigorously structured composition to emphasize the ideological message. The artist employs successive glazes (thin layers of color) to achieve depth and a faithful rendering of materiality, from the heavy texture of brocade to the sheen of silk. Stylistically, the canvas aligns with Academic Realism, where drawing precedes and disciplines color [8]. The characters are strategically placed in space, with light being used as a psychological element to isolate or highlight the anachronism of figures who refuse to adapt to the country's new European rhythm.
2. Materials and Methods
This study relied on on-site analyses with portable equipment performed at the “Moldova National Muzeum Complex”, and on investigations of collected microscopic fragments using tabletop instruments. Portable Raman measurements were performed using R-3000CN from Raman Systems, Woburn, MA, USA equipped with a 785 nm diode laser. Spectral resolution was set to 2 cm−1, while integration time was 10 s. Laser power was in the 10–50 mW range, and the laser spot was about 0.1 mm in diameter. The spectrometer was calibrated before each experimental session using the Raman peak of a silicon crystal at 520.5 cm−1. The portable-Raman analysis points, as highlighted in Figure 1, are referenced further on with the initial of the work of art, H for “Hora de peste Olt”, T for “Teleleice în Harem”, and R for “Regimul Vechi”, followed by the number of each analysis point.
Classical tabletop analytical techniques were employed for microscopic samples collected from areas under the picture frames, as highlighted in Figure 1. Grains, generally less than 1 × 1 mm in size, were collected from blue and green colored areas for “Hora de peste Olt”, referenced from now on as H_b and H_g, and from red and green areas from “Teleleice în Harem”, referenced from now on as T_r and T_g. ATR-FTIR spectra were produced with a Bruker Vertex 70 instrument (Billerica, MA, USA), in the 4000–6000 cm−1 region, with a resolution of 2 cm−1, by performing 64 scans at room temperature, using the ATR technique and the Opus 5 FTIR Software. Due to the brittleness of the samples, grains selected for ATR-FTIR cracked into 2 or more pieces when removing them from sample bags with tweezers. When possible, the individual pieces were collected, and a spectrum was recorded for each individual one. For this reason, there are one recorded spectra for H_b and T_r , 3 for T_g (from now on called T_g_1, T_g_2, T_g_3) and 3 for H_g (from now on called H_g_1, H_g_2, H_g_3). For the microscopic grains collected from the rims of the paintings, Raman spectra were recorded using a Renishaw InVia Reflex spectrometer with a 785 nm diode laser through a 50× objective. The laser power density on the samples was minimized to 5 mW to avoid any thermal damage. Each spectrum was recorded using a 1s accumulation time for 15 spectral accumulations to achieve an acceptable signal-to-noise ratio. The resolution of the recorded spectra was 2 cm−1. The spectrometer was calibrated before each experimental session using the Raman peak of a silicon crystal at 520.5 cm−1. The SEM-EDS analyses were performed with a FEI NanoSEM430 (Hillsboro, USA) with the following settings: 4 mm working distance, and an accelerating current of 20 KeV. Grains from all 4 samples were mounted with conductive double adhesive tape on Al stubs. One H_g grain was encased in Struers EpoFix Resin and sectioned with a Microtome CUT4050 (microTec Laborgeräte GmbH, Walldorf, Germany) prior to SEM-EDS investigations. XRD diffractograms were recorded on a Rigaku SmartLab X-ray diffractometer, Cu anode, 2θ 2° to 90°, scan step 0.02°, 3°/min acquisition time, and phase identification was performed with Match! 4 software (Crystal Impact, Bonn, Germany). OM images were collected with a Leica DM2500 M microscope (Wetzlar, Germany) and LAS Interactive Measurement software (https://www.leica-microsystems.com/products/microscope-software/p/leica-las-x-ls/) for image acquisition. Graph creation for the FTIR, Raman, and µ-Raman spectra, as well as background subtraction, were performed using Origin software (https://www.originlab.com/).
3. Results
The complementary use of portable techniques, p-Raman, and micro-invasive analyses, μ-Raman, ATR-FTIR, XRD, and SEM-EDS, has revealed the presence of multiple pigments that compose the color palette of the artist. Table 1 summarizes the list of identified pigments and the corresponding analytical techniques that allowed for their identification.
3.1. Portable Raman Spectroscopy
Vermillion is a very good Raman scatterer and, as such, good quality spectra were recorded both with portable (“Hora de peste Olt” points H14, H15, “Teleleice în Harem” points T6, T7, T17, T18, T28) (Figure 2 a, b) as well as µ-Raman instruments. Its characteristic bands appear at 253-255 cm−1(A1 mode), 278-286 cm−1 (Eu mode), and 343 cm−1 (Eu mode) [9].
Lead white was observed only in the portable Raman spectra, and it was identified in all 3 paintings, analysis points H2, T11, T18, T28, R19, R20, on the basis of the main 1047 cm-1 peak (Figure 2 a, c) (CO32−symmetric stretching) [10]. In analysis points T13 and T14, the recorded Raman spectrum showed the presence of chrome yellow (PbCrO4) (Figure 2 a) as identified by its main vibration bands at 839 cm-1 (stretching ν1) [11]. Ultramarine was identified by portable Raman spectroscopy in “Regimul Vechi”, point R9 (Figure 2 c), based solely on the main band at 545 cm−1, attributed to S3− ν1 S-S symmetric stretching. [12].
3.2. μ-Raman Spectroscopy
In the case of the µ-Raman measurements, ultramarine was found in all samples (Figure 3 a). Aside from the main band, around 546 cm-1, several spectra also featured its first overtone (2ν1) at 1093-1096 cm−1 [12]. The excellent spectrum, presented in Figure 3 a from H_b, also shows the bands at 258 cm−1 (S3− ν2 symmetric S-S bending), 585cm−1 (S2− ν1 symmetric S-S stretching) and 805 cm−1 (S3− ν1+ν2 overtone). In the same spectrum, a very weak peak appears at 835 cm-1 (stretching ν1) [11], indicating that Aman also used chrome yellow in “Hora de peste Olt”.
In the case of T_g, a better spectrum for chrome yellow was obtained, with 2 vibration bands at 358 cm-1 (ν4 symmetric bending ) and at 839 cm-1 (ν1 stretching) [11] being observable (Figure 3 a). The previously mentioned characteristic Raman bands of vermillion were observed in spectra recorded for H_b, T_r, and T_g. Goethite (α-FeOOH), the compound responsible for the yellow color in yellow ochre, was observed in only one analysis point in H_b (Figure 3 b), and due to the high fluorescence of the spectrum, only the main band at 387 cm-1, characteristic of the B3g phonon [13], appeared as a very weak peak. On the same sample 2, spectra of hematite (Fe2O3), the Fe oxide that gives red ochre its distinct color, were recorded (Figure 3 b). This compound was identified based on its characteristic vibration modes at 228 cm−1(A1g), 248 cm−1 (Eg), 294 cm−1 (Eg), 298 cm−1 (Eg), 412 cm−1 (Eg), 500 cm−1 (A1g), and 610 cm−1 (Eg) (Figure 3 b) [14]. The Raman measurements showed the presence of pararealgar (As4S4), the degradation product of the realgar pigment, with an identical chemical composition, in H_b. However, due to the fluorescence and noise of the spectrum, only one band centered around 234 cm-1 was observed instead of the main doublet at 230 cm-1 and 236 cm-1, while the rest of the bands were not present [15].
In regard to organic molecules based pigments, carbon black (Figure 3 c) was observed in all samples, with the distinctive features of the D band around 1355-1365 cm-1 and G band at 1582- 1587 cm-1 being present [16]. Prussian blue (Figure 3 c) was identified solely on samples from “Hora de peste Olt”, with over a dozen µ-Raman spectra showing the characteristic doublet at 2098 cm-1 and 2152 cm-1 (C≡N stretching) [10].
One highly fluorescent spectrum collected from H_b presented bands at 1385 cm-1, 1430 cm-1 and 1624 cm-1 (Figure 2 c). Reference literature indicates that, in the case of Indian yellow, a natural mixture of the magnesium and calcium salts of euxanthic acid (eux) derived from the urine of cows fed on a diet of mango leaves used until the early 20th century, it is very difficult to obtain Raman spectra using a 785 cm-1 wavelength laser [17]. At this wavelength, the bands are weak and the main ones, in order of intensity, appear at 1626 cm-1(ν(C-C)eux + δ(C-H)eux + δ(O-H)(C-8)), 1425 cm-1(ν(C-C)eux + δ(C-H)eux), 1441 cm-1(ν(C-C)eux + δ(C-H)eux), 1346 cm-1(δ(C-H)eux + δ(O-H)(C-3′) + ν(C-HC)eux) and 1368 cm-1(δ(C-H)eux + δ(O-H)(C-3′) + ν(C-HC)eux), respectively [17]. In the spectrum presented in Figure 2 c, the weaker bands are not present, while the doublet at 1425 cm-1, and 1441 cm-1 appears as a broad shoulder at 1430 cm-1, and only the main 1624 cm-1 band is sharp. While other painting materials present bands close to 1624 cm-1, they also have more intense bands in the region of 1500 cm-1-1700 cm-1, which makes their assignment inadequate or were not available at the time of the creation of the works of art. For the band at 1385 cm-1, the most likely source is a very disordered graphite grain located in the vicinity of the Indian yellow. Disordered graphite with a very intense D band and a low G band has been documented at similar wavelengths [18], and its presence is probably associated with carbon black.
3.3. XRD
The minerals present in the 4 samples were identified based on their XRD patterns with their most important peaks highlighted (Figure 4) and the complete list of entries for each sample being presented in supporting information (Figure S1-4). The peaks of hydrocerrusite overlap with most of the cerussite peaks, and as such, it was chosen to highlight the peaks of hydrocerrusite, highlighting only the distinctive cerrusite peak at 25.47.
For quartz, whose main peak at 2θ=26.64 overlaps with the second most intense peak of cinnabar, it was chosen to indicate the position of this peak.
The analysis of the diffraction pattern shows that all samples contain both hydrocerussite and cerussite, the two main components of the lead white pigment. Their presence can be attributed to both the use of lead white as a pigment in itself and as a component in the preparation layer of the canvas.
For “Teleleice în Harem”, XRD analysis showed the presence of kaolinite in both samples. Impurities of kaolin, such as muscovite, were found T_g, while quartz was identified in T_r. The presence of quartz cannot be solely attributed to the use of kaolin, as cinnabar and red ochre, other minerals identified by XRD and Raman spectroscopy, are also known to contain quartz impurities.
The identification of cinnabar, the mineral from which the red pigment vermilion is produced, in both “Teleleice în Harem” samples, while other pigments identified via Raman or EDS spectroscopy were not found, is likely due to its higher crystallinity rather than the amount used in the artwork.
For “Hora de peste Olt”, the XRD investigations were able to identify only the materials used in the preparation layer of the painting. As such, alongside the hydrocerussite and cerussite, previously mentioned barite, calcite and dolomite were also encountered. The presence of barite can be attributed to the use of barium white pigment, while calcite and dolomite are components of chalk.
3.4. OM and SEM-EDS
SEM-EDS measurements of the samples proved difficult as they were very brittle, and simple handling in order to mount them with conductive double adhesive tape on Al stubs resulted in them breaking apart. As such, fractured grains were investigated for the T_r, H_band H_g samples. Section investigations were possible for a T_g, as handling resulted in a clean break, and for H_g a grain was encased in resin and sectioned. Elemental compositions of the investigated areas are presented in Table 2.
Prior to SEM-EDS investigations, OM was performed on the samples chosen for analysis and areas with different color grains were recorded in order to determine the materials used by the painter by correlating feature observed in OM with ones notices in SEM.
Red grains, designated as 1, 2, 3 and 4 in the OM investigations (Figure 5 a, b, c) of T_r, were analyzed by EDS (Figure 5 d, e, f, g). The investigations showed that significant amounts of Fe and Hg were present (Table 2, lines 1-4). The presence of Hg can be straightforwardly attributed to the use of vermillion, HgS, which has a bright intense red color. The rather low amounts of Hg compared to Fe are due to the fact that vermillion has high tinting power, and generally, even a small amount allows for developing the required shade.
The presence of Fe in these red grains can be correlated to the use of red ochres, which was observed in the μ-Raman investigations. Ni is found in most cases in reduced amounts in the area of the red grains, and its presence can be correlated to Ni being an impurity in iron-bearing ores that contain hematite [19]. The investigations also showed the presence of As (Table 2, line 5), however, its identification in only one analysis point indicates that the painter made little use of realgar, As₄S₄.
The investigation of several grains that were dislodged from the original sample upon mounting on Al stubs (table 2 lines 5-7, Figure S5) further confirms the use of red ochre and vermillion, with atomic percentages reaching 26.41% for Fe and 13.61% for Hg. In most analysis points, Pb is found in significant amounts, indicating that Aman made extensive use of the lead white pigment. Its presence also greatly influenced the quantification of S due to the overlap of the Mα1 at 2,345.5 of Pb, which is intense due to the high amount of Pb, and the Kα1 at 2,307.84, Kα2 at 2,306.64 and Kβ1 at 2,464.04 of S. Due to this, the stoichiometry for both realgar and vermillion is not respected in the atomic percentages. The analysis of these grains also showed important amounts of Zn and Cr, which can be correlated to the use of zinc yellow (4ZnCrO₄·K₂O·3H₂O). Other elements that were encountered include Al, Si, Ca,K, Mg, which can be correlated to the presence of alkali feldspars and kaolin.

Table 2.
Atomic concentrations of elements, as determined by EDS measurements from various analysis points in the investigated samples.
Table 2.
Atomic concentrations of elements, as determined by EDS measurements from various analysis points in the investigated samples.
| No | C | N | O | Mg | Al | Si | S | K | Ca | Cr | Fe | Ni | Cu | Zn | Pd | Ba | Au | Hg | Pb | As |
| 1 | 19.63 | 0.81 | 39.65 | 0.56 | 3.89 | 6.14 | 0 | 0.31 | 0.48 | 0.41 | 8.36 | 1.06 | 0.44 | 0.57 | 0.54 | 0.26 | 4.02 | 1.23 | 11.64 | |
| 2 | 46.82 | 1.16 | 38.86 | 0.52 | 2.03 | 1.85 | 0.01 | 0.18 | 0.54 | 0.23 | 3.21 | 0.19 | 0.05 | 0.28 | 0.1 | 0.04 | 0.79 | 0.09 | 3.04 | |
| 3 | 51.44 | 0.43 | 35.85 | 0.64 | 1.42 | 1.33 | 0.3 | 0.23 | 1.07 | 0.17 | 3.36 | 0.21 | 0.04 | 0.27 | 0.12 | 0.04 | 0.61 | 0.08 | 2.4 | |
| 4 | 36.36 | 1.2 | 38.8 | 0.37 | 2.53 | 8.37 | 0 | 0.1 | 0.35 | 0.11 | 3.61 | 0.58 | 0.26 | 0.34 | 0.28 | 0.1 | 2.45 | 0.62 | 3.55 | |
| 5 | 43.86 | 0.88 | 35.6 | 0.05 | 2.87 | 2.66 | 0 | 0.15 | 0.16 | 1.48 | 0.66 | 0.25 | 0.43 | 1.74 | 0.16 | 7.64 | 1.42 | |||
| 6 | 56.76 | 1.16 | 17.77 | 0.19 | 2.44 | 0.44 | 1.09 | 0.4 | 0.67 | 1 | 5.1 | 0.69 | 0.62 | 2.27 | 0.24 | 0.15 | 3.93 | 2.52 | 2.59 | |
| 7 | 31.44 | 0.64 | 8.34 | 0.15 | 1.41 | 0.24 | 1.44 | 0.63 | 0.81 | 1.12 | 26.14 | 1.01 | 0.86 | 3.72 | 0.21 | 0.31 | 6.58 | 13.61 | 1.32 | |
| 8 | 8.43 | 0.18 | 29.32 | 0.67 | 5.1 | 9.39 | 0 | 1.24 | 0.91 | 0.28 | 23.77 | 1.49 | 1.08 | 0.62 | 0.41 | 0.48 | 6.39 | 2.88 | 7.24 | |
| 9 | 43.23 | 0.66 | 26.42 | 0.38 | 1.38 | 1.67 | 0 | 1.18 | 0.77 | 3.71 | 4.54 | 0.93 | 0.56 | 5.15 | 0.16 | 2.41 | 0.73 | 6.12 | ||
| 10 | 54.08 | 1.29 | 27.33 | 0.25 | 0.84 | 0.75 | 0 | 0.11 | 0.4 | 1.01 | 3.3 | 0.5 | 1.4 | 2.15 | 0.08 | 1.92 | 0.46 | 4.14 | ||
| 11 | 11 | 56.99 | 3.36 | 1.13 | 2.15 | 1.72 | 0.09 | 9.85 | 0.01 | 0.44 | 0.06 | 0.31 | 4.25 | 1.45 | 0.05 | 7.14 | ||||
| 12 | 34.27 | 47.94 | 2.05 | 0.72 | 0.86 | 0.28 | 0.05 | 7.09 | 0.02 | 0.68 | 0.05 | 0.16 | 1.41 | 1.03 | 0.12 | 3.29 | ||||
| 13 | 18.68 | 50.5 | 6.34 | 0.43 | 0.71 | 0.07 | 0.15 | 14.62 | 0.09 | 0.6 | 0.17 | 0.2 | 1.19 | 1.31 | 0.14 | 4.21 | ||||
| 14 | 11.86 | 54.53 | 0.99 | 0.67 | 1.03 | 4.73 | 0.04 | 5.45 | 0 | 0.33 | 0.03 | 0.11 | 6.09 | 0.64 | 0.08 | 3.42 | ||||
| 15 | 46.83 | 30.93 | 0.55 | 5.12 | 1.09 | 2.09 | 0.31 | 0.9 | 0.42 | 5.31 | 0.65 | 0.37 | 0.23 | 1.7 | 0.8 | 2.72 | ||||
| 16 | 7.23 | 54.14 | 2.39 | 2.34 | 3.81 | 1.36 | 0.14 | 8.86 | 0.02 | 0.77 | 0.14 | 0.46 | 4.61 | 2.06 | 0.12 | 11.56 | ||||
| 17 | 34.66 | 27.98 | 0.41 | 1.35 | 0.89 | 0 | 0.61 | 6.09 | 0.91 | 5.04 | 0.61 | 0.75 | 1.17 | 5.8 | 0.85 | 12.87 |
OM investigations of the section of the T_g grain showed that the stratigraphy of the painting consists of a white preparation layer, followed by a red underlayer on top of which the final pigment and oil layer is situated (Figure 6). In the EDS mapping of the section for Pb, Al, Si and Fe, we have highlighted two distinct areas A and B that correspond to the white preparation layer and the red underlayer. In area A, there are higher amounts of Pb as opposed to B, while Fe is completely missing, and Al and Si are found on only two to three random grains. This indicates that the preparation layer was made exclusively with lead white. In area B, we find that Pb, Al, Si, and Fe are present, indicating that the red underlayer was composed of lead white, with the addition of red ochre. The kaolin identified in the XRD measurements likely comes from this layer as red ochre is based on siliceous clays, such as kaolin, rich in hematite (Fe2O3). The difference in the composition of the layer is obvious when looking at individual grains. As such, the most obvious is grain 3 highlighted in Figure 6 e) and h), where Pb is completely absent, and the EDS mapping of Fe shows a large, well-defined grain. For the grain indicated with 1 in Figure 6 d), e), f), g) and i), again we see a depletion of Pb well-defined edges appear for O, Al, Si and K, indicating the presence of a K feldspar, which is a common impurity in kaolin. Another impurity of kaolin quartz was observed due to the presence of Si (Figure 6 g) and absence of other elements in grains numbered 6 and 7. The grain highlighted with 2 in Figure 6 d), e), i), j) and k) provided conclusive evidence of the use of the use of zinc yellow, in use since the beginning of the 19th century, as in that area we observe a depletion of Pb and instead O, K, Zn and Cr are high. In the grains highlighted with 5 and 4 in Figure 6 e), l) and m), we observe low Pb while Hg and S are high, indicating the presence of vermillion on the very surface within the oil layer of the painting which is high in C and O. The EDS mapping also showed the presence of several Cu-rich grains, highlighted with 8, 9 and 10, which we could not correlate with any particular pigment, as they were not noticed during OM, and the presence of C and O in the binder and in the oil makes it impossible to attribute them to blue or green or other colored pigments, such as azurite, malachite, copper resinate, etc. Only a few random individual analysis points were also recorded in the section, and only the most important ones are presented (Table 2, lines 9, 10). Their composition mirrors the one in the EDS mapping, with high amounts of Fe from red ochre and significant amounts of Zn, Cr, and K from zinc yellow (4ZnCrO₄·K₂O·3H₂O). Both in the measurements for the red grains and the green grains, the stoichiometry of the zinc yellow is not respected, as Zn is in higher amount, indicating that an excess of ZnO was used in the manufacture of the pigment. Since no blue grains were clearly observed by OM, and ultramarine is a silicate mineral, its presence could not be clearly confirmed.
In the case of the H_b grain chosen for OM and EDS analysis, the sample cracked when handling, and the two largest pieces were then collected in order to be analyzed. Unfortunately, again, during mounting on Al stubs for EDS measurements, the samples cracked, and as such, no correlation with OM images could be performed. The investigations (Table 2, lines 11, 12, 13, 14) showed that the most abundant metals are Ca, Ba, Pb and Mg. The presence of Ca can be correlated with calcite, and that of Mg in dolomite, both found in chalk. Distinct analysis points where Ca is in very high amounts, 14.62 and 9.85, contain only much smaller amounts of S, indicating that CaCO3 is present and not gypsum, CaSO4. Ba and Pb, on the other hand, can be attributed to barium white and lead white, respectively. While Ba is also found in lithopone (a mixture of BaSO4 and ZnS), the small amounts of Zn in the analysis point indicate that this pigment is not present. Al and Si were found in several areas, indicating the presence of aluminosilicate impurities in the white pigments. In an area (Table 2, line 15), Fe is encountered in large quantities (5.04), but its presence cannot be clearly attributed to any specific pigment as OM analysis provides no support for the color of the individual analysis point, and Raman analysis proved the presence of Prussian blue, red ochre, and yellow ochre. Other elements are generally in small abundance, and no clear correlations can be made to their presence.
The analysis of H_g grains, mounted on Al stubs, showed a similar composition to the blue ones (Table 2 lines 16, 17). Again, the most abundant metals are Pb, Ca, Ba, and Mg that can be correlated to the use of lead white, barium white and chalk. The analysis of the green sample encased in resin and sectioned (Figure 7) showed that the stratigraphy of the painting consists of only the preparation layer (highlighted area in Figure 7 e, f, g, j, k) and the paint layer. The paint layer could not be highlighted as the encasing resin has a similar composition to the oil rich in C and O. The EDS mapping of the sectioned grain clearly confirms previous results, indicating that in the preparation layer Aman used a mixture of white lead, barium white and chalk (calcite with dolomite impurities).
Unfortunately, the paint layer was very thin and no pigments could be observed. Several distinct grains associated with impurities are observed, and the one highlighted as 1 (Figure 7 h) contains high amounts of Si. This is obviously a grain of quartz, even though in some areas the EDS mapping shows Ba and Ca. This indicates that the grain is not on the surface, but just below, and Si was detected, as EDS is a volume technique that can reach up to several μm in depth. The same can be said for the grains highlighted as 2 in the Al EDS mapping (Figure 7 j), which are likely feldspars. Distinct grains containing Fe were noticed (Figure 7 l), and their presence can be simply attributed to ochre residues on the paint brush when the artist created the preparation layer. Noticeably, no distinct grains of Hg (Figure 7 m) and Cr (Figure 7 n) are absent, indicating that in the section, no pigments associated with red or yellow are present in the analyzed area.
3.5. ATR-FTIR Spectroscopy
ATR-FTIR spectroscopy provided complementary molecular information to that obtained by other analytical techniques, contributing to an improved understanding of the materials’ composition and the execution technique. The infrared spectra of the samples are presented in Figure 8, while the individual assignments of the absorption bands for the T_r, T_g_1, T_g_2, T_g_3, H_b, H_g_1, H_g_2, and H_g_3 samples can be found in Table S1(ESI). In addition to the information regarding the degradation processes (aging of the drying oil, formation of degradation products), the identified absorption bands were mainly assigned by referring to the absorption bands of the pigments previously detected by Raman, XRD, and EDS spectroscopies.
In all studied samples, the FTIR spectra revealed the presence of the absorption bands associated with the vibrational modes of the carbonate groups from cerussite, including symmetric (between 1058-1061 cm-1) and antisymmetric (between 1397 – 1401 cm-1) stretching modes, in-plane (between 676 – 680 cm-1) and out-of-plane (between 828-838 cm-1) deformation modes of the CO₃²⁻ anion, as well as of the ν1 and ν4 combination bands of CO₃²⁻ (between 1734 – 1739 cm-1) [20]. In addition, the presence of the characteristic absorption bands attributed to O–H stretching modes (between 3531 – 3535 cm-1) and distinct vibrations of Pb–OH bonds (937 cm-1) of hydrocerusite was observed. The co-existence of these types of bands reflects the mixed nature of the white lead pigment, consisting of variable proportions of cerussite and hydrocerussite [21], and confirms its extensive use as a white pigment in the analyzed pictorial layers. The presence of quartz in the T_g_1, T_g_2, and H_b FTIR spectra was evidenced by the attendance of the characteristic absorption bands corresponding to Si-O symmetrical bending (691-696 cm-1), Si-O symmetrical (777 cm-1, 793 – 800 cm-1), and asymmetrical stretching (1170 cm-1) vibrations [22,23]. In addition to its usual association with red ochre, quartz frequently appears as an associated material with a range of black (black chalk/graphite), white (calcium carbonate, lead white, kaolin), colored (cinnabar, green earth) pigmentsor texturing agents (clay minerals) [24].
Kaolinite, present in the T_g_2 sample, exhibits four active IR hydroxyl stretching bands centered at 3689, 3667, 3652, and 3620 cm⁻¹, which originate from distinct types of hydroxyl groups. The three higher-frequency absorption bands belong to the stretching vibrations of the hydroxyl groups located on the inner surface, above the aluminum-oxygen layer, while the lower frequency band from 3620 cm⁻¹ corresponds to the internal hydroxyl group located below the aluminum atoms. In addition, the other two absorption bands from 937 and 910 cm⁻¹ are attributed to the in-plane bending vibrations of the hydroxyl groups from the inner and internal surfaces, respectively. Other absorption bands can be found at 1115 cm-1 (symmetric Si-O stretching, longitudinal), 1028 and 1002 cm-1 (in-plane anti-symmetric Si–O stretching), 937 cm-1 (OH deformation of inner-surface hydroxyl group), 910 cm-1 (OH deformation of inner hydroxyl groups), 785 cm-1 (OH translations), and 749 and 692 cm-1 (Si–O, perpendicular), respectively [25].
The absorption bands of chrome yellow (PbCrO4), found in the FTIR spectra of T_g_1, T_g_3, H_b, H_g_1, and H_g_3 samples, were located between 841 – 851 cm-1 and 751 – 756 cm-1, corresponding to Cr-O asymmetric and symmetric stretching modes, respectively [26].
The historic Indian yellow pigment, renowned for its vibrant color derived from the complex euxanthic acid molecule, a conjugate of euxanthone and a glucuronate derivative, holds a significant place in art history. Its identification in the FTIR spectra of T_r, T_g_3, H_b, and H_g_2 samples relies on a set of characteristic absorption bands, as defined by de Faria et al. [27]. The FTIR spectrum of Indian yellow displays several key diagnostic regions. These include bands between 1622-1627 cm⁻¹ (C–C stretch and C–H/OH bend of the euxanthic ring), 1580-1584 cm⁻¹ (asymmetric COO⁻ stretching combined with O–H bending), and between 1445-1459 cm⁻¹ (resulting from the superposition of C-C/C-H stretching/bending of the euxanthic ring, O-H bending, and asymmetric C-O-C stretching). Other absorption bands can be found at 1545–1550 cm⁻¹ (C–C stretch & C–H bend with C–O–C asym. stretch), 1365-1368 cm⁻¹ (C–H bend, C–C stretch & OH bend), 1235 cm⁻¹ (complex band involving C–C modes, C–O–C bend, and C(euxanthic)–O(glucuronic) stretch), between 1107–1115 cm⁻¹ and 1076–1081 cm⁻¹ (C–O–C asym. stretch and bend modes from the glucuronic ring), 1058–1061 cm⁻¹ (C–O–C asym. stretch from glucuronic ring), and 981–983 cm⁻¹ (C–C/C–H bending from both rings and O–H bend). The clear detection of other reported bands, notably those around 1487, 1423, 1345, 1258, and 1016 cm⁻¹ (see Table S1 ESI), was hindered by significant spectral overlap with the intense, broad absorption bands of the aged linseed oil binder.
Zinc yellow pigment was identified in T_g_2 and H_b samples. The identification was based on the detection of the characteristic vibrations of the chromate group (CrO₄²⁻) located between 1075 – 1077, 937 – 948, 780-787 cm-1 (Cr-O asymmetric stretching), 872 -874 cm-1 (Cr-O symmetric stretching), and between 705 – 711 cm-1 (O-Cr-O bending), respectively [28,29]. The presence of dolomite in T_r, T_g_1, and H_b samples was confirmed by the identification of thecharacteristic set of carbonate ion absorption bands. These bands appear at positions specific to dolomite, i.e., the in-plane bending (ν₄) at 721–729 cm⁻¹, the out-of-plane bending (ν₂) at 873–877 cm⁻¹, the symmetric stretching (ν₁) at 1095–1096 cm⁻¹, and the asymmetric stretching band (ν₃) at 1452–1459 cm⁻¹. The presence of calcite was also evidenced in the T_r, T_g_1, and H_b samples. Differentiation from dolomite is based on two key FTIR criteria, namely the characteristic shift of the ν4 band and the splitting of the ν3 band. In calcite, the ν4 band appears at a lower frequency, observed at 711 cm⁻¹ (compared to 721–729 cm⁻¹ domain for dolomite) [30]. This difference is a classic spectral marker to distinguish calcium carbonate from calcium-magnesium carbonate. Also, the broad asymmetric stretching band (ν₃) shows a complex structure, with a distinct component at around 1445 cm⁻¹, which can be attributed to calcite, along with the contribution of dolomite at higher frequencies. Thus, the FTIR spectra suggest the presence of a mixture of dolomite and calcite, identifiable by careful analysis of the shape and position of the ν₄ and ν₃ bands. While in XRD calcite and dolomite do not appear in T_r and T_g samples, their presence in the FTIR speactra can be attributed to to the fact that they are likely impurities found in kaolinite.
Following FTIR analysis, the presence of Prussian blue pigment could not be detected, suggesting that this pigment was not present at the analysis points. In addition, the vermilion and realgar pigments have no characteristic absorption bands in the studied range (4000–600 cm−1).
Interpretation of the FTIR spectra indicates that all analyzed samples consist of a complex mixture of aged linseed oil, mineral pigments, and metallic soaps. This complexity significantly limits the clear identification of any specific natural resin. The carbonyl region (1700–1750 cm⁻¹) is dominated by overlapping signals from aged linseed oil (oxidized carboxylic acids, ketones, and esters) and lead white pigments (cerussite/hydrocerussite), effectively masking any resin-specific bands. Similarly, the 1200–1000 cm⁻¹ region is mostly dominated by vibrations belonging to inorganic pigments (e.g., Si–O from kaolinite and ultramarine, SO₄²⁻ from gypsum and barium white, Cr-O from zinc yellow, CO₃²⁻ from calcite, C-C, C-H, O-C, and OH from Indian yellow) and broad contributions from the aged oil (C–O, C–O–C), preventing unambiguous assignment of diagnostic C–O or C–O–C bands from a resin. In the C–H stretching region (3000–2800 cm⁻¹), the observed signals are characteristic of long aliphatic chains, compatible with aged linseed oil, zinc soaps, andother organic materials, like resins and proteinaceous materials [31]. Consequently, although FTIR confirms the presence of a highly oxidized organic phase and chemical interactions (e.g., soap formation), it does not provide robust evidence for a specific resin, as the predominant components and advanced aging processes dominate the spectra in this region. However, a comparative analysis with reference spectra for natural resins [32] suggests that the presence of sandarac resin, especially in spectrum H_g_3, cannot be excluded and is, in fact, plausible. This tentative assignment is based on the coincidence of most of the characteristic absorption bands of sandarac resin. The observed minor shifts in 3 of the 19 characteristic absorption bands (e.g., from 1497 to 1510 cm⁻¹, from 1213 to 1205 cm⁻¹, and from 789-792 to 779-785 cm⁻¹) and the masking of the one from around 3079 cm⁻¹ by the large O–H absorption band are phenomena consistent with the behavior of an old organic material (aged sandarac resin) embedded in a complex and degraded matrix, where molecular interactions and oxidation state can slightly modify the vibrational frequencies.
The main absorption bands in the regions 3337-3349 cm⁻¹ (combined N–H/O–H stretching), 1660–1663 cm⁻¹ (amide I, C=O stretching), 1545–1550 cm⁻¹ (amide II, combination of C=O stretching and NH bending), and between1234–1235 cm⁻¹ (amide III, CH bending), together with the absorption bands in the domains 2970-2979 cm⁻¹ (asymmetric stretching of CH₃), 2901-2908 cm⁻¹ (asymmetric stretching of CH₂ and/or CH₃) and 2860-2875 cm⁻¹ (symmetric stretching of CH₃) and 1440-1447 cm⁻¹ (scissoring bending of the CH₂/CH₃ groups), constitute the evidence for the characteristic signature of a proteinaceous binder (animal glue) in case of 4_1 and 4_4 samples [33,34]. Due to the spectral overlap and very close positions of the fundamental absorption bands for all types of animal glues, conventional FTIR analysis does not allow identification of the specific type of animal source (e.g., distinguishing between rabbit skin, bone, or hide glues).
Even though ultramarine and barium white were identified by other techniques and their characteristic absorption bands are present in the FTIR spectra the overlap with other bands that belong to other compounds makes their identification problematic. The band assignment is presented in Tab S1 and ESI.
4. Discussion
The investigations were able to create a clear picture of the artist’s palette and the way he developed his various hues. For reds, Aman relied heavily on vermillion, while red ochre was mostly used in underlayers upon which the paint layer was applied. In the case of yellows chromate based pigments, such as chrome yellow and zinc yellow, are the most widely used, while yellow ochre, realgar and Indian yellow are employed in small amounts. Aman’s blues consist only of ultramarine, found in all 3 artworks, and Prussian blue, found only in “Hora de peste Olt”. Regarding green hues, the analysis was not able to find any green pigments and, instead, revealed that the painter relied on a combination of blues and yellows to develop his colors. Aman made extensive use of lead white, which was used as pigment in all 3 artworks and in the preparation layer of “Hora de peste Olt” and “Teleleice în Harem”. Barium white and chalk, two other white pigments, were only observed in the preparation layer of “Hora de peste Olt”. For black areas and in developing darker shades, Aman used carbon black.
The analysis showed that as the style of the artist matured, his chromatic palette became less diverse as he found the combinations suitable to develop the hues that interested him. As such, while in his earlier work “Hora de peste Olt” Aman also relied on Prussian blue, barium white and chalk by the time of “Teleleice în Harem” he had renounced using them.
“Hora de peste Olt” and “Teleleice în Harem” are clearly distinct also in regard to the painting technique employed by the artist. While for “Hora de peste Olt” the direct application of the paint layer on the preparation layer is observed, for “Teleleice în Harem” the artist opts for a more advanced technique, where a red underlayer is applied on the preparation layer followed on top by the paint layer. The simplification of the chromatic palette and the evolution of the painting technique clearly show two distinct phases in the paintings of Aman.
The simultaneous presence of free carboxylic acids and metal carboxylates is an indicator of advanced paint film degradation. Carboxylic acids are formed following oxidation and fragmentation of the base oil. Some of these acids react with metal ions in pigments or in the support, forming insoluble metal soaps (carboxylates). These compounds migrate to the surface, where they crystallize, forming visible protrusions (micro-scratches). The formation of soaps is a critical deterioration process, which leads to a series of visible effects: increased fragility and susceptibility to mechanical cracking, localized detachment of pigments (loss of paint layer), textural elevation of the surface, and modification of light tones due to the incorporation of dirt particles and alteration of the optical ratios of the layer [45].
The obtained FTIR data allow a detailed reconstruction of the degradation mechanism of siccative linseed oil. The process is initiated by a radical attack on the cis double bonds, leading to the formation of unstable hydroperoxides – a step highlighted by the broadening of the O–H band. These hydroperoxides constitute the starting point for a cascade of secondary reactions, the decomposition of which generates a diverse range of terminal carbonyl compounds, including acids, ketones, aldehydes, and lactones, illustrating the transition from reactive intermediates to stable degradation products [35]. The major structural transformation is marked by the change in the unsaturation pattern, namely the consumption of the cis double bonds and their isomerization to the trans form, a key indicator of advanced degradation that modifies the physical properties of the binder. In parallel, oxidative polymerization reactions lead to the crosslinking of the triglyceride chains by the formation of C–O–C and C–C bonds, strengthening the matrix but reducing its flexibility. The strong and broad signature of oil, especially in the carbonyl, alkyl C–H, and fingerprint regions, acts as a dominant background noise, masking the weaker characteristic bands of other constituents in a mixed paint layer, such as organic pigments. This interference highlights the limitations of FTIR in the analysis of complex samples and the need to use complementary techniques (e.g., Raman spectroscopy) for unambiguous identification.
The identification of metal carboxylates provides a deep mechanistic insight into the state of paint degradation and the chemical interactions within the paint layer. The formation of zinc azelates is a two-step process: first, the degradation of the zinc pigment (zinc yellow or zinc oxide) releases Zn²⁺ ions, which then react with azelaic acid, a major product of advanced oxidation of fatty acids in linseed oil [46]. Therefore, the presence of zinc azelates is not only an indicator of pigment deterioration, but also a significant marker for advanced oxidative degradation of the entire binder, signaling a history of exposure to conditions that promote auto-oxidation. Similarly, the formation of saturated lead soaps (stearates) is the consequence of saponification: Pb²⁺ ions from the degradation of lead white and chrome yellow react with saturated fatty acids that become dominant in the old oil through oxidation and saturation processes. This transition from unsaturated carboxylates (oleates) to saturated ones reflects the progressive nature of the aging of the binder. Overall, the presence of these metal soaps underlines a chemically active and acidified environment in the pictorial layer, where the degradation of pigments and binder feed each other, leading to structural changes (such as the formation of efflorescent soaps) that can significantly affect the integrity and visual appearance of the work.
The results reveal distinct degradation mechanisms with profound implications for the condition and authenticity of the work. Realgar degradation is a rapid, almost inevitable photochemical process, and the detection of pararealgar by Raman confirms significant historical exposure to light, which may explain local chromatic alterations from orange-reddish to yellow [40]. The transformation of lead white, even in the absence of visible blackening, signals a reactive pictorial environment in which sulfur pollutants initiate chemical reactions at the micro-level; this process, identified under the frames, suggests that degradation may have been even more advanced in exposed areas [41]. Regarding Indian yellow, the difficulty of detecting euxanthone by FTIR highlights the major challenge of analyzing organic materials in complex matrices. In this case, degradation manifests as a gradual fading and loss of vibrant color intensity rather than a dramatic change, a phenomenon that can be inferred only indirectly from the layer's overall chromatic composition. Overall, these processes reflect a complex history of the work, marked by environmental conditions (light, pollutants, humidity) that activated specific reactions for each pigment, leading to subtle but significant modifications of the palette and the integrity of the original pictorial layer.
The formation of the identified calcium oxalate monohydrate constitutes an important diagnostic marker for the degradation history of the painting layer. The proposed mechanism involves a reaction between calcium ions (Ca²⁺), most likely released from calcite or the carbonate component of lead white, and oxalic acid (H₂C₂O₄) generated in situ. The probable sources for the oxalic acid are microbiological activity (excretion of fungi and colonizing bacteria) and photo-oxidative degradation of organic materials (binding oil) under the action of light [47,48]. The protected and relatively humid microclimate in the space between the canvas and the frame provided ideal conditions for the slow and orderly crystallization of whewellite, the thermodynamically stable monohydrate phase. Thus, its presence attests to a complex long-term degradation process, marked by both biodeterioration and advanced oxidative aging of the organic matrix. This reflects an active chemical exchange at the interface between the pictorial material and its storage medium, highlighting its vulnerability to environmental and biological factors.
5. Conclusions
The analysis showed that as the style of the artist matured, his chromatic palette became less diverse as he found the combinations suitable to develop the hues that interested him. As such, while in his earlier work “Hora de peste Olt”, Aman also relied on Prussian blue, barium white and chalk, by the time of “Teleleice în Harem” he had renounced using them. Three works of art of the first modern Romanian painter, Theodor Aman, were analyzed, one earlier painting, “Hora de peste Olt”, and two later paintings, “Teleleice în Harem” and “Regimul Vechi”. The palette used by the artist was established by employing complementary analytical techniques. Two distinct phases in the artist’s works of art appear as his style and technique matures. A simplification of the palette is observed as the painter renounces, in his later works, to use Prussian blue, in developing his blues, and barium white and chalk, for the production of the ground layer. At the same time, the stratigraphy of his works becomes more complex. Degradation phenomena were observed both in the Raman analyses and in FTIR investigations. In the case of the Raman analyses the degradation of lead white and the formation of pararealgar, the degradation product of realgar, were observed. FTIR was able to show widespread degradation of the pigments and binder with zinc azelate and lead stearate being the most widespread degradation products. These findings can stand as future references for conservation scientists and restorers working on the works of Aman.
The integrated analysis identified a complex landscape of degradation in the pictorial layer, where chemical, biological and environmental processes interact. Advanced oxidative degradation of linseed oil was demonstrated by the formation of metal carboxylates (zinc and lead soaps) and a complex of carbonyl compounds, marking a profound transformation of the organic matrix. Biodeterioration and photodegradation processes are highlighted by the presence of calcium oxalate monohydrate and the photochemical transformation of realgar into pararealgar. At the same time, incipient processes of lead white sulfurization, detected at the molecular level, show a subtle sensitivity to pollutants. These mechanisms, amplified by the protected microclimate under the frames, led to a significant alteration of the original chromatic palette (through the degradation of colored pigments) and to structural changes affecting the integrity of the layer. In conclusion, the condition of the painting is the result of a history of multifactorial and long-term degradation, where each component interacted distinctly with environmental factors, highlighting the intrinsic vulnerability of ancient artistic compositions.
Supplementary Materials
The following supporting information can be downloaded at the website of this paper posted on Preprints.org, Figure S1: “Hora de peste Olt” green grains XRD peak assignment, S2 “Hora de peste Olt” blue grains XRD peak assignment, S3 “Teleleice în Harem” green grains XRD peak assignment, S4 “Teleleice în Harem” red grains XRD peak assignment, S5 “Teleleice în Harem” dislodged red grains OM and EDS images, Table S1: ATR-FTIR band assignment.
Author Contributions
Conceptualization, M. Olaru. and L. Stratulat; methodology, M. Niculaua; investigation, M. Zaltariov, L.E. Ursu, D. Rusu and A. Dascalu; resources, A. Drob and S. Scutaru; writing—original draft preparation, M. Olaru, A.-V. Oancea and L. Stratulat; writing—review and editing, L. Stratulat and B. Simionescu; supervision, B. Simionescu and M. Niculaua; All authors have read and agreed to the published version of the manuscript.
Funding
This research received no external funding.
Data Availability Statement
The raw data supporting the conclusions of this article will be made available by the authors on request.
Conflicts of Interest
The authors declare no conflicts of interest.
Abbreviations
The following abbreviations are used in this manuscript:
| OM | Optical Microscopy |
| SEM-EDS | Scanning Electron Microscopy – Electron Dispersion Spectroscopy |
| ATR-FTIR | Attenuated Total Reflectance-Fourier Transform Infrared |
| XRD | X-Ray Diffraction |
References
- Ma, C.; Dou, H.; Zhao, Z.; Qiu, X.; Li, H.; Wang, X. Review of in-situ non- and micro-destructive techniques for pigment analysis in architectural heritage. npj Herit. Sci. 2025, 13, 222. [Google Scholar] [CrossRef]
- Florea, V. Arta românească modernă și contemporană, vol. I; Meridiane: Bucharest, Romania, 1982; p. 112. [Google Scholar]
- Oprescu, G. Theodor Aman; Editura de Stat pentru Literatură și Artă: Bucharest, Romania, 1954; p. 108. [Google Scholar]
- Oprescu, G. Pictura românească în secolul al XIX-lea; Fundația Regală pentru Literatură și Artă: Bucharest, Romania, 1943; pp. 180–182. [Google Scholar]
- Vida, M. Theodor Aman: Gravor; National Museum of Art of Romania: Bucharest, Romania, 1993; p. 28. [Google Scholar]
- Pavel, A. Pictura românească în secolul al XIX-lea; Meridiane: Bucharest, Romania, 1970; p. 55. [Google Scholar]
- Ionescu, A.S. Mișcarea artistică oficială în România secolului al XIX-lea; Noi Media Print: Bucharest, Romania, 2008; p. 74. [Google Scholar]
- Enescu, T. Theodor Aman; Editura Academiei R.S.R. Bucharest, Romania, 1972; p. 45. [Google Scholar]
- Frost, R.L.; Martens, W.N.; Kloprogge, J.T. Raman spectroscopic study of cinnabar (HgS), realgar (As4S4), and orpiment (As2S3) at 298 and 77K. N. Jb. Miner. Mh. 2002, 10, 469–480. [Google Scholar] [CrossRef]
- Innocenti, S.; Quintero Balbas, D.; Galeotti, M.; Cagnini, A.; Porcinai, S.; Striova, J. Historical Pigments and Paint Layers: Raman Spectral Library with 852 nm Excitation Laser. Minerals 2024, 14, 557. [Google Scholar] [CrossRef]
- Frost, R.L. Raman microscopy of selected chromate minerals. J. Raman Spectrosc. 2004, 35, 153–158. [Google Scholar] [CrossRef]
- Farsang, S.; Caracas, R.; Adachi, T.; Schnyder, C.; Zajacz, Z. S2-and S3-radicals and the S42-polysulfide ion in lazurite, haüyne, and synthetic ultramarine blue revealed by resonance Raman spectroscopy. Am. Mineral. 2023, 108(12), 2234–2243. [Google Scholar] [CrossRef]
- Abrashev, M.; Ivanov, V.; Stefanov, B.; Todorov, N.; Rosell, J.; Skumryev, V. Raman spectroscopy of alpha-FeOOH (goethite) near antiferromagnetic to paramagnetic phase transition. J. Appl. Phys. 2020, 127(20), 205108. [Google Scholar] [CrossRef]
- Marshall, C.P.; Dufresne, W.J.B.; Rufledt, C.J. Polarized Raman spectra of hematite and assignment of external modes. J. Raman Spectrosc. 2020, 51, 1522–1529. [Google Scholar] [CrossRef]
- Vermeulen, M.; Saverwyns, S.; Coudray, A.; Janssens, k.; Sanyova, J. Identification by Raman spectroscopy of pararealgar as a starting material in the synthesis of amorphous arsenic sulfide pigments. Dyes Pigm. 2018, 149, 290–297. [Google Scholar] [CrossRef]
- Ferrari, A.C.; Robertson, J. Interpretation of Raman spectra of disordered and amorphous carbon. Phys. Rev. B. 2000, 61, pp 14095–14107. [Google Scholar] [CrossRef]
- Smith, G.D. Cow urine, Indian yellow, and art forgeries: An update. Forensic Sci. Int. 2017, 276, e30–e34. [Google Scholar] [CrossRef]
- Keszler, A.M.; Nemes, L.; Ahmad, S.R.; Fang, X. Characterisation of carbon nanotube materials by Raman spectroscopy and microscopy - A case study of multiwalled and single walled samples. J. Optoelectron. Adv. M. 2004, 6(4), 1269–1274. [Google Scholar]
- Zhang, Z.; Zhang, W.; Zhang, Z.; Chen, X. Nickel extraction from nickel laterites: Processes, resources, environment and cost. China Geol. 2025, 8, 187–213. [Google Scholar] [CrossRef]
- Brooker, M.H.; Sunder, S.; Taylor, P.; Lopata, V.J. Infrared and Raman spectra and X-ray diffraction studies of solid lead(II)carbonates. Can. J. Chem. 1983, 61, 494–502. [Google Scholar] [CrossRef]
- Chevrier, C.; Giester, G.; Heger, G.; Jarosch, D.; Wildner, M.; Zemann, J. Neutron single-crystal refinement of cerussite, PbCO3, and comparison with other aragonite-type carbonates. Z. Kristallogr. Cryst. 1992, 199, 67–74. [Google Scholar] [CrossRef]
- Genestar, C.; Pons, C. Earth pigments in painting: characterisation and differentiation by means of FTIR spectroscopy and SEM-EDS microanalysis. Anal. Bioanal. Chem. 2005, 382, 269–274. [Google Scholar] [CrossRef]
- Udvardi, B.; Kovács, I.J.; Kónya, P.; Földvári, M.; Füri, J.; Budai, F.; Falus, G.; Fancsik, T.; Szabó, C.; Szalai, Z.; Mihály, J. Application of attenuated total reflectance Fourier transform infrared spectroscopy in the mineralogical study of a landslide area, Hungary. Sediment. Geol. 2014, 1–14. [Google Scholar] [CrossRef]
- Eastaugh, N.; Walsh, V.; Chaplin, T.; Siddall, R. Pigment Compendium, A Dictionary and Optical Microscopy of Historical Pigments; Elsevier: Oxford, UK, 2008; ISBN 9780750689809. [Google Scholar]
- Caglar, B. Structural characterization of kaolinite-nicotinamide intercalation composite. J. Mol. Struct. 2012, 1020, 48–55. [Google Scholar] [CrossRef]
- Stoilova, D.; Georgiev, M.; Marinova, D. Infrared study of the vibrational behavior of CrO42- guest ions matrix-isolated in metal (II) sulfates (Me=Ca, Sr, Ba, Pb). J. Mol.Struct. 2005, 738, 211–215. [Google Scholar] [CrossRef]
- de Faria, D.L.A.; Edwards, H.G.M.; Careaga, V.; Walt, N.; Maier, M.S. A definitive analytical spectroscopic study of Indian yellow, an ancient pigment used for dating purposes. Forensic Sci. Int. 2017, 271, 1–7. [Google Scholar] [CrossRef]
- Simonsen, K.P.; Christiansen, M.B.; Vinum, M.G.; Sanyova, J.; Bendix, J. Single crystal X-ray structure of the artists' pigment zinc yellow. J. Mol. Struct. 2017, 1141, 322–327. [Google Scholar] [CrossRef]
- Dohnalová, Ž.; Luxová, J.; Antušková, V.; Šefců, R.; Šulcová, P.; Turková, I.; Kotrlý, M. The synthesis and quality comparison of nineteenth-century chromate pigments: strontium, barium, zinc and cadmium chrome yellow. J. Mater. Sci. 2025, 60, 16002–16014. [Google Scholar] [CrossRef]
- Oancea, A.V.; Bodi, G.; Nica, V.; Ursu, L.E.; Drobota, M.; Cotofana, C.; Vasiliu, A.L.; Simionescu, B.C.; Olaru, M. Multi-analytical characterization of Cucuteni pottery. J. Eur. Ceram. Soc. 2017, 37, 5079–5098. [Google Scholar] [CrossRef]
- Invernizzi, C.; Rovetta, T.; Licchelli, M.; Malagod, M. Mid and near-infrared reflection spectral database of natural organic materials in the cultural heritage field. Int. J. Anal. Chem. 2018, 2018, 7823248. [Google Scholar] [CrossRef] [PubMed]
- Derrick, M. Fourier transform infrared spectral analysis of natural resinsused in furniture finishes. JAIC 1989, 28, 43–56. [Google Scholar] [CrossRef]
- Manfredi, M.; Barberis, E.; Rava, A.; Robotti, E.; Gosettia, F.; Marengo, E. Portable diffuse reflectance infrared fourier transform (DRIFT) technique for the non-invasive identification of canvas ground: IR spectra reference collection. Anal. Methods 2015, 7, 2313–2322. [Google Scholar] [CrossRef]
- Centeno, S.A.; Guzman, M.I.; Yamazaki-Kleps, A.; Védova, C.O.D. Characterization by FTIR of the effect of lead white on some properties of proteinaceous binding media. JAIC 2004, 43, 139–150. [Google Scholar] [CrossRef]
- Higgitt, C.; Spring, M.; Saunders, D. Pigment-medium interactions in oil paint films containing lead-based pigments. WAAC Newslett 2005, 27, 12–16. [Google Scholar]
- Morsch, S.; Van Driel, B.A.; van den Berg, K.J.; Dik, J. Investigating the photocatalytic degradation of oil paint using ATR-IR and AFM-IR. ACS Appl. Mater. Interfaces 2017, 9, 10169–10179. [Google Scholar] [CrossRef]
- Izzo, F.C.; Kratter, M.; Nevin, A.; Zendri, E. A critical review on the analysis of metal soaps in oil paintings. ChemistryOpen 2021, 10, 904–921. [Google Scholar] [CrossRef]
- Otero, V.; Sanches, D.; Montagner, C.; Vilarigues, M.; Carlyle, L.; Lopes, J.A.; Melo, M.J. Characterisation of metal carboxylates by Raman and infrared spectroscopy in works of art. J. Raman Spectrosc. 2014, 45, 1197–1206. [Google Scholar] [CrossRef]
- van den Berg, J.D.J. Analytical chemical studies on traditional oil paints. PhD thesis, Faculty of Science, Swammerdam Institute for Life Sciences, Amsterdam, 2002. [Google Scholar]
- Robinet, L.; Corbeil, M.-C. The characterization of metal soaps. Stud. Conserv. 2003, 48, 23–40. [Google Scholar] [CrossRef]
- Trentelman, K.; Stodulski, L.; Pavlosky, M. Characterization of pararealgar and other light-induced transformation products from realgar by Raman microspectroscopy. Anal. Chem. 1996, 68, 1755–1761. [Google Scholar] [CrossRef] [PubMed]
- Jovanovski, G.; Makreski, P. Intriguing minerals: photoinduced solid-state transition of realgar to pararealgar—direct atomic scale observation and visualization. ChemTexts 2020, 6. [Google Scholar] [CrossRef]
- Ploeger, R.; Shugar, A.; Smith, G.D.; Chen, V.J. Late 19th century accounts of Indian yellow: the analysis of samples from the Royal Botanic Gardens, Kew. Dyes Pigm 2019, 160, 418–431. [Google Scholar] [CrossRef]
- Smith, G.D.; Clark, R.J.H. The role of H2S in pigment blackening. J. Cult. Herit. 2002, 3, 101–105. [Google Scholar] [CrossRef]
- Valido, I.H.; Rius-Bartra, J.M.; Boada, R.; Resina-Gallego, M.; Valiente, M.; López-Mesas, M. Characterization of calciumoxalate hydrates and the transformation process. ChemPhysChem 2020, 21, 2583–2593. [Google Scholar] [CrossRef]
- Monico, L.; Rosi, F.; Miliani, C.; Daveri, A.; Brunetti, B. G. Non-invasive identification of metal-oxalate complexes on polychrome artwork surfaces by reflection mid-infrared spectroscopy. Spectrochim. Acta A Mol. Biomol. Spectrosc. 2013, 116, 270–280. [Google Scholar] [CrossRef]
- Rampazzi, L.; Andreotti, A.; Bonaduce, I.; Colombini, M.P.; Colombo, C.; Toniolo, L. Analytical investigation of calcium oxalate films on marble monuments. Talanta 2004, 63, 967–977. [Google Scholar] [CrossRef]
- Lazzarini, L.; Salvadori, O. A reassessment of the formation of the patina called scialbatura. Stud. Conserv. 1989, 34, 20–26. [Google Scholar] [CrossRef]
Figure 1.
a)“Hora de peste Olt”, b) “Teleleice în Harem”, and c) “Regimul Vechi”. Pink ellipses indicate where samples were collected for the painting for investigations: “Hora de peste Olt” 1 – blue samples, 2 – green samples, “Teleleice în Harem” 1 - red samples, 2 – green samples. Dashed white ellipses indicate where relevant portable Raman spectra were collected, with the numbers indicating the analysis point.
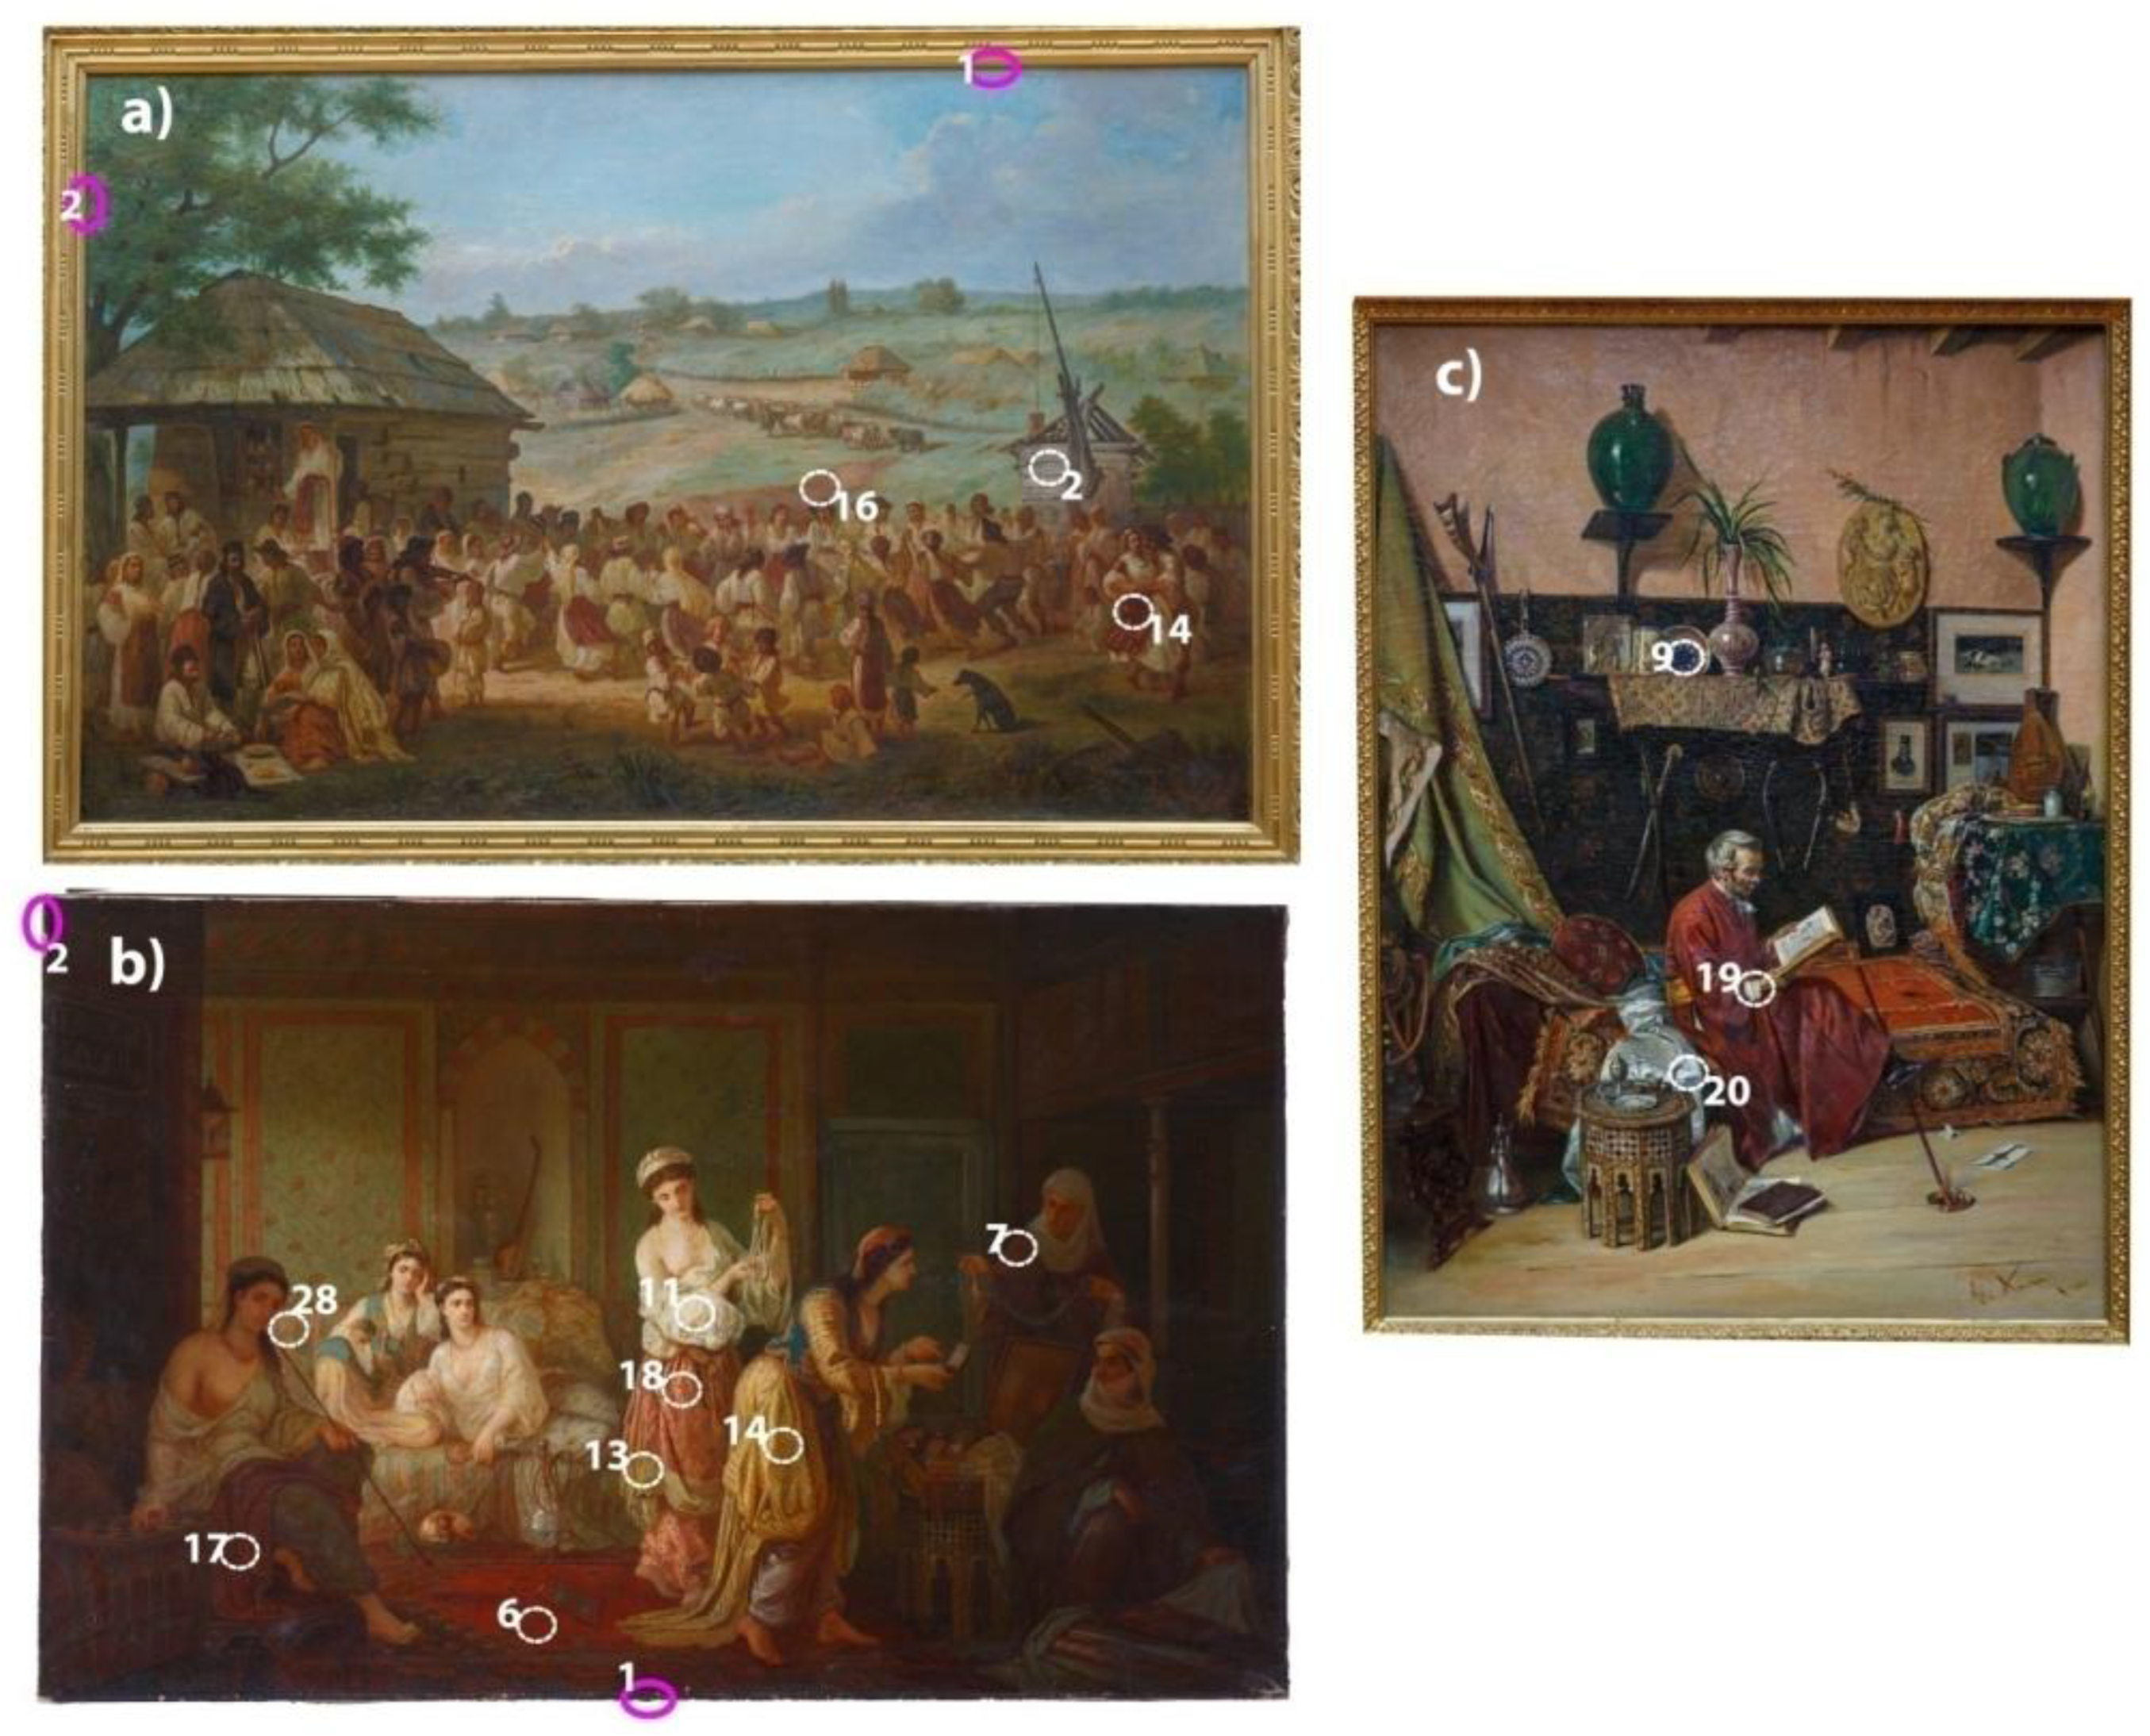
Figure 2.
Relevant spectra recorded of pigments from a) “Hora de peste Olt”, b) “Teleleice în Harem”, and c) “Regimul Vechi”.
Figure 2.
Relevant spectra recorded of pigments from a) “Hora de peste Olt”, b) “Teleleice în Harem”, and c) “Regimul Vechi”.
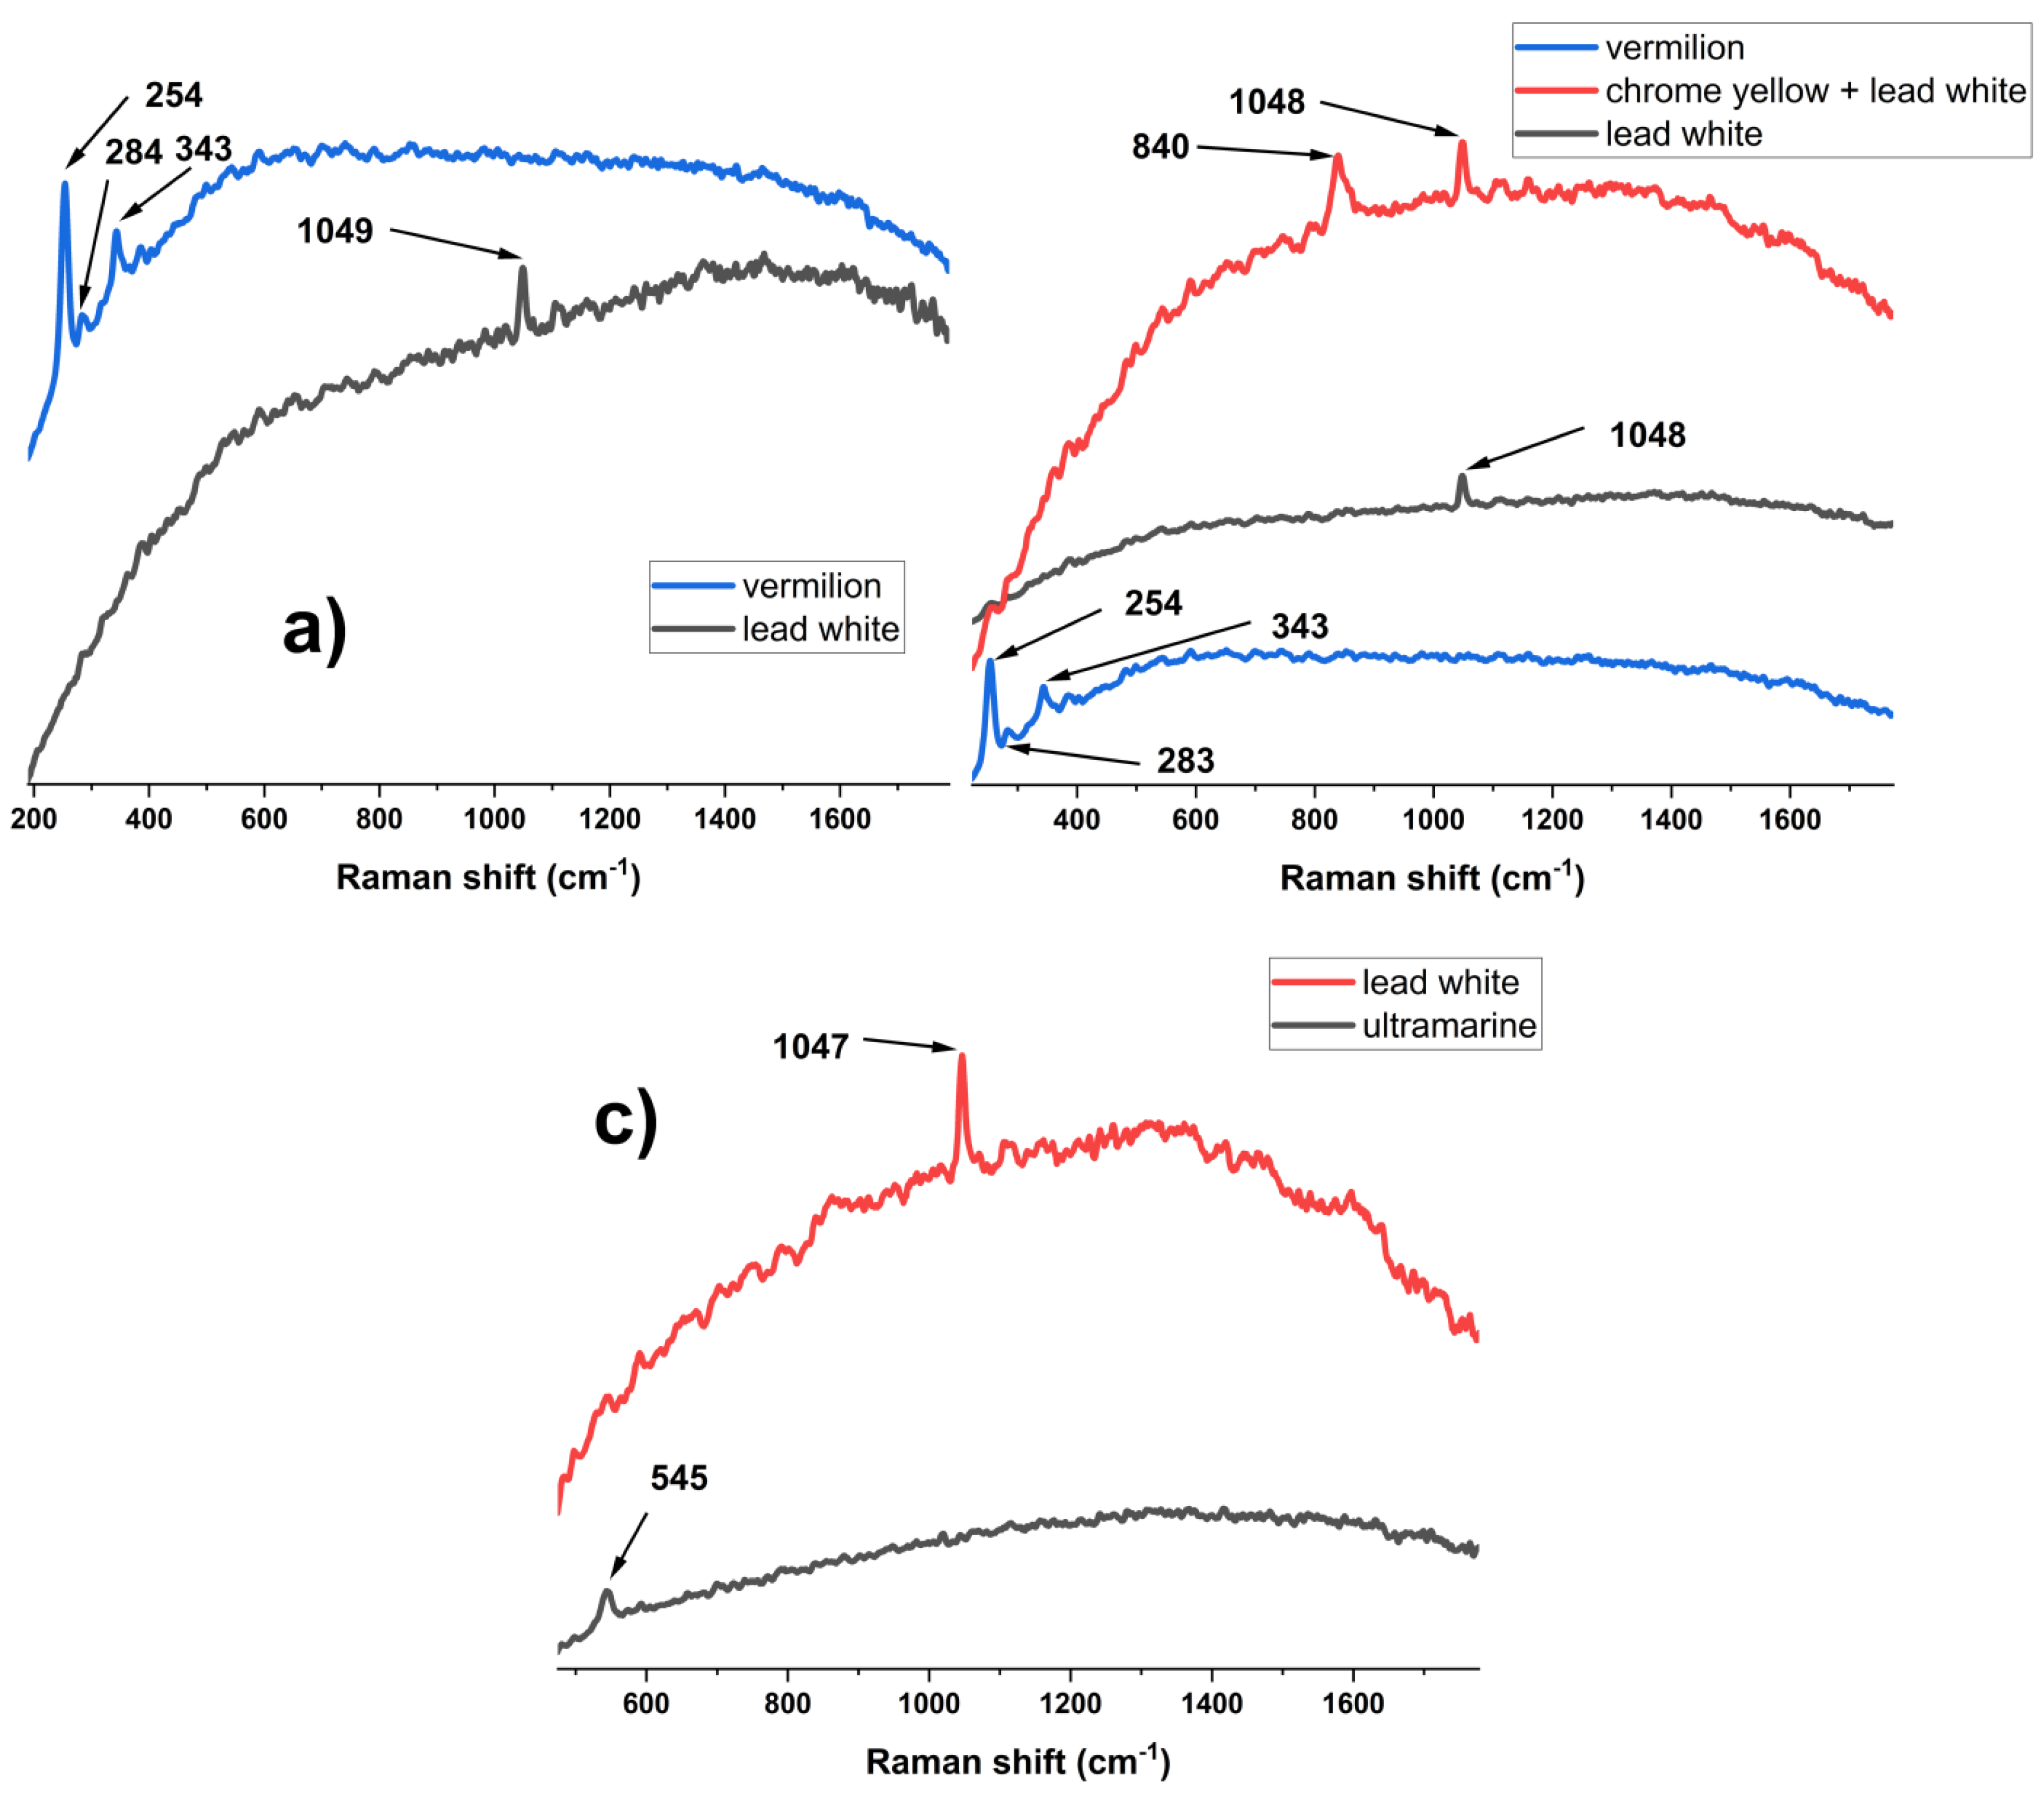
Figure 3.
Relevant μ-Raman spectra collected from samples from “Hora de peste Olt” and “Teleleice în Harem”.
Figure 3.
Relevant μ-Raman spectra collected from samples from “Hora de peste Olt” and “Teleleice în Harem”.
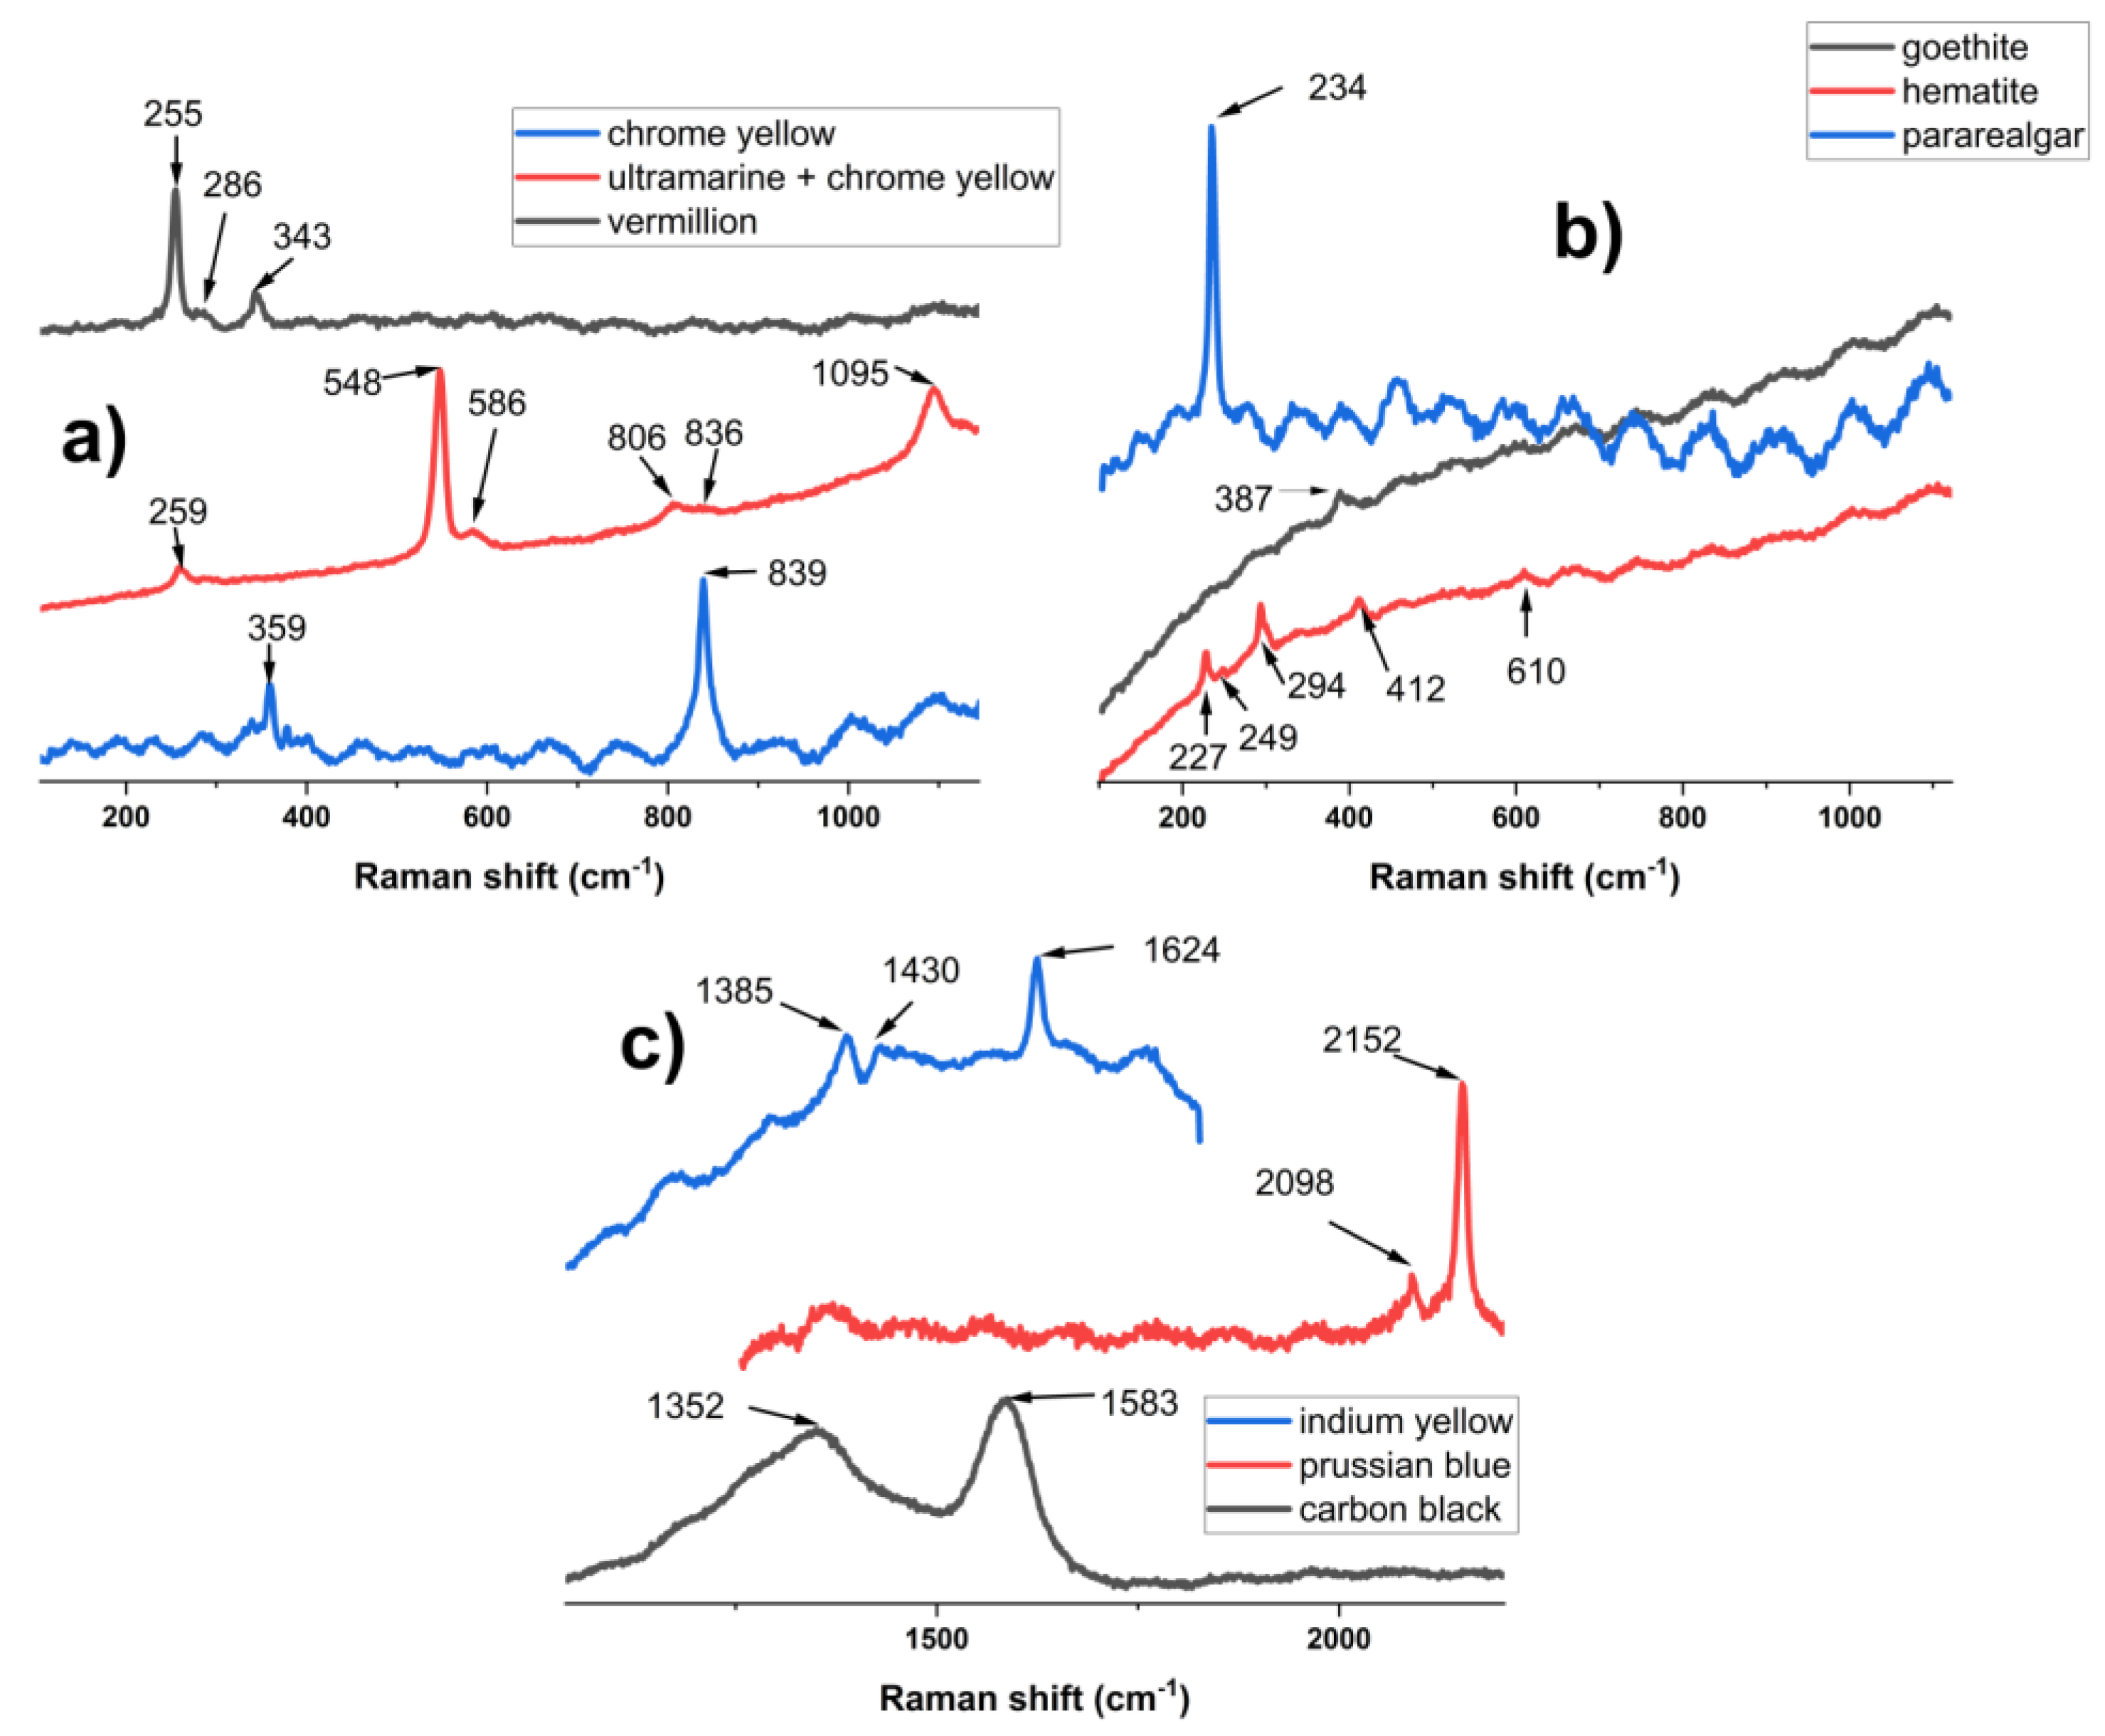
Figure 4.
XRD diffractograms of (⸻) H_b, (⸻) H_g, (⸻) T_r, (⸻) T_g. Posistions of peaks of identified phases are highlighted with: ▼ – hydrocerrusite, ▲ – cerrusite, ● – cinnabar, ● – quartz, ■ – kaolinite, ■ – muscovite, ▐ - calcite, ▐ - dolomite, ♦ - barite.
Figure 4.
XRD diffractograms of (⸻) H_b, (⸻) H_g, (⸻) T_r, (⸻) T_g. Posistions of peaks of identified phases are highlighted with: ▼ – hydrocerrusite, ▲ – cerrusite, ● – cinnabar, ● – quartz, ■ – kaolinite, ■ – muscovite, ▐ - calcite, ▐ - dolomite, ♦ - barite.
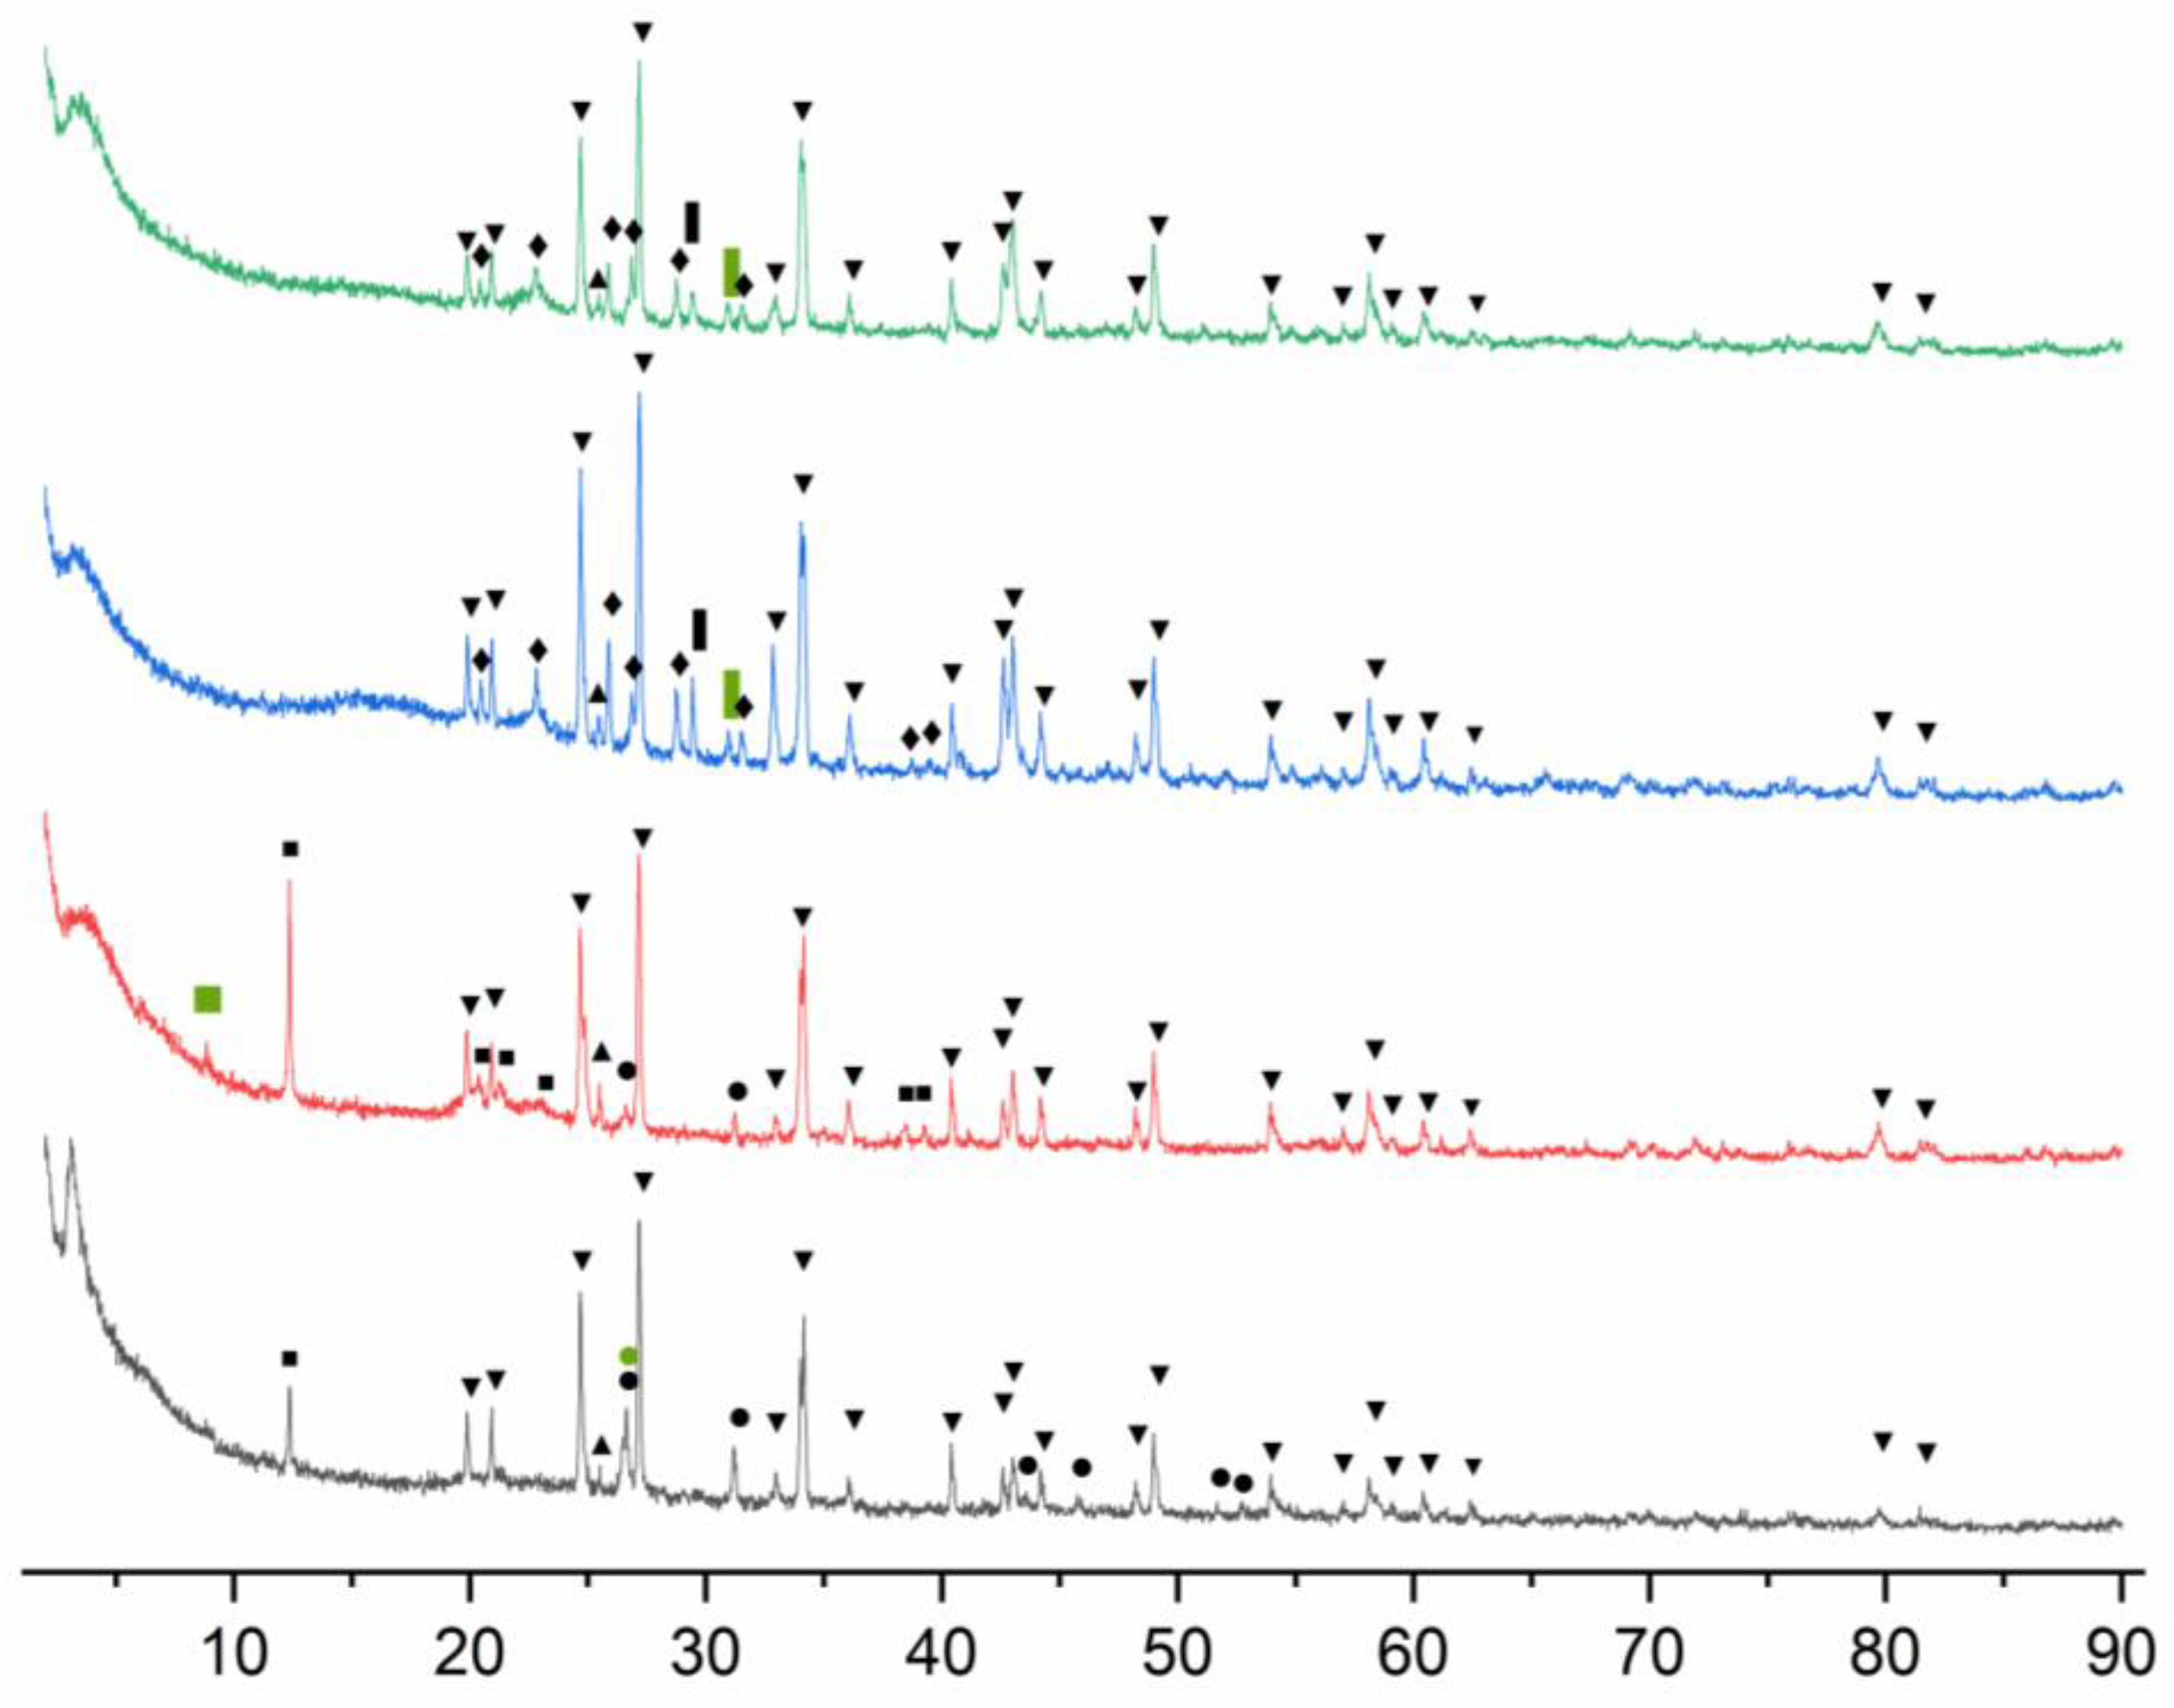
Figure 5.
OM and EDS images for T_r sample a) OM images of red grains 1,2,3 and 4, scale is 0.1 mm, b) OM image of red grain 1, scale is 0.05 mm, c) OM image of red grain 2, scale is 0.05 mm, d) EDS image of investigated area of grain 1, scale is 100 μm, e) EDS image of investigated area of grain 1, scale is 100 μm, f) EDS image of investigated area of grain 1, scale is 100 μm, f) EDS image of investigated area of grain 1, scale is 100 μm.
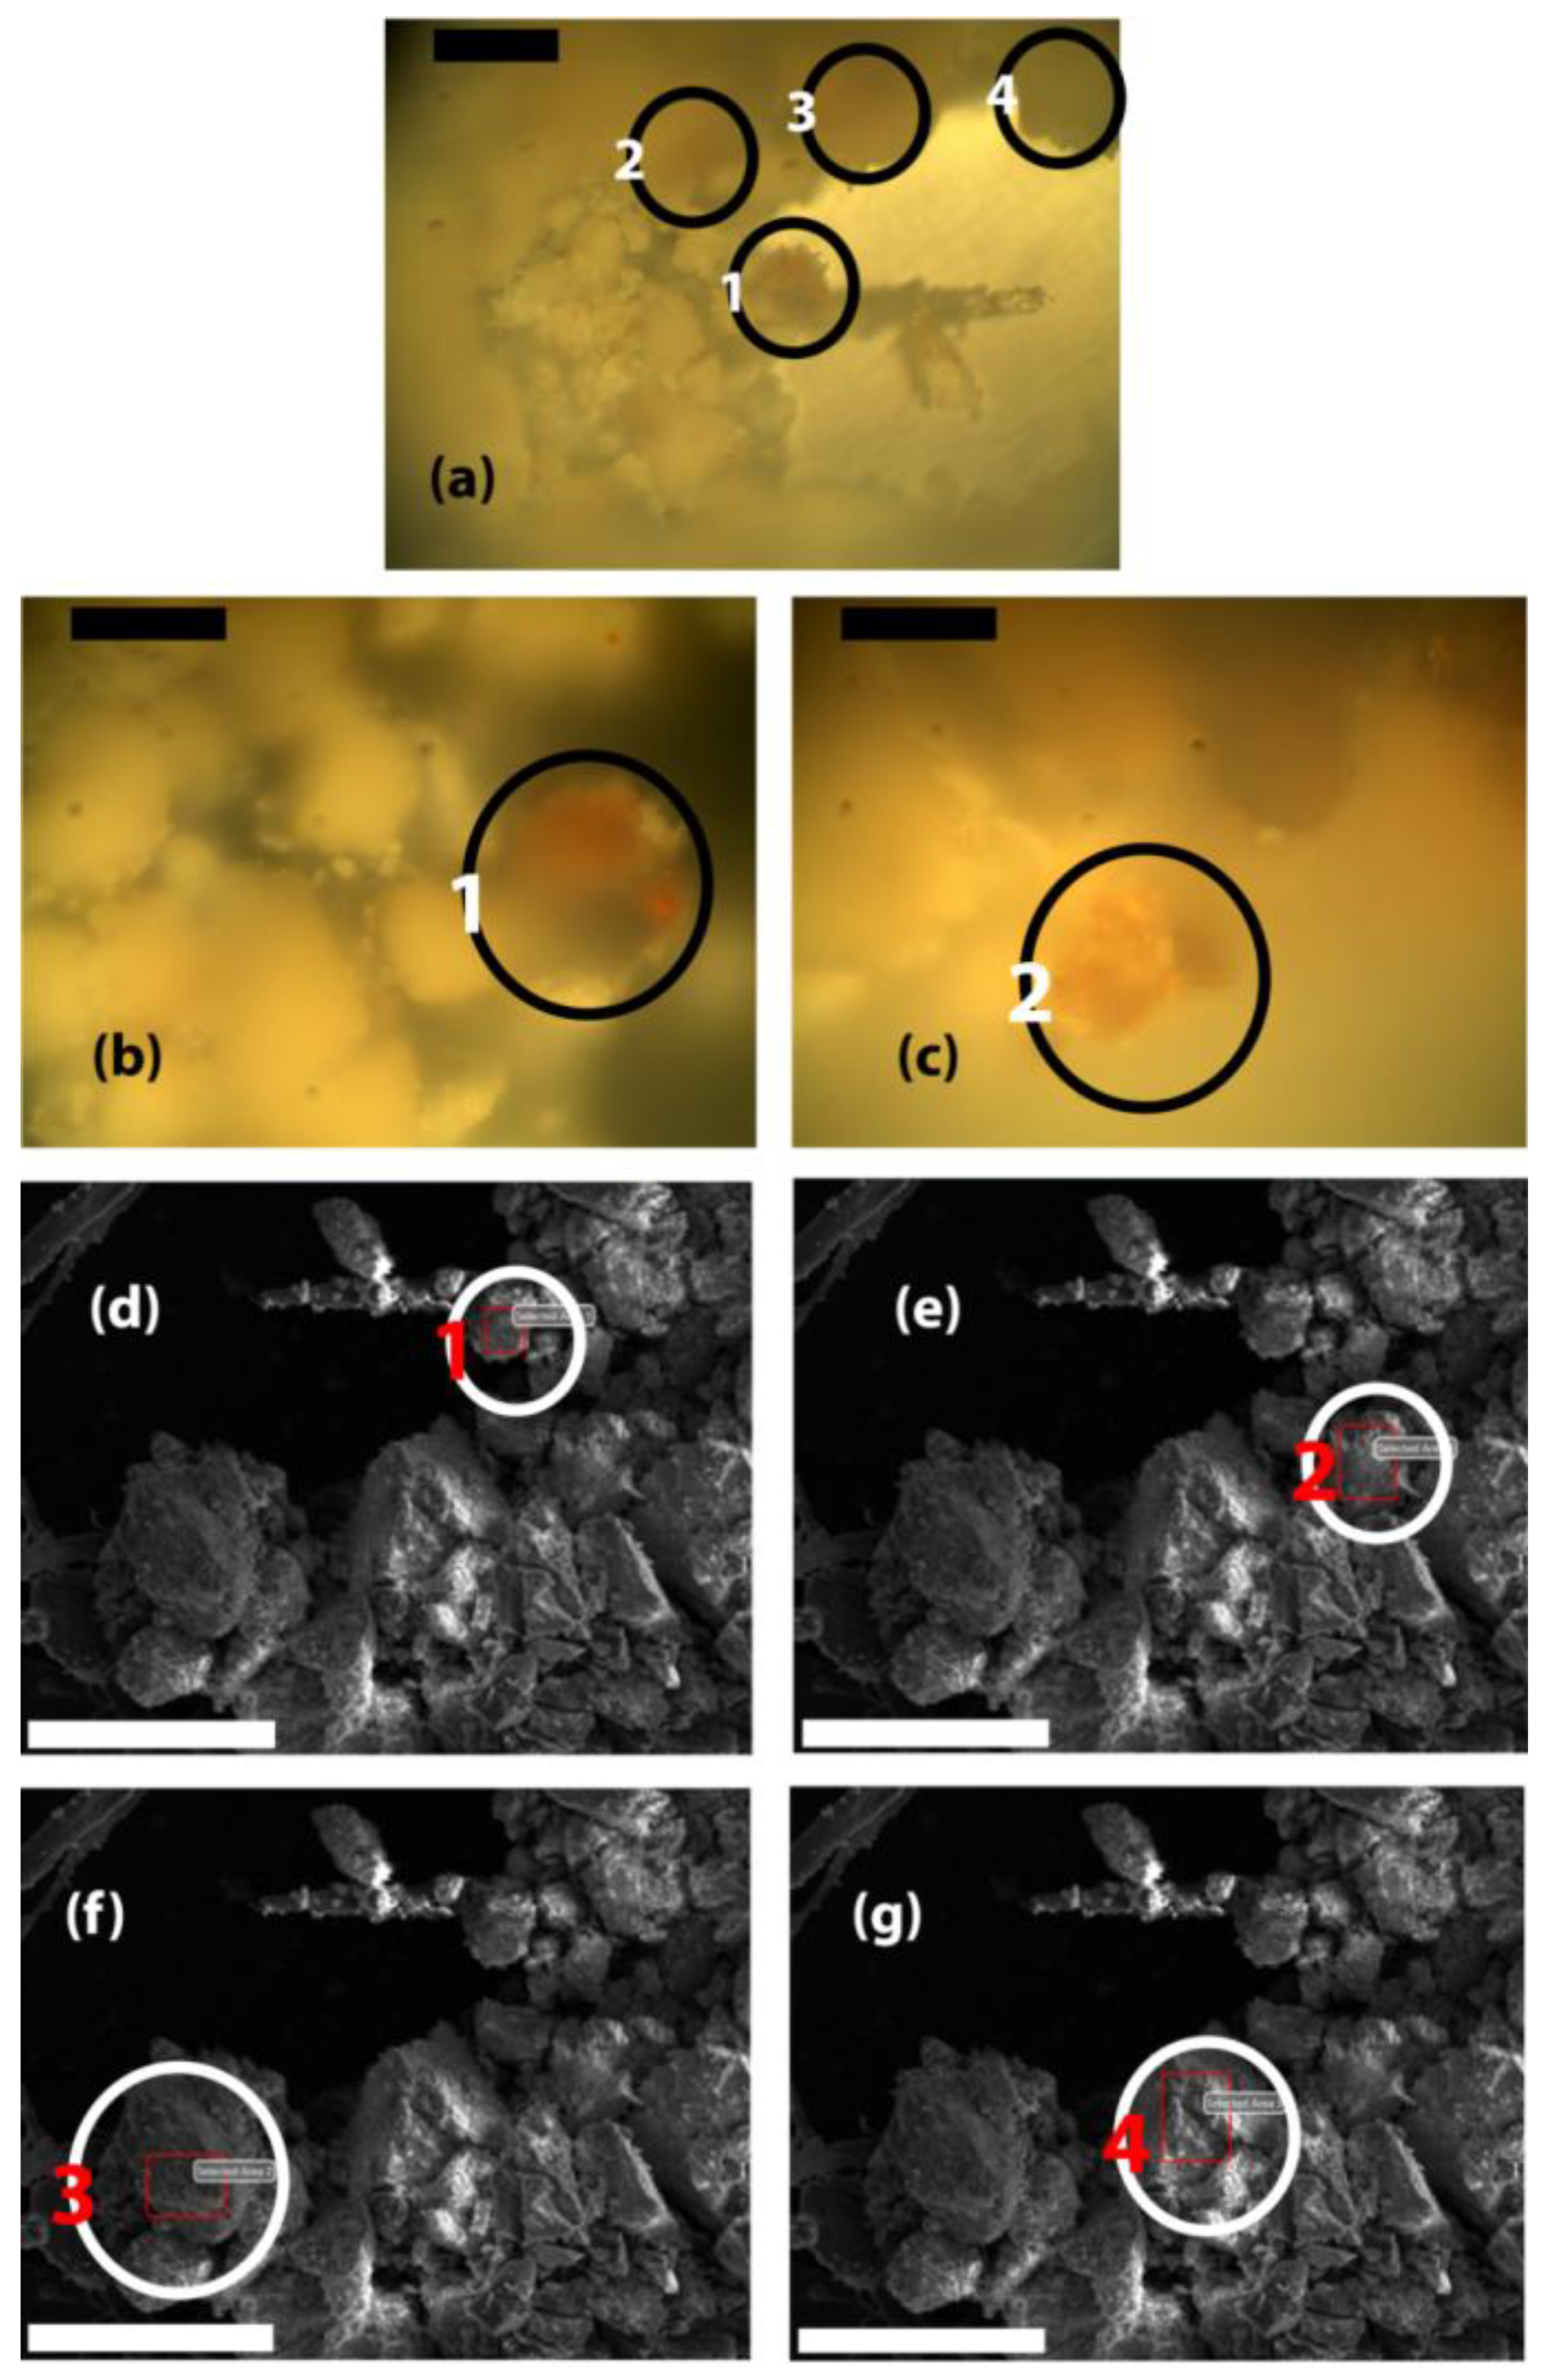
Figure 6.
OM, EDS and EDS elemental mapping images for the section of a T_g sample grain a) OM image, scale is 0.1 mm, b) EDS image, scale is 20 μm, EDS mapping of c) C, d) O, e) Pb, f) Al, g) Si, h) Fe, i) K, j) Zn, k) Cr, l) Hg, m) S and n) Cu.
Figure 6.
OM, EDS and EDS elemental mapping images for the section of a T_g sample grain a) OM image, scale is 0.1 mm, b) EDS image, scale is 20 μm, EDS mapping of c) C, d) O, e) Pb, f) Al, g) Si, h) Fe, i) K, j) Zn, k) Cr, l) Hg, m) S and n) Cu.
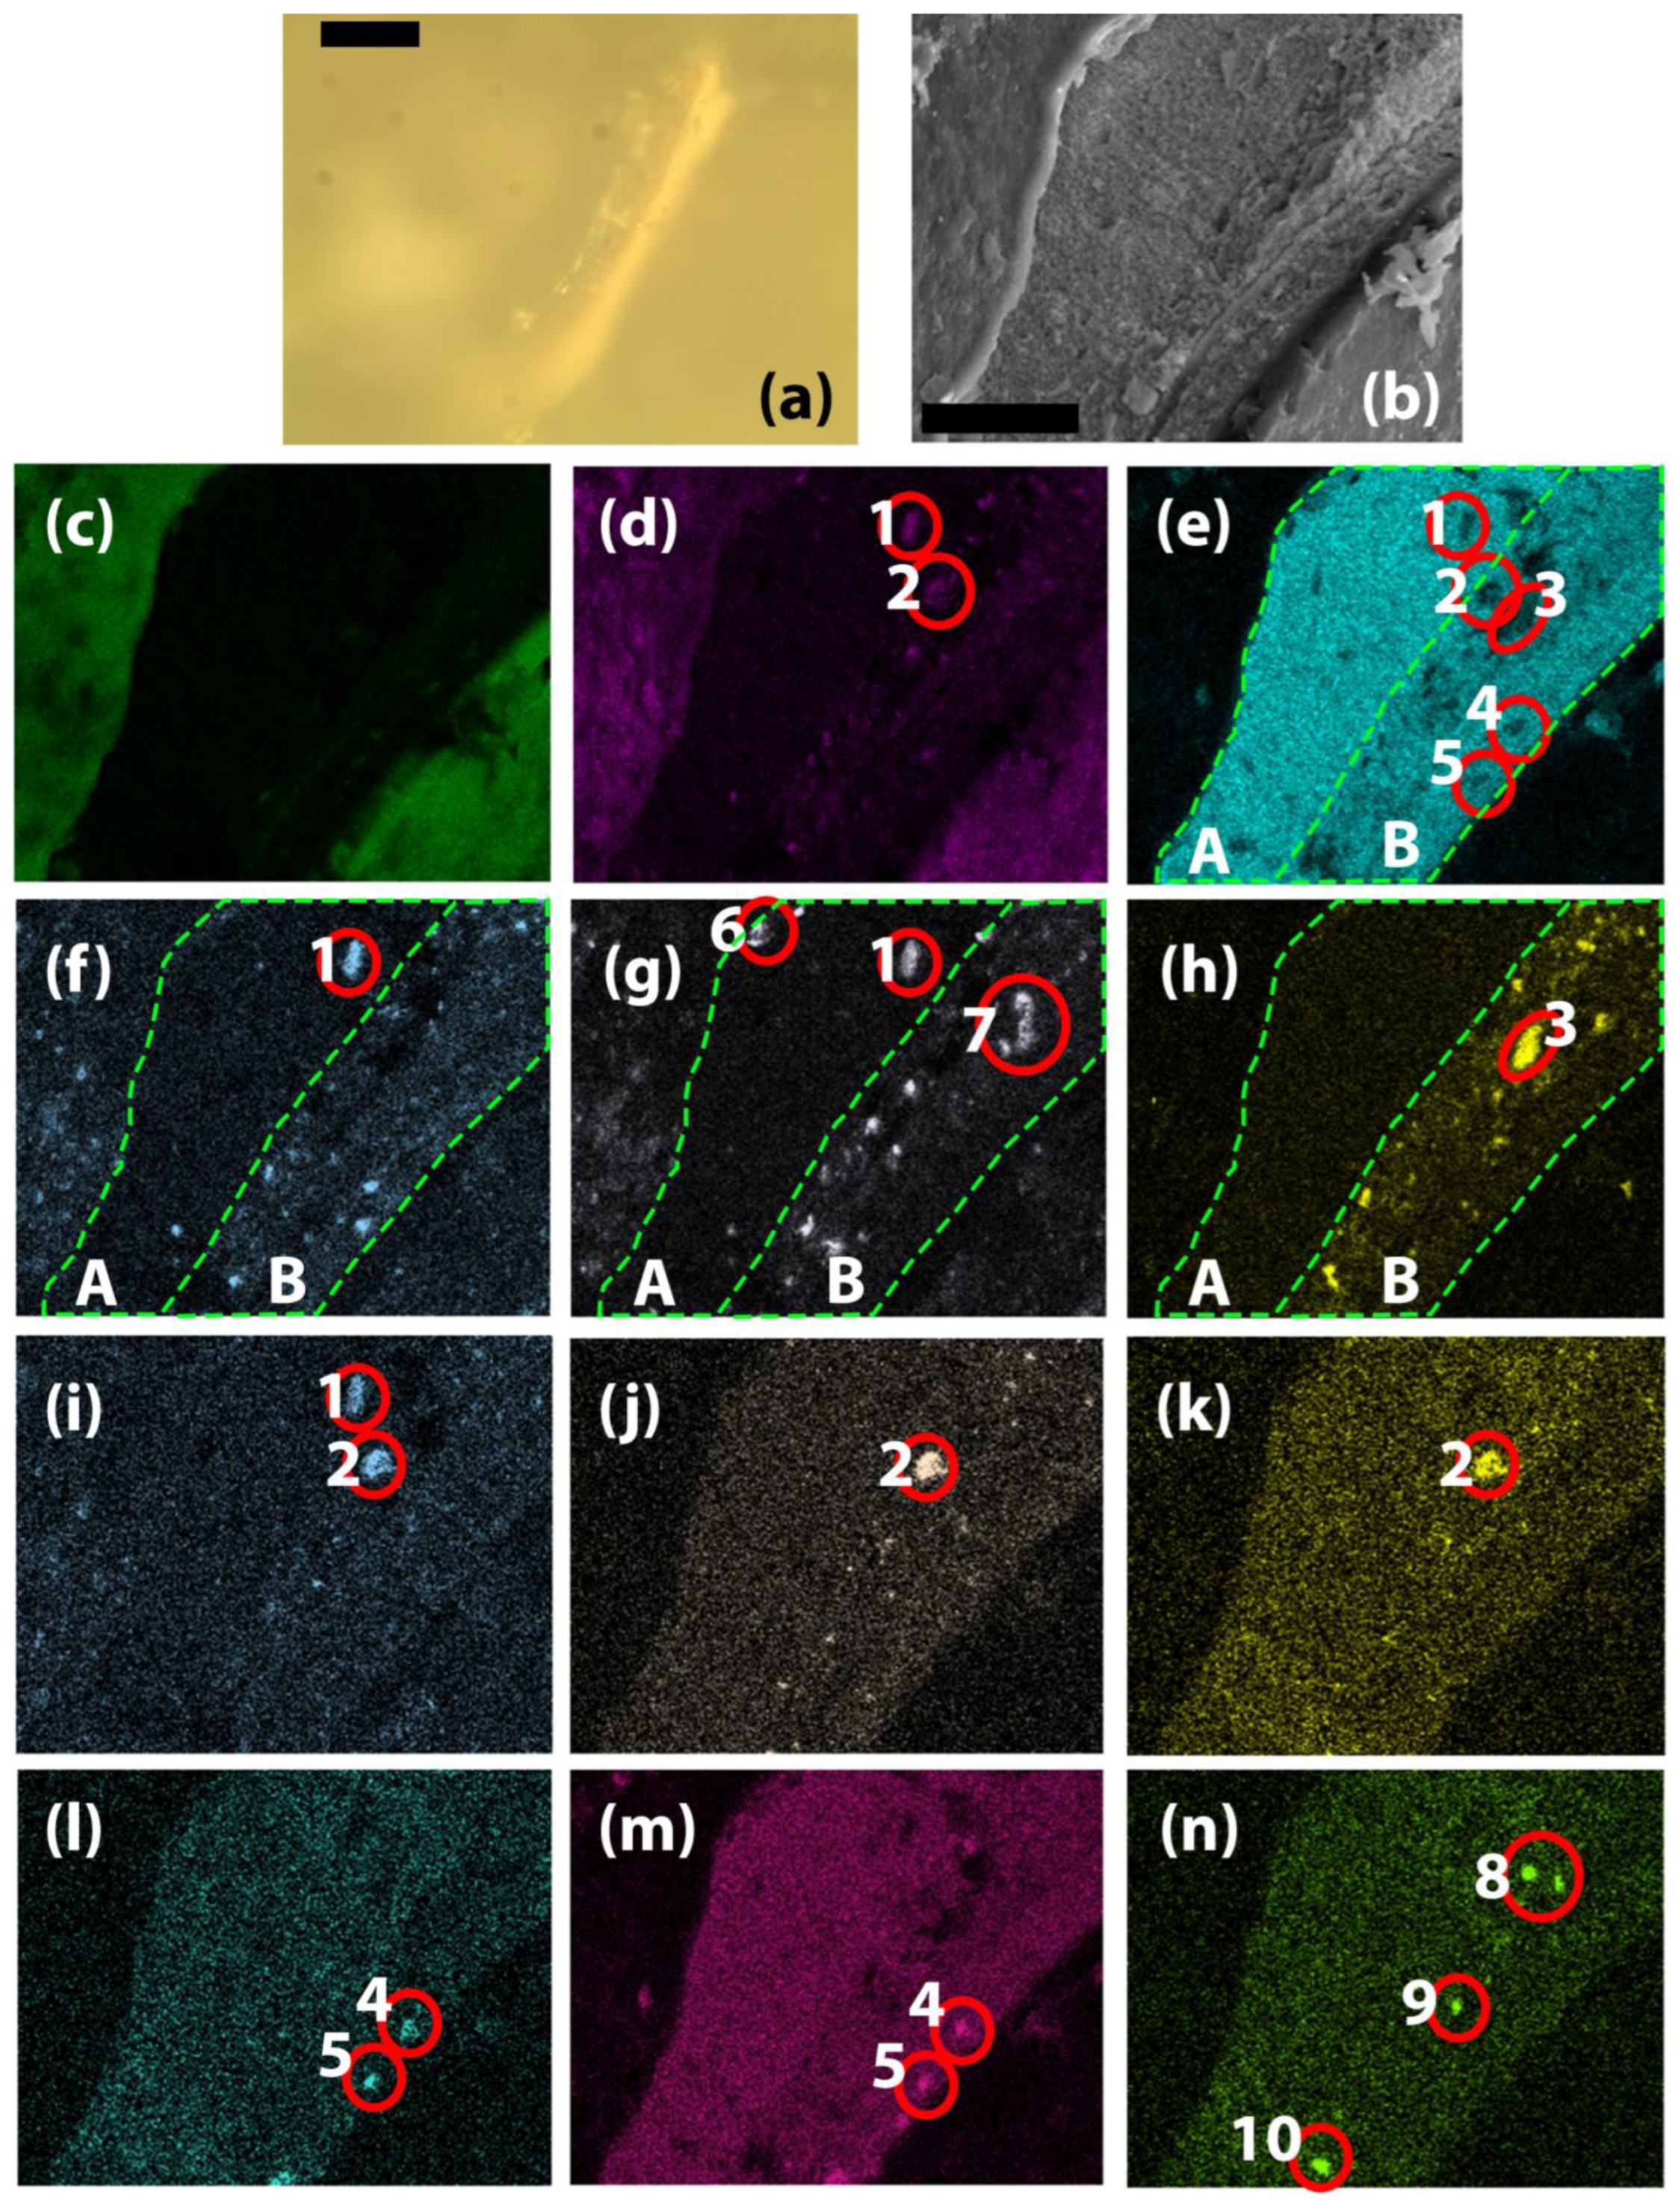
Figure 7.
OM, EDS and EDS elemental mapping images for the section a H_g sample grain a) OM image, scale is 0.05 mm, b) EDS image, scale is 20 μm, EDS mapping of c) C, d) O, e) Ca, f) Ba, g) Mg, h) Si, i) Al, j) Pb, k) S, l) Fe, m) Hg and n) Cr.
Figure 7.
OM, EDS and EDS elemental mapping images for the section a H_g sample grain a) OM image, scale is 0.05 mm, b) EDS image, scale is 20 μm, EDS mapping of c) C, d) O, e) Ca, f) Ba, g) Mg, h) Si, i) Al, j) Pb, k) S, l) Fe, m) Hg and n) Cr.
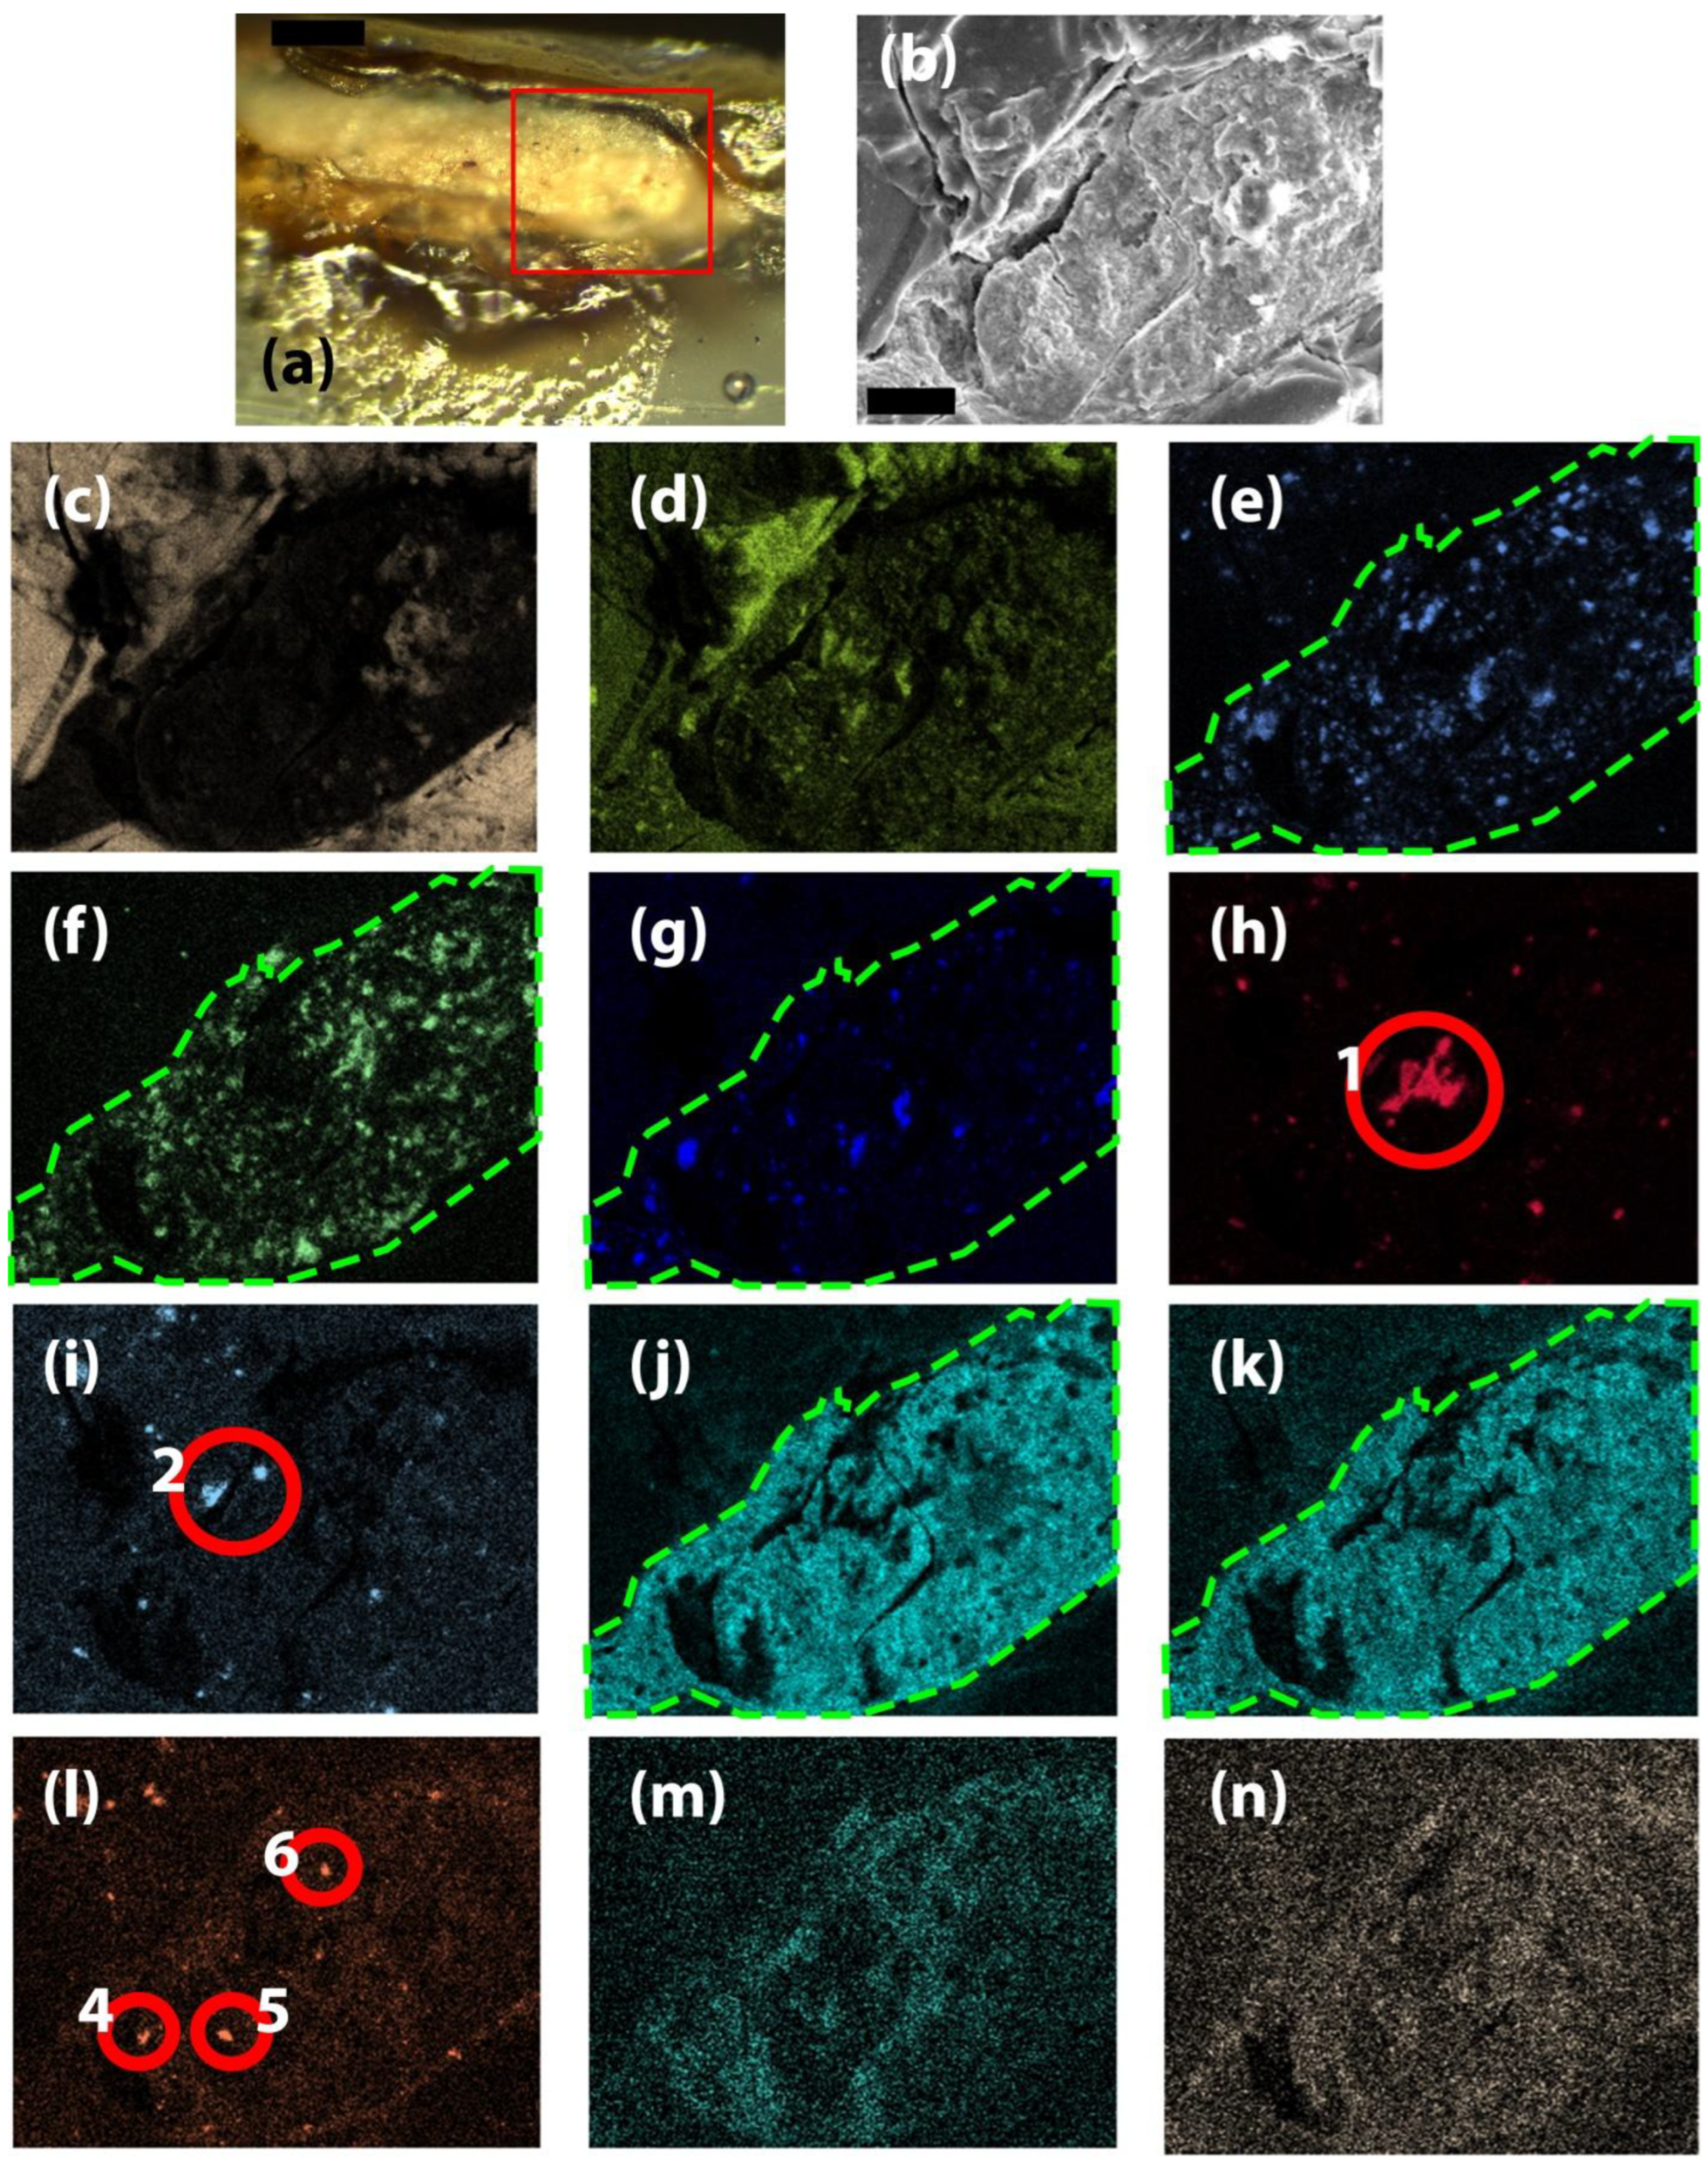
Figure 8.
FTIR spectra in the 600 cm-1 – 4000 cm-1 of the investigated samples.
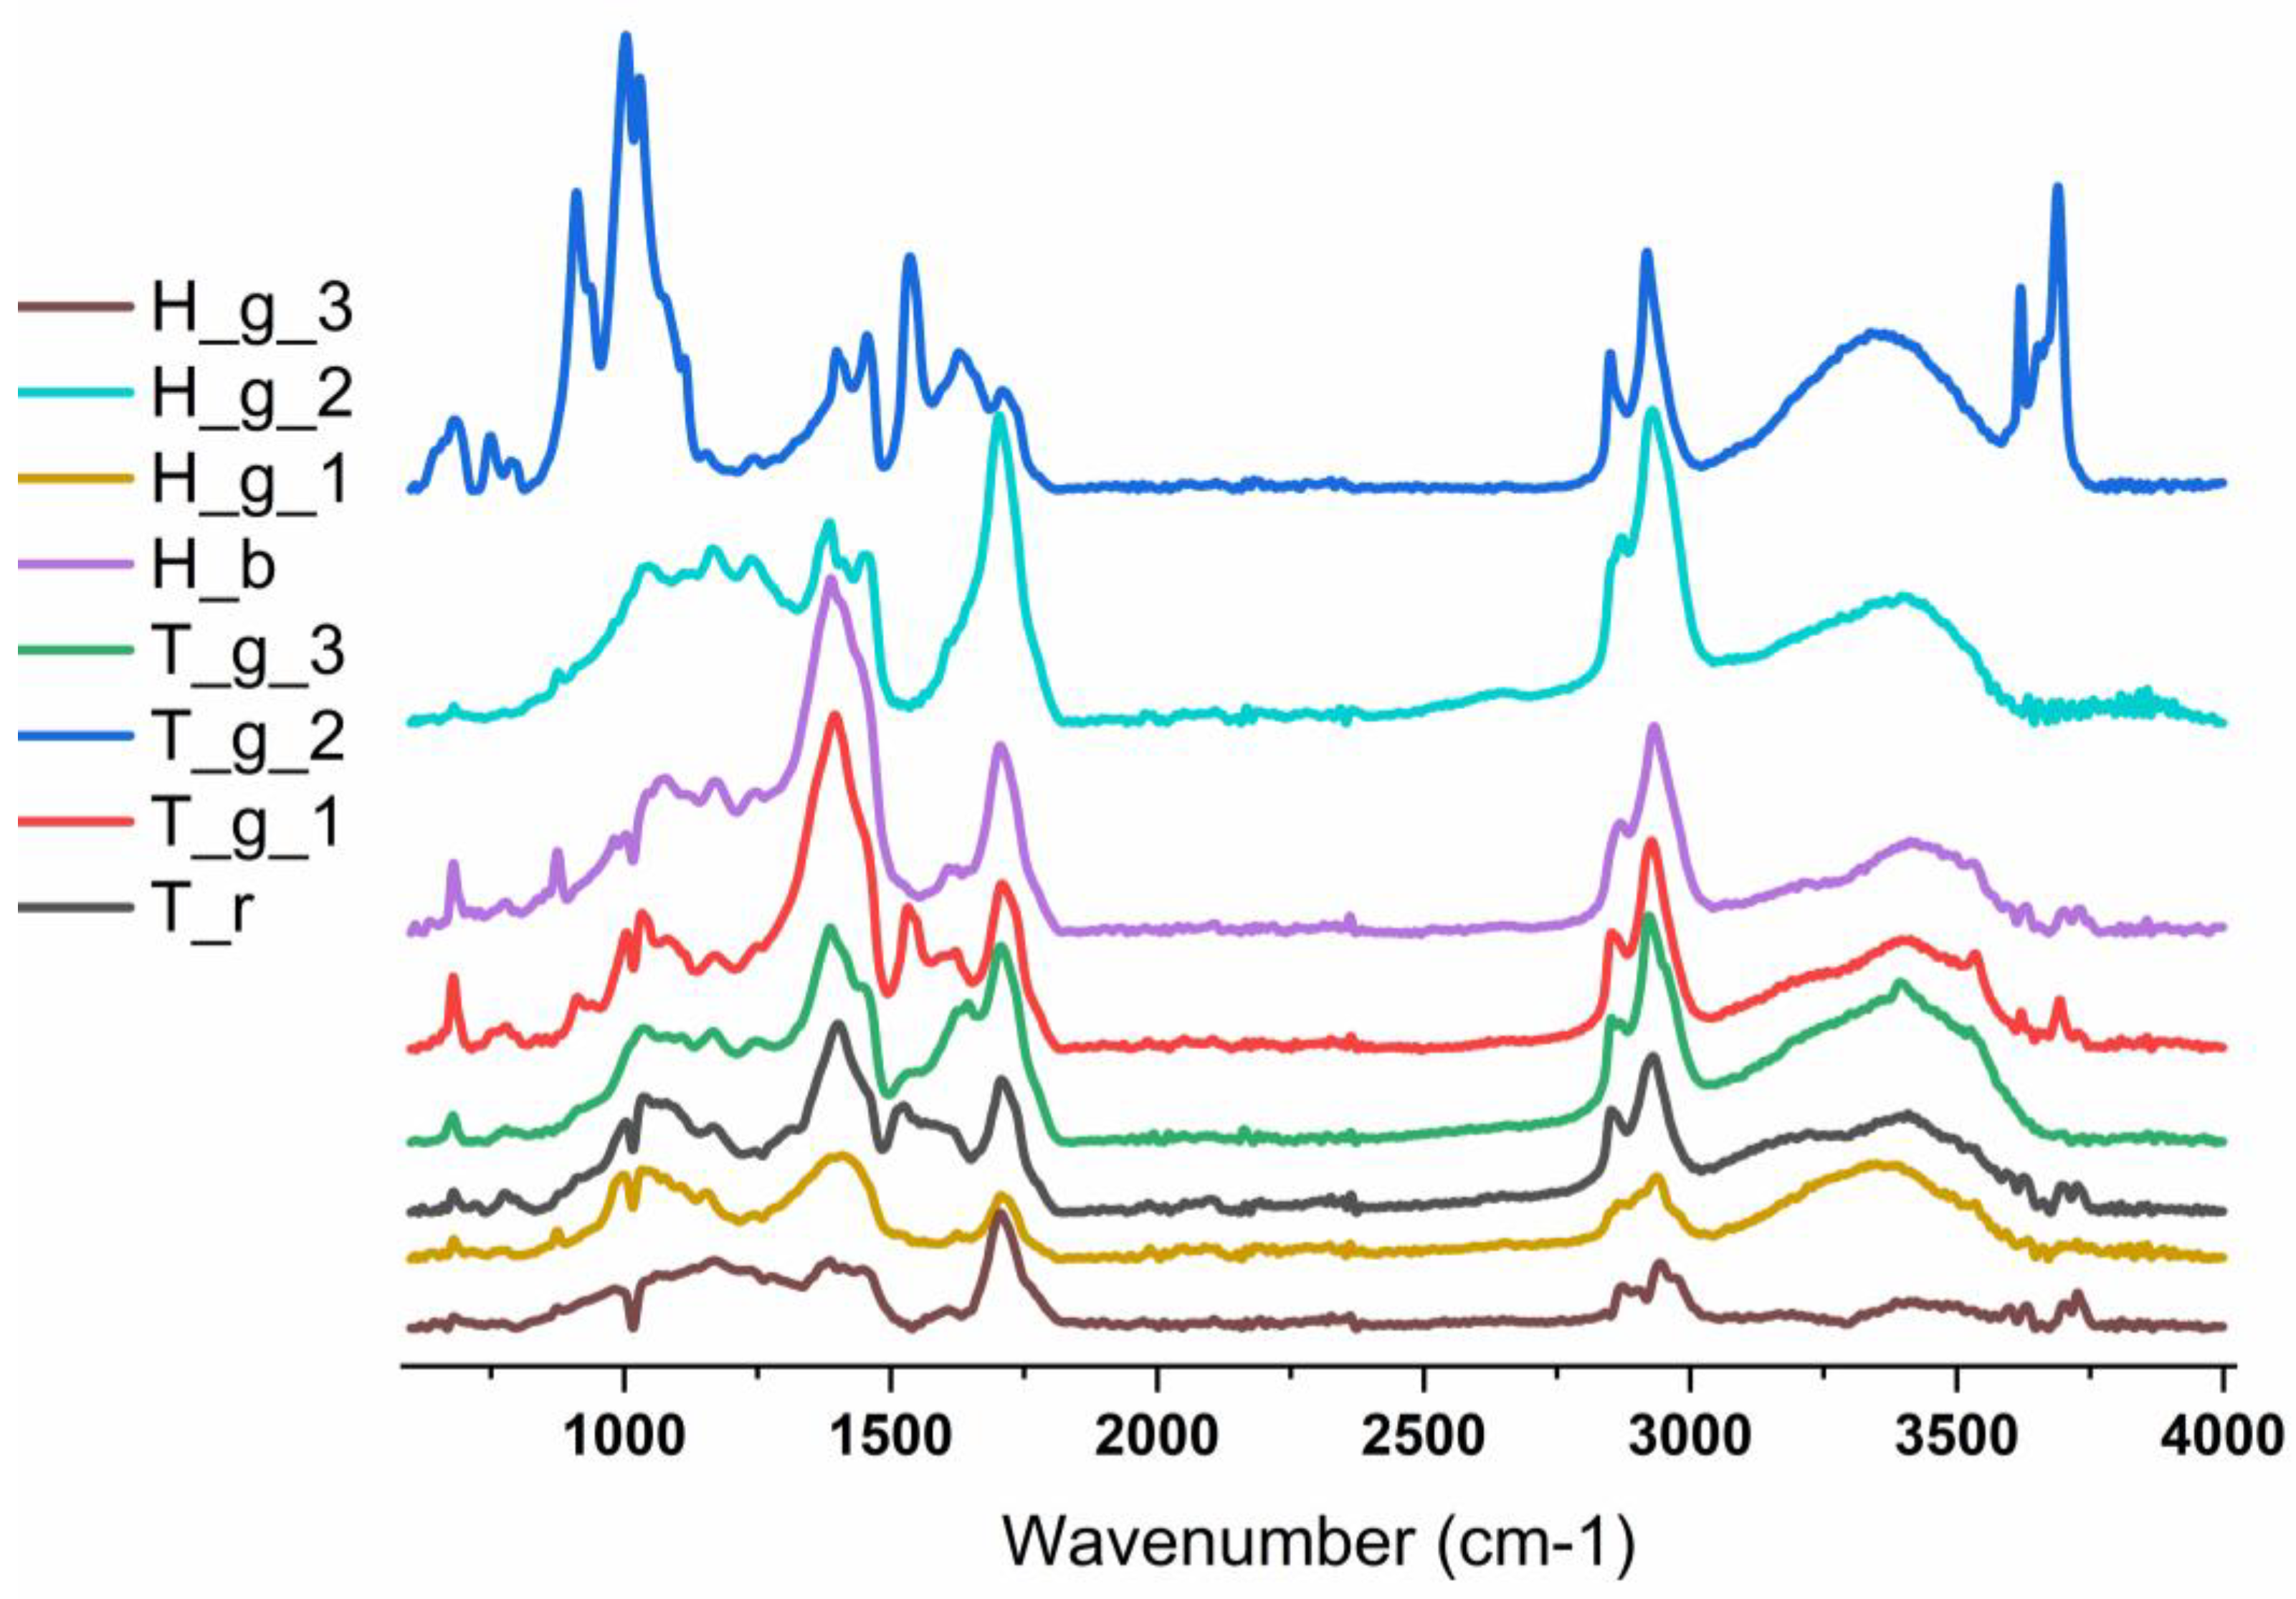
Table 1.
Pigments identified in the works of Theodor Aman based on the employed spectroscopic techniques.
Table 1.
Pigments identified in the works of Theodor Aman based on the employed spectroscopic techniques.
| Pigment | Artwork | ||||||
| “Hora de peste Olt” | “Teleleice în Harem” |
“Regimul Vechi” |
|||||
| Painting | H_b | H_g | Painting | T_r | T_g | Painting | |
| Lead white | a (2) | c,e | c,e | a (11, 18, 28) | c,e | c,e | a (19, 20) |
| Barium white | c | c | |||||
| Chalk (calcite + dolomite) | c,e | c | e | e | |||
| Vermillion | a (14, 16) | b | a (6, 7, 17, 18, 28) | b, c | b,c | ||
| Red ochre | b | ||||||
| Realgar | b* | ||||||
| Chrome yellow | b,e | e | a (13, 14) | b,e | |||
| Zinc yellow | e | d | d,e | ||||
| Yellow ochre | b | ||||||
| Indian yellow | b,e | e | e | e | |||
| Ultramarine | b | b | b | b | a (9) | ||
| Prussian blue | b | b | |||||
| Carbon black | b | b | b | b | |||
a) portable Raman, b) μ-Raman, numbers indicate the analysis point, c) XRD, d) EDS, e) FTIR, * - identified from degradation products.
Disclaimer/Publisher’s Note: The statements, opinions and data contained in all publications are solely those of the individual author(s) and contributor(s) and not of MDPI and/or the editor(s). MDPI and/or the editor(s) disclaim responsibility for any injury to people or property resulting from any ideas, methods, instructions or products referred to in the content. |
© 2026 by the authors. Licensee MDPI, Basel, Switzerland. This article is an open access article distributed under the terms and conditions of the Creative Commons Attribution (CC BY) license (http://creativecommons.org/licenses/by/4.0/).
Copyright: This open access article is published under a Creative Commons CC BY 4.0 license, which permit the free download, distribution, and reuse, provided that the author and preprint are cited in any reuse.


