

Submitted:
02 February 2026
Posted:
04 February 2026
You are already at the latest version
Abstract
Background: Alcohol use patterns influence health outcomes. This study examined sex-specific drinking trajectories and their associations with all-cause mortality and coronary heart disease (CHD) in the US-based Framingham Heart Study.
Method: Among 6,570 participants (mean age: 55±13; 55% women) followed for 15 years, a growth mixture model identified four sex-specific alcohol consumption trajectories. Cox models examined associations of alcohol trajectories with CHD and mortality over 10 years of follow-up, adjusting for covariates.
Results: The Moderate-Decreasing group (1,179 women, 0–14 g/day; 1,534 men, 0–28 g/day) showed a declining moderate intake. The Low-to-None group included light or non-drinkers (992 women, 826 men). The Inverse-U group (606 women, 199 men) showed variable intake, while the High-Decreasing group (858 women, 376 men) had high (women >14 and men >28 g/day) but declining consumption. Compared with Moderate-Decreasing, women in other groups had higher CHD risks (HRs 1.58-1.61) and greater mortality in Low-to-None (HR 1.25) and Inverse-U (HR 1.28) groups. Men in Low-to-None had higher mortality (HR 1.17) and CHD (HR 1.60), while High-Decreasing showed the highest mortality (HR 1.27). Low-to-moderate drinking was associated with lower mortality and CHD risks; however, these findings do not confirm the protective effects of alcohol use.
Discussion: Our findings suggest that sustained low to moderate drinking was associated with lower risks of mortality and CHD in both women and men, compared to high-level or fluctuating patterns. These results emphasize the importance of understanding long-term drinking patterns in public health, but we caution against interpreting moderate use as a means to lower mortality risk or prevent CHD.
Keywords:
alcohol consumption
; cardiovascular disease
; coronary heart disease
; mortality
; trajectory analysis
; survival analysis
Introduction
Alcohol consumption is a major contributor to the global disease burden, impacting health outcomes and mortality rates worldwide [1]. Extensive research has linked alcohol to various health conditions, particularly cardiovascular disease (CVD) and mortality. CVD refers to various conditions affecting the heart and blood vessels [2,3]. The relationship between alcohol consumption and CVD is complex, multifaceted, and with evidence suggesting it may differ by sex [4,5,6]. Studies suggest a J-shaped relationship (e.g., in the Global Burden of Disease study between 1990 and 2016) [1], with light-to-moderate drinking associated with the lowest risk in mostly middle-aged to older participants [7,8,9]. Women may be more vulnerable to alcohol’s harmful effects, showing faster intoxication, greater organ damage at lower doses, and quicker progression to dependence. However, sex-specific differences in the long-term impact of alcohol on CHD risk remain poorly understood [10,11]. Thus, further investigation is needed.
Concerns about confounding and selection bias, particularly among participants who abstain due to pre-existing health conditions, cast doubt on the protective effects of moderate drinking [12]. Additionally, most existing studies are cross-sectional or assessing alcohol consumption at a single point in time, which may not capture the dynamic nature of drinking habits that can change over time due to life circumstances such as health-related stressors or aging [13,14]. Individuals who increase their alcohol consumption, particularly those transitioning to heavy drinking, face a higher risk of CVD and mortality [9]. Conversely, a reduction in alcohol consumption, particularly from moderate or heavy drinking to abstinence, may reflect either intentional lifestyle improvements or underlying declining health conditions prompting cessation [15]. Therefore, longitudinal studies are essential for capturing long-term trends in alcohol consumption and their impact on health outcomes.
Our study addresses key gaps by examining sex-specific patterns of long-term alcohol consumption and their relationship to all-cause mortality and CVD, particularly coronary heart disease (CHD, the major type of CVD). We hypothesize that there are distinct alcohol consumption trajectories over time in men and women, and these trajectory groups are associated with varying all-cause mortality and CHD risks. Using data from the Framingham Heart Study (FHS), a long-term community-based cohort originating in Massachusetts, USA, we applied sex-specific latent class growth modeling to identify alcohol consumption trajectories (Aim 1) and conducted sex-specific multivariable-adjusted regression analyses to evaluate their associations with all-cause mortality and CHD (Aim 2). These analyses aim to improve our understanding of how long-term drinking patterns influence disease risk.
Method
We analyzed longitudinal alcohol consumption data and outcome variables in two phases: Phase 1 identified drinking trajectories over 15 years, and Phase 2 assessed their associations with mortality and CHD risk (Figure 1).
Study Participants
The FHS is a long-term, community-based, multi-generational cohort study in Framingham, Massachusetts, USA. To investigate cardiovascular risk factors, the Original cohort (n=5,209) was recruited in 1948, followed by the recruitment of their offspring and the spouses of the offspring into the Offspring cohort (n=5,124) in 1971 [16,17]. The present analysis initially included all available participants from the Original cohort and Offspring cohort who attended exam 12 (Original cohort, mean age 64±8, range: 50-91 at baseline of Phase 1) and exam 2 (Offspring cohort, mean age 44±10, range: 19-72 at baseline of Phase 1) (Table 1). Including both cohorts is crucial for studying potential generational differences in alcohol consumption and CVD outcomes. These differences may reflect the impact of changes over time in socioeconomic conditions, access to medical care, and lifestyle factors, including alcohol consumption, CVD prevention, and treatment practices.
The participants in FHS underwent in-person exams at regular intervals, including medical history assessments, physical exams, laboratory tests, and lifestyle questionnaires [16,17]. The participants in the Original cohort underwent up to 32 exams every 2 to 4 years, and those in the Offspring cohort have completed up to 10 exams, averaging one every 4 years (with an 8-year gap between the first two). Protocols for the exams of the participants were approved by the Institutional Review Board at Boston University Medical Center. All participants provided written informed consent for genetic studies. All research was performed in accordance with relevant guidelines/regulations.
For the Original cohort, we included participants from eight exams collected over 15 years (Figure 1): Exam 12 (1971–74, baseline), exams 13, 14, 15, 17, 18, 19, and Exam 20 (1986–90). Data prior to Exam 12 were excluded due to inconsistent or incomplete data collection on the types and frequency of alcoholic beverage consumption. Exam 16 data were also excluded because alcohol consumption data were not available. For the Offspring cohort, data from five exams over 16 years were included (Figure 1): Exam 2 (1979–1983, baseline) and exams 3, 4, 5, and 6 (1995–1998). Exam 1 was excluded because the data on the measurement of alcoholic beverage consumption were inconsistent with those in the later exams. In total, 3,503 participants (18,843 observations) from the Original cohort and 4,616 participants (19,086 observations) from the Offspring cohort were included in subsequent analyses (Figure 2).
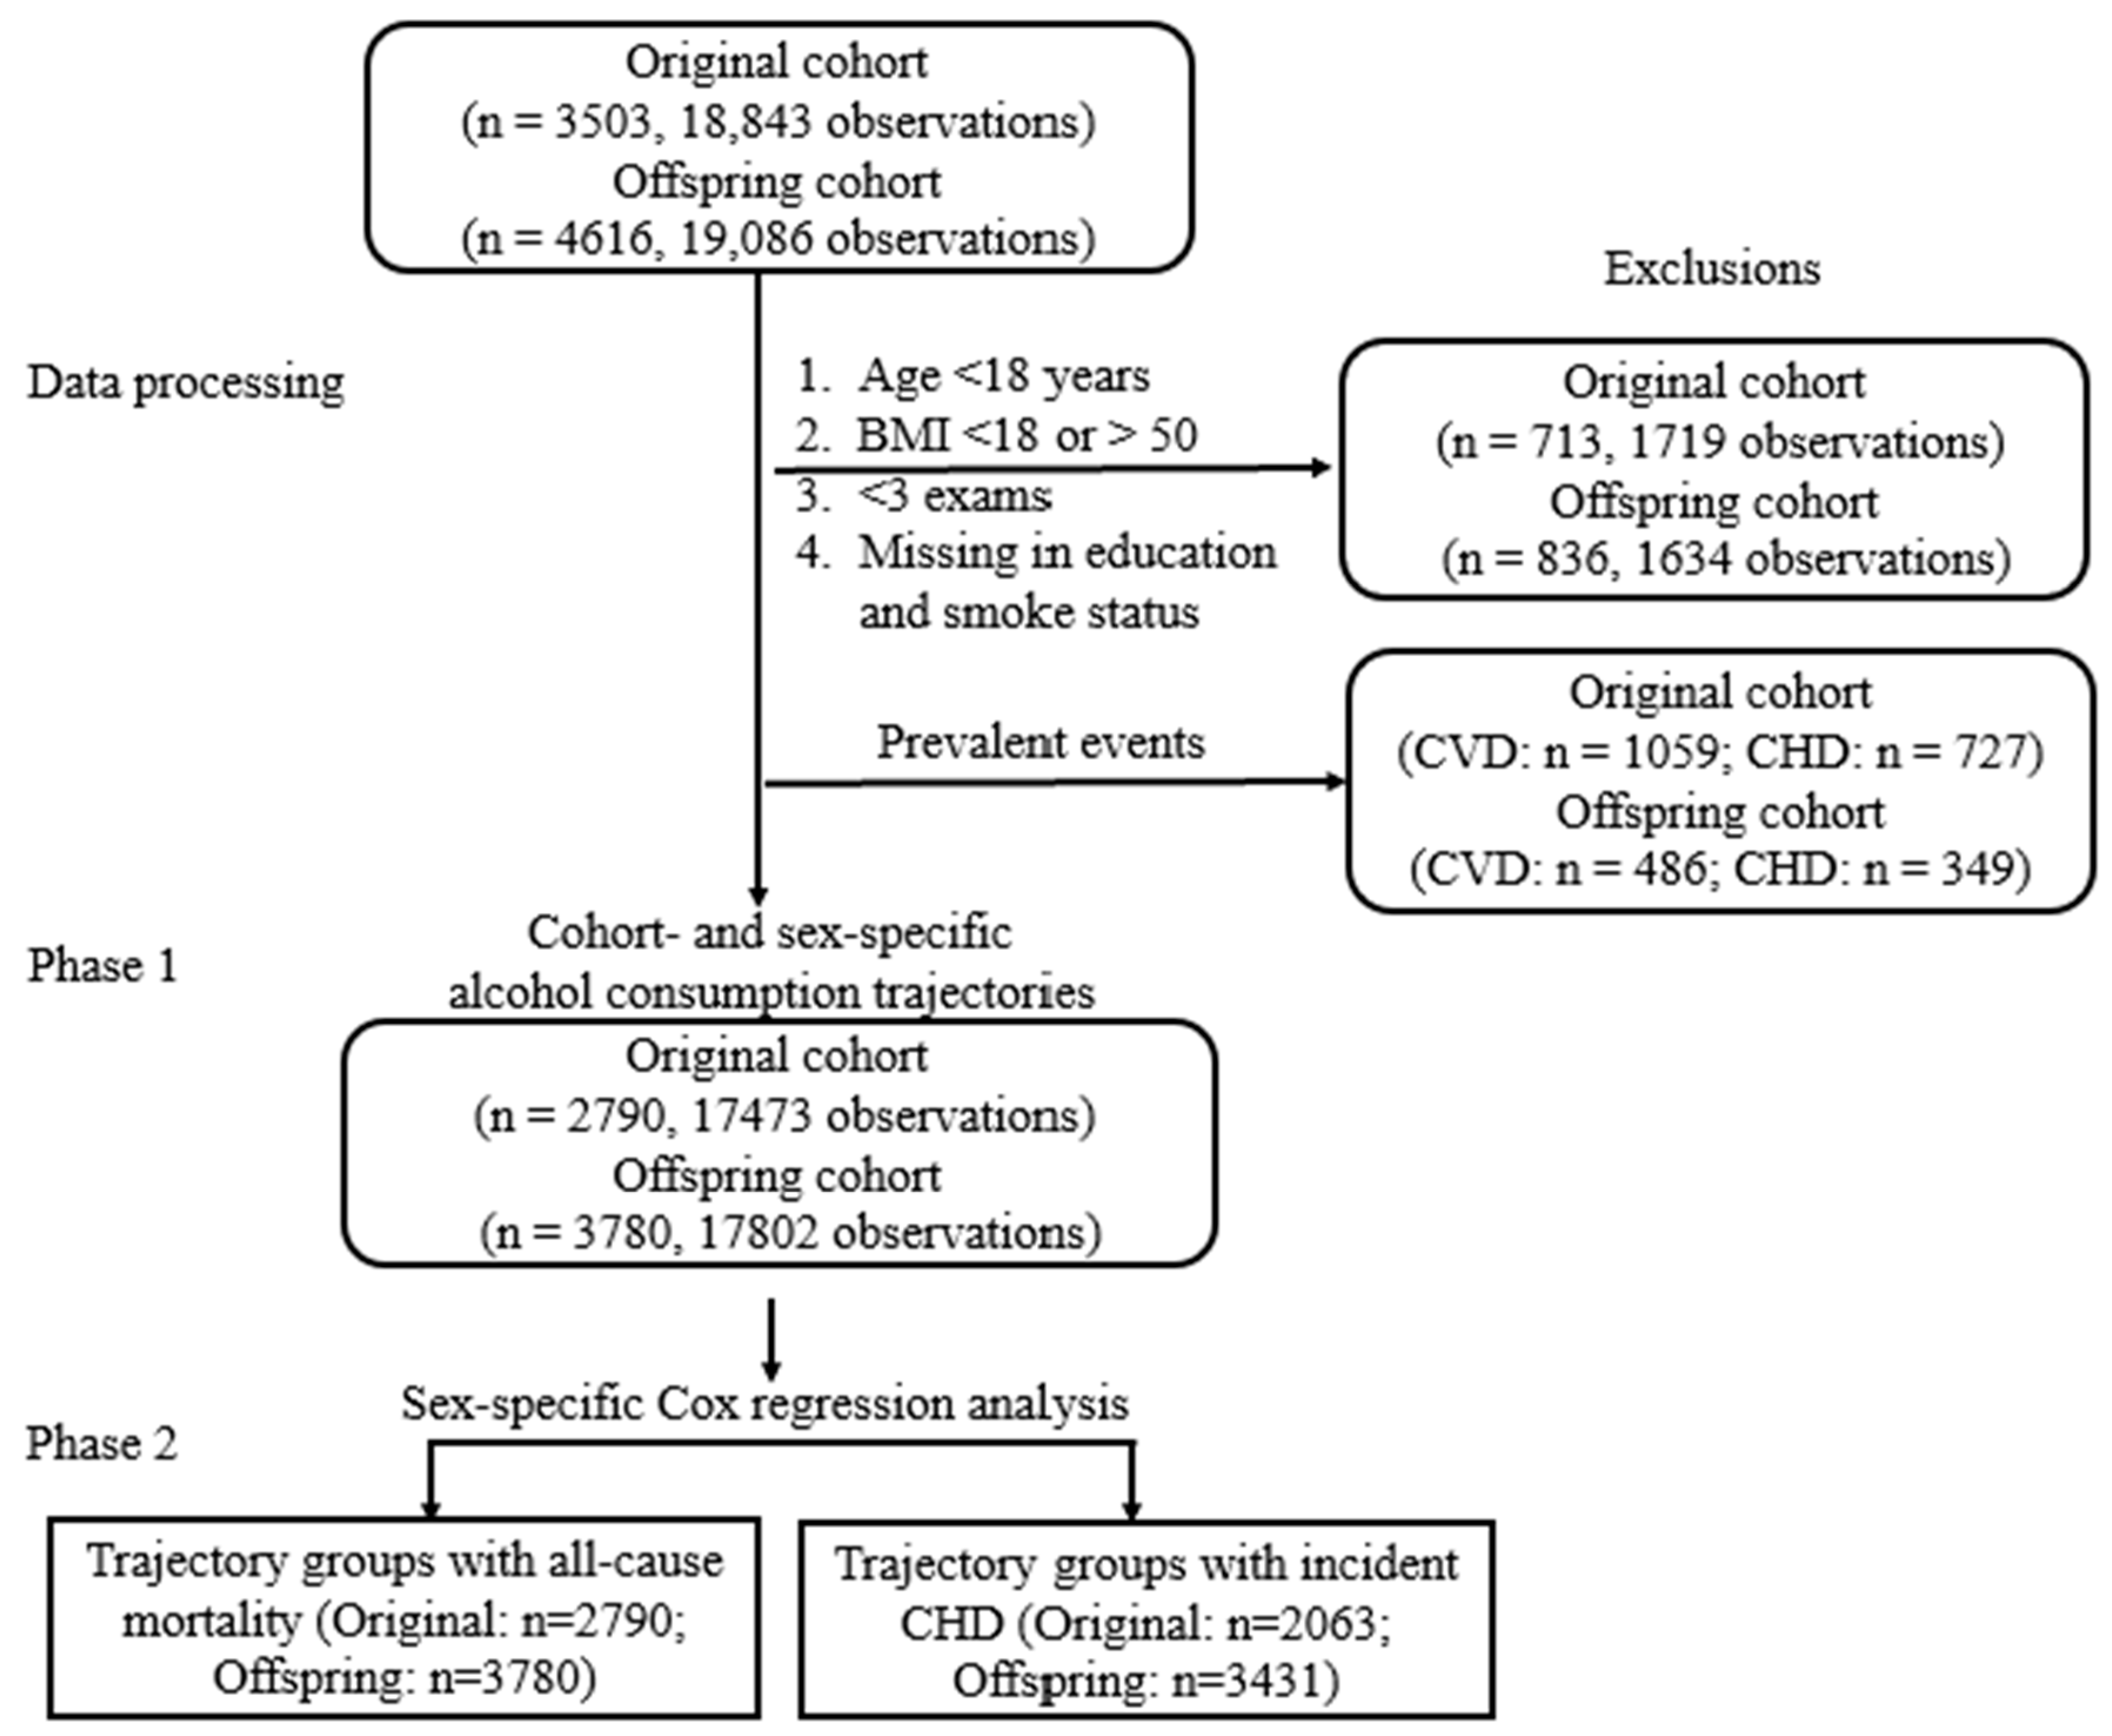
Several additional exclusion criteria (Figure 2) were applied to the data before trajectory analysis in Phase 1. We excluded participants under 18 years of age at baseline (n = 6) as individuals under 18 undergo significant physiological development. We also excluded participants with a BMI below 18 kg/m2 or above 50 kg/m² (n = 82), as these extremes may reflect underlying health conditions or atypical physiology that could bias trajectory patterns or outcome associations. In addition, for longitudinal consistency, we excluded participants who attended fewer than three exams, had missing alcohol consumption data, or who had covariates in two or more consecutive exam visits. After applying the exclusion criteria, 713 participants from the Original cohort and 836 from the Offspring cohort were removed, leaving 6,570 participants (2,790 from the Original cohort and 3,780 from the Offspring cohort) for the Phase 1 analysis to identify alcohol consumption trajectory patterns (Figure 1, Figure 2).
At the baseline of Phase 2, participants with prevalent CVD outcomes (i.e., any existing CVD cases identified prior to or at the baseline of Phase 2) were excluded from further analysis for incident CHD. A total of 1,545 prevalent CVD cases, including 1,076 prevalent CHD cases, were excluded (Figure 1, Figure 2). To maximize sample size, missing values for alcohol consumption and covariates were imputed by averaging the measurements from the two nearest exams, assuming the missing data were due to sporadic absences (Figure 2).
Alcohol Consumption Measurement
Lifestyle information, including alcohol consumption, was collected at most exams through a standalone, technician-administered questionnaire [18]. Participants were asked about their average weekly consumption of beer, wine, or liquor (in a standard portion size) over the past year. A standard drink was 12 ounces of beer, 4 to 5 ounces of wine, or 1.5 ounces of liquor, each containing approximately 14 grams of ethanol [19] (Supplemental Methods). Given the right-skewed distribution of alcohol consumption and the high proportion of participants without alcohol intake, a cohort- and sex-specific Box-Cox transformation was applied to the alcohol consumption data to improve normality and support more stable regression estimates [20] (Supplemental Figure 1).
Definition of All-Cause Mortality, CHD, and CVD
All-cause mortality, defined as death from any cause. Consistent procedures were followed to determine CVD outcomes (including CHD) and death events within FHS. A panel of three physicians reviewed medical records and death certificates to ensure accurate and consistent diagnoses [24]. The diagnosis of CHD includes coronary insufficiency (insufficient blood supply to the heart, often leading to symptoms like chest pain or angina), recognized myocardial infarction (MI) (a blockage in the coronary arteries that impedes blood flow and damages the heart muscle), and CHD-related death due to these conditions [24,25]. CVD was comprised of CHD, stroke, heart failure (HF), and death from any cardiovascular condition [26]. For the analysis of all-cause mortality, follow-up time was calculated from the Phase 2 baseline to the earliest of the following events: date of death, date of last contact, or 10 years post-baseline, whichever occurred first. For CVD and CHD, follow-up time was calculated from the Phase 2 baseline to the earliest of the following: the first occurrence of a CVD or CHD event, date of last contact, death, or 10 years post-baseline.
Covariates
In Phase 1, covariates included baseline education and smoking status assessed at each exam in the trajectory analysis of alcohol consumption. Education status was categorized into four levels: no high school, high school, some college, and college graduate. Current smoking status at each exam was recorded as a binary variable (Yes or No), indicating whether the participant was smoking regularly in the past year before an exam.
In Phase 2, covariates include education level, smoking status, systolic blood pressure (SBP), hypertension treatment, diabetes, and BMI at the baseline of phase 2 [27]. Except for education level, all covariates used in the Phase 2 analysis were measured at the baseline of Phase 2. (Table 1). We used the same variable for education level in both phases, as our study sample consisted primarily of middle-aged participants. Systolic blood pressure (SBP) was measured twice by physicians, and the average of the two readings was used in our analysis [24]. Diabetes was defined as a fasting glucose level equal to or greater than 126 mg/dL or using glucose-lowering medications [28]. Hypertension treatment was recorded based on the use of antihypertensive medications to treat high blood pressure. BMI was calculated by dividing the weight in kilograms by the square of the participant's height in meters (kg/m2).
Statistical Analysis
Comparison of Demographics
Population characteristics were compared based on sex and the trajectory groups of alcohol consumption. Chi-squared tests were employed to assess categorical variables, t-tests were used to compare continuous variables between the sexes, and one-way Analysis of Variance (ANOVA) was utilized to evaluate differences in continuous variables across trajectory groups.
Trajectory Analysis of Alcohol Consumption
The Growth Mixture Model (GMM) [29] was used to identify longitudinal patterns for alcohol consumption in Phase 1. The GMM can identify 'latent classes,' which are hidden groups that the model detects in the data, even though these groups are not directly observed. Each group is characterized by its own growth parameters: initial status, linear growth, and quadratic growth [29,30]. Covariates in GMM included age, education at baseline in Phase 1, and smoking status at each exam. Both linear and quadratic models were considered to describe different patterns of change in a trajectory over time. Based on the Bayesian Information Criterion (BIC), the use of the quadratic term appeared more appropriate in reflecting curvature variations in drinking behaviors over time. We restricted the number of trajectory groups from one to five based on a combination of statistical model fit, interpretability, and sample size considerations for each cohort- and sex-specific analysis [31]. This resulted in a total of twenty models. The optimal number of groups was selected based on the lowest BIC value, yielding one best-fitting model for each cohort- and sex-specific analysis.
Additional steps were taken to enhance the robustness and interpretability of the results. Because GMM randomly selects initial hyperparameters, we ran 100 iterations per model to obtain stable parameter estimates and reduce random variability [32]. Additionally, we required each identified trajectory group to contain at least 5% of all the study participants to ensure a meaningful group size [33,34]. Lastly, we examined the trajectory groups and combined those that displayed similar alcohol consumption patterns to facilitate a clearer interpretation of further analyses. Sensitivity analyses were conducted to examine whether combining trajectory groups was appropriate (see Sensitivity analysis).
Association Analysis of Alcohol Consumption Trajectories with Mortality and CHD
This primary association analysis evaluated the relationship between alcohol consumption trajectories and both all-cause mortality and CHD using sex-specific models combining data from both cohorts. In Phase 2, sex-specific Cox proportional hazards models were conducted to examine the associations between alcohol consumption trajectories and all-cause mortality and incident CHD. The base model quantified the unadjusted association between trajectory groups and an event. Additional covariates, including age, education level, BMI, smoking, hypertension, diabetes, and SBP at the baseline of Phase 2, were adjusted in the multivariable model. We checked the Cox proportional hazards (PH) assumption for all Cox proportional hazards models.
As a secondary association analysis, we conducted the same sex-specific Cox proportional hazards models within each generational cohort, using the same set of covariates, to assess consistency across the two FHS generations. We also conducted multiple sensitivity analyses to assess model robustness, evaluate potential confounding variables, and confirm consistency of associations across cohorts and analytical specifications (Supplemental Materials).All statistical analyses were performed with R version 4.1.1. A two-sided P value of less than 0.05 was considered statistically significant.
Results
In this section, we first described the study sample and alcohol consumption trajectory groups (Phase 1), followed by the association results with mortality and CHD (Phase 2).
Cohort Characteristics
At Phase 1 (Figure 1), our study included 2,790 Original cohort participants (mean age at baseline: 63±8, 59.7% women) and 3780 Offspring cohort participants (mean age at baseline: 44±10, 52.1% women) (Table 1). The Original and Offspring cohorts differed significantly in their health profiles (P < 0.001), with a mean baseline age difference of 20 years between the two cohorts (Table 1). Over half of the Original cohort participants had hypertension (56% in women and 50% in men), while less than one-fourth (17% of the women and 28% of the men) of the Offspring cohort had hypertension. Women in the Original cohort had a higher BMI than those in the Offspring cohort (mean BMI 26.5 vs. 24.7 kg/m2). In contrast, men had a similar BMI in both cohorts. Women in the Offspring cohort consumed more alcohol than those in the Original cohort (median consumption 4 g/day vs. 2 g/day, P < 0.001). In contrast, men in both cohorts consumed a similar amount of alcohol (median consumption of 14 g/day) (Table 1).

Table 1.
Baseline characteristics of the study samples.
| Variable1 | Original cohort | Offspring cohort | ||
|---|---|---|---|---|
| Men (n=1123) | Women (n=1667) | Men (n=1812) | Women (n=1968) | |
| Age, years | 63 (7) | 64 (8) | 44 (10) | 44 (10) |
| BMI, kg/m2 | 26.9 (3.4) | 26.46 (4.5) | 26.76 (3.6) | 24.66 (4.7) |
| DBP, mmHg | 84.5 (.1) | 83.63 (12.1) | 82.03 (10.6) | 76.07 (10.6) |
| SBP, mmHg | 141.6 (21.9) | 144.91 (25.7) | 127.37 (17.3) | 119.49 (18.5) |
| TC, mg/dL | 225.1 (38.2) | 227.1 (43.5) | 209.02 (38.0) | 203.85 (40.9) |
| HDL, mg/dL2 | NA | NA | 43.20 (11.8) | 55.55 (14.9) |
| Education, n (%) | ||||
| No high school | 433 (38.6%) | 611 (36.7%) | 131 (7.2%) | 110 (5.6%) |
| High school | 344 (30.6%) | 546 (32.8%) | 521 (28.8%) | 679 (34.5%) |
| Some college | 148 (13.2%) | 353 (21.2%) | 441 (24.3%) | 635 (32.3%) |
| College or above | 198 (17.6%) | 157 (9.4%) | 719 (39.7%) | 544 (27.6%) |
| Hypertension treatment, n (%) | 160 (14.3%) | 371 (22.3%) | 194 (10.7%) | 180 (9.1%) |
| Lipid treatment, n (%) | 13 (1.2%) | 38 (2.3%) | 21 (1.2%) | 10 (0.5%) |
| Current diabetes, n (%) | 4 (9.8%) | 4 (6.6%) | 60 (3.4%) | 36 (1.9%) |
| Obesity, n (%) | 176 (15.7%) | 312 (18.8%) | 297 (16.5%) | 238 (12.1%) |
| Hypertension3, n (%) | 566 (50.4%) | 929 (55.7%) | 506 (27.9%) | 343 (17.4%) |
| Alcohol consumption, g/day4 | 14 (4, 23) | 2 (0, 12) | 14 (4, 22) | 4 (0, 14) |
The FHS is a long-term, community-based, multigenerational cohort study based in Framingham, Massachusetts, USA. The present analysis included all available participants from the Original and Offspring cohorts who attended Exam 12 (Original cohort) and Exam 2 (Offspring cohort), respectively. See Figure 1 and Figure 2 for the study design and participant exclusions. 1 Values were presented as mean (SD) for continuous variables and count (percent) for category variables. 2 HDL information was not available for the Original cohort at exam 12. 3 Hypertension was defined as the use of hypertension treatment, SBP ≥130 mmHg, or diastolic blood pressure (DBP)≥80 mmHg. 4 Median (IQR) was reported. Note: All variables showed significant differences across the four groups (all P < 0.001).
Alcohol Consumption Trajectories
Initially, in the sex- and cohort-specific analyses, we identified five groups of alcohol consumption. Among them, two groups, referred to as Moderate-Decreasing drinking group A and Moderate-Decreasing drinking group B (Supplemental Figure 2), showed similar drinking patterns, i.e., starting with moderate alcohol intake (0–28 g/day in men, 0–14 g/day in women) followed by a gradual decline over time. Thus, in the sex- and cohort-specific analyses, these two trajectories were combined into a new group referred to as the Moderate-Decreasing drinking group to improve interpretability (Supplemental Figure 3).
We also compared alcohol consumption trajectories separately by sex across the Original and Offspring cohorts. Among women, the overall trajectory patterns were broadly similar between the two generational cohorts (Supplemental Figure 3). The Moderate-Decreasing drinking group included participants who began with moderate alcohol intake (approximately 10 g/day, on average) and gradually reduced their intake to less than 5 g/day by the end of Phase 1. The Low-to-None drinking group consisted of women with constant minimal or no alcohol consumption (on average, approximately 0 g/day) throughout the study period. The Inverse-U Pattern drinking group began with a moderate intake of approximately 5 g/day and, around year 7, increased to about 8 g/day in the Original cohort and 10 g/day in the Offspring cohort, then gradually declined to 0 g/day by the end of follow-up. Women in the High-Decreasing drinking group consistently consumed more than 14 g/day throughout the 15-year period, with a slightly lower intake in the Offspring cohort.
Among men, trajectory patterns were broadly similar between the Original and Offspring cohorts, as observed in women. The Moderate-Decreasing drinking group exhibited a gradual decline in alcohol consumption, from approximately 20 g/day at baseline to 12 g/day after 10 years. The Low-to-None drinking group included men who had lightly consumed alcohol (<14 g/day) and non-drinkers. In the Inverse-U Pattern drinking group, the Original cohort participants started at 25 g/day, increasing around years 7–8 to 45 g/day, then decreasing to low-level consumption (< 14 g/day) by the end of Phase 1; the Offspring cohort participants began at 30 g/day, peaked at 35 g/day, and also declined to low-level consumption by Phase 1 end. The High-Decreasing drinking group maintained consistently high intake, declining from ~60 g/day to ~45 g/day, with Offspring men averaging slightly higher levels throughout (Supplemental Figure 3).
Association of Alcohol Consumption Trajectories with All-Cause Mortality
During an additional median follow-up of 10 years, women have lower mortality rates compared to men (P < 0.001): 1,124 women (31%; 917 from the Original cohort and 207 from the Offspring cohort) and 1,141 men (39%; 790 from the Original cohort and 351 from the Offspring cohort) died from any cause. Mortality was lower in the Offspring cohort compared to the Original cohort (14.7% vs. 61.2%) (Supplemental Table 1). Given the overall similarity in trajectory patterns across cohorts, we conducted the primary association analyses using the combined trajectory groups to maximize statistical power and enhance interpretability. Secondary analyses using cohort-specific groups were performed to compare differences between cohorts. The group of participants in the Moderate-Decreasing drinking group was used as the reference in all analyses.
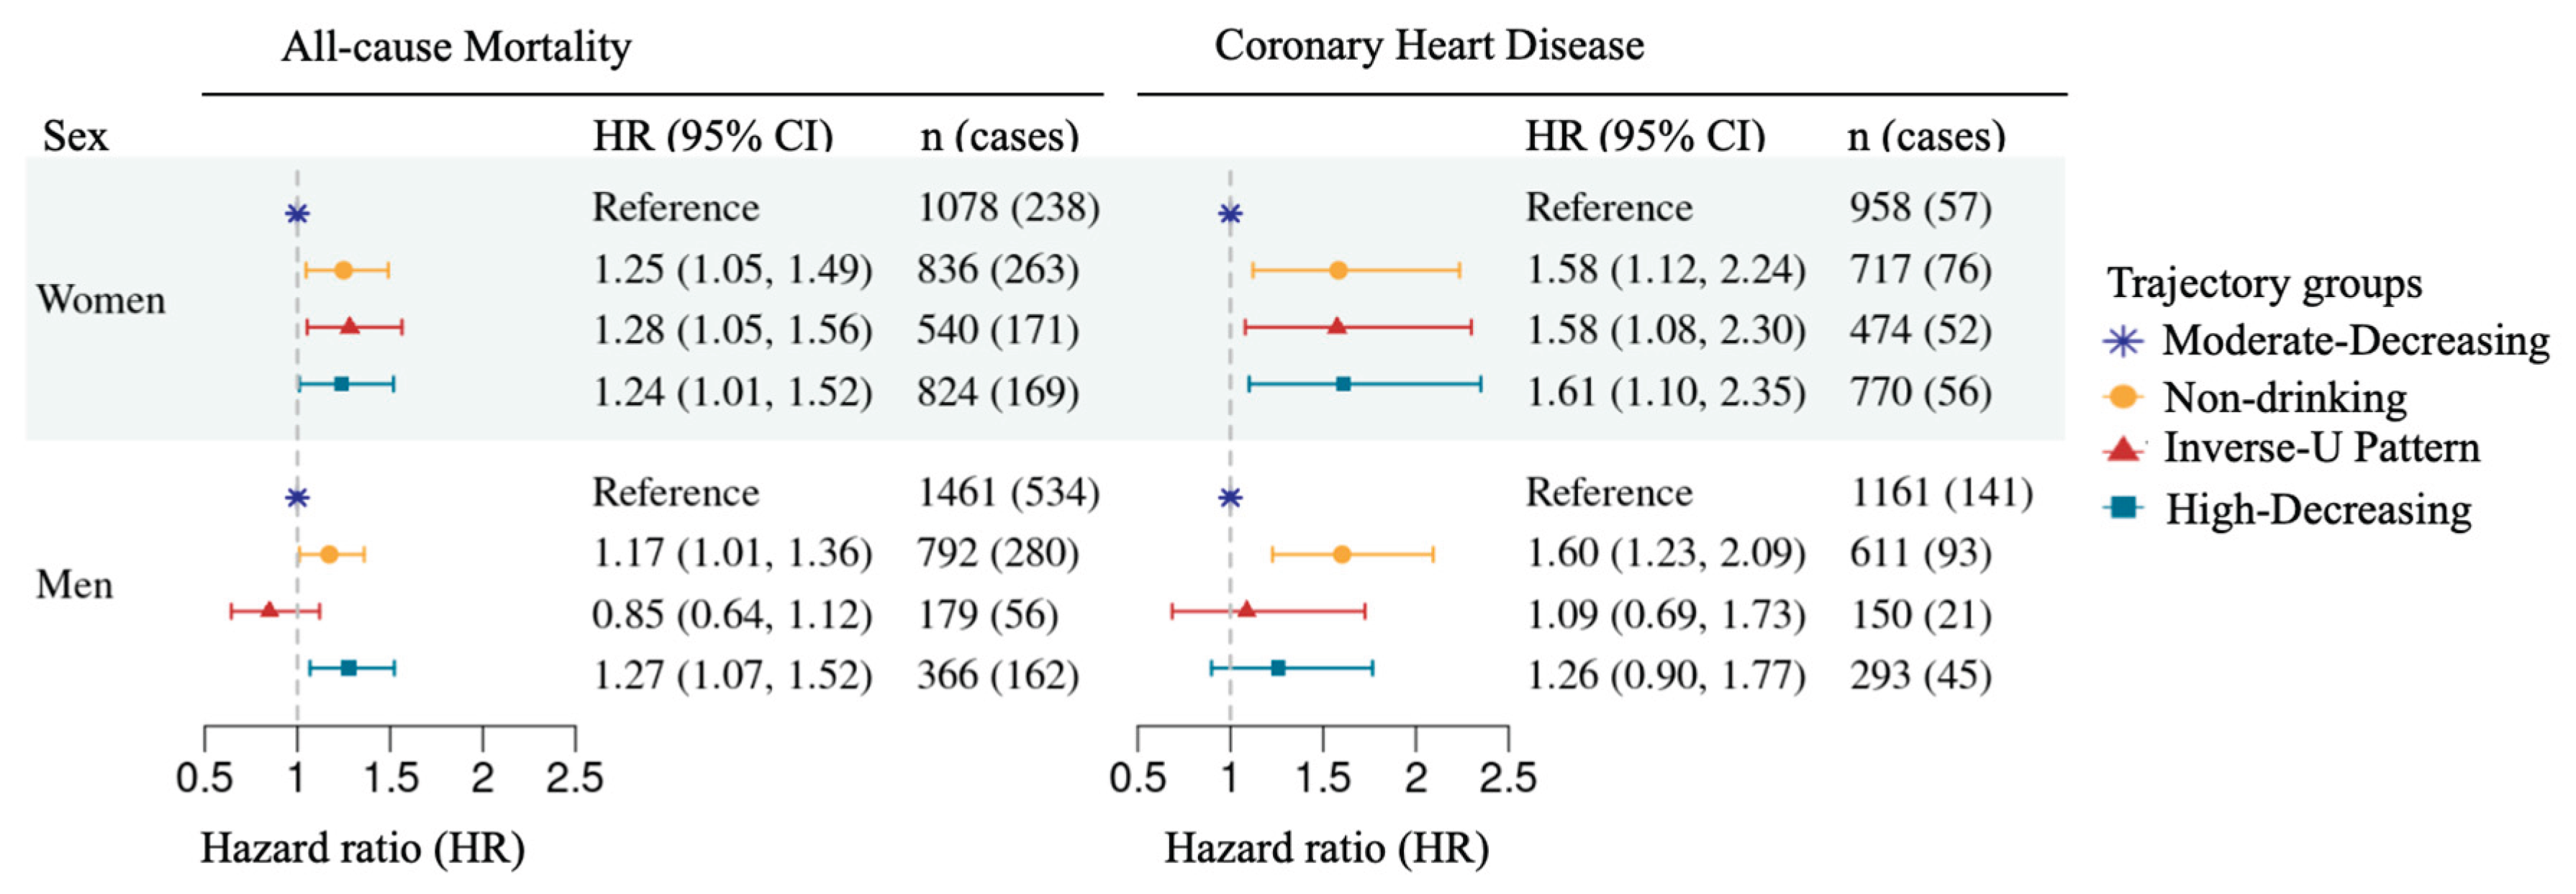
As shown in Supplemental Table 2, women in the Low-to-None drinking group had a lower crude mortality rate (31.6%) compared to the reference group. However, after adjusting for follow-up time using the Cox proportional hazards model, women in the Low-to-None drinking and Inverse-U Pattern drinking groups each exhibited a 24% higher risk of all-cause mortality relative to the reference (Supplemental Table 4). Furthermore, after additionally adjusting for covariates, including age, education level, BMI, smoking status, hypertension, diabetes, and SBP at the baseline of Phase 2, the risk of participants in the Low-to-None drinking group increased by 25% (95% CI = 1.05-1.49, P = 0.01), while risk of participants in the Inverse-U Pattern drinking group increased by 28% (95% CI = 1.05-1.56, P = 0.01) (Figure 4, Supplemental Table 4). We also found a 22% (95% CI=1-1.48, P = 0.053, considering follow-up time) and 24% (95% CI = 1.01-1.52, P = 0.04, adjusting for additional covariates) higher mortality risk for women in the High-Decreasing drinking group compared to reference group (Supplemental Table 4, Figure 4).
Although men in the Low-to-None drinking group had the lowest crude mortality rate (24.3%) among the four trajectory groups (Supplemental Table 3), Cox proportional hazards modeling revealed a 23% higher risk of mortality compared to the reference group after accounting for follow-up time (95% CI: 1.06–1.42, P = 0.005). This elevated risk remained significant, at 17%, after further adjustment for covariates (95% CI: 1.01–1.36, P = 0.04) (Supplemental Figure 4). In addition, men in the High-Decreasing drinking group had a 31% higher risk of all-cause mortality compared to the reference group (95% CI = 1.10-1.56, P = 0.003) using the base Cox proportional hazards model and a 27% higher risk (95% CI = 1.07-1.52, P = 0.007) after additionally adjusting for covariates. No significant associations were observed for men in the Inverse-U Pattern drinking group compared to the reference group (Figure 4; Supplemental Table 5). The proportional risks assumption was tested and satisfied in all Cox proportional hazards models.
Figure 3.
Four trajectory groups of alcohol consumption in sex-specific analysis across the Original and Offspring cohorts. A growth mixture model was applied to identify cohort-specific and sex-specific alcohol consumption trajectories. The number and percentage of participants for each trajectory group are presented in the table below. The Moderate-Decreasing drinking group included moderate drinkers (<14 g/day for women and <28 g/day for men) who slightly decreased their consumption. The Inverse-U Pattern drinking group comprised participants with varying alcohol intake patterns, while the High-Decreasing drinking group included participants with consistently high intake levels (>28 g/day for women and >40 g/day for men), also showing a decreasing trend. HR, hazard ratio. 95% CI, 95% confidence interval.
Figure 3.
Four trajectory groups of alcohol consumption in sex-specific analysis across the Original and Offspring cohorts. A growth mixture model was applied to identify cohort-specific and sex-specific alcohol consumption trajectories. The number and percentage of participants for each trajectory group are presented in the table below. The Moderate-Decreasing drinking group included moderate drinkers (<14 g/day for women and <28 g/day for men) who slightly decreased their consumption. The Inverse-U Pattern drinking group comprised participants with varying alcohol intake patterns, while the High-Decreasing drinking group included participants with consistently high intake levels (>28 g/day for women and >40 g/day for men), also showing a decreasing trend. HR, hazard ratio. 95% CI, 95% confidence interval.
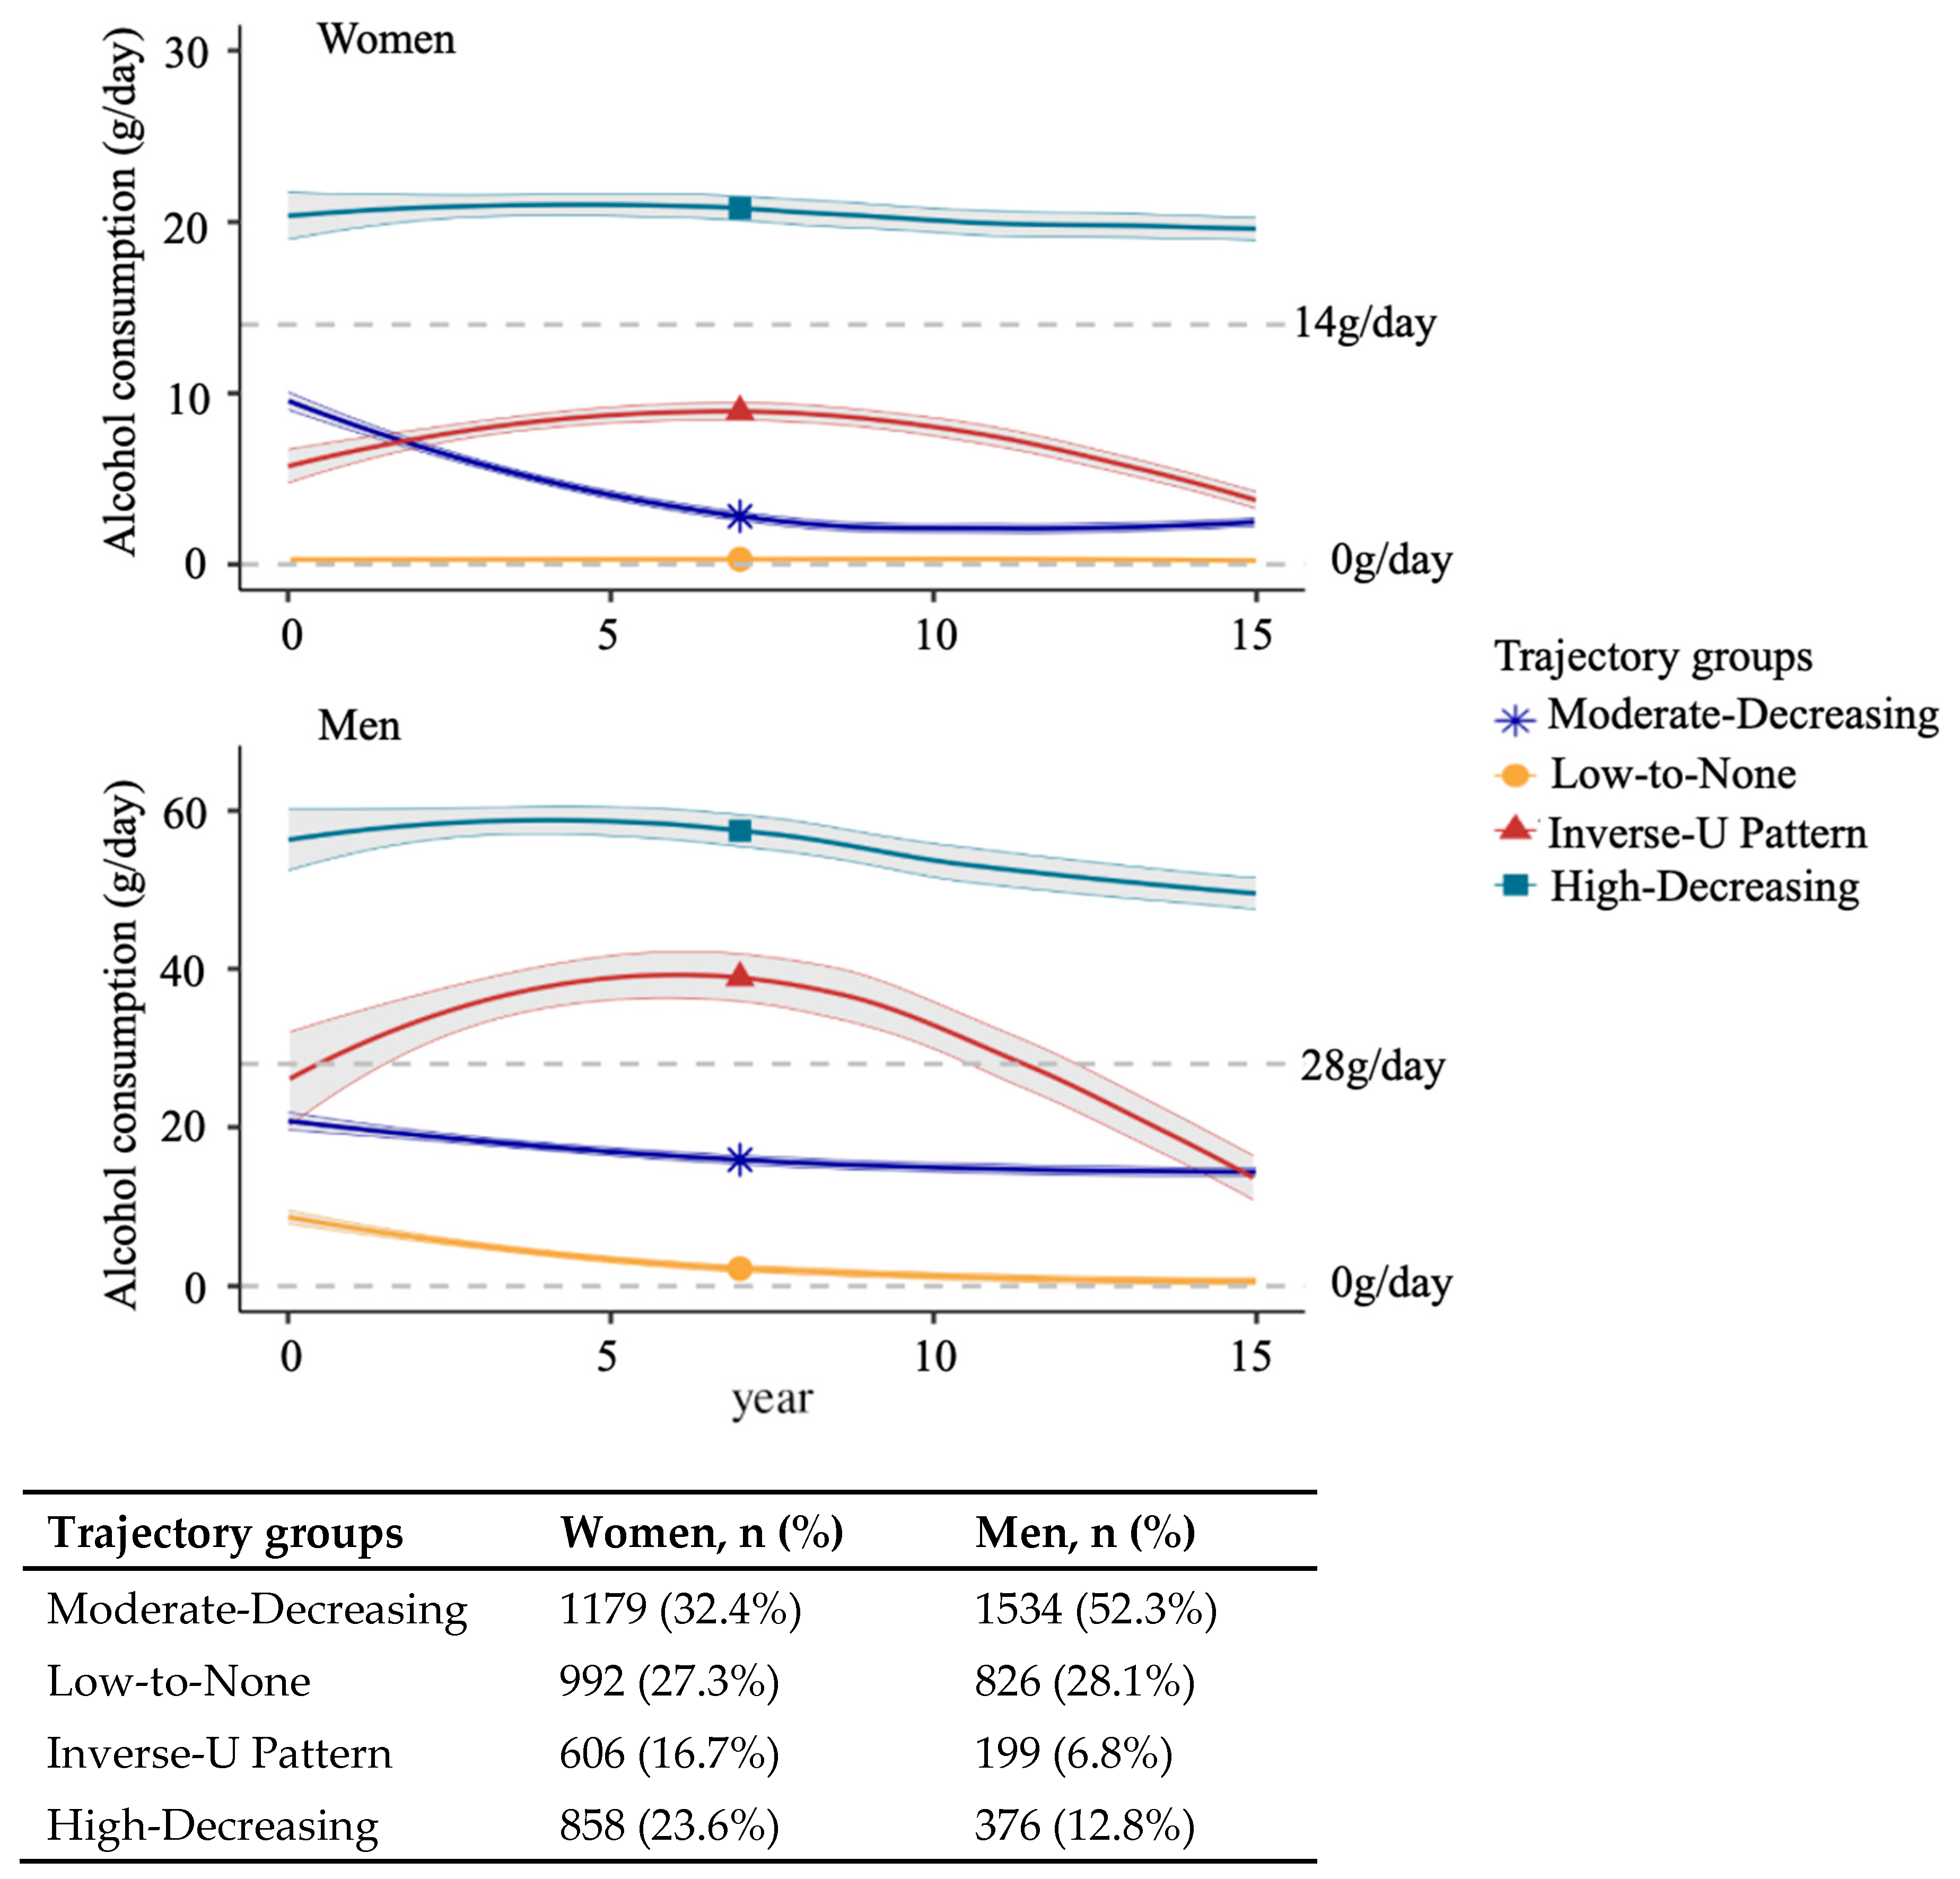
Figure 4.
Sex-stratified association analysis between alcohol consumption trajectory groups with all-cause mortality and coronary heart disease. The alcohol consumption groups were described in Figure 3. Cox proportional hazards models were used to examine the association between alcohol consumption trajectory groups and time to all-cause mortality and coronary heart disease. Covariates included age, education level, body mass index, current smoking status, systolic blood pressure, hypertension treatment, and diabetes at the baseline of Phase 2. The Moderate-Decreasing drinking group (the reference group) included moderate drinkers (<14 g/day for women and <28 g/day for men) who slightly decreased their consumption. The Inverse-U Pattern drinking group comprised participants with varying alcohol intake patterns, while the High-Decreasing drinking group included participants with consistently high intake levels (>28 g/day for women and >40 g/day for men), also showing a decreasing trend. HR, hazard ratio. 95% CI, 95% confidence interval. n (cases), the total number of participants in a trajectory group (the number of events in this group).
Figure 4.
Sex-stratified association analysis between alcohol consumption trajectory groups with all-cause mortality and coronary heart disease. The alcohol consumption groups were described in Figure 3. Cox proportional hazards models were used to examine the association between alcohol consumption trajectory groups and time to all-cause mortality and coronary heart disease. Covariates included age, education level, body mass index, current smoking status, systolic blood pressure, hypertension treatment, and diabetes at the baseline of Phase 2. The Moderate-Decreasing drinking group (the reference group) included moderate drinkers (<14 g/day for women and <28 g/day for men) who slightly decreased their consumption. The Inverse-U Pattern drinking group comprised participants with varying alcohol intake patterns, while the High-Decreasing drinking group included participants with consistently high intake levels (>28 g/day for women and >40 g/day for men), also showing a decreasing trend. HR, hazard ratio. 95% CI, 95% confidence interval. n (cases), the total number of participants in a trajectory group (the number of events in this group).
In secondary analyses, we repeated sex-specific models separately in the Original and Offspring cohorts to assess cohort-specific consistency. Our results were generally consistent across generational cohorts within each sex. The combined analysis produced intermediate effect estimates but demonstrated stronger statistical significance and narrower confidence intervals, indicating improved precision and stability of the associations (Supplemental Materials, Supplemental Table 9).
Association of Alcohol Consumption Trajectories with Incident CHD
Over a median follow-up period of 10 years following the Phase 2 baseline, women have a lower incidence rate of CHD compared to men (P < 0.001): 263 (7.0%) women (176 from the Original cohort and 87 from the Offspring cohort) and 312 (10.6%) men (155 from the Original cohort and 157 from the Offspring cohort) developed CHD (Supplemental Table 1).
Among women, the crude CHD incidence rates were not significantly different across the trajectory groups without considering follow-up time (P = 0.7) (Supplemental Table 3). After considering survival time, women in the Low-to-None and Inverse-U Pattern drinking groups had 57% (95% CI = 1.11-2.21, P = 0.01) and 53% (95% CI = 1.05-2.23, P = 0.03) higher CHD risk compared to the reference group, and after adjusting for the same set of additional covariates, both risks increased by 58% (Low-to-None drinking group: 95% CI = 1.12-2.24, P = 0.01; Inverse-U Pattern drinking group: 95% CI = 1.08-2.30, P = 0.02). In the High-Decreasing drinking group, women had a 47% higher risk of developing CHD compared to the reference group (95% CI = 1.02- 2.13, P = 0.04), and this CHD risk increased to 61% after adjusting for the covariates (95% CI = 1.11- 2.35, P = 0.01) (Figure 4; Supplemental Table 6).
For men, similar to the observations in women, no significant differences were observed in crude CHD incidence rates across the trajectory groups (P = 0.6). When incorporating survival time, men in the Low-to-None drinking group had a 60% higher risk of developing CHD compared to the reference group (95% CI = 1.23 - 2.08, P < 0.001), and the risk remained unchanged after adjusting for the same covariates (95% CI = 1.23 - 2.09, P < 0.001). However, men in the Inverse-U Pattern and High-Decreasing drinking groups did not show a significantly different risk of developing CHD compared to the reference before or after adjusting for additional covariates in Cox proportional hazards models (Supplemental Table 7).
Similar to the mortality analyses, results were consistent across generational cohorts within each sex, while the combined analysis yielded intermediate estimates with stronger significance and narrower confidence intervals, reflecting improved precision (Supplemental Materials, Supplemental Table 9).
Sensitivity Analysis to Evaluate Additional Variables
Sensitivity analyses confirmed the robustness of associations between alcohol trajectories and outcomes across alternative model specifications. Results were consistent when varying the reference group, including additional lifestyle and health factors, or adjusting for family structure (Supplemental Table 8 and Figures 6–9).
Discussion
This study addresses a critical gap in our understanding of the dynamic nature of alcohol consumption over time and its sex-specific associations with all-cause mortality and CHD. We identified four distinct, sex-specific alcohol consumption trajectories in participants from two longitudinal cohorts in the FHS. Most participants displayed an overall decreasing trend in their alcohol consumption over the 15 years of follow-up. However, the patterns of this decline varied across trajectory groups in both women and men. Using the Moderate-Decreasing drinking group as the reference group, where participants consumed moderate but gradually decreasing amounts of alcohol during the 15-year observation period, we found that women in all three of the other groups displayed significantly higher risks for incident all-cause mortality and CHD. Among men, the Low-to-None drinking group had a higher risk of incident CHD compared to the reference. This group, along with the High-Decreasing drinking group (>28 g/day), also exhibited an increased risk of all-cause mortality.
Our study showed sex-specific patterns between trajectory groups and the risk of developing all-cause mortality and CHD. Men in our study had higher drinking levels than women across all trajectory groups. Additionally, in the Inverse-U Pattern drinking groups, both men and women exhibited a trend of increasing followed by decreasing alcohol consumption, while women remained below 14 g/day even at their peak, men exceeded 28 g/day and later reduced their intake to below that level. However, men in the Inverse-U Pattern drinking group showed no significant increase in all-cause mortality and CHD risk compared to the reference group, while women in the Inverse-U Pattern drinking group had a higher risk of both outcomes.
These findings emphasize the importance of considering sex-specific, long-term drinking trajectories in evaluating cardiovascular and overall health. Our findings indicate that participants who engage in moderate alcohol consumption, with a decreasing trend, are associated with a lower risk of all-cause mortality compared to those who drink little or no alcohol. However, participants in the Low-to-None drinking group in our study had more preexisting health conditions, such as obesity, diabetes, and hypertension, which are major risk factors for CVD. Therefore, caution is warranted when considering moderate drinking solely as a means to decrease mortality or to protect against CHD. This perspective is supported by a recent meta-analysis of 107 cohort studies involving over 4.8 million individuals, which found no preventive association between moderate alcohol consumption and all-cause mortality. Nonetheless, most cohort studies included in this large meta-analysis were based on a single alcohol assessment [7].
Our study has several limitations. While we prioritized retaining as much longitudinal data as possible to minimize sample loss, missing data may introduce bias. Additionally, unmeasured covariates or measurement errors may have biased our findings, despite adjusting for multiple factors that influence alcohol consumption patterns. Future research should consider covariates updated at each exam that influence the association between alcohol consumption and health outcomes. We also acknowledge that the self-reported alcohol consumption data may not fully reflect actual intake. The longitudinal design of the FHS enables long-term tracking of behavior, which helps mitigate some biases inherent in self-reporting. In addition, FHS has contributed to large-scale genome-wide association studies (GWAS)[35,36], epigenome-wide association studies (EWAS)[37], and other alcohol-related research with consistently replicated findings [38,39,40]. The variation in exam intervals stems from logistical challenges, including participant availability, resources, and shifting research priorities. While this may affect precision, it is accounted for in statistical models to support reliable conclusions. FHS Original and Offspring cohorts are predominantly White individuals of European descent with higher levels of education and socioeconomic status, which may limit the generalizability of our findings to more diverse populations [41]. Therefore, future studies should include a more diverse group of individuals to enhance the applicability of the findings.
Despite its limitations, this study has several advantages. First, over 15 years of alcohol consumption data provide a rich resource for characterizing long-term drinking patterns. Second, the inclusion of two generational cohorts may capture temporal changes in socioeconomic conditions, medical practices, and lifestyle behaviors, particularly in relation to alcohol use and CVD prevention and treatment. While some cohort-specific differences were observed in trajectory patterns and associations, the overall direction of associations was consistent. Therefore, we combined the cohorts to increase sample size and precision, which strengthened the robustness and interpretability of our findings. However, because participants were primarily related family members, the generalizability of these results to unrelated populations or other geographic and sociodemographic contexts may be limited.
In summary, this study identified sex-specific alcohol consumption trajectories across two FHS generations. Our findings suggest that sustained low to moderate drinking was associated with lower risks of mortality and CHD in both women and men, compared to high-level or fluctuating patterns. These results emphasize the importance of understanding long-term drinking patterns in public health, but we caution against interpreting moderate use as a means to lower mortality risk or prevent CHD.
Supplementary Materials
The following supporting information can be downloaded at the website of this paper posted on Preprints.org.
Funding
Data collection for FHS was supported by N01-HC-25195, HHSN268201500001, and grants (R01AG059727, R01AG016495, R01AG008122, RF1AG062109, U19AG068753, R01AA028263) from the National Institute on Aging. Yuanming. Leng, Yi. Li, Jiantao. Ma, and Chunyu. Liu were supported by R01AA028263. H. Ding was supported by the American Heart Association (20SFRN35360180).
Acknowledgments
We extend our sincere gratitude to the participants of the Framingham Heart Study for their dedication. This research would not have been possible without their invaluable contributions.
Conflicts of Interest
The authors state that this study was carried out without any conflict of interest.
Ethics Approval
Protocols for the exams of the participants were approved by the Institutional Review Board at Boston University Medical Center. All research was performed in accordance with relevant guidelines/regulations.
Consent To Participate
All participants provided written informed consent for genetic studies.
References
- Collaborators, G.B.D.A., Alcohol use and burden for 195 countries and territories, 1990-2016: a systematic analysis for the Global Burden of Disease Study 2016. Lancet, 2018. 392(10152): p. 1015-1035.
- Lloyd-Jones, D.M., et al., Defining and setting national goals for cardiovascular health promotion and disease reduction: the American Heart Association's strategic Impact Goal through 2020 and beyond. Circulation, 2010. 121(4): p. 586-613.
- Benjamin, E.J., et al., Heart Disease and Stroke Statistics-2018 Update: A Report From the American Heart Association. Circulation, 2018. 137(12): p. e67-e492.
- Mostofsky, E., et al., Alcohol and Immediate Risk of Cardiovascular Events: A Systematic Review and Dose-Response Meta-Analysis. Circulation, 2016. 133(10): p. 979-87.
- Hemsing, N. and L. Greaves, Gender Norms, Roles and Relations and Cannabis-Use Patterns: A Scoping Review. Int J Environ Res Public Health, 2020. 17(3). [CrossRef]
- Greaves, L., Missing in Action: Sex and Gender in Substance Use Research. Int J Environ Res Public Health, 2020. 17(7). [CrossRef]
- Zhao, J., et al., Association Between Daily Alcohol Intake and Risk of All-Cause Mortality: A Systematic Review and Meta-analyses. JAMA Netw Open, 2023. 6(3): p. e236185.
- Ronksley, P.E., et al., Association of alcohol consumption with selected cardiovascular disease outcomes: a systematic review and meta-analysis. BMJ, 2011. 342: p. d671. [CrossRef]
- Roerecke, M. and J. Rehm, Alcohol consumption, drinking patterns, and ischemic heart disease: a narrative review of meta-analyses and a systematic review and meta-analysis of the impact of heavy drinking occasions on risk for moderate drinkers. BMC Med, 2014. 12: p. 182. [CrossRef]
- Lee, K., Sex-Specific Associations of Risk-Based Alcohol Drinking Level with Cardiovascular Risk Factors and the 10-Year Cardiovascular Disease Risk Scores. Alcohol Clin Exp Res, 2018. [CrossRef]
- Simon, J., et al., Sex-specific associations between alcohol consumption, cardiac morphology, and function as assessed by magnetic resonance imaging: insights form the UK Biobank Population Study. Eur Heart J Cardiovasc Imaging, 2021. 22(9): p. 1009-1016.
- Naimi, T.S., et al., Selection bias and relationships between alcohol consumption and mortality. Addiction, 2017. 112(2): p. 220-221. [CrossRef]
- Georgescu, O.S., et al., Alcohol Consumption and Cardiovascular Disease: A Narrative Review of Evolving Perspectives and Long-Term Implications. Life (Basel), 2024. 14(9). [CrossRef]
- Khamis, A.A., et al., Alcohol Consumption Patterns: A Systematic Review of Demographic and Sociocultural Influencing Factors. Int J Environ Res Public Health, 2022. 19(13). [CrossRef]
- Millwood, I.Y., et al., Conventional and genetic evidence on alcohol and vascular disease aetiology: a prospective study of 500 000 men and women in China. Lancet, 2019. 393(10183): p. 1831-1842. [CrossRef]
- Dawber, T.R., G.F. Meadors, and F.E. Moore, Jr., Epidemiological approaches to heart disease: the Framingham Study. Am J Public Health Nations Health, 1951. 41(3): p. 279-81.
- Feinleib, M., et al., The Framingham Offspring Study. Design and preliminary data. Prev Med, 1975. 4(4): p. 518-25. [CrossRef]
- Sun, X., et al., Associations of Alcohol Consumption with Cardiovascular Disease-Related Proteomic Biomarkers: The Framingham Heart Study. J Nutr, 2021. 151(9): p. 2574-2582. [CrossRef]
- Liu, C., et al., A DNA methylation biomarker of alcohol consumption. Molecular Psychiatry, 2018. 23(2): p. 422-433. [CrossRef]
- Box, G.E.P. and D.R. Cox, An Analysis of Transformations. Journal of the Royal Statistical Society: Series B (Methodological), 1964. 26(2): p. 211-243.
- Alcoholism, N.I.o.A.A.a. Understanding Alcohol Drinking Patterns. 2025; Available from: https://www.niaaa.nih.gov/alcohols-effects-health/alcohol-drinking-patterns.
- Dawber, T.R., G.F. Meadors, and F.E. Moore, Epidemiological Approaches to Heart Disease: The Framingham Study. American Journal of Public Health and the Nations Health, 1951. 41(3): p. 279-286.
- Goff, D.C., et al., 2013 ACC/AHA Guideline on the Assessment of Cardiovascular Risk. Circulation, 2014. 129(25_suppl_2): p. S49-S73. [CrossRef]
- Culleton, B.F., et al., Cardiovascular disease and mortality in a community-based cohort with mild renal insufficiency. Kidney Int, 1999. 56(6): p. 2214-9. [CrossRef]
- Shurtleff, D., Some characteristics related to the incidence of cardiovascular disease and death: Framingham Study, 16-year follow-up. 1970: US Department of Health, Education, and Welfare, Public Health Service ….
- Ho, J.E., et al., Long-term cardiovascular risks associated with an elevated heart rate: the Framingham Heart Study. J Am Heart Assoc, 2014. 3(3): p. e000668. [CrossRef]
- Kannel, W., P. Wolf, and R. Garrison, The Framingham Heart Study, Section 34: An Epidemiological Investigation of Cardiovascular Disease: Some Risk Factors Related to the Annual Incidence of Cardiovascular Disease and Death in Pooled Repeated Biennial Measurements: 30-Year Follow-Up. Lung, and Blood Institute, 1988.
- Ho, J.E., et al., Long-term Cardiovascular Risks Associated With an Elevated Heart Rate: The Framingham Heart Study. Journal of the American Heart Association. 3(3): p. e000668. [CrossRef]
- Jo, B., et al., Targeted use of growth mixture modeling: a learning perspective. Stat Med, 2017. 36(4): p. 671-686. [CrossRef]
- Wardenaar, K.J., Latent Class Growth Analysis and Growth Mixture Modeling using R: A tutorial for two R-packages and a comparison with Mplus, in PsyArXiv. 2020.
- Rahman, F., et al., Trajectories of Risk Factors and Risk of New-Onset Atrial Fibrillation in the Framingham Heart Study. Hypertension, 2016. 68(3): p. 597-605. [CrossRef]
- Hipp, J.R. and D.J. Bauer, Local solutions in the estimation of growth mixture models. Psychol Methods, 2006. 11(1): p. 36-53. [CrossRef]
- Dillon, P., et al., Group-Based Trajectory Models: Assessing Adherence to Antihypertensive Medication in Older Adults in a Community Pharmacy Setting. Clin Pharmacol Ther, 2018. 103(6): p. 1052-1060. [CrossRef]
- Sagaon-Teyssier, L., et al., A Group-Based Trajectory Model for Changes in Pre-Exposure Prophylaxis and Condom Use Among Men Who Have Sex with Men Participating in the ANRS IPERGAY Trial. AIDS Patient Care and STDs, 2018. 32(12): p. 495-510. [CrossRef]
- Saunders, G.R.B., et al., Genetic diversity fuels gene discovery for tobacco and alcohol use. Nature, 2022. 612(7941): p. 720-724. [CrossRef]
- Schumann, G., et al., KLB is associated with alcohol drinking, and its gene product beta-Klotho is necessary for FGF21 regulation of alcohol preference. Proc Natl Acad Sci U S A, 2016. 113(50): p. 14372-14377. [CrossRef]
- Liu, C., et al., A DNA methylation biomarker of alcohol consumption. Mol Psychiatry, 2018. 23(2): p. 422-433. [CrossRef]
- Bui, H., et al., Association analysis between an epigenetic alcohol risk score and blood pressure. Clin Epigenetics, 2024. 16(1): p. 149. [CrossRef]
- Wang, M., et al., Alcohol consumption and epigenetic age acceleration across human adulthood. Aging (Albany NY), 2023. 15(20): p. 10938-10971. [CrossRef]
- Yousefi, P.D., et al., Validation and characterisation of a DNA methylation alcohol biomarker across the life course. Clin Epigenetics, 2019. 11(1): p. 163. [CrossRef]
- Loucks, E.B., et al., Life-course socioeconomic position and incidence of coronary heart disease: the Framingham Offspring Study. Am J Epidemiol, 2009. 169(7): p. 829-36.
Figure 1.
Study timeline and data collection milestones. The FHS is a long-term, community-based, multi-generational cohort study in Framingham, Massachusetts, USA. To investigate cardiovascular risk factors, the Original cohort (n= 5,209) was recruited in 1948, followed by the recruitment of their offspring and the spouses of the offspring into the Offspring cohort (n=5,124) in 1971. The present analysis included all available participants from the Original cohort and Offspring cohort who attended exam 12 (Original cohort) and exam 2 (Offspring cohort). The year on the arrow reflects the longitudinal nature of the Original and Offspring cohorts in the Framingham Heart Study. In Phase 1, alcohol consumption trajectories were constructed using longitudinal alcohol consumption data collected over 15 years—between 1971 for the Original cohort and between 1979 and 1995 for the Offspring cohort. In Phase 2, association analyses were conducted to examine the relationship between trajectory groups and incident CHD and mortality, with a 10-year follow-up period.
Figure 1.
Study timeline and data collection milestones. The FHS is a long-term, community-based, multi-generational cohort study in Framingham, Massachusetts, USA. To investigate cardiovascular risk factors, the Original cohort (n= 5,209) was recruited in 1948, followed by the recruitment of their offspring and the spouses of the offspring into the Offspring cohort (n=5,124) in 1971. The present analysis included all available participants from the Original cohort and Offspring cohort who attended exam 12 (Original cohort) and exam 2 (Offspring cohort). The year on the arrow reflects the longitudinal nature of the Original and Offspring cohorts in the Framingham Heart Study. In Phase 1, alcohol consumption trajectories were constructed using longitudinal alcohol consumption data collected over 15 years—between 1971 for the Original cohort and between 1979 and 1995 for the Offspring cohort. In Phase 2, association analyses were conducted to examine the relationship between trajectory groups and incident CHD and mortality, with a 10-year follow-up period.
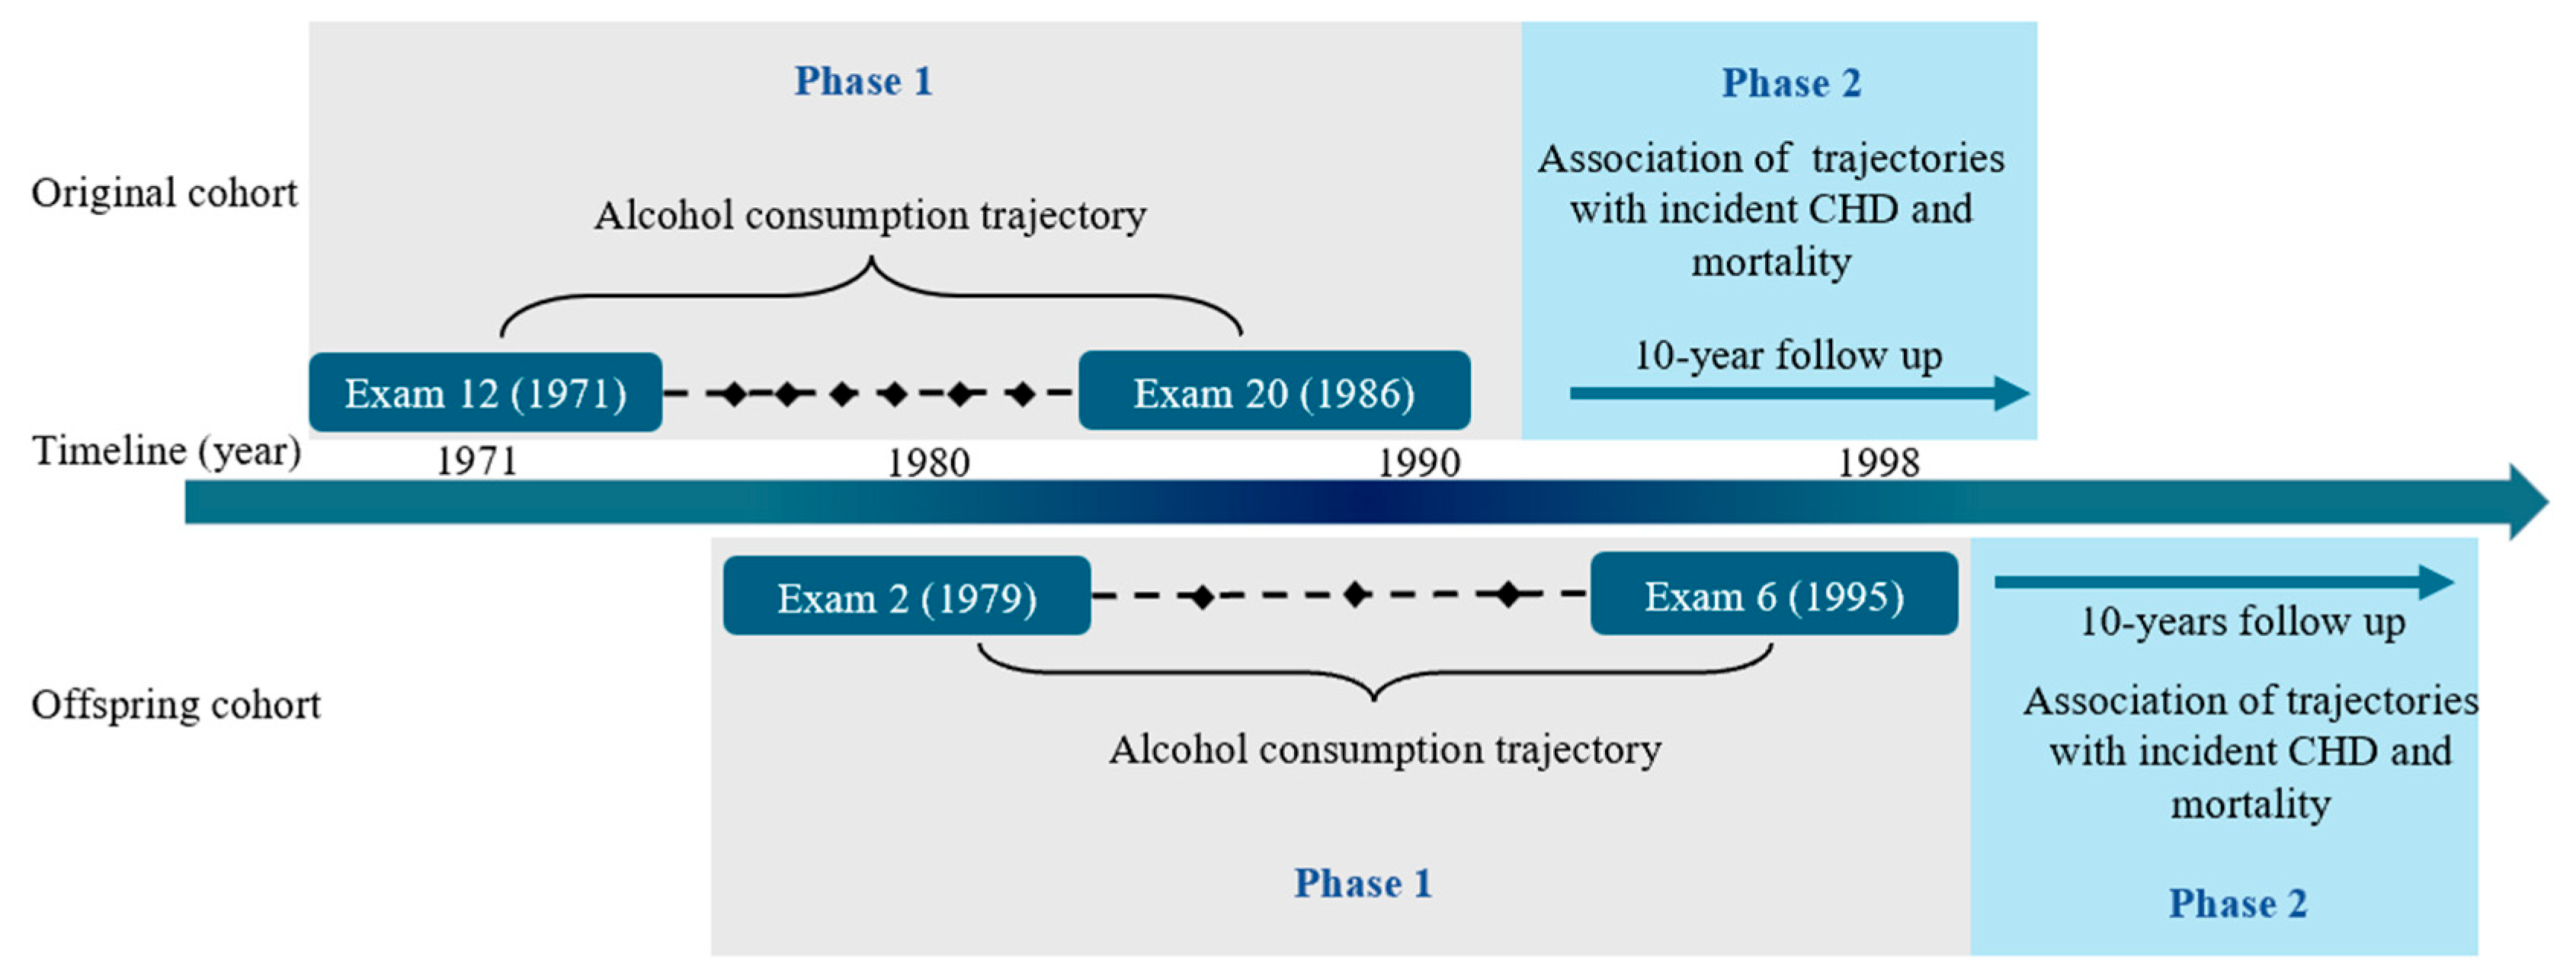
Figure 2.
Study design. The present analysis initially included all available participants from the Original cohort and Offspring cohort who attended exam 12 (Original cohort) and exam 2 (Offspring cohort). Several exclusion criteria were applied to select participants (n = 2,790 from the Original cohort and n = 3780 from the Offspring cohort) for the alcohol consumption trajectory analysis. In Phase 1, cohort- and sex-specific trajectory analysis was conducted to identify alcohol consumption trajectory groups. In Phase 2, sex-specific Cox proportional hazards regression was performed to evaluate if alcohol trajectory groups were associated with total mortality and CHD. BMI, body mass index. CVD, cardiovascular disease. CHD, coronary disease. Prevalent events refer to participants who developed CVD and CHD before the baseline of Phase 2 analysis.
Figure 2.
Study design. The present analysis initially included all available participants from the Original cohort and Offspring cohort who attended exam 12 (Original cohort) and exam 2 (Offspring cohort). Several exclusion criteria were applied to select participants (n = 2,790 from the Original cohort and n = 3780 from the Offspring cohort) for the alcohol consumption trajectory analysis. In Phase 1, cohort- and sex-specific trajectory analysis was conducted to identify alcohol consumption trajectory groups. In Phase 2, sex-specific Cox proportional hazards regression was performed to evaluate if alcohol trajectory groups were associated with total mortality and CHD. BMI, body mass index. CVD, cardiovascular disease. CHD, coronary disease. Prevalent events refer to participants who developed CVD and CHD before the baseline of Phase 2 analysis.
Disclaimer/Publisher’s Note: The statements, opinions and data contained in all publications are solely those of the individual author(s) and contributor(s) and not of MDPI and/or the editor(s). MDPI and/or the editor(s) disclaim responsibility for any injury to people or property resulting from any ideas, methods, instructions or products referred to in the content. |
© 2026 by the authors. Licensee MDPI, Basel, Switzerland. This article is an open access article distributed under the terms and conditions of the Creative Commons Attribution (CC BY) license (http://creativecommons.org/licenses/by/4.0/).
Copyright: This open access article is published under a Creative Commons CC BY 4.0 license, which permit the free download, distribution, and reuse, provided that the author and preprint are cited in any reuse.


