Submitted:
31 January 2026
Posted:
03 February 2026
You are already at the latest version
Abstract
The city of Bukavu, Democratic Republic of Congo, faces multiple urban mobility challenges. Already confronted with major socio-economic issues, it must cope with rapid population growth, accelerated and unplanned urbanization, and signifi cant defi cienciesin transport infrastructure. Approximately 70% of the population lives in precarious conditions, severely limiting access to reliable transport services. Furthermore, due to its hilly terrain, the city is strongly affected by climate-related disruptions, which negatively impact transport networks and increase user costs. These factors exacerbate economic vulnerability related to mobility and strain household budgets. This study adopts a quantitative, predictive approach to better understand and anticipate household vulnerability in daily mobility, contributing to more inclusive public policy development. The analysis relies on Principal Component Analysis (PCA) to identify key determinants, followed by clustering to segment households according to their vulnerability level. Finally, three predictive models were compared. Cluster analysis revealed three distinct vulnerability profi les, highlighting marked socio-economic stratifi cation. The most disadvantaged households, representing 73% of the sample, are the most exposed, with budget shares reaching up to 50% of income. Conversely, affl uent and middle-class households enjoy better mobility conditions but remain sensitive to economic and climate shocks. These fi ndings underscore the need to integrate spatial and economic inequalities into local public policy planning. Among the tested models, logistic regression stood out for its accuracy and its ability to identify vulnerable households with perfect recall.
Keywords:
urban mobility
; socio-economic vulnerability
; spatial inequalities
; Principal Component Analysis (PCA)
; clustering
; predictive modeling
; logistic regression
; Bukavu
; D.R. Congo
1. Introduction
Mobility-related vulnerability represents a major challenge in urban environments, particularly in developing countries, where transport infrastructures are often fragile and households face significant financial constraints [1,2]. Defined as the ability for individuals to move for accessing essential services, employment, and economic opportunities, mobility is fundamental for urban development [3].
However, budgetary effort rate becomes an indicator of household vulnerability when a disproportionate part of their income is devoted to transport expenses[4]. This situation is likely to bring about economic consequences, such as a decrease in the ability for households to meet other essential needs, education, healthcare or food and an increased sensitivity to economic shocks. [5,6] The study undertaken by the World Bank for its Annual Report of the [7], in several African cities has revealed that low-income households allocate, on average, 20% of their monthly budget to freights, limiting their ability to cover other essential needs. Additionally, in developing cities, high transport costs can lead to a reduction of 15-20% on food expenditures, accentuating food insecurity. [8].
In the Democratic Republic of the Congo (DRC), urban mobility raises particularly acute concerns [9,10]. Already confronted to major socio-economic challenges, the country is facing rapid and unplanned urbanization and insufficient transport infrastructures [11]. According to the World Bank [7], more than 70% of the urban population in the DRC lives in precarious conditions, with limited access to affordable and reliable transport services. This situation is further fueled by climate-related disruptions, floods and landslides that regularly damage transport networks and increase user costs [12]. A study undertaken in Katanga region showed that access to public transport has been considerably decreased at 30% due to climatic disturbances, compelling households to make rescourse to informal, costly modes of transport or simply walking [13].
In the South Kivu Province, the situation is more critical. The combination of difficult terrain, high population density, and deteriorated road networks makes travel particularly challenging, worsening household vulnerability in terms of mobility [14,15].Roads are often in poor condition and frequently cut off during the rainy season, isolating entire communities and conditioning high transport costs [16]. Indeed, 60% of households report having reduced their mobility due to high costs and limited access to transportation [17].
This decrease in mobility directly affects access to markets, employment, and healthcare services accentuating poverty and social exclusion. Bukavu, the provincial capital of South Kivu, presents specific and acute challenges. Located on the shores of Kivu Lake, the city faces problems related to its rugged topography and rapid demographic growth. The inadequate and winding road infrastructure, often congested, makes daily commuting complex and costly. Moreover, household mobility costs are further increased by recurrent floods and landslides, which frequently disrupt transport networks. According to [18], households in Bukavu allocate on average 25% of their income to mobility, underlining the emergency of developing predictive tools to better understand and anticipate the economic impacts of mobility disruptions. [19]
Regardless of this context, existing research on economic vulnerability related to mobility remains largely focused on developed countries and on aggregated indicators, neglecting the specificities of urban contexts in African cities [8,20,21]. Furthermore, although the use of machine learning in the social sciences is expanding rapidly [22,23], its application to predict mobility-related vulnerability in fragile contexts remains scarce. This gap arises questions particularly in cities such as Bukavu, where quantitative data on mobility and vulnerability are limited and fragmented. To bridge this gap, the present study proposes a quantitative approach based on an automatic prediction for better understanding and anticipating the vulnerability of households in their daily mobility in Bukavu. Specifically, we use a Principal Component Analysis (PCA) to identify the most determining variables, then we apply a clustering classification to segment households according to their level of vulnerability [24].
Finally, three machine learning models are compared: Random Forest, Logistic Regression, and Support Vector Machines (SVM) to evaluate their ability to predict economic vulnerability related to mobility and to identify the most suitable model for the context of Bukavu.[25,26]
This study is doubly justified ,on one hand, it aims to better identify vulnerable households by means of a predictive tool adapted to the context of Bukavu city, on the other hand, given the fact that current public policies lack sufficiently detailed data for elaborating targeted and effective interventions, this study seeks to provide them with useful insights for reducing vulnerability and improving transport accessibility on behalf of the poorest households [2,27].
The remainder part of this paper is organized as follows. Section 2 presents the materials and methods. Section 3 repports the results and provides their analysis. Section 4 presents the model validation. Section 5 discusses the findings and outlines the policy implications, limitations, and directions for future reseach. Finally, section 6 concludes the study.
2. Materials and Methods
2.1. Research Design
This study aims to analyze household budgetary effort rate and economic vulnerability related to daily mobility in Bukavu city, Democratic Republic of the Congo. The main objective is to model and predict vulnerability from socio-economic data using machine learning algorithms (logistic regression, random forests, and SVM) combined with multivariate analysis techniques (principal component analysis and clustering).
Data were collected between July and November 2023 from 385 households selected through proportional stratified sampling based on the demographic size of Bukavu’s three communes (Ibanda, Kadutu, and Bagira). Proportional allocation was applied to ensure that each commune was represented according to its relative weight in the city’s total population,providing a balanced representation of the urban fabric. Respondents were selected purposively, targeting household heads or adults responsible for transportation expenses, while considering their location, mobility frequency, and socio-economic status. Figure 1 provides an overview of the methodological steps followed in this study..
2.2. Data Collection and Preprocessing
The dataset include features such as the budget effort rate (the share of income devoted to mobility, the income, household size, access to transport and socio-economic variables (education, employment, dependents, etc.), as well as the target variable (vulnerability).It is to be noted that in this study, a household is considered vulnerable if it devotes more than 20% of its income to mobility. Data were collected both on line (WhatsApp), and face-to-face by an investigator. Data were coded and processed in Python using libraries such as pandas, scikit-learn, seaborn, and numpy. Preprocessing steps included:
- Data cleaning:: Missing values were imputed using the mean for continuous variables and the mode for categorical ones.
- Encoding: Categorical variables ( employment type, education level) were converted into numerical form using one-hot encoding.
- Normalization: Continuous variables were standardized using the z-score method to ensure comparability across scales.
- Data splitting:Data splitting: The dataset was divided into training (80%) and test (20%) subsets.
2.3. Analysis Methods
For data analysis, we made recourse to Principal Component Analysis (PCA) and clustering to explore data structure, followed by predictive modeling using three machine learning algorithms.
- 1.
- Principal Component Analysis (PCA): PCA was applied to reduce data dimensionality and identify the main components explaining the variance[28]. The transformation is defined as:where (Z) represents the principal components, (X) the original data matrix, and (W) the weight matrix of the components
- 2.
- K-Means Clustering: allowed to group households based on their socio-economic characteristics and their vulnerability. Tis algorithm minimizes the within-cluster sum of squares as follows:where denotes clusters, are centroids, and k is the number of clusters [29].
- 3.
-
Machine Learning Models:
- Logistic Regression: Estimates the probability of vulnerability considering explanatory variables. The model is defined by:where is the probability of vulnerability, X are predictors, and are logistic coefficients indicating each variable’s effect [30].
- Random Forests: A set of decision trees for capturing complex non-linear relationships among variables. Prediction is given by:where represents the decision tree and B is the total number of trees [24]. Variable importance was measured using the mean decrease in impurity (Gini or entropy).
- Support Vector Machines (SVM): SVM maximizes the margin between classes by using a Kernel function: The objective function is:where w is the weight vector, are the slack variables, and C is a regularization parameter controlling the trade-off between margin maximization and error minimization. Kernel functions (linear, polynomial, or Gaussian/RBF) were used to handle non-linear separations.
2.4. Model Evaluationl
The performance of models was assessed using metrics, such as accuracy, precision, recall, F1-score, accuracy, execution time, and AUC-ROC. These matrics are used to measure the capacity for models to correctly predict vulnerability and to discriminate among classes [31].
Additionally, confusion matrix was used to evaluate model performance by comparing predictions to real values. It includes true positives (TP), false positives (FP), true negatives (TN), and false negatives (FN).
The ROC curve (Receiver Operating Characteristic) illustrates the model’s capability to discriminate among classes, and AUC (Area Under Curve) measures the global performance of the model. An AUC of 1 indicates a perfect performance, while an AUC of 0.5 indicates a random performance (1 = perfect; 0.5 = random), learning curves are used to visualize model performance across training size of the whole treatement. They help to detect overfitting or underfitting [32].
Additionally, Precision–Recall curve which is particularly useful for imbalanced classes, high-lights the trade-off between precision and recall (proportion of true positive predictions) and Recall (proportion of true positives correctly identified). An ideal curve shows a simultaneously high precision and recall). Finally, (k-fold) cross-validation was conducted to assess model robustness by partitioning the dataset into (k) subsets and training/testing iteratively. [33].
3. Results
3.1. Description of Variables
Table 1 reveals socio-economic disparities marked among households in Bukavu, a city located in the South Kivu province of the Democratic Republic of Congo. The average transportation expenditure amounts to USD 51.37, with a relatively high variability (standard deviation = 25.46), reflecting differences in travel modes, distances, and household mobility patterns. Overall, the descriptive statistics highlight heterogeneous income levels and varying transport costs, suggesting differentiated access to mobility services. These inequalities provide an empirical basis for analyzing households’ budgetary effort and economic vulnerability in urban transport.
The average household income is USD 402.08, but the high standard deviation (371.83) indicates significant disparities, ranging from USD 30 to USD 1,500. The average rent is USD 133.80, with values spanning from 0 to 700 USD, reflecting spatial segmentation across the communes. Finally, the average budgetary effort rate is23.02%, yet some households allocate up to 50% of their budget to mobility, placing them in a situation of extreme vulnerability.
3.2. Economic Vulnerability and Budget Effort Rate
Figure 2.
Evolution of households’ economic vulnerability according to the budget effort rate dedicated to mobility. The green curve shows the progressive increase in vulnerability, with the 20% critical threshold highlighted by a red dashed line. The stylized plant illustrates the onset of economic vulnerability at this threshold.
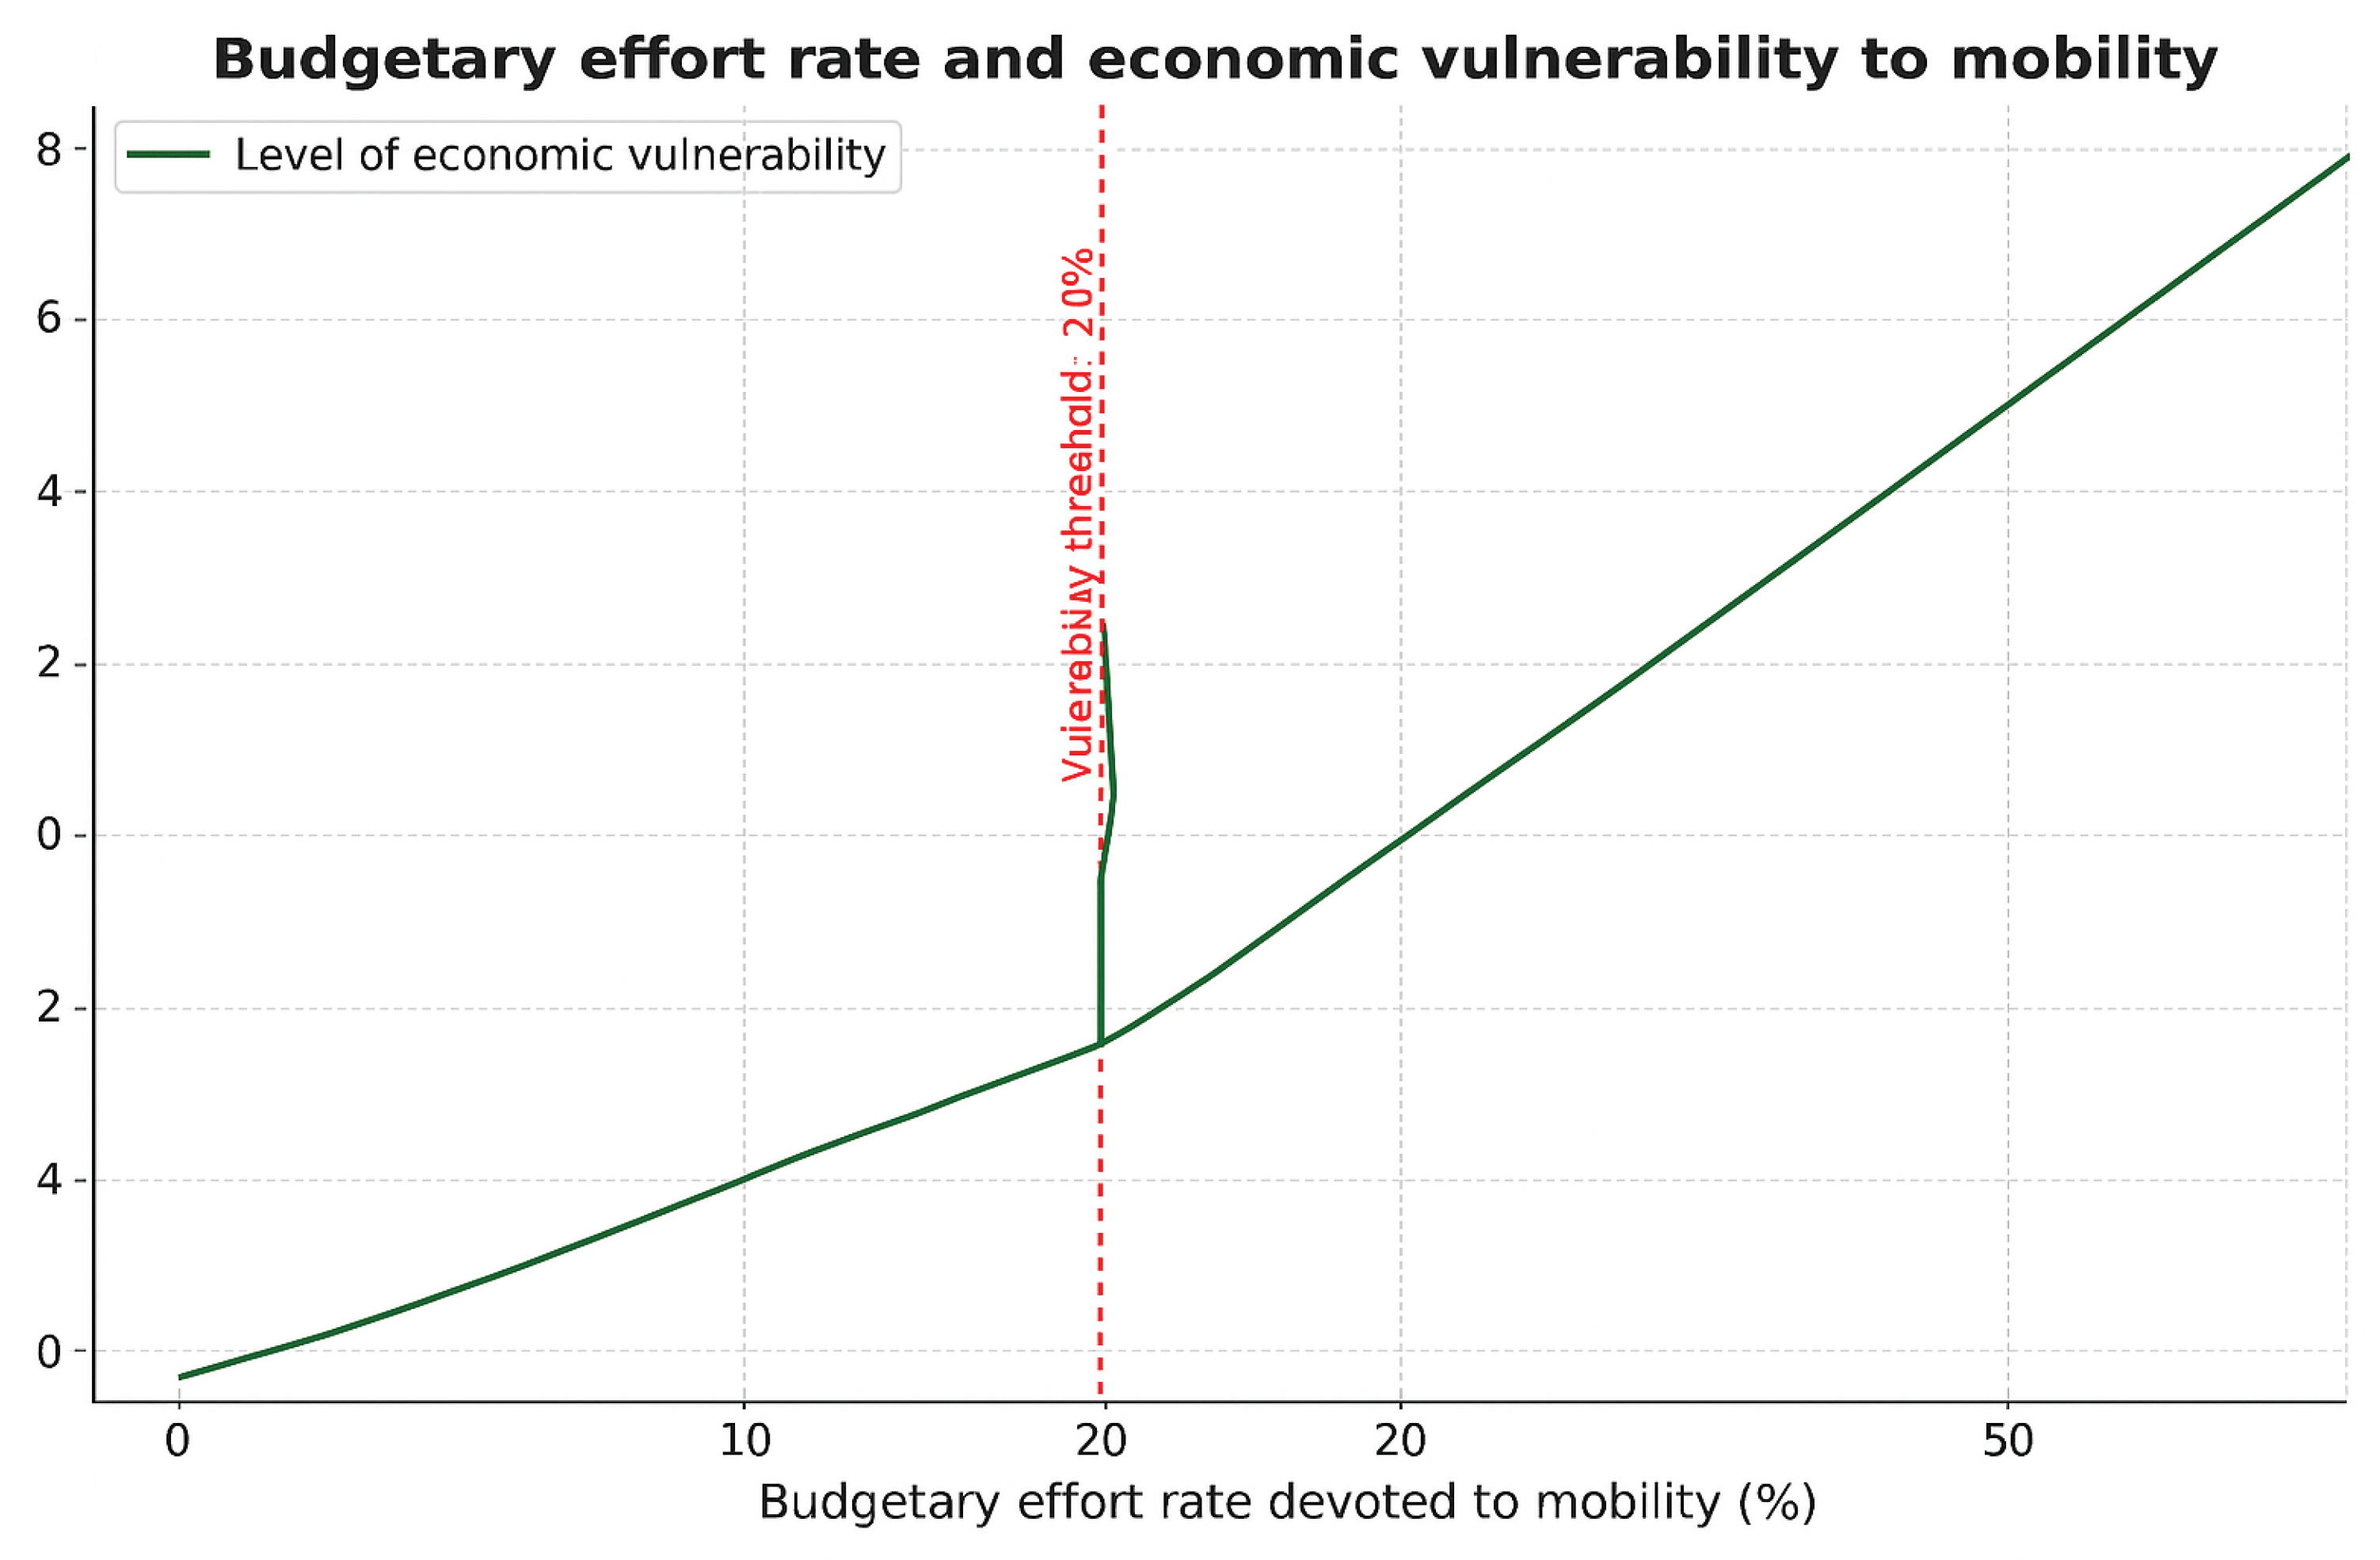
Figure 3.
Correlation matrix among key variables. Strong correlations are observed between income and rent (0.60) and transport (0.39), while the budget effort rate is strongly correlated with income (0.56) and rent (0.40). Mobility rate shows weaker correlations, indicating potential influence from external factors.
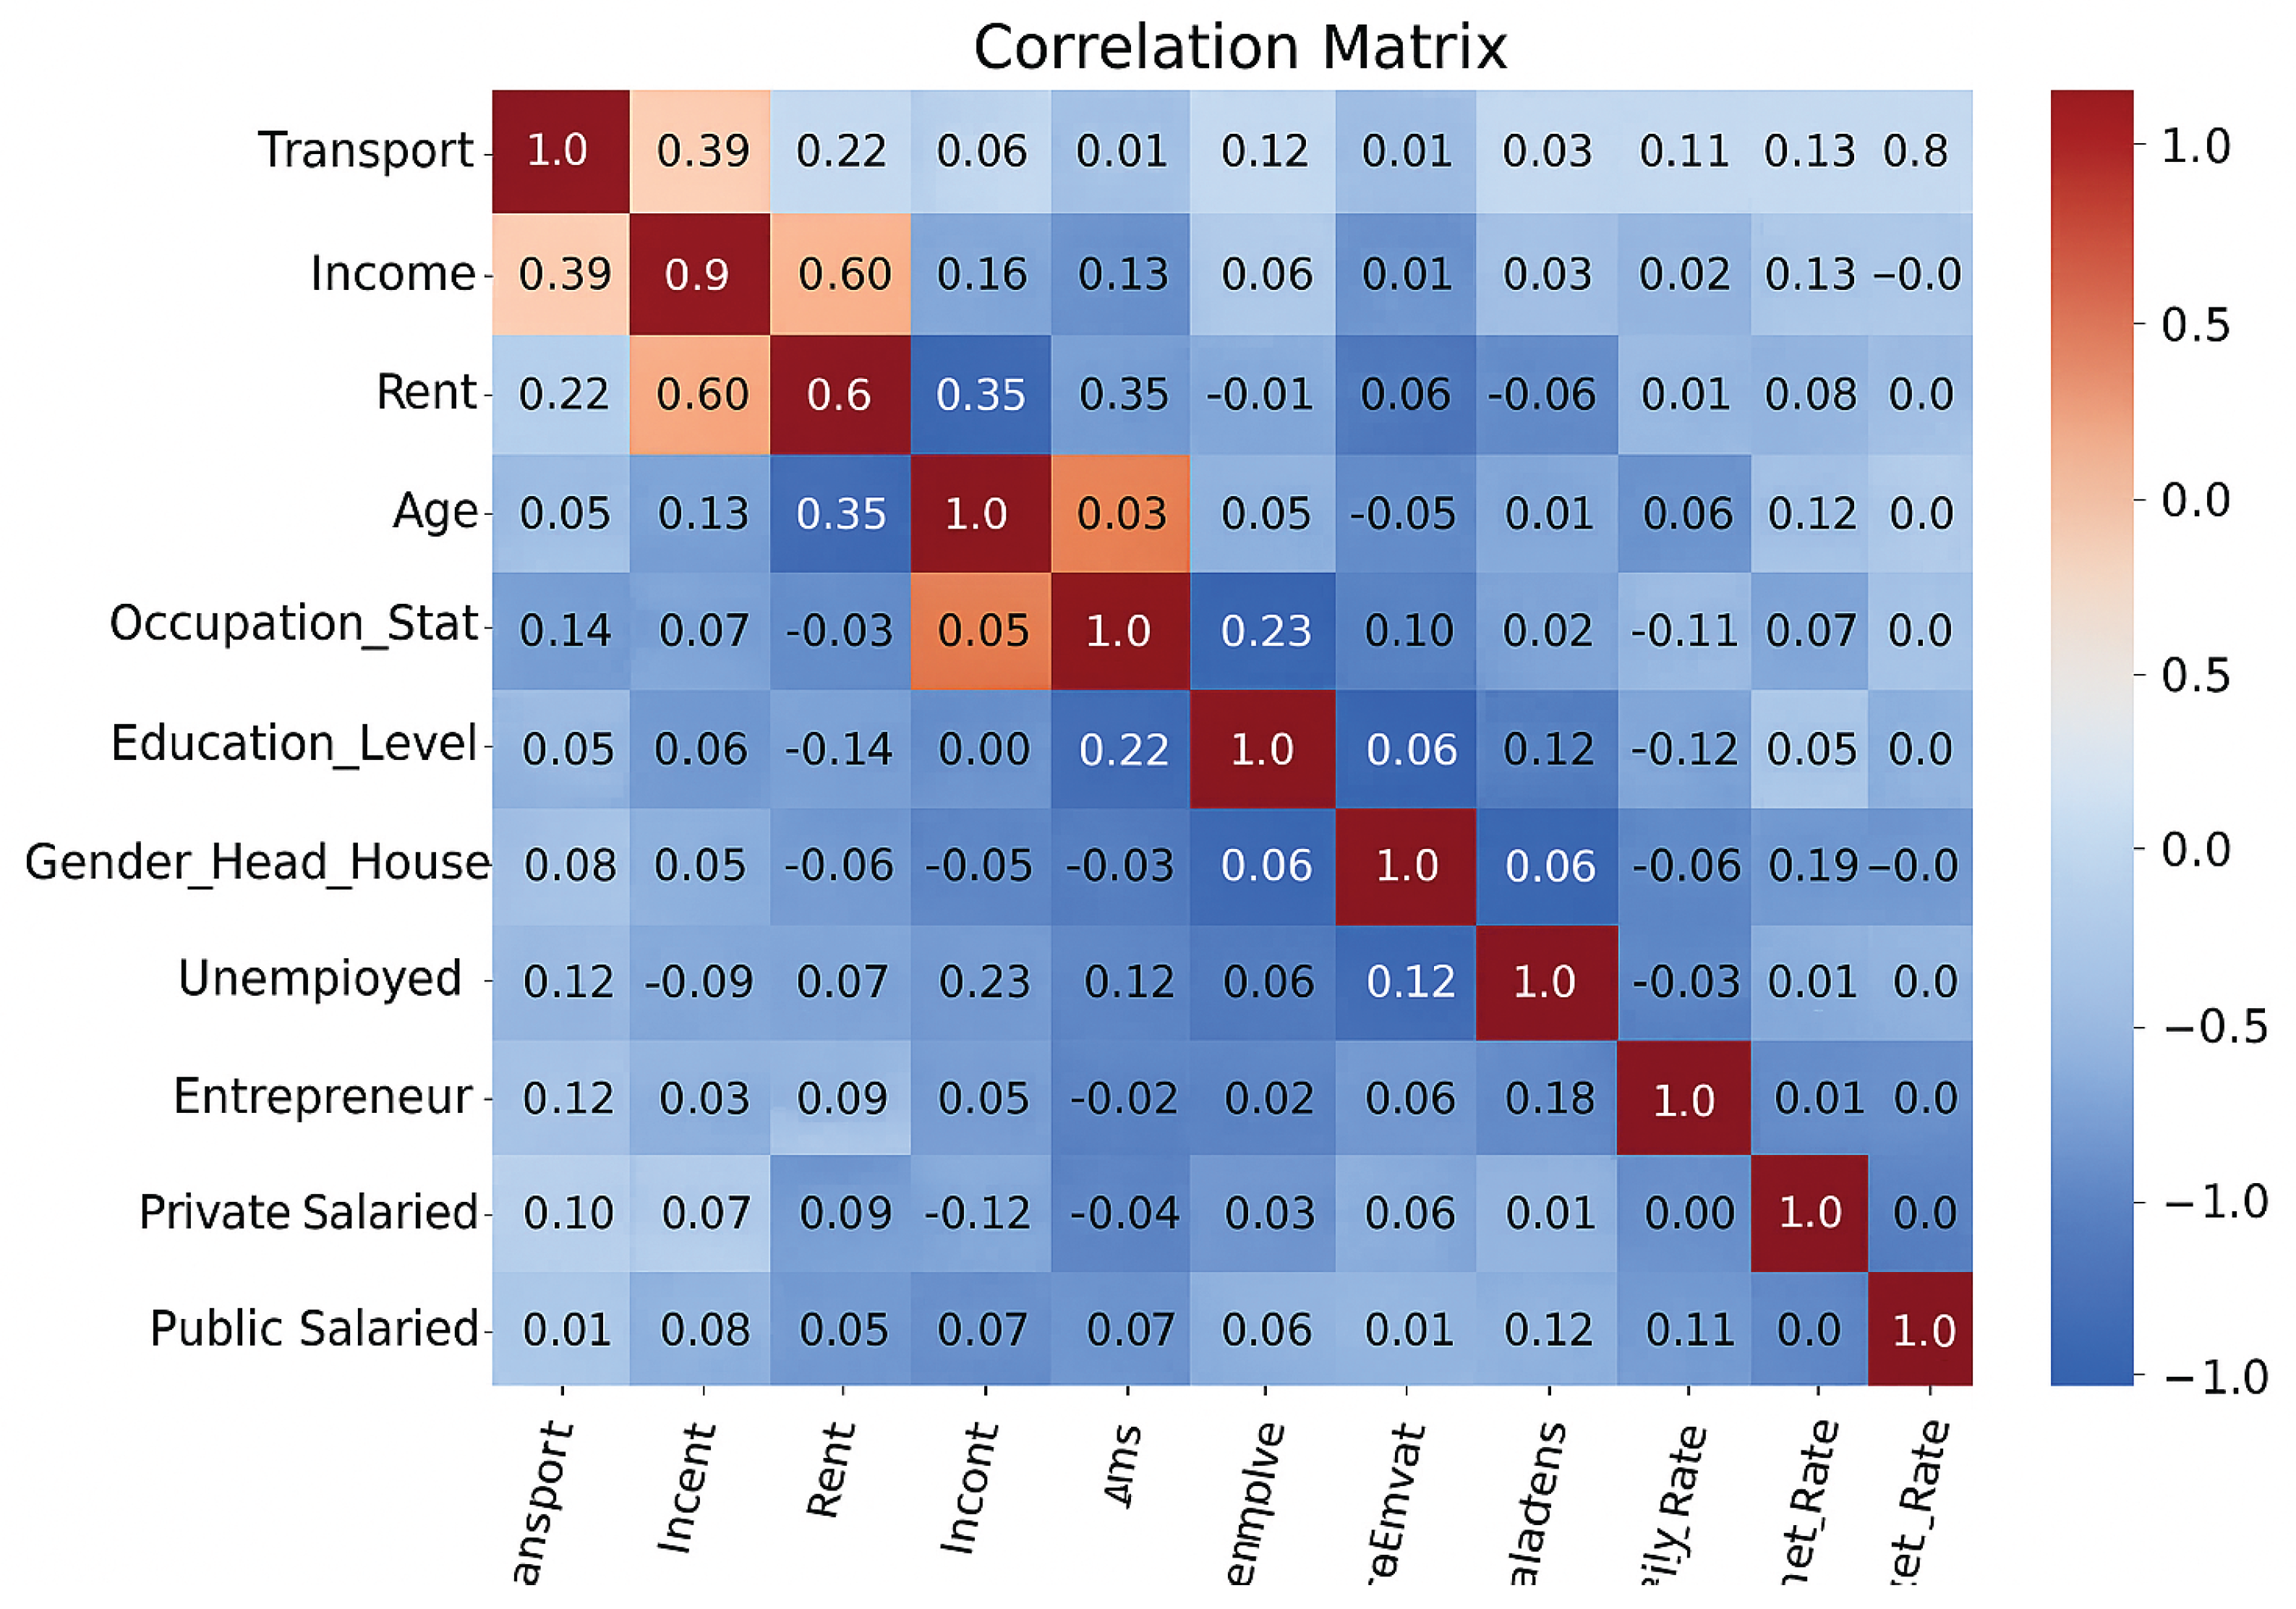
Overall, the moderate and strong correlations among key variables (income, rent, transport) suggest that the data are structured and suitable for machine learning modeling, as they capture meaningful relationships that can be leveraged to predict mobility-related vulnerability.
3.3. Principal Component Analysis (PCA) and Clustering for Household Classification in Bukavu
The Principal Component Analysis (PCA) and clustering classification (Figure 4 and Table 2and reveal contrasting socio-economic realities among households in Bukavu, characterized by deep inequalities and infrastructure challenges. The first principal component (PCA1) explains 99.62% of the variance, capturing most of the information, mainly related to economic variables such as income, rent, and transport expenditures. This high concentration of variance in PCA1 highlights the importance of budget constraints in mobility-related vulnerability in Bukavu.
The identified clusters illustrate this stratification:
- Cluster 0 (282 households) groups the most vulnerable households, with a high budget effort rate (27.49%) and low income (USD 199.51). These households, often dependent on public transport or motorcycle taxis, face major economic difficulties.
- Cluster 1 (29 households) represents affluent households, with a very low budget effort rate (4.86%) and high income (USD 1,500), enjoying more flexible mobility and better living conditions.
- Cluster 2 (74 households) embodies an intermediate class, with moderate economic characteristics, reflecting a reality often neglected in studies on African cities.
The variance explained by each component underscores that budget and income variables are the primary drivers of household vulnerability, validating the use of PCA for dimensionality reduction and subsequent clustering in this context.
3.4. Comparative Analysis of the Three Machine Learning Models
The performance of the three machine learning models used to predict household vulnerability in Bukavu is summarized in Table 3. The models were tuned using cross-validation on the training data to optimize performance while avoiding overfitting.
For logistic regression, the regularization parameter C was adjusted to control the penalization of large coefficients, ensuring a good bias-variance trade-off. In the SVM model, the main parameters are C (regularization) and the kernel type, Radial Basis Function (RBF), as the data are not linearly separable. The RBF kernel projects the data into a higher-dimensional space where non-linear separation becomes possible. Finally, in the Random Forest model, the number of trees (B), the maximum depth, and the number of variables considered at each split were tuned to maximize accuracy while maintaining prediction stability.
4. Model Evaluation
4.1. Confusion Matrices; ROC curve and Precision-Recall curve
As shown in Figure 5, Confusion matrices for the three models show overall high performance, with notable differences. For Logistic Regression, the matrix indicates a high number of true positives (22) and true negatives (54), with only 1 false positive and 0 false negative. This confirms its perfect recall (1.00) and high precision (0.96), meaning that it correctly identifies all vulnerable households without missing any, while minimizing classification errors. The SVM shows similar results, with 21 true positives, 54 true negatives, 1 false positive, and 1 false negative. Like Logistic Regression, it has a perfect recall (1.00) and high precision (0.96), making it an equally effective model for distinguishing vulnerable households from non-vulnerable ones. In contrast, the Random Forest, although very precise (55 true negatives and 0 false positives), shows a slight imbalance with 2 false negatives and 20 true positives. This reflects its lower recall (0.90), meaning that it may fail to identify some vulnerable households while incorrectly identifying others as vulnerable ones. This limitation could be problematic in a context like Bukavu, where the identification of all vulnerable households is essential. This demonstrates the strong discriminative power of Logistic Regression and SVM in detecting vulnerability.
Figure 6 further supports these findings, illustrating that Logistic Regression and SVM achieve nearly perfect AUC values (0.999 and 1.00, respectively), reflecting excellent class separation. Although the Random Forest also performs well (AUC = 0.997), its slightly lower score aligns with the patterns observed in the confusion matrices, confirming its relatively weaker sensitivity and Figure 6 Curves illustrate both Logistic Regression and SVM maintain high precision and recall simultaneously, which is crucial for identifying vulnerable households. Random Forest shows slightly lower recall, highlighting potential under-classification.
4.2. Learning Curves
Figure 7 shows the learning curves. Logistic Regression and SVM display balanced curves with minimal overfitting, while Random Forest exhibits slight overfitting indicated by the gap between training and validation scores. These curves confirm the robustness and generalizability of the models, with Logistic Regression and SVM being particularly suitable for the Bukavu dataset.
4.3. Cross-Validation Results
As shown in Table 4, Logistic Regression achieves the highest mean accuracy (96.36%) with a low standard deviation (3.97%), indicating excellent stability and generalization. Random Forest also performs well (94.55%) but exhibits slightly higher variability (7.27%). SVM presents a slightly lower mean accuracy (92.47%) with comparable variability (6.54%). Overall, Logistic Regression is the most reliable and accurate model for predicting household vulnerability in Bukavu.
The Table 5presents the variable coefficients for Logistic Regression and SVM, as well as variable importance scores from the Random Forest model in predicting householdvulnerability in Bukavu. Logistic Regression results indicate that Transport Expenditure (coefficient = 2.347926) and Household Income (coefficient = –5.478468) are the most influential predictors of vulnerability. This suggests that households spending more on transport or earning lower incomes are the most vulnerable.
The SVM confirms these trends with similar coefficient patterns, while the Random Forest model assigns moderate importance to the same variables (0.175443 for transport expenditure and 0.314423 for income). Other factors, such as the Age of the Household Head and Housing Occupation Status, also play significant roles, reflecting the complex socio- economic dynamics in Bukavu, where households headed by older individuals or those with stable housing (owners or those living in family or official housing) tend to be less vulnerable.
Logistic Regression provides a direct interpretation of the direction and magnitude of each variable’s impact, while the SVM, although comparable in performance, is less inter- pretable in non-linear contexts. The Random Forest model, on the other hand, highlights variable importance based on impurity reduction but does not indicate the direction of the impacts.
5. Discussion
5.1. Structural Vulnerability and Financial Burden of Urban Mobility in Bukavu
This study reveals systemic vulnerability among Bukavu households related to transportation expenses, with an average budget share of 23.02%, frequently exceeding 40% for the most precarious households. These findings align with global trends, where low-income urban populations in developing countries devote a disproportionate share of their resources to mobility, compromising access to essential needs [34,35].
A meta-analysis of 15 African cities [36]showed that poor households spend on average 18–35% of their income on transport, confirming that Bukavu is not an isolated case but a striking example of a structural phenomenon. This situation reflects what Hauslbauer et al. [37] term “mobility poverty”: a restriction of socio-economic opportunities due to spatial and financial inaccessibility of transport networks. Furthermore, climate-related disruptions, such as recurrent flooding, amplify this vulnerability by reducing access to formal transport systems [13,38], a mechanism also observed in Lagos and Nairobi[39].
5.2. Socio-Economic Segmentation and Cluster Analysis: Towards a Typology of Vulnerability
Cluster analysis identified three distinct vulnerability profiles, reflecting deep socio-economic stratification. Cluster 0, comprising approximately 73% of households, is characterized by low average income (USD 199.51) and a high budget share devoted to mobility (27.49%), indicating pronounced economic vulnerability.
Cluster 1, in contrast, includes relatively affluent households, owning private vehicles and residing in better-served areas, illustrating spatial and accessibility inequalities typical of African cities [40].
Cluster 2 (about 19.5% of households) represents an urban middle class, with a moderate average income (USD 660.54) and more controlled transportation expenses. Although less exposed than Cluster 0, these households remain sensitive to economic shocks, such as fuel price increases or climate-related disruptions. These observations align with Oviedo et al. [41] on the “invisible vulnerabilities” of urban middle classes, whose resilience is weakened by the absence of formal social safety nets.
5.3. Methodological Contribution: Superiority of Machine Learning Models for Contextual Analysis
The exceptional performance of the machine learning models (accuracy 0.96–1.00, AUC-ROC 0.997–1.00) demonstrates their relevance for studying vulnerability in data-scarce contexts.
Logistic regression, with a perfect recall (1.00), exceeds expectations, especially compared to previous studies using similar methods. For instance, Li et al. (2021) achieved 0.89 accuracy with Random Forests to predict urban poverty in Mexico, while Bernard & Bissonnette [42] reported an AUC-ROC of 0.92 for SVM applied to food vulnerability in Indonesia. This superiority is explained by the models’ ability to capture nonlinear interactions between variables, such as the combined effect of income, geographic location, and household size.
For example, the importance of the variables “access to transport” and “vehicle ownership” ( = 2.35 to −5.48) confirms theories of spatial justice [43], where geographic exclusion reinforces economic inequalities. These results validate the approach advocated by Mullainathan & Spiess [44], who argue for the integration of machine learning in social sciences to model complex realities.
5.4. Determinant Factors: Beyond Income, Intersectionality of Vulnerabilities
While income and transportation expenses emerge as primary predictors of vulnerability, multivariate analysis highlights the crucial role of often-understudied factors. Residential area (Ibanda, Kadutu, and Bagira) significantly influences risk, with coefficients up to 1.03, reflecting spatial apartheid inherited from colonial urbanization (Jenkins, 2013).
Similarly, the gender of the household head ( = 0.60) corroborates studies in Southeast Asian cities [45], where female-headed households face increased mobility restrictions due to socio-cultural norms. An original contribution of this research lies in identifying mobility rate as a key variable. Contrary to expectations, its moderate correlation with vulnerability (r = 0.39) suggests that it is not the frequency of trips, but their relative cost, that determines risk. This nuance aligns with Satterthwaite [46](2004) in Cape Town, where low-income households adopt “constrained mobility” strategies, limiting trips to preserve their budget.
5.5. Policy Implications
The findings of this study have significant implications for policymakers. First, it is essentiel to develop targeted interventions to reduce transport costs for the most vulnerable households. These could include subsidies for public transport, sustainable mobility programs, or initiatives to improve access to essential services. Second, public policies should aim to increase household incomes, for instance by supporting job creation or facilitating access to education and vocational training. Finally, the results highlight the need for more detailed data collection on household mobility and vulnerability, particularly in fragile urban contexts like Bukavu. A better understanding of mobility practices, economic constraints, and territorial disparities would allow for more targeted interventions adapted to local needs. Such data are crucial for orianting transport and urban planning policies towards greater equity and efficiency.
5.6. Limitations and Perspectives
This study, though providing significant insights into household vulnerability based on mobility in Bukavu, has some limitations. First, the geographic specificity focused on a single city, limits generalization to other urban contexts, particularly in regions with different Socio-economic and infrastructural dynamics.
Additionally, the sample size (385 households) may not capture the full diversity of vulnerability situations in a medium-sized city like Bukavu. Moreover, the study mainly relies on cross-sectional data, which does not allow for analyzing long-term vulnerability dynamics or evaluating policy impacts. To address these gaps, future research could expand the geographic scope to include other cities in the DRC or other developing countries to compare vulnerability dynamics across urban contexts. Increasing the sample size and integrating longitudinal data would provide a better understanding of vulnerability evolution over time and allow the assessment of policy effectiveness.
Furthermore, including additional variables, such as social networks, household coping strategies, and climate change impacts, would enrich the analysis. These improvements would allow for better targeting of public policies and reduction of household vulnerability in fragile urban contexts.
6. Conclusions
This study examines household vulnerability related to urban mobility in Bukavu, Democratic Republic of Congo, using machine learning models. The results show that the most vulnerable households devote a disproportionate share of their income to transportation, compromising access to essential needs such as food, education, and healthcare. This situation reflects “mobility poverty,” where financial and infrastructural constraints limit socio-economic opportunities for low-income urban populations.
Cluster analysis identified three distinct vulnerability profiles, highlighting deep socio- economic stratification. The poorest households, representing 73% of the sample, are the most affected, with budget share rates sometimes reaching 50% of their income. In contrast, affluent and middle-class households benefit from better mobility conditions but remain sensitive to economic and climate-related shocks. These findings underscore the importance of considering spatial and economic inequalities in public policy design.
Machine learning models, particularly logistic regression, stood out for their accuracy and their ability to identify vulnerable households with perfect recall. These tools offer promising perspectives for policymakers by enabling more effective targeting of interventions aimed at reducing mobility-related vulnerability. However, the study acknowledges some limitations, including the geographic specificity of Bukavu, the limited sample size and the risk of overfitting due to extremely high model performance, which may affect generalizability. In conclusion, this research emphasizes the need to implement targeted public policies to reduce transportation costs, improve access to essential services, and increase the income of the most vulnerable households.
Public transport subsidies, sustainable mobility programs, and initiatives to strengthen the economic resilience of vulnerable households could help to mitigate observed inequalities. Finally, this study highlights the need for more detailed and longitudinal data collection to better understand vulnerability dynamics and assesse the effectiveness of public policies in fragile urban contexts.
Author Contributions
Conceptualization, A.T. and B.J.; methodology, A.T.; B.J. and D.S.; software, A.T. and D.S.; validation, A.T.; B.J. and D.S.; investigation, A.T. and D.T.; writing—original draft preparation, A.T.; B.J. and D.S.; writing—review and editing, A.T.; N.J. and D.S. ; supervision, B.J. All authors have read and agreed to the published version of the manuscript.
Funding
This research received no external funding.
Institutional Review Board Statement
The study was conducted in accordance with the ethical standards of Bukavu Teacher Training Collage, Bukavu, Democratic Republic of the Congo and local regulations. Formal ethical approval was not required due to the non-invasive and anonymous nature of the survey.
Informed Consent Statement
Informed consent was obtained from all participants prior to their inclusion in the survey. Participation was voluntary, and all responses were collected anonymously.
Data Availability Statement
The data used in this study were collected through household surveys in Bukavu, Democratic Republic of Congo. Due to privacy and ethical restrictions, the dataset is not publicly available but can be obtained from the corresponding author upon reasonable request.
Conflicts of Interest
The authors declare no conflict of interest.
References
- Cling, J.P.; Lagrée, S.; Razafindrakoto, M.; Roubaud, F., Eds. L’économie informelle dans les pays en développement; Number 6 in Conférences & Séminaires, Agence Française de Développement (AFD): Paris, France, 2012; p. 363. Sélection de communications présentées lors de la Conférence internationale sur l’économie informelle, Hanoï (Vietnam), mai 2010.
- Porter, G.; Abane, A.; Lucas, K. User diversity and mobility practices in Sub-Saharan African cities: Understanding the needs of vulnerable populations. The state of knowledge and research. SSATP Working Paper No. 108, Africa Transport Policy Program (SSATP), The World Bank 2020. Working Paper No. 108, Sub-Saharan Africa Transport Policy Program (SSATP).
- Dávila, J.D., Ed. Urban Mobility and Poverty: Lessons from Medellin and Soacha, Colombia; University College London & Facultad de Arquitectura, Universidad Nacional de Colombia, Medellín: London, UK, 2013; p. 214.
- Nicolas, J.P.; Vanco, F.; Verry, D. Mobilité quotidienne et vulnérabilité des ménages. Revue d’Économie Régionale et Urbaine, 1, 5–30.
- Kyprianou, I.; Serghides, D.; Carlucci, S. Urban vulnerability in the EMME region and sustainable development goals: A new conceptual framework. Sustainable Cities and Society, 80, 103763. [CrossRef]
- Santos, T.; Fernandes, V.A.; Cardoso, M.; da Silva, M. Resilience and Vulnerability of Urban Mobility Systems in Developing Countries: A Case Study of Rio De Janeiro’s Transportation Fare Policy. [CrossRef]
- mondiale, B. Urban Transport and Poverty in Sub-Saharan Africa: A Policy Brief. Technical report, Banque mondiale, 2015. Consulté le 15 octobre 2025.
- Reis, E.C.G.d.; Véras, M.P.B. Social inequalities, territories of vulnerability, and urban mobility. Cadernos Metrópole, 26, 537–560. [CrossRef]
- Phippard, T. Urban fractures: mobility, risk and the accidenté in Kikwit, Democratic Republic of Congo. Africa 2023, 93, 140–158. [CrossRef]
- Wilson Janssens, M.C. Spatial mobility and social becoming: The journeys of four Central African Students in Congo-Kinshasa. Geoforum, 116, 252–261. [CrossRef]
- Diop, D.; Timera, A.S. Diamniadio : naissance d’une nouvelle ville : enjeux et défis d’une gouvernance durable; Éditions L’Harmattan: Sénégal, 2018; p. 228. Publié le 29 mars 2018.
- Ansah, E.; Amoadu, M.; Obeng, P.; Sarfo, J.O. Climate change, urban vulnerabilities and adaptation in Africa: a scoping review. Climatic Change, 177. [CrossRef]
- Ngomba Yashele, K.; Nsombo Mosombo, B. Perception paysanne des impacts de la variabilité climatique autour de la station de l’INERA/Kipopo dans la province du Katanga en République Démocratique Congo. VertigO - la revue électronique en sciences de l’environnement 2017, 17. Publisher: Les éditions en environnements VertigO, Number: 17-3, . [CrossRef]
- Ndayiragije, R.; Alidou, S.; Ansoms, A., Eds. Conjonctures de l’Afrique centrale 2022; Vol. 98, Cahiers africains, L’Harmattan, 2022; p. 310. Sélection de textes en lien avec la situation politique, économique et sociale de l’année 2021 en Afrique centrale.
- Shamamba, D.B.; Ansoms, A.; Basengere, E.B.; Lebailly, P. L’agriculture familiale à l’épreuve de la concurrence foncière au Sud-Kivu. Conjonctures de l’Afrique centrale, Cahiers africains 2022, 97, 293–312. Étude de conjoncture / Cahiers africains.
- Muzalia, G.; Mukungilwa, B.; Bisimwa, S.; Hoffmann, K.; Nalunva, A.; Batumike, E.; Mapatano, J.; Dunia, O.; Cirhuza, E.; Muderhwa, V. Roadblocks ‘at the rhythm of the country’: Predation and beyond in South Kivu, Democratic Republic of Congo. Technical report, Governance in Conflict Network, 2021. Accessed: 2025-10-15.
- Munyaka, J.C.B.; Yadavalli, V.S.S. Using transportation problem in humanitarian supply chain to prepositioned facility locations: a case study in the Democratic Republic of the Congo. International Journal of System Assurance Engineering and Management, 12, 199–216. [CrossRef]
- Tristan, A. Sur le taux d’effort budgétaire et la vulnérabilité des ménages pour leur mobilité quotidienne : cas des ménages de la commune d’Ibanda dans la ville de Bukavu.
- Bucekuderhwa, C. Technology adoption in South Kivu province subsistence farming of DRC. Bukavu Journal of Economics and Social Sciences (BJESS), Numéro 3, 32–76.
- Büttner, B.; Wulfhorst, G.; Ji, C.; Crozet, Y.; Mercier, A.; Ovtracht, N. The Impact of Sharp Increases in Mobility Costs Analysed by Means of the Vulnerability Assessment. In Proceedings of the Proceedings of the 13th World Conference on Transport Research (WCTR), Rio de Janeiro, Brazil, 2013; pp. 1–15. Accessed: 2025-10-15.
- Diaz Olvera, L.; Plat, D.; Pochet, P. The puzzle of mobility and access to the city in Sub-Saharan Africa. Journal of Transport Geography, 32, 56–64. [CrossRef]
- Athey, S. The Impact of Machine Learning on Economics. In The Economics of Artificial Intelligence: An Agenda; University of Chicago Press, 2018; pp. 507–547.
- Ludwig, J.; Mullainathan, S.; Spiess, J. Machine-Learning Tests for Effects on Multiple Outcomes, [1707.01473 [stat]]. [CrossRef]
- Breiman, L. Random Forests. Machine Learning, 45, 5–32. [CrossRef]
- Omar, E.D.; Mat, H.; Abd Karim, A.Z.; Sanaudi, R.; Ibrahim, F.H.; Omar, M.A.; Ismail, M.Z.H.; Jayaraj, V.J.; Goh, B.L. Comparative Analysis of Logistic Regression, Gradient Boosted Trees, SVM, and Random Forest Algorithms for Prediction of Acute Kidney Injury Requiring Dialysis After Cardiac Surgery. International Journal of Nephrology and Renovascular Disease, 17, 197–204. Publisher: Dove Medical Press _eprint: https://www.tandfonline.com/doi/pdf/10.2147/IJNRD.S461028, . [CrossRef]
- Salazar, D.A.; Vélez, J.I.; Salazar, J.C. Comparison between SVM and Logistic Regression: Which One is Better to Discriminate? Revista Colombiana de Estadística.
- Kurakin, A.; Goodfellow, I.; Bengio, S. Adversarial Machine Learning at Scale, [1611.01236 [cs]]. [CrossRef]
- Jolliffe, I.T.; Cadima, J. Principal component analysis: a review and recent developments. Philosophical Transactions of the Royal Society A: Mathematical, Physical and Engineering Sciences, 374, 20150202. [CrossRef]
- MacQueen, J. Some Methods for Classification and Analysis of Multivariate Observations. In Proceedings of the Proceedings of the Fifth Berkeley Symposium on Mathematical Statistics and Probability. University of California Press, 1967, Vol. 1, pp. 281–297.
- Fagerland, M.W.; Hosmer, D.W. A Generalized Hosmer–Lemeshow Goodness-of-Fit Test for Multinomial Logistic Regression Models. The Stata Journal, 12, 447–453. Publisher: SAGE Publications, . [CrossRef]
- Fawcett, T. An introduction to ROC analysis. Pattern Recognition Letters, 27, 861–874. [CrossRef]
- Douglas, M..; Haikins. The Problem of Overfitting | Journal of Chemical Information and Modeling. J. Chem.inf. comput. sci/ 20224.
- Arlot, S. Cross-validation, [1703.03167 [math]]. [CrossRef]
- Cervero, R. Linking urban transport and land use in developing countries. Journal of Transport and Land Use, 6, 7–24. Publisher: Journal of Transport and Land Use.
- Hornby, T.G.; Henderson, C.E.; Plawecki, A.; Lucas, E.; Lotter, J.; Holthus, M.; Brazg, G.; Fahey, M.; Woodward, J.; Ardestani, M.; et al. Contributions of Stepping Intensity and Variability to Mobility in Individuals Poststroke. Stroke, 50, 2492–2499. Publisher: American Heart Association, . [CrossRef]
- Pavageau, C.; Locatelli, B.; Tiani, A.M.; Zida, M. Cartographier la vulnérabilité aux variations climatiques : une méta-analyse en Afrique. Technical report, Center for International Forestry Research (CIFOR), 2013.
- Hauslbauer, A.L.; Schade, J.; Petzoldt, T. The identification of mobility types on a national level. Transport Policy, 125, 289–298. [CrossRef]
- Alhassan, T.F.; Ansah, E.O.; Niyazbekova, S.U.; Blokhina, T.K. The impact of foreign investment in financing sustainable development in Sub-Saharan African countries. Russian Journal of Economics 2024, 10, 60–83. Publisher: Non-profit partnership "Voprosy Ekonomiki", . [CrossRef]
- Adelekan, I.O.; Asiyanbi, A.P. Flood risk perception in flood-affected communities in Lagos, Nigeria. Natural Hazards, 80, 445–469. [CrossRef]
- Nkoa, B.E.O.; Song, J.S. Urbanisation et inégalités en Afrique : une étude à partir des indices désagrégés. Revue d’Économie Régionale et Urbaine 2019, pp. 447–484. Publisher: Armand Colin, . [CrossRef]
- Oviedo, D.C.; Pinzón, M.S.; Rodríguez-Araña, S.; Tratner, A.E.; Pauli-Quirós, E.; Chavarría, C.; Posada Rodríguez, C.; Britton, G.B. Psychosocial response to the COVID-19 pandemic in Panama. Frontiers in Public Health, 10, 919818. [CrossRef]
- Bernard, S.; Bissonnette, J.F. Les politiques agricoles de l’Indonésie et de la Malaisie face aux impératifs de la sécurité alimentaire. VertigO : la revue électronique en sciences de l’environnement, 14. Publisher: Université du Québec à Montréal.
- Soja, E.W.; Dufaux, F.; Gervais-Lambony, P.; Buire, C.; Desbois, H. La justice spatiale et le droit à la ville : un entretien avec Edward Soja. Justice spatiale = Spatial Justice 2011. Publisher: Université Paris Ouest Nanterre La Défense, UMR LAVUE 7218, Laboratoire Mosaïques.
- Mullainathan, S.; Spiess, J. Machine Learning: An Applied Econometric Approach. Journal of Economic Perspectives, 31, 87–106. [CrossRef]
- Alam, A.; Khalil, M.B. Gender, (im)mobility and social relations shaping vulnerabilities in coastal Bangladesh. International Journal of Disaster Risk Reduction, 82, 103342. [CrossRef]
- Satterthwaite, D. The Under-estimation of Urban Poverty in Low and Middle-income Nations; IIED, 2004. Google Books ID: 7Gnnm_FTG_gC.
Figure 1.
Overview of data preprocessing, model development and evaluation using Python adapted from[25]
Figure 1.
Overview of data preprocessing, model development and evaluation using Python adapted from[25]
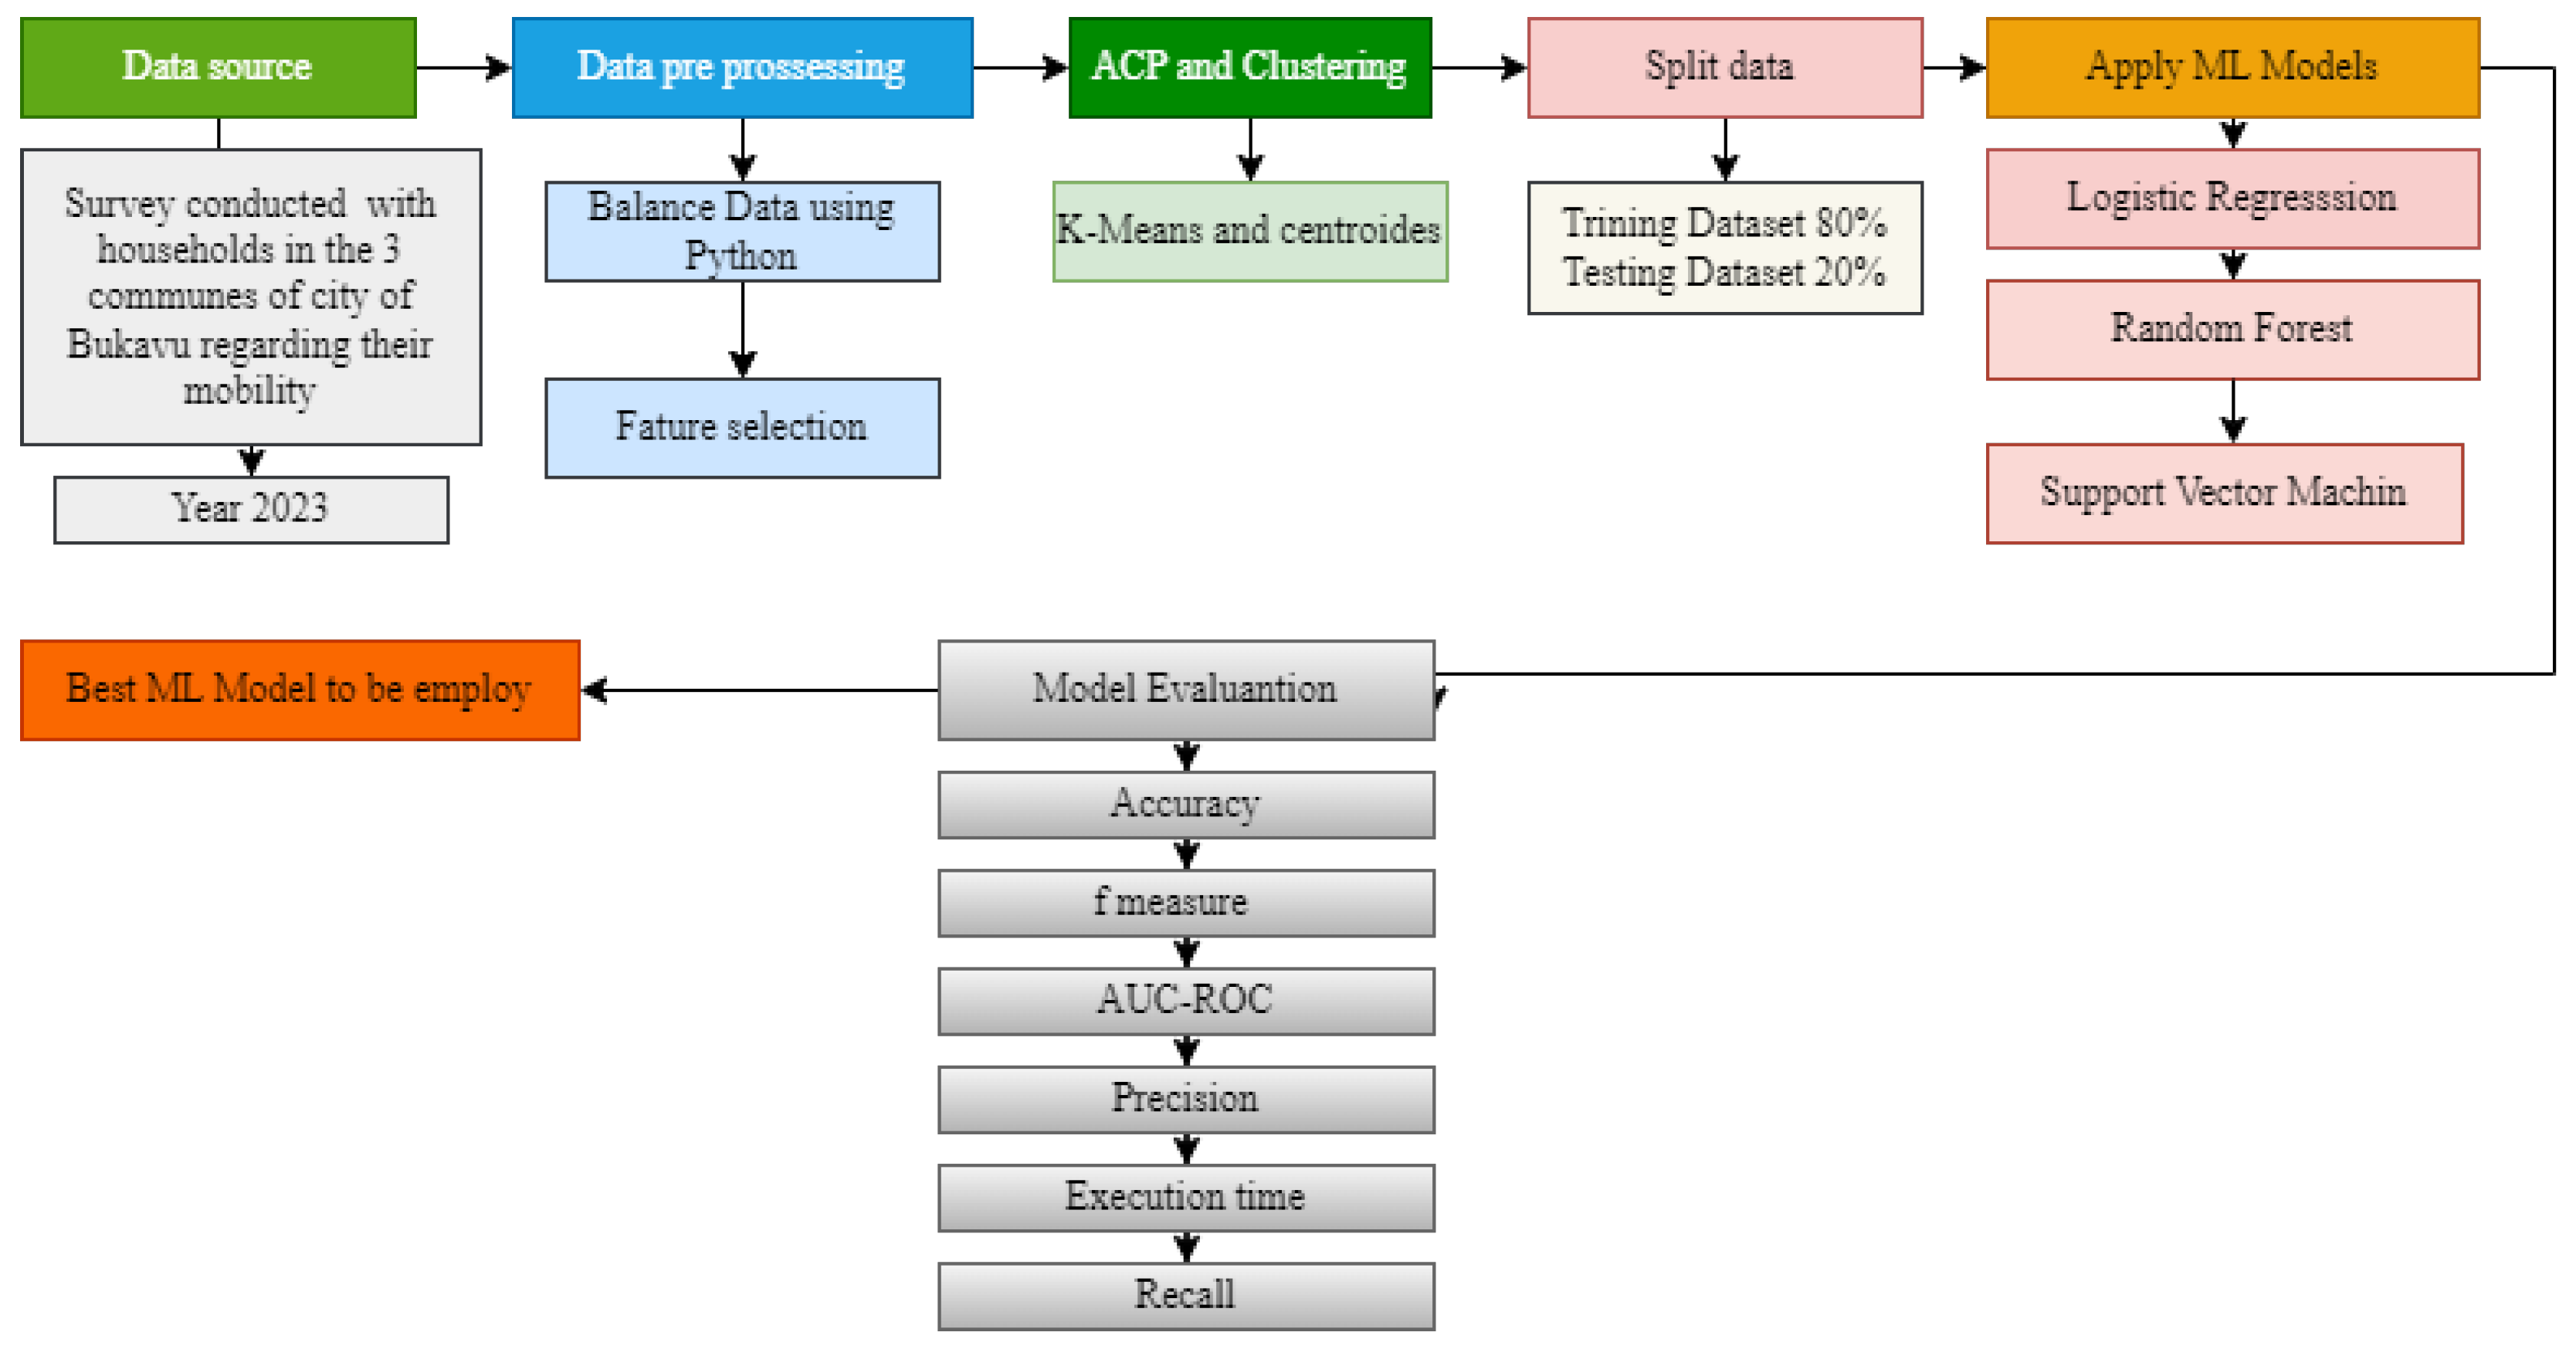
Figure 4.
PCA plot showing household distribution across the first two principal components and cluster assignment. Cluster 0 (blue) groups the most vulnerable households, Cluster 1 (green) represents affluent households, and Cluster 2 (orange) corresponds to the intermediate group.
Figure 4.
PCA plot showing household distribution across the first two principal components and cluster assignment. Cluster 0 (blue) groups the most vulnerable households, Cluster 1 (green) represents affluent households, and Cluster 2 (orange) corresponds to the intermediate group.
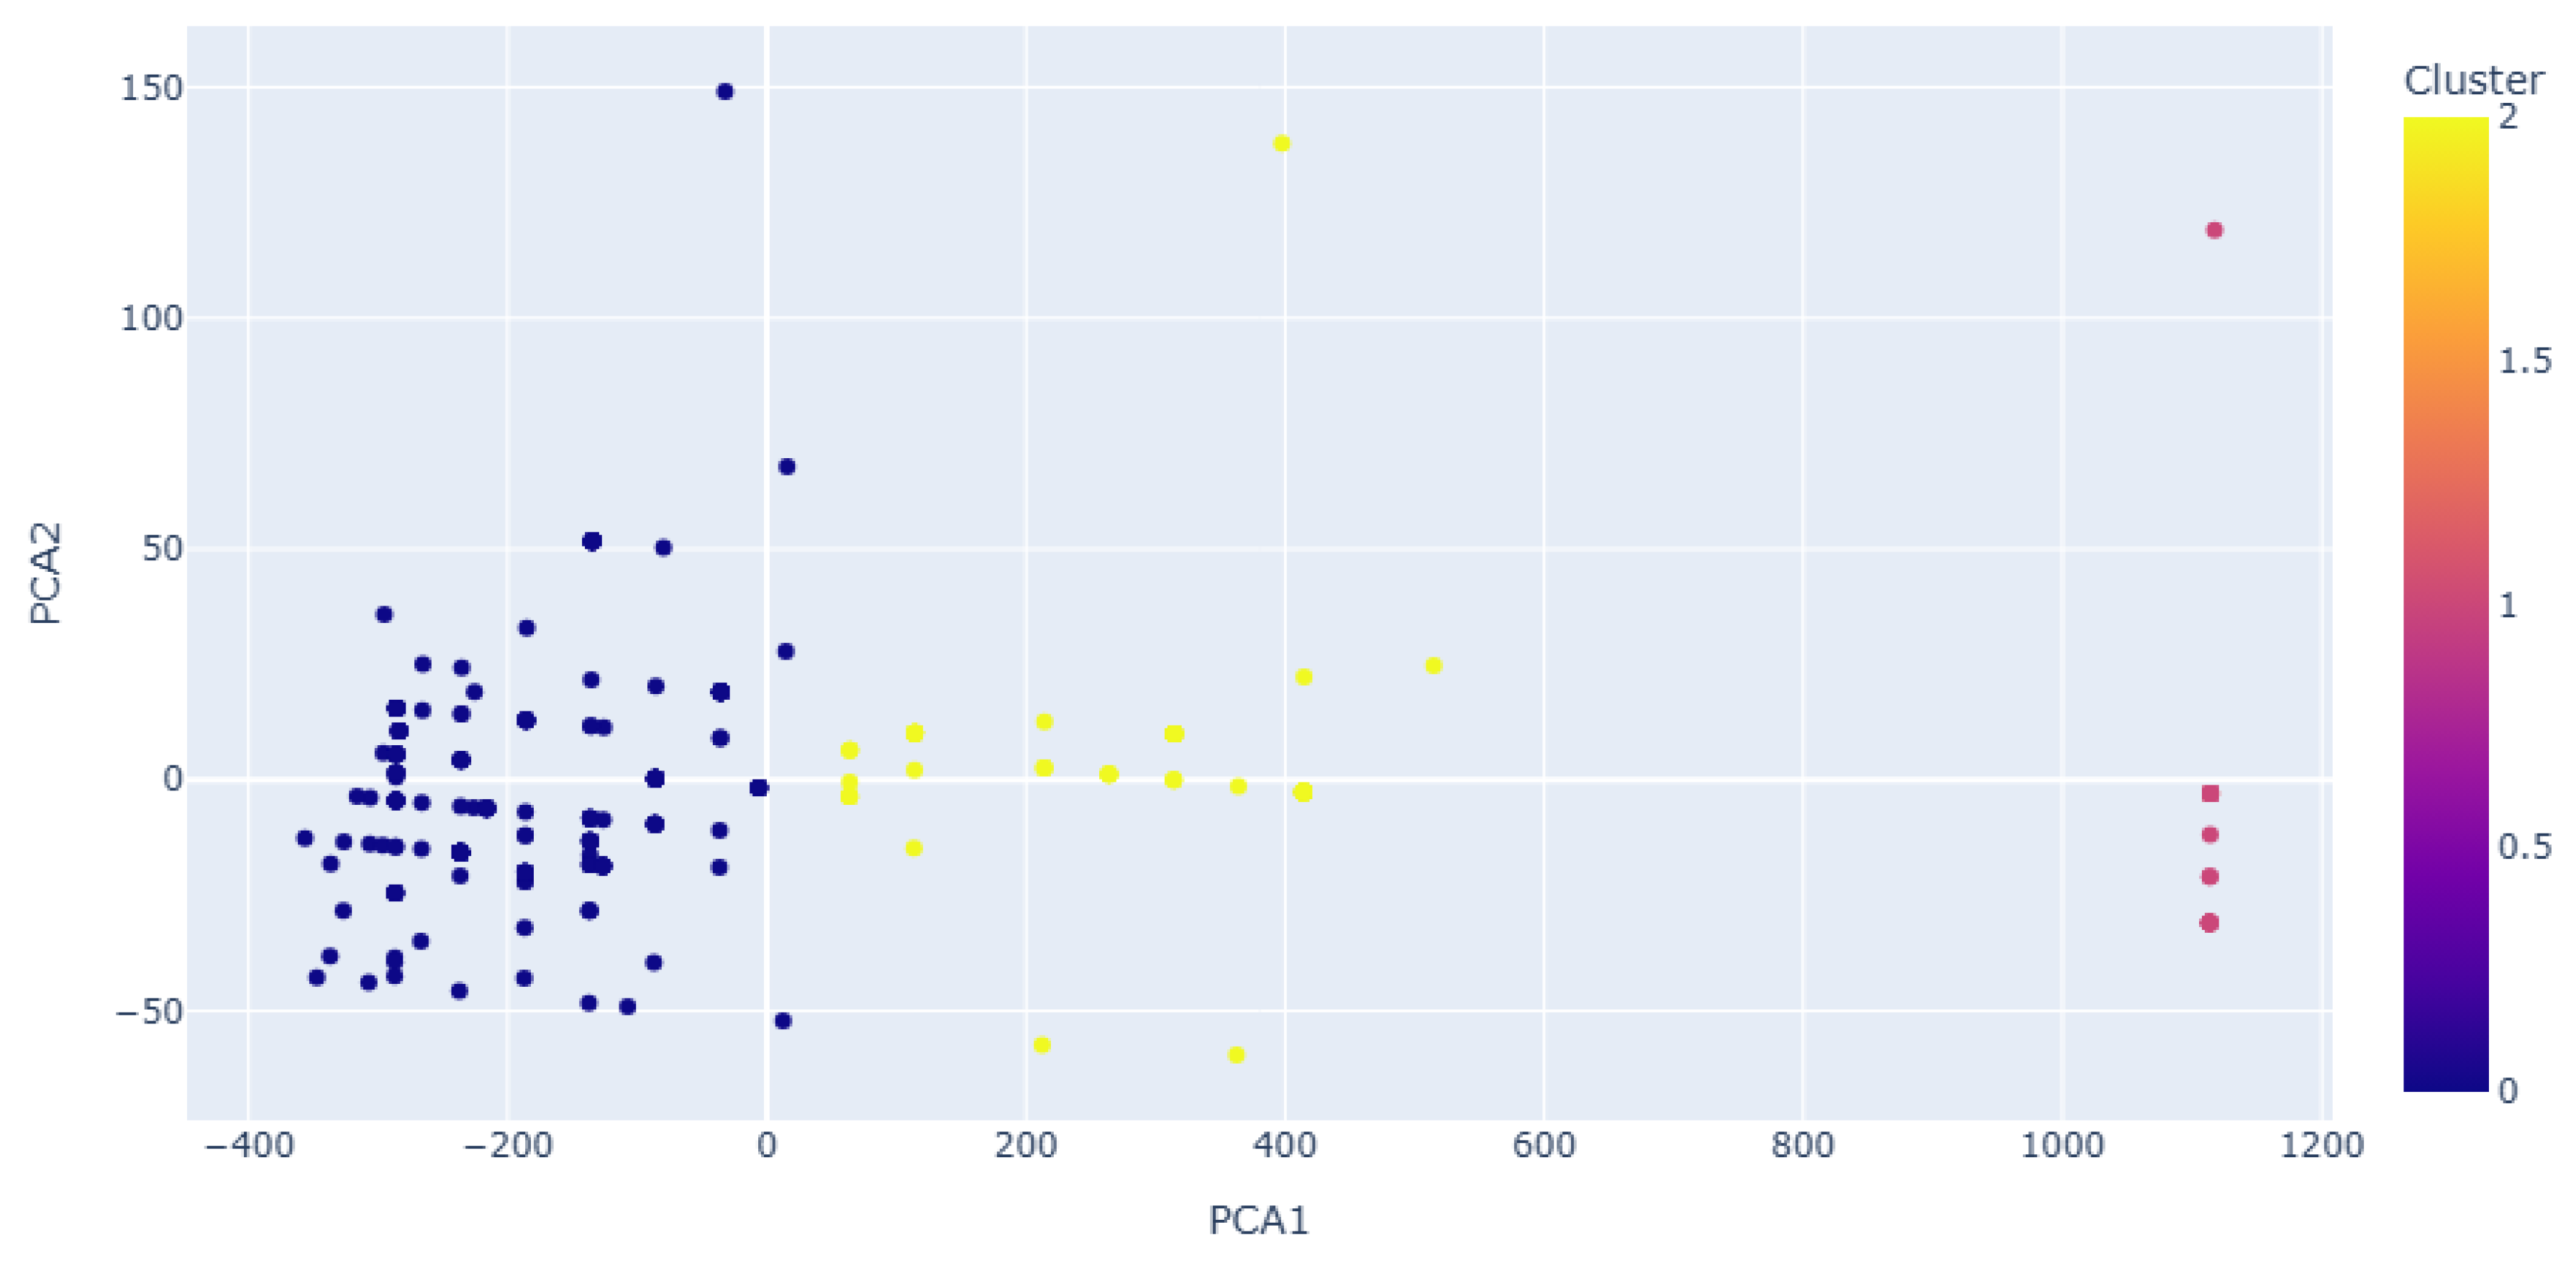
Figure 5.
Confusion matrices for the three machine learning models.
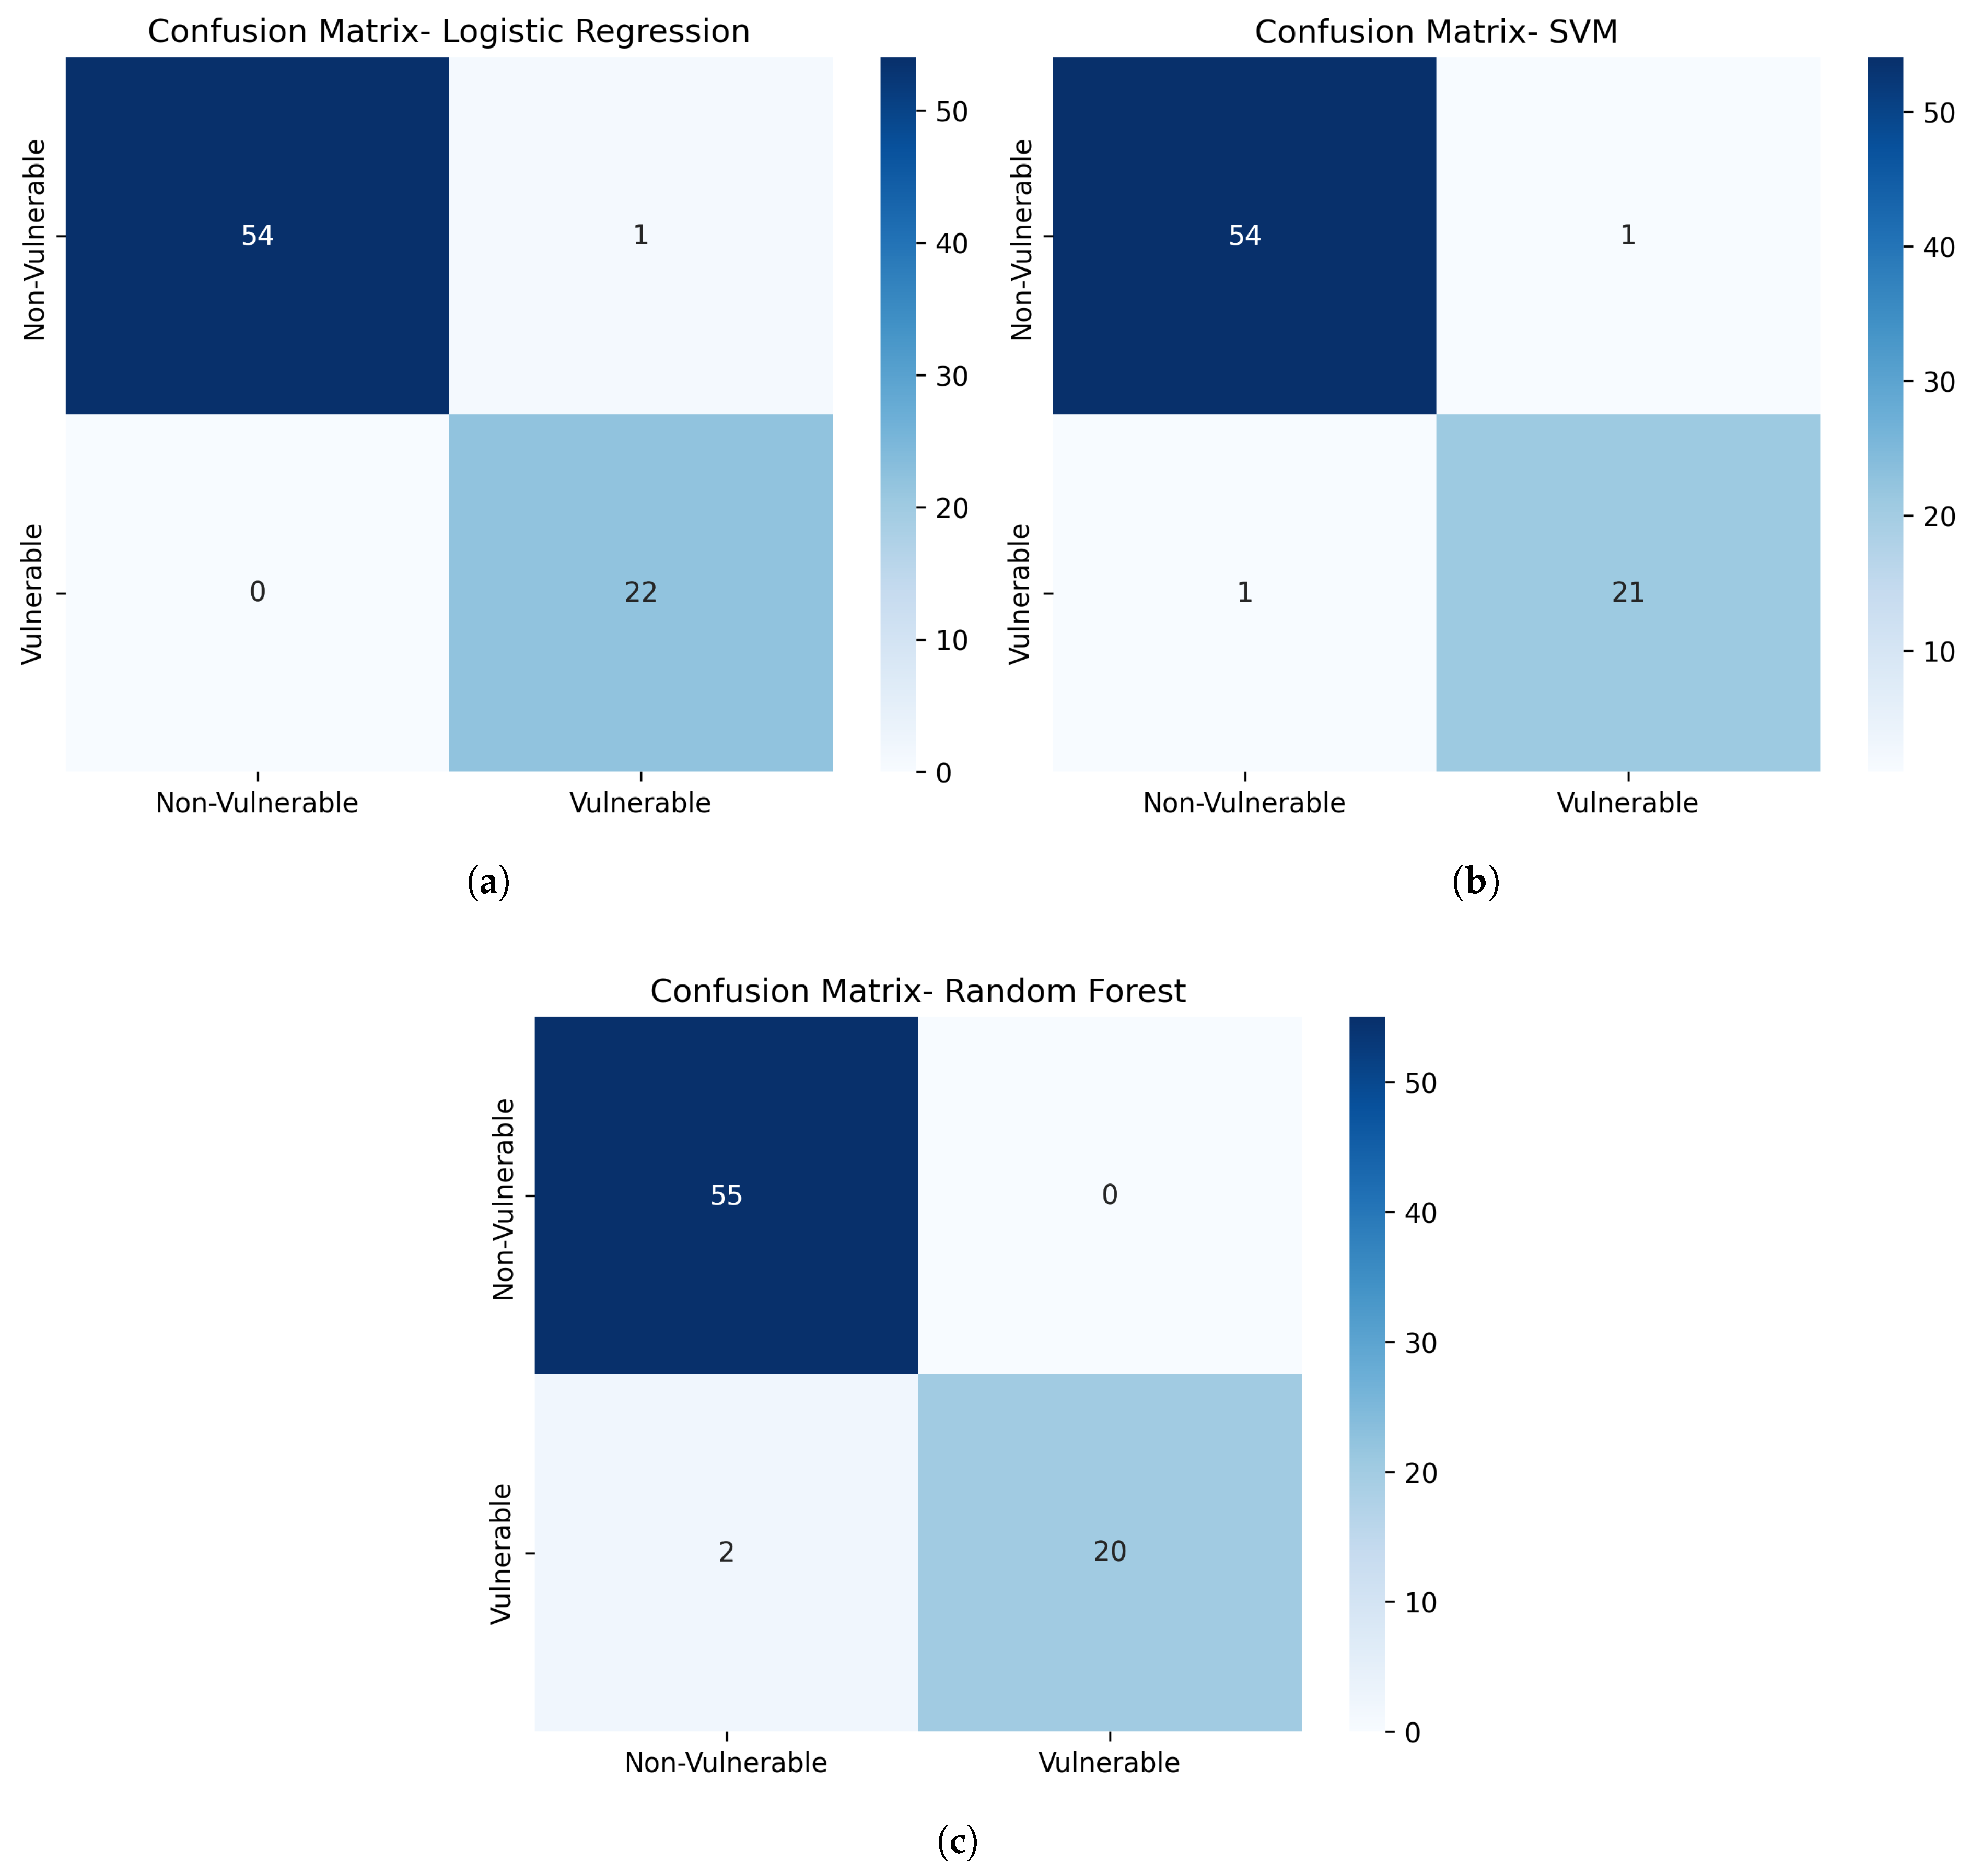
Figure 6.
ROC curves and Precision-Recall curves for Logistic Regression, SVM, and Random Forest.
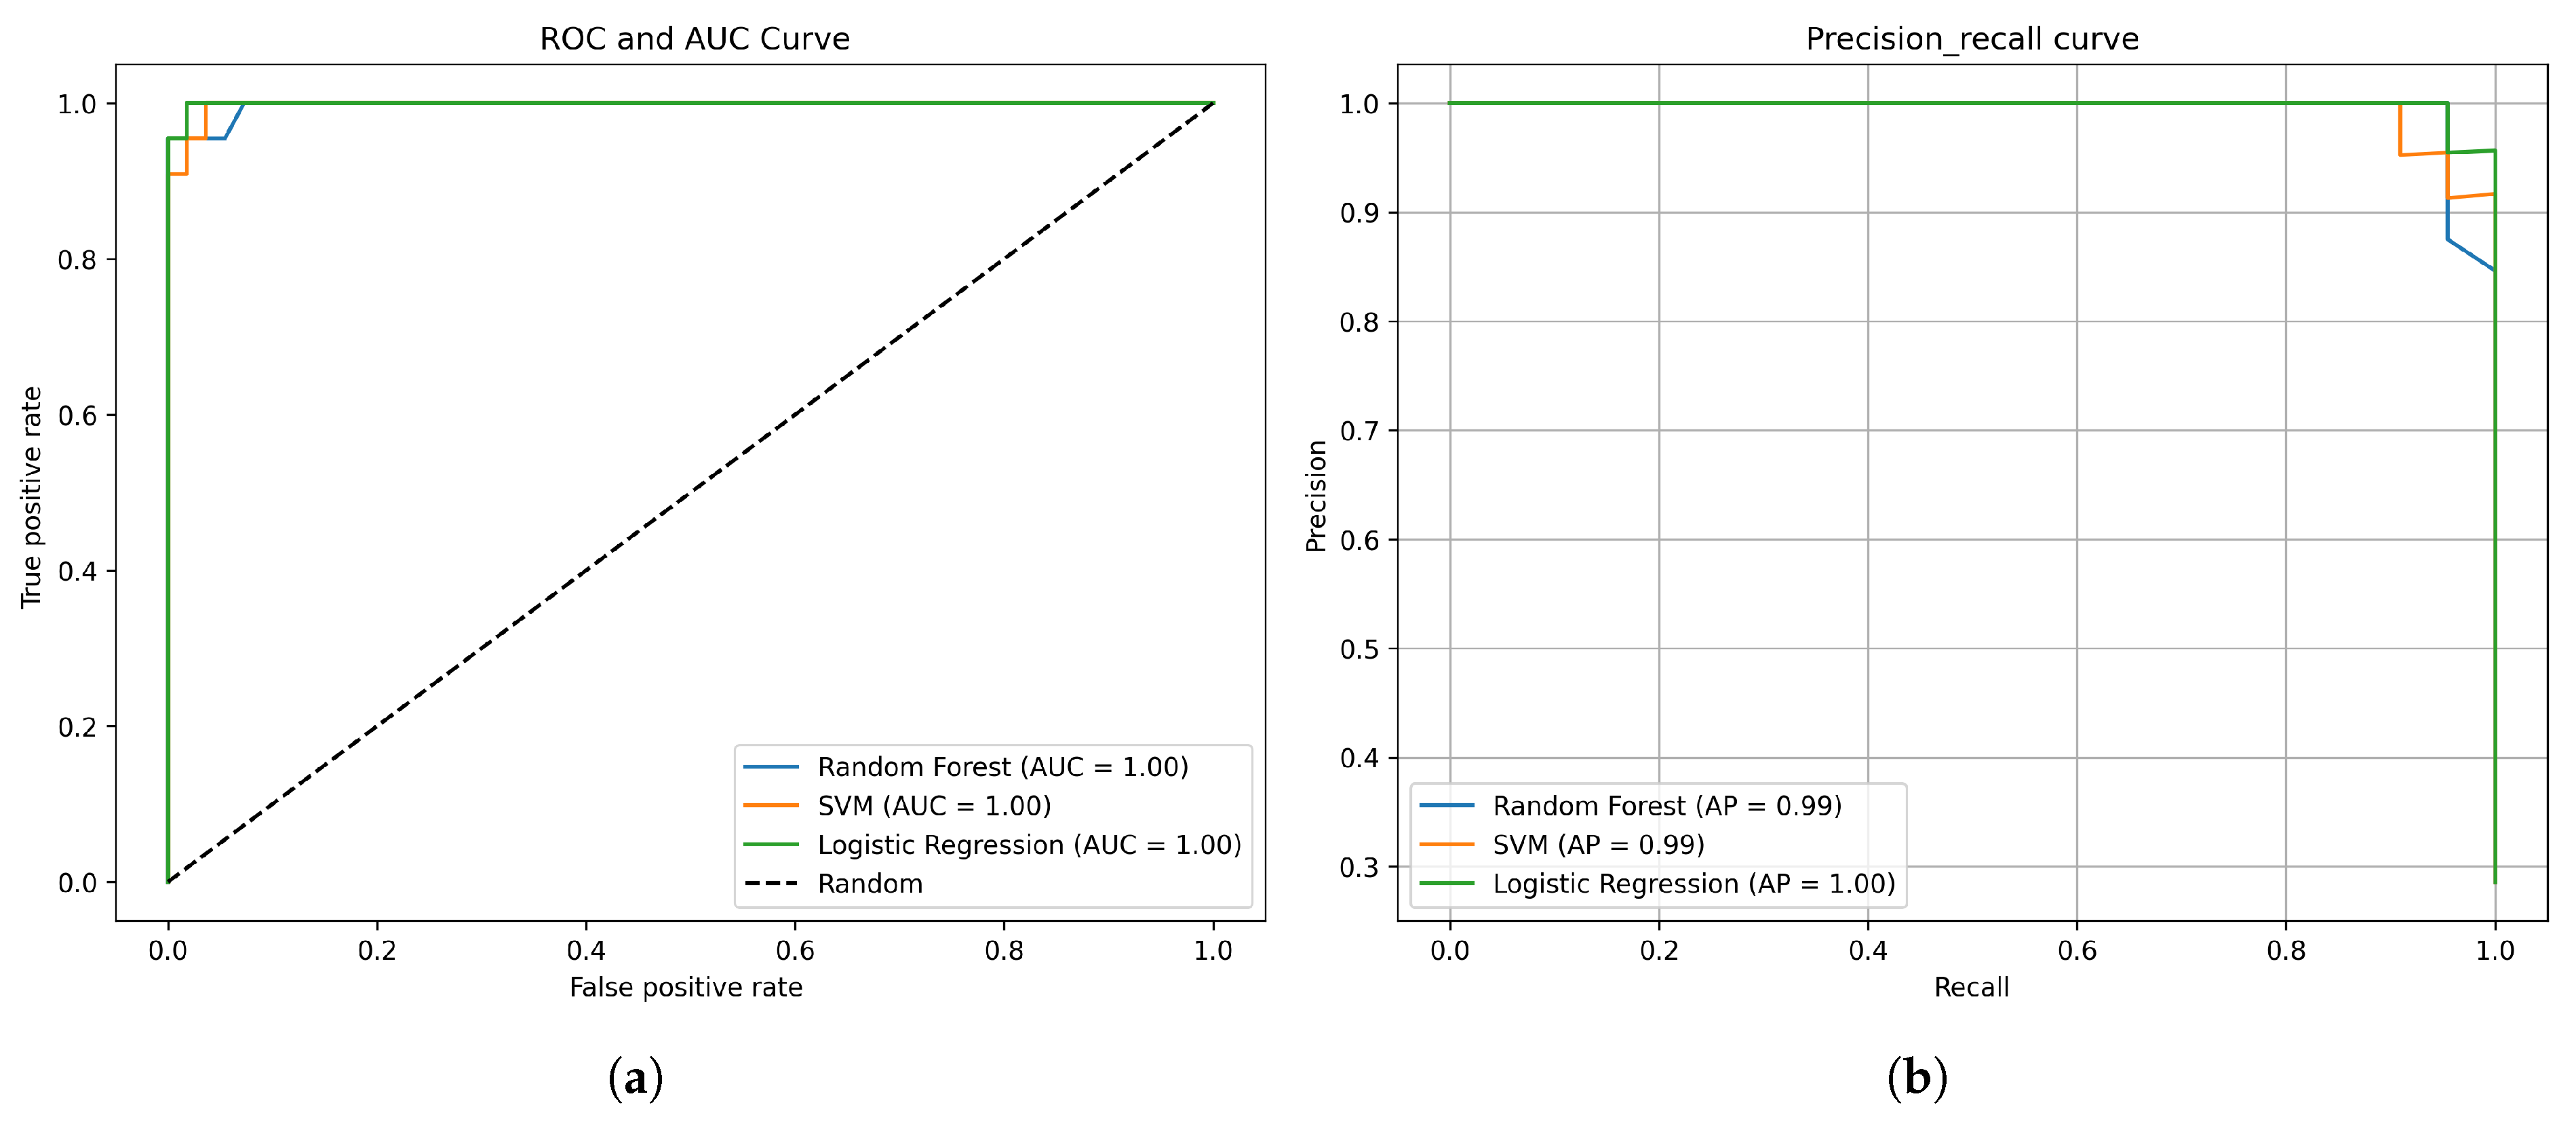
Figure 7.
Learning curves for the three models, showing training and validation performance.
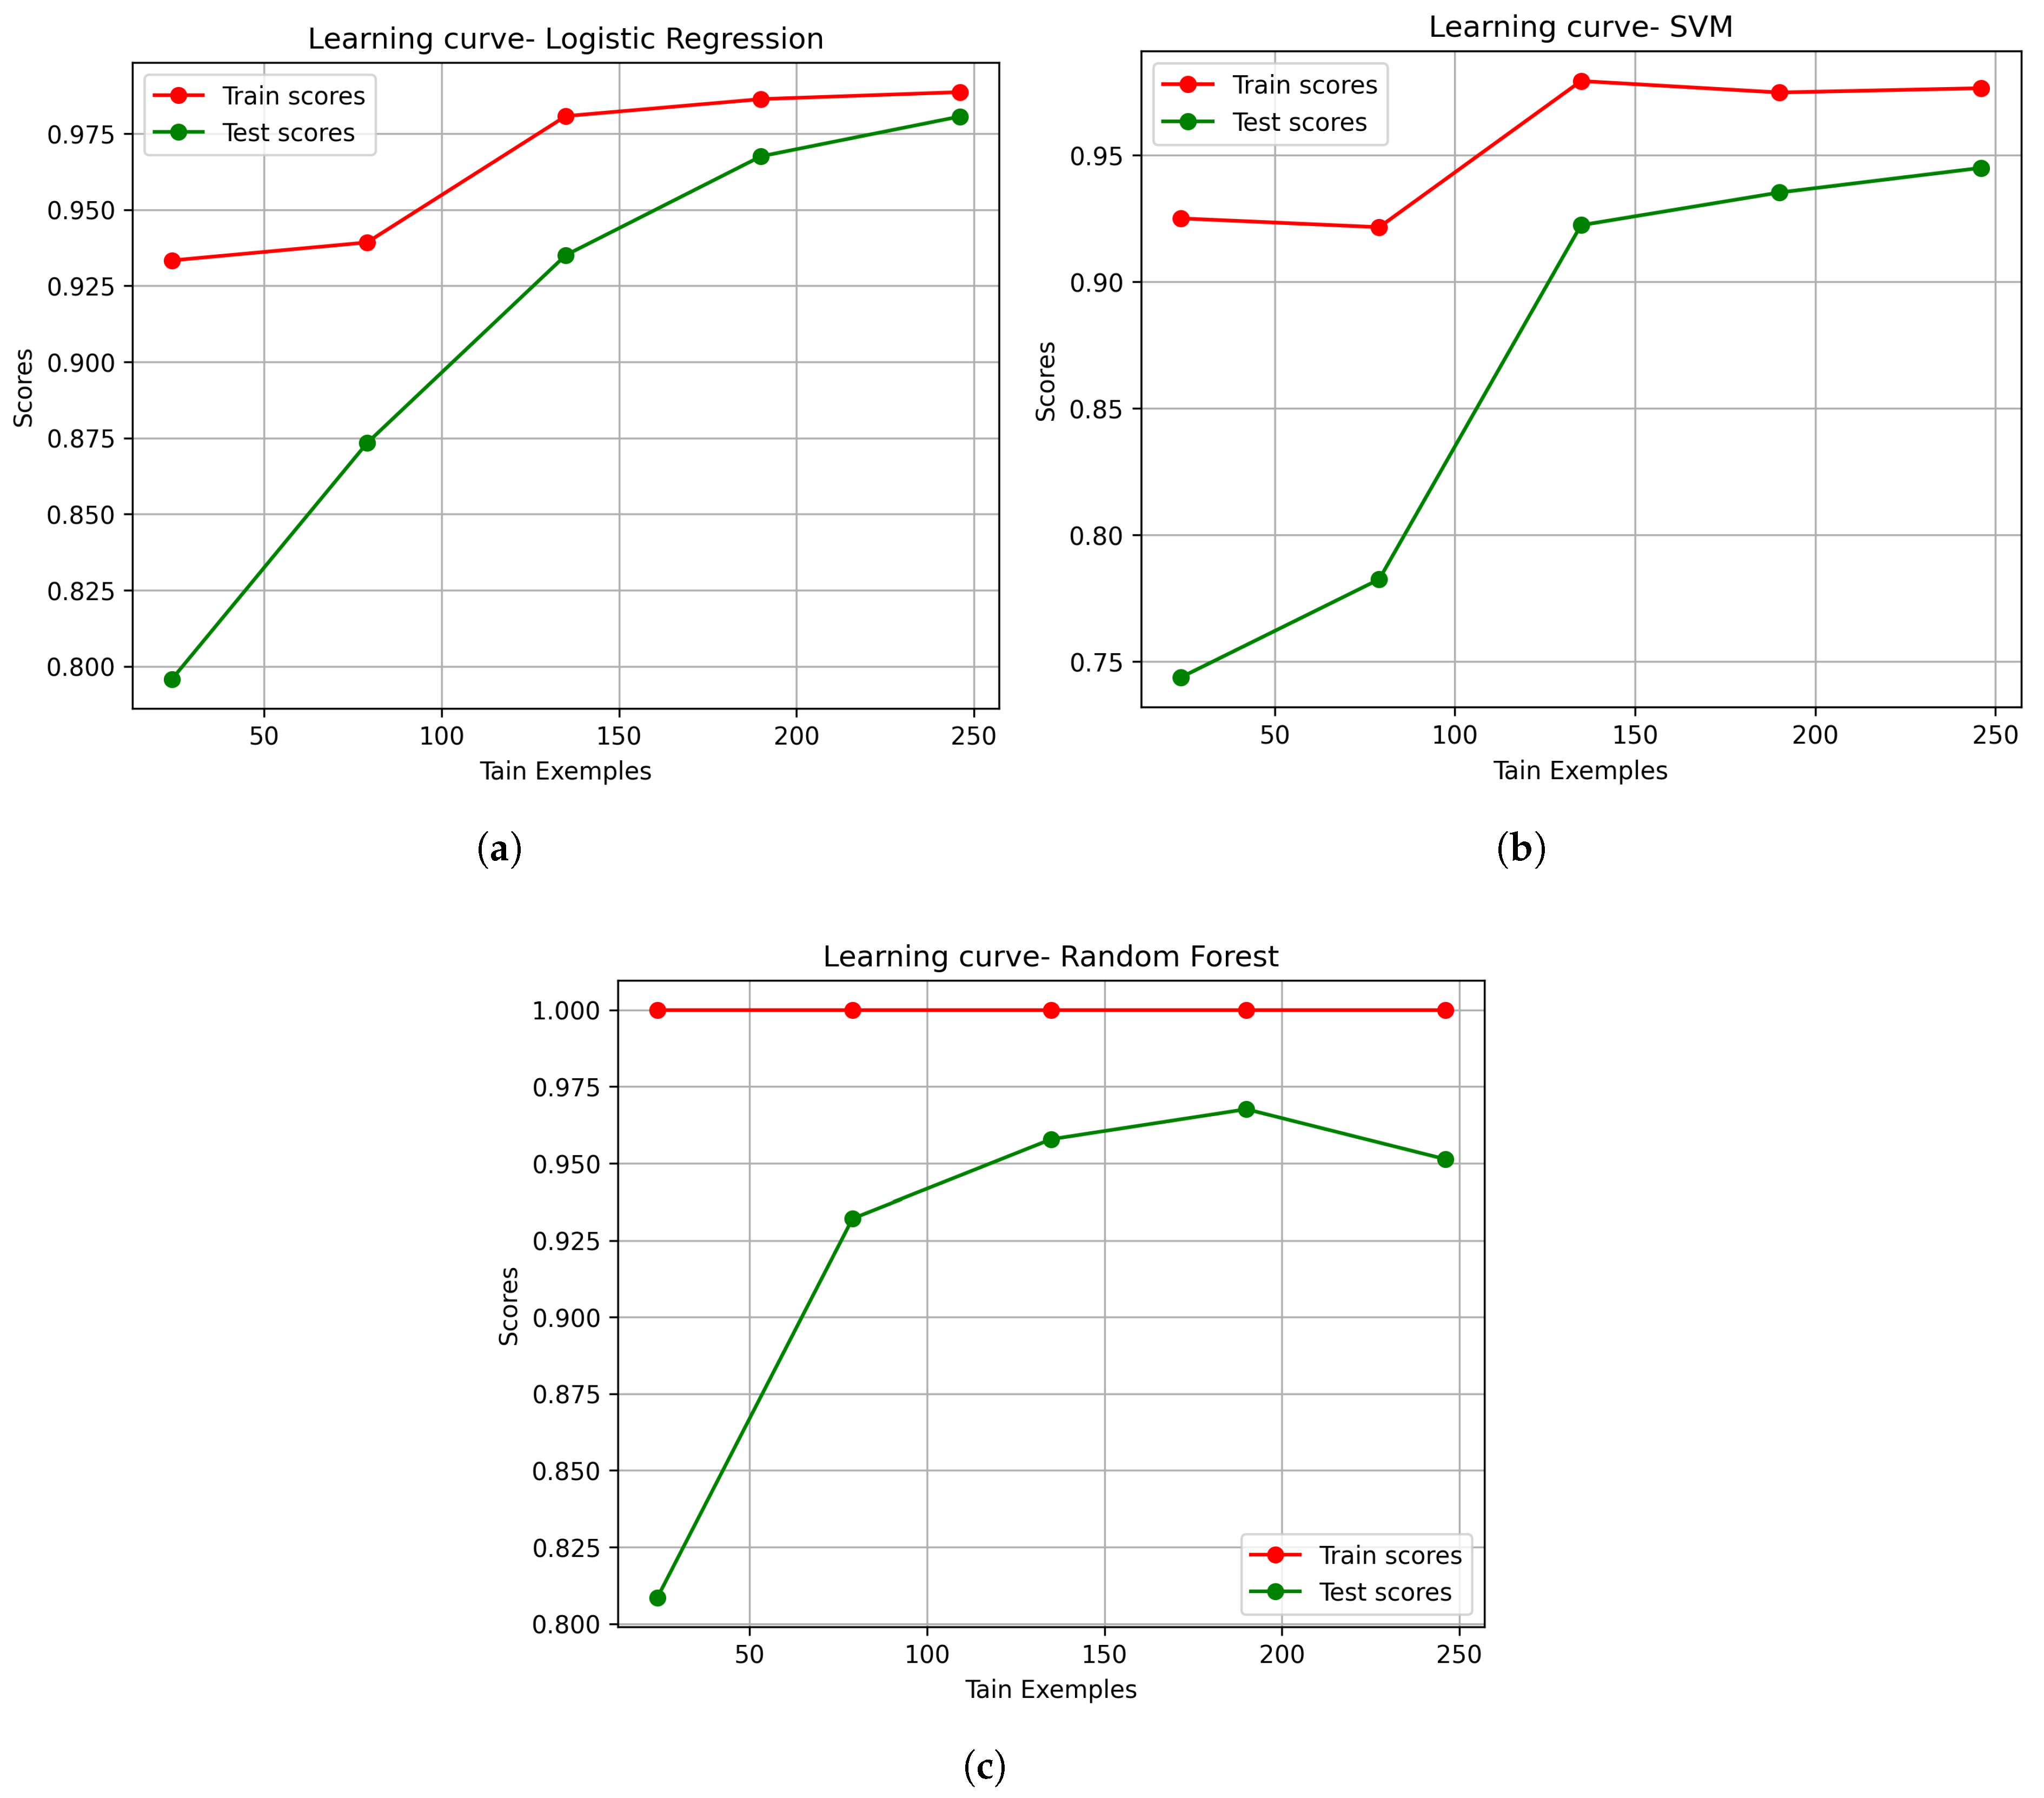

Table 1.
Descriptive statistics of the main variables in Bukavu households.
| Variable | Mean | Std. Dev. | Min | 25% | 50% | 75% | Max |
|---|---|---|---|---|---|---|---|
| Transport (USD) | 51.37 | 25.46 | 0.00 | 35.00 | 50.00 | 60.00 | 200.00 |
| Income (USD) | 402.08 | 371.83 | 30.00 | 150.00 | 260.00 | 500.00 | 1500.00 |
| Rent (USD) | 133.80 | 96.09 | 0.00 | 70.00 | 100.00 | 200.00 | 700.00 |
| Age (years) | 39.42 | 15.26 | 24.00 | 24.00 | 45.50 | 45.50 | 89.00 |
| Car Ownership | 0.436 | 1.28 | 0.00 | 0.00 | 0.00 | 0.00 | 4.00 |
| Mobility Rate | 11.42 | 8.56 | 0.00 | 7.00 | 8.00 | 14.00 | 47.00 |
| Budget Effort Rate | 23.02 | 12.27 | 0.00 | 10.00 | 16.67 | 23.52 | 50.00 |
Table 2.
Clustering results for Bukavu households. PCA1 explains 99.62% of variance, PCA2 0.37%.
| Cluster | Size | Budget Effort Rate ( %) | Avg. Income | Avg. Transport Expenses | Vehicles per Household |
|---|---|---|---|---|---|
| 0 | 282 | 27.49 | 199.51 | 46.70 | 0.66 |
| 1 | 29 | 4.86 | 1500.00 | 72.93 | 2.62 |
| 2 | 74 | 9.82 | 660.54 | 63.14 | 2.89 |
Table 3.
Performance comparison of Logistic Regression, SVM, and Random Forest models for predicting household vulnerability in Bukavu.
Table 3.
Performance comparison of Logistic Regression, SVM, and Random Forest models for predicting household vulnerability in Bukavu.
| Model | Precision | Recall | F1-Score | AUC-ROC | Accuracy | Time(s) |
|---|---|---|---|---|---|---|
| Logistic Regression | 0.96 | 1.00 | 0.98 | 0.999 | 0.987 | 0.021 |
| SVM | 0.96 | 1.00 | 0.98 | 1.00 | 0.987 | 0.030 |
| Random Forest | 1.00 | 0.90 | 0.95 | 0.997 | 0.974 | 0.185 |
Table 4.
Cross-validation performance (mean accuracy and standard deviation) of the three models.
| Model | Mean Accuracy | Standard Deviation |
|---|---|---|
| Random Forest | 0.9455 | 0.0727 |
| SVM | 0.9247 | 0.0654 |
| Logistic Regression | 0.9636 | 0.0397 |
Table 5.
Regression Coefficients and Variable Importance for the Three Models.
| Variables | Logistic Regression | SVM | Random Forest Importance |
|---|---|---|---|
| Transport Expenditure | 2.347926 | 2.026481 | 0.175443 |
| Household Income | -5.478468 | -5.564908 | 0.314423 |
| Housing Rent | -0.025524 | 0.053763 | 0.165803 |
| Age of Household Head | -0.510877 | -0.421659 | 0.040898 |
| Occupation Status | -0.632006 | -0.314694 | 0.023974 |
| Education Level | -0.797172 | -0.335017 | 0.055182 |
| Gender of Household Head | 0.598190 | 0.276443 | 0.011202 |
| Employment: Unemployed | -0.023989 | -0.083704 | 0.001989 |
| Employment: Entrepreneur | 0.172913 | 0.091994 | 0.030739 |
| Employment: Private Employee | -0.677285 | -0.365117 | 0.010238 |
| Employment: Public Employee | 0.172913 | 0.091994 | 0.021575 |
| Number of Dependents | 0.573524 | 0.415332 | 0.056644 |
| Car Ownership | -0.379830 | 0.431540 | 0.018048 |
| Mobility Rate | 0.059943 | -0.002723 | 0.037358 |
| Residence: Bagira | 1.037223 | 0.903137 | 0.019356 |
| Residence: Ibanda | -0.416353 | -0.451564 | 0.008131 |
| Residence: Kadutu | -0.625747 | -0.451573 | 0.008996 |
Disclaimer/Publisher’s Note: The statements, opinions and data contained in all publications are solely those of the individual author(s) and contributor(s) and not of MDPI and/or the editor(s). MDPI and/or the editor(s) disclaim responsibility for any injury to people or property resulting from any ideas, methods, instructions or products referred to in the content. |
© 2026 by the authors. Licensee MDPI, Basel, Switzerland. This article is an open access article distributed under the terms and conditions of the Creative Commons Attribution (CC BY) license (http://creativecommons.org/licenses/by/4.0/).
Copyright: This open access article is published under a Creative Commons CC BY 4.0 license, which permit the free download, distribution, and reuse, provided that the author and preprint are cited in any reuse.


