1. Introduction
Obesity has emerged as a global epidemic and a major public health challenge. It is primarily characterized by insulin resistance, relative insulin deficiency, type 2 diabetes mellitus, and disorders of carbohydrate and lipid metabolisms [
1]. The accumulation of excess adipose tissue initiates a cascade of physiological dysfunctions, leading to dyslipidemia defined by elevated triglycerides and reduced high density lipoprotein cholesterol levels, which contribute to cardiovascular diseases [
2]. Metabolic dysfunction-associated fatty liver disease (MAFLD) represents another serious complication, in which excessive fat accumulates in hepatocytes, promoting hepatic steatosis that can progress to inflammation, fibrosis, and cirrhosis [
3,
4].
The obesity-associated metabolic disorders has risen markedly, particularly in developed countries, where sedentary lifestyles and diets high in processed foods and calories are widespread [
5]. A major contributing factor is excessive sugar consumption, which disrupts energy balance and promotes weight gain [
6]. High-sucrose/high-fat die in mice alters gut microbiota composition, impairs intestinal barrier function, and promotes the release of metabolic toxins, collectively driving disorders of glucose and lipid metabolisms [
7].
Similar to their mammalian counterparts, carnivorous fish exhibit marked glucose intolerance and are prone to developing metabolic syndrome-like conditions when subjected to HSF. Carnivorous fish exhibit significant variations in metabolic responses to dietary carbohydrate levels [
8]. Their limited capacity to utilize starch stems from reduced blood glucose clearance and impaired glucose absorption, making them less efficient in handling carbohydrates compared to omnivorous or herbivorous fish [
9,
10]. This metabolic constraint adversely affects meat quality by altering texture, flavor, and nutritional value, thereby reducing market appeal. More critically, it disrupts metabolic homeostasis, increasing susceptibility to diseases that can progress into life-threatening conditions, leading to elevated mortality and substantial economic losses for aquaculture operations. Those losses manifest as reduced productivity, increased costs, and diminished market value of aquatic products [
11,
12,
13].
Probiotics and prebiotics have emerged as complementary additives for preventing and mitigating metabolic disorders. Although numerous studies have implicated probiotics in obesity and healthy management of human and animals, the specific strains involved and their molecular mechanisms remain inadequately characterized. Our previous study has revealed that
Lactobacillus plantarum (
L. plantarum) can enhance catabolic process and reduces hepatic lipid accumulation in largemouth bass (
Micropterus salmoides) fed with high-starch diet [
14]. This probiotic strain appears to improve lipid metabolism and decrease liver fat accumulation, particularly in fish under long-term dietary stress. The beneficial effects are potentially mediated through modulation of gut microbiota involved in lipid digestion and carbohydrate and lipid metabolisms.
To elucidate the role of
L. plantarum-derived metabolites in regulating carbohydrate and lipid metabolisms, we performed a metabolomic analysis and identified carnosine as one of the key metabolites produced by
L. plantarum. This dipeptide, composed of β-alanine and histidine, plays crucial roles in metabolic regulation and antioxidant defense [
15,
16]. Its presence in
L. plantarum highlights the potential of this probiotic in enhancing physiological resilience and protecting against oxidative damage [
17,
18,
19]. Carnosine exists in two variants: L-carnosine, which occurs naturally in organisms, and D-carnosine, a synthetic analog. Both forms exhibit similar biological activities [
20].
Zebrafish (
Danio rerio) is a small aquatic vertebrate widely used as a model organism in the study of various biological and pathological processes. Its advantages include small size, ease of breeding, short life cycle, and low maintenance cost, making it particularly suitable for laboratory research [
21,
22]. Furthermore, the high genetic similarity between zebrafish and humans allows this organism to model numerous human diseases, thereby facilitating the investigation of disease mechanisms and supporting drug discovery efforts. The short generation time and high fecundity of zebrafish also enable high-throughput screening, accelerating advances in genetics, toxicology, and pharmacology. As omnivorous with a carnivorous tendency, zebrafish naturally consume a diverse diets that including insects, zooplankton, and phytoplankton, a trait that further supports their utility in nutritional and metabolic studies [
23,
24].
In this study, we aim to dissect the functional mechanisms of naturally occurring L-carnosine in carbohydrate and lipid metabolisms of zebrafish. A high-starch diet was employed to generate a fatty model of zebrafish, which enables the dissection of molecular mechanisms underlying the development and progression of high carbohydrate-associated metabolic disorders.
2. Results
2.1. L-carnosine Supplementation Alleviates Hepatic Steatosis in Zebrafish
After 10-week feeding trial under the same rearing conditions, we assessed the growth performance of zebrafish fed with normal-starch feed (NSF), high-starch feed (HSF), dietary supplementation with L-carnosine at low (CAL) or high dose (CAH). As shown in
Table 1 and
Figure S1, the average body weights of HSF and CAL groups were significantly higher than that of the NSF group. The average body weight of CAH group markedly decreased when compared with those of HSF and CAL groups, and showed no significant difference with that of NSF group. These data indicate that an obesity model of zebrafish was successfully generated and L-carnosine supplementation at high dose (CAH) has a weight loss effect on the obese zebrafish.
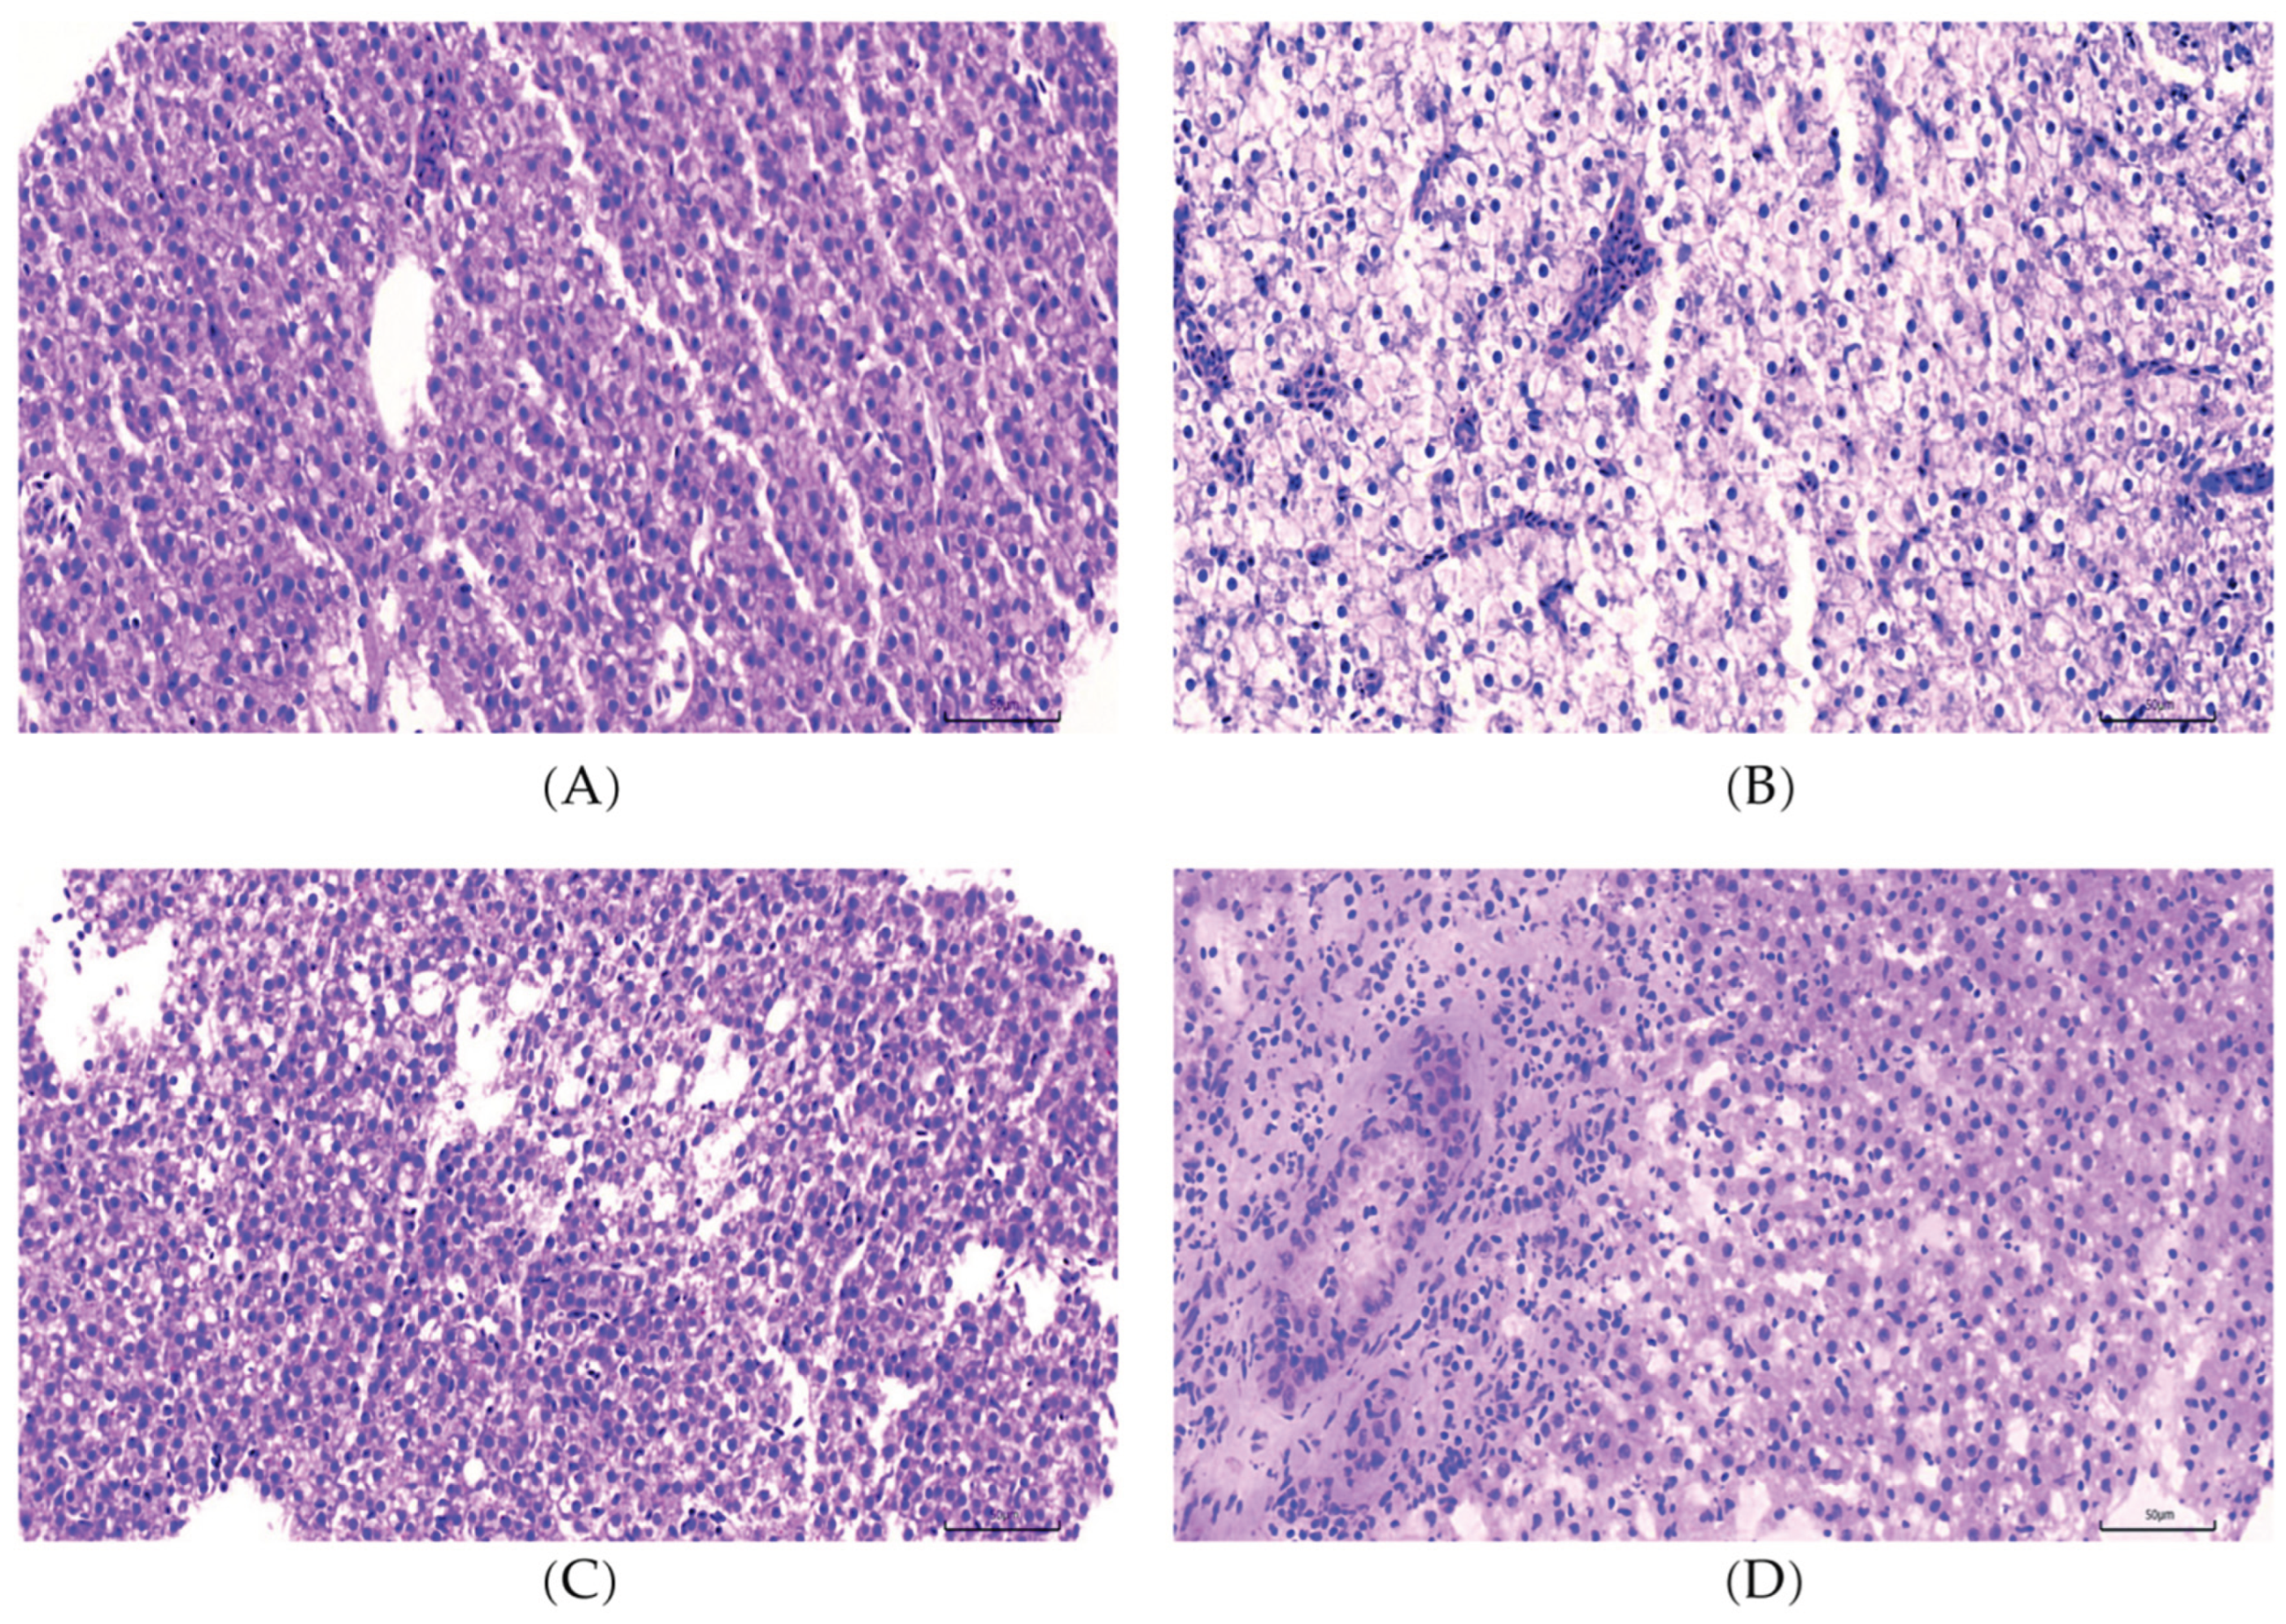
Histopathological analyses were performed to assess liver pathology in response to dietary interventions. As shown in
Figure 1, H&E staining revealed that hepatocytes from the NSF group are closely connected to one another and arranged in an orderly manner, and contain large and round or oval cell nuclei located in the center of the cell, with a clear nuclear membrane and uniform chromatin. In contrast, hepatocytes from the HSF group displayed severe cellular swelling, vacuolar degeneration, and peripheral displacement of nuclei. The average number of nuclei for three randomly selected regions of uniform size in
Figure 1A was significantly higher than those in
Figure 1B, but not in
Figure 1C and 1D (
Figure S2). These data indicate that the disruption of hepatic architecture and the loss of hepatocyte number in HSF group can be recovered by L-carnosine supplementation at both low and high doses in CAL and CAH groups.
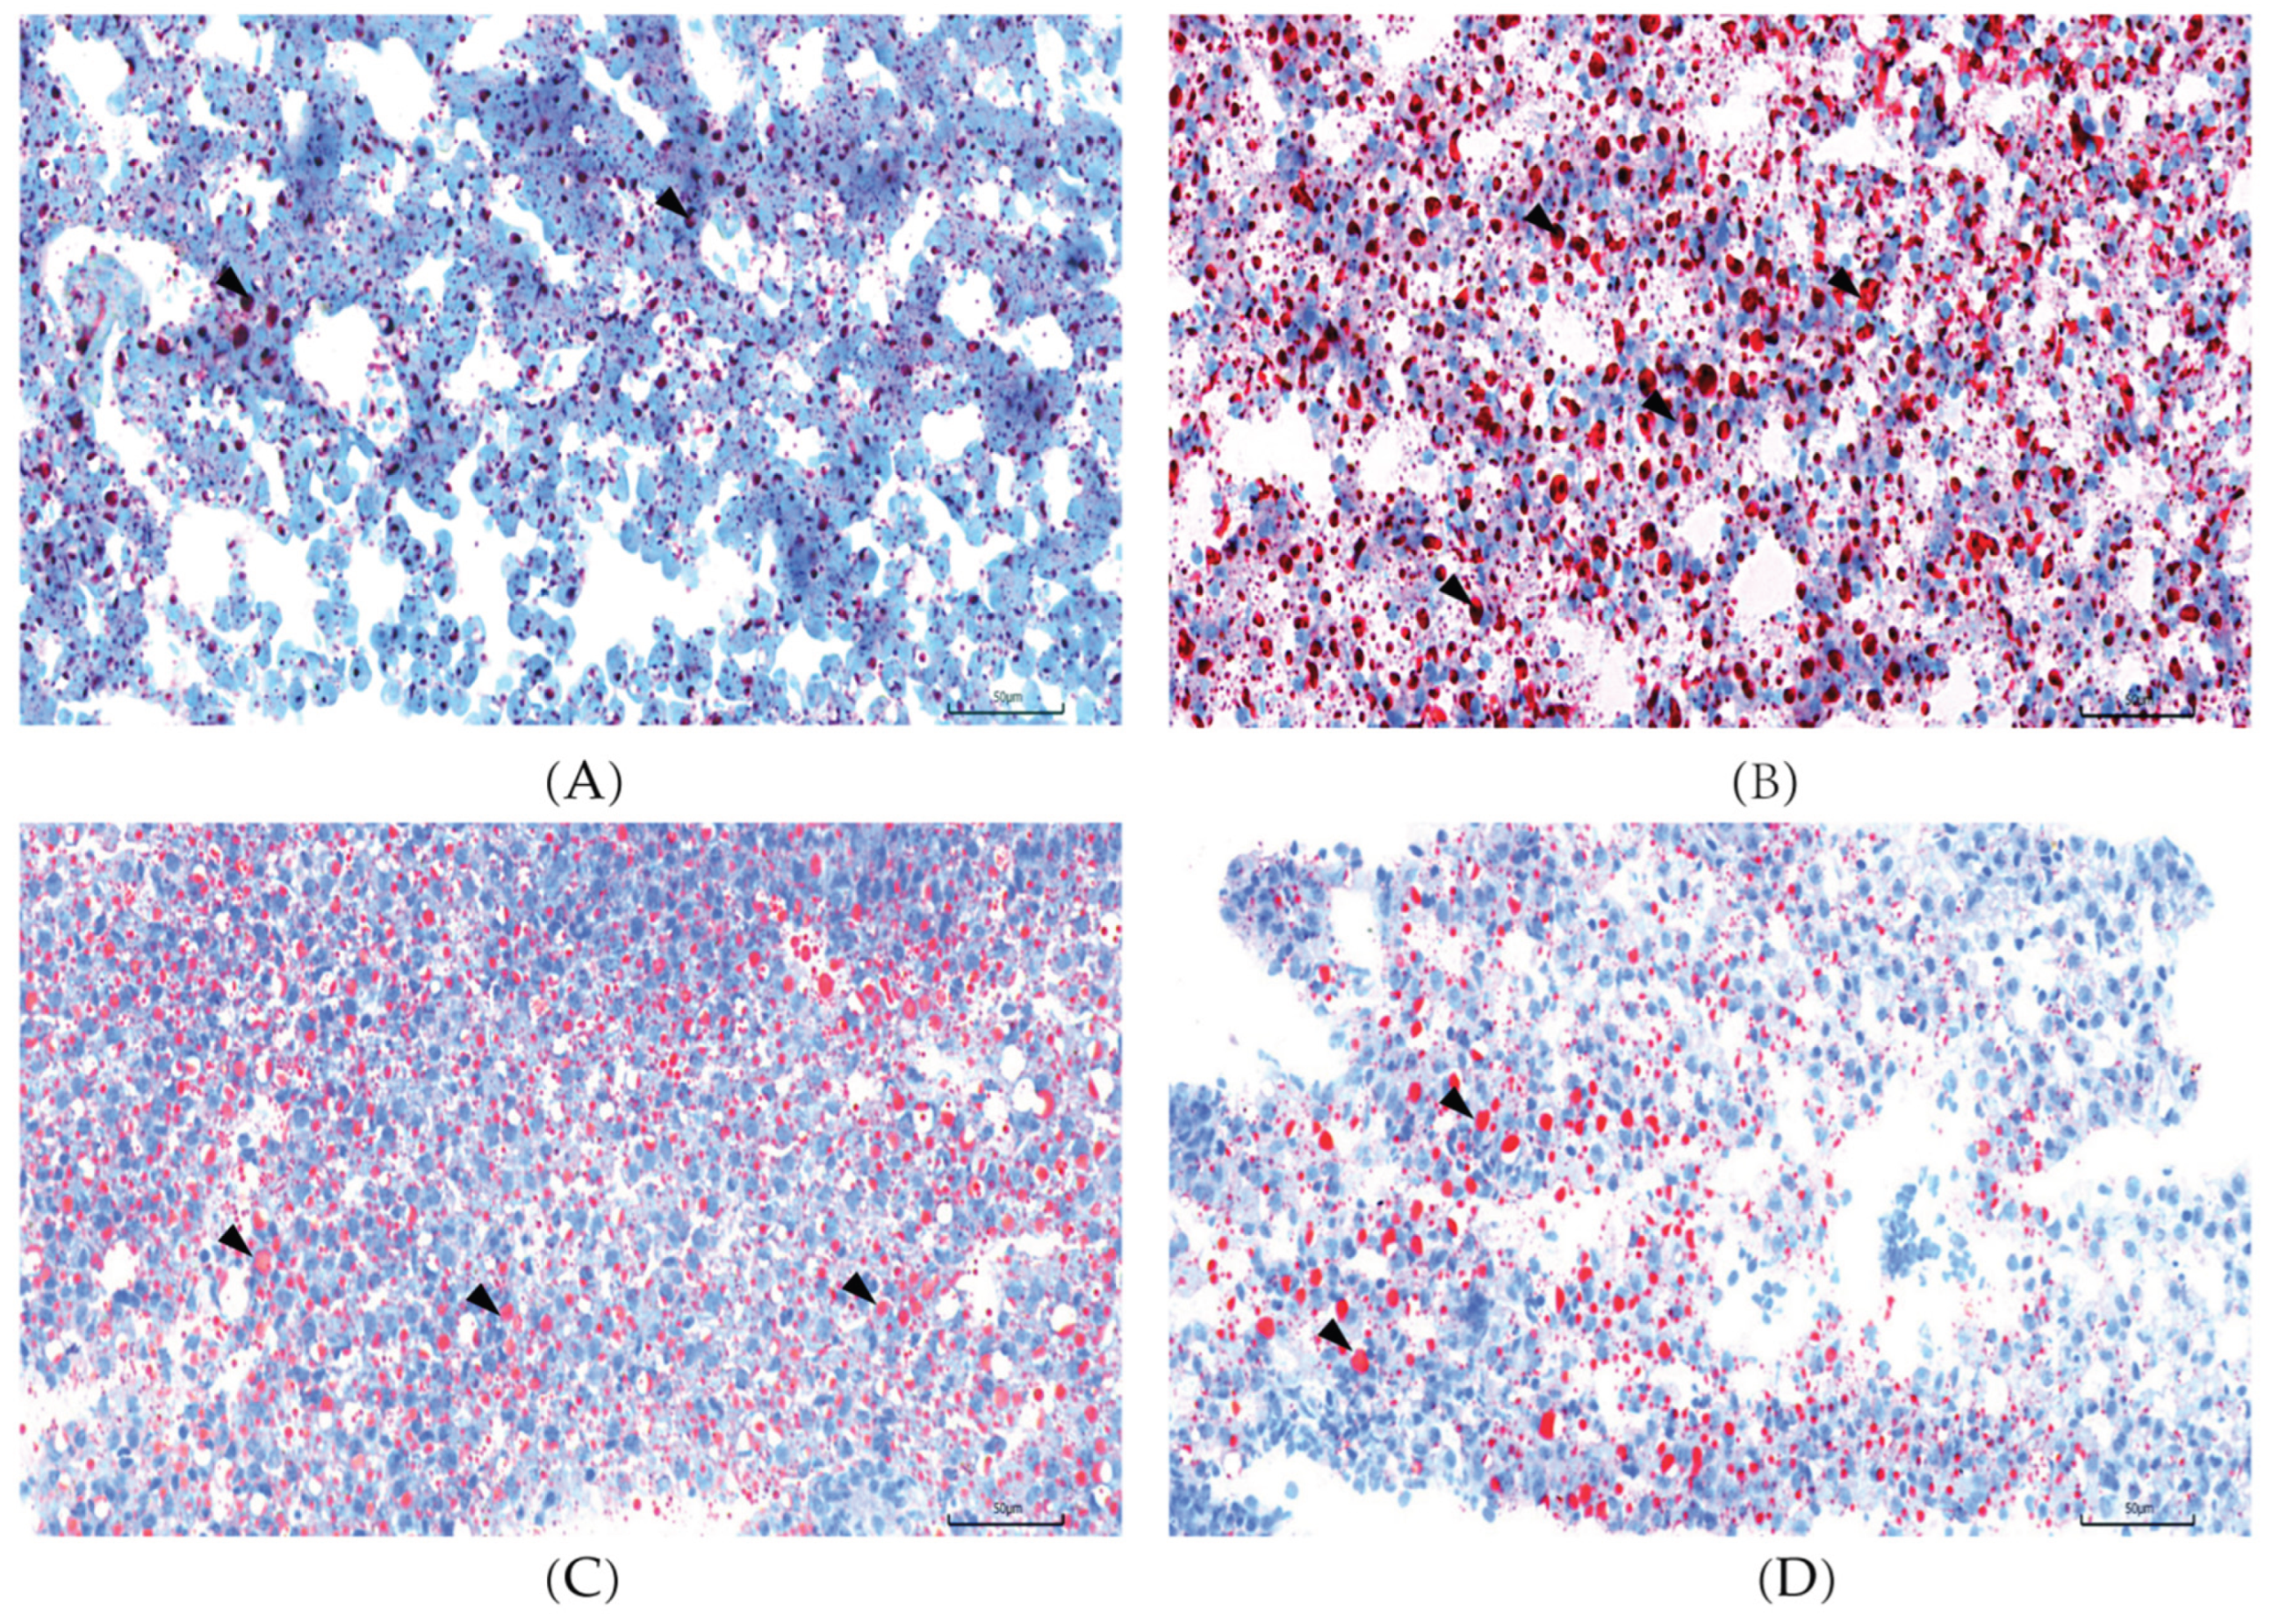
Consistent with these findings, Oil Red O (ORO) staining in the HSF group of
Figure 2 exhibited an extensive lipid accumulation (red dot areas), whereas a few and small lipid droplets were detected in NSF, CAL and CAH groups. These findings indicate that L-carnosine effectively attenuates the hepatic lipid deposition caused by high-carbohydrate feeding.
2.2. Effects of L-carnosine Treatments on Gene Expression in Zebrafish Liver
RNA-seq was performed to characterize the gene expression in zebrafish liver of NSF, HSF, CAL and CAH groups. In total, 12 sequencing libraries with triplicates for each group were constructed and sequenced. The number of clean read pairs generated for each sample ranged from 23.15 M to 43.46 M and the mapping rate of clean reads to the zebrafish reference transcriptome varied from 78.44% to 90.60% (
Table S1).
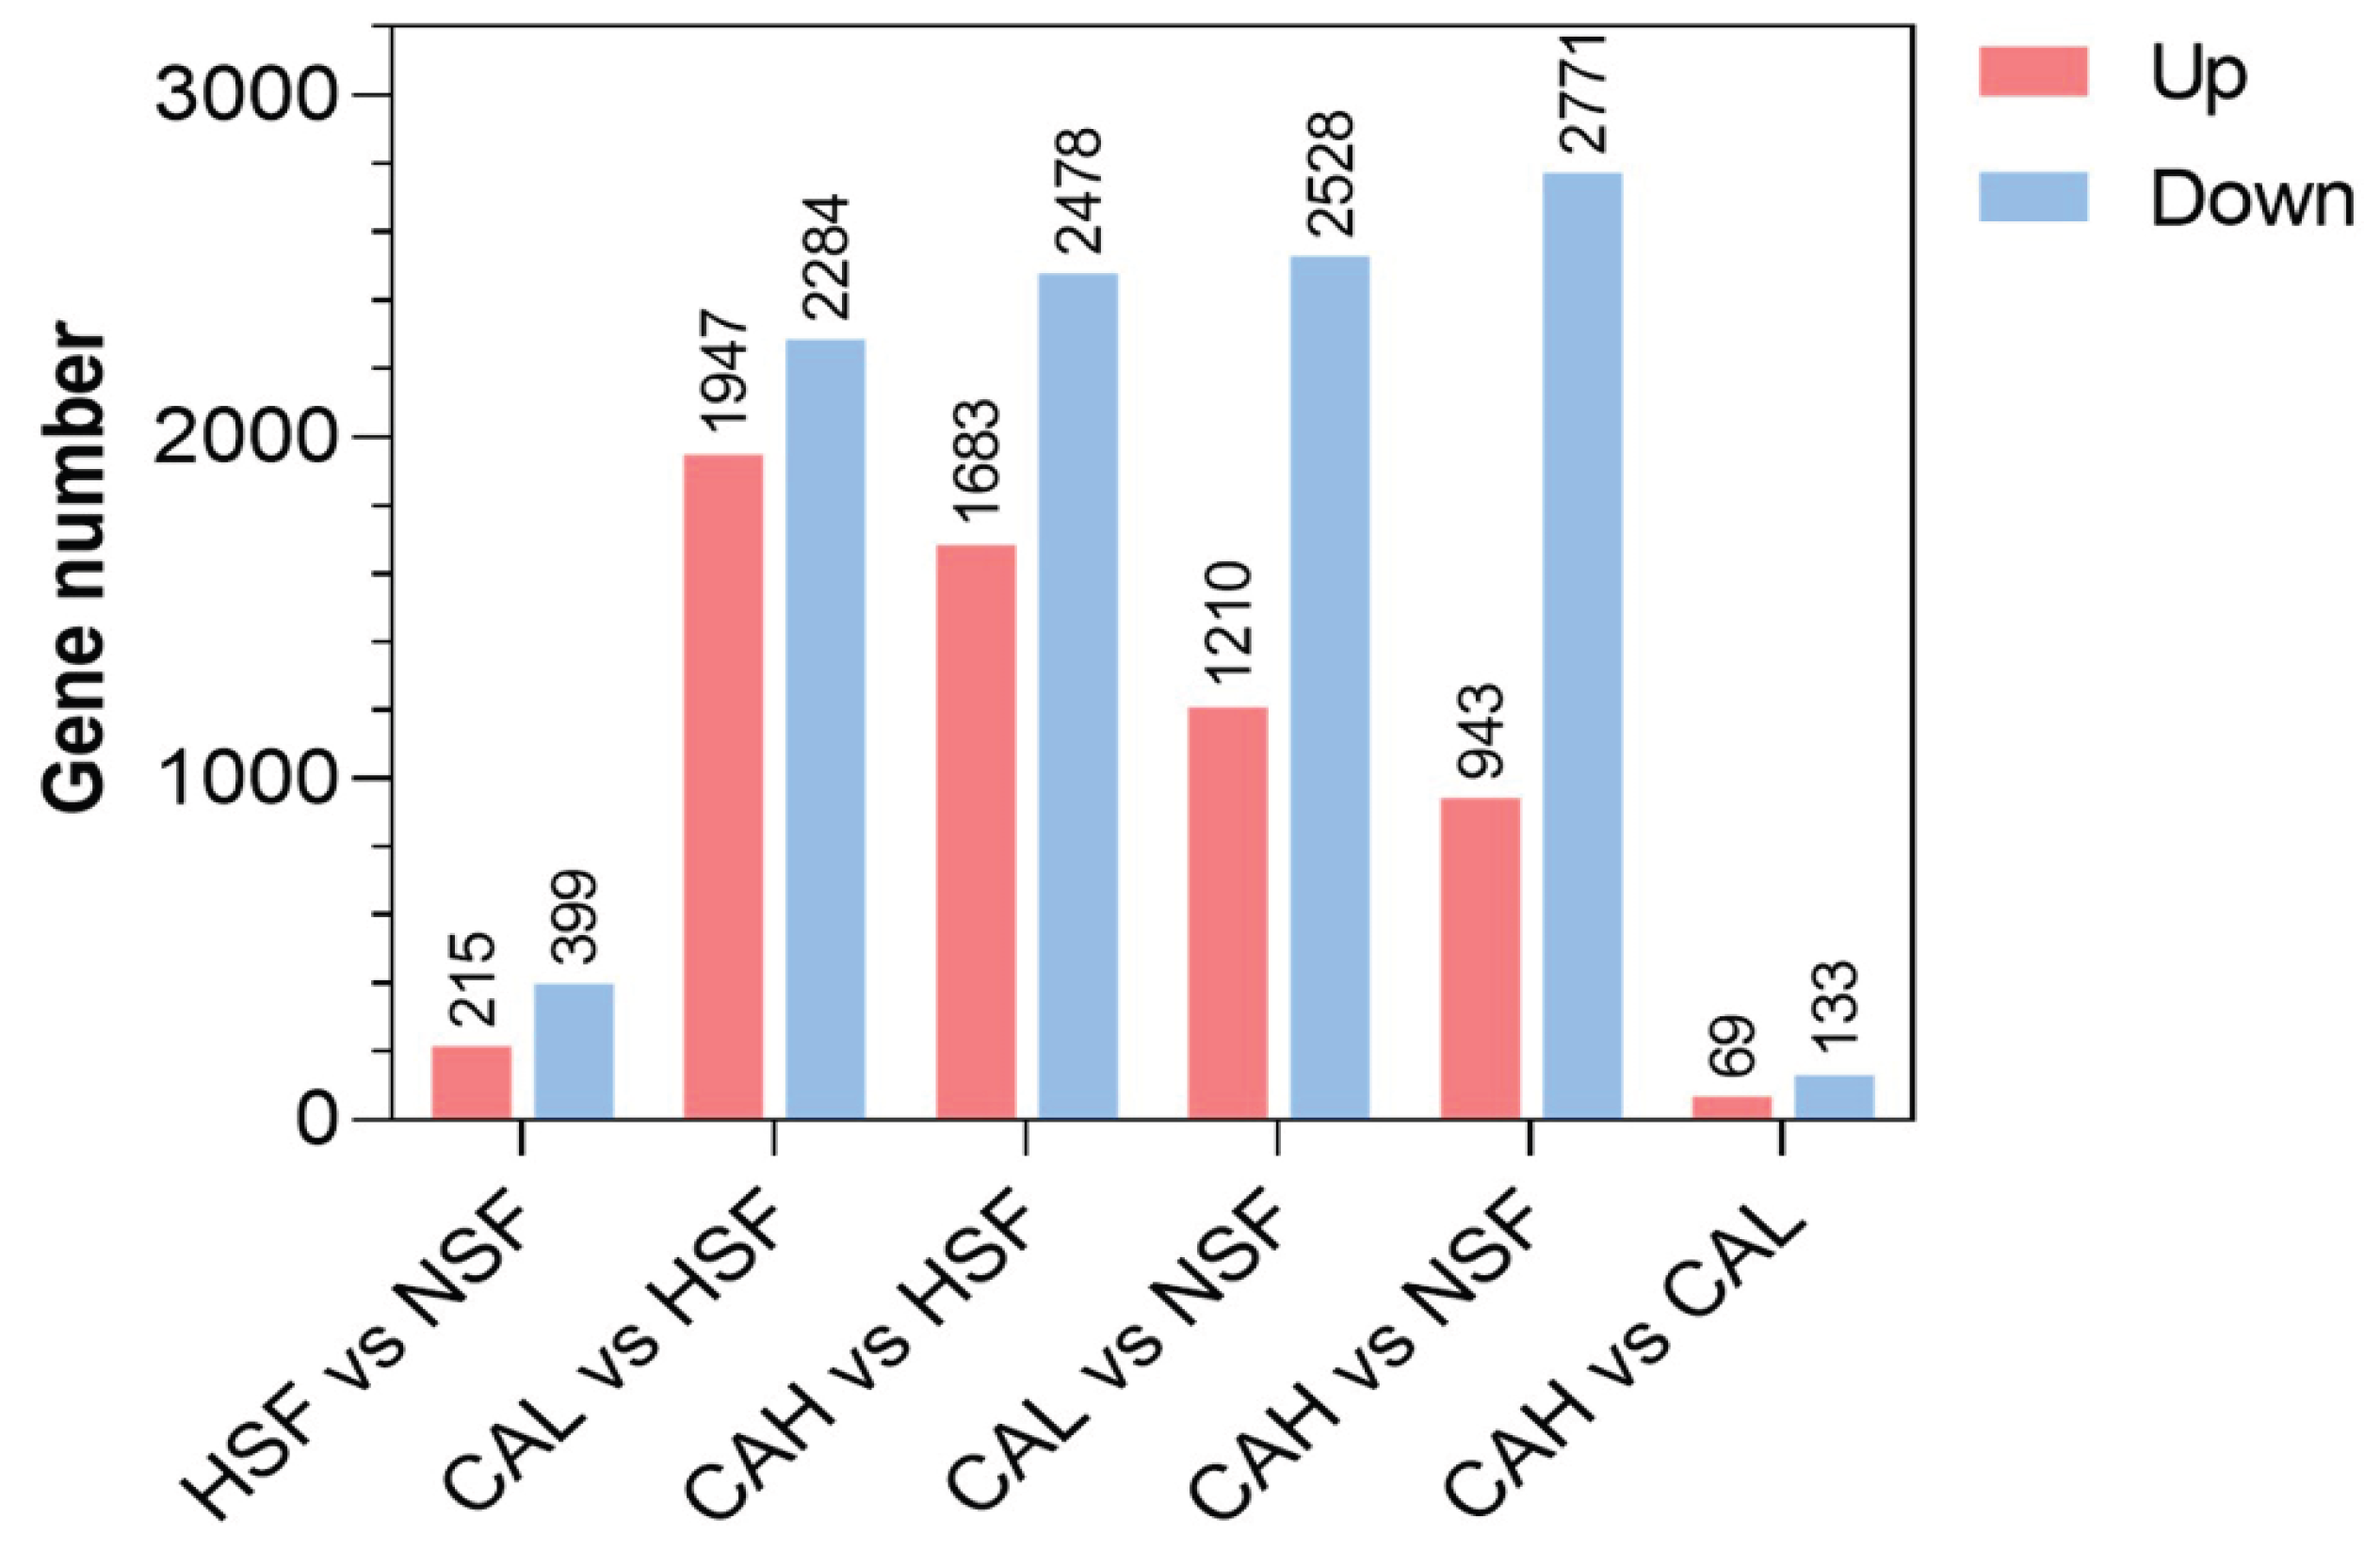
The differentially expressed genes (DEGs) between two groups in
Figure 3 were listed in
Table S2. The numbers of up- and down-regulated genes between the experimental groups are shown in
Figure 3. In total, 215 genes were up-regulated and 399 genes were down-regulated between HSF and NSF groups. The largest number of up-regulated genes was found between CAL and HSF groups, while the largest number of down-regulated genes was found between the CAH and NSF groups. The smallest numbers of up- and down-regulated genes were identified between CAH and CAL group. These data indicate that L-carnosine supplementation led to significant impacts on gene expression of zebrafish.
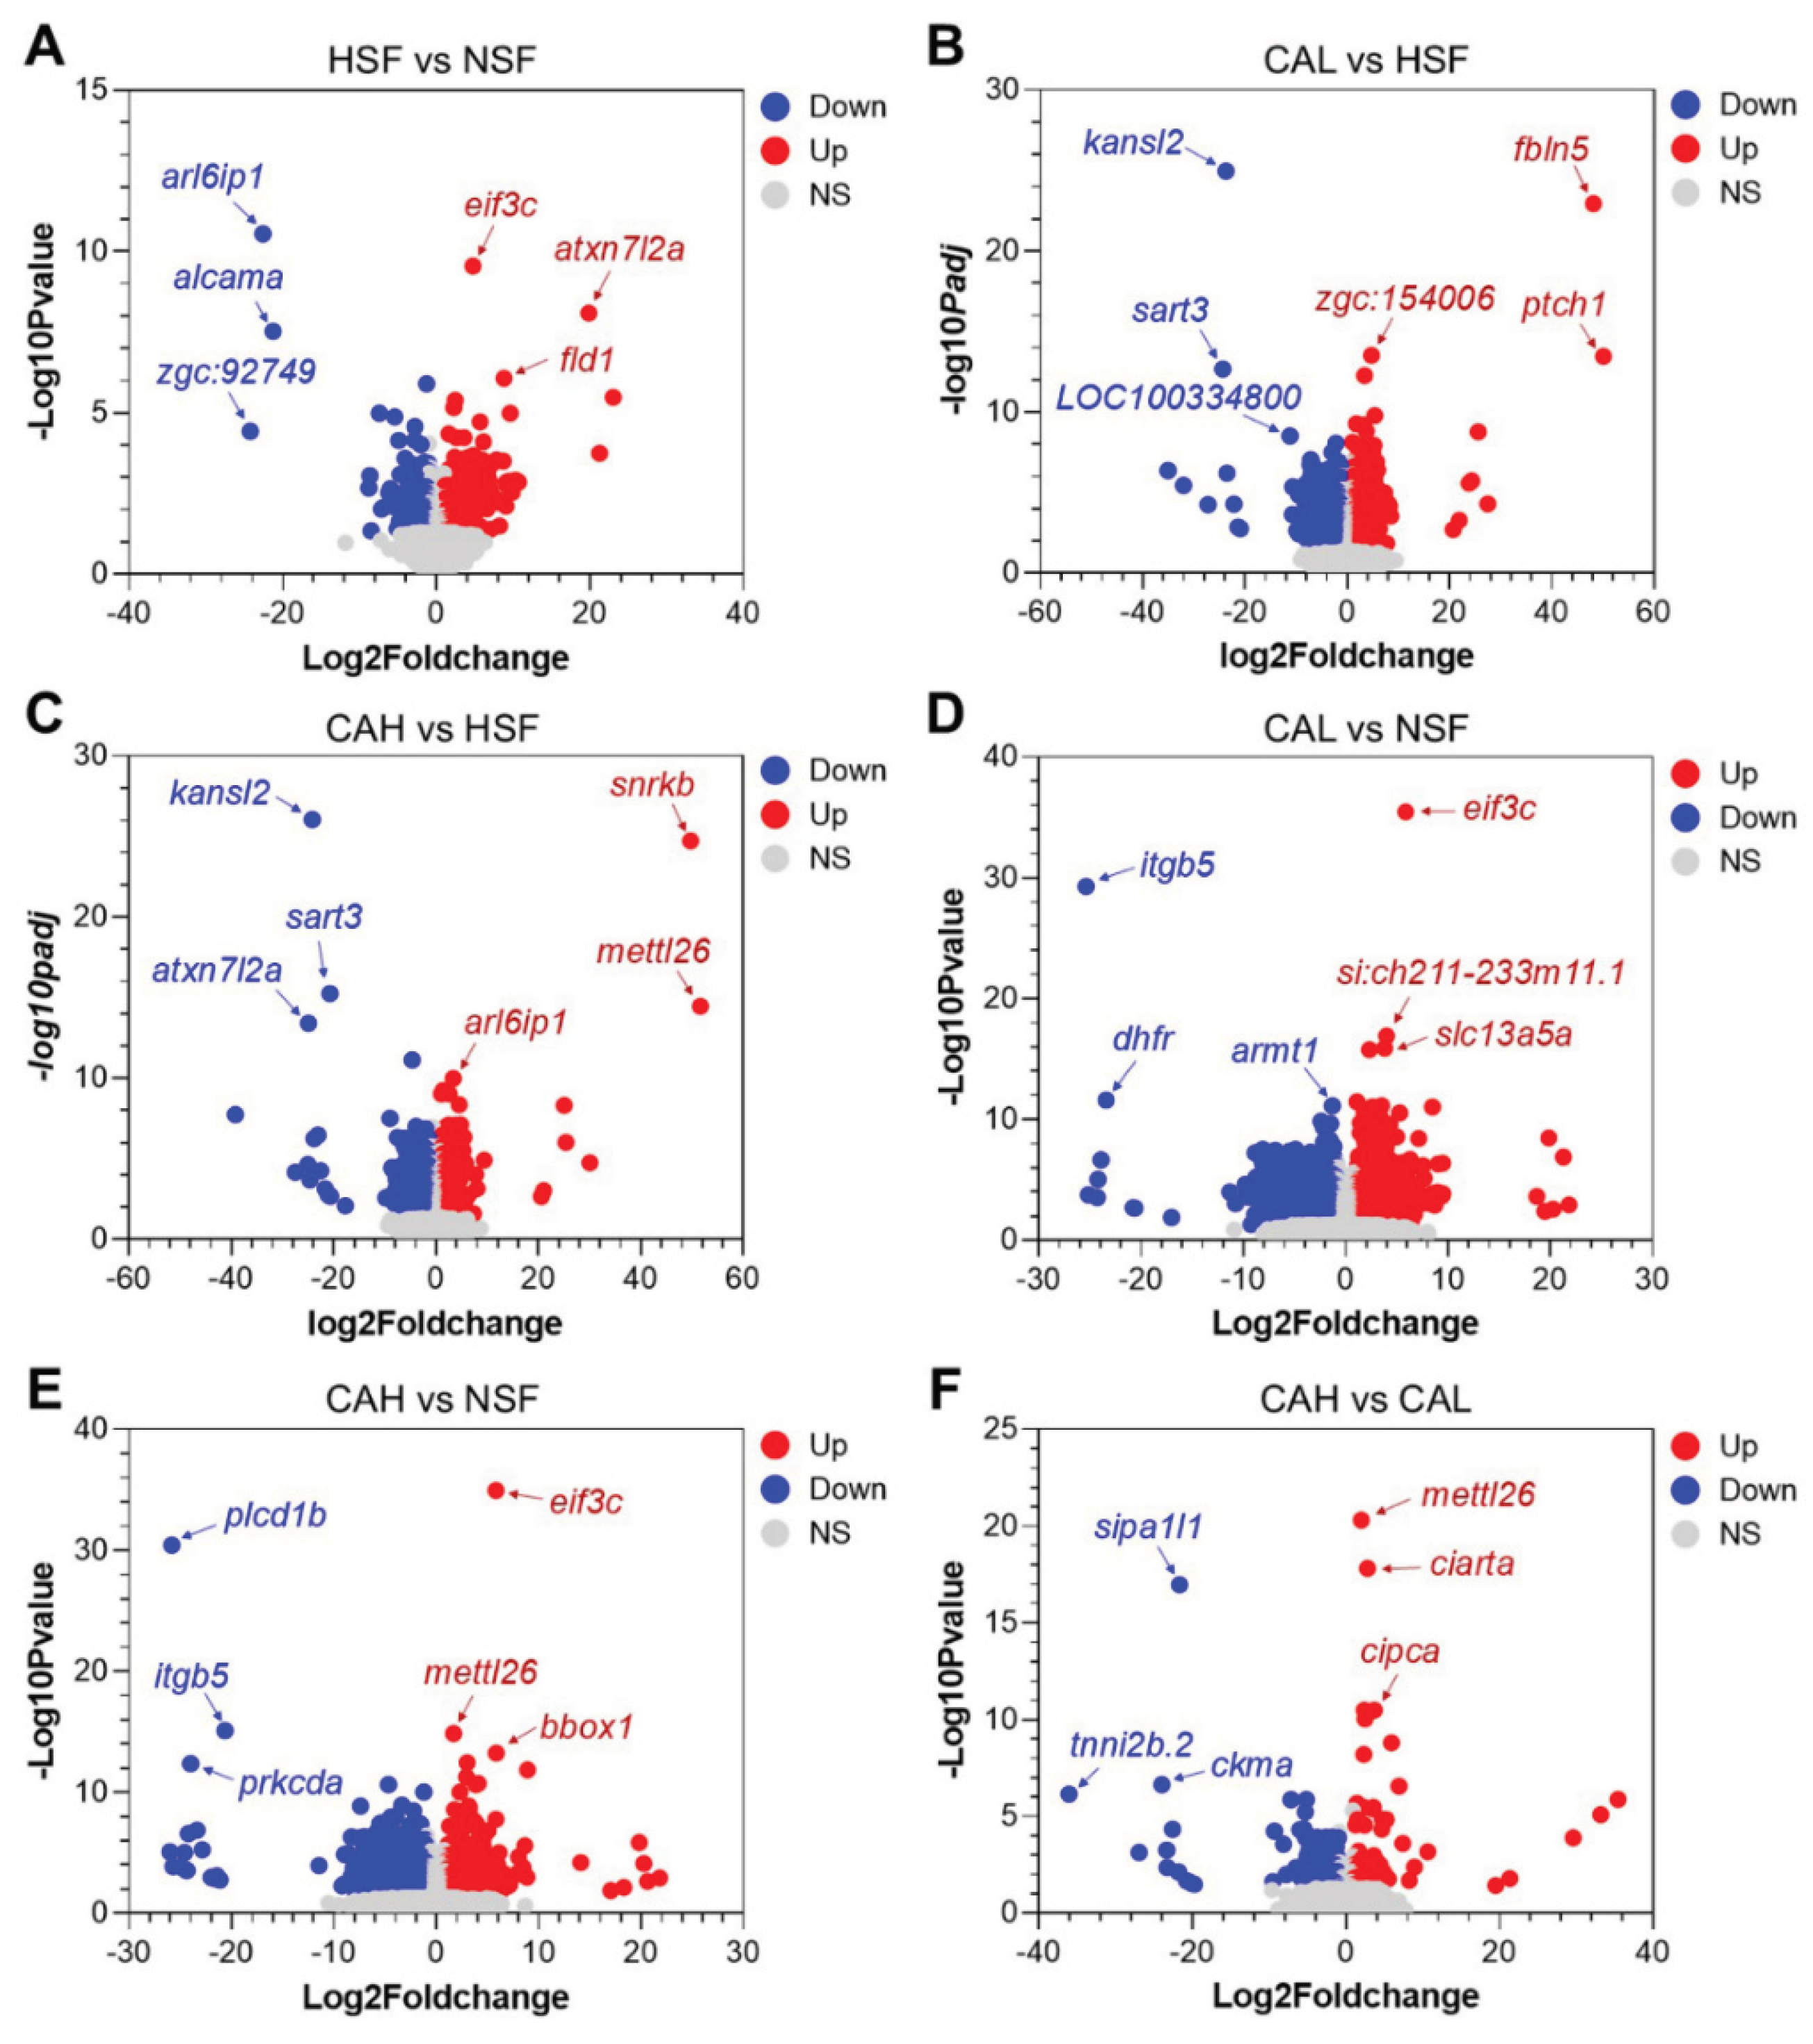
The genes differentially expressed between the experimental groups are shown in the volcano plots of
Figure 4 A to F, with symbols of the top up- and down-regulated genes displayed. For example,
eif3c,
atxn7l2a, and
fld1 are the top up-regulated genes, while
arl6ip1,
alcama, and
zgc:92749 are the top down-regulated genes in liver of the HSF group compared to the NSF group. Furthermore, the gene
atxn7l2a is among the top down-regulated genes between CAH and HSF, suggesting that high L-carnosine level can reverse its up-regulation by a high carbohydrate feed.
2.3. Identification of Genes Underlying the Protective Effects of L-carnosine in Zebrafish Liver
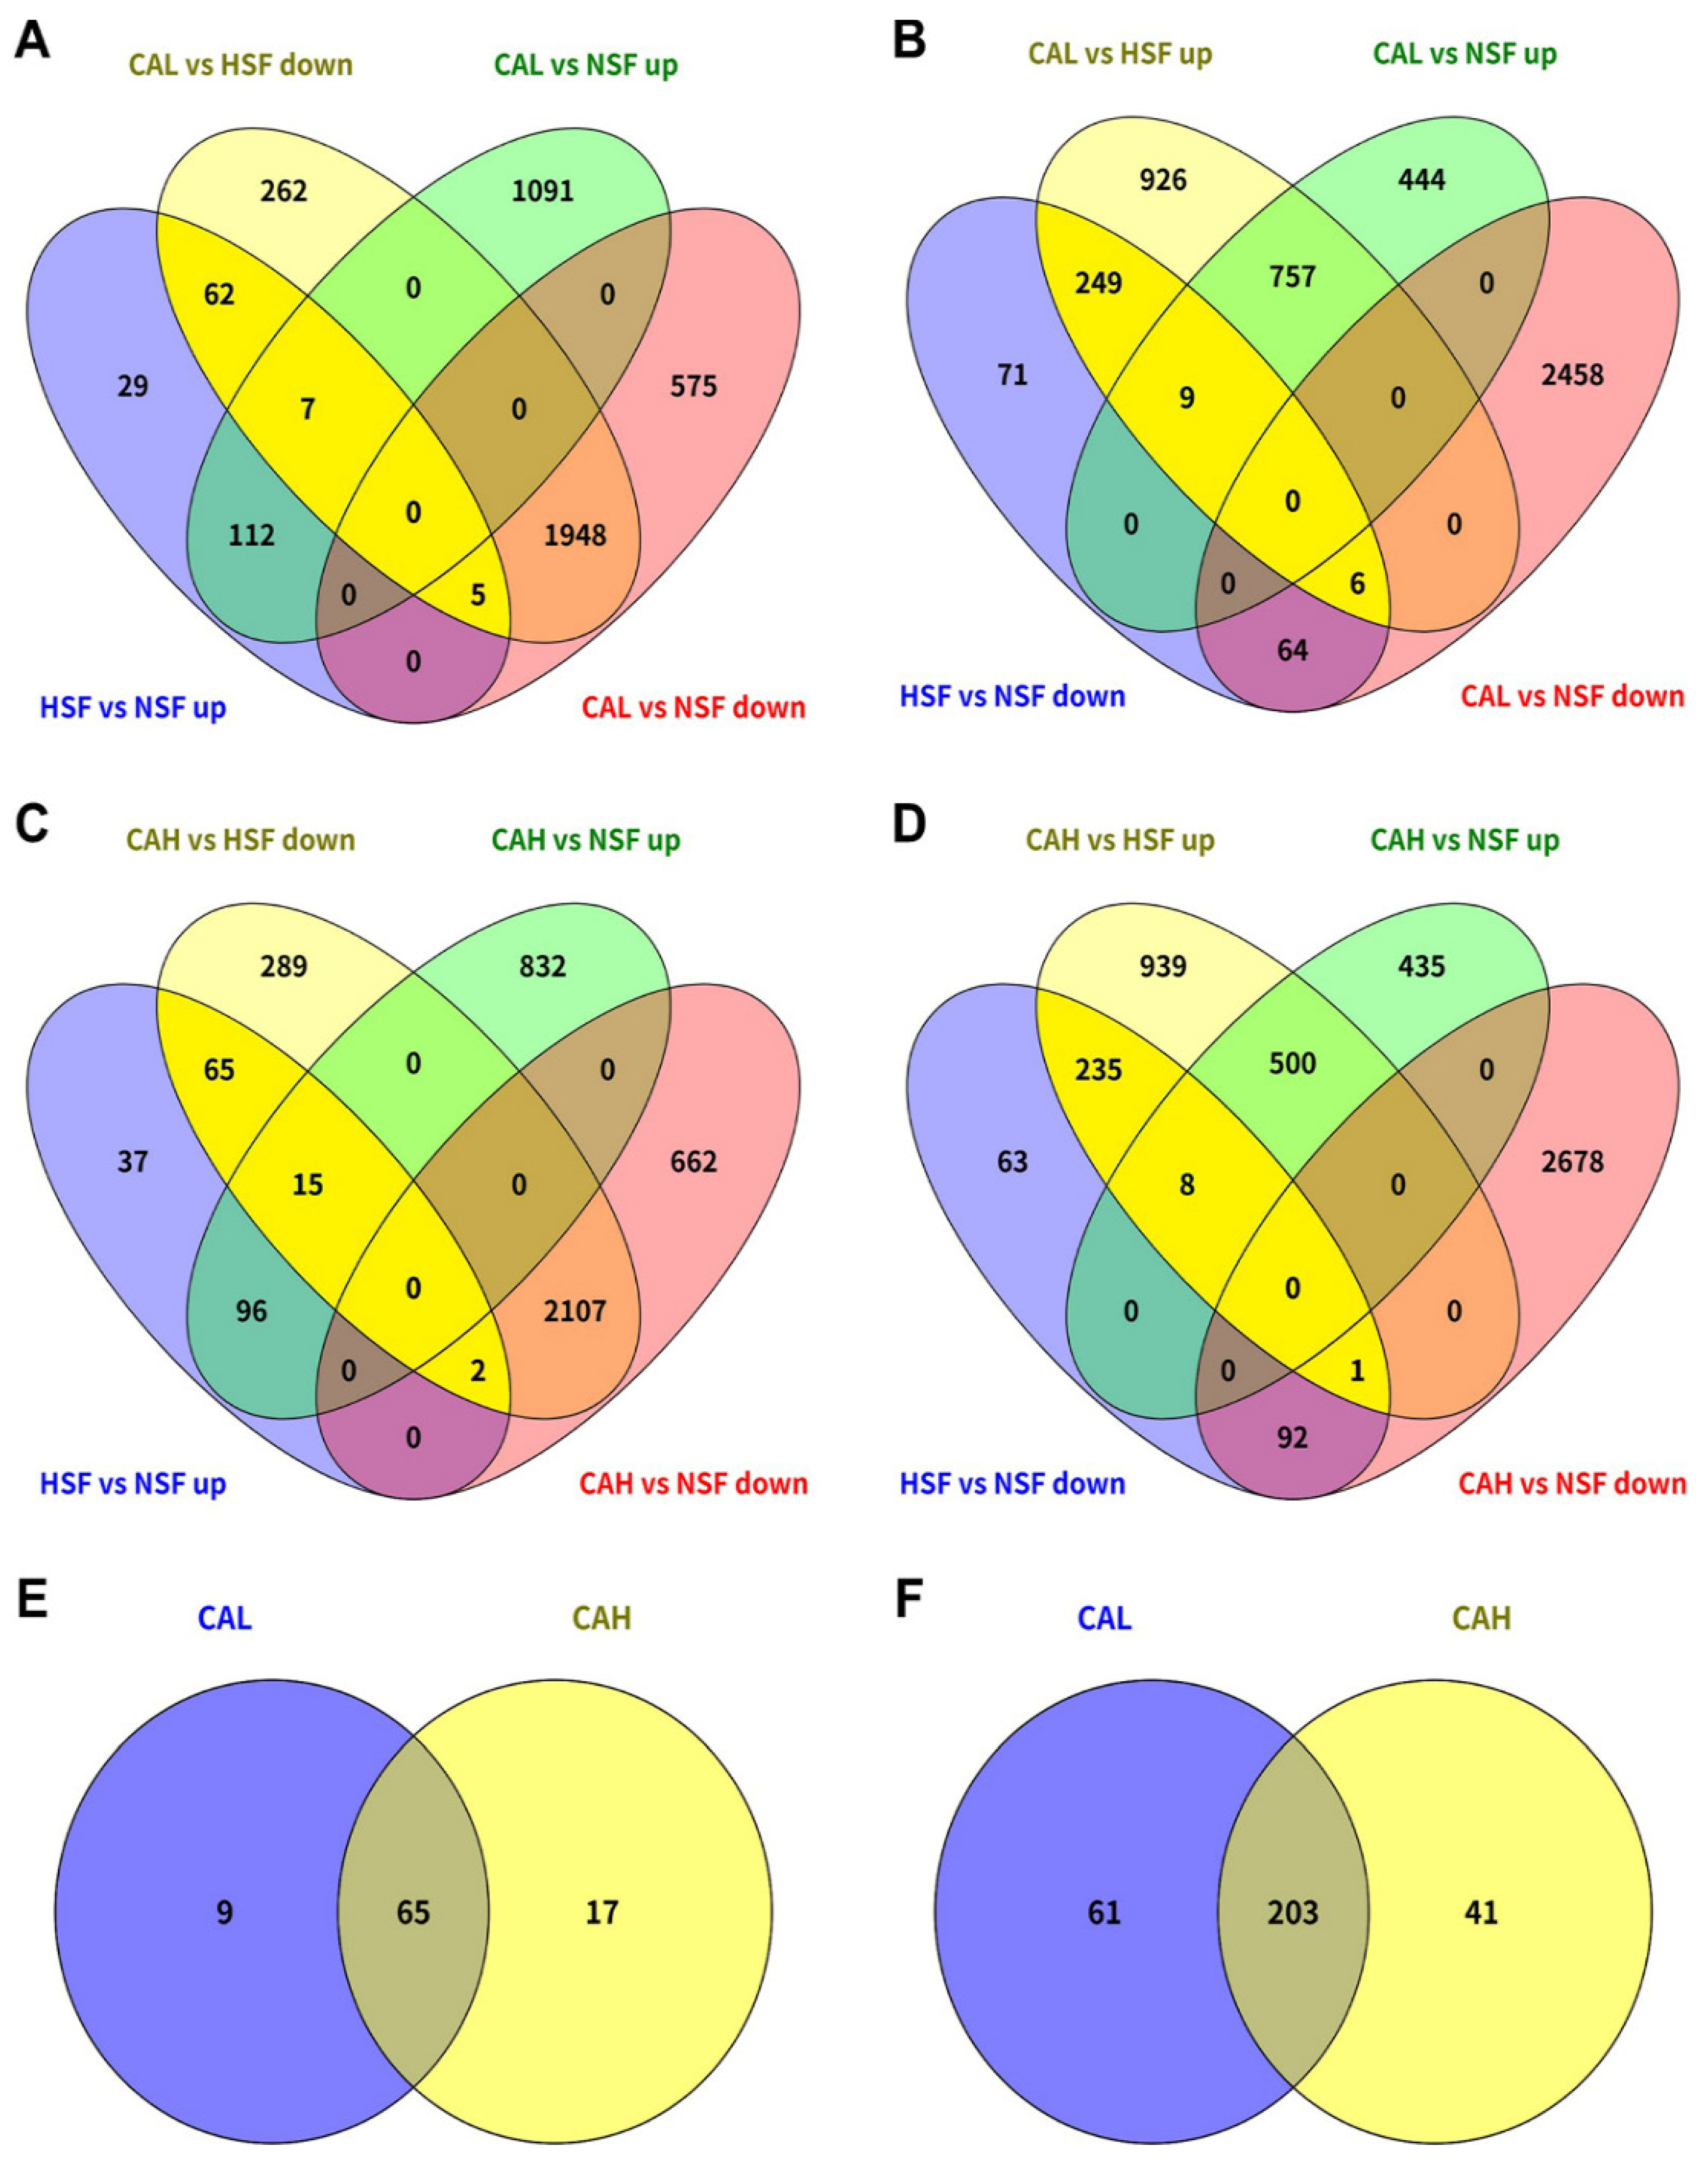
The genes associated with the protective effects of L-carnosine in the liver of zebrafish fed with HSF were identified by comparing the DEGs between different conditions. A total of 74 HSF-induced genes were found to be reversed by CAL toward the levels in the liver of fish fed with NSF, because 62 out 74 of these genes were not differentially expressed between the CAL and NSF groups (
Figure 5A, within bright yellow background). A large number of HSF-inhibited genes were found to be reversed by CAL (264) and most of them (249 out of 264) demonstrated no significant difference in expression between the CAL and NSF groups (
Figure 5B, within bright yellow background). Similar to those in the CAL group, the number of genes transcriptionally reversed in CAH group were 82 (HSF-induced) and 244 (HSF-inhibited) and most of them (249 out of 264) demonstrated no significant difference in expression between the CAL and NSF groups and most of them (65 out of 82 and 235 out of 244) demonstrated no significant difference in expression between the CAH and NSF groups (
Figure 5C and 5D, within bright yellow background). Furthermore, most of the L-carnosine-targeted genes were common between CAL and CAH, 65 for down-regulated genes (
Figure 5E) and 203 for up-regulated genes (
Figure 5F).
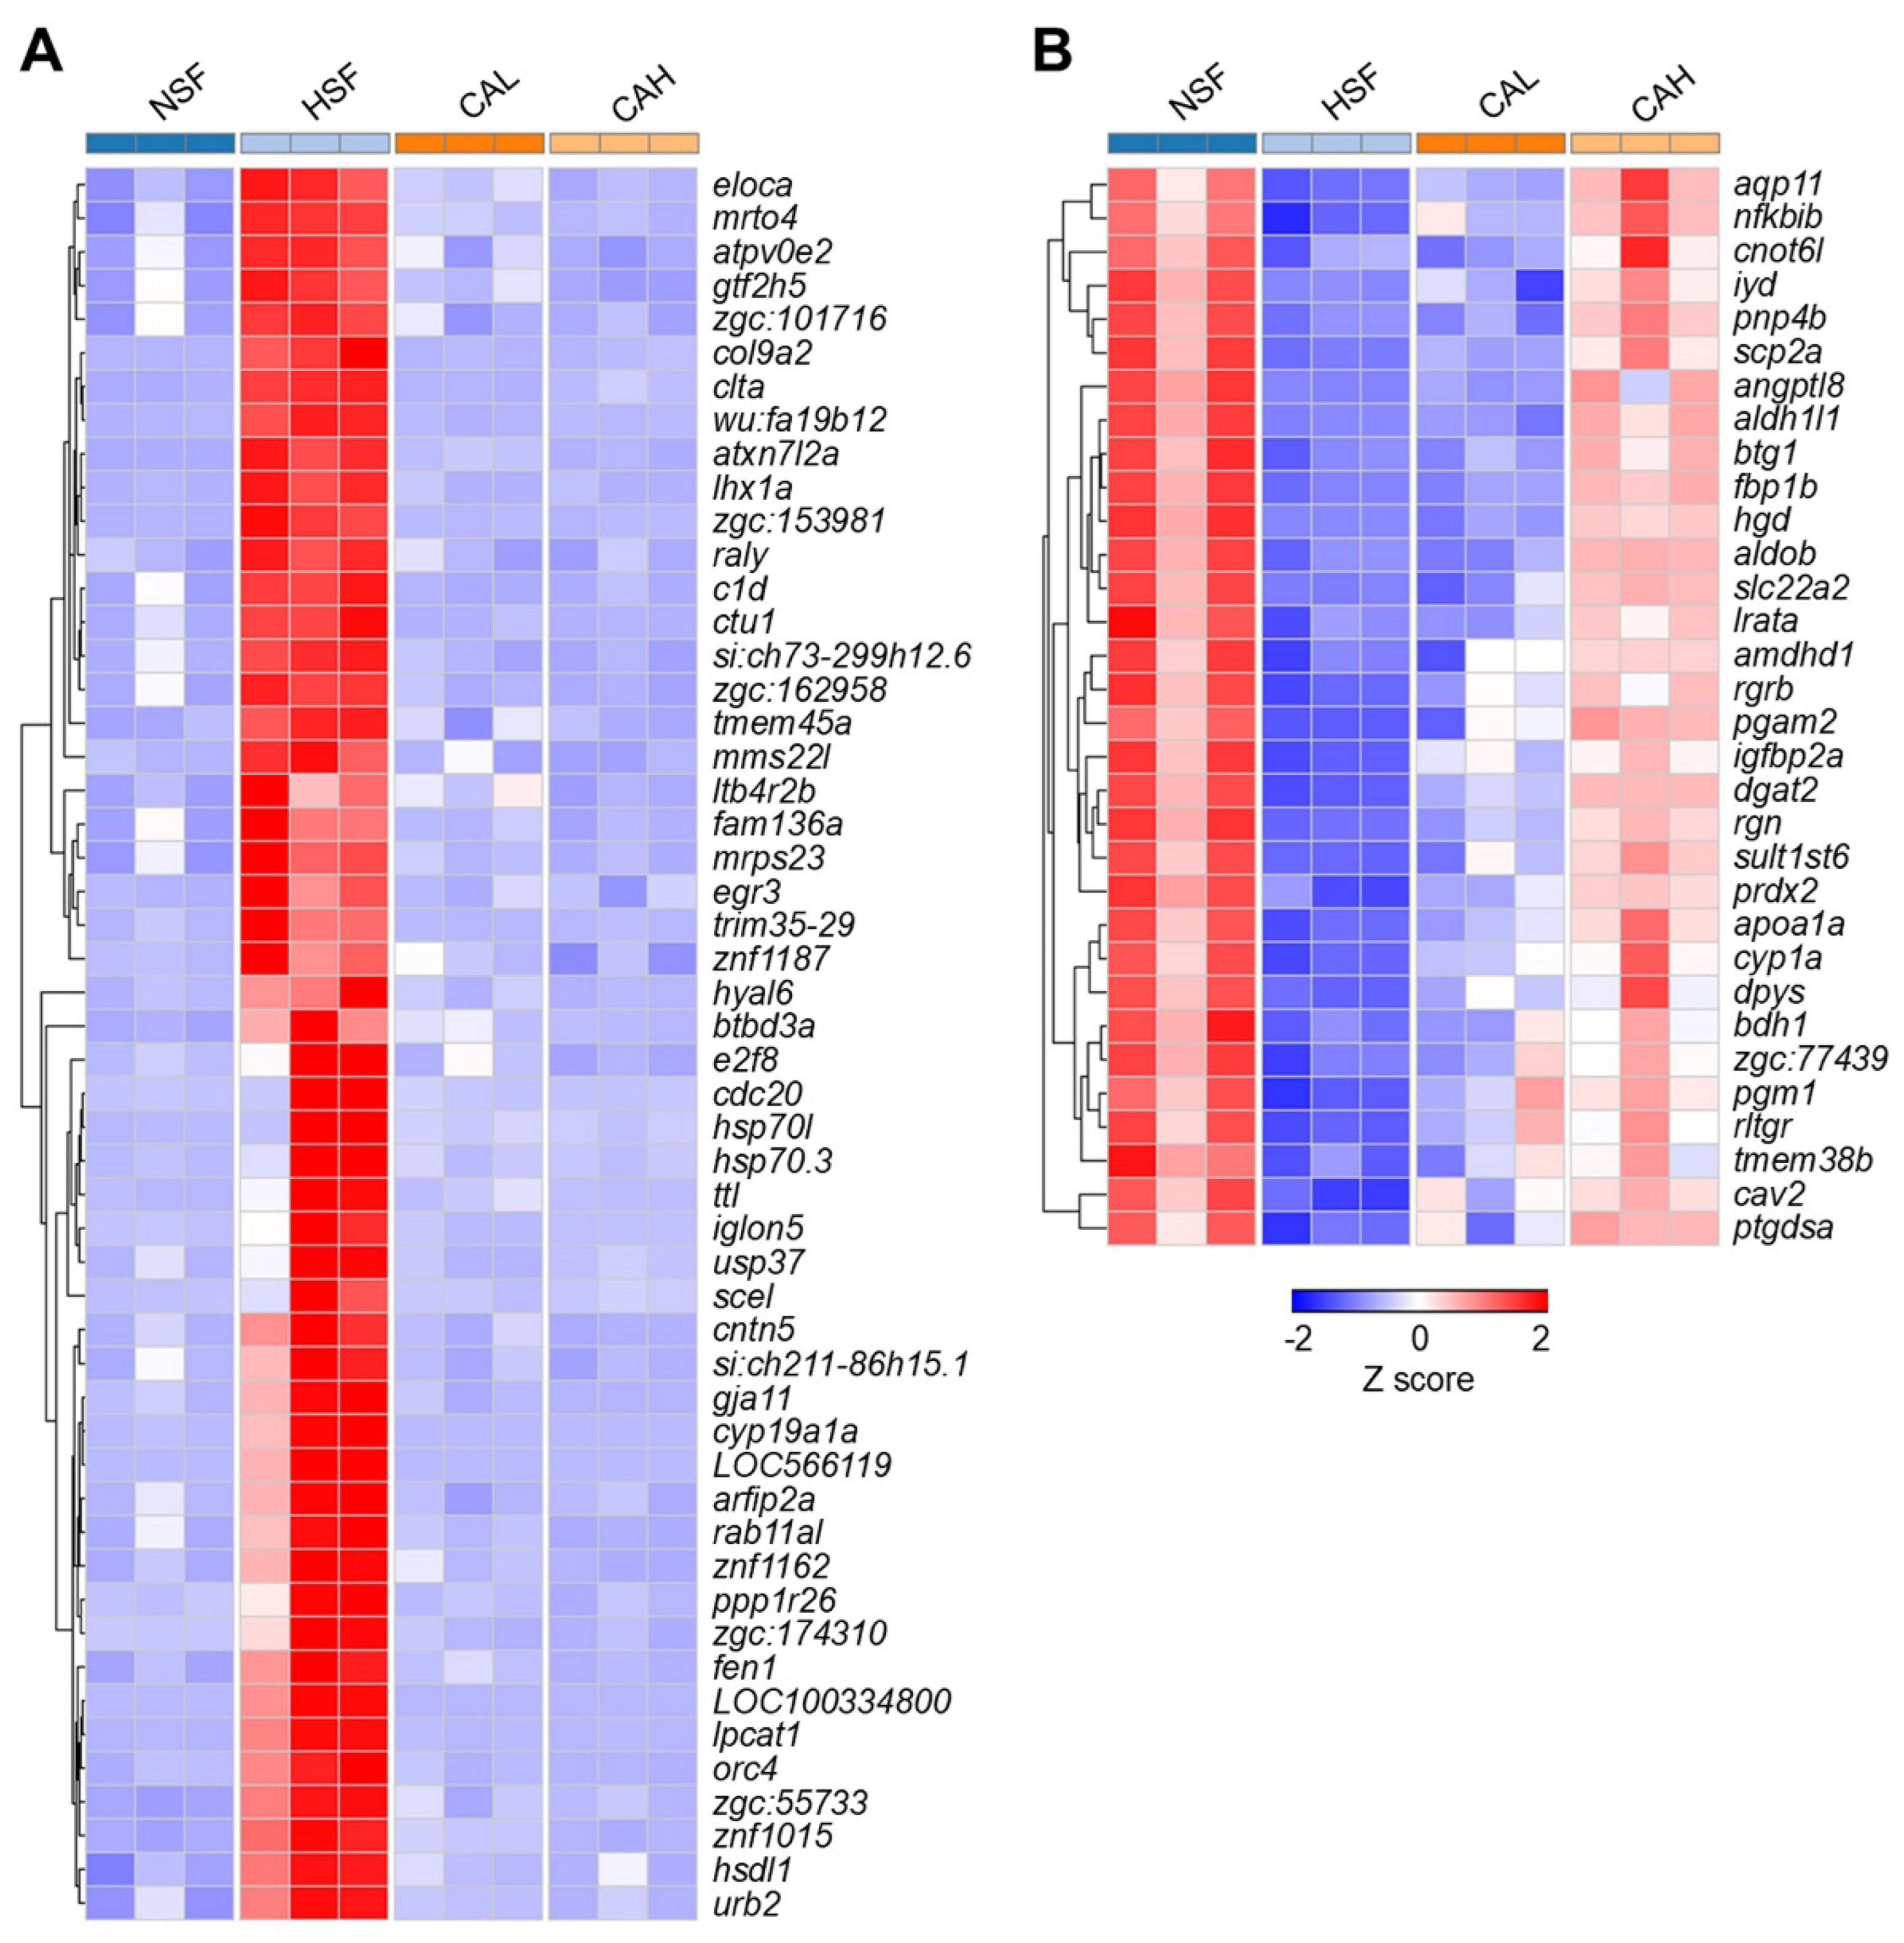
Representative genes up- or down-regulated by HSF and reversed by CAL or CAH toward the levels in NSF group are displayed in
Table S3,
Figure 6A and 6B. For example, the expression levels of genes such as
eloca,
mrto4, and
atpv0e2 were highly up-regulated in HSF group compared to the NSF group, but were decreased to normal levels in the CAL and CAH groups (
Figure 6A). On the contrary, genes such as
aqp11,
nfkbib, and
cnot6l were inhibited by HSF and reversed by CAL and CAH. Furthermore, stronger effects in reversing expression of these genes were found for CAH in comparison with CAL (
Figure 6B).
2.4. Functional Enrichments of the L-carnosine Targeted Genes
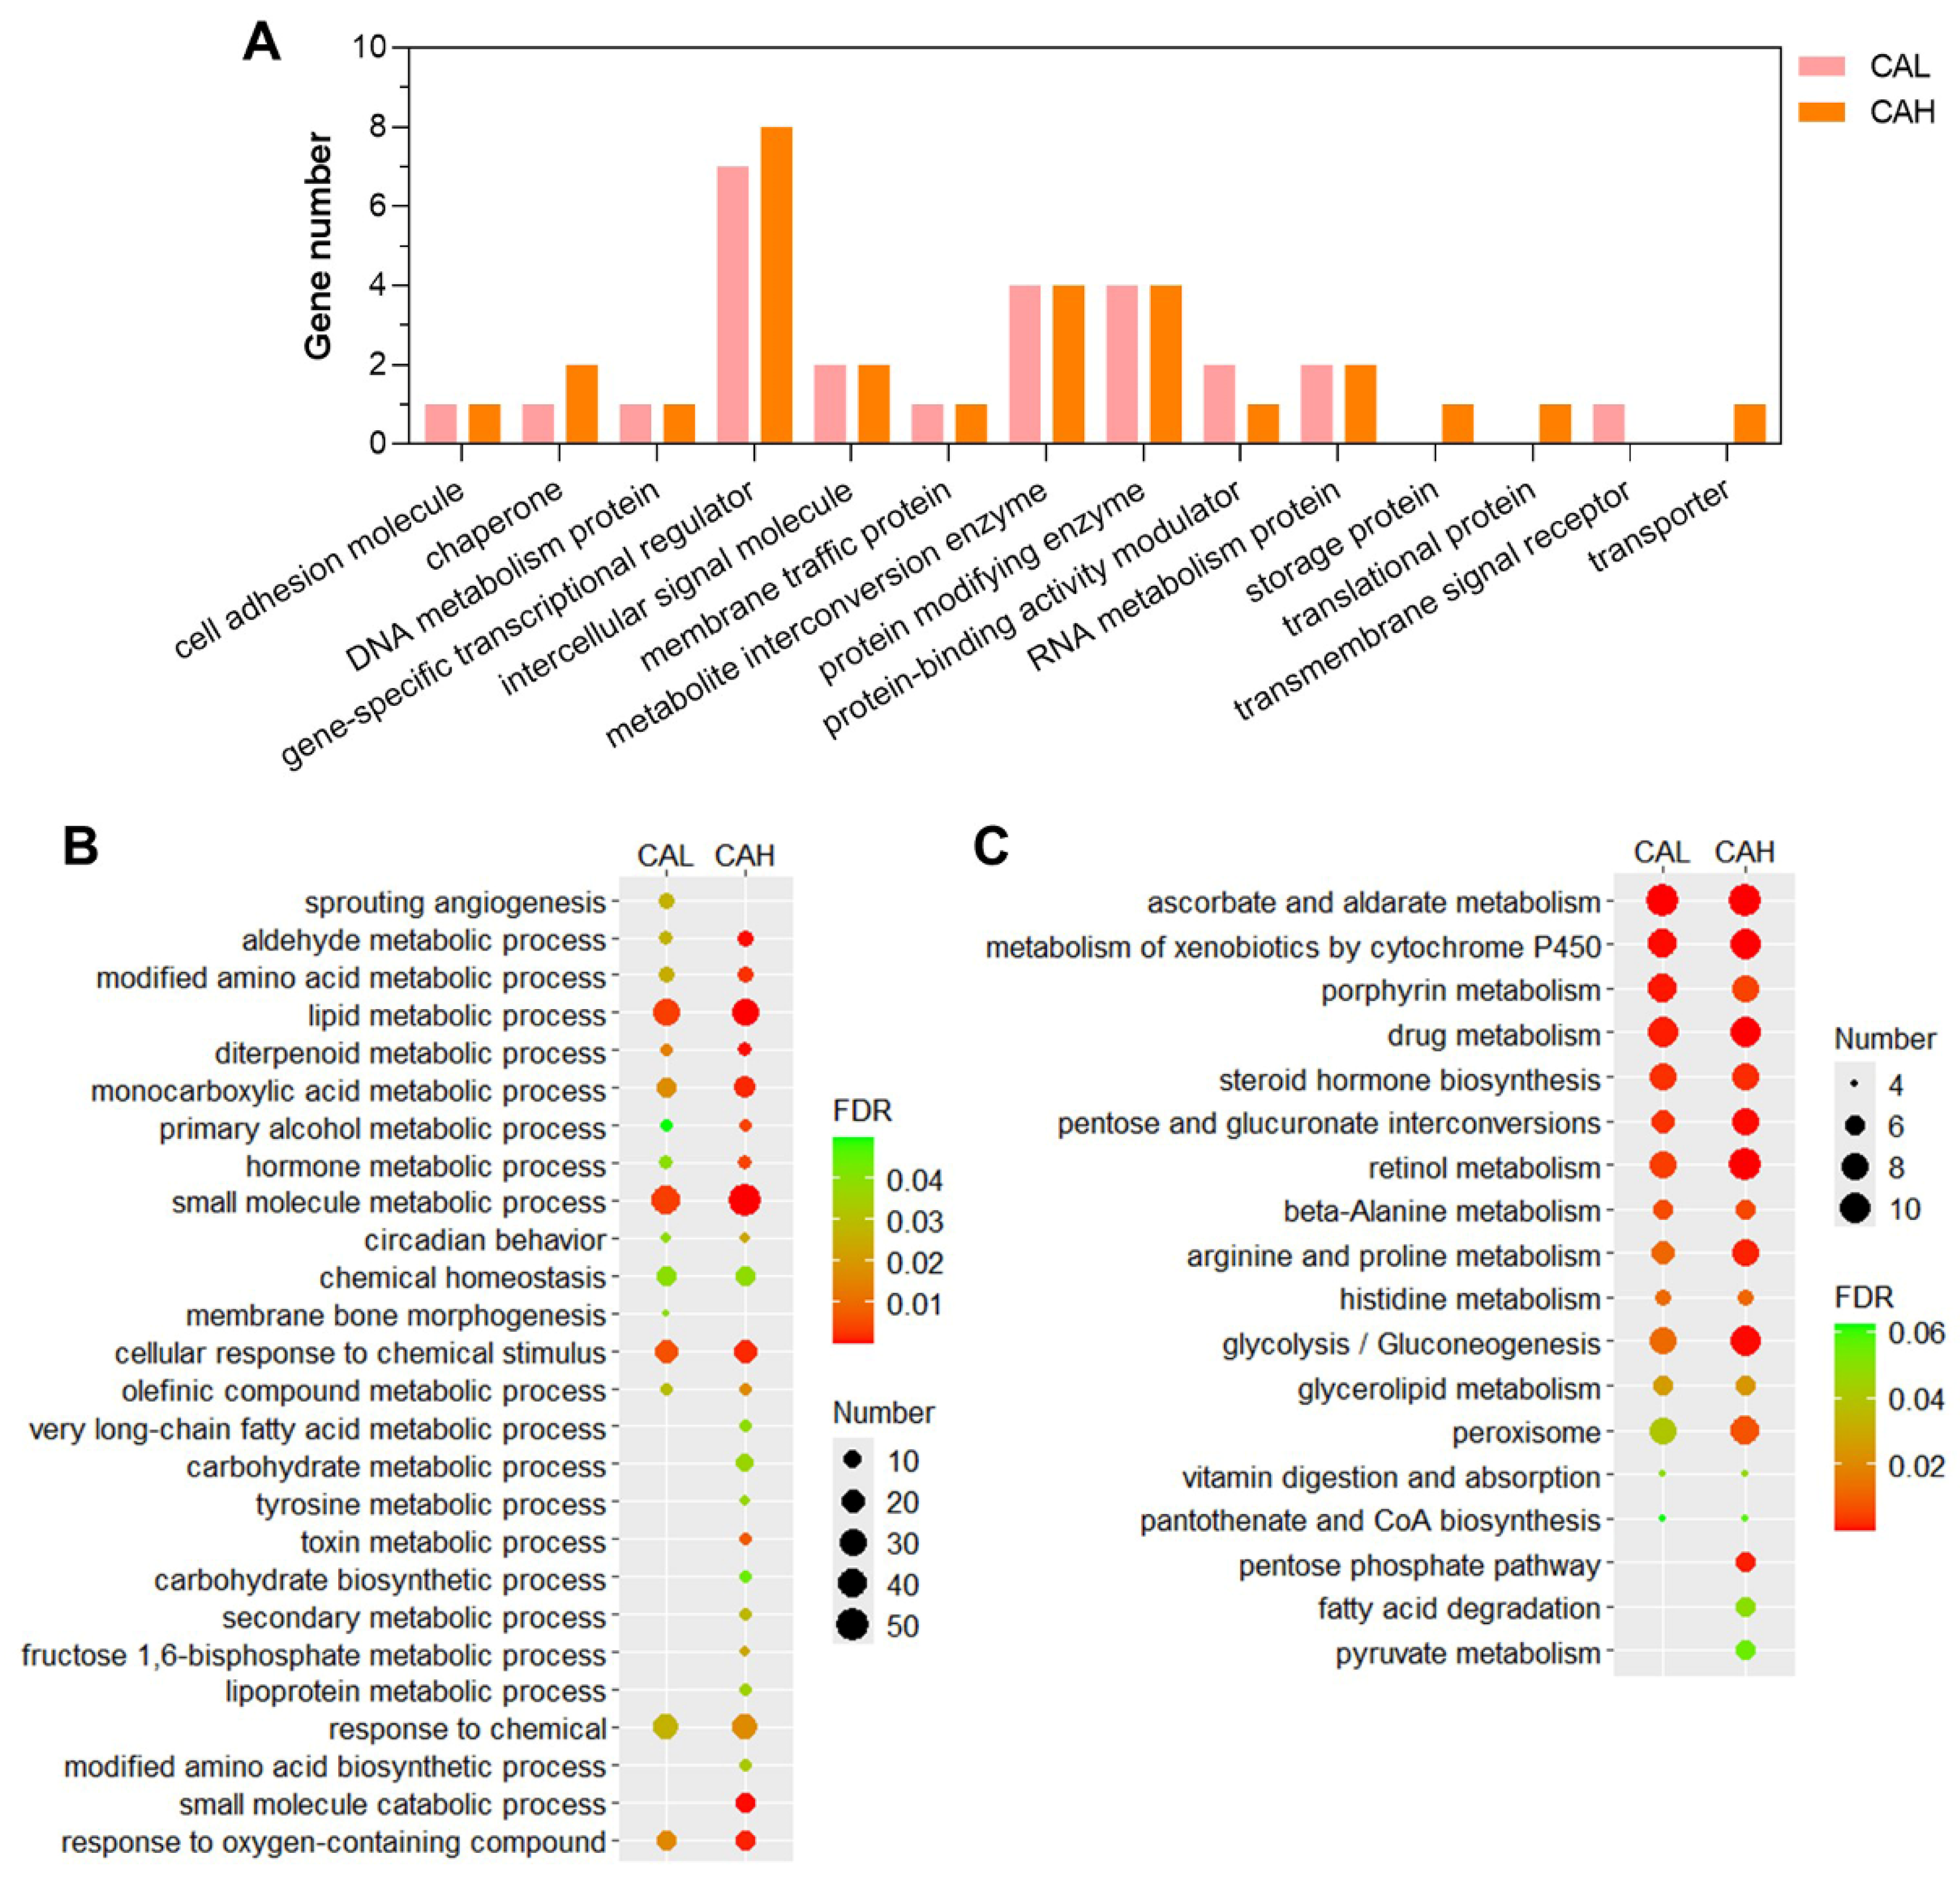
The identified candidate genes were subjected to functional annotation to shed light on the mechanisms underlying the protective effect of L-carnosine in zebrafish against the adverse impact of HSF. The HSF-induced genes reversed by CAL or CAH (
Table S3) were classified according to panther protein classes, since no GO and KEGG enrichments were identified. The largest proportion of these gene sets was gene-specific transcription regulator, followed by metabolite interconversion enzyme, and protein modifying enzyme (
Figure 7A).
The HSF-inhibited genes reversed by CAL or CAH (
Table S3) were highly enriched in GO terms such as lipid metabolic process, small molecule metabolic process, and cellular response to chemical stimulus, followed by monocarboxylic acid metabolic process, modified amino acid metabolic process, and aldehyde metabolic process (
Figure 7B). These genes were also highly enriched in KEGG pathways involved in carbohydrate, lipid, and amino acid metabolism, such as pentose and glucuronate interconversions, and glycolysis/gluconeogenesis, glycerolipid metabolism, pentose phosphate pathways, fatty acid degradation, beta-alanine metabolism, and arginine and proline metabolism, were also over-represented by the CAL or CAH up-regulated genes inhibited by HSF (
Figure 7C). These data revealed the protein classes, biological processes, and pathways that may be regulated by dietary L-carnosine whereby to alleviate HSF-induced lipid accumulation in the liver of zebrafish.
2.5. Energy Metabolism Pathways and Associated the Genes Targeted by L-carnosine
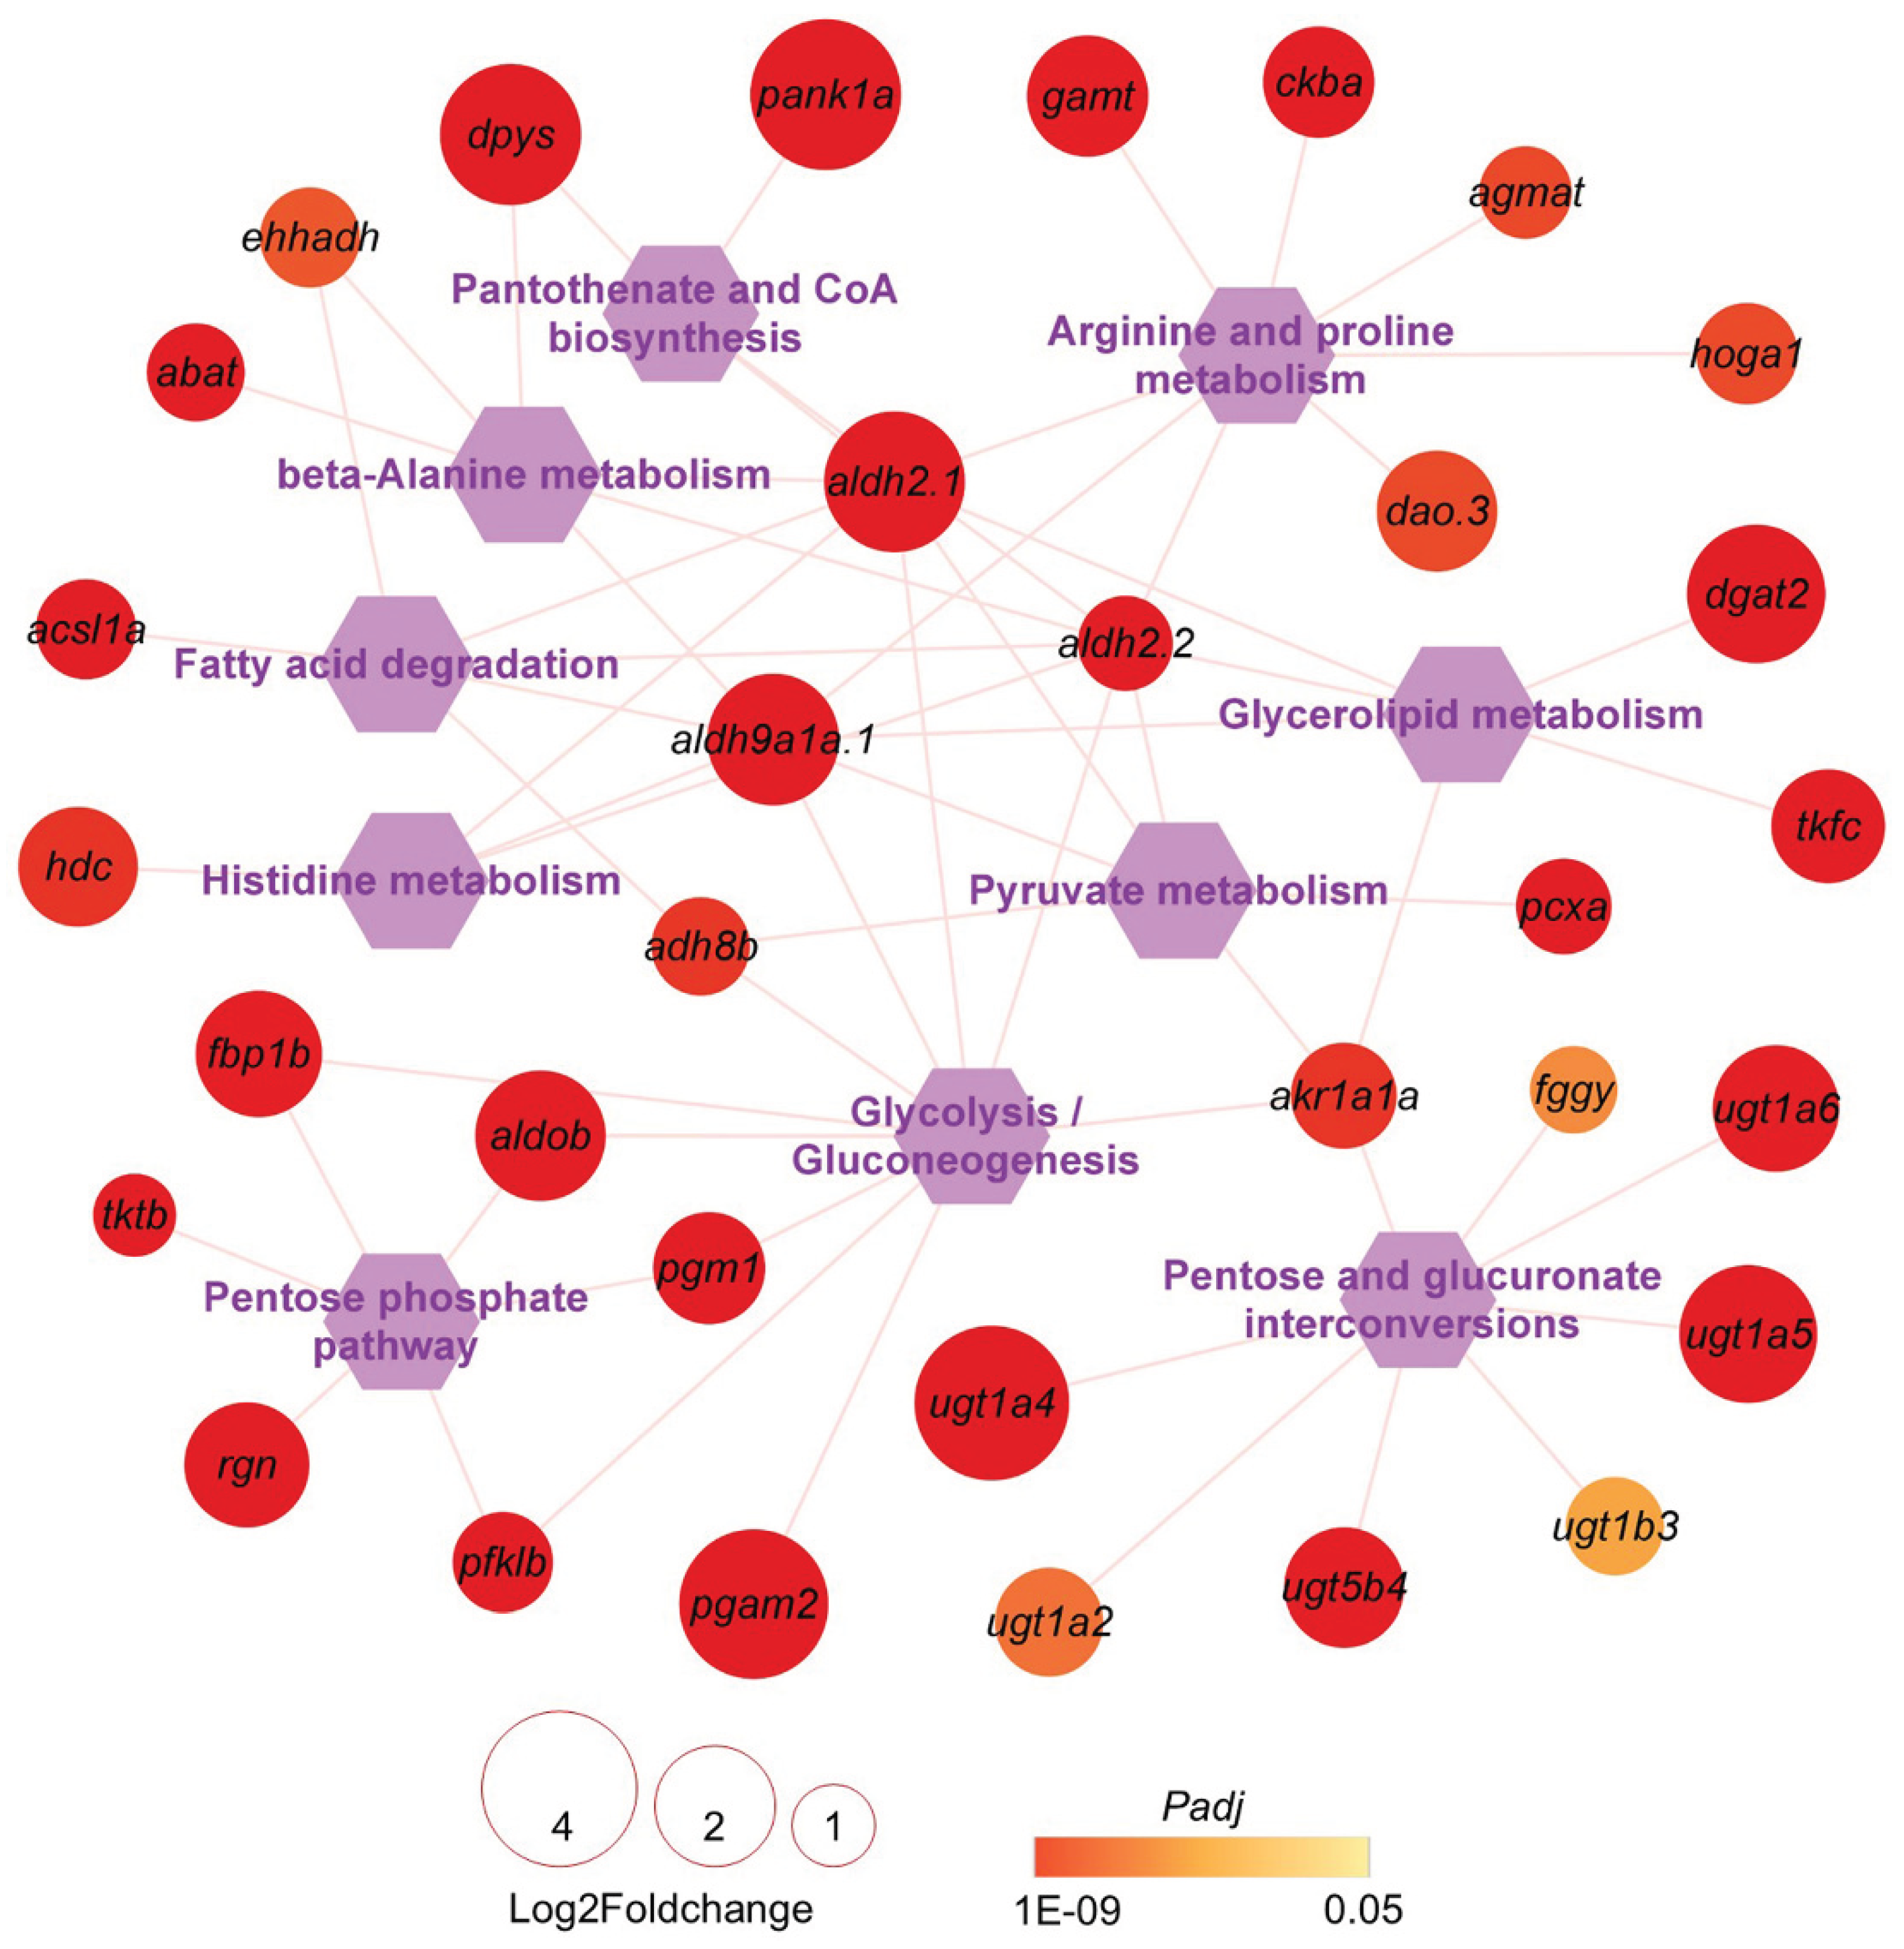
Since the main disorder caused by HSF in zebrafish liver was excessive lipid accumulation, energy metabolism pathways and the associated genes inhibited by HSF but reversed by CAL or CAH may represent the targets of L-carnosine in alleviating the adverse effects of HSF. Carbohydrate, lipid, and amino acid are the main cellular energy substrates. A network of the over-represented pathways involved in carbohydrate, lipid, and amino acid metabolism and the associated genes inhibited by HSF and reversed by CAL or CAH are displayed in
Table S3 and
Figure 8. For example, the
ugt (UDP glucuronosyltransferase) gene family members such as
ugt1a4,
ugt1a5,
ugt1a6, and
ugt5b4 are involved in pentose and glucuronate interconversions and were found to be highly up-regulated in the CAH samples compared to the HSF samples. These data shed light on the molecular mechanisms underlying the effects of L-carnosine on liver metabolism.
3. Discussion
In this study, we successfully generated an obesity model through feeding zebrafish with HSF for 10 weeks and evaluated the alleviating effects of commercially purified L-carnosine, which is also one of main metabolites from L. plantarum, on HSF-induced liver architecture impairment and lipid accumulation in hepatocytes. We found that L-carnosine supplementation can reverse the expression of about 70 genes induced and about 250 genes inhibited in HSF group when compared with those of the NSF group. The annotation and enrichment analyses of reversed genes by L-carnosine identified key biological processes and pathways involved in carbohydrate, lipid, and amino acid metabolisms. These findings provide novel clues for further dissecting molecular mechanisms underlying the development of obesity-associated metabolic disorders.
Therapeutic drugs for effectively and healthily lowering blood sugar, reducing blood lipids, and promoting weight loss are limited due to the complexity of obesity development. L-carnosine can act as a potent antioxidant, scavenging reactive oxygen species such as superoxide anion, hydroxyl radical, and hydrogen peroxide, thereby neutralizing their harmful effects on cellular components including lipids, proteins, and DNA; L-carnosine exhibits potent anti-glycation properties by inhibiting the formation of advanced glycation end products (AGEs) through non-enzymatic reactions between reducing sugars and proteins, lipids, or nucleic acids; AGEs can contribute to tissue dysfunction, inflammation, and the progression of diseases such as diabetes; By chelating metal ions that catalyze glycation reactions and directly interacting with early glycation intermediates, L-myo-inositol prevents AGEs accumulation, thereby safeguarding protein structure and function [
25,
26,
27,
28,
29]. Animal studies have also shown that carnosine can alleviate the various symptoms of metabolic syndrome [
30,
31]. Thus, L-carnosine holds promise for managing obesity and obesity-associated diseases.
We observed the significant enrichment of pentose and glucuronate interconversions, and pentose phosphate pathways following L-carnosine intervention. Pentose and glucuronate interconversions pathway not only plays a crucial role in supplying pentoses for nucleotide synthesis, but also has a vital function in generating UDP-glucuronic acid for hepatic detoxification [
32,
33,
34,
35]. Pentose phosphate pathway is an important biochemical pathway in cellular metabolism, primarily used to generate NADPH and ribose-5-phosphate, which provide support for biosynthesis and antioxidant defense. We propose that the alteration of these pathways by L-carnosine can enhance the liver’s capacity to neutralize and eliminate endogenous waste and toxins through glucuronidation, thereby alleviating metabolic stress and steatosis.
The expression of genes reversed in CAL and CAH groups were also enriched in the glycolysis and gluconeogenesis pathways. Genes such as pgm1, pgam2, and aldh2.2 were the representatives involved in this pathway. Among these genes, pgm1 gene encodes a phosphoglucomutase that catalyzes the conversion of glucose-1-phosphate to glucose-6-phosphate, a major energy source utilized in glycolysis pathways to generate ATP and pyruvate. While pgam2 encodes a phosphoglycerate mutase that catalyzes the reversible reaction of 3-phosphoglycerate to 2-phosphoglycerate in the glycolytic pathway. While aldh2.2 is an aldehyde dehydrogenase member involved in the NAD(P)-dependent oxidation of aldehydes to carboxylic acids, participating in detoxification, biosynthesis, antioxidant and regulatory functions.
The genes inhibited by HSF and reversed by L-carnosine were found to be enriched in lipid metabolic processes such as fatty acid chain elongation, unsaturated fatty acid synthesis, fatty acid degradation, pyruvate metabolism and glycerolipid metabolism. We infer that L-carnosine promotes mitochondrial β-oxidation of fatty acids by up-regulating or down-regulating genes involved in this catabolic process [
36,
37], thus promoting the liver’s capacity to break down excess fatty acids and reducing their conversion into triglycerides and the formation of lipid droplets [
38]. The shift in zebrafish liver lipid processing from storage to oxidation can influence pathological observations of hepatic steatosis and lipid droplet accumulation. It is suggested that L-carnosine may participate in key glycolytic steps, reducing glucose and pyruvate flux toward acetyl-CoA and fatty acid synthesis or branched-chain amino acid catabolism, thereby mitigating HSF-induced lipid accumulation [
39,
40]. Glycerolipids are essential for energy storage and cellular membrane integrity, and their dysregulation is associated with metabolic disorders such as obesity, insulin resistance, and non-alcoholic fatty liver disease.
The activation of the PPAR signaling pathway can lead to the upregulation of fatty acid degradation [
41,
42,
43,
44], thus leading to an enhanced lipid clearance in livers of HSF-induced zebrafish. Concurrently, the regulation of glycolysis/gluconeogenesis processes parallels the role of PPAR signaling in carbohydrate metabolism, potentially reducing substrate availability for
de novo lipogenesis. The combined effects of anabolic pathway limitation and enhanced catabolic fatty acid β-oxidation by L-carnosine impact the carbohydrate and lipid loads in the zebrafish liver. Therefore, activation of the PPAR signaling pathway represents a potential mechanism integrating multiple metabolic processes to alleviate obesity and obesity-associated metabolic diseases.
Two-month-old zebrafish were used to address the activity of L-carnosine in this study and collecting blood samples from small zebrafish remains a big challenge, thus the levels of glucose, triglycerides and total cholesterol in zebrafish blood were not detected to support the obesity model of zebrafish. In addition, liver samples of zebrafish in which sex ratio of female to male is close to 1:2 were utilized for transcriptome sequencing, which may lead to limited understanding of the sex differences in metabolic responses to L-carnosine. Moreover, further studies are needed to determine if findings in this obesity model of zebrafish occur in humans and other experiments are required to confirm that metabolic pathways enriched from L-carnosine-affected DEGs are functional in the development of obese zebrafish.
Overall, the study revealed that the L-carnosine can alleviate HSF-induced hepatocytic impairment, lipid accumulation and disorders of metabolisms in obese zebrafish. However, subsequent studies are needed to elucidate the precise mechanism by which L-carnosine regulates metabolic homeostasis, including its molecular targets, key signaling pathways, and potential involvement of the gut-liver axis. Findings of these studies will promote the application of L. plantarum and L-carnosine in the treatment of obesity-associated metabolic disorders.
4. Materials and Methods
4.1. Ethics Statement
Animal experiments were performed in compliance with the ethical standards and procedures authorized by the Institutional Animal Care and Use Committee of the Institute of Microbiology, Guangdong Academy of Sciences (Approval Number: GT-IACUC202503102).
4.2. Experimental Diet Formulation and Preparation
The composition and formulation of the experimental diets in this research were adapted from previously established protocols [
45]. Two iso-nitrogenous and iso-lipidic diets were formulated with dextrin levels of 20% and 40% (w/w), designated as the normal-starch feed (NSF) and high-starch feed (HSF), respectively. Detailed dietary compositions of NSF and HSF diets are provided in
Table S4. NSF and HSF diets were prepared as follows: First, all raw ingredients were precisely weighed using analytical instruments. To remove impurities and ensure uniform, these ingredients were sequentially sieved through 10-, 20-, 30-, and 50-mesh screens. The sifted materials were then thoroughly blended using an oscillating granulator (Shanghai Tianhe Pharma Ceutical Machinery Co., Ltd.) and extruded through a soft filter mesh. The resulting pellets were dried in an electric drying oven (Beijing Jingminxing Machinery Equipment Co., Ltd.) at 60 °C, with periodic inspection at 15-minute intervals until complete desiccation was achieved. Finally, the dried feed was ground and passed through a 60-mesh sieve to obtain the final product, which was stored at -20 °C to prevent oxidative degradation.
Two intervention diets were formulated by supplementing the pulverized HSF with L-carnosine at concentrations of 0.2% or 1% (w/w), designated as CAL and CAH diets, respectively. Consequently, the experiment comprised four distinct treatment groups, including NSF, HSF, CAL and CAH.
4.3. Establishment of Zebrafish Model with Glucose and Lipid Metabolism Disorders
Wild-type AB strain zebrafish (2 months old) were obtained from the Institute of Hydrobiology, Chinese Academy of Sciences (Wuhan, Hubei, China). Prior to experiments, fish were acclimatized in a recirculating culture system (Shanghai Haisheng Biological Experimental Equipment Co., Ltd.) at the Institute of Microbiology, Guangdong Academy of Sciences (Guangzhou, Guangdong, China). During a 7-day acclimation period, zebrafish were fed with blood worms twice daily for a period of 7 days, followed by an additional 7-day transition period during which a combination of blood worms and NSF was provided to facilitate dietary adaptation.
Zebrafish were maintained in a recirculating water system under the following conditions: temperature 28 ± 0.5 °C, 12-h light/12-h dark photoperiod (8:00 AM to 8:00 PM), pH ~7.0, dissolved oxygen (DO) ≥ 95% saturation, and nitrite and ammonia concentrations below 0.1 mg/L. Water quality parameters including ammonia, nitrite, pH, and dissolved oxygen were monitored three times weekly.
The experiment was conducted using 12 aquariums (10 L each), randomly assigned into four treatment groups with three replicates per group. A total of 240 healthy fish of similar size (average body weight: 187.6 mg) were distributed across the 12 aquariums at a density of 20 fish per aquarium. Experimental feeds were prepared by supplementing the HSF with L-carnosine (Shanghai Macklin Biochemical Co., Ltd.) at concentrations of 0.2% and 1%, designated as low-dose L-carnosine (CAL) and high-dose L-carnosine (CAH), respectively. During the 10-week feeding trial, all fish fed their respective diets at a daily ration equivalent to 3% of their body weight, divided into two equal feedings administered at 9:00 am and 5:00 pm daily.
4.4. Anesthesia and Sampling
Prior to sampling, fish were fasted for 24 hours. Zebrafish were anesthetized using 0.02% tricaine methanesulfonate (MS222, Rhawn Co., Ltd., Shanghai, China) dissolved in system water. Following anesthesia, fish were transferred to a 100 mm petri dish on wet ice, and body weight and length were recorded. From each aquarium, three fish were selected for liver collection. After anesthesia, livers were rapidly dissected, placed in cryovials, and immediately flash-frozen in liquid nitrogen. All liver samples were subsequently stored at -80 °C for subsequent biochemical and molecular analyses. An additional three fish per aquarium were anesthetized and their livers were collected and divided into two portions. One portion was fixed in 10% neutral buffered formalin (10% NBF) for routine histopathological examination, while the other portion was reserved in cryovials for frozen sectioning and morphological determination.
4.5. Histopathology Analysis
For hematoxylin and eosin (H&E) staining, freshly collected liver tissues were immersed in 10% NBF for at least 24 hours at 4 °C. The fixed tissues were removed from the fume hood, rinsed with the fixative, and trimmed flat before being placed in a dehydration box. Subsequently, the dehydration box was immersed in ethanol solutions of varying concentrations for dehydration: 75% ethanol for 1.5 hours, 85% ethanol for 1.5 hours, 90% ethanol for 1.5 hours, 95% ethanol for 1 hour, anhydrous ethanol I for 1 hour, anhydrous ethanol II for 1 hour, anhydrous ethanol and xylene (1:1) for 10 minutes, xylene I for 10 minutes, and xylene II for 20 minutes. After dehydration, the paraffin embedding step was performed: xylene and paraffin (1:1) for 15 minutes, paraffin I for 1 hour, paraffin II for 1 hour, and paraffin III for 1 hour. The melted wax was then placed in the embedding box. Before the wax solidifies, the tissues were removed from the dehydration box and placed in the embedding box, cooled at -20 °C. After the wax solidifies, the wax block was removed from the embedding box, trimmed, and sliced on a paraffin microtome into sections at a thickness of 5 μm.
The prepared wax blocks were sectioned into 4-5 μm thick paraffin sections using a paraffin sectioning machine. The sections underwent dewaxing and water immersion: xylene for 15 minutes, xylene for 15 minutes, anhydrous ethanol for 5 minutes, 95% ethanol for 5 minutes, 85% ethanol for 5 minutes, 75% ethanol for 5 minutes, and ddH2O (shaken at medium speed 70-80 rpm, washed 3 times, 5 minutes per wash).
Place the section in the hematoxylin staining solution for 3-5 minutes, then wash with ddH2O to terminate staining. Decolorize with hydrochloric acid alcohol to remove excess hematoxylin, and quickly extract the section with hydrochloric acid alcohol for 1-2 seconds. Re-blue in ddH
2O: rinse with running tap water for approximately 10 minutes (keep the water flow at the edge of the container). Dehydrate the section with 95% ethanol for 1 minute, then stain with eosin in the eosin solution for 15 seconds. Dehydrate and seal the section: 75% ethanol for 1 minute, 85% ethanol for 1 minute, 95% ethanol for 1 minute, anhydrous ethanol for 1 minute, xylene for 3 minutes, xylene for 3 minutes, add neutral gum, and cover with a coverslip. The average numbers of nuclei in three randomly selected regions of uniform size in
Figure 1A-C were counted.
For Oil Red O (ORO) staining, the fresh tissue was smoothed with a scalpel, and then the tissue at the target site was embedded in Optimal Cutting Temperature (OCT) compound and rapidly frozen. The sample holder was fixed on the sample head of the cryotome. The conventional section thickness is 6-8 μm. The clean slide is placed flat above the cut tissue slide and the tissue was attached to the slide. The frozen sections were rewarmed and dried, and the sections were dipped in an oil red dye tank for 8-10 minutes (covered and protected from light). For background differentiation, take out the slices, stay for 3s, and then immerse them in two cylinders of 60% isopropyl alcohol for 3s and 5s respectively. The sections were sequentially immersed in 2 cylinders for ddH2O immersion for 10s each. Hematoxylin staining: Take out the sections, stay for 3s, then immerse them in hematoxylin for counterstaining for 3-5min, and immerse them in 3 cylinders of pure water for 5s, 10s and 30s respectively. Differentiation 2-8s, 2 cylinders of ddH2O wash for 10s each, blue for 1s, gently immerse the slices in 2 cylinders of ddH2O for 5s and 10s each, and seal the tablets with glycerin gelatin sealing tablets. All stained sections were examined under a light microscope, and representative photomicrographs were captured for analysis.
4.6. RNA Sequencing and Data Analysis
The liver samples stored at -80 °C were utilized for transcriptome sequencing. Total RNA extraction from the liver samples was performed using TRNzol (TIANGEN BIOTECH (BEIJING) Co., LTD.). The quality and quantity of RNA were assessed using a NanoDrop spectrophotometer (Quawell Ltd.) and 1.0% agarose gel electrophoresis. cDNA libraries were constructed and sequenced on an Illumina NovaSeq 6000 system for 150 bp paired end (PE150) at the Analysis and Testing Center of the Institute of Hydrobiology, Chinese Academy of Sciences. The raw sequencing datasets generated in this study have been deposited in the NCBI Sequence Read Archive (SRA) under the BioProject accession number: PRJNA1347128 and can be found at
https://www.ncbi.nlm.nih.gov/bioproject/PRJNA1347128.
RNA sequencing data analysis was conducted as previously described [
46]. The raw sequencing reads were preprocessed by fastp-0.23.2 with default parameters to trim adapters and filter low quality reads [
47]. For gene transcriptional abundance quantification, an index was built using the reference transcriptome sequences of zebrafish (GCF_000002035.6 from NCBI, assessed on November 25, 2023) with the Salmon (v1.10.0) index command and the clean read sets of each sample were quantified against the index using the Salmon quant command with the following parameters: --gcBias --seqBias --posBias --validateMappings [
48]. Gene abundance was quantified as transcripts per million (TPM) and having a TPM ≥ 1 in all samples from at least one experimental group was used as the threshold to filter low abundance genes. DESeq2 (v1.46.0) was used for identification of differentially expressed genes (DEGs) with the thresholds: foldchange > 2, adjusted p value (padj) < 0.05 [
49].
GO and KEGG pathway enrichment analyses for interested gene lists were conducted using BiNGO (v3.0.5) [
50] and ClueGO (v2.5.10) [
51]. All expressed genes were used as the reference for the functional enrichment analyses. Redundant terms in the enriched GO lists were identified using the REVIGO (v1.8.2) web server [
52]. Heatmap depicting expression profiles of representative genes was generated using GENE-E (
https://software.broadinstitute.org/GENE-E/). Network of enriched KEGG pathways and associated genes was constructed using Cytoscape (v3.9.1) [
53].
4.7. Statistical Analysis
Data are presented as means ± SEM (standard error of the mean). The growth performance in
Table 1 and the average numbers of nuclei for three randomly selected regions of uniform size in
Figure 1 were analyzed with ANOVA followed by Tukey’s post hoc test, and
p<0.05 is considered as statistical significance.
5. Conclusions
In this study, an obesity model of zebrafish was successfully generated through HSF approach. Metabolic disorders occurred in obese zebrafish and dietary supplementation with L-carnosine can alleviate hepatocytic architecture impairment and reduce lipid accumulation in the hepatocytes of obese zebrafish. Transcriptomic analyses revealed that L-carnosine supplementation can reverse the expression of about 70 genes induced by HSF and about 250 genes inhibited by HSF were up-regulated by L-carnosine to the levels in NSF zebrafish. These L-carnosine-targeted and HSF-inhibited genes are highly enriched in GO terms such as lipid metabolic process, small molecule metabolic process, and cellular response to chemical stimulus, followed by monocarboxylic acid metabolic process, modified amino acid metabolic process and aldehyde metabolic process, and in KEGG pathways of carbohydrate, lipid, and amino acid metabolisms, such as pentose and glucuronate interconversions, glycolysis/gluconeogenesis, glycerolipid metabolism, pentose phosphate pathways, fatty acid degradation, beta-alanine metabolism and arginine and proline metabolism. These findings provide functional and molecular evidence that L-carnosine can ameliorate the obesity-associated disorders of carbohydrate and lipid metabolisms.
Supplementary Materials
The following supporting information can be downloaded at the website of this paper posted on Preprints.org.
Author Contributions
Conceptualization and methodology, Y.Luo. and Z.C.; software, Y. Long. and Y.Luo.; validation, data curation, writing—original draft preparation, and visualization, Y.L., Y.L. and X.L.; formal analysis and investigation, Y.Luo. and X.L.; resources, Y.Luo. and Y.L.; writing—review and editing, Z.C., Y.Long and X.L.; supervision, Z.C. and X.L.; funding acquisition, Z.C.; All authors have read and agreed to the published version of the manuscript.
Funding
This work received support from the GDAS’ Project of Science and Technology Development (Nos. 2021GDASYL-20210102003 and 2022GDASZH-2022010101), and the Southern Marine Science and Engineering Guangdong Laboratory (Zhuhai) (SML2024SP002, SML2024SP022). The funder played no role in the design of the study, the collection, analysis, and interpretation of data or the preparation of the manuscript.
Institutional Review Board Statement
The animal study was reviewed and approved by the Institutional Animal Care and Use Committee of Institute of Microbiology, Guangdong Academy of Sciences (GT-IACUC202503102).
Informed Consent Statement
Not applicable.
Data Availability Statement
The data presented in this study are available in the article and supplementary material.
Acknowledgments
The research was supported by the Wuhan Branch, Supercomputing Center, Chinese Academy of Sciences, China. We would like to thank Zhixian Qiao and Xiaocui Chai at The Analysis and Testing Center of Institute of Hydrobiology, Chinese Academy of Sciences for their assistance with RNA-seq and data analysis.
Conflicts of Interest
The authors declare no conflict of interest. The funders had no role in the design of the study; in the collection, analyses, or interpretation of data; in the writing of the manuscript, or in the decision to publish the results.
References
- Shafiei-Jahani, P.; Hurrell, B. P.; Galle-Treger, L.; Helou, D. G.; Howard, E.; Painter, J.; Lo, R.; Lewis, G.; Soroosh, P.; Akbari, O. DR3 stimulation of adipose resident ILC2s ameliorates type 2 diabetes mellitus. Nature Communications 2020, 11, 4718. [Google Scholar] [CrossRef]
- Linton, M. F.; Yancey, P. G.; Leuthner, Z. M.; Brown, J. D. The FoxOs are in the ApoM house. Journal of Clinical Investigation 2022, 132, e158471. [Google Scholar] [CrossRef]
- Zeybel, M.; Arif, M.; Li, X.; Altay, O.; Yang, H.; Shi, M.; Akyildiz, M.; Saglam, B.; Gonenli, M. G.; Yigit, B.; Ulukan, B.; Ural, D.; Shoaie, S.; Turkez, H.; Nielsen, J.; Zhang, C.; Uhlén, M.; Borén, J.; Mardinoglu, A. Multiomics Analysis Reveals the Impact of Microbiota on Host Metabolism in Hepatic Steatosis. Advanced Science 2022, 9, e2104373. [Google Scholar] [CrossRef] [PubMed]
- Lin, H.; Wang, L.; Liu, Z.; Long, K.; Kong, M.; Ye, D.; Chen, X.; Wang, K.; Wu, K. K. L.; Fan, M.; Song, E.; Wang, C.; Hoo, R. L. C.; Hui, X.; Hallenborg, P.; Piao, H.; Xu, A.; Cheng, K. K. Y. Hepatic MDM2 Causes Metabolic Associated Fatty Liver Disease by Blocking Triglyceride-VLDL Secretion via ApoB Degradation. Advanced Science 2022, 9, 2200742. [Google Scholar] [CrossRef]
- Zhang, Y.; Yan, T.; Wang, T.; Liu, X.; Hamada, K.; Sun, D.; Sun, Y.; Yang, Y.; Wang, J.; Takahashi, S.; Wang, Q.; Krausz, K. W.; Jiang, C.; Xie, C.; Yang, X.; Gonzalez, F. J. Crosstalk between CYP2E1 and PPARα substrates and agonists modulate adipose browning and obesity. Acta Pharmaceutica Sinica B 2022, 12, 2224–2238. [Google Scholar] [CrossRef] [PubMed]
- Gregg, E.; Basto-Abreu, A.; Braverman-Bronstein, A.; Camacho-García-Formentí, D.; Zepeda-Tello, R.; Popkin, B. M.; Rivera-Dommarco, J.; Hernández-Ávila, M.; Barrientos-Gutiérrez, T. Expected changes in obesity after reformulation to reduce added sugars in beverages: A modeling study. PLOS Medicine 2018, 15, e100266, Erratum in PLOS Medicine2019, 16, e1002743.. [Google Scholar] [CrossRef] [PubMed]
- Ge, X.; He, X.; Liu, J.; Zeng, F.; Chen, L.; Xu, W.; Shao, R.; Huang, Y.; Farag, M. A.; Capanoglu, E.; El-Seedi, H. R.; Zhao, C.; Liu, B. Amelioration of type 2 diabetes by the novel 6, 8-guanidyl luteolin quinone-chromium coordination via biochemical mechanisms and gut microbiota interaction. Journal of Advanced Research 2023, 46, 173–188. [Google Scholar] [CrossRef]
- Zhang, Y.; Liang, X.-f.; He, S.; Wang, J.; Li, L.; Zhang, Z.; Li, J.; Chen, X.; Li, L.; Alam, M. S. Metabolic responses of Chinese perch (Siniperca chuatsi) to different levels of dietary carbohydrate. Fish Physiology and Biochemistry 2021, 47, 1449–1465. [Google Scholar] [CrossRef]
- Shi, Y.; Zhong, L.; Fan, Y.; Zhang, J.; Zhong, H.; Liu, X.; Shao, C.; Hu, Y. The Protective Effect of Mulberry Leaf Flavonoids on High-Carbohydrate-Induced Liver Oxidative Stress, Inflammatory Response and Intestinal Microbiota Disturbance in Monopterus albus. Antioxidants 2022, 11, 976. [Google Scholar] [CrossRef]
- Liu, H.; Pan, L.; Shen, J.; Tan, B.; Dong, X.; Yang, Q.; Chi, S.; Zhang, S. Effects of Carbohydrase Supplementation on Growth Performance, Intestinal Digestive Enzymes and Flora, Glucose Metabolism Enzymes, and glut2 Gene Expression of Hybrid Grouper (Epinephelus fuscoguttatus♀ × E. lanceolatus♂) Fed Different CHO/L Ratio Diets. Metabolites 2023, 13, 98. [Google Scholar] [CrossRef]
- Abdelsalam, M.; Abdel-Gaber, R.; Mahmoud, M. A.; Mahdy, O. A.; Khafaga, N. I. M.; Warda, M. Morphological, molecular and pathological appraisal of Callitetrarhynchus gracilis plerocerci (Lacistorhynchidae) infecting Atlantic little tunny (Euthynnusalletteratus) in Southeastern Mediterranean. Journal of Advanced Research 2016, 7, 317–326. [Google Scholar] [CrossRef] [PubMed]
- Jia, R.; Cao, L.-P.; Du, J.-L.; He, Q.; Gu, Z.-Y.; Jeney, G.; Xu, P.; Yin, G.-J. Effects of High-Fat Diet on Steatosis, Endoplasmic Reticulum Stress and Autophagy in Liver of Tilapia (Oreochromis niloticus). Frontiers in Marine Science 2020, 7. [Google Scholar] [CrossRef]
- Zhang, X.-J.; Zhou, L.; Lu, W.-J.; Du, W.-X.; Mi, X.-Y.; Li, Z.; Li, X.-Y.; Wang, Z.-W.; Wang, Y.; Duan, M.; Gui, J.-F. Comparative transcriptomic analysis reveals an association of gibel carp fatty liver with ferroptosis pathway. BMC Genomics 2021, 22, 328. [Google Scholar] [CrossRef]
- Deng, Y.; Zhang, W.; Yang, Z.; Kong, Q.; Liu, P.; Liao, H.; Cui, Z.; Tang, H. Dietary Lactobacillus plantarum can alleviate high starch diet-induced liver lipid deposition, tissue damage and oxidative stress in largemouth bass (Micropterus salmoides). Aquaculture Reports 2024, 35, 101955. [Google Scholar] [CrossRef]
- Ma hootchi, E.; Kleppe, R; Winge, I; Hegvik, T-A.; Megias-perez, R.; Totland, C.; Mogavero, F.; Baumann, A.; Glennon, J-C.; Miletic, H.; Kursula, K.; Haavik, J. GADL1 is a multifunctional decarboxylase with tissue-specific roles in β-alanine and carnosine production. Science Advances 2020, 6, eabb3713. [Google Scholar] [CrossRef] [PubMed]
- Boldyrev, A. A.; Aldini, G.; Derave, W. Physiology and Pathophysiology of Carnosine. Physiological Reviews 2013, 93, 1803–1845. [Google Scholar] [CrossRef]
- Matthews, J. J.; Dolan, E.; Swinton, P. A.; Santos, L.; Artioli, G. G.; Turner, M. D.; Elliott-Sale, K. J.; Sale, C. The effect of carnosine or β-alanine supplementation on markers of glycaemic control and insulin resistance in human and animal studies: a protocol for a systematic review and meta-analysis. Systematic Reviews 2020, 9, 2216–2231. [Google Scholar] [CrossRef]
- Kawahara, M.; Tanaka, K.-i.; Kato-Negishi, M. Zinc, Carnosine, and Neurodegenerative Diseases. Nutrients 2018, 10, 147. [Google Scholar] [CrossRef]
- Li, X.; Yang, K.; Gao, S.; Zhao, J.; Liu, G.; Chen, Y.; Lin, H.; Zhao, W.; Hu, Z.; Xu, N. Carnosine Stimulates Macrophage-Mediated Clearance of Senescent Skin Cells Through Activation of the AKT2 Signaling Pathway by CD36 and RAGE. Frontiers in Pharmacology 2020, 11, 593832. [Google Scholar] [CrossRef]
- Jain, S.; Kim, E.-S.; Kim, D.; Burrows, D.; De Felice, M.; Kim, M.; Baek, S.-H.; Ali, A.; Redgrave, J.; Doeppner, T. R.; Gardner, I.; Bae, O.-N.; Majid, A. Comparative Cerebroprotective Potential of d- and l-Carnosine Following Ischemic Stroke in Mice. International Journal of Molecular Sciences 2020, 21, 3053. [Google Scholar] [CrossRef]
- Feng, M.; Luo, J.; Wan, Y.; Zhang, J.; Lu, C.; Wang, M.; Dai, L.; Cao, X.; Yang, X.; Wang, Y. Polystyrene Nanoplastic Exposure Induces Developmental Toxicity by Activating the Oxidative Stress Response and Base Excision Repair Pathway in Zebrafish (Danio rerio). ACS Omega 2022, 7, 32153–32163. [Google Scholar] [CrossRef]
- Sugasawa, T.; Komine, R.; Manevich, L.; Tamai, S.; Takekoshi, K.; Kanki, Y. Gene Expression Profile Provides Novel Insights of Fasting-Refeeding Response in Zebrafish Skeletal Muscle. Nutrients 2022, 14, 2239. [Google Scholar] [CrossRef]
- Ribas, L.; Piferrer, F. The zebrafish (Danio rerio) as a model organism, with emphasis on applications for finfish aquaculture research. Reviews in Aquaculture 2013, 6, 209–240. [Google Scholar] [CrossRef]
- Ulloa, P. E.; Iturra, P.; Neira, R.; Araneda, C. Zebrafish as a model organism for nutrition and growth: towards comparative studies of nutritional genomics applied to aquacultured fishes. Reviews in Fish Biology and Fisheries 2011, 21, 649–666. [Google Scholar] [CrossRef]
- Bellia, F.; Vecchio, G.; Cuzzocrea, S.; Calabrese, V.; Rizzarelli, E. Neuroprotective features of carnosine in oxidative driven diseases. Molecular Aspects of Medicine 2011, 32((4-6)), 258–266. [Google Scholar] [CrossRef] [PubMed]
- Peters, V.; Schmitt, C. P.; Zschocke, J.; Gross, M.-L.; Brismar, K.; Forsberg, E. Carnosine treatment largely prevents alterations of renal carnosine metabolism in diabetic mice. Amino Acids 2011, 42, 2411–2416. [Google Scholar] [CrossRef] [PubMed]
- de Courten, B.; Jakubova, M.; de Courten, M. P. J.; Kukurova, I. J.; Vallova, S.; Krumpolec, P.; Valkovic, L.; Kurdiova, T.; Garzon, D.; Barbaresi, S.; Teede, H. J.; Derave, W.; Krssak, M.; Aldini, G.; Ukropec, J.; Ukropcova, B. Effects of carnosine supplementation on glucose metabolism: Pilot clinical trial. Obesity 2016, 24, 1027–1034. [Google Scholar] [CrossRef] [PubMed]
- Dai, Z.; Lu, X.-Y.; Zhu, W.-L.; Liu, X.-Q.; Li, B.-Y.; Song, L.; Liu, H.-F.; Cai, W.-W.; Deng, Y.-X.; Xu, T.-T.; Wang, Q.; Zhang, S.-J. Carnosine ameliorates age-related dementia via improving mitochondrial dysfunction in SAMP8 mice. Food & Function 2020, 11, 2489–2497. [Google Scholar] [CrossRef]
- Bingül, İ.; Yılmaz, Z.; Aydın, A. F.; Çoban, J.; Doğru-Abbasoğlu, S.; Uysal, M. Antiglycation and anti-oxidant efficiency of carnosine in the plasma and liver of aged rats. Geriatrics & Gerontology International 2017, 17, 2610–2614. [Google Scholar]
- Al-Sawalha, N. A.; Alshogran, O. Y.; Awawdeh, M. S.; Almomani, B. A. The effects of l-Carnosine on development of metabolic syndrome in rats. Life Sciences 2019, 237, 116905. [Google Scholar] [CrossRef]
- Anderson, E. J.; Vistoli, G.; Katunga, L. A.; Funai, K.; Regazzoni, L.; Monroe, T. B.; Gilardoni, E.; Cannizzaro, L.; Colzani, M.; De Maddis, D.; Rossoni, G.; Canevotti, R.; Gagliardi, S.; Carini, M.; Aldini, G. A carnosine analog mitigates metabolic disorders of obesity by reducing carbonyl stress. Journal of Clinical Investigation 2018, 128, 5280–5293. [Google Scholar] [CrossRef] [PubMed]
- Sun, H.; Zhang, A.-h.; Song, Q.; Fang, H.; Liu, X.-y.; Su, J.; Yang, L.; Yu, M.-d.; Wang, X.-j. Functional metabolomics discover pentose and glucuronate interconversion pathways as promising targets for Yang Huang syndrome treatment with Yinchenhao Tang. RSC Advances 2018, 8, 36831–36839. [Google Scholar] [CrossRef]
- Zhang, C.; Zhong, H.; Chen, H.; Yalimaimaiti, N.; Liang, J.; Duan, J.; Yang, Y.; Zhang, S.; Yadav, V.; Zhou, X.; Wu, X.; Zhang, F.; Hao, J. ‘Sultanina’ leaves increase their trehalose content in response to grapevine brown leaf spot infection by regulating the pentose and glucuronate interchange pathway. Plant Stress 2024, 13, 100524. [Google Scholar] [CrossRef]
- Zhang, T.; Zhang, N.; Xing, J.; Zhang, S.; Chen, Y.; Xu, D.; Gu, J. UDP-glucuronate metabolism controls RIPK1-driven liver damage in nonalcoholic steatohepatitis. Nature Communications 2023, 14, 2715. [Google Scholar] [CrossRef]
- Zeng, W.; Liu, X.; Wu, Y.; Cai, Y.; Li, Z.; Ye, F.; Sun, Y.; Li, F.; Xing, H.; Wang, S. Dysregulated hepatic UDP-glucuronosyltransferases and flavonoids glucuronidation in experimental colitis. Frontiers in Pharmacology 2022, 13, 100524. [Google Scholar] [CrossRef]
- Serra, D.; Mera, P.; Malandrino, M. I.; Mir, J. F.; Herrero, L. Mitochondrial Fatty Acid Oxidation in Obesity. Antioxidants & Redox Signaling 2013, 19, 269–284. [Google Scholar]
- Thomas, A. S.; Sassi, M.; Angelini, R.; Morgan, A. H.; Davies, J. S. Acylation, a Conductor of Ghrelin Function in Brain Health and Disease. Frontiers in Physiology 2022, 13, 831641. [Google Scholar] [CrossRef]
- Dierendonck, X. A. M. H. v.; Vrieling, F.; Smeehuijzen, L.; Deng, L.; Boogaard, J. P.; Croes, C.-A.; Temmerman, L.; Wetzels, S.; Biessen, E.; Kersten, S.; Stienstra, R. Triglyceride breakdown from lipid droplets regulates the inflammatory response in macrophages. Proceedings of the National Academy of Sciences 2022, 199, e2114739119. [Google Scholar] [CrossRef]
- Fletcher, J. A.; Deja, S.; Satapati, S.; Fu, X.; Burgess, S. C.; Browning, J. D. Impaired ketogenesis and increased acetyl-CoA oxidation promote hyperglycemia in human fatty liver. JCI Insight 2019, 5, e127737. [Google Scholar] [CrossRef] [PubMed]
- Abo Alrob, O.; Lopaschuk, Gary D. Role of CoA and acetyl-CoA in regulating cardiac fatty acid and glucose oxidation. Biochemical Society Transactions 2014, 42, 1043–1051. [Google Scholar] [CrossRef] [PubMed]
- Okamura, A.; Koyanagi, S.; Dilxiat, A.; Kusunose, N.; Chen, J. J.; Matsunaga, N.; Shibata, S.; Ohdo, S. Bile Acid-regulated Peroxisome Proliferator-activated Receptor-α (PPARα) Activity Underlies Circadian Expression of Intestinal Peptide Absorption Transporter PepT1/Slc15a1. Journal of Biological Chemistry 2014, 289, 25296–25305. [Google Scholar] [CrossRef] [PubMed]
- Grandini, N. A.; Costa, M. R.; Gregolin, C. S.; Siqueira, J. S.; Vieira, T. A.; Togneri Ferron, A. J.; Francisqueti-Ferron, F. V.; Romualdo, G. R.; Lúcia dos Anjos Ferreira, A.; Aldini, G.; Corrêa, C. R.; Moreto, F. Effects of carnosine supplementation on markers for the pathophysiological development of metabolic dysfunction-associated steatotic liver disease in a diet-induced model. Molecular and Cellular Endocrinology 2024, 582, 112138. [Google Scholar] [CrossRef]
- Seo, Y. S.; Kim, J. H.; Jo, N. Y.; Choi, K. M.; Baik, S. H.; Park, J. J.; Kim, J. S.; Byun, K. S.; Bak, Y. T.; Lee, C. H.; Kim, A.; Yeon, J. E. PPAR agonists treatment is effective in a nonalcoholic fatty liver disease animal model by modulating fatty-acid metabolic enzymes. Journal of Gastroenterology and Hepatology 2007, 23, 102–109, Erratum inJournal of Gastroenterology and Hepatology2009, 24, 932; Erratum in Journal of Gastroenterology and Hepatology 2009, 24, 1310.. [Google Scholar] [CrossRef]
- Mao, Z.; Feng, M.; Li, Z.; Zhou, M.; Xu, L.; Pan, K.; Wang, S.; Su, W.; Zhang, W. ETV5 Regulates Hepatic Fatty Acid Metabolism Through PPAR Signaling Pathway. Diabetes 2021, 70, 214–226. [Google Scholar] [CrossRef]
- Xi, L.; Lu, Q.; Liu, Y.; Gong, Y.; Liu, H.; Jin, J.; Zhang, Z.; Yang, Y.; Zhu, X.; Han, D.; Xie, S.; Xu, H. Study on Carbohydrate Metabolism in Adult Zebrafish (Danio rerio). Aquaculture Nutrition 2023, 2023, 1–14. [Google Scholar] [CrossRef] [PubMed]
- Zhang, Y.; Qiao, H.; Peng, L.; Meng, Y.; Song, G.; Luo, C.; Long, Y. Influence of High Temperature and Ammonia and Nitrite Accumulation on the Physiological, Structural, and Genetic Aspects of the Biology of Largemouth Bass (Micropterus salmoides). Antioxidants (Basel) 2025, 14, 495. [Google Scholar] [CrossRef]
- Chen, S.; Zhou, Y.; Chen, Y.; Gu, J. fastp: an ultra-fast all-in-one FASTQ preprocessor. Bioinformatics 2018, 34, i884–i890. [Google Scholar] [CrossRef] [PubMed]
- Patro, R.; Duggal, G.; Love, M. I.; Irizarry, R. A.; Kingsford, C. Salmon provides fast and bias-aware quantification of transcript expression. Nat Methods 2017, 14, 417–419. [Google Scholar] [CrossRef]
- Love, M. I.; Huber, W.; Anders, S. Moderated estimation of fold change and dispersion for RNA-seq data with DESeq2. Genome Biol 2014, 15, 550. [Google Scholar] [CrossRef]
- Maere, S.; Heymans, K.; Kuiper, M. BiNGO: a Cytoscape plugin to assess overrepresentation of gene ontology categories in biological networks. Bioinformatics 2005, 21, 3448–3449. [Google Scholar] [CrossRef]
- Bindea, G.; Mlecnik, B.; Hackl, H.; Charoentong, P.; Tosolini, M.; Kirilovsky, A.; Fridman, W. H.; Pages, F.; Trajanoski, Z.; Galon, J. ClueGO: a Cytoscape plug-in to decipher functionally grouped gene ontology and pathway annotation networks. Bioinformatics 2009, 25, 1091–1093. [Google Scholar] [CrossRef] [PubMed]
- Supek, F.; Bosnjak, M.; Skunca, N.; Smuc, T. REVIGO summarizes and visualizes long lists of gene ontology terms. PLoS One 2011, 6, e21800. [Google Scholar] [CrossRef] [PubMed]
- Shannon, P.; Markiel, A.; Ozier, O.; Baliga, N. S.; Wang, J. T.; Ramage, D.; Amin, N.; Schwikowski, B.; Ideker, T. Cytoscape: a software environment for integrated models of biomolecular interaction networks. Genome Res 2003, 13, 2498–2504. [Google Scholar] [CrossRef] [PubMed]
Figure 1.
L-carnosine supplementation significantly ameliorated histopathological alterations in the liver of zebrafish. Representative H&E staining of liver tissue sections for NSF (A), HSF (B), CAL (C) and CAH (D) groups, magnification 400×. The scale bar represents 50 µm.
Figure 1.
L-carnosine supplementation significantly ameliorated histopathological alterations in the liver of zebrafish. Representative H&E staining of liver tissue sections for NSF (A), HSF (B), CAL (C) and CAH (D) groups, magnification 400×. The scale bar represents 50 µm.
Figure 2.
L-carnosine supplementation significantly attenuated hepatic lipid accumulation induced by HSF in the liver of zebrafish. Representative ORO staining of liver tissue sections for NSF (A), HSF (B), CAL (C) and CAH (D) groups, magnification 400×. The scale bar represents 50 µm. Black arrows point to lipid droplets.
Figure 3.
Numbers of DEGs between the experimental groups indicated. The numbers on the top of red (up) and blue (down) bars represent the numbers of up- and down-regulated DEGs, respectively.
Figure 3.
Numbers of DEGs between the experimental groups indicated. The numbers on the top of red (up) and blue (down) bars represent the numbers of up- and down-regulated DEGs, respectively.
Figure 4.
Volcano plots indicating the DEGs between the indicated experimental groups (A-F). Gene symbols of the top 3 up- (red) and down-regulated (blue) genes are included. NS, not significant.
Figure 4.
Volcano plots indicating the DEGs between the indicated experimental groups (A-F). Gene symbols of the top 3 up- (red) and down-regulated (blue) genes are included. NS, not significant.
Figure 5.
Identification of HSF-affected genes targeted by CAL and CAH. HSF-induced genes were reversed by CAL (A) and CAH (C). HSF-inhibited genes were reversed by CAL (B) and CAH (D). The numbers of genes targeted by CAL and CAH are highlighted within a bright yellow background in the Venn charts (A-D). Comparison of CAL- and CAH-targeted genes that were induced (E) or inhibited (F) in HSF group compared to those in NSF group.
Figure 6.
Heatmaps illustrating the expression profile of representative HSF-induced genes (A) and HSF-inhibited genes (B) that were reversed in CAL and CAH groups. The columns and rows of the heatmaps represent groups and genes, respectively. The color scale indicates row z score value of gene abundances.
Figure 7.
Functional annotation of the HSF-affected genes reversed by CAL and CAH. (A) Panther protein class annotation of the HSF-induced genes inhibited by CAL and CAH. GO (biological process) enrichment (B) and KEGG pathway enrichment (C) of the HSF-inhibited genes reversed by CAL and CAH.
Figure 7.
Functional annotation of the HSF-affected genes reversed by CAL and CAH. (A) Panther protein class annotation of the HSF-induced genes inhibited by CAL and CAH. GO (biological process) enrichment (B) and KEGG pathway enrichment (C) of the HSF-inhibited genes reversed by CAL and CAH.
Figure 8.
A network for the carbohydrate, lipid, and ammino acid metabolism-associated pathways and genes targeted by L-carnosine. The hexagons and circles in the diagram represent enriched pathways and DEGs between the CAH and HSF groups. The size and color of the circles indicate the log2Foldchange and Padj values of the genes.
Table 1.
Growth performance of experimental zebrafish.
Table 1.
Growth performance of experimental zebrafish.
| Items |
NSF |
HSF |
CAL |
CAH |
| Body weight (mg) |
340 ± 5.5 |
396 ± 9.2* |
390 ± 12.4* |
370 ± 17.8 |
| Body length (mm) |
336 ± 6.7 |
342 ± 7.3 |
330 ± 8.9 |
338 ± 5.8 |
|
Disclaimer/Publisher’s Note: The statements, opinions and data contained in all publications are solely those of the individual author(s) and contributor(s) and not of MDPI and/or the editor(s). MDPI and/or the editor(s) disclaim responsibility for any injury to people or property resulting from any ideas, methods, instructions or products referred to in the content. |
© 2026 by the authors. Licensee MDPI, Basel, Switzerland. This article is an open access article distributed under the terms and conditions of the Creative Commons Attribution (CC BY) license (http://creativecommons.org/licenses/by/4.0/).