Submitted:
28 January 2026
Posted:
29 January 2026
You are already at the latest version
Abstract
Monitoring the structural integrity of dams in politically sensitive and physically inaccessible regions is critical for disaster risk reduction and national security. This study presents a long-term structural stability assessment of the Hwanggang Dam in North Korea using time-series Sentinel-1 synthetic aperture radar (SAR) data acquired between 2017 and 2025, processed with interferometric SAR (InSAR) techniques. Two key technical challenges associated with long-term dam monitoring in the absence of in situ reference data are addressed: (i) the loss of persistent scatterers (PS) over multi-year observation periods due to temporal decorrelation, and (ii) the need to maximize the density of coherent measurement points within a single, spatially isolated structure. To overcome these limitations, a time-segmented Compressed SAR (TS-ComSAR) approach is employed, in which InSAR processing is performed in annual segments and subsequently stacked to construct a nine-year displacement time series. By constraining the temporal baseline, this strategy enables consistent identification and tracking of stable PS points across multiple years. In addition, a full-stack nine-year time-series dataset is processed using the conventional Compressed SAR (ComSAR) approach to enable a direct comparison with TS-ComSAR results. The analysis indicates that the Hwanggang Dam remains structurally stable over the observation period; however, the concrete dam section exhibits a persistent uplift trend, with cumulative displacement on the order of 20–30 mm. In contrast, the embankment (fill) dam section shows a pronounced long-term subsidence trend, with cumulative displacement reaching approximately 60–80 mm over the monitoring period. These results demonstrate the effectiveness of TS-ComSAR for infrastructure safety monitoring and highlight its capability for remote structural health assessment of strategic dams in restricted regions where ground-based observations are unavailable. The proposed integration of time-segmented and full-stack ComSAR provides a robust framework for long-term stability assessment of critical infrastructure under data-limited conditions.
Keywords:
SAR
; InSAR
; Hwanggang dam
; displacement monitoring
; ComSAR
; time-segmented ComSA
1. Introduction
Dam infrastructure requires thorough monitoring to prevent catastrophic flooding and loss of life due to structural failure. However, on-site inspections and instrument installation are often impossible in politically sensitive or inaccessible areas. North Korea’s Hwanggang Dam is a prime example. Located approximately 42km north of the Imjin River Demilitarized Zone (DMZ), this hydroelectric dam has a storage capacity of approximately 0.4 . Sudden releases from the Hwanggang Dam have been used as a geopolitical tool, causing flooding and loss of life in downstream areas. Notably, an unannounced release in 2009 resulted in the deaths of six South Koreans and significant downstream damage. Given these risks, continuous monitoring of the Hwanggang Dam’s structural stability is crucial for both humanitarian and national security reasons. However, direct access by international engineers is blocked, making indirect monitoring methods essential.
Satellite-based remote sensing offers a highly effective solution for monitoring infrastructure in restricted areas [1,2]. In particular, the interferometric synthetic aperture radar (InSAR) time-series technique can detect minute ground displacements on the millimeter (mm) scale over a wide area from space. The persistent scatterer InSAR (PS-InSAR) approach identifies point targets, such as buildings or rock masses, that maintain phase coherence over long periods, enabling precise deformation measurements in metropolitan areas [1,3,8]. PS-InSAR has been successfully applied worldwide to monitor urban settlement and engineering structures. However, a key limitation of conventional PS-InSAR is its reliance on scatterers maintaining coherence throughout the entire data stack [4,11,20,25]. When conducting multi-year analyses in non-urban areas or environments with significant environmental changes, even initially stable scatterers can become decorrelated and excluded from the analysis due to surface changes or vegetation growth. This leads to a loss of measurement points and discontinuity in monitoring. Maintaining the same PS point for years on a single structure, such as a dam, is extremely difficult, and targets that remain unchanged throughout the entire period of 100 or more radar observations are extremely rare. Therefore, temporal decorrelation poses a serious challenge to long-term continuous monitoring using PS-InSAR.
Another limitation is the low density of measurement points (sparsity) in infrastructure located in rural or vegetated environments. Conventional PS-InSAR primarily selects only bright, stable reflectors, such as metal or concrete edges, resulting in limited coverage on dams and natural slopes. To overcome this, researchers have developed a method utilizing Distributed Scatterers (DS). DS are pixels representing rough surfaces that, while individually low in coherence, can be averaged with pixels from homogeneous neighborhoods to achieve coherence. The SqueeSAR algorithm proposed by Ferretti et al. (2001) dramatically increased the density of measurement points in non-urban areas by combining PS and DS [1]. The recent advanced PSDS (Persistent Scatterer + Distributed Scatterer) InSAR technique has established itself as the state-of-the-art in deformation monitoring, leveraging DS points, such as grass-covered dam slopes and rocky slopes, to provide superior spatial coverage compared to conventional PS-only techniques. Furthermore, extending the PSDS concept, the Compressed SAR (ComSAR) approach was proposed by Ho Tong Minh et al. (2022) to handle large amounts of data and improve coherence in high-density time-series InSAR [5]. The ComSAR algorithm splits large SAR datasets into smaller stacks and applies optimal phase linking and compression to each segment to combine PS and DS targets. This effectively reduces temporal noise and data volume while preserving essential deformation signals. ComSAR has been proven to consistently produce better displacement estimates and higher point densities than conventional PSDS or PSI, especially in long-term monitoring tasks. Furthermore, by compressing data into segments, it significantly reduces computational costs, enabling efficient processing of multi-year time-series data.
Based on this technical background, this study aims to expand the limitations of inaccessible dam monitoring in two ways: (1) to achieve continuous multi-year observations of an inaccessible strategic dam (the Hwanggang Dam) using satellite InSAR, and (2) to propose a methodological algorithm to ensure high-quality long-term displacement results. In particular, to address the issue of long-term PS loss, we introduce an annual stacking approach. Instead of processing all data from 2017 to 2025 simultaneously and expecting coherence to be maintained for over nine years, we divide the data into yearly subsets, analyze them, and then combine the results. By resetting the temporal baseline annually, we minimize decorrelation and identify multiple stable scatterers within each year, even if they are not maintained throughout the entire period. These annual analysis results are then chained to construct a consistent, multi-year displacement history. Additionally, we integrated the ComSAR algorithm to utilize both PS and DS scatterers within and around the dam. This maximizes the number of measurement points and enhances the robustness of deformation estimation, even in complex natural environments.
In summary, the novel contributions of this work are:
- 1.
- Continuous Monitoring in a Restricted Area: This study presents the case of continuous monitoring of the displacement of the Hwanggang Dam structure using InSAR. This demonstrates the potential for monitoring and supervising critical infrastructure in politically sensitive and physically inaccessible areas, providing significant implications for national security and transboundary water resource management.
- 2.
- Annual Interval Stacking for PS Stability: This study proposes a novel multi-temporal InSAR methodology that stacks consecutive annual monitoring results. This strategy effectively mitigates the effects of temporal decorrelation occurring over multi-year periods and consistently identifies stable PS points over long periods, addressing common challenges in long-term monitoring of a single target.
- 3.
- ComSAR (PS+DS) Analysis Integration: This study integrates the ComSAR algorithm proposed in a recent French study into the workflow. By jointly utilizing PS and DS, coherence and spatial coverage are improved, resulting in improved deformation detection performance in dam structures and their surroundings compared to conventional PS-InSAR.
The rest of this paper is organized as follows. Section 2 describes the material and methodological framework adopted in this research and its significance. Section 3 presents the results of the multi-year deformation monitoring of Hwanggang Dam and discussion on the implications of the findings, the performance of the proposed approach, and limitations. Section 4 concludes the paper, highlighting the novelty of monitoring a restricted area using our method and suggesting future research directions.
2. Materials and Methods
2.1. Study Area
Hwanggang Dam is a large hydroelectric dam located in Tosan County, North Hwanghae Province, North Korea. Constructed between 2002 and 2007, the dam impounds the Imjin River approximately 42 km upstream of the inter-Korean border (Demilitarized Zone). It has an estimated reservoir capacity on the order of 0.36–0.40 . The dam’s structure comprises a central concrete spillway section and adjoining earthen embankment sections (fill dams) that extend the reservoir impoundment. While detailed engineering specifications of Hwanggang Dam are not publicly available, its design is believed to serve dual purposes: water supply (irrigation and hydropower) and flood control, as officially stated by North Korean sources. Unofficially, the dam’s location and control over downstream water flow give it strategic importance in the Korean peninsula’s geopolitics. In response to Hwanggang’s construction, South Korea built its own downstream flood control dams (e.g., Gunnam Dam, completed 2010) to mitigate the risk of sudden water releases. The geographical location of Hwanggang dam is shown in Figure 1.
The political sensitivity of the Hwanggang Dam arises from past incidents and its potential impact on South Korea. On 6 September 2009, North Korean authorities released a massive volume of water (approximately 0.4 billion cubic meters) from Hwanggang Dam without prior warning. The resulting flash flood along the Imjin River killed six South Koreans and caused substantial property damage downstream. This tragedy underscored the dam’s role as a possible geopolitical leverage point – it demonstrated that manipulation of the dam’s outflows could be used as an instrument of pressure or could inadvertently trigger humanitarian disasters. Indeed, multiple transboundary water conflicts have been recorded on the Imjin River since the dam’s completion [14]. Consequently, South Korean and international agencies have a vested interest in remotely monitoring the Hwanggang Dam’s status, including both its water storage behavior and its structural condition.
Direct monitoring of the dam’s structure (e.g., on-site surveys, installing sensors or gauges) is not feasible due to North Korea’s restrictions and the military sensitivity of the border zone. There are no publicly reported instruments on the dam itself. Thus, remote sensing remains the primary source of information on Hwanggang Dam’s behavior. Previous studies have utilized satellite imagery to observe water level and reservoir surface changes at Hwanggang Reservoir. For instance, satellite optical and radar data have been used to infer reservoir storage variations as an indirect way to predict potential releases. However, these hydrologic observations do not provide insight into the dam’s structural stability [22].
Until recent, there was little information on whether the Hwanggang Dam itself had experienced any physical deformation since its construction. In 2025, Kim et al. applied PS-InSAR analysis to the Hwanggang Dam using Sentinel-1 data and reported that the dam showed only minimal displacement (on the order of a few mm/year) from 2017 to 2024 [24]. In their study, the concrete section was essentially stable (sub-millimeter move-ments), and the earth-fill section exhibited a gentle subsidence trend of a few millimeters per year. These findings suggested that, as of 2024, Hwanggang Dam did not show alarming structural deformation, indirectly confirming its integrity. The study also demonstrated the effectiveness of satellite-based monitoring for infrastructure with limited access, reinforcing the value of InSAR for this application. However, the analysis by Kim et al. relied on conventional PS-InSAR processing over the multi-year dataset. As noted earlier, such long-term PS analysis can suffer from loss of coherent targets and reduced point density over time.
Our study area for InSAR analysis is defined as the vicinity of Hwanggang Dam, including the dam body and its immediate surroundings. We focus on capturing deformation of the dam’s structure: the concrete spillway section and the adjacent embankments forming the reservoir margins. The area is largely rural and vegetated, apart from the dam structure itself. This kind of environment can pose challenges for InSAR due to vegetation cover and lack of man-made reflective surfaces. By integrating DS scatterer analysis (through ComSAR), we aim to overcome the sparse coverage and detect deformation not only on the concrete portions but also on the earthen slopes of the dam and possibly the abutment areas. Continuous monitoring of this site over 2017–2025 provides a testbed to evaluate our methodological improvements in a real-world, high-stakes scenario. The insights gained will be valuable for remote surveillance of other inaccessible critical infrastructure around the world [22].
2.2. SAR Data Aqusition
For this study, we utilized a multi-year archive of Sentinel-1 C-band SAR images covering the Hwanggang Dam area. Sentinel-1 provides a frequent, all-weather imaging capability ideal for long-term ground deformation monitoring. Time-series data of Sentinel-1 acquired in single look complex (SLC) format. A total of 235 images (ascending track) covering the study study site were collected during 2017 to 2025 from Alaska Satellite Facility portal with a pixel spacing of ∼ 14 m in range by ∼ 3 m in azimuth (Interferometric Wide swath mode).The baseline plot of acquired Sentinel-1 time-series data is shown in Figure 2. Similarly time-segmented (annual) baseline plot of acquired data is shown in Figure 3.
2.3. Time-Series InSAR Processing
The acquired Sentinel-1 images were processed using two schemes. In the first scheme, the data were processed in an annual, time-segmented manner, in which images from each year (2017–2025) were processed independently to generate year-wise time-series co-registered stacks and corresponding interferogram stacks [7]. In the second scheme, the complete set of acquired Sentinel-1 images was processed together to generate a single, continuous time-series co-registered stack and a corresponding interferogram stack.
To generate the co-registered time-series stack and the interferogram stack, the following processing steps were performed. All SAR images were co-registered to a common master scene using precise orbit ephemerides with digital elevation model (DEM) assistance. The 1-arcsecond (30 m) Shuttle Radar Topography Mission (SRTM) DEM was employed for topographic phase correction and geocoding. Interferometric pairs were selected using a perpendicular baseline threshold of ± 300 m to minimize geometric decorrelation. Accordingly, interferograms were formed only between image pairs with small orbital track separation, thereby preserving high coherence. Owing to the relatively short spatial baselines of Sentinel-1 acquisitions in the study area, this criterion still enabled the construction of a dense and well-connected interferometric network over time.
For each selected image pair, differential interferograms were generated by removing the topographic phase derived from the reference DEM as well as a refined orbital phase trend. The resulting co-registered time-series stack and interferogram stack were subsequently exploited using the time-segmented compressed SAR (TS-ComSAR) approach and the full-stack time-series processing scheme. The deformation profile was extracted in terms of the line-of-sight (LOS) deformation rate and total deformation observed over the study period. As there are no Global Navigation Satellite System (GNSS) stations located within the Lahore metropolitan area, calibration and validation of the land deformation profile using GNSS data were not conducted.
The statistical homogeneous pixels selected by both full-stack ComSAR and TS-ComSAR approach were post-processed to extract land displacement profile. Figure 4 shows the post-processing flow.
2.3.1. Land Displacement Mapping using Compressed Timeseries Stack Based ComSAR
We employed a multi-temporal InSAR processing approach to estimate the time series of surface deformation at the dam. Our processing chain builds upon the Persistent Scatterer Interferometry (PSI) technique, augmented with distributed scatterer analysis as described below. The open-source tool Stanford Method for Persistent Scatterers (StaMPS) was used for initial PS candidate selection and phase analysis, with modifications to in-corporate the ComSAR algorithm for combined PS+DS processing [9,10].
Persistent Scatterer (PS) identification: We first identified candidate PS pixels based on amplitude stability and interferometric coherence. Pixels exhibiting a coherence magnitude of ≥ 0.75 in the majority of interferograms were marked as PS candidates. These typically correspond to man-made or rock surfaces with stable radar reflection. We also applied an amplitude dispersion index threshold (not exceeding 0.4) as a supplementary criterion to select relatively stable scatterers. The phase values of these PS candidates were extracted from all interferograms for time-series analysis.
Distributed Scatterer (DS) analysis and ComSAR integration: To enrich the measurement point density, we integrated the PSDS (PS + DS) analysis into our workflow. Following the approach of Ferretti et al. (2011) and Ho Tong Minh et al. (2021), we identified Statistically Homogeneous Pixel (SHP) groups in areas that lacked dominant PS. These are clusters of neighboring pixels (e.g., on the grass-covered dam slope or reservoir mar-gins) that share similar radar backscatter statistics. By spatially averaging the phase within each SHP cluster (multi-look processing), we obtained DS candidates with enhanced signal-to-noise ratio. A maximum likelihood phase linking technique was then applied to these DS clusters to estimate a coherent phase series that is consistent across interferograms. This process, known as phase triangulation or phase linking, mitigates the random phase fluctuations in DS pixels and makes their interferometric phase behave like that of PS points. After this enhancement, the DS points could be combined with the PS points in a unified deformation estimation process, effectively increasing the total set of coherent targets.
2.3.2. Land Displacement Mapping Using TS-ComSAR
Compressed SAR (ComSAR) analysis was performed for whole 9 years time-series stack, producing very sparse PSs, degrading the spatial correlation between the neighboring statistically homogeneous pixels (SHPs) pairs during the phase unwrapping. Therefore, time-segmented compressed SAR (TS-ComSAR) was utilized by performing ComSAR processing on an annual (2017, 2018, 2019, 2020, 2021, 2022, 2023, 2024, and 2025) time-series stack to obtain a sufficient number of high-quality SHPs [6]. TS-PSInSAR was suggested by Moon et al. (2022) which successfully applied to a very rapid surface deformation of CookE2 subglacial lake with a maximum uplift rate of 1.1 m/year. With annual time-series stack, sufficient number of high-quality SHPs were selected because of better spatial and temporal correlation. The schematic block diagram of time-segmented compressed SAR is shown in Figure 5.
3. Results and Discussion
3.1. Land Displacement Detected Patterns using Full-Stack ComSAR Approach
Figure 6 presents the spatial distribution of land deformation rates estimated from the full Sentinel-1 time-series stack (2017–2025) processed using the Compressed SAR (ComSAR) algorithm over the Hwanggang Dam area. The deformation rates are expressed in millimeters per year along the radar line-of-sight (LOS), with negative values indicating motion away from the satellite and positive values indicating motion toward the satellite. The deformation map reveals a clear spatial heterogeneity across the study area. Relatively stable zones dominate the forested and elevated terrain surrounding the reservoir, where deformation rates remain close to zero (-0.9 to +0.9 ). These areas are characterized by bedrock-controlled slopes and limited anthropogenic disturbance, which contribute to long-term mechanical stability.
In contrast, clear deformation patterns are observed along the river channel and adjacent floodplain within the dam’s downstream and upstream influence zones and subsidence rates reaching up to approximately -8.6 mm/year, particularly along the central river corridor and near riverbanks. These localized subsidence patterns are likely associated with sediment compaction, seasonal water-level fluctuations, and changes in pore-water pressure induced by dam operation. Long-term reservoir impoundment and regulated discharge can modify stress conditions in alluvial deposits, leading to gradual consolidation that is consistently captured by the full time-series analysis. Moderate uplift (up to +6.6 mm/year) is also detected in limited sections of the riverbanks and agricultural areas. Such uplift may reflect elastic ground response to cyclic hydrological loading, seasonal groundwater recharge, or sediment redistribution along the riverbed. The coexistence of subsidence and uplift within short spatial distances highlights the complex hydro-mechanical interactions governing the dam–river–floodplain system [9,10,19].
Importantly, the use of the full time-series stack enables the identification of long-term deformation trends that may not be apparent in temporally segmented analyses. By exploiting the dense interferometric network spanning nine years, the ComSAR algorithm effectively suppresses atmospheric noise and decorrelation effects, allowing robust estimation of subtle but persistent deformation signals. This long-term perspective is particularly valuable for dam safety assessment and downstream risk monitoring, as it captures cumulative deformation behavior rather than short-term fluctuations.
Overall, the results demonstrate that the Hwanggang Dam area exhibits predominantly stable conditions at the regional scale, while localized deformation hotspots are concentrated along hydrologically active zones. These findings underscore the importance of continuous InSAR-based monitoring for detecting gradual land deformation associated with dam operation and river dynamics, providing essential information for infrastructure management and water-resource planning [18,21,23].
3.2. Land Displacement Patterns Using Time-Segmented ComSAR Approach
3.2.1. Annual Land Displacement Patterns (2017-2025)
Figure 7 presents the annual line-of-sight (LOS) land displacement rates derived from time-segmented Compressed SAR processing for the period 2017–2025. The results reveal clear spatial and temporal variability in deformation patterns within the study area, highlighted by the dense distribution of coherent measurement points across agricultural land, riverine zones, and forested regions.
From 2017 to 2019, the deformation signal is dominated by moderate subsidence, with displacement rates largely ranging between -22.6 and -5.1 mm/year. These subsiding zones are primarily concentrated along the central river corridor and adjacent low-lying agricultural areas, suggesting a strong geomorphological or hydrological control. Localized uplift signals (4.5 to 12 mm/year) are intermittently observed, particularly toward the northern and eastern parts of the study area, but remain spatially limited during this early period.
A significant deformation occurs during 2020–2021. In 2020, localized zones of accelerated subsidence exceeding -32.3 mm/year emerge near the southern section of the river channel, coinciding with areas of exposed sediment and active land modification. In contrast, 2021 exhibits a relative stabilization, with a higher proportion of points showing near-zero to slight uplift (-5.1 to 12 mm/year), indicating a temporary reduction in deformation rates.
From 2022 onward, the deformation field becomes increasingly heterogeneous. The 2022 and 2023 maps show alternating patches of uplift and subsidence, reflecting a dynamic balance between surface loading, sediment redistribution, and possible groundwater variations. By 2024 and 2025, subsidence once again becomes dominant along the river corridor, with several segments exhibiting persistent negative deformation rates between -22.6 and -14.3 mm/year. The spatial persistence of these zones across multiple years indicates long-term ground instability rather than short-term noise or atmospheric artifacts [26].
3.2.2. Temporal Evolution and Stability Assessment
The time-segmented analysis enables year-by-year interpretation of deformation trends along dam embankment, revealing that deformation within the study area is not consistent but evolves in distinct phases. Periods of accelerated subsidence (e.g., 2018-2019 and 2024-2025) alternate with relatively stable or mildly uplifting phases (e.g., 2021-2022). This temporal variability highlights the importance of segmented InSAR analysis, as multi-year averaging would masked these short-term but potentially critical deformation events.
The persistence of deformation hotspots across consecutive years analysis particularly along the central and southern river sections suggests structurally or hydrologically controlled ground movement. In contrast, deformation observed in forested areas near the boundary is very low likely due to lower human activity and underlying surface stability. The spatial distribution of annual land displacement profile along dam embankment is shown in Figure 8.
Temporal analysis of land displacement pattern depict that concrete dam section of Hwanggang dam shows a clear long-term uplift trend from 2017 to 2025. LOS displacement gradually shifts from negative to positive values, with cumulative uplift reaching approximately 20–30 mm. Short-term variability is present but does not alter the overall deformation pattern and is likely related to seasonal and environmental effects. No abrupt changes or trend reversals are observed, indicating stable and coherent structural behavior of the concrete dam. The representative land displacement profile of Hwanggang dam concrete section (P1) is shown in Figure 9.
Similarly, the land displacement profile of the fill dam area section (P2) shows a clear long-term subsidence trend over the monitoring period from 2017 to 2025. LOS displacement values decrease steadily from positive values in the early years to predominantly negative values after 2020, with cumulative subsidence reaching approximately 30–50 mm toward the end of the observation period. Short-term fluctuations are present but remain superimposed on the dominant downward trend. No abrupt deformation events are observed, indicating gradual and progressive settlement behavior of the fill dam section. The representative land displacement profile of Hwanggang fill dam section (P2) is shown in Figure 10.
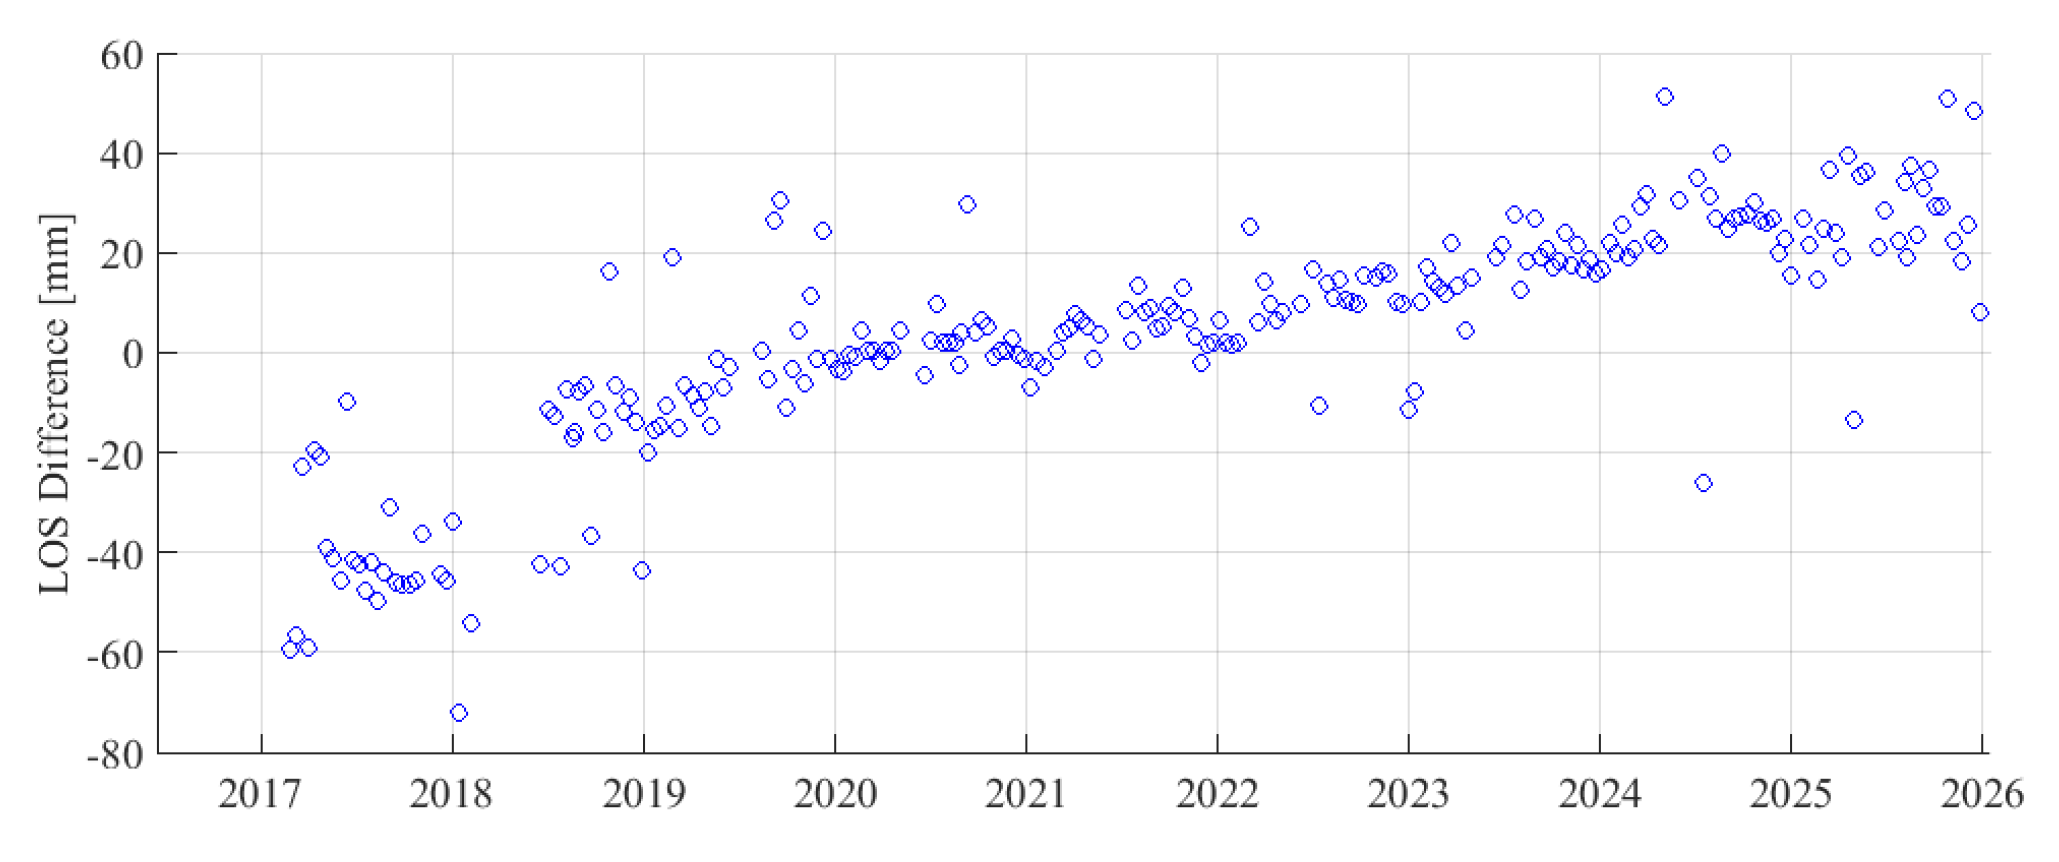
Figure 11 shows the LOS displacement difference between P1 and P2 which depicts a clear increasing trend from 2017 to 2026, indicating progressive differential movement within the Hwanggang Dam structure. This increasing differential displacement is significant, as it may reflect spatially varying structural response and provides a sensitive indicator for detecting internal deformation gradients and potential stability concerns.
3.2.3. Implications of Compressed SAR-Based Time Segmentation
The successful retrieval of coherent annual displacement maps over a nine-year period demonstrates the robustness of the Compressed SAR approach for long-term deformation monitoring. Despite reduced temporal sampling within each segment, the method preserves sufficient phase information to capture both gradual and episodic deformation signals. This is particularly evident in the clear detection of year-specific deformation anomalies, such as the localized high subsidence in 2020 and the partial recovery observed in 2021 [12,13,15].
Compared to conventional continuous time-series InSAR, the segmented approach provides enhanced interpretability for infrastructure monitoring and land stability assessment, as it allows direct comparison between individual years. This is especially valuable for operational monitoring frameworks, where decision-makers require annual deformation indicators rather than long-term averages.
3.2.4. Limitations and Future Considerations
While the results demonstrate strong spatial coherence and temporal consistency, some limitations remain. Variations in point density between years, particularly in vegetated areas, indicate sensitivity to temporal decorrelation and seasonal land cover changes. Additionally, the LOS nature of the measurements limits direct interpretation of vertical versus horizontal motion components [16,17]. Integrating ascending and descending geometries or coupling the results with hydrological and geological datasets would further enhance deformation attribution [19].
Overall, the annual displacement maps provide compelling evidence of ongoing land deformation within the study area and underscore the value of time-segmented Compressed SAR analysis for long-term land stability monitoring.
4. Conclusions
In conclusion, this study demonstrated the feasibility and effectiveness of long-term InSAR-based monitoring of the Hwanggang Dam in North Korea using time-series Sentinel-1 data spanning 2017–2024. By adopting a time-segmented Compressed SAR (ComSAR) strategy, continuous displacement monitoring of a critical yet inaccessible infrastructure was achieved, effectively addressing limitations related to temporal decorrelation and measurement point density inherent in conventional InSAR approaches. The proposed framework enabled the generation of high-density and temporally stable land displacement maps through the integration of annual result stacking and PS+DS ComSAR analysis. The monitoring results indicate that the Hwanggang Dam remains structurally stable over the observation period; however, the concrete dam section exhibits a persistent uplift trend, with cumulative displacement on the order of 20–30 mm. In contrast, the embankment (fill) dam section shows a clear long-term subsidence trend, with cumulative displacement reaching approximately 60–80 mm over the extended monitoring period (2017–2025). These deformation characteristics are consistent with previous independent assessments conducted for the 2017–2021 period, thereby reinforcing the reliability and robustness of the proposed methodology. Overall, this study highlights the strong potential of time-segmented ComSAR as an effective tool for continuous dam safety monitoring and hazard assessment in politically sensitive or physically inaccessible regions [24].
Methodologically, the annual time-segmented approach proved critical for preserving persistent scatterer coherence over the nine-year observation period. By mitigating temporal decorrelation, this strategy enabled consistent tracking of the same stable scatterers across successive years, a capability that is often difficult to achieve using conventional multi-year InSAR processing. As a result, the proposed framework represents a significant methodological advancement for long-term InSAR applications, effectively extending the applicability of ComSAR techniques to reliable decade-scale deformation monitoring. In complex environments like dams surrounded by natural terrain, this TS-ComSAR strategy enhances the coherence and coverage of InSAR analysis, as we have demonstrated. In conclusion, our study not only provides the specific assessment of Hwanggang Dam’s stability but also establishes a blueprint for how to monitor critical infrastructure in denied areas using advanced InSAR approach. This is particularly relevant in regions where political or safety concerns preclude physical inspections satellites can bridge the information gap.
Funding
This research received no external funding.
Data Availability Statement
The Sentinel-1 SAR data used in this study were obtained from the Alaska Satellite Facility (ASF). All data supporting the findings of this study are contained within the article. No additional data are available upon request.
Conflicts of Interest
Sunghwa Choi is employed by K-Water. Mirza Muhammad Waqar and Heein Yang are employed by CONTEC. The authors declare that the research was conducted in the absence of any commercial or financial relationships that could be construed as a potential conflict of interest.
Abbreviations
The following abbreviations are used in this manuscript:
| ComSAR | Compressed SAR |
| DEM | Digital Elevation Model |
| DS | Distributed Scatterer |
| GNSS | Global Navigation Satellite System |
| InSAR | Interferometric Synthetic Aperture Radar |
| LOS | Line of Sight |
| PS | Persistent Scatterer |
| PSDS | Persistent Scatterer + Distributed Scatterer |
| PSI | Persistent Scatterer Interferometry |
| PS-InSAR | Persistent Scatterer Interferometry Synthetic Aperture Radar |
| SAR | Synthetic Aperture Radar |
| SHP | Statistical Homogeneous Pixels |
| SLC | Single Look Complex |
| STaMPS | Stanford Method for Persistent Scatterers |
| SRTM | Shuttle Radar Topographic Mission |
| TS-ComSAR | Time-Segmented Compressed SAR |
Appendix A

Table A1.
Summary of Sentinel-1 time-series stack used for full-stack ComSAR and time-segmented ComSAR.
Table A1.
Summary of Sentinel-1 time-series stack used for full-stack ComSAR and time-segmented ComSAR.
| Year | Number of Images | Master Date (YYYY-MM-DD) |
|---|---|---|
| 2017 | 24 | 2017-07-18 |
| 2018 | 21 | 2018-09-11 |
| 2019 | 26 | 2019-06-02 |
| 2020 | 29 | 2020-07-14 |
| 2021 | 27 | 2021-07-21 |
| 2022 | 26 | 2022-07-16 |
| 2023 | 26 | 2023-06-17 |
| 2024 | 27 | 2024-05-06 |
| 2025 | 29 | 2025-08-17 |
| 2017-2025 | 235 | 2021-02-15 |
Table A2.
Year-wise Sentinel-1 SAR acquisition dates used in the analysis.
| 2017 | 2018 | 2019 | 2020 | 2021 | 2022 | 2023 | 2024 | 2025 |
|---|---|---|---|---|---|---|---|---|
| 2017-02-24 | 2018-01-02 | 2019-01-09 | 2020-01-04 | 2021-01-10 | 2022-01-05 | 2023-01-12 | 2024-01-07 | 2025-01-01 |
| 2017-03-08 | 2018-01-14 | 2019-01-21 | 2020-01-16 | 2021-01-22 | 2022-01-17 | 2023-01-24 | 2024-01-19 | 2025-01-25 |
| 2017-03-20 | 2018-02-07 | 2019-02-02 | 2020-01-28 | 2021-02-03 | 2022-01-29 | 2023-02-05 | 2024-01-31 | 2025-02-06 |
| 2017-04-01 | 2018-06-19 | 2019-02-14 | 2020-02-09 | 2021-02-27 | 2022-02-10 | 2023-02-17 | 2024-02-12 | 2025-02-18 |
| 2017-04-13 | 2018-07-01 | 2019-02-26 | 2020-02-21 | 2021-03-11 | 2022-03-06 | 2023-03-01 | 2024-02-24 | 2025-03-02 |
| 2017-04-25 | 2018-07-13 | 2019-03-10 | 2020-03-04 | 2021-03-23 | 2022-03-18 | 2023-03-13 | 2024-03-07 | 2025-03-14 |
| 2017-05-07 | 2018-07-25 | 2019-03-22 | 2020-03-16 | 2021-04-04 | 2022-03-30 | 2023-03-25 | 2024-03-19 | 2025-03-26 |
| 2017-05-19 | 2018-08-06 | 2019-04-03 | 2020-03-28 | 2021-04-16 | 2022-04-11 | 2023-04-06 | 2024-03-31 | 2025-04-07 |
| 2017-05-31 | 2018-08-18 | 2019-04-15 | 2020-04-09 | 2021-04-28 | 2022-04-23 | 2023-04-18 | 2024-04-12 | 2025-04-19 |
| 2017-06-12 | 2018-08-24 | 2019-04-27 | 2020-04-21 | 2021-05-10 | 2022-05-05 | 2023-04-30 | 2024-04-24 | 2025-05-01 |
| 2017-06-24 | 2018-08-30 | 2019-05-09 | 2020-05-03 | 2021-05-22 | 2022-06-10 | 2023-06-17 | 2024-05-06 | 2025-05-13 |
| 2017-07-06 | 2018-09-11 | 2019-05-21 | 2020-06-20 | 2021-07-09 | 2022-07-04 | 2023-06-29 | 2024-05-30 | 2025-05-25 |
| 2017-07-18 | 2018-09-23 | 2019-06-02 | 2020-07-02 | 2021-07-21 | 2022-07-16 | 2023-07-23 | 2024-07-05 | 2025-06-18 |
| 2017-07-30 | 2018-10-05 | 2019-06-14 | 2020-07-14 | 2021-08-02 | 2022-07-28 | 2023-08-04 | 2024-07-17 | 2025-06-30 |
| 2017-08-11 | 2018-10-17 | 2019-08-13 | 2020-07-26 | 2021-08-14 | 2022-08-09 | 2023-08-16 | 2024-07-29 | 2025-07-24 |
| 2017-08-23 | 2018-10-29 | 2019-08-25 | 2020-08-07 | 2021-08-26 | 2022-08-21 | 2023-08-28 | 2024-08-10 | 2025-08-05 |
| 2017-09-04 | 2018-11-10 | 2019-09-06 | 2020-08-19 | 2021-09-07 | 2022-09-02 | 2023-09-09 | 2024-08-22 | 2025-08-11 |
| 2017-09-16 | 2018-11-22 | 2019-09-18 | 2020-08-25 | 2021-09-19 | 2022-09-14 | 2023-09-21 | 2024-09-03 | 2025-08-17 |
| 2017-09-28 | 2018-12-04 | 2019-09-30 | 2020-08-31 | 2021-10-01 | 2022-09-26 | 2023-10-03 | 2024-09-15 | 2025-08-29 |
| 2017-10-10 | 2018-12-16 | 2019-10-12 | 2020-09-12 | 2021-10-13 | 2022-10-08 | 2023-10-15 | 2024-09-27 | 2025-09-10 |
| 2017-10-22 | 2018-12-28 | 2019-10-24 | 2020-09-24 | 2021-10-25 | 2022-11-01 | 2023-10-27 | 2024-10-09 | 2025-09-22 |
| 2017-11-03 | 2019-11-05 | 2020-10-06 | 2021-11-06 | 2022-11-13 | 2023-11-08 | 2024-10-21 | 2025-10-04 | |
| 2017-12-09 | 2019-11-17 | 2020-10-18 | 2021-11-18 | 2022-11-25 | 2023-11-20 | 2024-11-02 | 2025-10-16 | |
| 2017-12-21 | 2019-11-29 | 2020-10-30 | 2021-11-30 | 2022-12-07 | 2023-12-02 | 2024-11-14 | 2025-10-28 | |
| 2019-12-11 | 2020-11-11 | 2021-12-12 | 2022-12-19 | 2023-12-14 | 2024-11-26 | 2025-11-09 | ||
| 2019-12-23 | 2020-11-23 | 2021-12-24 | 2022-12-31 | 2023-12-26 | 2024-12-08 | 2025-11-21 | ||
| 2020-12-05 | 2024-12-20 | 2025-12-03 | ||||||
| 2020-12-17 | 2025-12-15 | |||||||
| 2020-12-29 | 2025-12-27 |
References
- Ferretti, A.; Prati, C.; Rocca, F. Permanent scatterers in SAR interferometry. IEEE Trans. Geosci. Remote Sens. 2001, 39, 8–20. [Google Scholar] [CrossRef]
- Berardino, P.; Fornaro, G.; Lanari, R.; Sansosti, E. A new algorithm for surface deformation monitoring based on small baseline differential SAR interferograms. IEEE Trans. Geosci. Remote Sens. 2002, 40, 2375–2383. [Google Scholar] [CrossRef]
- Osmanoglu, B.; Dixon, T.H.; Wdowinski, S.; Cabral-Cano, E.; Jiang, Y. Time series analysis of InSAR data: Methods and trends. ISPRS J. Photogramm. Remote Sens. 2016, 115, 90–102. [Google Scholar] [CrossRef]
- Parizzi, A.; Brcic, R. Adaptive InSAR stack multilooking exploiting amplitude statistics: A comparison between different techniques and practical results. IEEE Geosci. Remote Sens. Lett. 2011, 8, 441–445. [Google Scholar] [CrossRef]
- Ho Tong Minh, D.; Yen, Y.N. Compressed SAR Interferometry in the Big Data Era. Remote Sensing 2022, 14(2), 390. [Google Scholar] [CrossRef]
- Moon, J.; Lee, H.; Lee, H. Elevation Change of CookE2 Subglacial Lake in East Antarctica Observed by DInSAR and Time-Segmented PSInSAR. Remote Sensing 2022, 14(18), 4616. [Google Scholar] [CrossRef]
- Ansari, H.; De Zan, F.; Bamler, R. Efficient phase estimation for interferometric stacks. IEEE Trans. Geosci. Remote Sens. 2018, 56, 4109–4125. [Google Scholar] [CrossRef]
- Crosetto, M.; Monserrat, O.; Cuevas-González, M.; Devanthéry, N.; Crippa, B. Persistent Scatterer Interferometry: A review. ISPRS J. Photogramm. Remote Sens. 2016, 115, 78–89. [Google Scholar] [CrossRef]
- Milillo, P.; Perissin, D.; Salzer, J.T.; Lundgren, P.; Lacava, G.; Milillo, G.; Serio, C. Monitoring dam structural health from space: Insights from novel InSAR techniques and multi-parametric modeling applied to the Pertusillo dam Basilicata, Italy. International Journal of Applied Earth Observation and Geoinformation 2016, 52, 221–229. [Google Scholar] [CrossRef]
- Tomás, R.; Cano, M.; García-Barba, J.; Vicente, F.; Herrera, G.; Lopez-Sanchez, J.M.; Mallorquí, J.J. Monitoring an earthfill dam using differential SAR interferometry: La Pedrera dam, Alicante, Spain. Engineering Geology 2013, 157, 21–32. [Google Scholar] [CrossRef]
- Sousa, J.J.; Hooper, A.; Hanssen, R.F.; Bastos, L.C.; Ruiz, A.M. Persistent scatterer InSAR: A comparison of processing algorithms and an assessment of applications to dam deformation monitoring. Remote Sens. Environ. 2011, 115, 2652–2663. [Google Scholar] [CrossRef]
- Emardson, R.; Simmons, M.; Webb, F. Neutral atmospheric delay in interferometric synthetic aperture radar applications: Statistical description and mitigation. J. Geophys. Res. Solid Earth 2003, 108, 2235. [Google Scholar] [CrossRef]
- Tavakkoliestahbanati, A.; Milillo, P.; Kuai, H.; et al. Re-collapse spaceborne deformation monitoring of the Kakhovka dam, Ukraine, from 2017 to 2023. Commun. Earth Environ. 2024, 145. [Google Scholar]
- Zeitoun, M.; Warner, J. Hydro-hegemony – a framework for analysis of trans-boundary water conflicts. Water Policy 2006, 8, 435–460. [Google Scholar] [CrossRef]
- Zebker, H.A.; Villasenor, J. Decorrelation in interferometric radar echoes. IEEE Trans. Geosci. Remote Sens. 1992, 30, 950–959. [Google Scholar] [CrossRef]
- Wang, Y.; Zhu, X.X. Robust estimations for meteorological monitoring using differential SAR interferometry. IEEE Trans. Geosci. Remote Sens. 2016, 54, 968–980. [Google Scholar] [CrossRef]
- Dong, J.; Zhang, L.; Tang, M.; Liao, M.; Xu, Q.; Gong, J.; Ao, M. Mapping landslide surface displacements with time-series InSAR combining persistent and distributed scatterers: A case study of Jiaju landslide, Danba, China. Remote Sens. Environ. 2018, 205, 180–198. [Google Scholar] [CrossRef]
- Gernhardt, S.; Bamler, R. Deformation monitoring of single buildings using Meter-Resolution SAR data in PSI. ISPRS J. Photogramm. Remote Sens. 2012, 73, 68–79. [Google Scholar] [CrossRef]
- Huang, Q.; Monserrat, O.; Crosetto, M.; Crippa, B.; Wang, Y.; Jiang, J.; Ding, Y. Displacement Monitoring and Health Evaluation of Two Bridges Using Sentinel-1 SAR Images. Remote Sensing 2018, 10(11), 1714. [Google Scholar] [CrossRef]
- Pang, Z.; Jin, Q.; Fan, P.; Jiang, W.; Lv, J.; Zhang, P.; Cui, X.; Zhao, C.; Zhang, Z. Deformation Monitoring and Analysis of Reservoir Dams Based on SBAS-InSAR Technology—Banqiao Reservoir. Remote Sensing 2023, 15(12), 3062. [Google Scholar] [CrossRef]
- Crétaux, J.F.; Jelinski, W.; Calmant, S.; Kouraev, A.; Vuglinski, V.; Bergé-Nguyen, M.; Gennero, M.C.; Nino, F.; Del Rio, R.A.; Cazenave, A.; et al. SOLS: A lake database to monitor in the Near Real Time water level and storage variations from remote sensing data. Adv. Space Res. 2011, 47, 1497–1507. [Google Scholar] [CrossRef]
- Ha, D. T. T.; Kim, S.-H.; Bae, D.-H. Impacts of Upstream Structures on Downstream Discharge in the Transboundary Imjin River Basin, Korean Peninsula. Applied Sciences 2020, 10(9), 3333. [Google Scholar] [CrossRef]
- Hagg, W.; Mayer, C.; Mayr, E.; Heilig, A. Glacier changes in the Big Naryn basin, Central Tian Shan. Glob. Planet. Chang. 2013, 110, 40–50. [Google Scholar] [CrossRef]
- Kim, J. H.; Kim, J. S. Displacement Analysis of the Hwanggang Dam Using PS-InSAR. KSCE Journal of Civil and Environmental Engineering Research 2025, 45, 557–565. [Google Scholar]
- Hooper, A.; Segall, P.; Zebker, H. Persistent scatterer interferometric synthetic aperture radar for crustal deformation analysis, with application to Volcán Alcedo, Galápagos. Journal of Geophysical Research: Solid Earthh 2007, 112. [Google Scholar] [CrossRef]
- Waqar, M. M.; Sukmawati, R.; Kakli, M. U.; Yang, H. Underground Water Depletion Triggered Land Deformation Monitoring Using PSInSAR Algorithm. 2025 IEEE International Geoscience and Remote Sensing Symposium 2025, 9479–9482. [Google Scholar]
Figure 1.
Hwanggang Dam, North Korea.
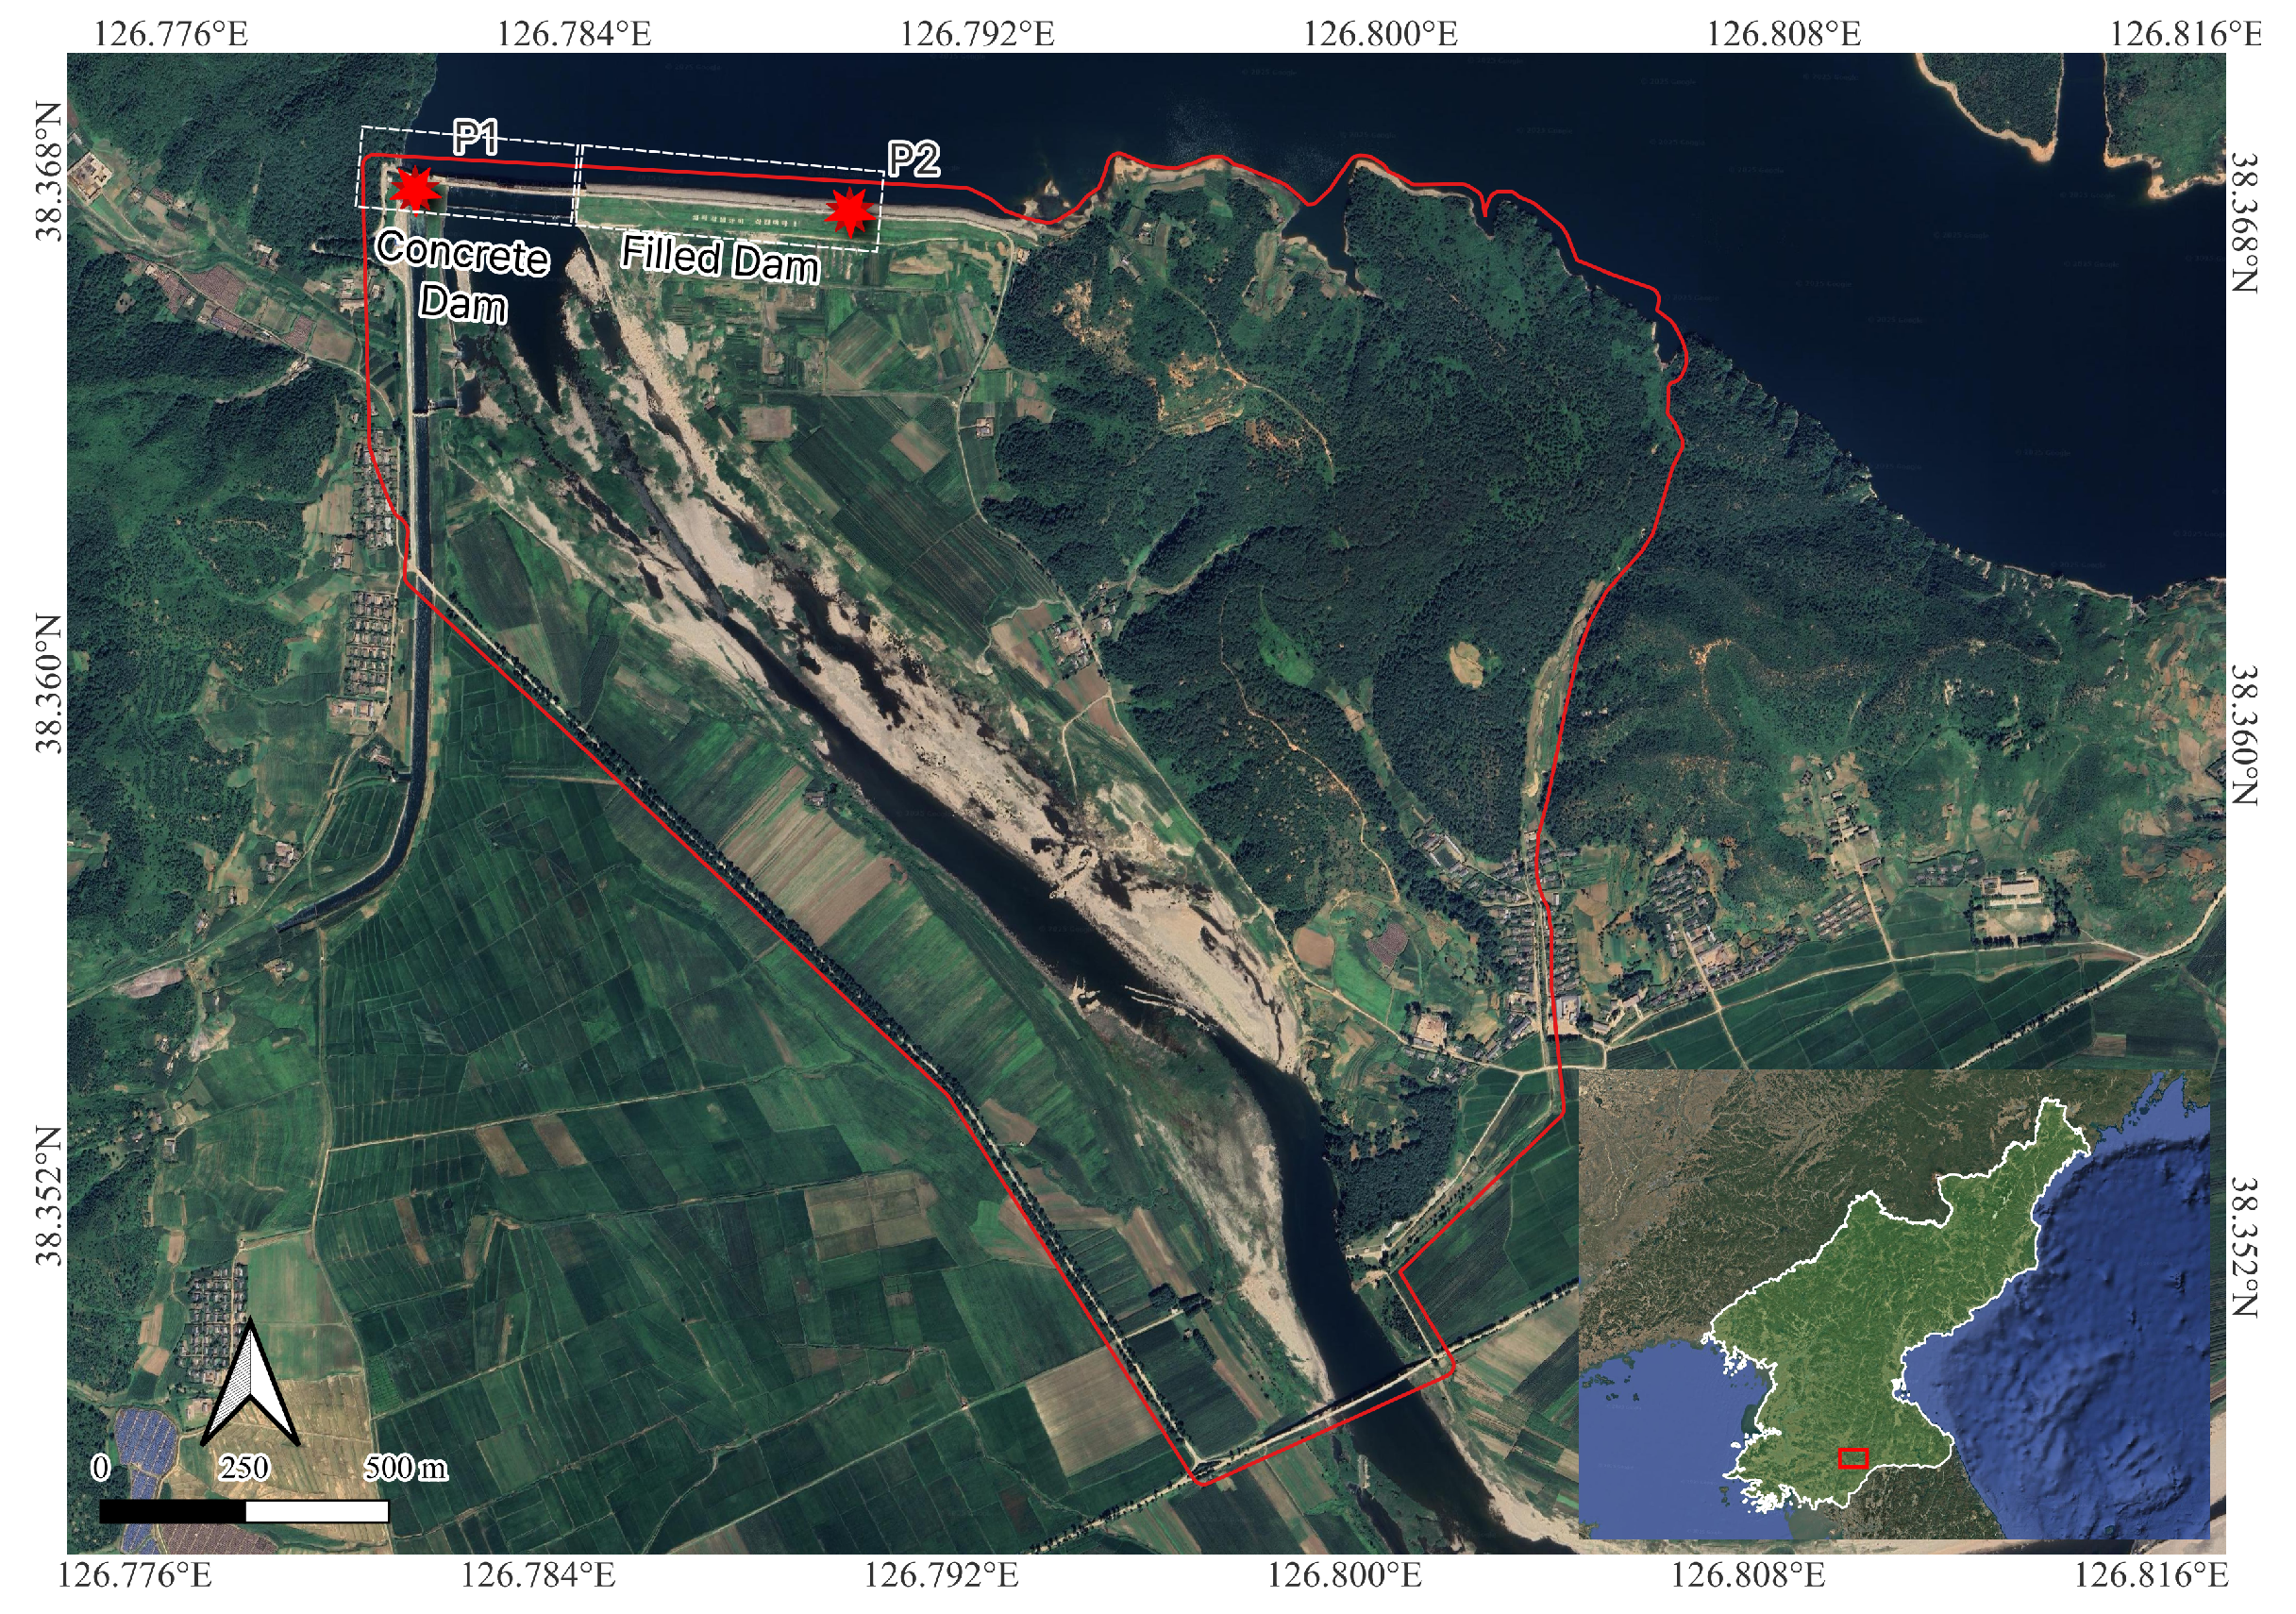
Figure 2.
Baseline plot of each year stack (2017-2025).
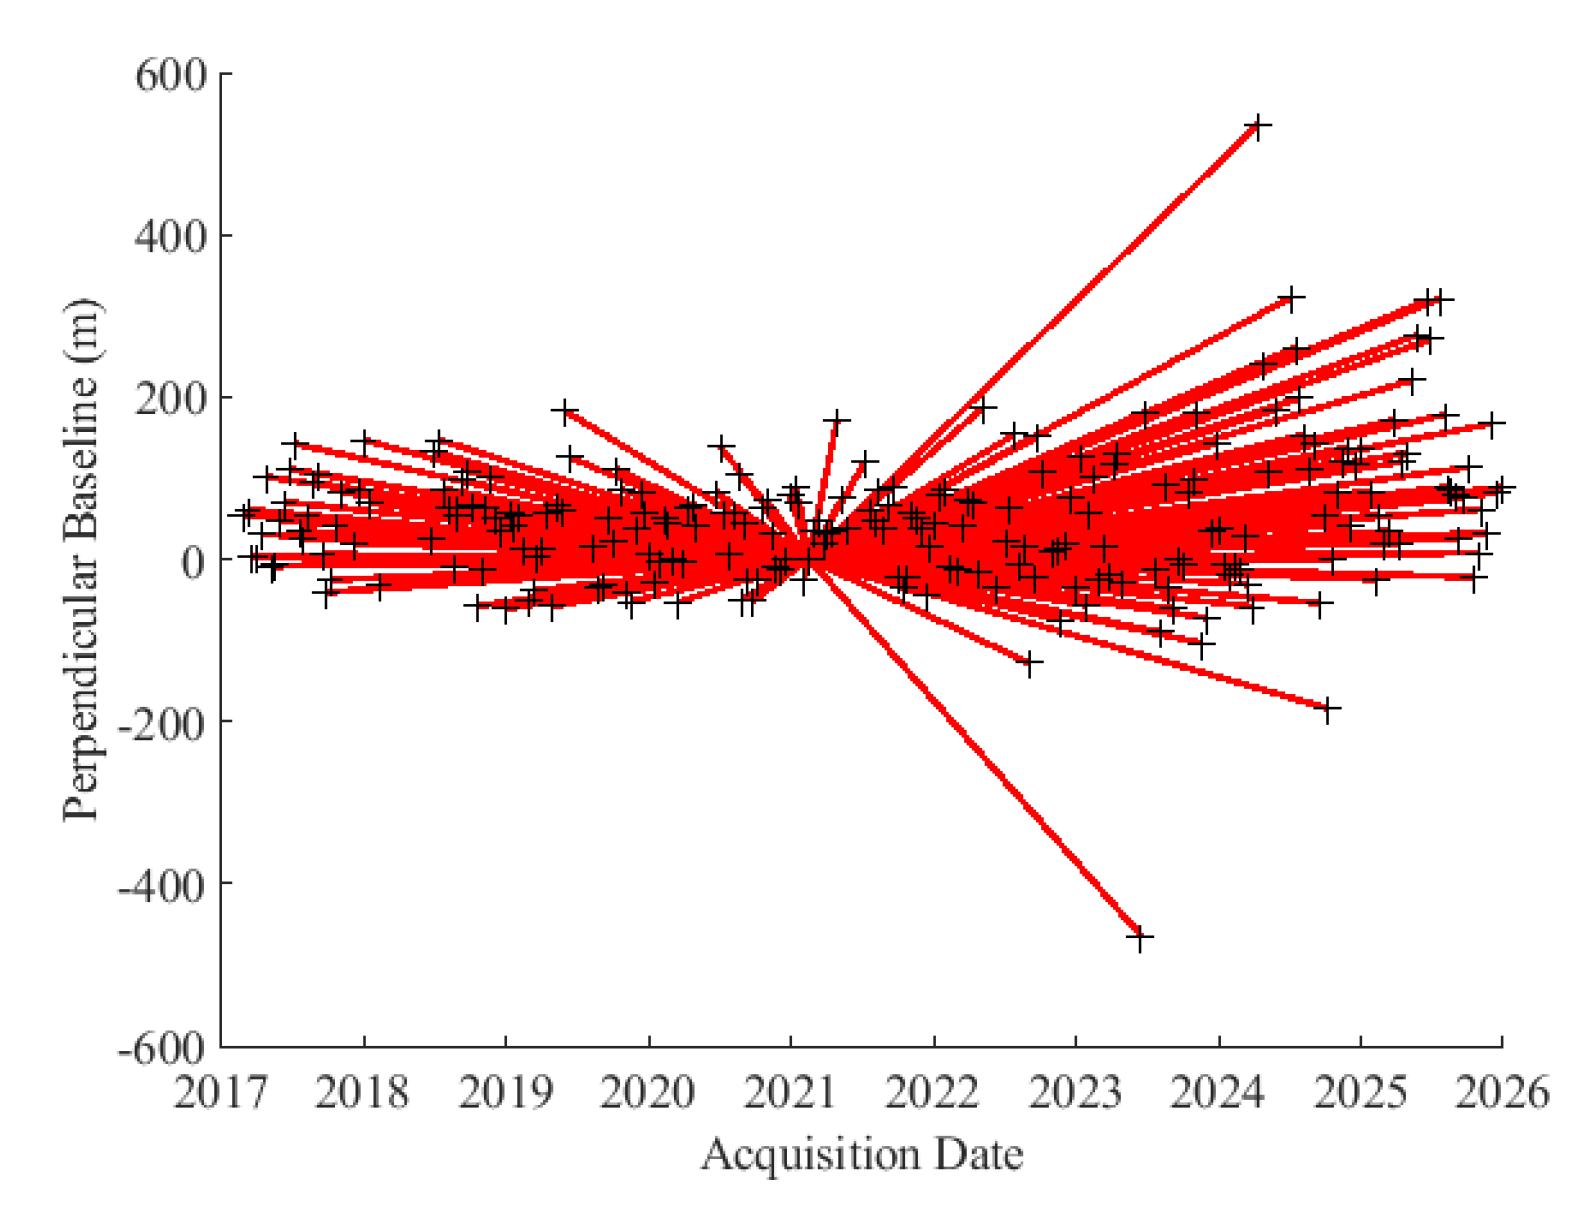
Figure 3.
Baseline plot of complete timeseries stack 2017-2025.
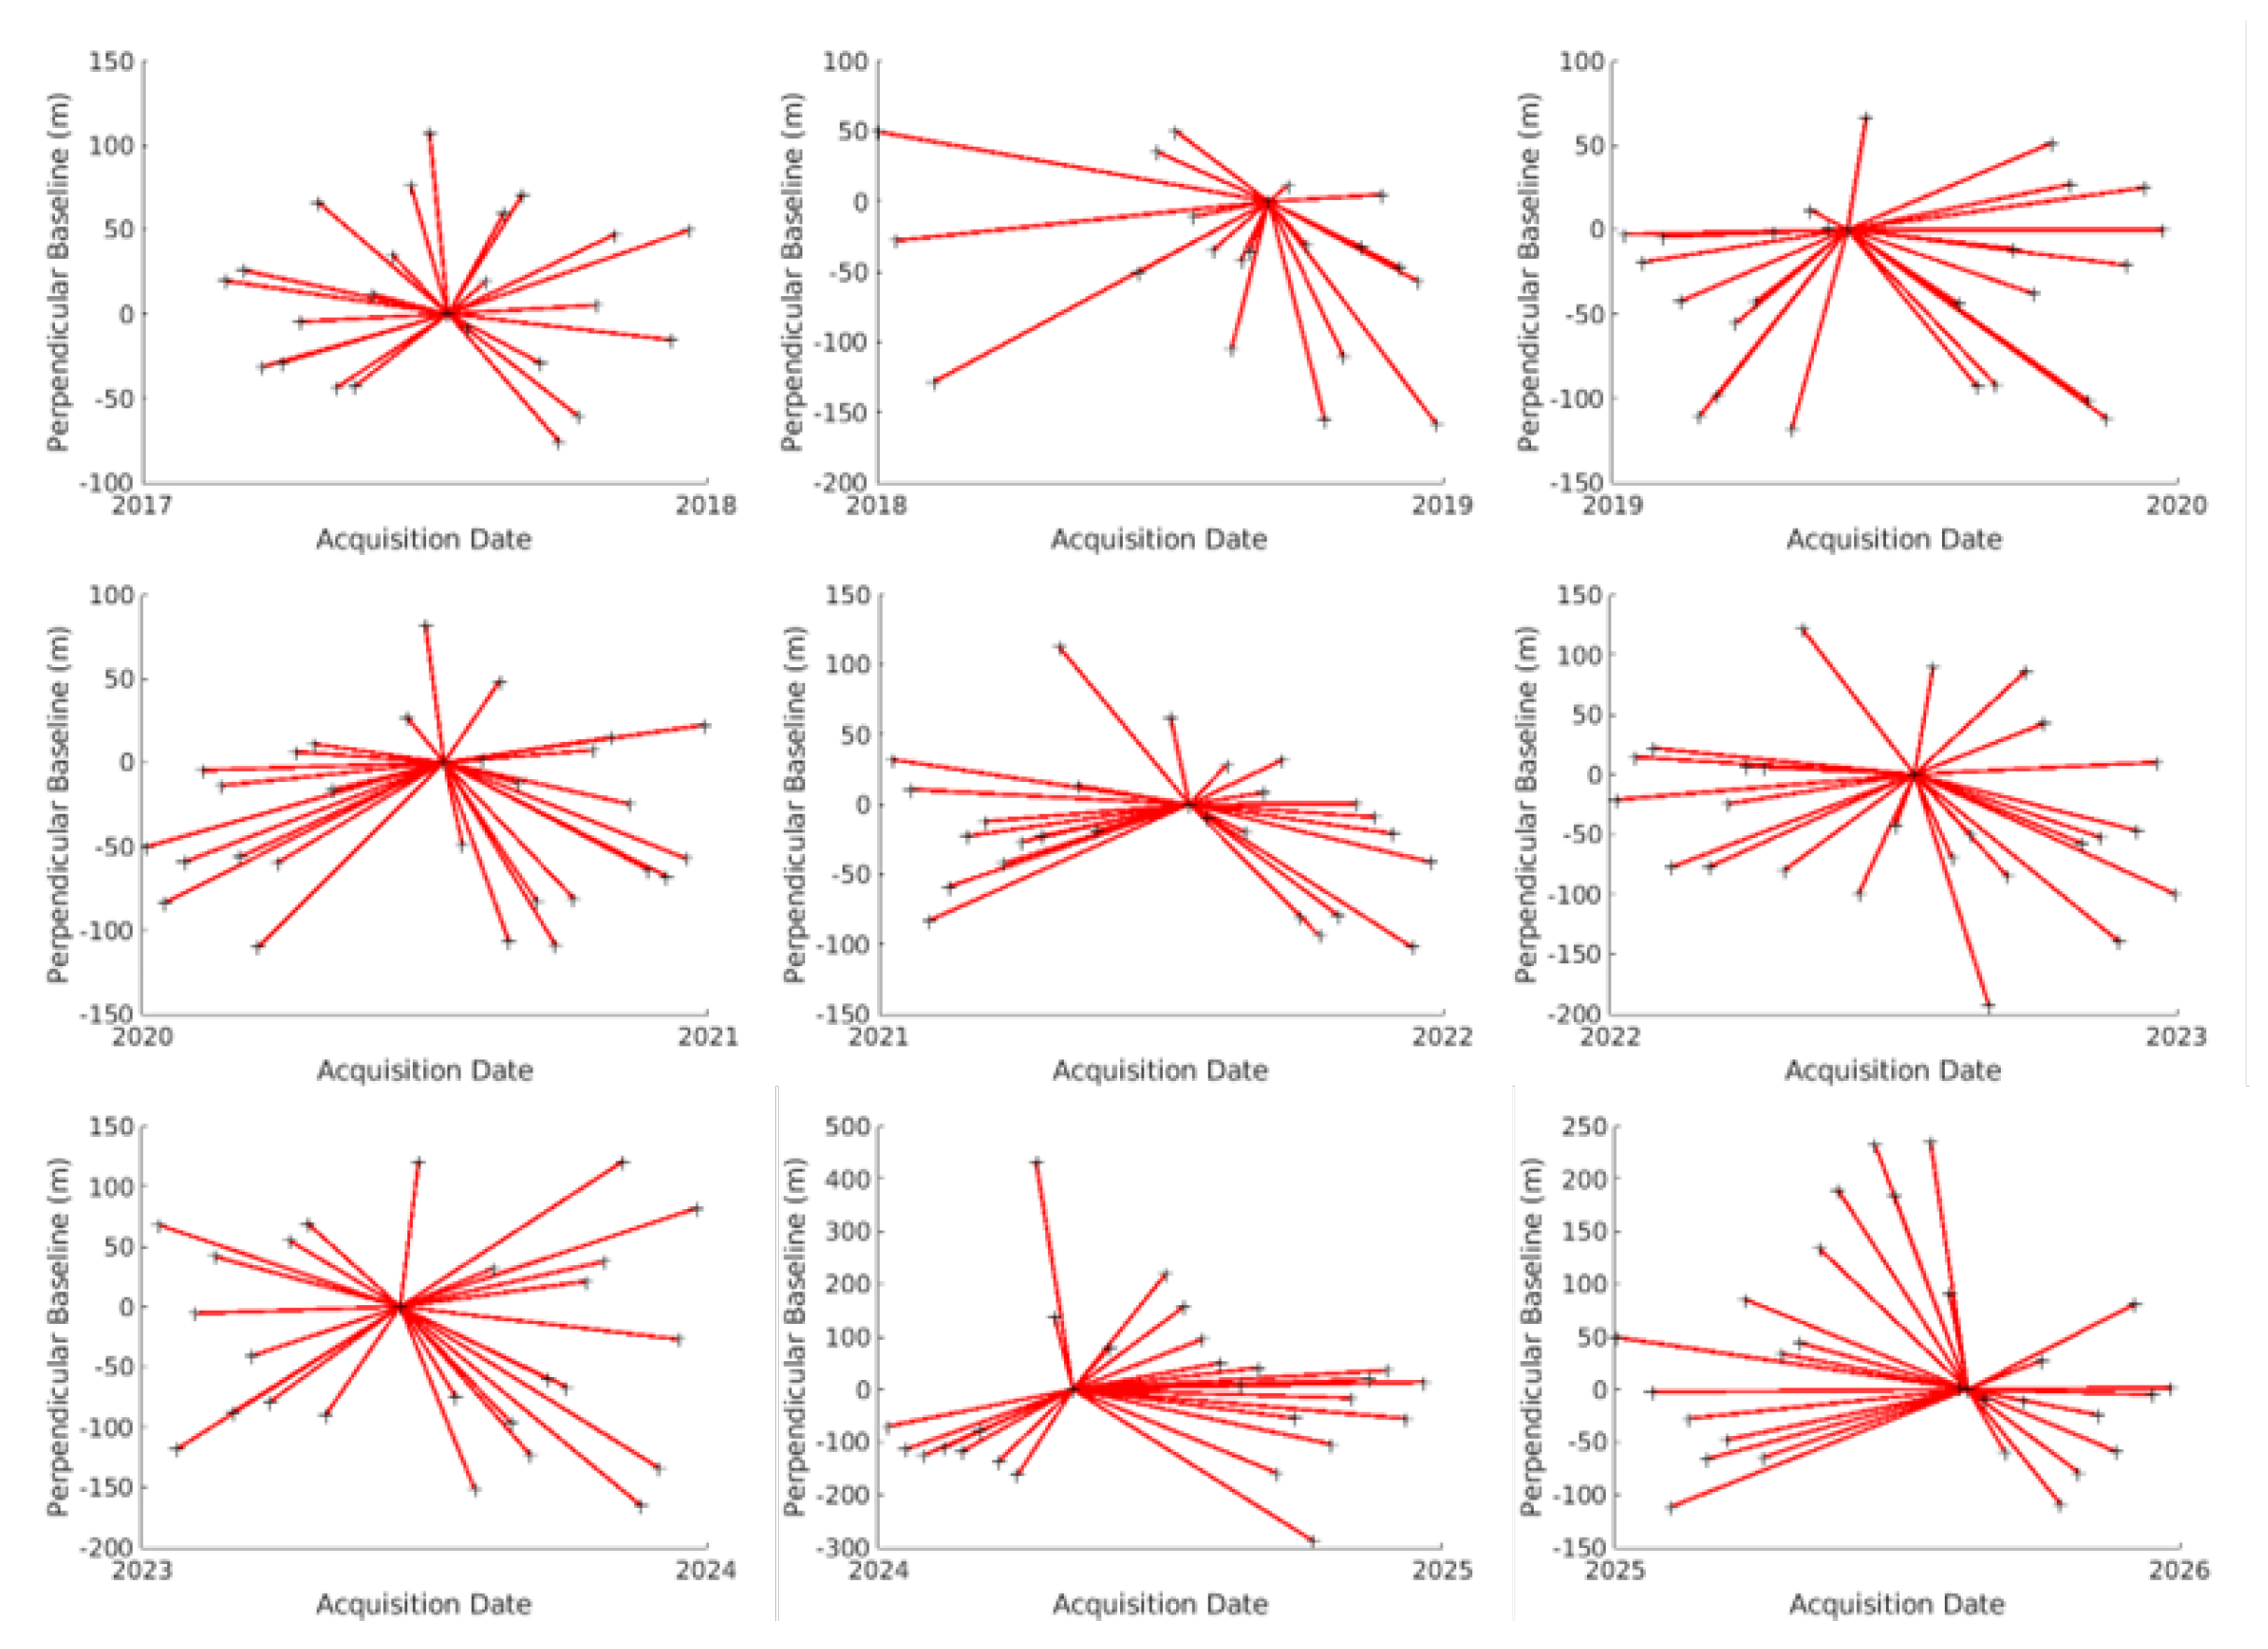
Figure 4.
Post-processing Flow: [w] wrapped phase; [u] unwrapped phase; [d] DEM error; [a] atmospheric error; [m] master atmospheric error; [o] orbital ramps; [v] velocity [hgt] height.
Figure 4.
Post-processing Flow: [w] wrapped phase; [u] unwrapped phase; [d] DEM error; [a] atmospheric error; [m] master atmospheric error; [o] orbital ramps; [v] velocity [hgt] height.
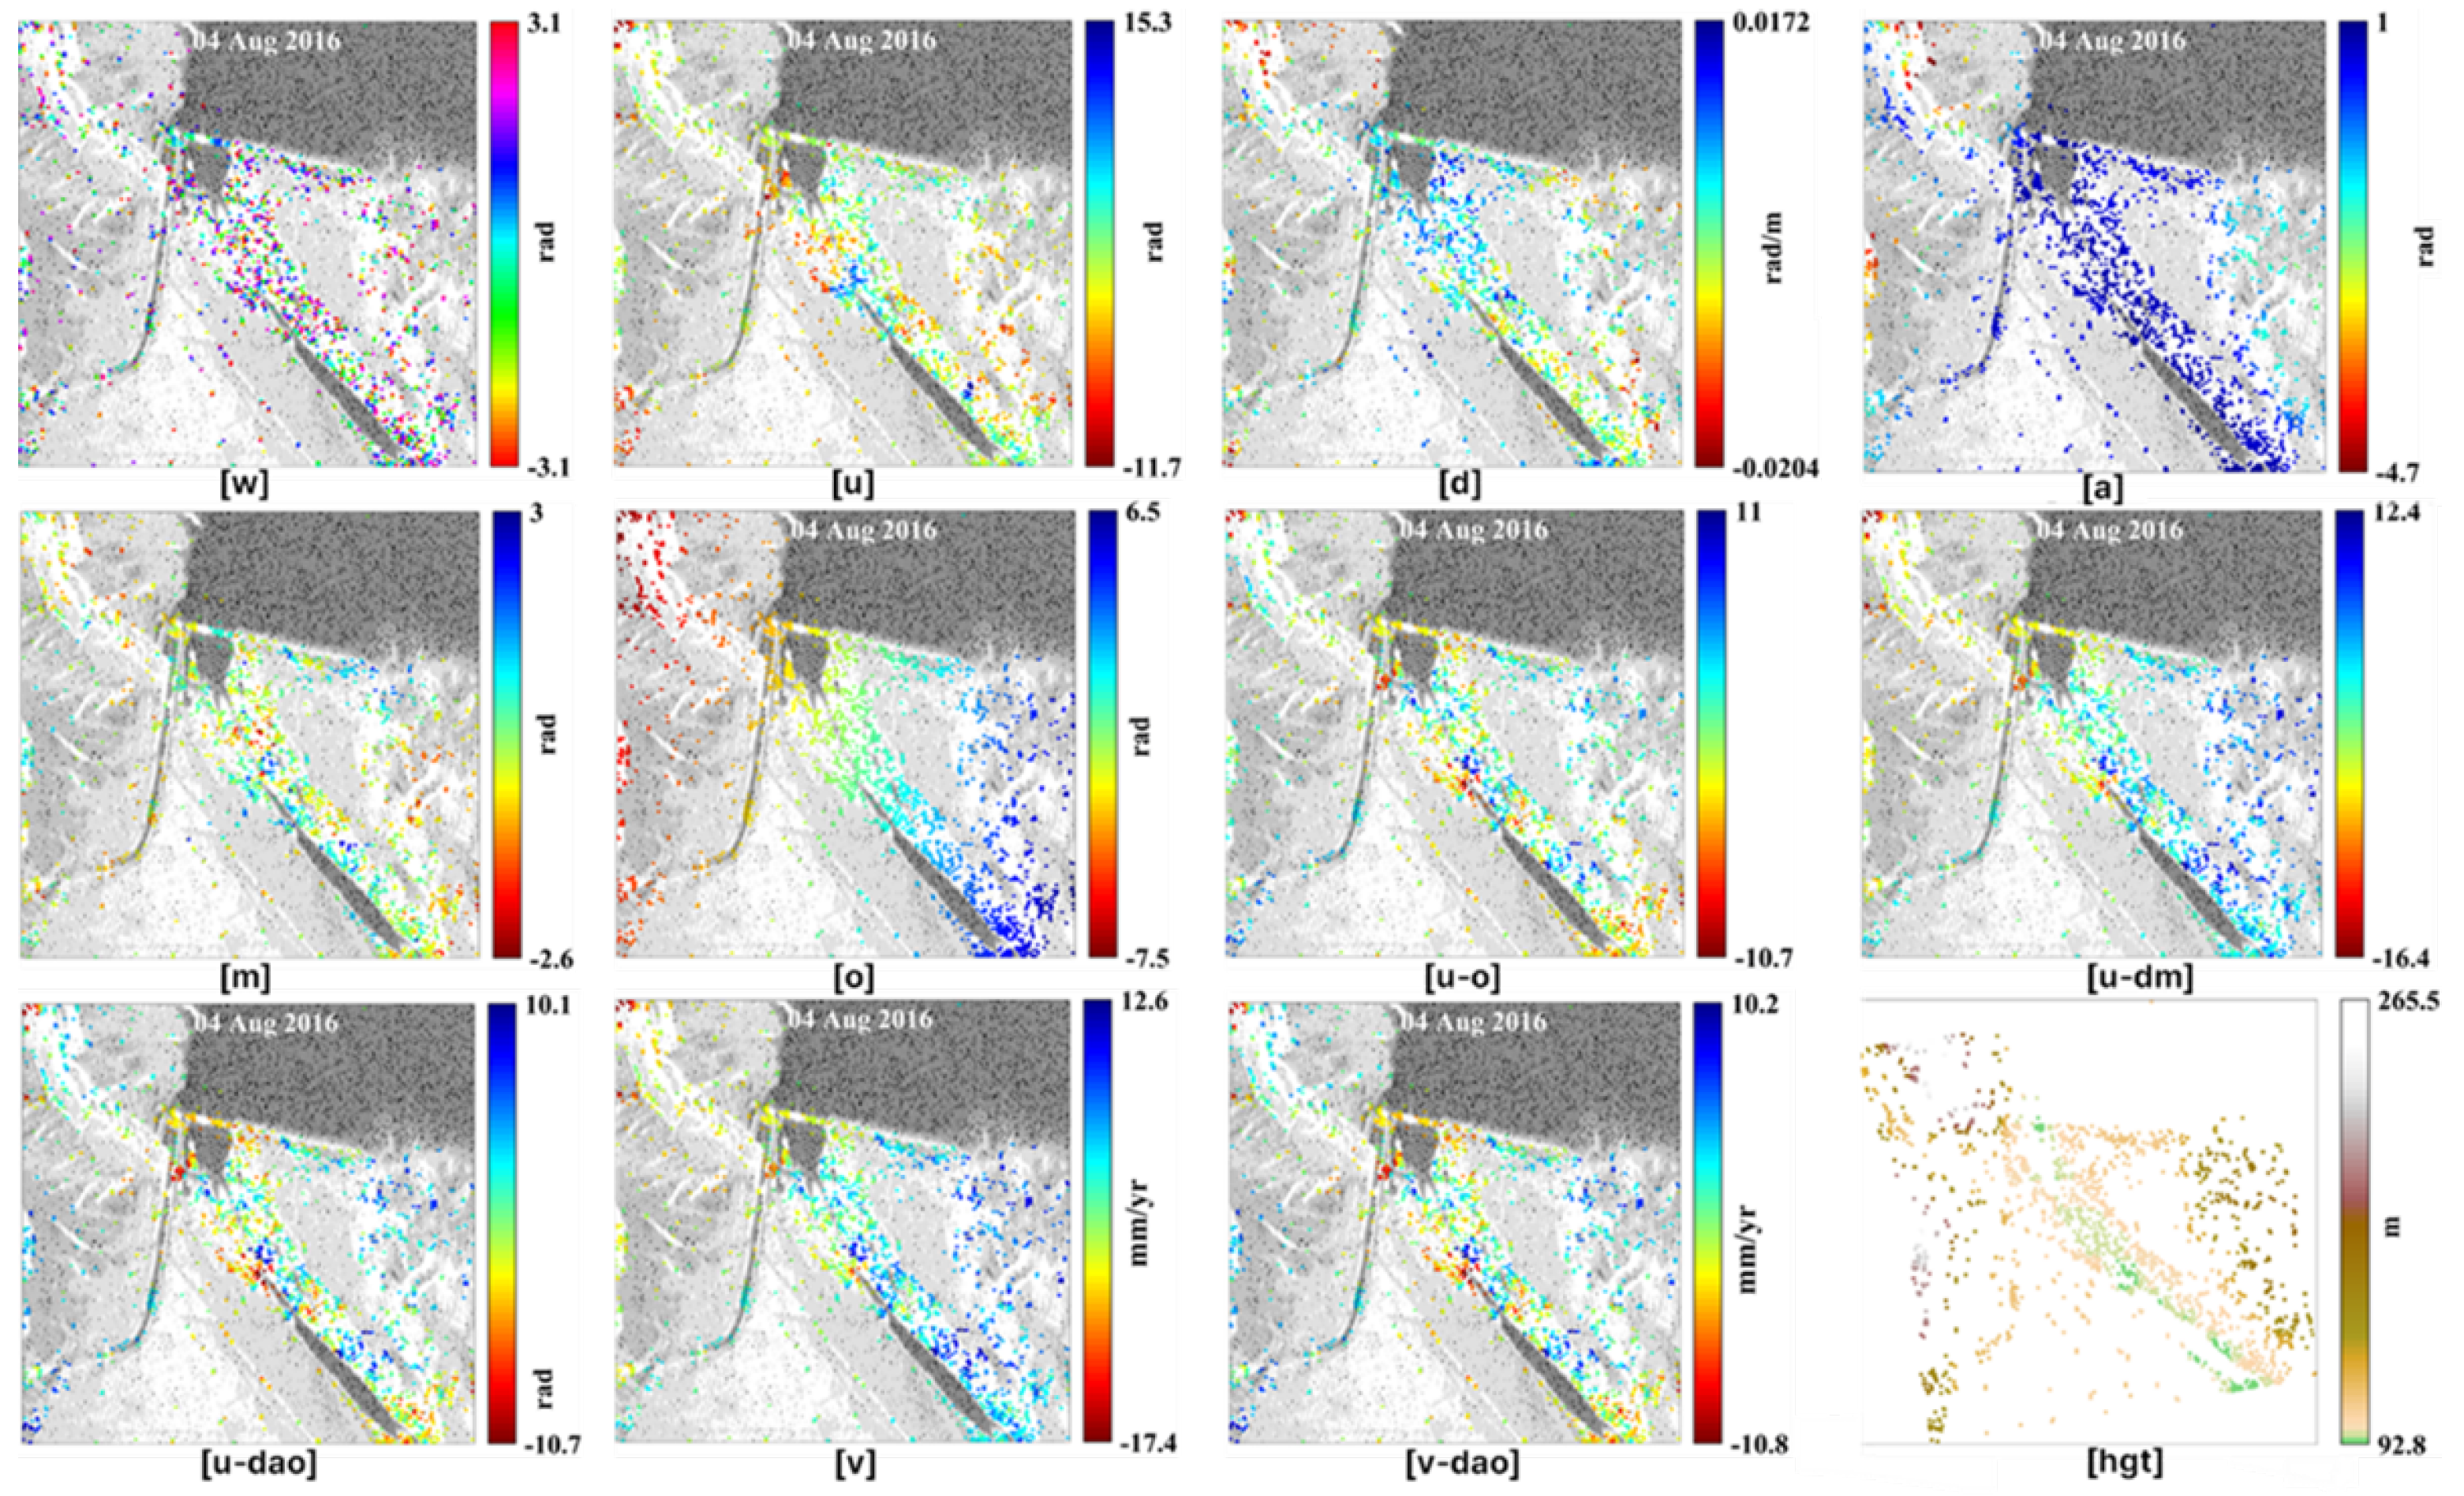
Figure 5.
Methodological framework for land displacement mapping using time-segmented compressed SAR (TS-ComSAR).
Figure 5.
Methodological framework for land displacement mapping using time-segmented compressed SAR (TS-ComSAR).
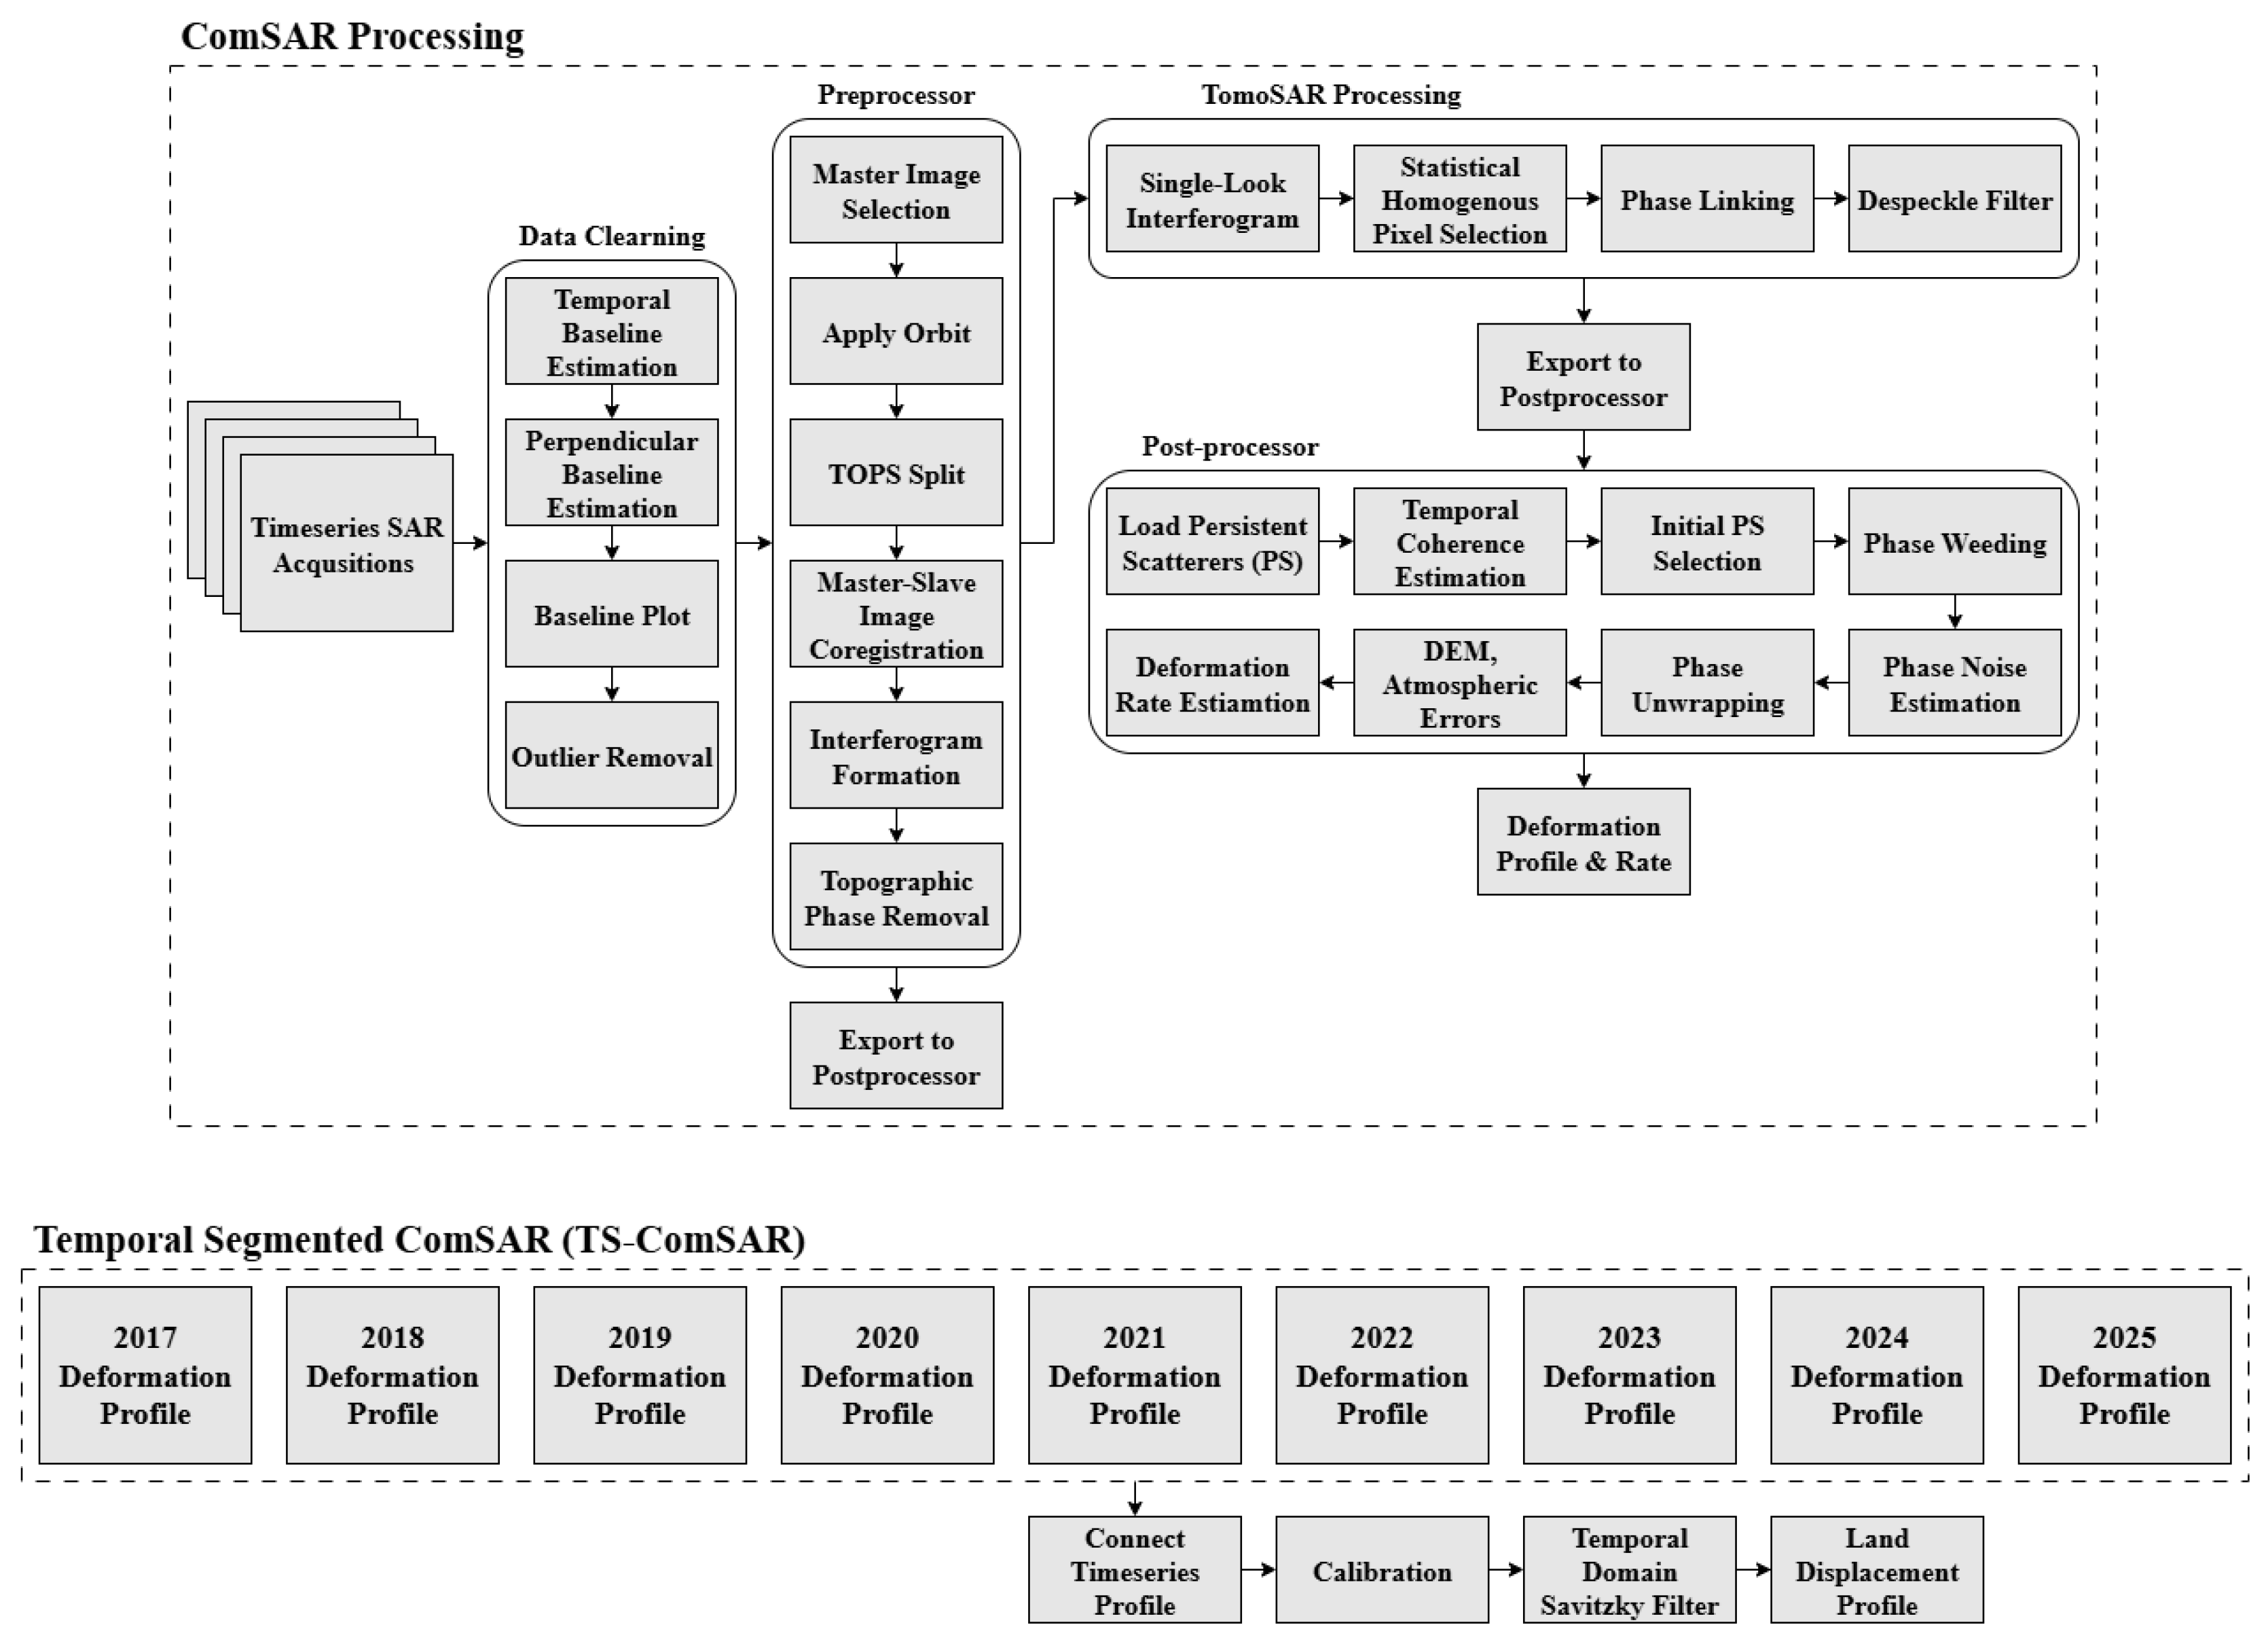
Figure 6.
Spatial distribution of estimated land displacement derived from the full time-series stack processed using the ComSAR algorithm.
Figure 6.
Spatial distribution of estimated land displacement derived from the full time-series stack processed using the ComSAR algorithm.
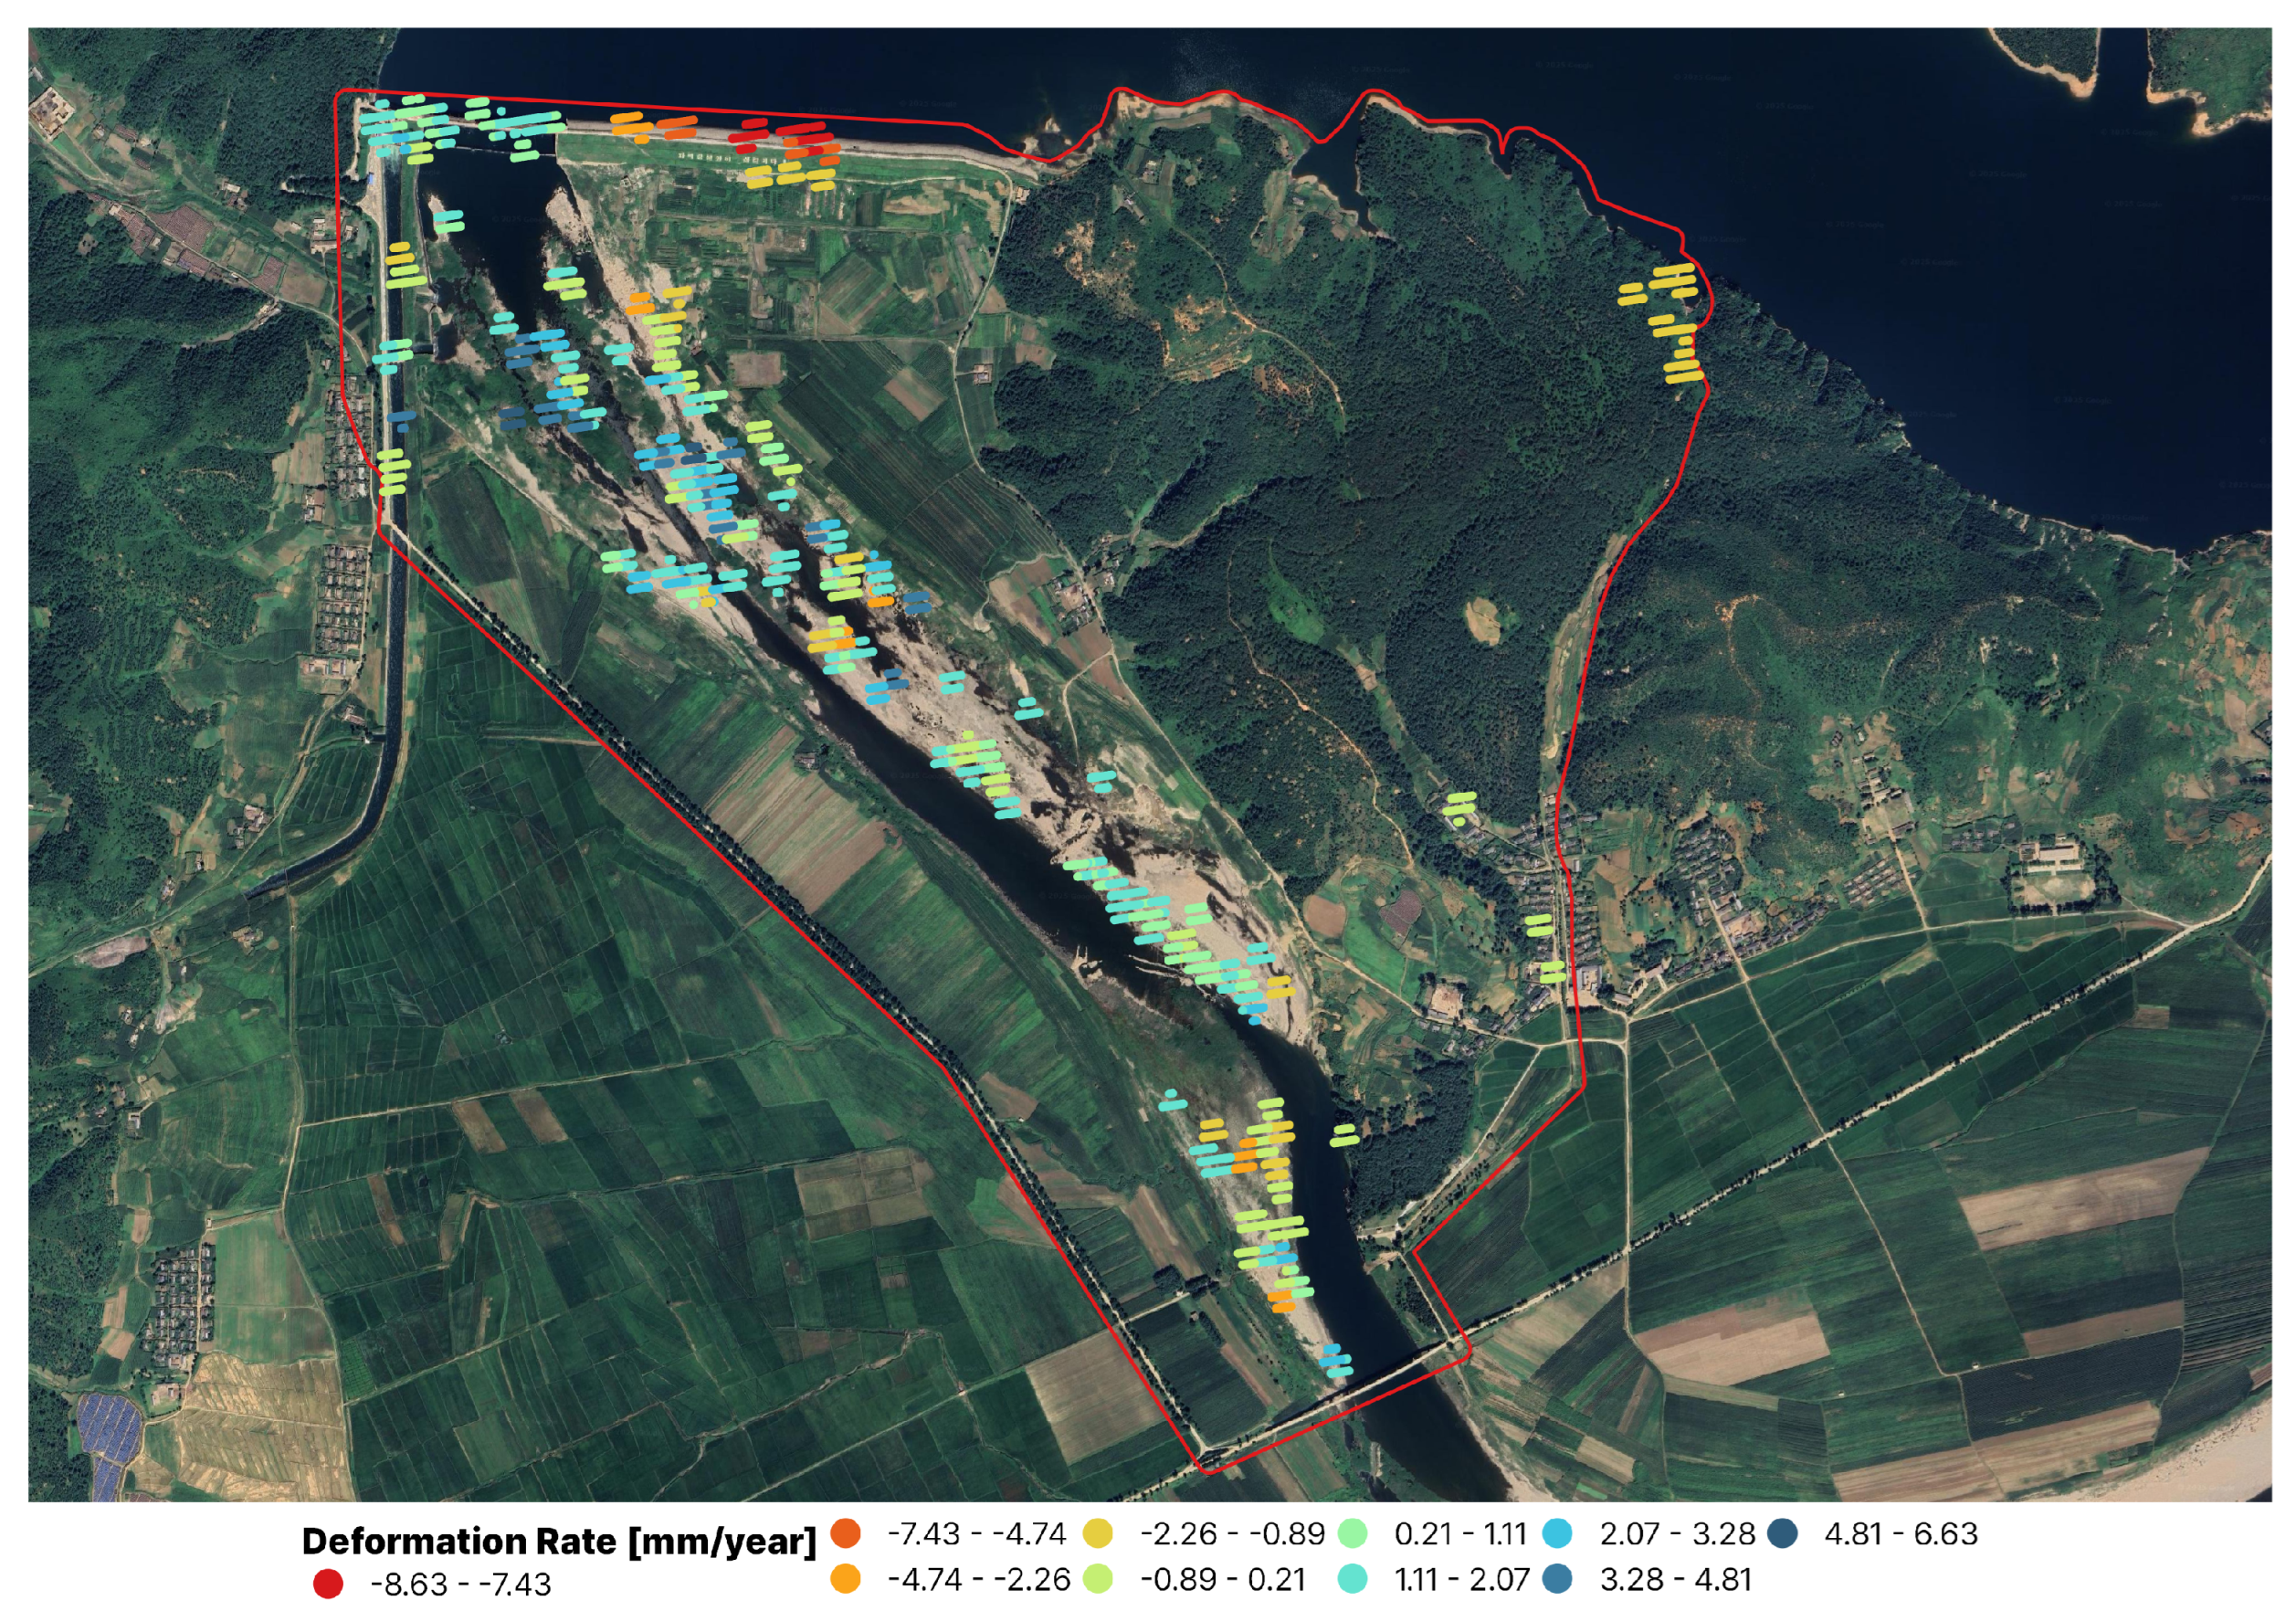
Figure 7.
Spatial distribution of estimated annual land displacement derived from the full time-series stack processed using time-segmented compressed SAR (TS-ComSAR).
Figure 7.
Spatial distribution of estimated annual land displacement derived from the full time-series stack processed using time-segmented compressed SAR (TS-ComSAR).
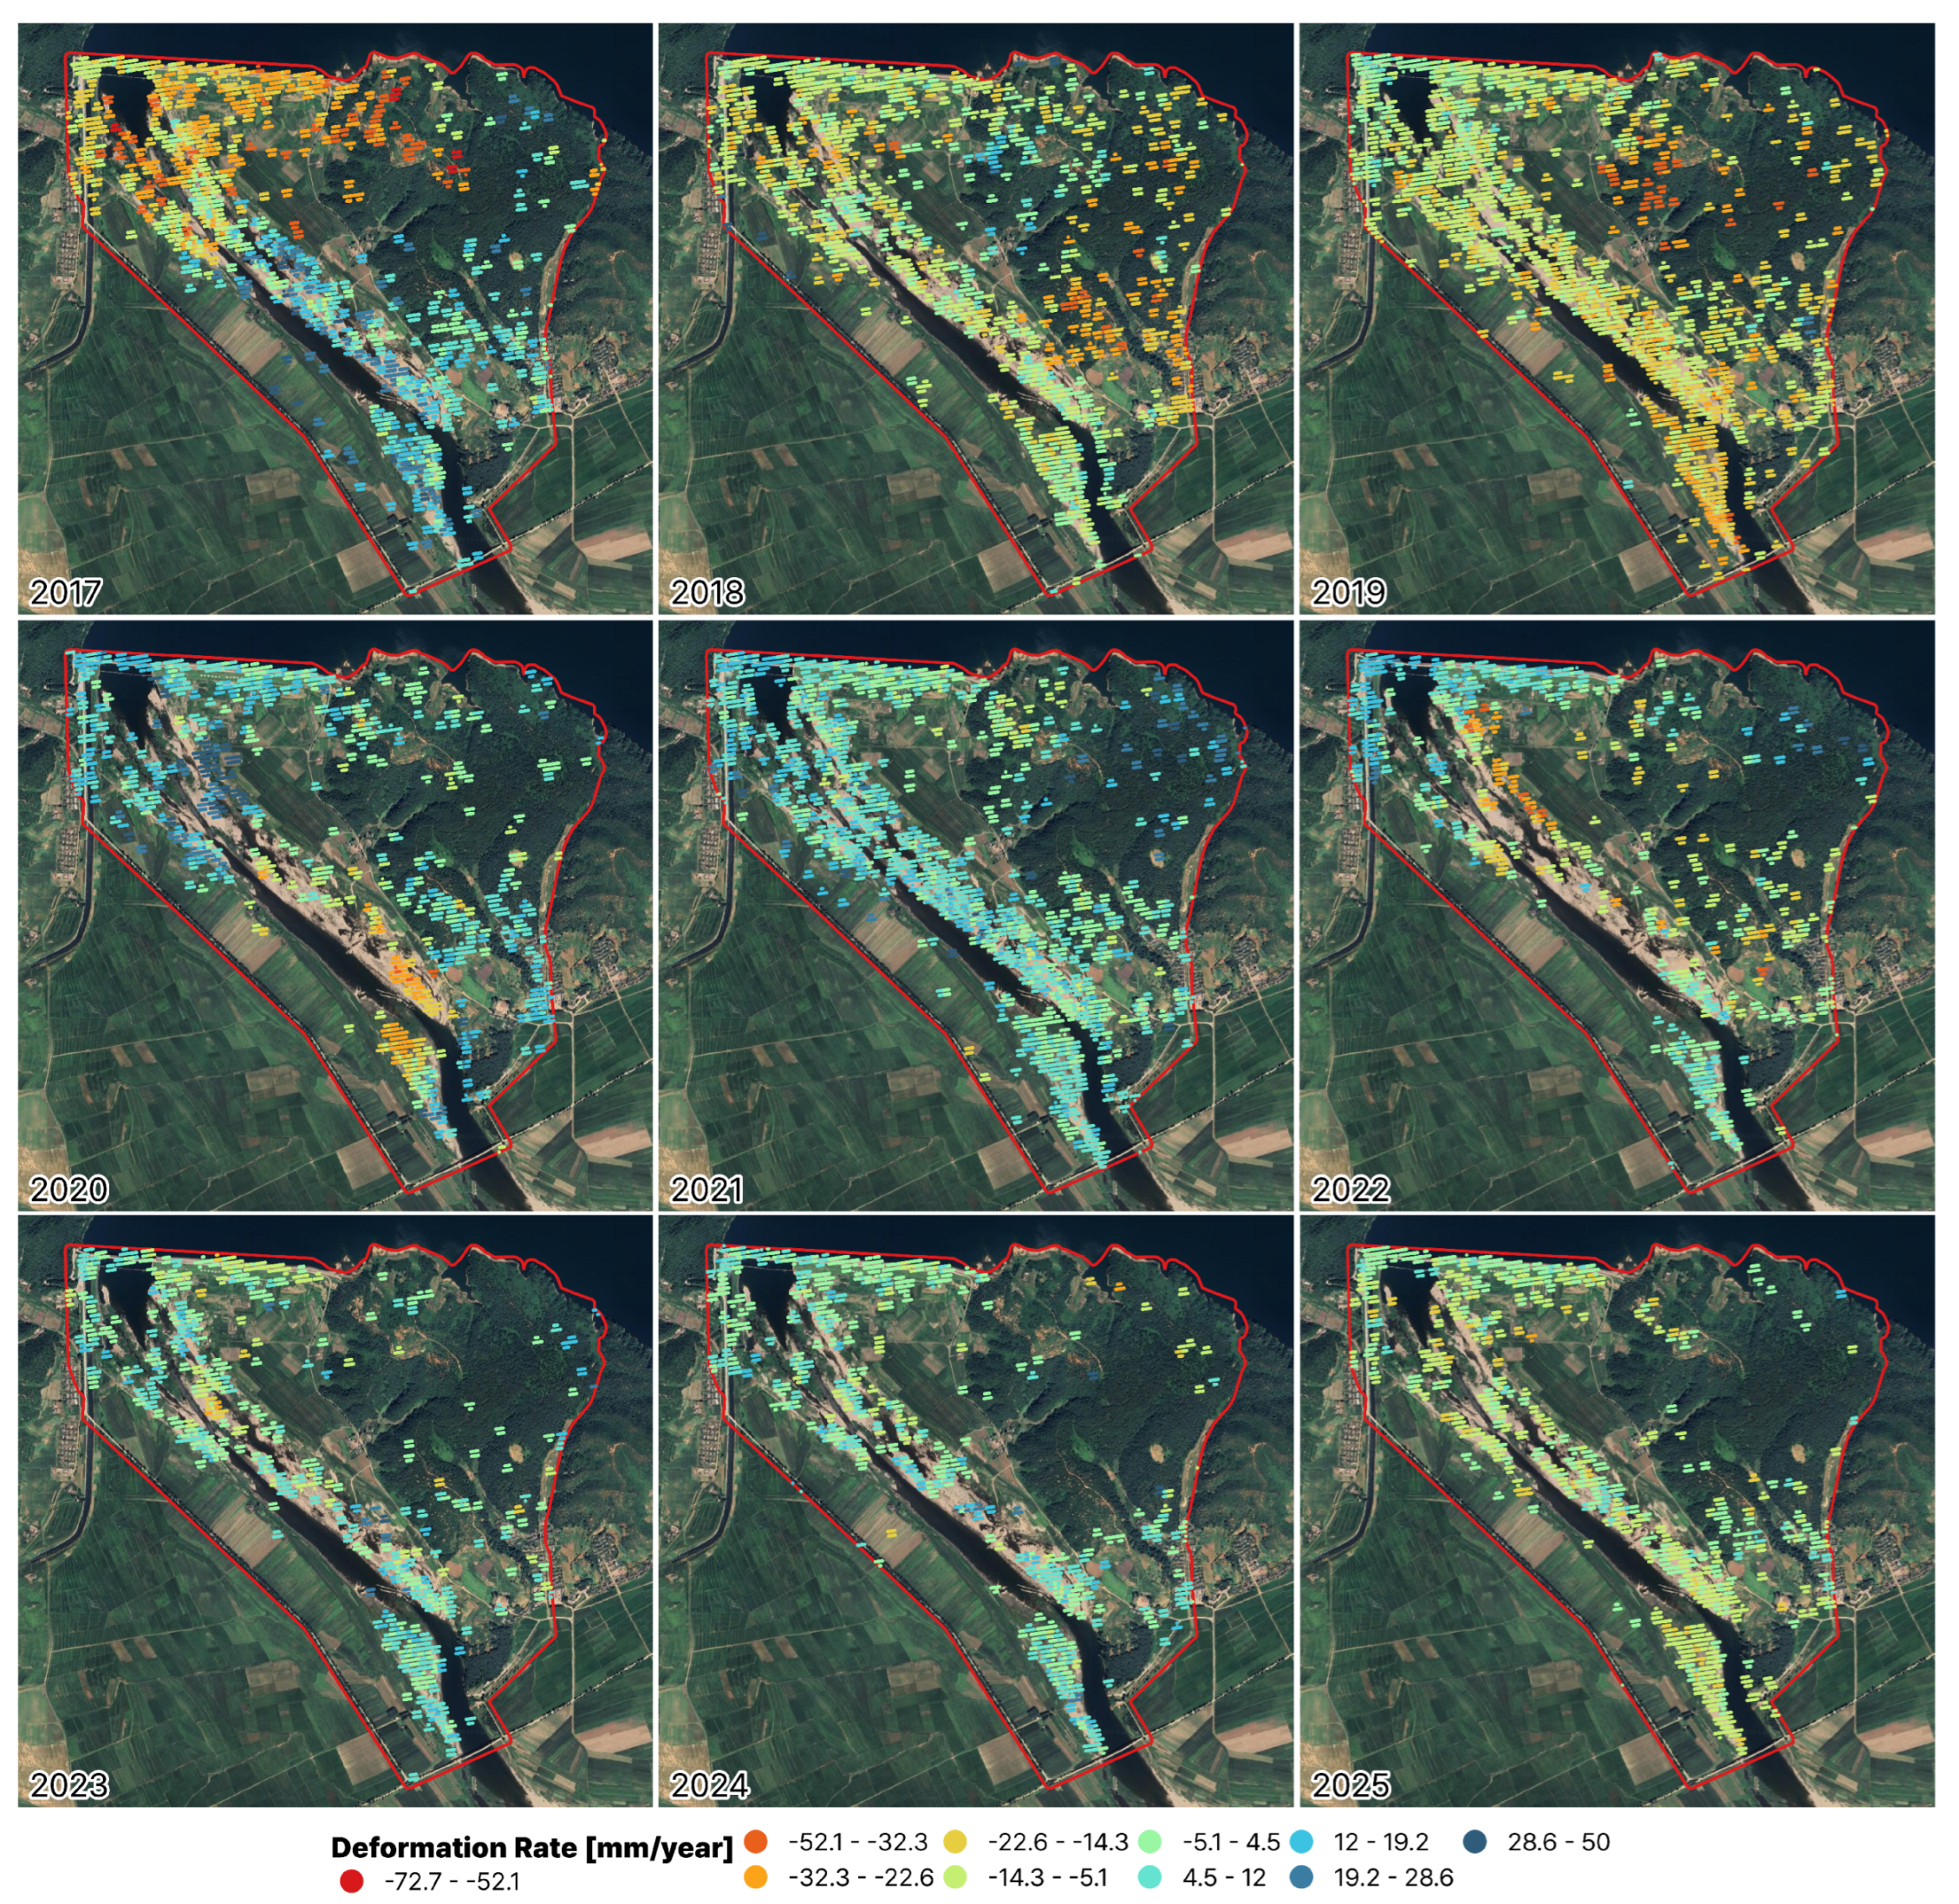
Figure 8.
Spatial distribution of estimated land displacement along Hwanggang dam embankment derived from the full time-series stack processed usingsing time-segmented compressed SAR (TS-ComSAR)
Figure 8.
Spatial distribution of estimated land displacement along Hwanggang dam embankment derived from the full time-series stack processed usingsing time-segmented compressed SAR (TS-ComSAR)
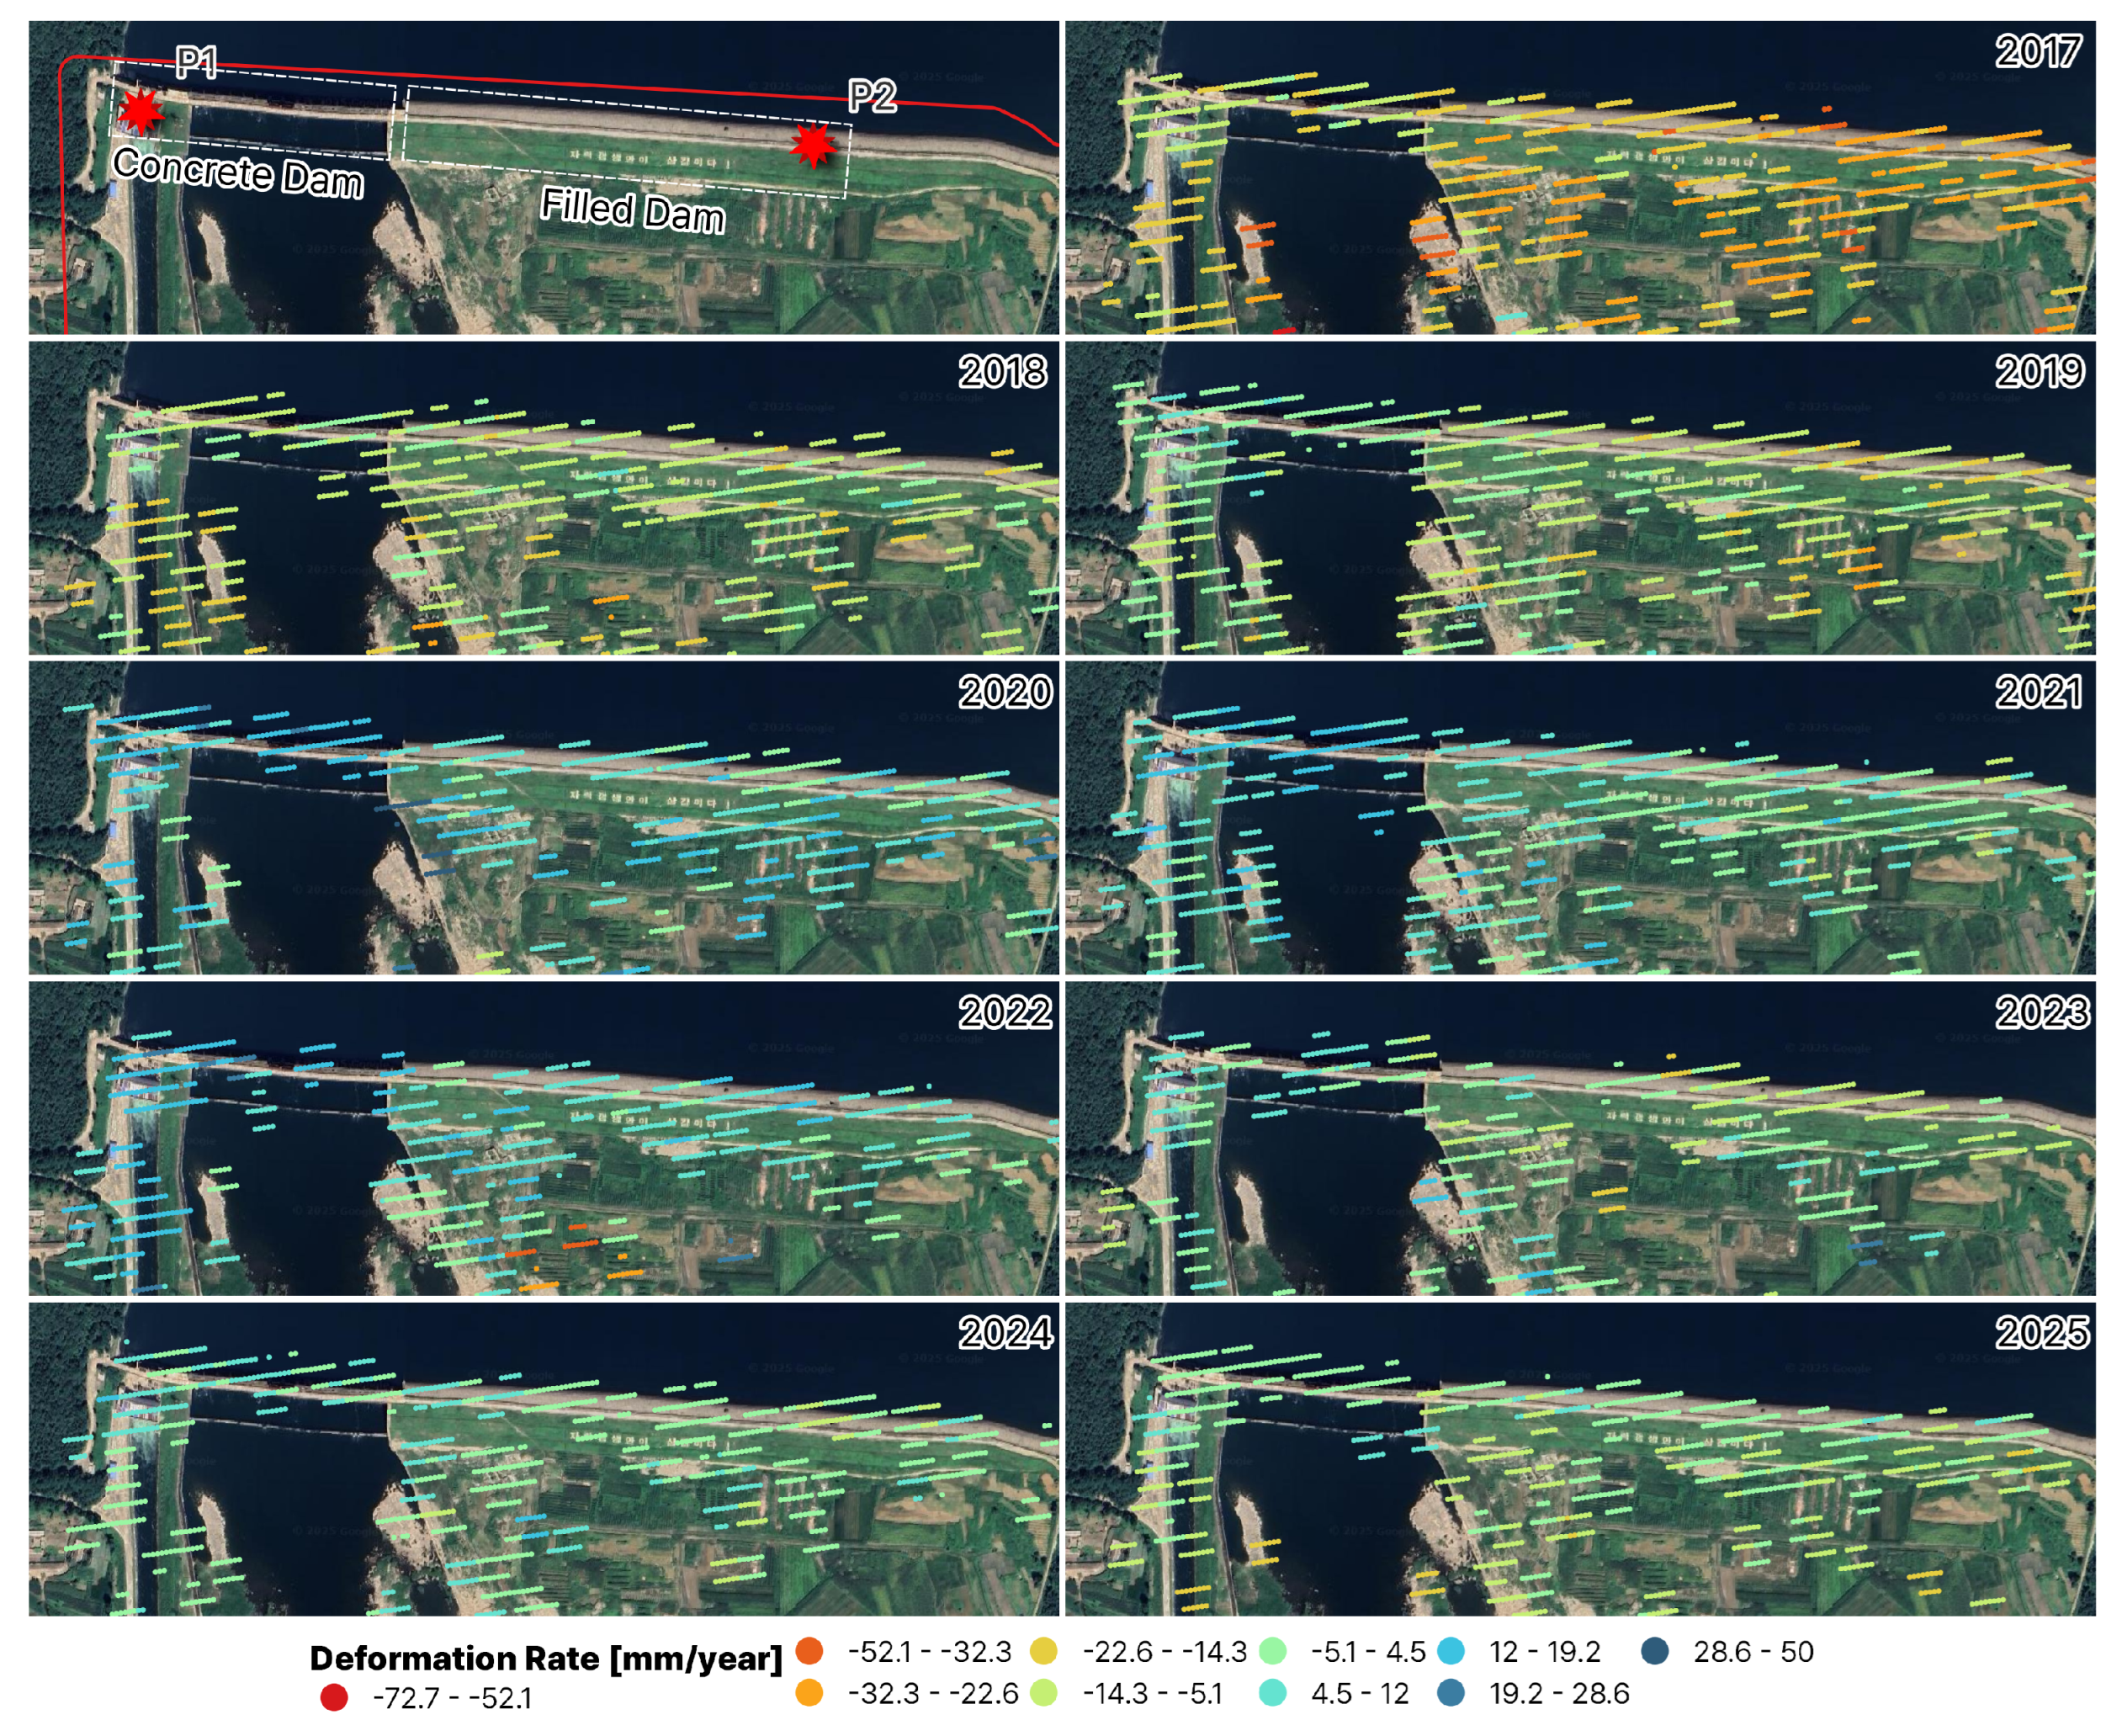
Figure 9.
The representative deformation profile of Hwanggang dam embarkment along point P1 (concrete dam) (a) Raw land displacement profile (b) Smoothed land displacement profile.
Figure 9.
The representative deformation profile of Hwanggang dam embarkment along point P1 (concrete dam) (a) Raw land displacement profile (b) Smoothed land displacement profile.
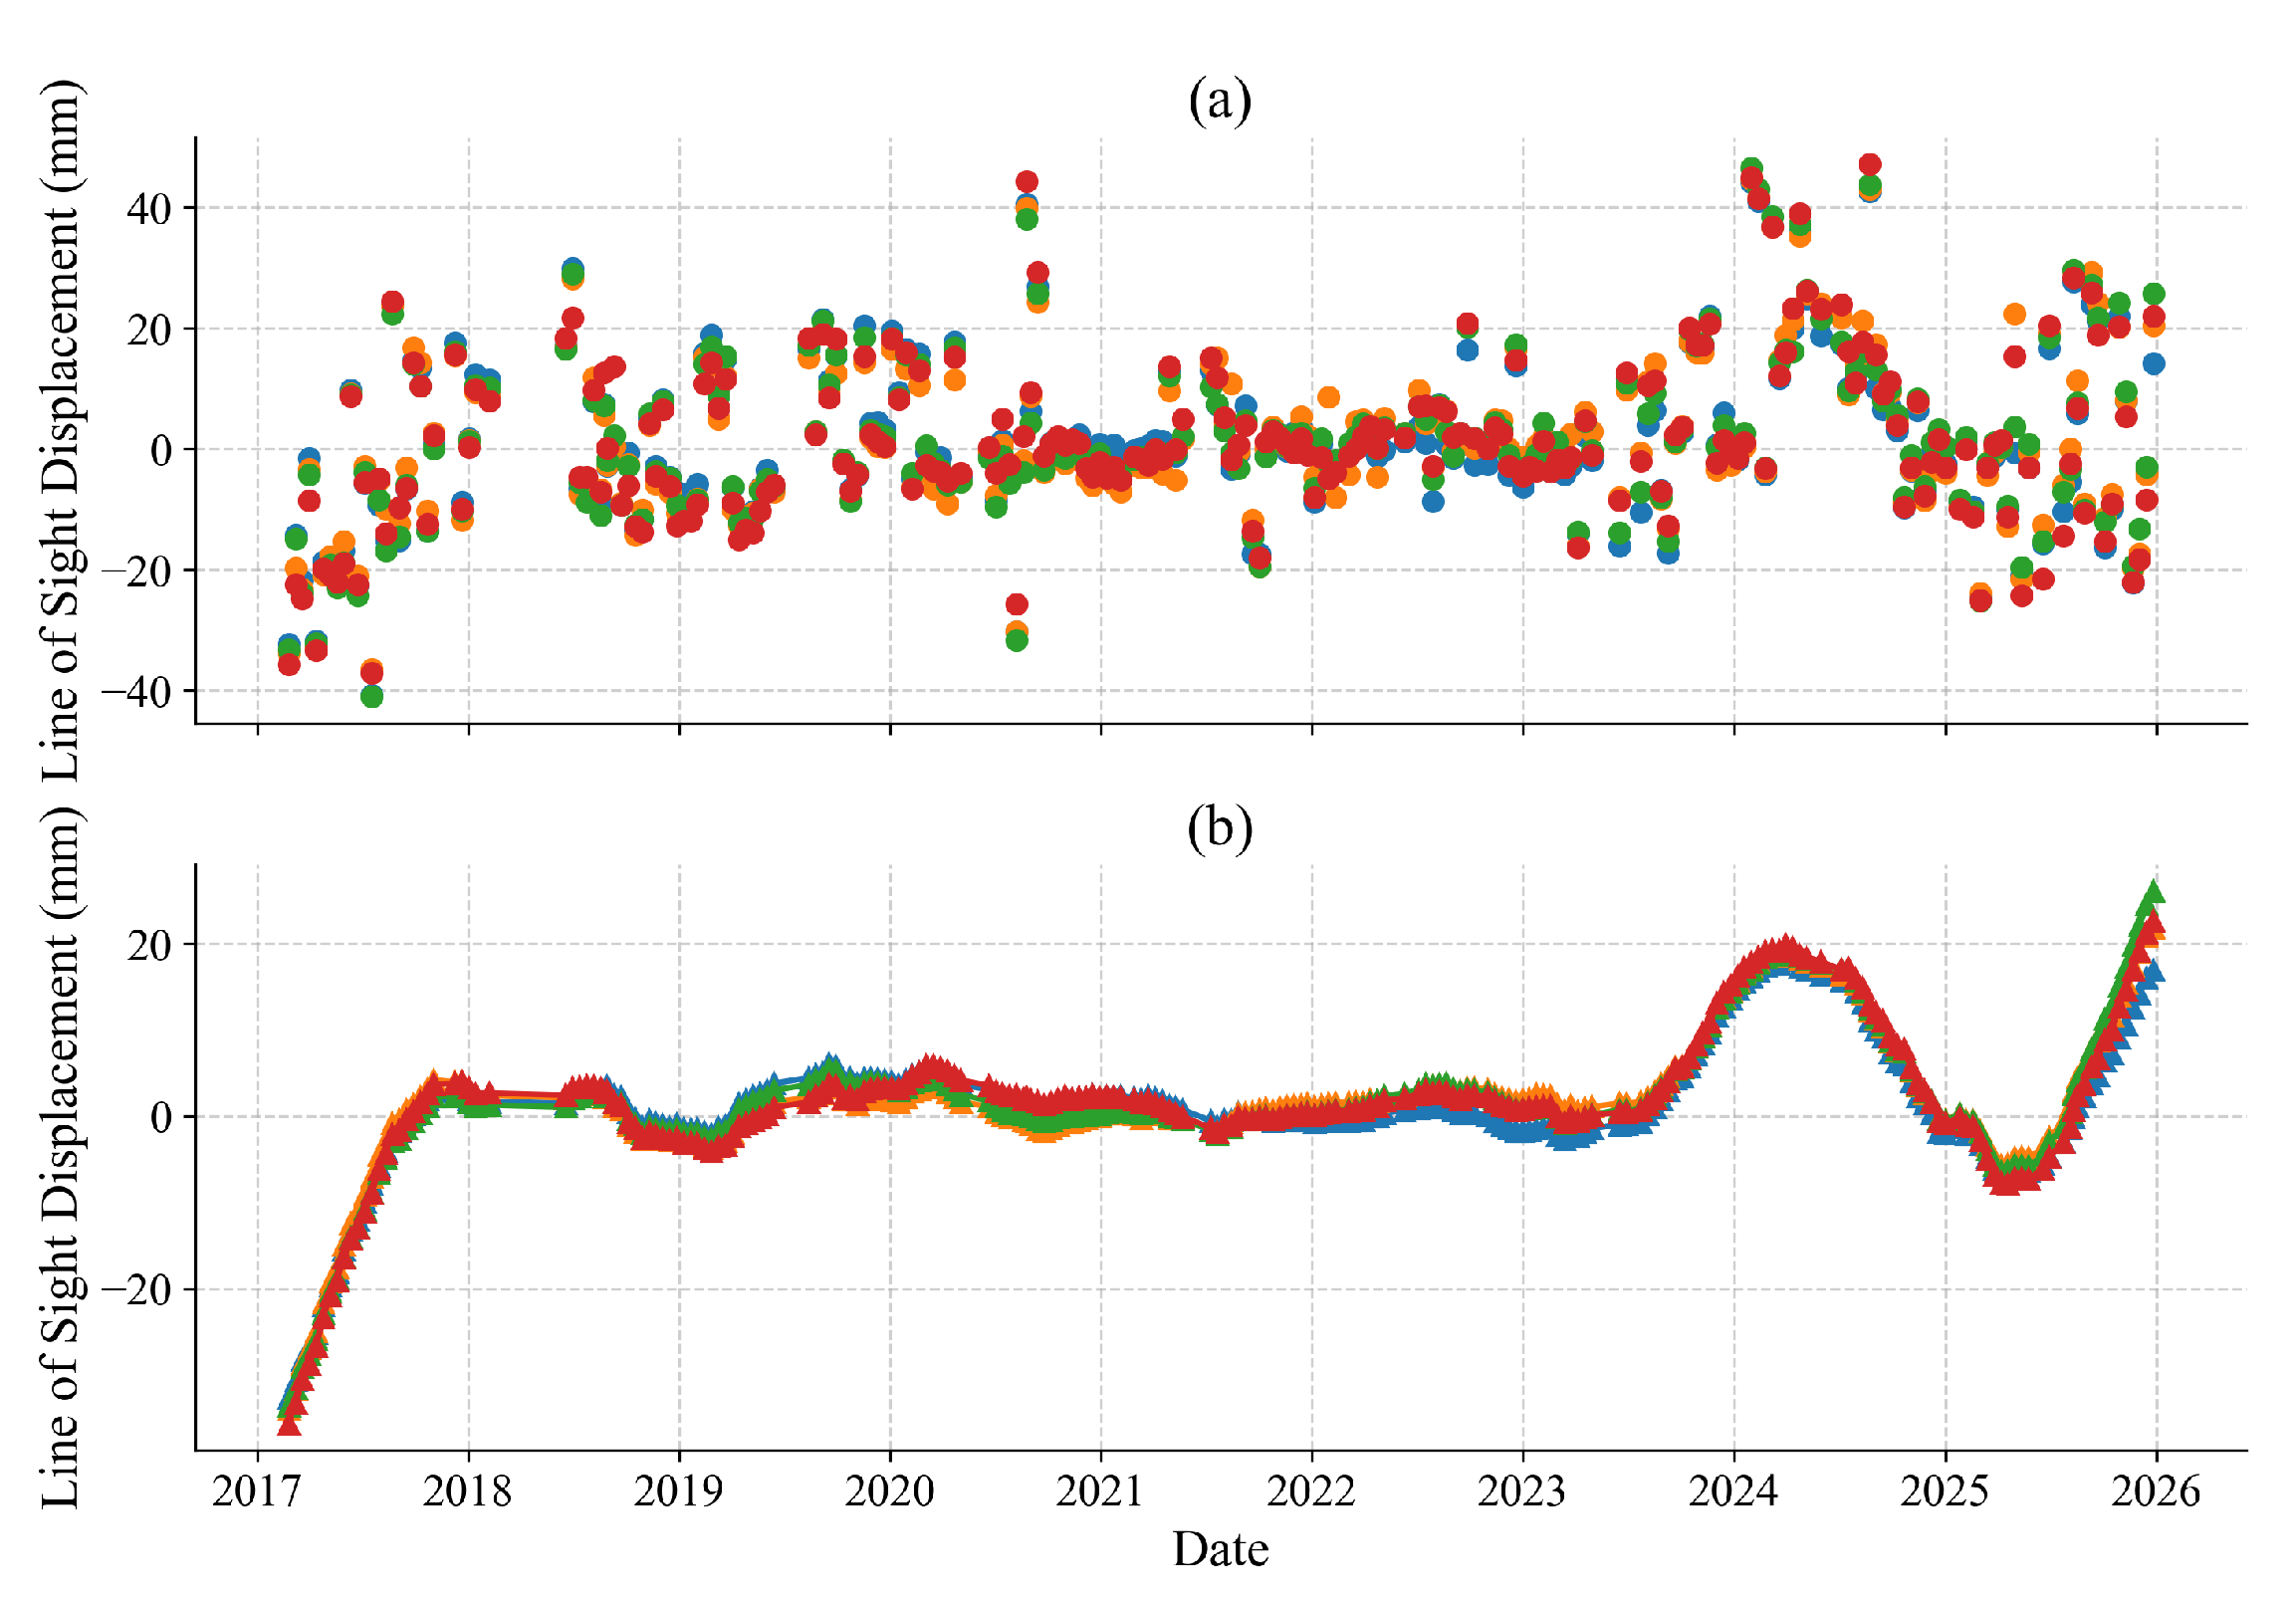
Figure 10.
The representative deformation profile of Hwanggang dam embarkment along point P2 (fill dam) (a) Raw land displacement profile (b) Smoothed land displacement profile.
Figure 10.
The representative deformation profile of Hwanggang dam embarkment along point P2 (fill dam) (a) Raw land displacement profile (b) Smoothed land displacement profile.
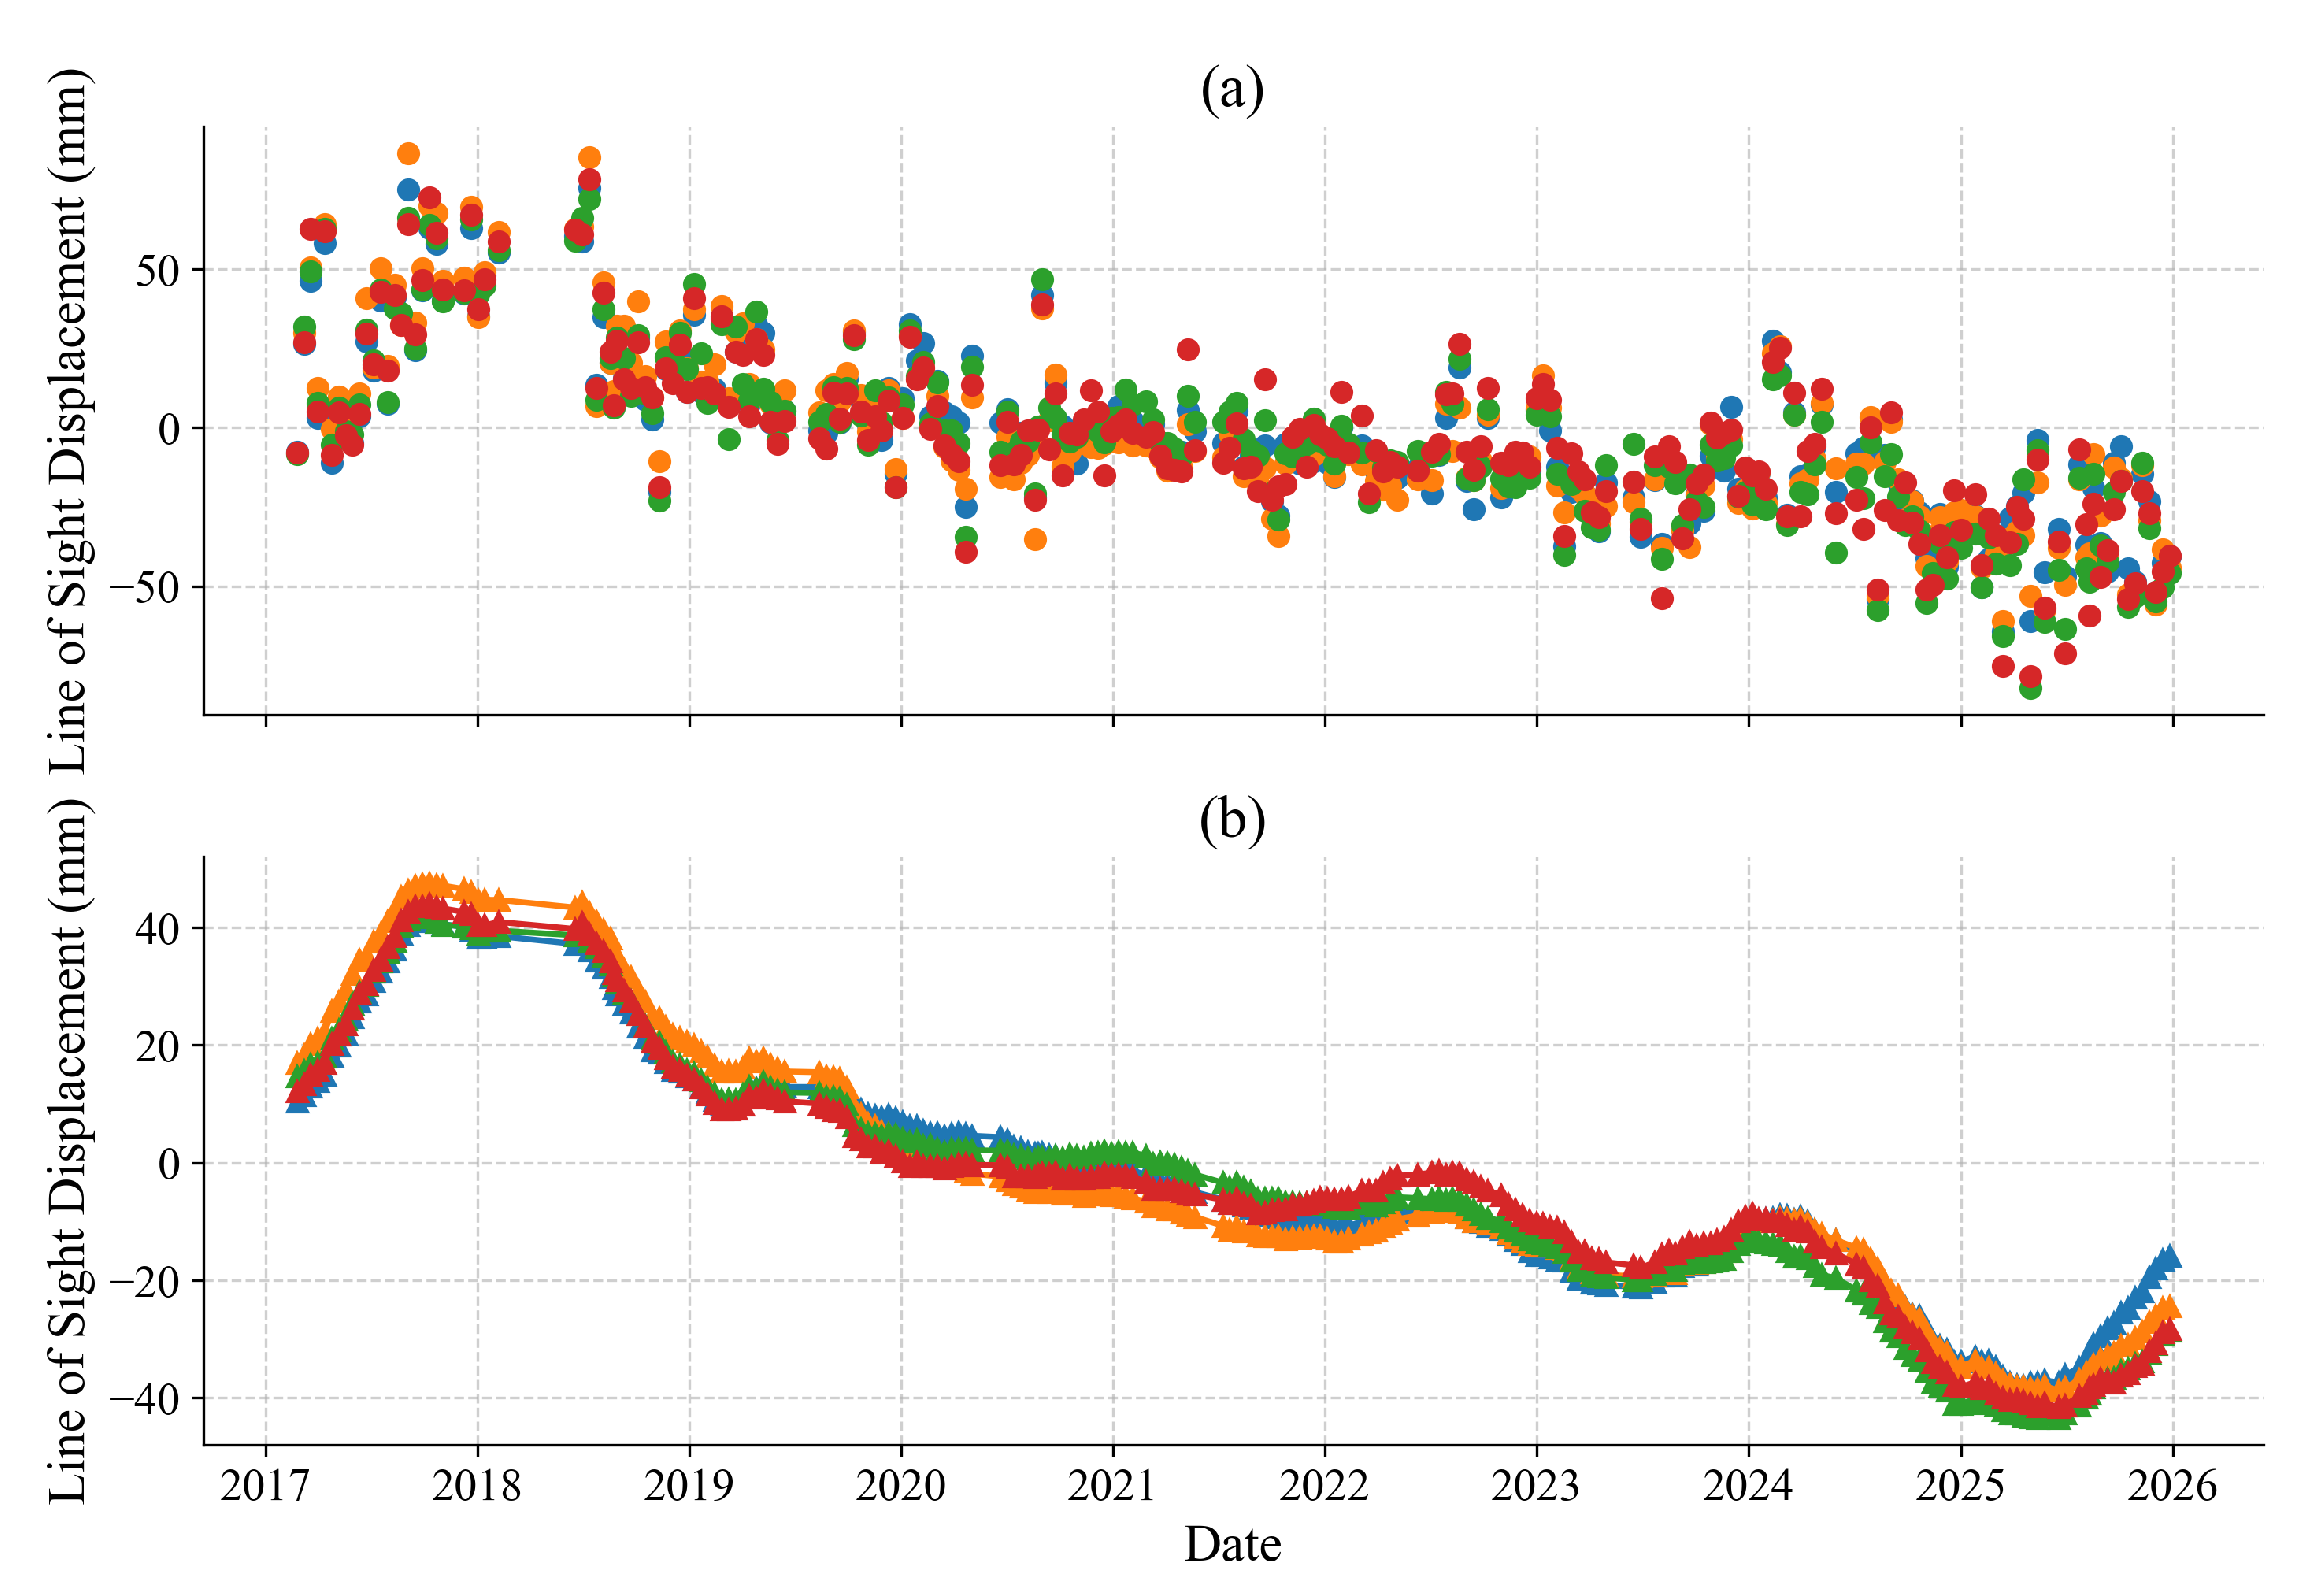
Figure 11.
The representative deformation profile of difference between point P1 (concrete dam) and P2 (fill dam) on Hwanggang dam embankment.
Figure 11.
The representative deformation profile of difference between point P1 (concrete dam) and P2 (fill dam) on Hwanggang dam embankment.
Disclaimer/Publisher’s Note: The statements, opinions and data contained in all publications are solely those of the individual author(s) and contributor(s) and not of MDPI and/or the editor(s). MDPI and/or the editor(s) disclaim responsibility for any injury to people or property resulting from any ideas, methods, instructions or products referred to in the content. |
© 2026 by the authors. Licensee MDPI, Basel, Switzerland. This article is an open access article distributed under the terms and conditions of the Creative Commons Attribution (CC BY) license.
Copyright: This open access article is published under a Creative Commons CC BY 4.0 license, which permit the free download, distribution, and reuse, provided that the author and preprint are cited in any reuse.


