
Submitted:
28 January 2026
Posted:
29 January 2026
You are already at the latest version
Abstract
History attempts to make sense of disparate information trying to create a discourse that lays a series of events with crisp cause-effect relationships in a sequence. Epochal shifts, such as the change from Antiquity to Middle Ages, are especially complex since they involve a large number of economic, political and even religious factors which occur over long periods and that might overlap and interact through reciprocal feedback mechanisms, making this cause-effects sequence difficult to establish. In this research we adopt a data-driven and well-established methodology to identify, with quantifiable statistical precision, the moment when this shift happened, and from there arrive at its possible causes. We will use historical coin hoard data to find out whether such a shift is detected in a peripheral part of the Roman Empire, the Iberian Peninsula. To do so, we will apply different changepoint analysis methods to a time series of trade links created from that data, and conduct a retrospective analysis based on that result, analyzing the structure of the trade networks before and after the link. Thus, we progress from identifying when the shift happened to identifying where it took place, which in turn allows us to get to investigate why it happened; namely, historical events that could have caused it. This methodology can be used to analyze epochal changes in several steps using time-stamped network data, possibly finding disregarded causes or cause-effect links that could have been overlooked by qualitative methods; in this case, we have applied it to a dataset of coin hoards either found in the Iberian Peninsula or including coins minted there, finding a changepoint in the early 5th century, which, through network analysis, has been linked to a loss of trade with the area of Britain.
Keywords:
economic history
; historiography
; changepoint analysis
; fall of the Roman Empire
; Iberian Peninsula
; late antiquity
; early middle ages
1. Introduction
When did the world, as the ancient people knew it, come to an end? This is a question that, even today, does not have a definitive answer by historians, as exemplified by recent papers like [1]. Although, in general, this moment is generally ascribed to the fall of the Western Roman Empire, one question, when did Antiquity change into the Middle Ages, leads to another, when did the Western Roman Empire fall? And when the answer to that question is found, there is yet another question that needs an answer: why did it fall?
These two questions generally go together. When a significant causal factor is found, it is used to establish a date for the fall by establishing when that factor peaked or reached its bottom; this date need not affect historiography, since the boundary between late Antiquity and the Middle Ages in Western Europe is well accepted for the time being; however, it will affect the context in which other events happened, or why they happened. On the other hand, if a definite date is found for a change of trend or regime in the archaeological record, this can lead to new factors that explain the political disaggregation and economic collapse of the Western Roman Empire.
The initial and mostly discarded approach of [2] starts with the date of the fall of the Roman empire and then tries to identify reasons prior to that date that could have caused it. Mainstream researchers today, however, and certainly most mentioned by [3] follow an approach that enriches written sources with archaeological and environmental data, an approach that tries first to find why and then establish a date for the change of regime. In the use of different sources, this approach was originally proposed in the 20th century by Henri Pirenne [4], who posited that humanity inhabiting Europe and the Mediterranean basin followed more or less in the same way its daily life until around the 7th century, when the expansion of the Islam disrupted societies and economies in the Southern Mediterranean and ended centuries of trading practices, including trade itself. This approach came to be called tout court, that is, the whole field, considering all sources of information, including material culture, as well as meteorological and geographical data.
This approach, that includes all kind of sources, especially data from different fields, was the one taken by [5], who explicitly includes disease and climate in its title and clearly establishes the relationship between these two (See Box 5.1, entitled "Twin calamities: How Climate Events Trigger Epidemics"), including also data on inflation (with wheat price going up to the year 360 and then decreasing in the last point of the series, Fig 5.4). Still, although it logically follows from their data that the fate of the Roman empire was indeed sealed, there is no quantitative analysis of when a breakpoint occurred, where they originated, and what immediate effects they had that eventually led to the destruction of the Western Roman Empire as a functioning polity. Furthermore, this approach has been criticized by [6] with a more nuanced, and certainly wider field approach, that takes into account social issues in the impact of these factors, as well as a more subtle interpretation of climatic changes.
Harper et al.’s approach connects well with the cliometrics [7] approach to economic history, which went in parallel with the Annales school of historiography [8] looking for a more systematic and, when possible, statistically sound, approach to the establishment of historical fact and cause-effect relationships.
However, despite this way of writing about history and creating a historical narrative being better adapted for the study of epochal changes, from Antiquity to the Middle Ages, there are relatively few articles that use it specifically to the fall of the (Western) Roman empire; specifically. There are a few articles that use sources such as lead pollution [9] to explain some of the crisis that eventually led to the fall, but there are no papers that use statistical analysis to find a specific date when that change of regime took place, and then from that date try to identify more proximate causes.
It can be argued if, in a context where so many factors have an influence, talking about a single regime change or changepoint even makes sense. Epochal changes such as the fall of the Roman Empire have been studied by many researchers, and even if there is not a consensus on a small set of causes and their relative importance, it is generally accepted among scholars that change did not occur in a "point", but over a very extended period. [10], cited in [3], argues that the collapse of the Roman civilization goes as far back as the invasion of Hannibal in the 3rd century BC, which led to abandonment of agricultural land, which became breeding grounds for malaria. Certainly, a collapse is never caused by a single factor; there are many of them that can be correlated or linked in a cause-effect relationship. However, for every one of these factors, a point of no return is reached beyond which the collapse is inevitable, and the regime changes. Identifying those breakpoints helps us understand much better the mechanism of history, even more so if you work back from the identified changepoint date to the changes in the network, the nodes and edges (connections) where that shift took place.
From a statistical point of view, a change of regime or shift is called a change point or simply changepoint [11]. A changepoint, when it exists, divides a time series in two parts such that some statistical measurements such as the average differ maximally between them. Please note that, despite semantically being similar, this is totally different to a peak or change of trend, a statistical concept that is sometimes used in the same context; a change of trend occurs when a series with an upwards or downwards trend changes direction; this kind of series might not have a change point (for instance, if the width before or after the peak are similar); if it has a change point, its position will depend on how far away from the peak it goes before and after it, and then the change point will be located in a position that will be proportionally away from the peak.
We should emphasize that a changepoint is not an event; however, finding a changepoint in a time series is the starting point to better understand the dynamics, historical dynamics in this case, that lead to it; those dynamics might be triggered by a factor o series of factors, or caused by a specific historic event. In any case, information inside the time series, the dataset from which that time series has been computed, or eventually outside, is going to be needed. In most cases, and in the absence of data, only speculations, maybe well-grounded ones, can be offered. However, in the case of network data, additional analysis on the network before and after the event might yield additional information on the specific area of the network that was the most affected; in turn, that might lead, through additional data analysis or through historical sources, to a narrowing down of the possible factors and causes. For instance, in [12] we first detected a changepoint in the time series of the time Venetian doges stood in power from election to its death, whose average changed more or less abruptly by the beginning of the 14th century, to propose a possible cause that would explain that fact.
Although in many cases the result of stationarity analysis is also called change point1 [13], the concept is not the same. In a time series of economic data, in some cases the changepoint is that point in time where it reaches stationarity according to some test such as the Augmented Dickey Fuller [14]; stationarity occurs when a period with constant mean, variance, or autocorrelation is reached. More than abrupt change (which might or might not occur in the case of the kind of changepoints we are dealing with in this paper), these change points identify persistent change, since they lead to a stationary situation with one or several variables (or model) kept stable. For instance, [13] uses this kind of analysis on a time series of GDP per capita in different industrial countries, and tries to relate them to the industrial revolution, finding that real change only took place in the UK many years (seventy) after the purported date, 1750; they use historical sources to explain this difference, but the point here is that detection of a changepoint in a time series leads to a better understanding of the historical dynamics that led to it.
In this paper, we will focus on the Iberian Peninsula, by itself and as a representative of the periphery of the empire and how it was affected by the larger issues, or conversely, how it created challenges that eventually extended to the rest of the empire. There are several reasons for this: first, the quality and quantity of the hoards found here and the precision with which mints can be ascertained from these findings; second, as a peripheral part of the empire, it might have experimented disruption before or after the main changepoint, and to find out which one is the case would contribute to the understanding of the change from Antiquity to the Middle Ages. Finally, there is very extensive historiographical literature on the Iberian Peninsula such as [15], which might find it easier to connect epochal changes to trends or specific events. As we have stated before, one of the ways that makes easier to establish cause-effect relationship is to work on a time series that has been generated from dated network data; we will base our analysis in the well-known FLAME (Framing the Late Antique and early Medieval Economy) coin hoard dataset [16] processed to convert it in a network of regions (with either hoard or mints) and trade links, since the fact that coins minted in one region are found in another implies that, in the interval between the minting and the burying of the hoard, there has been some relationship between them, either direct or indirect.
Thus, there are several interrelated research questions that we will work with in this paper:
- Research question 1: Is there a changepoint in the Iberian Peninsula trade link time series?
- Research question 2: Is there a specific change in the network that can explain that changepoint?
- Research question 3: If that is the case, can that change in the network be explained by known historically established factors or events?
- Research question 4: Working in the other causal direction, would this be a new factor that would explain the fall of the Roman Empire and thus the end of Antiquity and the beginning of the Middle Ages?
Solving those issues in turn implies applying a methodology that can lend credibility to the responses obtained in every step; this methodology will work through these stages:
- 1.
- Process the dataset so that the generated time series reflects meaningfully when the associated data occurred.
- 2.
- Validate the resulting time series by resorting to internal checks, checks against another existing dataset for the same period or matches against historically established facts.
- 3.
- Use changepoint detection methods to find a changepoint in the time series, validating it via cross-check using other algorithms or methods.
- 4.
- Analyze data before and after the changepoint to narrow down the set of factors that might have contributed to it. Use again statistical analysis for doing it, from complex network analysis to other kinds of methods.
The following stage would be largely qualitative and involves the construction of a theoretical narrative; it would use the statistical analysis to create a sequence of events that would go from different factors to the changepoint, and from this one to the period boundary we are interested in, that from Antiquity to the Middle ages. Our intention with this paper is twofold: introduce this methodology in the field of digital history and cliometrics, as well as try to find novel results in the field of Late Antiquity history that have fair historical and statistical support.
The rest of the paper is organized as follows: next we will present the current state of the art in the application of change point detection methods in history, as well as any other analysis that try to research the boundary between Antiquity and the Middle Ages. We will describe and show an overview of the dataset in Section 3. The data will be analyzed, trying to respond to the research questions in Section 4. Finally, we will discuss these results and present our conclusions in Section 5.
2. State of the Art
The research that produced this paper was initiated by the publication of a preprint by [17] which set out to analyze changes in economic regime in the Mediterranean as reflected in coin hoards found during a millennium. The central finding of this paper is that we can use existing datasets that have a basis in trade, like coin hoards, to find evidence of disruption in economic patterns, since trade is at the same time one of the main drivers, as well as indicators, of economic activity. This change in economic regime was predicted by [4], claiming that the real Middle Ages did not start until the onset of the Islamic invasion of the Middle East and North Africa disrupted the trade routes, breaking it into smaller, regional ones, which had to become economically self-sufficient.
The central idea of this school of thought is that traditional historiography’s so-called break points—such as the fall of the Roman Empire—should be reconsidered in light of all available evidence. This includes unconventional data sources like the one used in this paper: coin hoards, which serve as a proxy for trade activity. Conclusions about historical transitions should only be drawn after such data has been analyzed and tested statistically.
For example, [18] examined lead pollution and blood-lead levels, linking them to cognitive decline that may have contributed to Rome’s collapse. Lead exposure has long been studied as a disruptive factor in the Roman Empire, as further explored in [19], which relies on a different dataset. In contrast, Boehm and Chaney’s paper focus on patterns of economic growth and their evolution between the years 600 and 800. It does not attempt to pinpoint a specific moment of rupture or to identify its possible causes.
We are going to focus on this paper on the Iberian Peninsula. As a peripheral part of the Roman empire, any disruption might have affected it, but in a different way or in a different time frame. This is why we are especially interested in works that focus on this area, like [20], which actually focuses on the whole European part of the Roman Empire, and [21], more focused on the Iberian Peninsula itself. Of course, the final fall of the Western Roman Empire should have some kind of impact [15] on this area, since the Roman central administration definitely vanishes by mid 5th century. However, modern historiographical analysis, following Pirenne, tells us to look further than the written record and into other kinds of factors. Two of the most important factors that impacted the whole Roman empire were the Antonine and Cyprian plagues, which happened in the 2nd and 3rd centuries [18] and had lasting effects spanning at least five centuries.
Focusing on the Iberian Peninsula, the Visigoth invasion did produce some discontinuity, but trade continued decreasing during the 5th and 6th centuries, although most changes were relatively slow [21].
These multitude of factors can produce changes in time series related to economic activity, such as trade, but you need to apply rigorous statistical methods to be able to find the date when it occurs and then work back and try to explain the change in historical trends through the other data, historiographical, environmental, network and archaeological, that is available. This approach is called, in general, changepoint analysis, and it has been repeatedly applied to historical data including battle deaths [22], use of force by US presidents [23], analysis of the actual "for life" terms served by Venetian doges [12] and how shifts in marriage patterns explain the different shift points in the Republic of Venice [24]; the technique was initially created for climate variations [25] but since then, different algorithms, including Bayesian ones, have been applied to the analysis of historical time series [26].
A recent report [27] analyzed the whole dataset of coin hoards and found a change point in the early 5th century. An additional social network analysis discovered that the center of the network, previously based in the Danubian area, had collapsed after the changepoint, hypothesizing that the loss of the Danube and adjoining Roman-maintained and -guarded roads after the defeat of Adrianople and the inclusion of foederati homelands South of the river provoked a general disruption of trade patterns, and thus, by definition, the actual Fall of the Roman Empire and the beginning of the Middle Ages.
Collapse in trade patterns in networks due to the fall of specific nodes or edges has also been the subject of investigation quite recently by [28], who analyze networks in the late Bronze Age and try to identify the nodes that could have been the early harbingers of the collapse. By using a network analysis approach, they could date more precisely the breakpoint between two ages (Late Bronze and Iron) and advance hypotheses on which causes could have made a major contribution to it.
By focusing on the analysis of the trade patterns that coin hoards reveal, and using change point detection methods and focusing on a specific area, we should be able to find more precisely what group of trends produced those changes and if there were some specific events that produced those trends or their change. The variation in the dates of the changepoint might also reveal cause-effect chains in one direction of the other or locate with higher precision chain of events that led to change of a global scale.
How we processed the dataset used and the methodology applied to it in this paper will be explained next.
3. Materials and Methods
We have used the FLAME (Framing the Late Antique and early Medieval Economy) database as the foundation for this paper in its September 18, 2024 version, which is available from https://coinage.princeton.edu/flame-database-last-version. This project has published a series of datasets that contain information on coin hoards found all over the world spanning from the 4th to the 8th century. These datasets formed the basis for [17], although it was enhanced with more data that has not been published in data form so far.
We will focus on the Iberian Peninsula and the two countries with hoards and mints, Spain and Portugal2. We simply included in our datasets hoards or mints that had been geolocated to these two countries.
We might wonder about the validity of this dataset as an, if not complete, at least unbiased representative of the activity we want to study. Any archaeological dataset is a sample of all possible data on the objects that are considered in it, and will probably have some biases, as revealed by [29]. Certainly, those countries that are more urbanized will have found more coin hoards than those that are sparsely populated. In that paper, Spain has 36% of sites with a numismatic rating of "Good" or better, over 461 hoards that have been found; it is among the 4 countries that have been described in caption to Table 1 of that paper as having good data quality; in the conclusion, it affirms that
[...] in Portugal and Spain urban hoards more often have a high data quality.
So, this gives the subset of the original dataset we are using enough validity to be able to draw some conclusions from its statistical analysis; however, this matter is examined in more depth in the following subsections. In what follows, we will describe which specific files we have used from that dataset, and the processing they have undergone (Section 3.1), show a general overview of coin hoard data and its distribution in Section 3.2 and finally indicate how the dataset is validated in Section 3.3.
3.1. Dataset Processing
The FLAME database includes many different coin hoards datasets. The definition of coin hoard in these datasets is quite wide and provided by [16] referring to one of the subsets included in flame, called CHRE: they are simply groups of coins that have been found stashed in the same group3. Although they are generally referred to as hoards, that does not imply that they have been hoarded in times of trouble; the reason for stashing away some coins are mentioned in the same paper, and including such disparate things as some specific coins being forbidden or even ritualistic reasons; this implies that the times at which coins are buried, and with which they appear in the database, do not have a specific bias towards times of perceived crisis, or their immediate prolegomena. The fact, however, that they have been buried implies that the way these hoards sample the circulation might be biased in unknown ways; this is why it is problematic to consider them proxy data for economic performance [30]. Interpreting these coin hoards as indicators of economic performance would be highly problematic, as indicated in [31]; this author indicates that
... We cannot simply assume that the data we have are a representative sample.
However, that affirmation is made in the context of estimating economic indicators. Our context is more similar to the one indicated by [32], in the sense that we are dealing with connections between nodes in a network. Thus, while the relative strength of this connection will be affected by its interpretation as proxy data and sampling differences, Verboven still concludes that there are several promising fields where empirical archaeo-cliometrics can be applied within the framework of complexity economics.
We are explicitly working in a complex network and using complex network analysis to understand the dynamics behind the data and the historical events that occurred at the same time. Acknowledging the many biases, to which we have referred above, in the FLAME database, what we can say about these hoards are, in a first approximation, that these coins were physically together at some point in time, and possibly have some value, indicating a connection between the places that printed them and the place where they were buried. Of course, we cannot affirm that when there is no hoard there is no trade, but the fact that the FLAME database is comprehensive reduces bias in the sense; with quantity of data comes quality of data. Finally, since we are analyzing hoards as much as mints and considering them at the same level, the fact that both disappear in a certain area or the link between two places disappear will be a strong indicative of the depletion of economic activity in that area, at least if we consider big enough areas as we are doing in this paper, a place where trading as well as minting activity took place during an extended period of time.
We have used three FLAME datasets from the database:
- Coin groups, a dataset that contains individual information on the group of coins found in every hoard and the mint where they were minted; it includes also information on the range of time those coins were minted cross referenced to the two files below.
- Hoards, which contains information on the hoard itself, including the date it was found, the number of coins, and the place where it was found.
- Mints, that contains location information on said establishments.
We have made a series of processing steps to create the final datasets used in the paper. These will be described below
3.1.1. Geolocation
We have geolocated and assigned the mints and hoards to a specific current territory, using the GeoApify service. These are geographical markings more than actual polities; in many cases, besides, the minting place is not exactly known, in which case it gets assigned to the conventional center of a current territory.
In the case we identify current territories with polities in the time under analysis, we will use the most probable one; for instance, Turkey will be identified with the Eastern Roman empire, and Italy as the main site of the Western Roman empire. Please bear in mind that the main focus of this paper is the territories with which the Iberian Peninsula traded (as reflected by hoards) not so much as the polities that controlled those territories. These will be considered insomuch as they affect the interpretation of the results, but not as an important factor to obtain the results.
For instance, if Morocco is a node that shows up in the results, we will take into account only the territory it occupies, and use the fact that it was first a Roman territory and then under the control of the Vandals for additional interpretation within the temporal framework that obtained by the analysis [33].
From the result of this step, we have processed hoards and mints to keep only those that are placed in the two countries in the Iberian Peninsula, Spain and Portugal. These two names have been substituted by the generic territory under study, the Iberian Peninsula.
We were interested in the trade link density, that is, the number of coin groups from one country found in another country, so we processed all files above to obtain that information. We generated two files with this procedure:
- Iberian-only trade links, which contain only the trade links where the mint and the coin finding (hoard) are in the Iberian Peninsula.
- All trade links of hoards found in the Iberian Peninsula or that contain coins minted in it.
3.1.2. Processing into a Time Series
The FLAME database includes two fields with the start and end date estimated (and published) for the coin hoard; we will need to process these ranges into a time series so that we assign a specific value to every year in the it, which is what algorithms that deal with this kind of data need.
In order to make an informed choice on this allocation, a logarithmic histogram of the span of these ranges is shown in Figure 1. Most of them are in the 10-50-year range, but there is a certain amount that is much wider, more than 100 years; most of them are ranges of coin groups of which only the century is known. Using a single number, such as the average, to represent this span would introduce some artifacts such as the over-representation of the years "50" in a century. In [34], we adopted that solution, which is valid as a first approximation. It had, however, a drawback: averages had to be taken by decade since some years in the time series were simply void of any value. That, and the fact that due to the distribution of range sizes the average might not be a good representative of it, made us look for possible alternatives.
Assigning a value to a random variable for which we only know it has occurred in a moment within the interval is, in general, known as interval censoring [35]. Literature includes many methods to deal with this problem, depending on the width of the ranges, what we know about the variable within the range, and the precision we want to obtain from the analysis of the time series. Allocating the variable at any point, as we did before, is a simple method which might be valid in the case precision of the result is not so important, and the ranges are not too wide. Unfortunately, as shown in Figure 1, that is not the case in this dataset, so we must adopt another method; there are several methods available, including uniformly random allocation and multiple random imputation. In the latter case, we would have to run repeatedly the analysis to obtain a consensus on the result, a lengthy process and would increase the difficulty of the methodology we use, compromising its use by computational history practitioners, so we have adopted the former, that is, uniform allocation, as a good compromise between result quality and simplicity. We have produced an additional dataset from this one filtering those hoards whose date range is wider than 100 years. These will be used mainly for validation of the results; they will be called filtered in tables showing results.
Thus, what we have done is allocate uniform probability to every year in the range. If, for instance, the range goes from 310 to 320, every year will get 0.1 probability. We have called this variable link density; years included in more ranges will have a higher link density; years included in less will get correspondingly less. We have chosen this way of processing the data, unlike [34], since the ranges of some hoards were several centuries wide, and besides needed additional processing to work with decades instead of years, as in this case. This will correspondingly enhance the precision of the solution.
3.1.3. Description of the Final Datasets
As a result, we have two synchronous datasets with 517 rows that start in the year 284 and end in the year 800, namely:
- Time series of trade link density per year within the Iberian Peninsula.
- Time series of trade link density per year between the Iberian Peninsula and elsewhere. This time series was shortened to match the same beginning and end year as the previous one.
These processed datasets are available in R data format in the repository for this paper, https://github.com/JJ/medieval-trade4.
Figure 2 is a representation of the two time series mentioned, that is, the interior one and the one that includes links (including interior ones). The two time series follow a similar "drop" pattern in the same or very similar period; however, there are analytically relevant divergences which might make the analysis totally different. 5
3.2. Overview of Coin Hoard Data
The connectivity of the dataset is represented in Figure 3. In this Figure, as stated in Section 3.1.1, the vertices are current-day territories, and edges have a weight equivalent to the sum of the link density; intra-Iberian Peninsula links, acting as self-loops, have been dropped when creating the network.
The top edges of that network are shown in Table 1. At the top is the connection between Spain and the United Kingdom that was already pointed out in the introduction to this section. Obviously, connections between the Iberian Peninsula and Italy are important, as well as the connection with Turkey, where Constantinople, the capital of the Eastern Roman Empire, was situated. Next is France, notably the neighboring country so this should be expected. Connections further away than France, to the Netherlands, Germany, Sweden and to the Palestinian Territory and Greece, are also among the top connections.
This indicates a trade network that was maritime in a big part and which extended through the Mediterranean to the Middle East and through the Atlantic to Sweden. This is, however, the overall picture for the whole period under study.
The importance of trade with the United Kingdom might be, to a certain point, the evidence of a certain bias in the dataset, since the abundance of hoards in the UK is higher than in other places due to its population density and other sources of bias; this is mentioned explicitly by [36], which mentions a series of legislative measures that have made coin hoards found there more likely to end up in the database. On the other hand, it has been clearly established by scholars that Spain and the UK shared material culture [21] and that the trade in raw materials, luxury items, as well as transshipment through Spain of goods produced elsewhere, mainly in Africa, was intense [37] and long-lasting.
Regardless, we would need to discuss the validity of the dataset, which we will do in the next subsection.
3.3. Dataset Validation
In order to start our research on solid ground, we need to validate the dataset we are using, extracted from the FLAME database, finding independent proofs that, on one hand, the data it is based on is reliable, and on the other, how and in what way biases present in the data might affect results. This pre-analysis needs to be complemented later with a complementary one focused on how known biases might have affected said results.
It is well known that there are many inherent biases in any archaeological dataset, something we have already acknowledged in Section 3.2. The biases, as indicated by [36], mainly concern regional representation and their relative importance; the authors plainly assert that
... FLAME is not a representative sample of the ancient monetary circulation.
The main reason for this is that the FLAME database stands at the rear end of a funnel that receives all coins used in an area during a period but drops those that did not end up in a dug-up and published hoard for any reason, including being recovered by their owners, having not been excavated or excavated but not studied, or studied but not published. The bias that every one of those filters introduces is unknown. However, the authors also affirm that those known unknowns, as well as the unknown unknowns, do not render the dataset totally useless, and in fact it has been used repeatedly, most notably in [17], where it is a subset of the database, and in [27], where it is the main source of data. We should also note that although a priori there should be a correlation between someone hoarding coins and difficult times, that correlation is not clearly established [16]. From the point of view of this paper, however, the mass of coins in circulation is not so important as the origin of those coins insofar as it is indicative of a connection between the origin and the place where the hoard was found. The strength of the connection is not measured by the number of coins, but by the independent coin groups where coins minted somewhere are found elsewhere. In a nutshell, this paper is not so much concerned about how much money was circulating, but about the fact that it was, indeed, circulating.
[16] refers to different kinds of biases but mainly from the numismatic point of view. However, our point of view is different, so that the impact of these biases is mitigated. We use mainly two types of data in this paper: geographical and temporal data; that is, the mints where coins were produced and where they were found, as well as when the interchange of coins took place. The FLAME database insists on including only hoards that have been described in a scholarly publication, thus adding reliability to the point of production; that is, there is no bias in how the place of minting and of the found hoards is reflected, which would be the main source of errors for our analysis.
We should probably consider also the fact that, in some cases, imitative currency, that is, currency that simply follows a pre-existing pattern or die, but is not indeed minted by the original authority, was in circulation in the territories once they were abandoned by Roman authorities. As far as we can tell, the FLAME database will not identify the original, but the imitative currency mint, thus taking into account the correct time frame where it was minted. This identification itself considers the absence of mints in some territories; they will simply not appear as the origin of coins in the database, thus not biasing the result. In general, FLAME database will only include data on hoards that are properly identified by a publication, as indicated in [36], which includes any imitation coins that will be identified by production mint, and not the pattern they used. The main issue with this geographic data is the inherent regional primary bias [38]. However, we can assume that this bias is constant through time; since we are interested in the evolution of connections among and within regions, this primary bias should not affect the results.
Finally, regional distribution is not the main focus of this paper, as we are mainly concerned with the detection of change point in a time series; in this sense, temporal biases would greatly affect results, in the sense that if a change in the link density is indicative simply of absence of evidence for that particular period and not absence of links, the result would be compromised. [36] mention that the early medieval period has only very recently been a source of interest, and that in many cases sites linked to that period would not be excavated and even, in some cases, bulldozed. On the other hand, we should take into account that while there is bias in choosing the places to excavate, the year where coins were minted or used is an output or result of these excavations which cannot be filtered beforehand. This means that unless some specific region was the only source of coins or hoards for a specific period, or coins from some period were simply dropped or results not published, we should expect an (unquantified) smaller bias in the time series of links we are using in this paper.
The second type of bias we should expect is temporal, that is, some periods get more hoards than others, so that the number of hoards found reflects the interest of numismatists and archaeologists in those periods more than the economic activity. We will try to validate qualitatively the time series with known studies in the period and area we are interested; for instance, we can match the highs and lows in the time series with existing research in the area of numismatics and economics history. [39] describes history, economic and minting activity of the Visigothic reigns in the Iberian Peninsula and notes that it was kept at a low level, mainly reproducing Eastern Empire coins. This dearth of trade links can be seen in Figure 3, with a long depression lasting for two centuries and reflected in very few trade links during the 5th and 6th centuries. This low activity is qualified in [40], noting also a certain recovery in the 7th century after a minimum of coin weight in the first half of the century, followed by a certain recuperation in the early 8th century. Again, this peak is shown by the end of the time series that we are using in this paper, Figure 3. Additionally, a small peak during the 7th century matches the invasion of the Spanish South-East by the Byzantine empire that made the circulation of coins minted there much more common together with a certain increase in commerce and economic activity [41] during that period. In general, this series, at least qualitatively, matches known economic activity patterns and the corresponding circulation of coins in our area of study, the Iberian Peninsula.
Additionally, the time series must be tested to ensure that the assumptions underlying the planned analysis are valid. The first condition a time series needs to fulfill is non-stationarity; that is, the data we observe is not simply noise around a constant mean.
We have used Augmented Dickey-Fuller [42] and KPSS [43] to test for this stationarity; the statistic values shown in Table 2 indicate that both the interior and the complete trade link density series exhibit non-stationarity with a statistically significant level. This enables us to proceed with the rest of the analysis, validating the use of change point detection methods.
An additional source of validation for this dataset is using a different, independently gathered, time series related to trade activity. [19] in their paper that follows up a previous one [18] establish a connection between the economic activity (and other events that are bound to impact it, like war and plagues) and lead pollution measured in ice cores; since lead is released into the atmosphere as a result of mining and minting activities, there could be a correlation between hoard and lead data. By using the dataset they have released, substituting missing values by series average, we have analyzed cross-correlation between the two time series shown in Figure 4, which shows a very strong correlation between contamination and trade density with a lag that of several decades, indicated by lag values surpassing the dashed blue line, that is, a change in trade link density in either direction is correlated with lead presence in the atmosphere several decades later.6 It should be noted that [20] finds a similar negative correlation between lead pollution and silver coin circulation; however, this correlation is not delayed as we find here. It can be argued that this contemporary negative correlation could be later on cause of a negative correlation in trade link density; however, this is not the main point of this paper, so we are not going to delve into this. Let it be said, however, that similar correlation results in the same direction have been proved, which could be an additional source of validation of this dataset we are using.
This would be an additional validation for the time series, which, despite the acknowledged biases in the original data, would be representative enough of this trade activity we are analyzing, the number of trade links to support the validity of the results we will present as responses to the research questions.
3.4. Checking the Time Series Against Known Events
Additionally, we will try to connect our results to other sources of information, be it written or from material culture, so that they can be validated in an independent way. A visual inspection of the time series can be used to check it against known historical events; the fact that they appear in the series with a plausible impact would be a source of additional validation.
Figure 5 shows some important events that happened in the Iberian Peninsula during the period under study. The restoration of Emerita Augusta, which was the capital city of a province that included Spain and Portugal, was restored in 340 while the sons of Constantine were in power. This matches a peak in activity reflected in the internal time series. The end of the Priscillian heresy in 385 [44] is followed by a descent in activity, but it is after the Vandal and Suebi invasion in 409 when the activity is totally grounded [44]. The Byzantine invasion [4] is reflected by a small increment in activity, which peaks during the stabilization of the Visigoth kingdom during the early 7th century [39]. The Umayyad invasion in 711 is shown as a small depression, that stabilizes a bit later to a smaller level of activity before the end of the series. In general, and by visual inspection, the series shows depressions in activity as reflected in the coin hoards after invasions or civil wars, and peaks of varying importance during stable or peaceful periods. The breakdown of links with the Western Roman Empire soon before its downfall is followed by an almost century-long period with very low activity. In general, it can be said that the existing data qualitatively reflects what we know about the history of trade-related activity, thus giving an additional layer of validation to our data.
At any rate, data used in this paper will be published with a free license from the repository at https://github.com/JJ/medieval-trade, so that it can be validated independently.
4. Results
After we have established the validity of the dataset, we will go ahead and try and answer the first research question, namely the existence of a changepoint in this subset of the data analyzed in [27]. As we did in that case, we have used the cpt.meanvar function of the changepoint package [45], which includes several functions suitable for this type of statistical analysis. The function chosen, cpt.meanvar, looks for a point of maximum change in the mean and the variance; since variability in the time series is extreme, this option is the best adapted. Default values have been used for all the other function parameters except for the method, which has been set to AMOC ("at most one change") to ensure that we get a single changepoint 7; if we want this kind of quantitative methods introduced into Digital Humanities and specifically into the study of history, methodological simplicity was prioritized in order to facilitate reproducibility and adoption within the digital humanities community. The result, with averages before and after the changepoint, is shown in Figure 6.
With the main objective of showing the robustness of the initial method, we have also run a multi-changepoint algorithm, with results shown in Figure 7. The method used has been PELT [46] with the manual penalty function , where n is the length of the time series; this penalty function has been chosen after trying several values and checking that it produced a reasonable number of changepoints. The changepoints vary in importance depending on the difference in the values after and before them; the graph shows that the changepoint with the biggest gap occurs in the year 408, followed by the one before that, 323. We are interested in the main changepoint obtained by this different method; however, it is interesting to match this Figure with Figure 5. Although the latter is plotted over the internal trade link density series, we see that the second changepoint is close to the date when Emerita Augusta was restored, there is a changepoint soon after breaking ties with Rome, and another one soon after the reassertion of the Visigothic centralized power. As long as the time series is representative enough, either single or multi-changepoint analysis can help clarify the impact of historical events on the dynamics of a community or networked region. From our point of view, however, this analysis gives us another reference date for a change of regime in the trade link density of the Iberian Peninsula.
Finally, we have used additional changepoint detection methods to validate our results. These methods are non-parametric and have been used in other papers dealing with similar problems [34,47,48,49]. The results are shown in Table 3.
As can be observed, there is a statistically significant changepoint in the year 423. This is roughly 20 years after the year found in [27], but still half a century short of the Fall of the Roman Empire with the ousting of the last emperor by Odoacre [1]. We will validate this approach using other methods, in order to find a bracket of possible changepoints; this way we can have a better idea of the period of time when the change happened. We have used two non-parametric tests, Lanzante’s [47] and Pettitt’s [48] as well as Buishand’s range test, which applies to normal variables [49]. The column "Changepoint (filtered)" shows the result of applying the same methods to the dataset where hoards with a long date range have been filtered out. The changepoint for both Lanzante and Pettit’s methods has been moved down to 477, as can be seen, and is closer to the previous estimate reached when we used midpoint imputation (without filters). Still, there is a small difference that still places the changepoint for this time series in the second half of the 5th century.
The results of the different changepoint methods are shown in Table 3; we include in the last column the results we published in [34]; in that case, coin hoards were assigned to the midpoint of the period in which they had been found; additionally, the number of trade links was added over a decade instead of representing it as uniform probability across the period as we do here. Our main intention by presenting them here alongside changepoints computed for this paper is to show the (relative) robustness independently of the method that has been used to convert from periods to a time series.
In the case of the current changepoints, they are at both sides of the changepoint detected by the first method (see Figure 6), thus giving an interval of possible changepoint years between 408 and 491. Please observe that all changepoints are statistically significant, the difference in output being the different methods used to detect them; however, Buishand’s methods need normal variables, a fact that is not guaranteed in this case; although statistically significant, we should probably lend more credibility to the non-parametric methods (Lanzante and Pettitt), which, besides, are consistent with each other; we would then have a range of dates between 423 and 491.
Before looking for a possible cause, we should try and place the internal Iberian traffic changepoint, this being an important component of all the trade links; any variation withing the range we have would point out to important internal causes for the change of regime, that would contribute (or detract) from any external cause.
The changepoint plot with averages before and after it is shown in Figure 8. The changepoint is in the year 395, an earlier date than previously detected, but still in the same range. The interesting thing is that intra-Iberian trade was disrupted very soon after the Battle of Adrianople [50], which might indicate some signs of the decay in the periphery of the empire (the Iberian Peninsula was literally finis terrae).
In this case, there are specific methods for finding changepoints in time series with multiple columns, like this one. In order to apply the procedure, we first subtract the number of internal links from the number of total links to have two different and synchronous sequences, with trade links inside and outside the Iberian Peninsula. On this two-column array, we apply the e.divisive function from the ecp package in R [51] which implements a hierarchical divisive estimation procedure, finding changepoints and applying again the same procedure to the resulting fragments; this method needs an additional parameter, the minimum size of the chunks in which the time series is going to be divided. Since we are looking for epochal changes, we have used size = 100 years. The result is shown in Figure 9, with the vertical dashed line indicating the changepoint found, which shows a vertical dashed line for the changepoint found at 409.
This would allow us to answer, at least partially, RQ1: Yes, there is a statistically significant regime change reflected in the time series of external, internal and aggregated trade links extracted from connections between hoards and mints. Different methods will give us different change points with the same statistical significance, but they all fall within the same 96-year period that starts in 395, with a higher density between the years 408 and the year 410.
Table 4 summarizes the changepoints found using the different methods described above, including results with and without filtering hoards with a long date range and the decade-resolution changepoint [34] found for the dataset that uses midpoint imputation (second row); in the case the date found by both method is the same we use "(+filtered)" in the row name. Except for the Lanzante/Pettitt tests, there is no change in the dates found by the different changepoint detection methods. It is especially interesting to find no change in the e.divisive method, which being a multi-sequence method, is the most robust of all. Additionally, the changepoint dates, with decennial resolution, found in [34] are essentially the same as found with the yearly resolution methods with present in this paper, once again pointing to the robustness of the result.
We should stop for a moment to discuss how biases in the original data would affect this result, that is, a date on which the change of trade regime we were looking for took place. The first question we should ask is: Is the absence of evidence evidence of absence? That is, coin hoards in the area under study disappear due to lack of trade or change of trading routes, or people stopped hoarding coins, or were these hoards simply not dug up yet? To a certain point, historical and archaeological records point to changes in economic regime, certainly so in Britain [52]. But the second question is if and how the shift point found in the data is affected by these biases, including those acknowledged in 3.3; the honest answer is that we do not know. However, while the algorithms we have used help us find a value that is statistically significant, subsequent processing, using network analysis, is relatively more robust since it takes into account a bigger amount of data. We will see the results of this analysis next; we could work with the start or the end of the date range mentioned in the previous paragraph, the midpoint, or the one found by multi-sequence analysis, which is statistically the soundest, the qualitative results will be substantially similar. This multiple analysis is needed, however, to clearly establish that range, as well as the points where the change of regime is most likely.
Additionally, a visual inspection of Figure 9 shows that the changepoint found does not occur, indeed, in a structural break in the data. There are several sharp increases and drops; the changepoint detection methods, since they look at averages before and after the point, are not necessarily affected by these, maybe structural, breaks. However, they may reveal a structural change in the underlying network, which we will try to analyze next trying to answer RQ2.
Research question 2 asks if there is some change in the network that can explain that changepoint. As we have explained, FLAME data can be processed into a network with regions as nodes and link density, resulting from processing the probability of a link occurring in a specific year in the range where the coin hoard was dated, as edges. In order to answer that question, we will look at specific trade links, and how they evolved with time, especially before and after the changepoint found.
In Figure 10 we show the evolution in time of the top links (as indicated in Table 1); these, unless noted otherwise, are connections with Spain. We see a crash in the link density across the board, but we note that the links with the United Kingdom (highlighted also with points at every value) started to decline several decades before the changepoints indicated above. Several different trading partners then became the main ones, notably Italy, Turkey (which hosted both capitals of the empire), but also France, the Netherlands, and most notably, connections within the current territory of Spain (also marked with dots in that figure), which reach its peak here. Eventually, these also fall to a minimum level right around the time of the found changepoint in the first quarter of the 5th century.
We have a different look at how trade changed after the changepoint in Figure 11, where we show the ratio of average link density after and before the changepoint for the top links; that is, we take the annual average link density before the changepoint in year 409 and divide it by the same average after the changepoint. The bars are sorted in decreasing order.
Even taking into account that this average includes some years that might have not been very representative (beginning of the series, see Figure 13, what we see is that there is only a trading partner that has doubled its importance, Greece; Greece was only, however, the 8th most important trading partner (see Table 1), with a volume 1/10th of that of the UK. The fact that trade for the main partners such as Italy, and the most important one, the UK, must have had an impact in the life of the inhabitants of the peninsula, even more so when internal trade seems to have decreased tenfold or more (in the case of trade with Italy the Middle East, represented by Israel and Palestinian Territory).
The peak in link density right before the changepoint in "border" territories such as France and the Netherlands might be due to two different reasons: in times of trouble, when different groups such as the Vandals or the Alans were pressuring from the Rhine [53] and people resorted to burying their treasures, thus biasing the number of hoards found; but the second reason is that since there were troops fighting in those areas which needed to be supplied, the trade with them increased over other, relatively more peaceful, times. However, inherent biases in the dataset make it impossible to establish, just from data, which of the two reasons was more important or if there was a third, different cause, of these small peaks in trade. At any rate, this is a secondary issue, which only illustrates how network analysis might help establish hypotheses that would then have to be proved using cliometrics using micro or macro data.
In order to see more clearly what the impact on trade of the change was, we have made in Figure 12 a boxplot of the link density between the year 250 and the changepoint (409) and between that and the year 750. The main intention of limiting this range is to avoid the very limited trade links before and after that date that would skew the averages; we also follow the same convention as in Figure 10. We have chosen the top five trading partners plus internal trade link density. Please note that the y axis is on a logarithmic scale in order to show more clearly the order of magnitude of the difference. The far left boxplot shows how the trade link density with the UK has changed: more than two orders of magnitude. In other cases it is also an order of magnitude or more except for internal trade, which is roughly one order of magnitude.
From the analysis above what is clear is that the changepoint is a downstream event caused by the downshift in trade with the main trading partner just before the changepoint, the United Kingdom. And this decline, as shown in Figure 10, was sharp in the last decades of the 4th century. Precisely, what happened there in the 380s was the first removal of Roman troops due to the invasion of Gaul by the usurper Magnus Maximus [54].
In general, this points to local causes in the collapse of trade, with no evidence of a direct causal relationship with changepoints encountered in the global trade links dataset analyzed in [27]. There is no evidence that the defeat and consequent settlement of different peoples South of the Danube provoked the flight of troops from Britain and subsequent or maybe concomitant, probable collapse of the economy. We might establish some indirect cause-effect relationship, however: the loss of the via militaris and the Danube [55] as a trading venue, and the troops lost at the battle of Adrianople, impeded any help of troops from those provinces (which included also Goths) to the Western emperor attacked by the usurper; in that sense, they are both part of a larger pattern of resettlement of different human groups displaced by climate change and other human groups, crossing the natural borders of the empire, which made the extensive logistic and trade routes maintained by the empire go into disrepair, as well as provoke a collapse of demand of goods traded across a long distance.
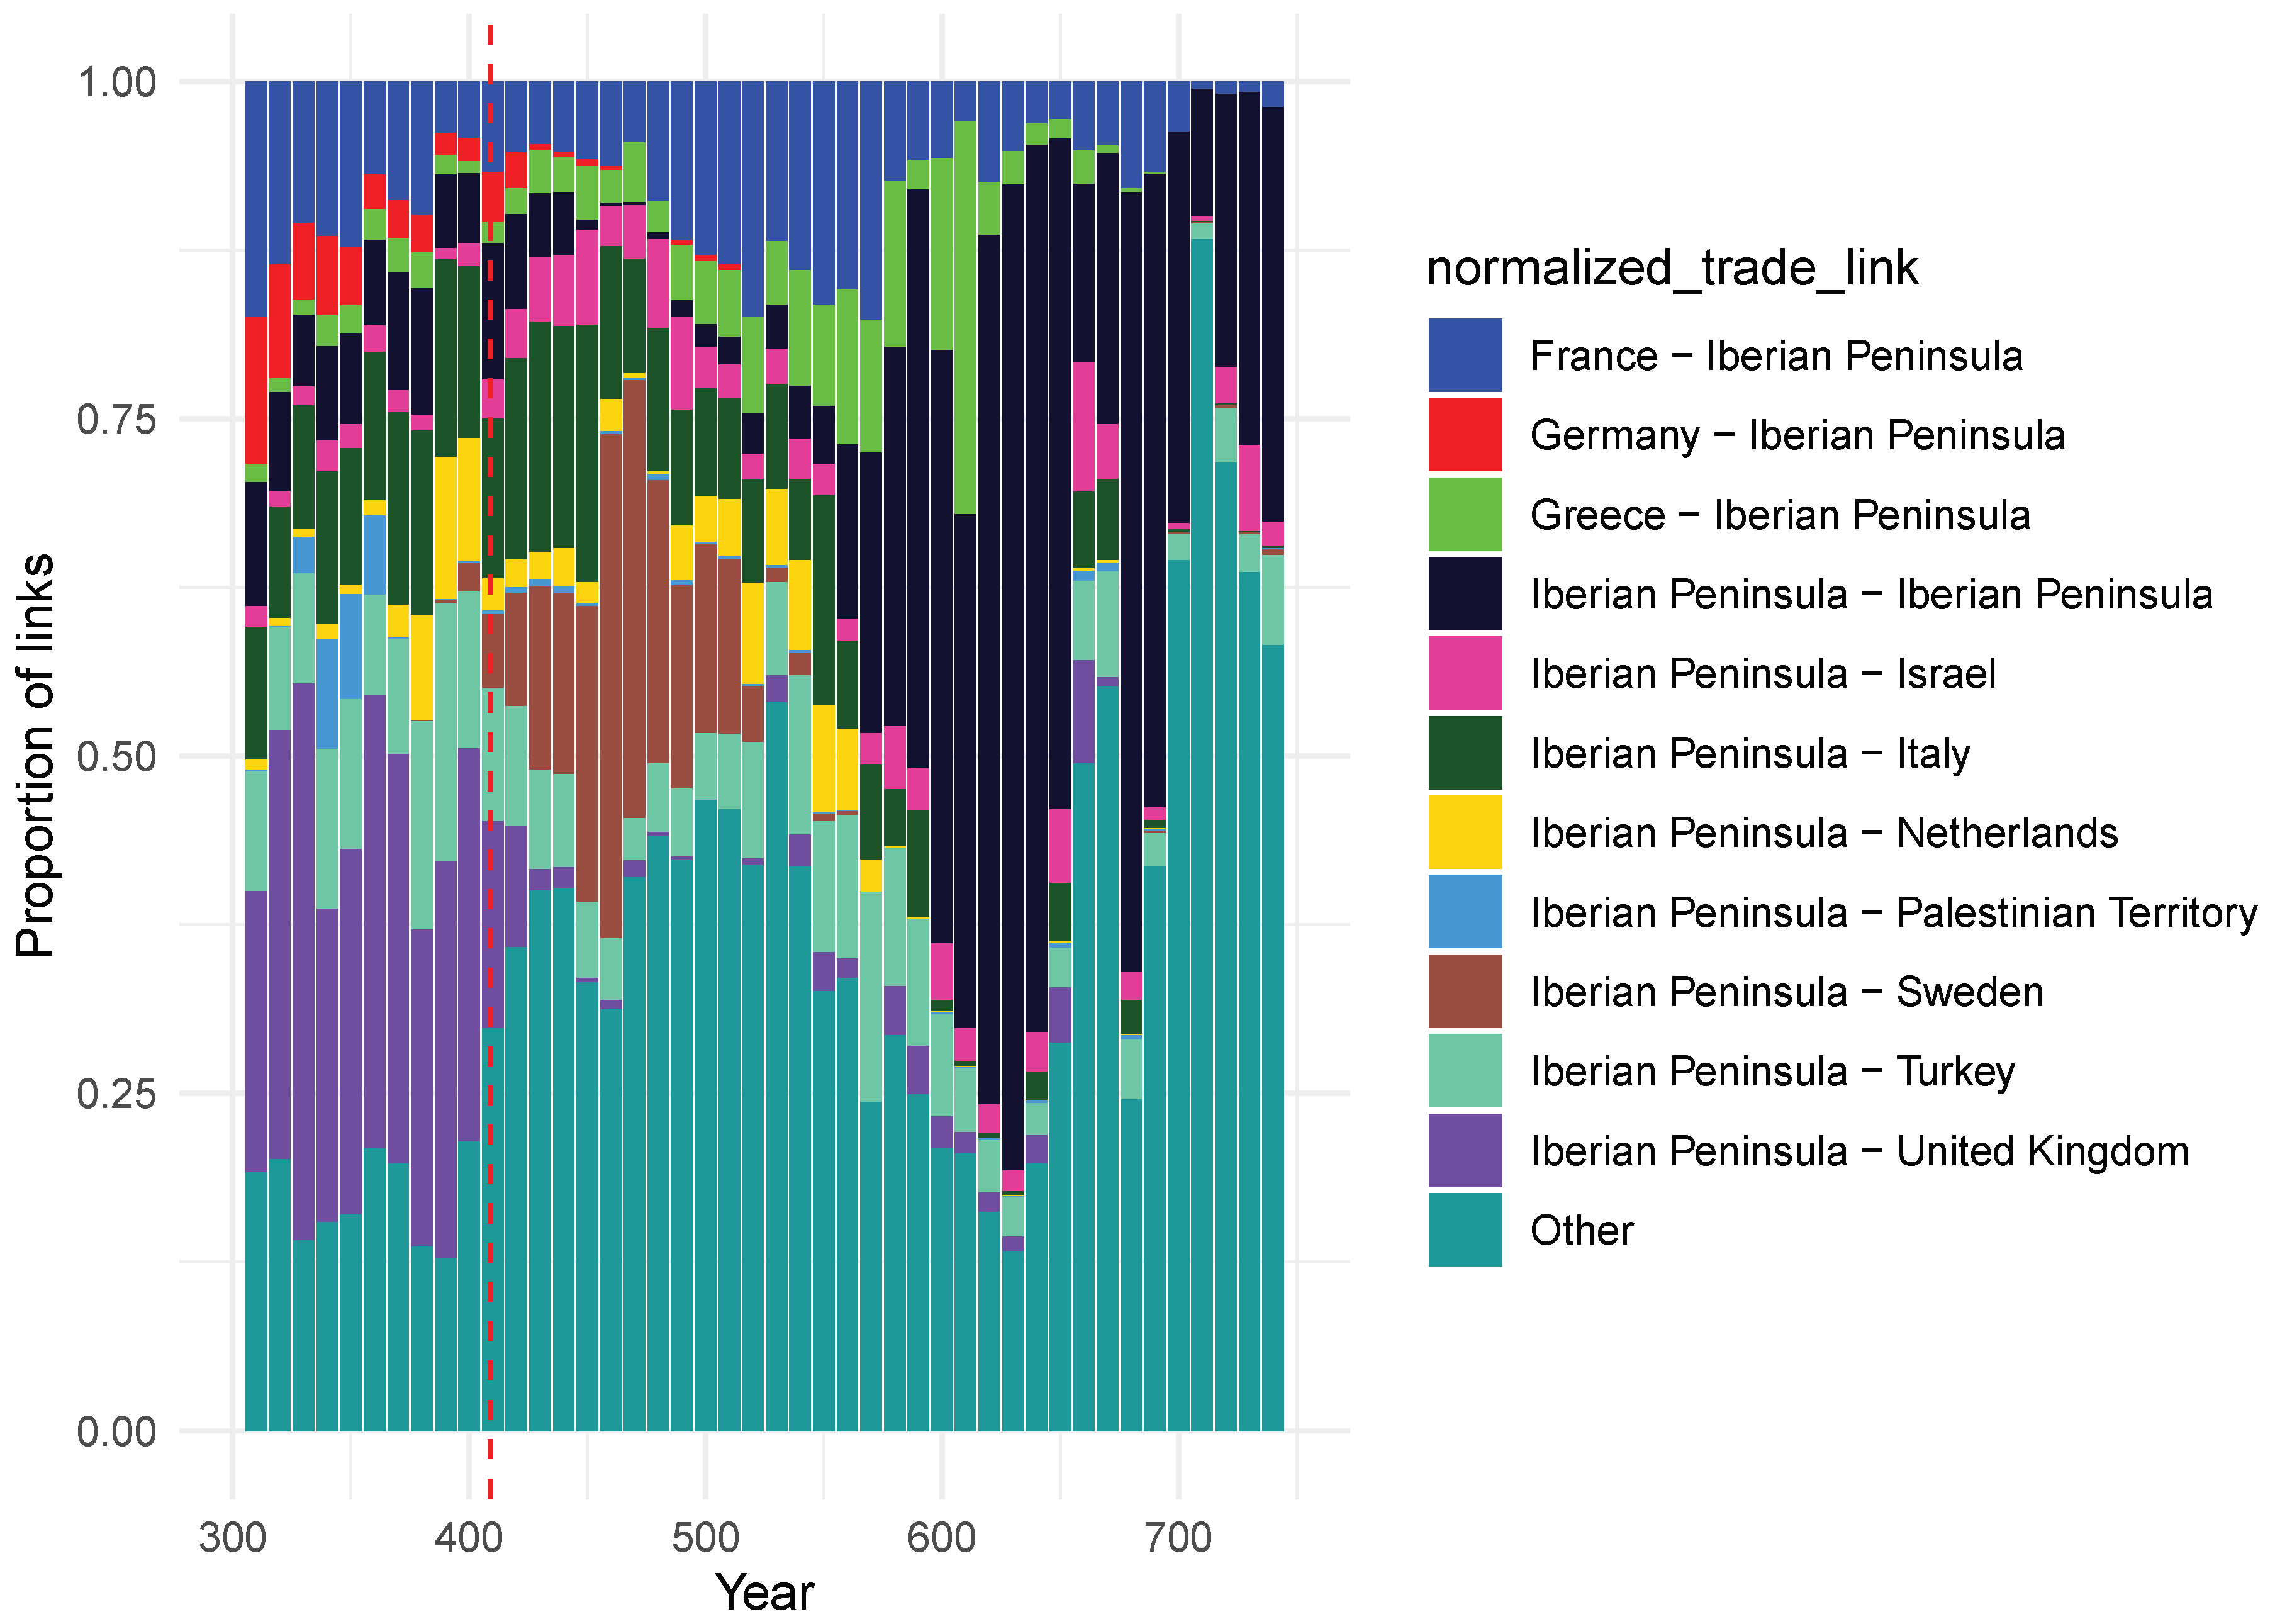
As is noteworthy, commerce mostly collapsed, but that also meant that different trade links started to have more relative importance; we reproduce in Figure 13 the same sequence indicating percentages of links, again with the "Other" category taking all links not in the top ten; what we see is that from the approximately the year 410 most links occur with these other countries, except for brief periods where France and the Eastern Roman empire have the most importance. By the end of the 5th and during the 6th century, there are very few interchanges, but whatever trade is taking place is merely internal; we can refer again back to Figure 10 where we see a that in those dates internal date is essentially the only one taking place; during all those years, links with Eastern Roman Empire (Turkey and Greece) are constant and in most case more important than those with the Western Roman Empire. As a matter of fact, the indicated period matches the occupation by the Byzantine empire of parts of Southern Spain [37]. The (weak) economic revival during those years would be a worthy field of study.
Figure 13.
Evolution through time of the link density with the main trading partners of the Iberian Peninsula.The red dashed line indicates the computed changepoint.
Figure 13.
Evolution through time of the link density with the main trading partners of the Iberian Peninsula.The red dashed line indicates the computed changepoint.
Although not central to our research questions, we should maybe try to explain the presence of Sweden as one relatively important trading partner during the 5th century. As indicated above, these trade links represent the presence of coins minted in one place in another; in this case we would be talking about coins minted in the Iberian Peninsula. As has been analyzed by [56], as a consequence of plunder of different coastal and riverine town and cities, but also limited trade as well as troop payments, different types of coins made their way into these hoards in Scandinavian settlements. Again, we should refer to Figure 10, where we can observe a peaklet in the second half of the 5th century, that is anyway just a fraction of the trade with any of the partners before the changepoint.
Once results have been obtained, we should go back to examining possible biases in the data, and how these might have influenced the result. There were two possible sources of bias: temporal and regional. The first one has been mitigated by using several changepoint detection methods, as well as a multi-time series method; all these will reduce bias. Examining the time series for other main trading partners visually has the same kind of result. As indicated above, however, the year yielded by the changepoint analysis is only a point of departure to apply other network analysis methods and eventually investigate historical sources; any bias that might have been present in the original data will have a limited impact on the result. Another possible source of temporal bias would be the simple absence in the dataset of hoards found after the changepoint, especially in Britain. This is very unlikely, however, given that the region identified as being a possible vanishing node in the network is one of the most studied in Europe. While the specific range of dates, the first quarter of the 5th century, might have some absences in the numismatic record, we can say once again that the subsequent analysis is robust enough to not be affected by a date moving up or down a few years, or even a few decades.
The second source of bias, regional, is more difficult to assess. We should expect a intense trade from the Iberian Peninsula with Northern Africa; however, there is scarce evidence of this in the FLAME database; in general, regions with a relatively small area and no or little minting activity during this period might be under-represented and thus bias the result. However, our methodology is mainly dependent on the node or edge that has the highest ranking in the network before or after the change and how its position in the network changes. Again, it is relatively unlikely that there is another region whose trade with the Iberian Peninsula would be indeed more important than that with Britain but did not have archaeological evidence in the form of coin hoards or coins minted and found there. The difference in trade density between Italy and Britain is big enough to not be overturned by bias in the dataset. So, while acknowledging these biases in the data, we are relatively confident on the answer found to the two first research questions.
The third research question searches for causes of the observed behavior in the known historical narrative. Figure 10 and Figure 13 reveal that internal and external trade in the Iberian Peninsula was heavily dependent to the point of being almost one and the same with the Roman settlers and armies in the current United Kingdom territory. When they left, they took the Iberian Peninsula trade and apparently a good part of the economy with it; initially almost literally, since commerce continued with other areas where these armies were battling others, France and the Netherlands ; see Figure 10 during the last decades of the 4th and first ones of the 5th century. Eventually, not even these new sources of income, or the brief period of intense trade connections with the Eastern Empire, were able to partially overcome the fall of demand; those were, anyway, long-distance trade links that, without intermediate stages (like the Italian peninsula or Sicily) could not substitute for trading partners situated at a shorter distance. Internal demand was never intense enough, and also related to trade with Britain, to pick up the slack, leading eventually to the shifts in trade regime we mention in the paper title. So, the answer to RQ1 would ascribe the observed structural changes in the trading network and subsequent changepoint observed mainly to the removal, in several stages, of the Roman army and administration from Britain and its consequent vanishing as a trading partner. This cause does not exclude others: other trading partners, notably the Netherlands, almost disappeared too; commerce with Italy continued at a much lower level, although until roughly the deposition of the last emperor in the third quarter of the 5th century was the main trading partner in the FLAME database.
Could the propagation of trade fall have happened in the other direction, from Spain to Britain? Since the first wave of flight of Roman troops from Britain happened in the third quarter of the 4th century, and it was unrelated to anything happening in the Iberian Peninsula, that is relatively unlikely. However, local events might have contributed in an important way to the changepoint observed, namely, the Visigothic invasion that took place in the first quarter of the 5th century [15].
To summarize the answer to the third research question, the main cause of the observed changepoint and structural network changes in the subset of the FLAME database that includes only Iberian Peninsula hoards and mints is the administrative and military changes in Britain, which affected the Iberian Peninsula more than other territories due to their tight relationship and shared material culture. This, together with the Visigothic invasion of Italy and eventual arrival in the Iberian peninsula 8, precipitated the changepoint observed in 409. Please observe that, from the historical point of view, the propagation across the network of troubles eventually affecting the whole empire is a relatively new result, especially from the strictly local point of view of the influence of the events in Britain in Tardorroman Spain.
The answer to the fourth research question, that ties the found changepoint with the destiny of the Roman Empire at large, needs to be investigated qualitatively, since the dataset we use does not include the trade relations between other parts of the empire. We can make some educated, qualitative guesses following network properties as well as the historical record. Even if Britain and Spain were peripheral nodes in the Roman Empire network, their virtual disappearance from it need to have had some effects on the closest nodes, especially France, which, besides, was subject to its own pressures. [37] mentions the lack of communication between the Gaulish landowners and any other place, pointing to a network that was, by those times, already fragmented, and became even more fragmented by the creation of several different polities in the territory of France
The fate of North Africa, as a node mainly linked to the rest of the Roman Empire through the Iberian Peninsula was, possibly, more important to the systemic collapse of the Western Roman Empire, since it was one of the main sources of grain for Rome after Egypt was mainly devoted to supply the Eastern Roman Empire. The fall of the Iberian node of the network left this one devoid of many valid customers, but above all open to invasions, which effectively came from the Iberian Peninsula in the shape of the Vandals [33] in 429. [37] goes so far as to state:
Geiseric’s conquest of Carthage in 439 is arguably the turning-point in the "fall" of the western empire
It should be pointed out that, as shown in this paper, that would not have been possible without the fall of Britain, followed by the fall of the Iberian peninsula, invaded by the same peoples that eventually got to North Africa and cut the supply of grain from the Italian peninsula. Summarizing the answer to the research question 4, effectively the fall of Britain as a trading node which was worked out in this paper as a cause of the changepoint in the Iberian peninsula, is, in fact, a factor to the fall of th e Roman Empire, which can be considered new insofar it has not been, to the best of our knowledge, explicitly mentioned in a causal chain such as the one we are presenting here9.
5. Discussion and Conclusions
In this paper we have followed a methodology for linking statistical results over a coin hoard database to historically established facts, by analyzing historical data looking for changepoints and delving into them using network analysis before and after the changepoint looking for possible immediate origins and causes of those epochal changes.
The first stage of the analysis has established the dates of the changepoint and, from them, possible factors that influenced the change of regime of the Western Roman Empire in the Iberian Peninsula, a peripheral part of said empire, by looking at data from the FLAME coin hoard database. We validated the dataset of trade links obtained from that database used via historical sources, as well as correlations with time series representing lead pollution, giving us a solid foundation for performing this analysis. Date ranges of coin groups in FLAME coin hoards were then processed following best practices to a time series of trade link density between different regions. Using different change point analysis algorithms, we found statistically significant changepoints for different time series obtained from that data in a range of years that preceded the actual fall of the Roman Empire by several decades. These dates found through changepoint analysis are robust with respect to changes in the imputation of date ranges to specific years.
Once the changepoints were found, splitting the network of trade links in periods pre and post allows us to examine which nodes in the network have suffered the biggest fall in link density or disappeared altogether; Britain seems to have topped the list of those, followed closely by other nodes in the network; the internal trade density of the Iberian Peninsula shows also a clear decline preceding the changepoint.
After answering the two first research questions with this analysis, we proceed with a second, more qualitative and speculative stage, to answer the second group of research questions. Tapping from historical sources, we have found that the causes of the changes found through the changepoint and subsequent network analysis was the dependence of a mainly commercial economy with the supply of the Roman elite and troops in the British Isles. The first decreases in trade link density as represented in the coin hoard data came after the bulk of the Roman troops abandoned Britain during the last quarter of the 4th century. A second, and possibly fatal, fall in trade link density arrived after the isles were left to their own devices following the second departure of Roman troops and elites in the early 5th century, which resulted in a collapse of material culture in England. Due to the proven, and also present in the FLAME data, connection between Britain and the Iberian Peninsula, this was probably a very important factor in the vulnerability of the Iberian Peninsula to the invasions that succeeded in the first half of the 5th century. These events also coincided with the first sack of Rome by the Visigoths [58]. At any rate, we have established that the factors that caused the changepoint observed in the trade link density time series are very probably internal, as well as related to its economic dependence with the British Isles and other parts of the empire. The analysis of the internal link density shows that it was depressed even further shortly before the changepoint and did not indeed pick up until the 7th century.
The results of these two events, collapse of trade in the Mediterranean at large as well as collapse of the Atlantic trade due to the fall of the British Isles as an economic node and subsequent events point, interestingly enough, to network events that highlight the importance of network analysis in the explanation of system-wide, epochal collapses such as the transition from Late Antiquity to Early Middle Ages. Elimination of edges, such as the one found in [27], which disconnected two important clusters of nodes, is a possible cause of catastrophic structural changes in the network. In the case we are concerned in this paper, however, we are rather dealing with the elimination of a node, with the consequent elimination of all edges connecting to it and the cascade of effects on the nodes connected by those edges. In general, network analysis [59] concludes that, for a small-world network (which it very possibly was, at least if we consider only the Mediterranean area [60]), elimination of a single edge or node will result only in small changes in communities and overall closeness. However, having to use alternative routes will increase the cost of driving goods or troops from one part to another [60], eventually making trade with the more peripheral areas, such as the ones we are dealing with in this paper, unfeasible, which leads to their virtual elimination from the network. But after that first-order effect, structural changes in the network will continue: [59] also models how information or disease will propagate through the network, causing the subsequent elimination of more edges and nodes and the effective conversion of the network in single nodes or small disconnected networks with little power or possibility of reconstructing the network back again, at least in the short- or mid-term.
Looking again at Figure 2, and the small surge in trade by the beginning of the 8th century, we can interpret Pirenne’s hypothesis as a second changepoint that possibly eliminated mainly maritime routes that remained. However, it is relatively clear from the coin hoard data that the presence of Southern and Eastern Mediterranean coins in Europe and vice-versa by the beginning of the Islamic expansion was orders of magnitude lower than that existing a few decades before the early 5th century changepoint found here. Without a more extensive analysis, we can make an educated guess that that changepoint, by itself, might be sufficiently significant to indicate a minor change of regime, but probably not the social, politic, religious and economic chasm that opened itself between Antiquity and the Middle Ages and that produced the change in trade patterns we have shown here. Investigating if there is effectively a (secondary) changepoint in this period is left, however, as a future line of work, one that would need more data to complement FLAME database and extend it temporally.
We could discuss if these results contradict current historiography. We can argue that they, in fact, do not. The relationship between the battle of Adrianople and the fall of the empire is sufficiently accepted by historiographers, as well as the common material culture across the Atlantic coast during the late empire. However, what we present in this paper is first a methodology to use datasets to establish dates for changes of regime in the number of trade links, and then apply further analysis to the data from which the time series has been created, before and after the changepoint, to establish rigorous cause-effect relationships. This methodology was initiated in [12] and extended and systematized in [24]. In this paper we present it explicitly, and apply it in a more significant historical change, the shift from Antiquity to Middle Ages.
From the analysis in this paper, we can conclude that analysis of dated ancient networks can help us discover new factors that can be inserted in the historical narrative and give rise to new insights on the dynamics of epochal changes from a network-centric perspective. What we have presented here is one example, where the dated database is the FLAME coin hoard dataset, the area is the Western Roman Empire centered in the Iberian Peninsula, and the epochal change we are examining is the Fall of the Roman Empire. The workflows used for this analysis are hosted in a GitHub repository https://github.com/JJ/medieval-trade under a free license and can be used by anyone under these terms.
This opens new, and promising, lines of work. For instance, by applying this methodology to the same database, it would be interesting to research causes and effects in other parts of the empire. Italy would be an area that, by size and centrality in the empire, could yield interesting results; but also the United Kingdom itself, as well as all North Africa, although in this case there is probably less data, and we would have to wait for a more complete database. Finally, using lead pollution databases not only for validation, but as part of the changepoint analysis, as well as other climatological or food production data would allow a more complete tout court research of the initial causes of the epochal change, and how each of them affected it in different and unique ways.
Funding
This work is supported by the Ministerio español de Economía y Competitividad (Spanish Ministry of Competitiveness and Economy) under project PID2023-147409NB-C21.
Data Availability Statement
The data for this paper is available at the GitHub repository https://github.com/JJ/medieval-trade under a free license. The source for this paper includes the R scripts used for processing data and producing the results presented here; this code is free software too.
Acknowledgments
I am grateful to my professors of History of Antiquity and Middle Ages at the degree of Art History at the University of Granada, especially Pr. Juan Manuel Piñero Palacios, who by mentioning Henry Pirenne in class, led me down a rabbit hole that eventually produced this paper. The reviewers of this paper have also contributed greatly to its improvement of this from the first manuscript.
Conflicts of Interest
The author declares no conflicts of interest.
| 1 | Please note that we are separating it in two words, as in the literature, to differentiate it from the other changepoint, which is usually referred to in the literature as a single word. |
| 2 | There are no hoards found in Andorra or in the UK colony of Gibraltar. |
| 3 | The dataset refers to them simply as coin groups
|
| 4 | Please read the README.md file for specific location of the datasets used here. |
| 5 | Please note the small tails before roughly the year 300 and after 750, which are probably artifacts due to the way the coin hoard date ranges are processed into what we call link density; their value indicates that they are probably coming from a single or a small amount of coin groups. Since this value is very small, its influence in the result is correspondingly small so we will perform no additional assumptions (such as starting in a period that is covered by a certain number of coin groups) to eliminate them. However, a researcher following this methodology might need to take this into account. |
| 6 | By itself, this result would open an interesting avenue to explore, but will use it here only for the purpose of validating our dataset. |
| 7 | This was the default in one of the versions of the package we used but was changed when we upgraded; adding this (currently) non-default value helped reproducibility across package versions, if sacrificing a bit usability for non-technical users. |
| 8 | [57] marks the fall season of 409 "as good as date as any for the end of Roman rule in the Iberian peninsula", due to the invasion of the Alans, Suebi and Vandals crossing the Pyrenees. |
| 9 | As a matter of fact, [57], p. 13 points to a more direct relationship: The Vandals only crossed the Pyrenees because the troops of a rebel emperor, Constantine III, allowed them; these were the troops that had previously abandoned Britain, leading to its final separation from the network. |
References
- Wood, I.N. Chapter 1 When Did the West Roman Empire Fall? Brill: Leiden, The Netherlands, 2022; pp. 55–77. [Google Scholar] [CrossRef]
- Gibbon, E. The History of the Decline and Fall of the Roman Empire; W. Strahan and T. Cadell: London; pp. 1776–1789.
- Tainter, J.A. The collapse of complex societies; Cambridge University Press, 1988. [Google Scholar]
- Pirenne, H. Mohammed and Charlemagne; Allen and Unwin: London, 1939. [Google Scholar]
- Harper, K. The fate of Rome: climate, disease and the end of an empire; The Princeton History of the Ancient World; Princeton University Press: Princeton and Oxford, 2017. [Google Scholar]
- Erdkamp, P. War, food, climate change, and the decline of the Roman Empire. Journal of Late Antiquity 2019, 12, 422–465. [Google Scholar] [CrossRef]
- Haupert, M. The Impact of Cliometrics on Economics and History. Revue d’économie politique 2017, 127, 1059–1082. [Google Scholar] [CrossRef]
- Forster, R. Achievements of the Annales school. The Journal of Economic History 1978, 38, 58–76. [Google Scholar] [CrossRef]
- Pavlyshyn, D.; Johnstone, I.; Saller, R. Lead pollution and the Roman economy. Journal of Roman Archaeology 2020, 33, 354–364. [Google Scholar] [CrossRef]
- Jones, W.H.S. Malaria, a neglected factor in the history of Greece and Rome; Macmillan & Bowes, 1907. [Google Scholar]
- van den Burg, G.J.J.; Williams, C.K.I. An Evaluation of Change Point Detection Algorithms. arXiv 2022, arXiv:stat.ML/2003.06222. [Google Scholar] [CrossRef]
- Merelo, J.J. It’s a Doge’s Life: Examining Term Limits in Venetian Doges’ Life Tenure. Histories 2023, 3, 21–31. [Google Scholar] [CrossRef]
- Testik, M.C.; Sarikulak, O. Change points of real GDP per capita time series corresponding to the periods of industrial revolutions. Technological Forecasting and Social Change 2021, 170, 120911. [Google Scholar] [CrossRef]
- Mushtaq, R. Augmented Dickey Fuller test. 2011. [Google Scholar] [CrossRef]
- Martínez Jiménez, J.; Sastre de Diego, I.; Tejerizo García, C. Late Antique and Early Medieval Iberia; chapter The Iberian Peninsula between 300 and 850: an Archaeological Perspective; Amsterdam University Press, 2018. [Google Scholar]
- Howgego, C.; Wilson, A. Introduction: Coin Hoards and Hoarding in the Roman World. In Oxford Studies in the Roman Economy; Oxford University Press, 2022. [Google Scholar]
- Boehm, J.; Chaney, T. Trade and the end of antiquity; Technical report; London School of Economics and Political Science, LSE Library, 2024. [Google Scholar]
- McConnell, J.R.; Wilson, A.I.; Stohl, A.; Arienzo, M.M.; Chellman, N.J.; Eckhardt, S.; Thompson, E.M.; Pollard, A.M.; Steffensen, J.P. Lead pollution recorded in Greenland ice indicates European emissions tracked plagues, wars, and imperial expansion during antiquity. Proceedings of the National Academy of Sciences 2018, 115, 5726–5731. [Google Scholar] [CrossRef] [PubMed]
- McConnell, J.R.; Chellman, N.J.; Plach, A.; Wensman, S.M.; Plunkett, G.; Stohl, A.; Smith, N.K.; Vinther, B.M.; Dahl-Jensen, D.; Steffensen, J.P.; et al. Pan-European atmospheric lead pollution, enhanced blood lead levels, and cognitive decline from Roman-era mining and smelting. Proceedings of the National Academy of Sciences 2025, 122, e2419630121. [Google Scholar] [CrossRef]
- Oddo, L.; Traverso, S.; Verboven, K. Economic Dynamics of the Early Roman Empire: Insights from Lead Pollution, Coinage, Weather, and War. In Coinage, Weather, and War; 2024. [Google Scholar]
- Fernández, D. Aristocrats and statehood in Western Iberia, 300-600 CE; University of Pennsylvania Press, 2017. [Google Scholar]
- Fagan, B.T.; Knight, M.I.; MacKay, N.J.; Jamie Wood, A. Change Point Analysis of Historical Battle Deaths. Journal of the Royal Statistical Society Series A: Statistics in Society 2020, 183, 909–933. Available online: https://academic.oup.com/jrsssa/article-pdf/183/3/909/49326197/jrsssa_183_3_909.pdf. [CrossRef]
- Hee Park, J. Structural change in US presidents’ use of force. American Journal of Political Science 2010, 54, 766–782. [Google Scholar] [CrossRef]
- Merelo-Guervós, J.J. Detecting Pivotal Moments Using Changepoint Analysis of Noble Marriages during the Time of the Republic of Venice. Histories 2024, 4, 234–255. [Google Scholar] [CrossRef]
- Beaulieu, C.; Chen, J.; Sarmiento, J.L. Change-point analysis as a tool to detect abrupt climate variations. Philosophical Transactions of the Royal Society A: Mathematical, Physical and Engineering Sciences 2012, 370, 1228–1249. [Google Scholar] [CrossRef]
- Western, B.; Kleykamp, M. A Bayesian Change Point Model for Historical Time Series Analysis. Political Analysis 2017, 12, 354–374. [Google Scholar] [CrossRef]
- Merelo-Guervós, J.J. Finding changepoints in medieval European and Middle Eastern trade networks. Technical report. DigiBUG, University of Granada, 2025. Available online: https://hdl.handle.net/10481/105018.
- Linkov, I.; Galaitsi, S.; Trump, B.D.; Pinigina, E.; Rand, K.; Cline, E.H.; Kitsak, M. Are civilizations destined to collapse? Lessons from the Mediterranean Bronze Age. Global Environmental Change 2024, 84, 102792. [Google Scholar] [CrossRef]
- Rademacher, P. Data Quality and Bias in the Coin Hoards of the Roman Empire Database: A Logistic Regression Analysis. Theoretical Roman Archaeology Journal 2024, 7. [Google Scholar]
- Verboven, K. Introduction: finding a new approach to ancient proxy data. In Complexity Economics: Building a New Approach to Ancient Economic History; Springer, 2020; pp. 1–18. [Google Scholar]
- Verboven, K. Ancient cliometrics and archaeological proxy-data: between the devil and the deep blue sea. In Cuantificar las economías antiguas: problemas y métodos: quantifying ancient economies: problems and methodologies; Universitat de Barcelona. Edicions, 2018; pp. 345–371. [Google Scholar]
- Preiser-Kapeller, J. Networks as Proxies: A Relational Approach Towards Economic Complexity in the Roman Period. In Complexity Economics: Building a New Approach to Ancient Economic History; Verboven, K., Ed.; Springer International Publishing: Cham, 2021; pp. 53–103. [Google Scholar] [CrossRef]
- Rousseau, P. A companion to Late Antiquity; John Wiley & Sons, 2012. [Google Scholar]
- Merelo-Guervós, J.J. Before the Collapse: Analyzing Changes of Economic Regime in the Iberian Peninsula Using Change Point Detection Methods. Preprints 2025. [Google Scholar] [CrossRef]
- Zhang, Z.; Sun, J. Interval censoring. Statistical Methods in Medical Research 2010, 19, 53–70. [Google Scholar] [CrossRef] [PubMed]
- Lee, M.; Stahl, A.; Pyzyk, M.; Ilia, C.P. Systematic bias in humanities datasets: ancient and medieval coin finds in the FLAME project. Digital Humanities Quarterly 2025, 19. [Google Scholar]
- Wickham, C. Framing the Early Middle Ages: Europe and the Mediterranean; Oxford University Press, USA, 2005. [Google Scholar]
- Pyzyk, M. Regional bias in late antique and early medieval coin finds and its effects on data: three case studies. Ukrainian Numismatic Annual 2021, 197–210. [Google Scholar] [CrossRef]
- Kurt, A. Minting, State, and Economy in the Visigothic Kingdom: From Settlement in Aquitaine through the First Decade of the Muslim Conquest of Spain. 2020. [Google Scholar]
- Castro Priego, M. Absent coinage: Archaeological contexts and tremisses on the central Iberian Peninsula in the 7th and 8th centuries AD. Medieval Archaeology 2016, 60, 27–56. [Google Scholar] [CrossRef]
- Pliego, R. Rethinking the minimi of the Iberian Peninsula and Balearic Islands in late antiquity. Journal of Medieval Iberian Studies 2020, 12, 125–154. [Google Scholar] [CrossRef]
- Said, S.E.; Dickey, D.A. Testing for unit roots in autoregressive-moving average models of unknown order. Biometrika 1984, 71, 599–607. [Google Scholar] [CrossRef]
- Kwiatkowski, D.; Phillips, P.C.; Schmidt, P.; Shin, Y. Testing the null hypothesis of stationarity against the alternative of a unit root: How sure are we that economic time series have a unit root? Journal of econometrics 1992, 54, 159–178. [Google Scholar] [CrossRef]
- Wood, J. Borders, Centres and Peripheries in late Roman and Visigothic Iberia. International Journal of Regional and Local History 2015, 10, 1–17. [Google Scholar] [CrossRef]
- Killick, R.; Eckley, I.A. changepoint: An R Package for Changepoint Analysis. Journal of Statistical Software 2014, 58, 1–19. [Google Scholar] [CrossRef]
- Killick, R.; Fearnhead, P.; Eckley, I.A. Optimal detection of changepoints with a linear computational cost. Journal of the American Statistical Association 2012, 107, 1590–1598. [Google Scholar] [CrossRef]
- Lanzante, J.R. Resistant, robust and non-parametric techniques for the analysis of climate data: Theory and examples, including applications to historical radiosonde station data. International Journal of Climatology: A Journal of the Royal Meteorological Society 1996, 16, 1197–1226. [Google Scholar] [CrossRef]
- Pettitt, A.N. A non-parametric approach to the change-point problem. Journal of the Royal Statistical Society: Series C (Applied Statistics) 1979, 28, 126–135. [Google Scholar] [CrossRef]
- Buishand, T.A. Some methods for testing the homogeneity of rainfall records. Journal of hydrology 1982, 58, 11–27. [Google Scholar] [CrossRef]
- Burns, T.S. The battle of Adrianople: a reconsideration. Historia: Zeitschrift für Alte Geschichte 1973, 336–345. [Google Scholar]
- James, Nicholas A.; Matteson, David S. ecp: An R Package for Nonparametric Multiple Change Point Analysis of Multivariate Data. Journal of Statistical Software 2014, 62, 1–25. [Google Scholar] [CrossRef]
- Walton, P.; Moorhead, S. Coinage and collapse? The contribution of numismatic data to understanding the end of Roman Britain. Internet Archaeology 2016. [Google Scholar] [CrossRef]
- Heather, P. Why did the Barbarian cross the Rhine? Journal of Late Antiquity 2009, 2, 3–29. [Google Scholar] [CrossRef]
- Pohl, W.; Wieser, V. Emerging Powers in Eurasian Comparison, 200–1100: Shadows of Empire; Brill: Leiden, The Netherlands, 2022. [Google Scholar] [CrossRef]
- Larnach, M.J. All roads lead to Constantinople: Exploring the Via Militaris in the medieval Balkans, 600-1204. PhD thesis, 2016. [Google Scholar]
- Bursche, A. Circulation of Roman Coinage in Northern Europe in late antiquity; Éditions de l’EHESS, 2002; Vol. 17. [Google Scholar]
- Collins, R. Visigothic Spain 409-711; John Wiley & Sons, 2008. [Google Scholar]
- Collins, R. The battle of Adrianople and the sack of Rome. In Early Medieval Europe 300–1000; Macmillan Education UK: London, 1991; pp. 45–57. [Google Scholar] [CrossRef]
- Newman, M.E.; Watts, D.J. Scaling and percolation in the small-world network model. Physical review E 1999, 60, 7332. [Google Scholar] [CrossRef]
- Scheidel, W. The shape of the Roman world: modelling imperial connectivity. Journal of Roman Archaeology Copyright - Copyright © Journal of Roman Archaeology L.L.C. 2014; Última actualización - 2023-12-05. 2014, 27, 7–32. [Google Scholar] [CrossRef]
Figure 1.
Histogram of the span of date ranges.
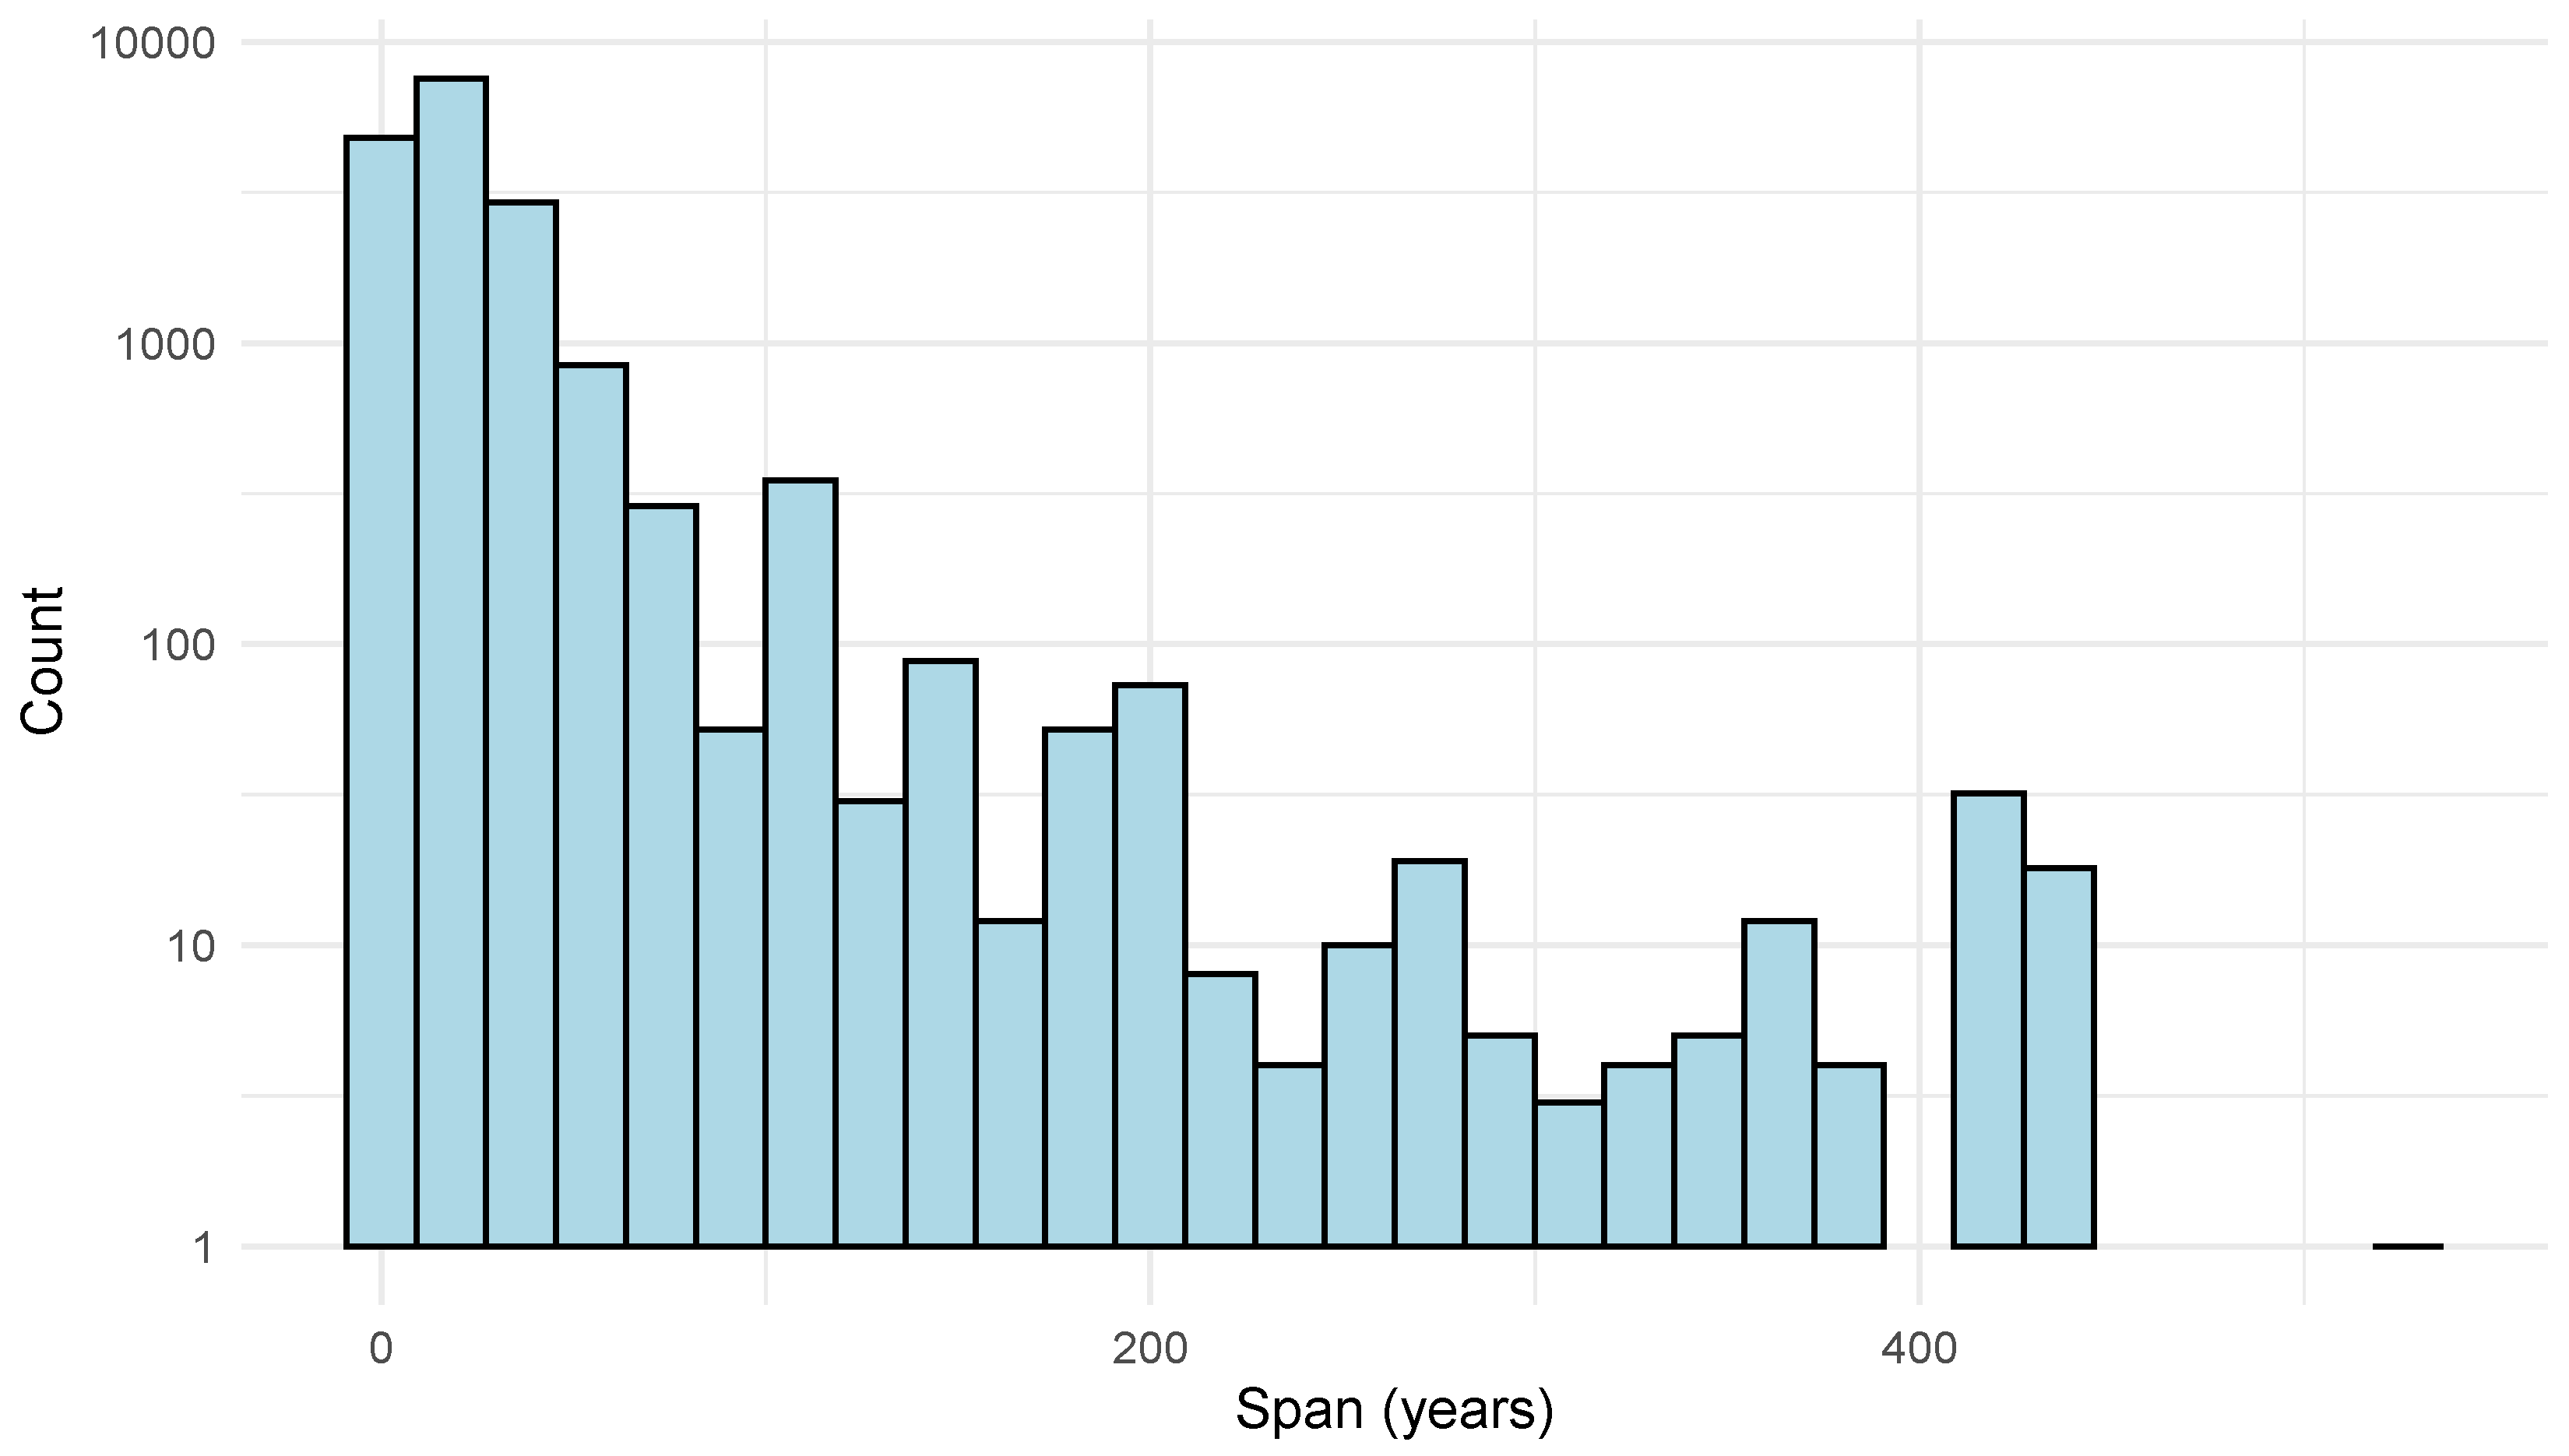
Figure 2.
Time series of interior and all trade link density for the Iberian Peninsula.
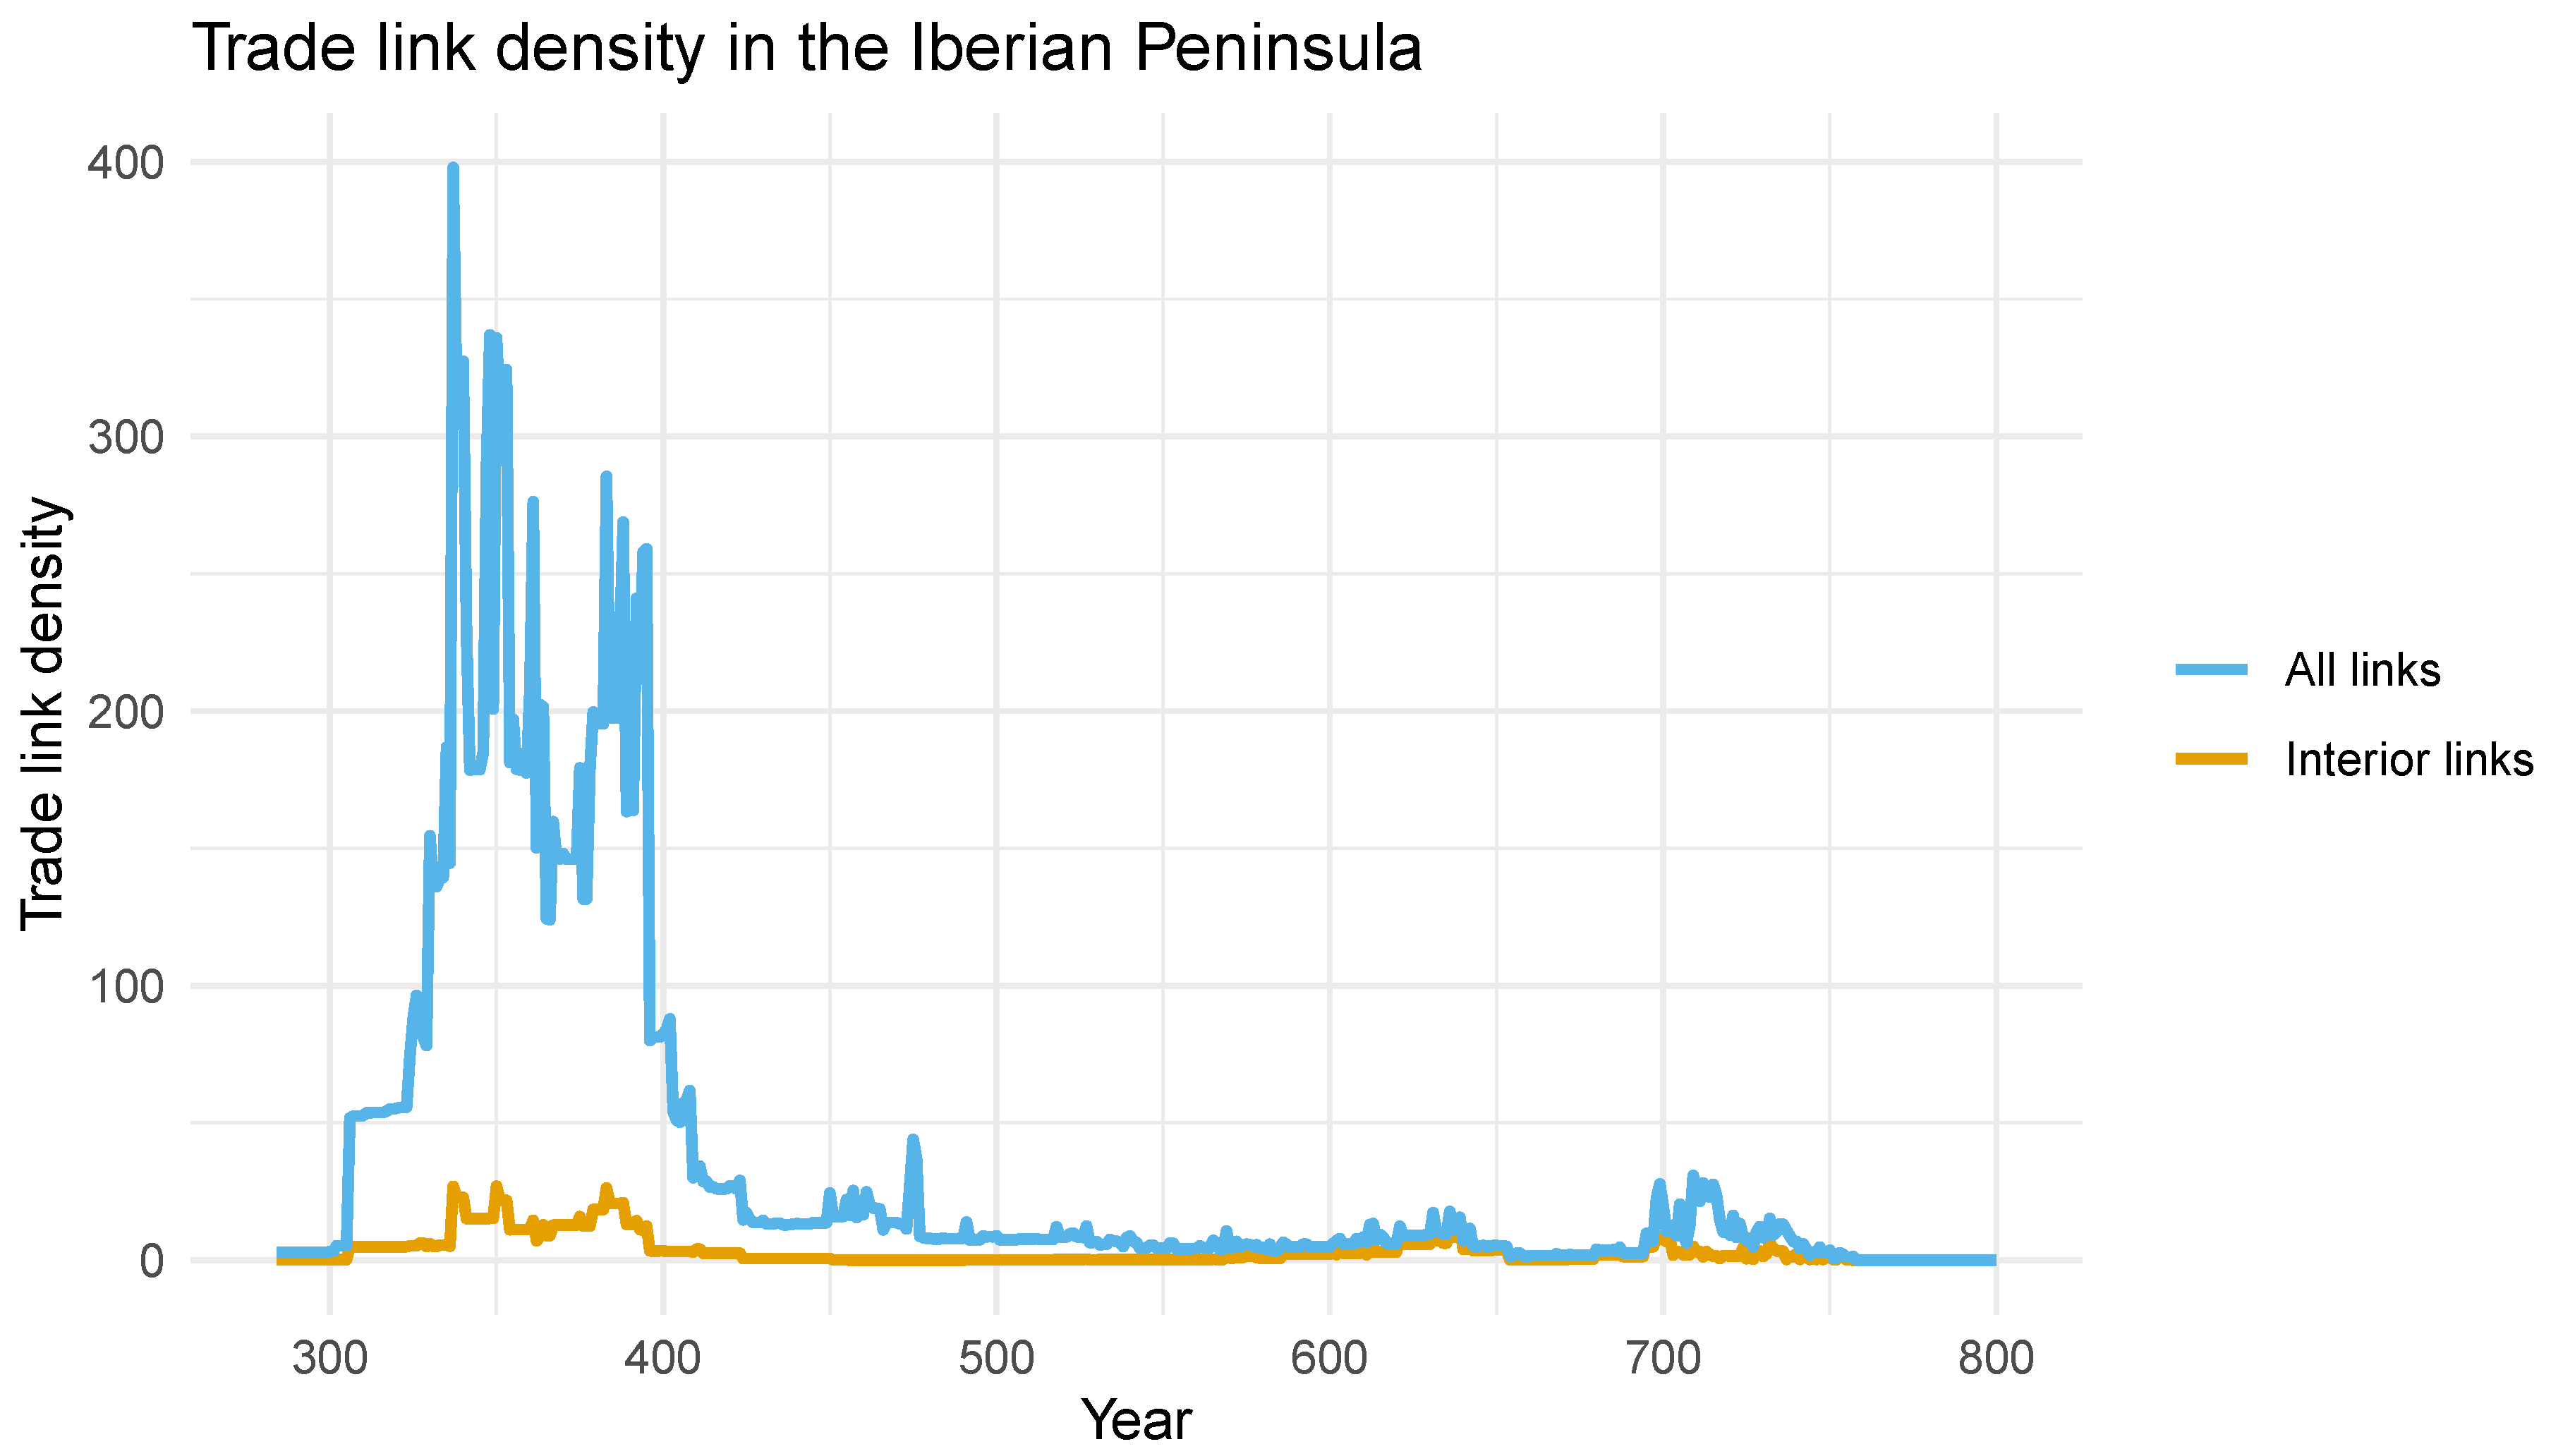
Figure 3.
Graph plot of the regional network using (current) regions as nodes. Edge size is proportional to weight, that is, link density.
Figure 3.
Graph plot of the regional network using (current) regions as nodes. Edge size is proportional to weight, that is, link density.
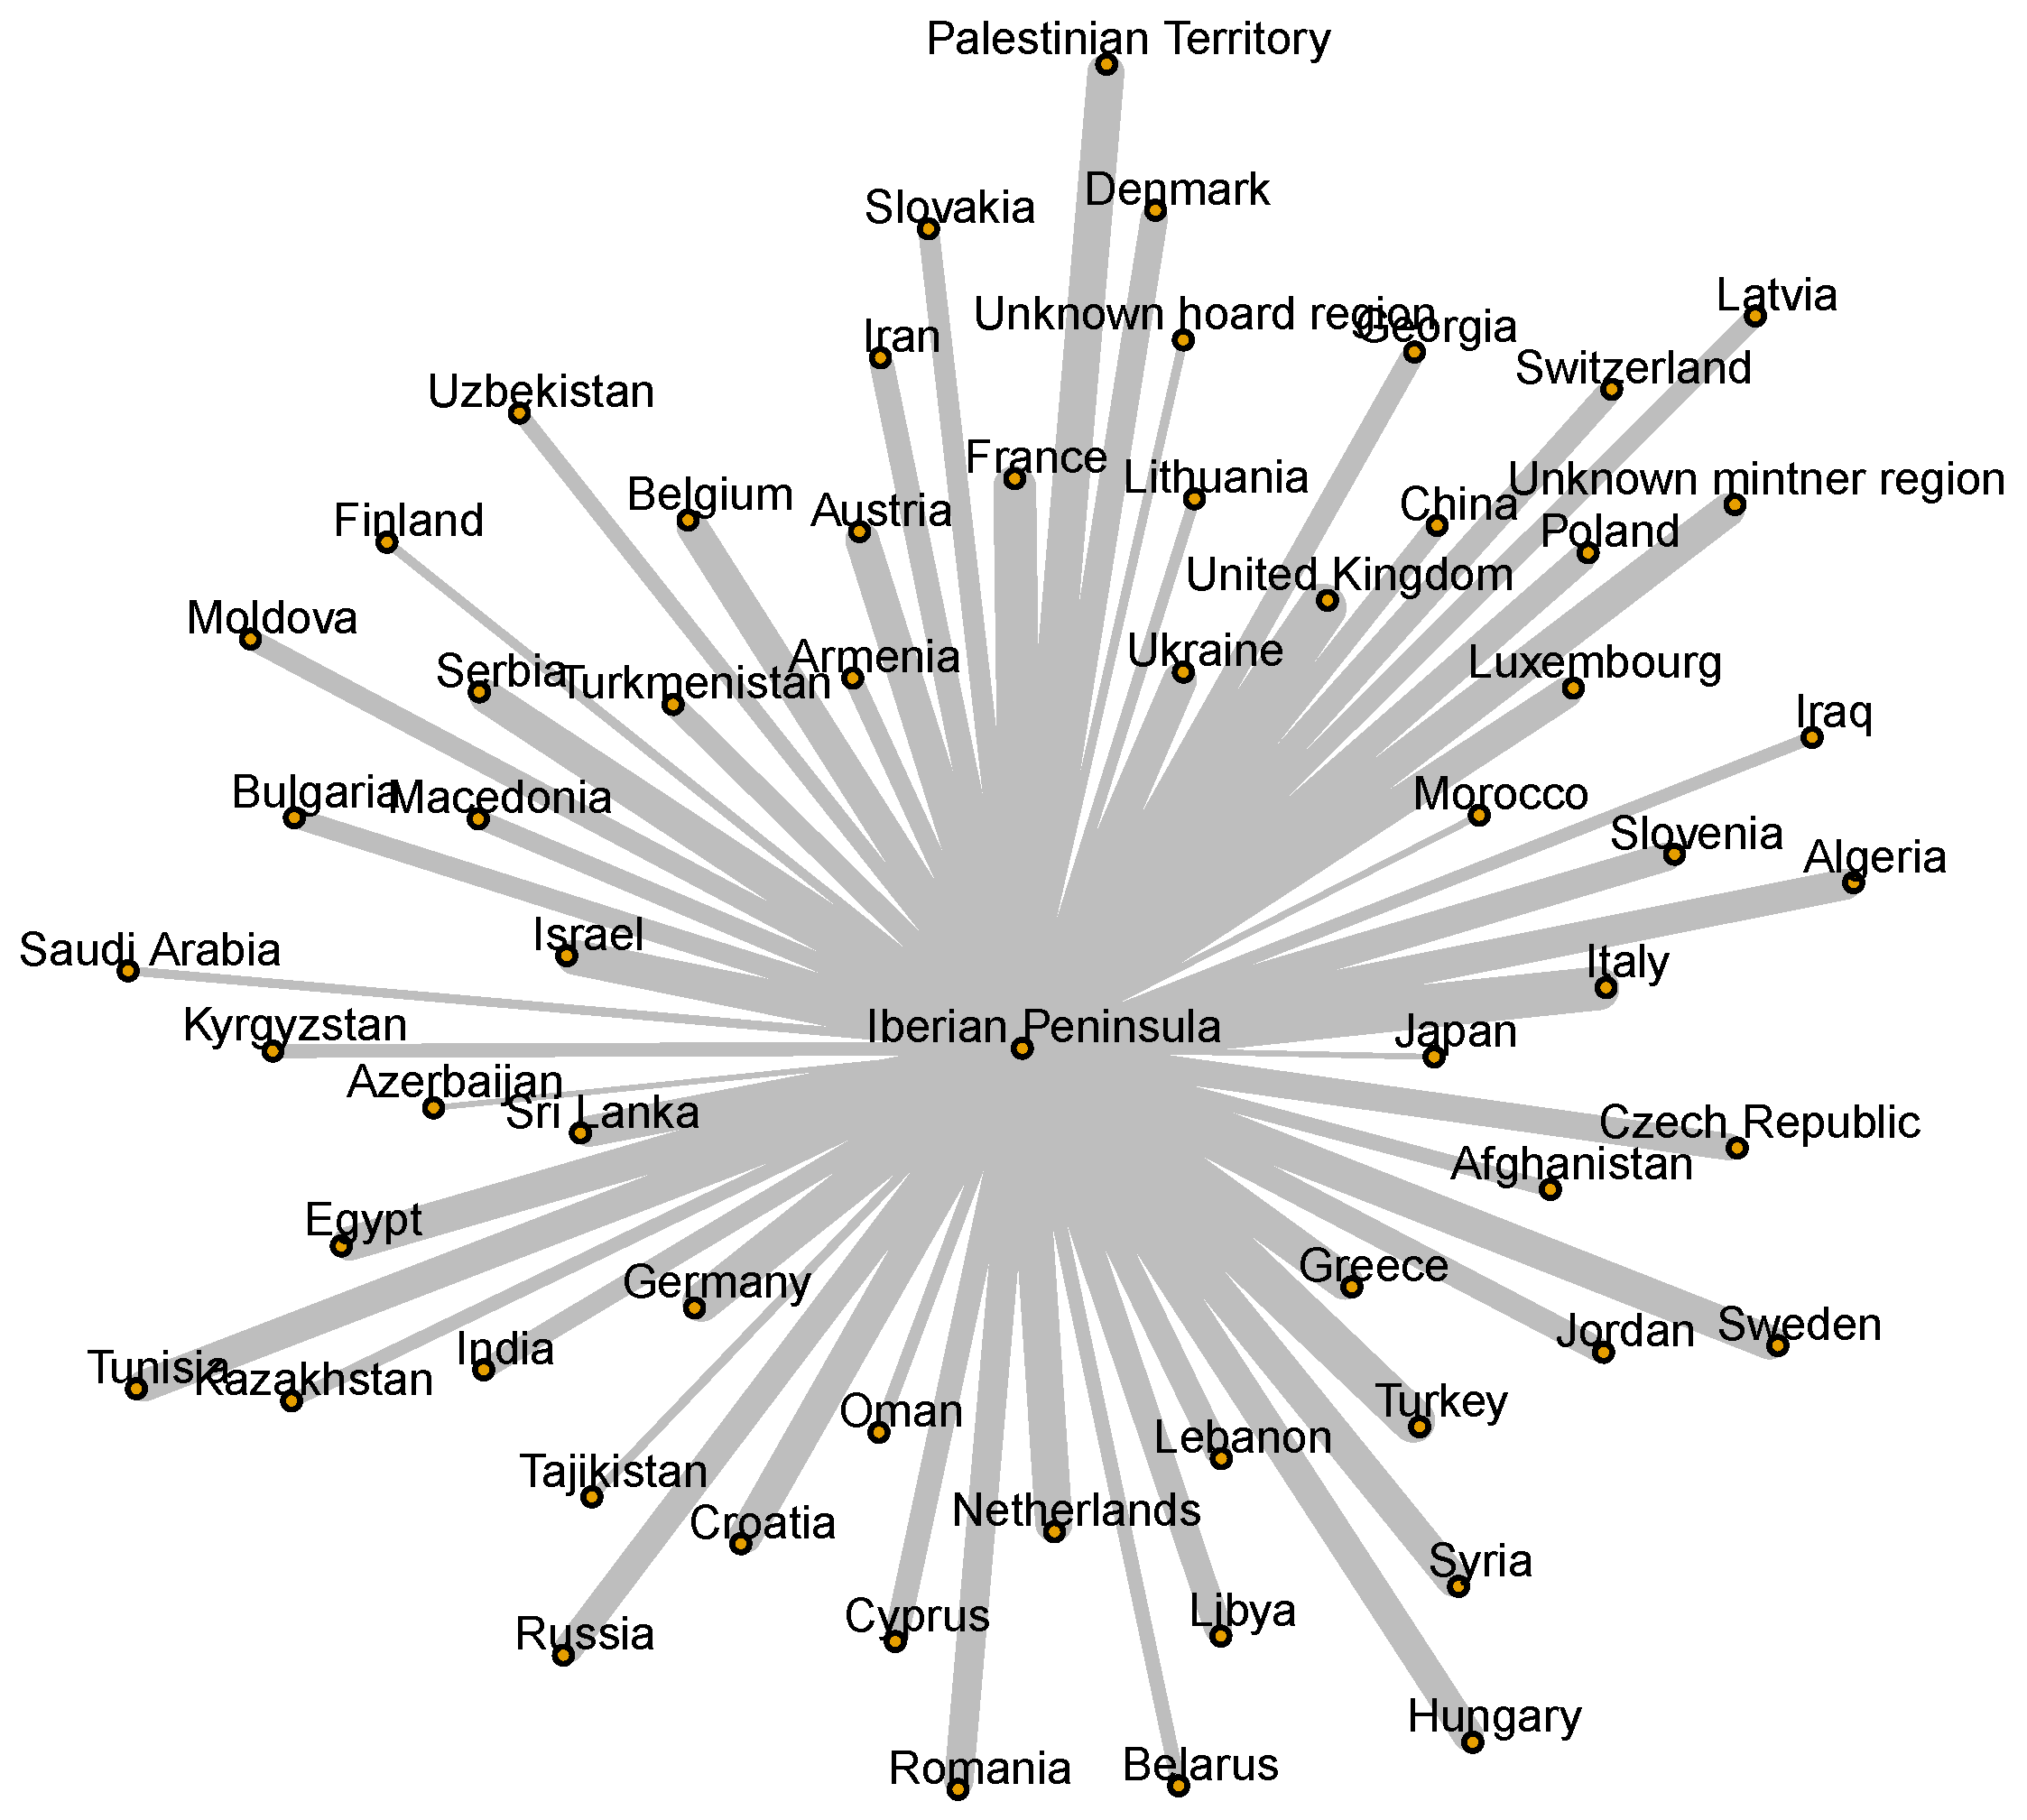
Figure 4.
Cross-correlation between annual trade density and lead pollution.
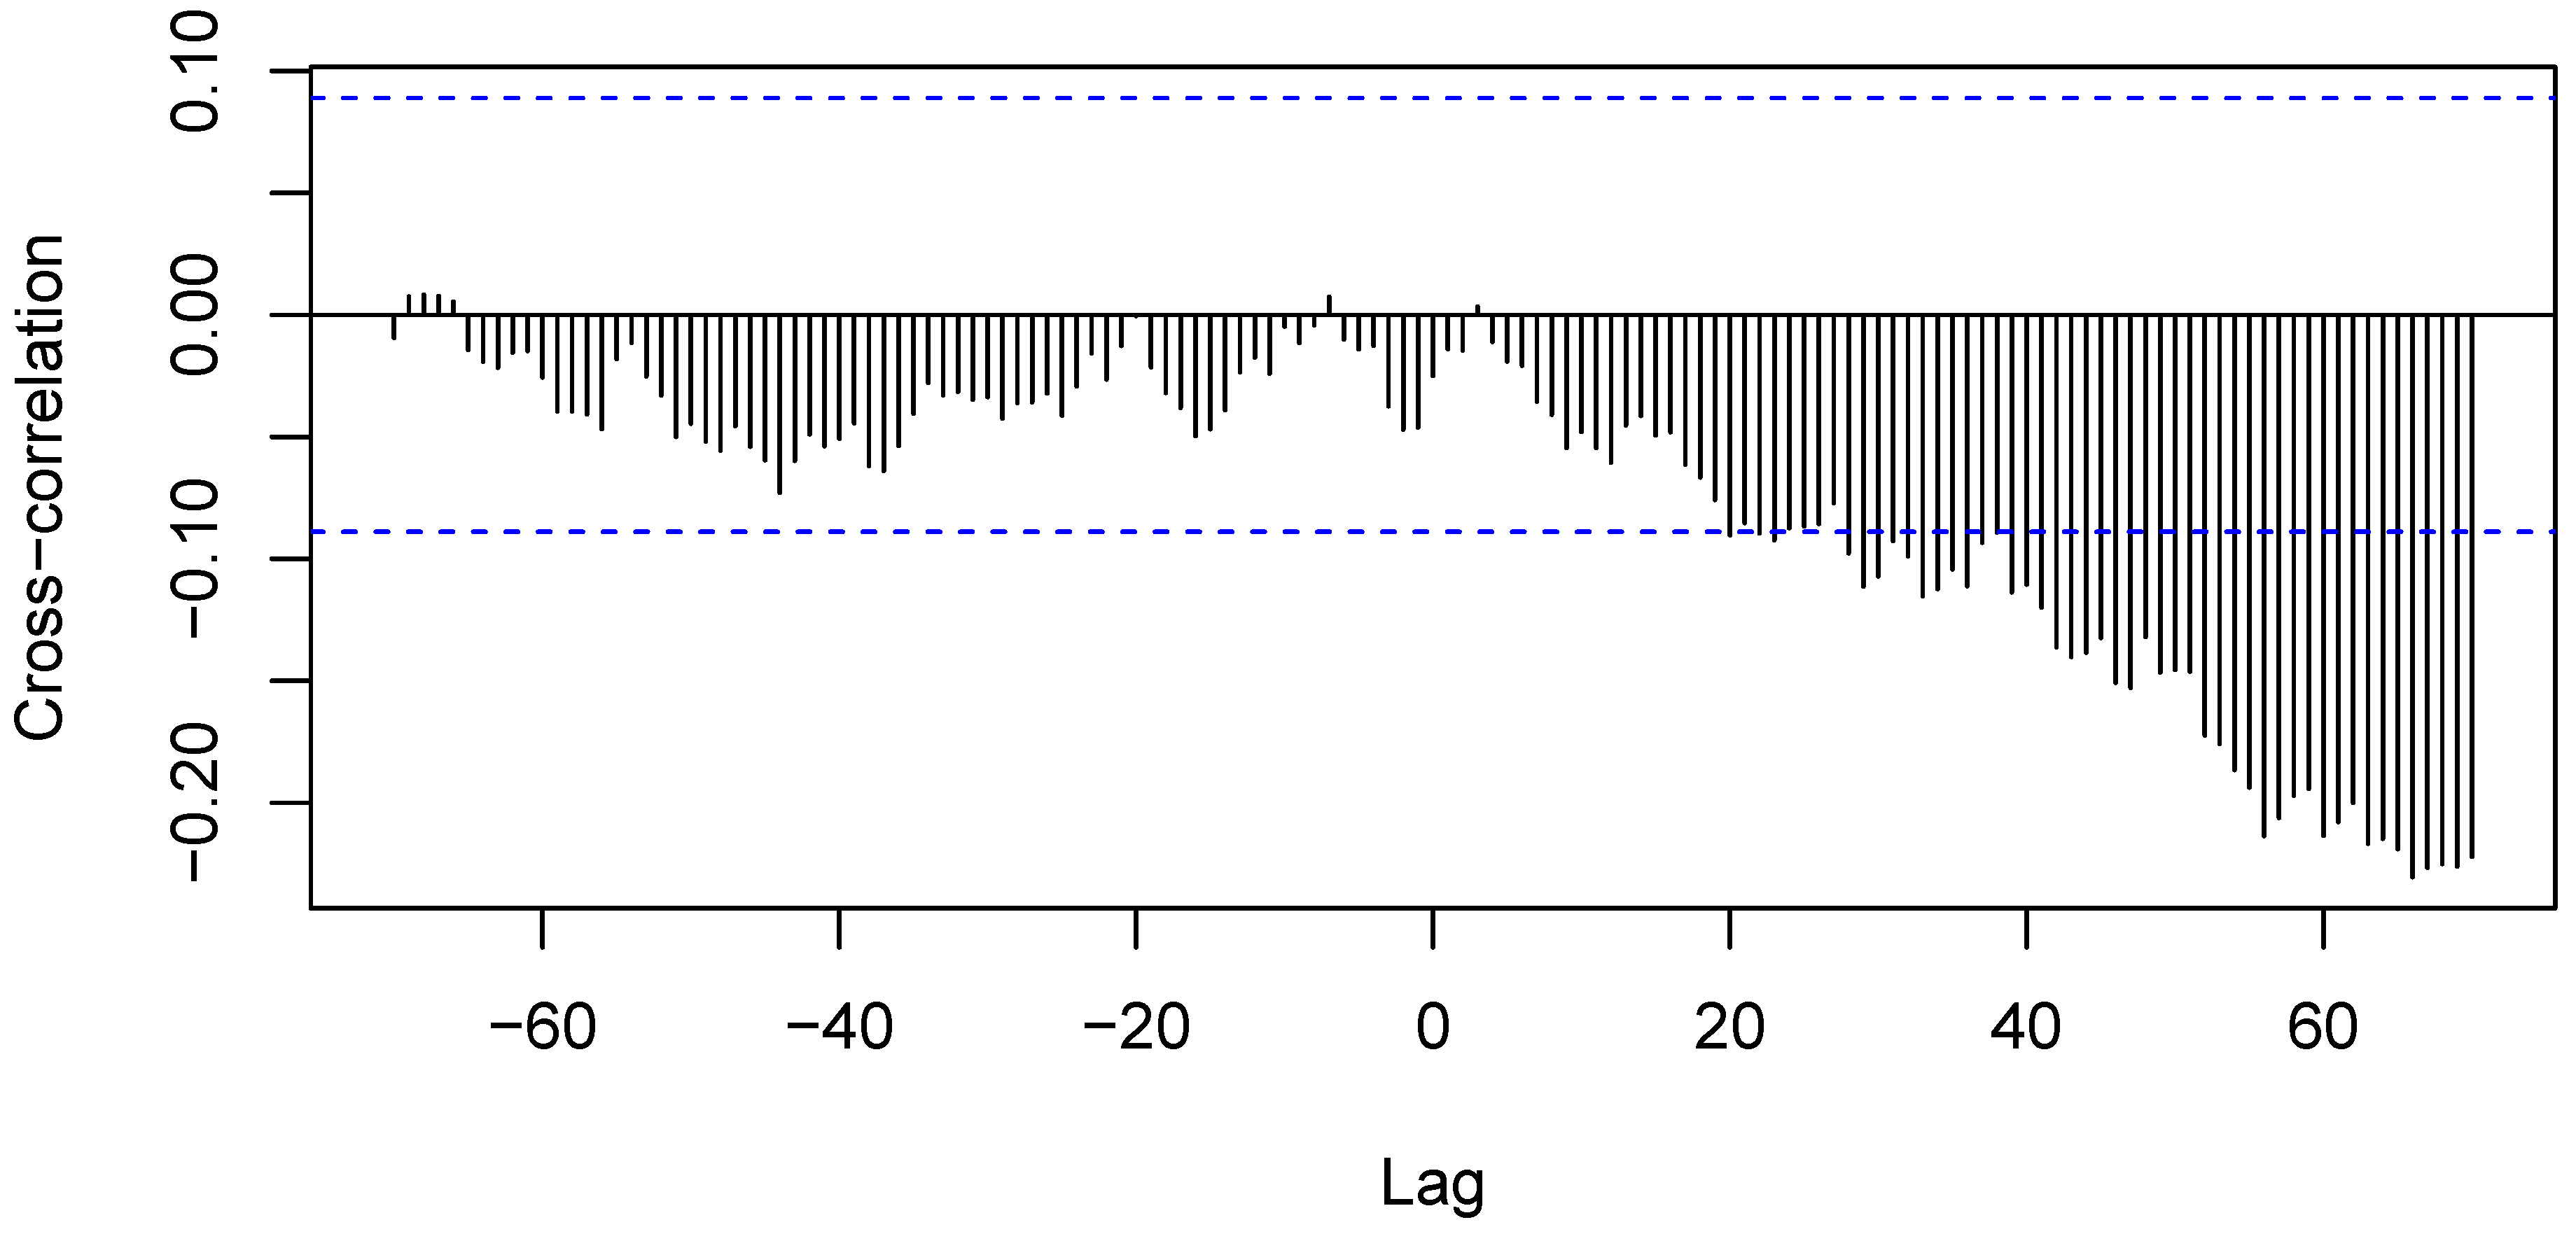
Figure 5.
Time series of interior link density for the Iberian Peninsula, with known historical events indicated.
Figure 5.
Time series of interior link density for the Iberian Peninsula, with known historical events indicated.
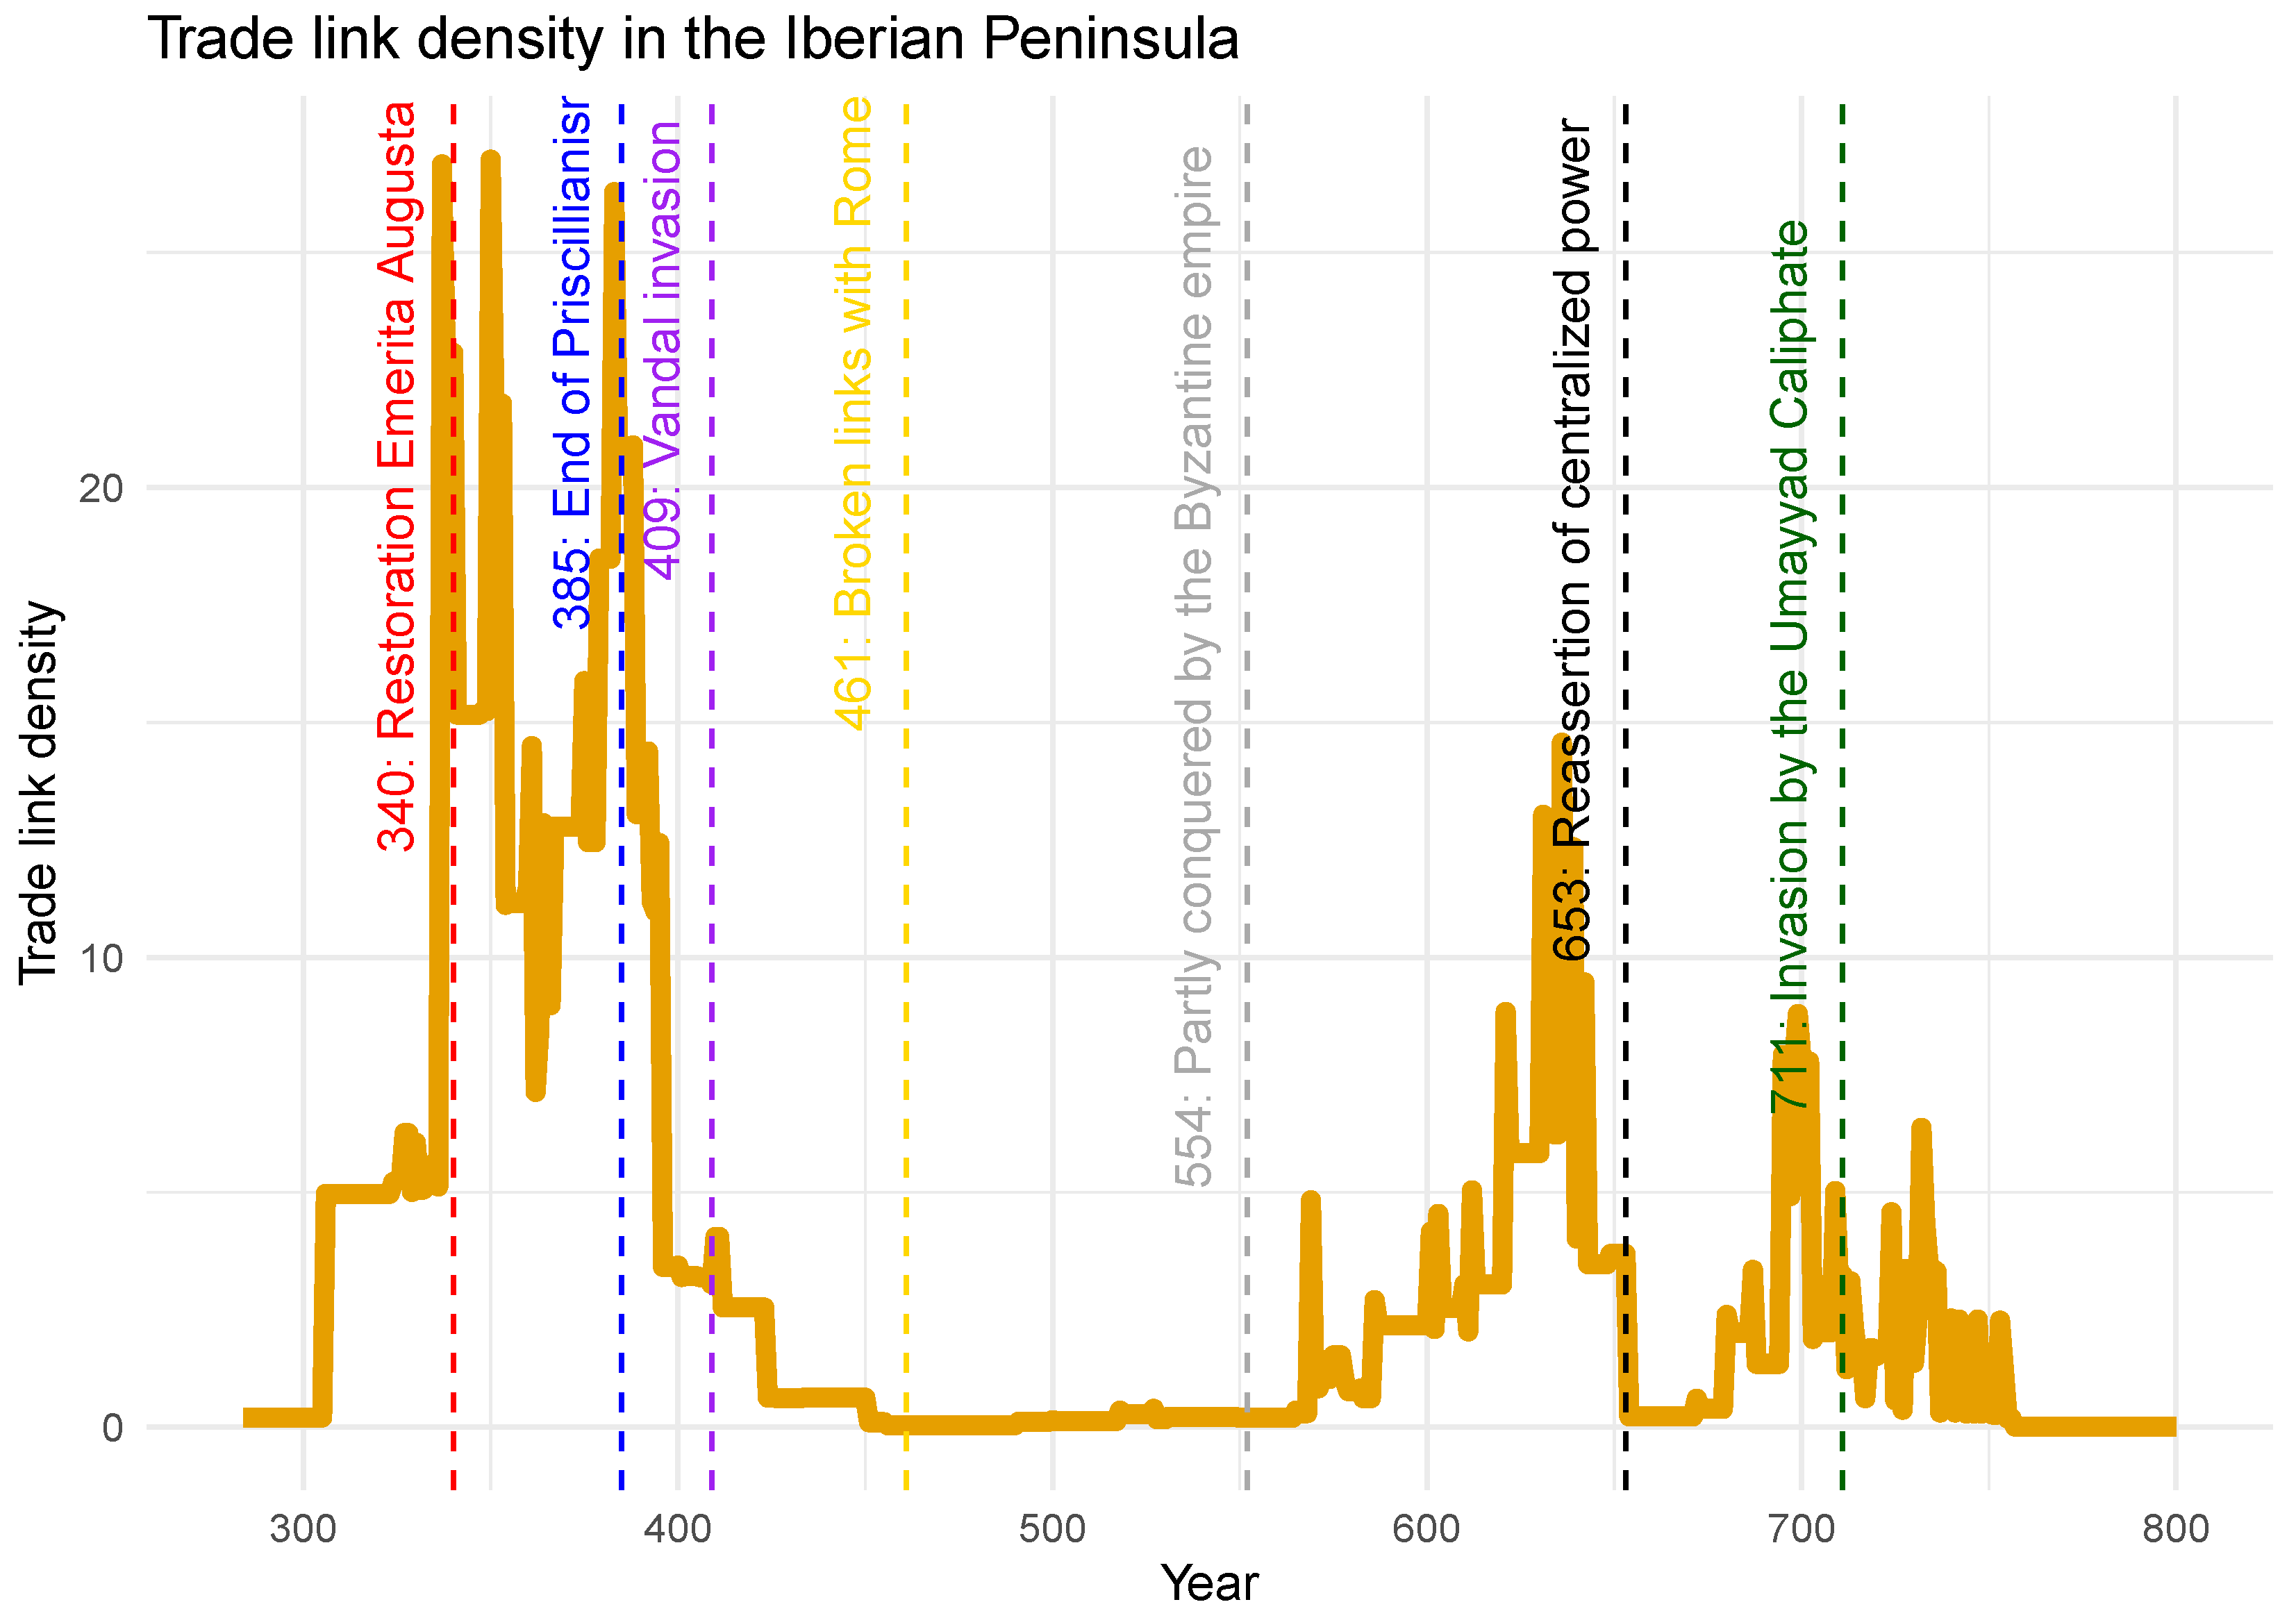
Figure 6.
Changepoint in the time series of density of trade links with the Iberian peninsula, with mean before and after the changepoint in red. This changepoint has been established following the cpt.meanvar method.
Figure 6.
Changepoint in the time series of density of trade links with the Iberian peninsula, with mean before and after the changepoint in red. This changepoint has been established following the cpt.meanvar method.
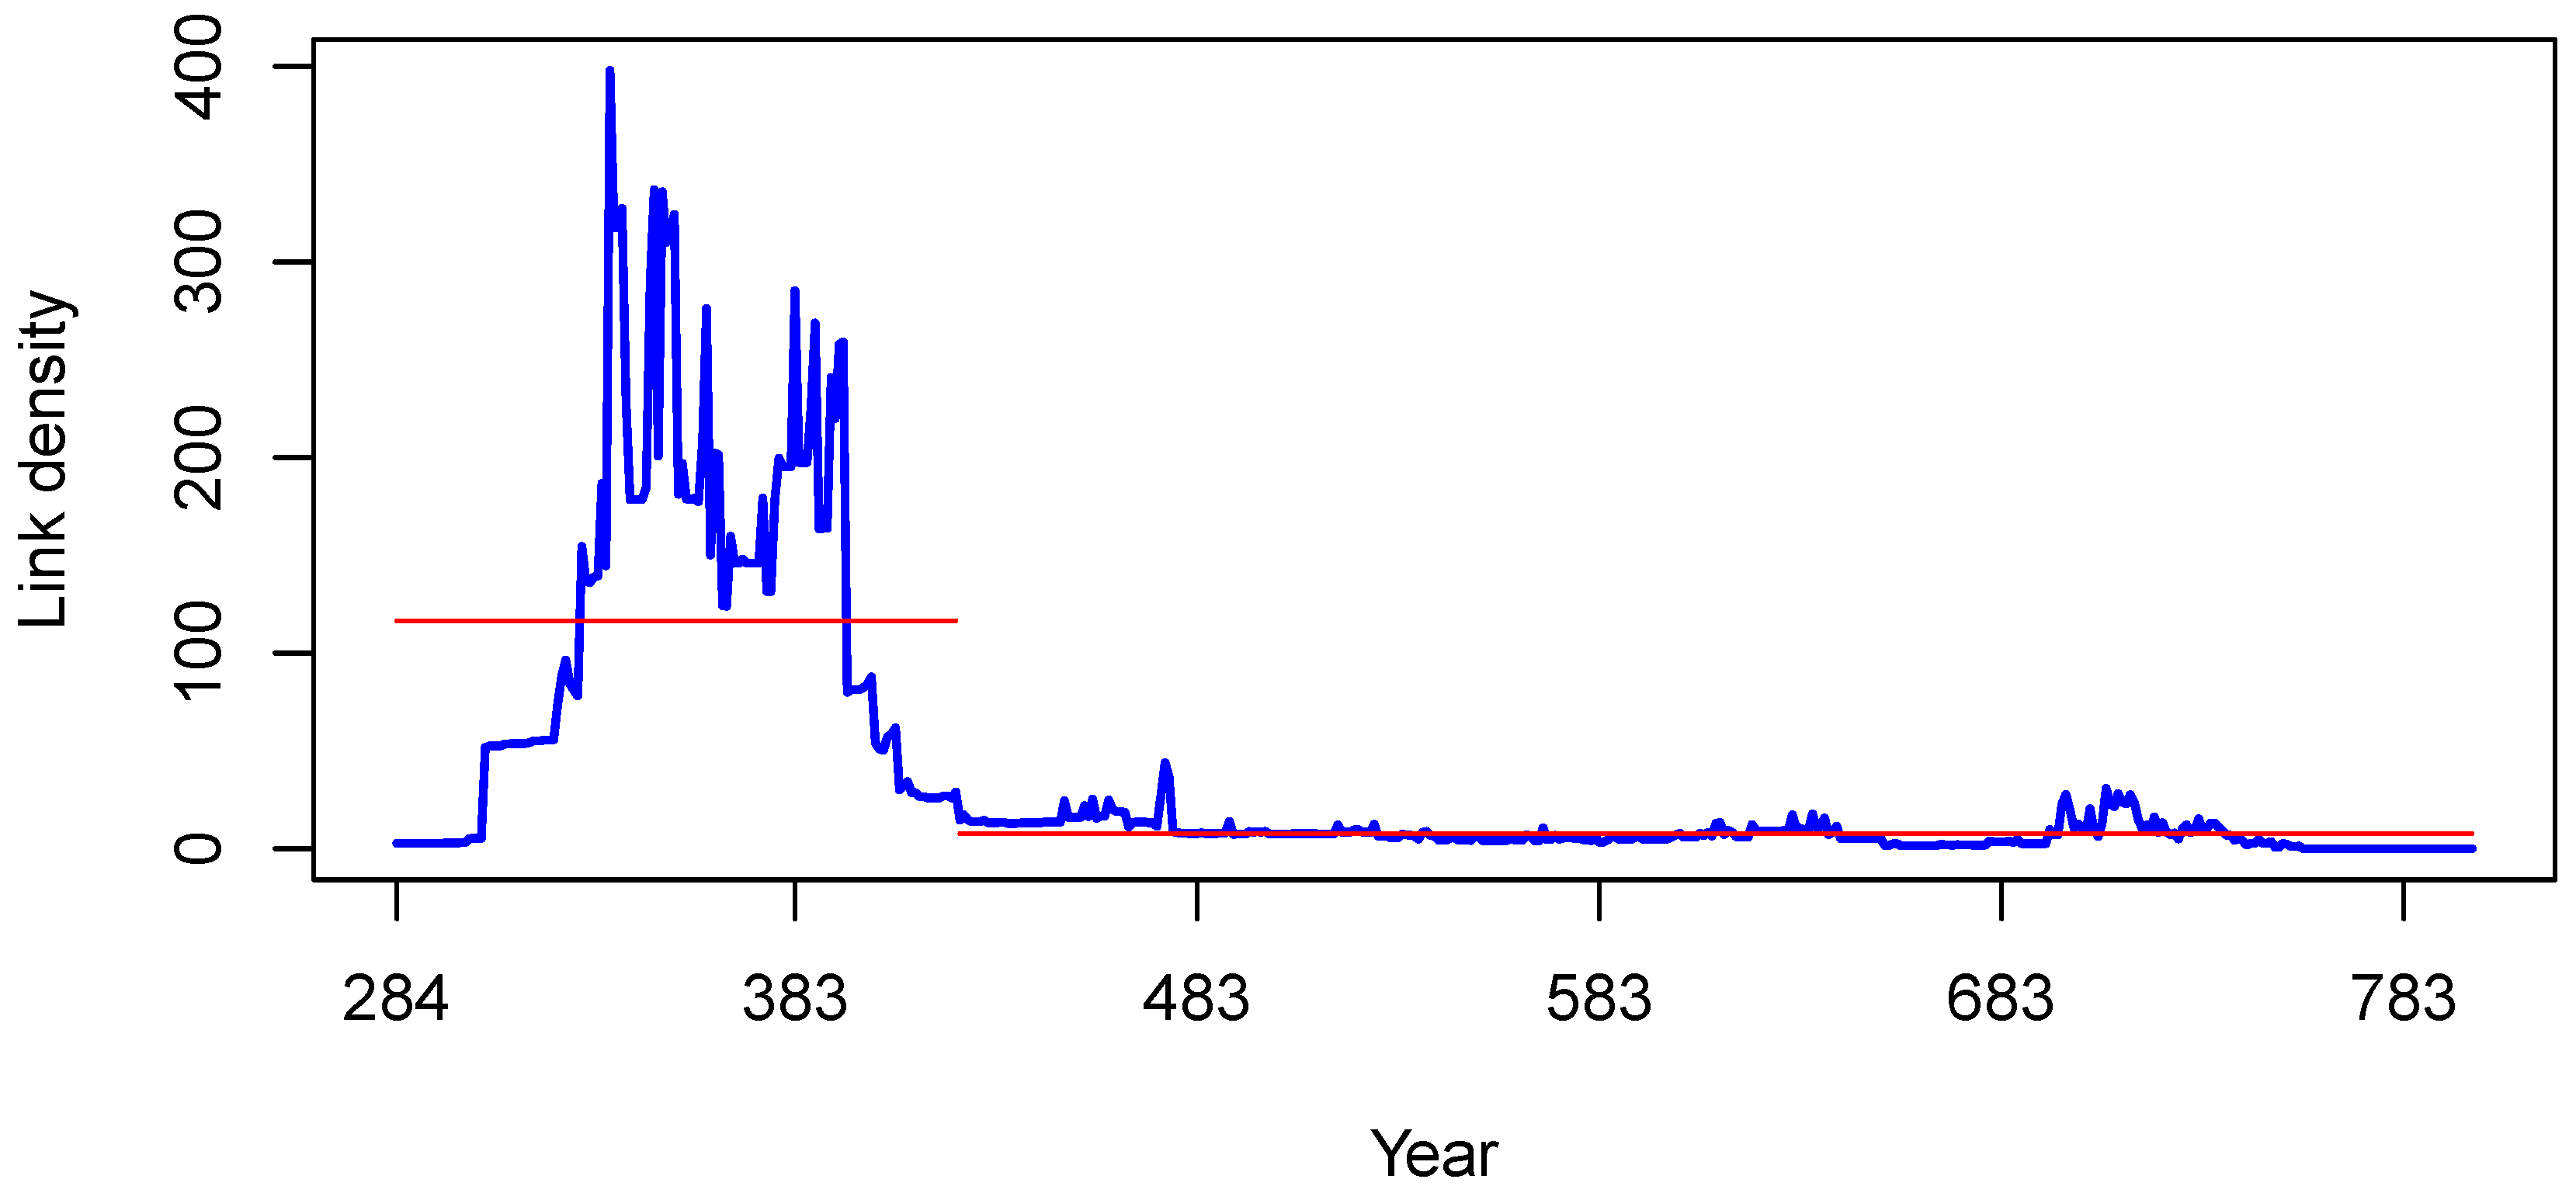
Figure 7.
Multiple changepoints in the time series of density of trade links with the Iberian Peninsula, with mean before and after each changepoint in red. This changepoint has been established following the cpt.meanvar method.
Figure 7.
Multiple changepoints in the time series of density of trade links with the Iberian Peninsula, with mean before and after each changepoint in red. This changepoint has been established following the cpt.meanvar method.
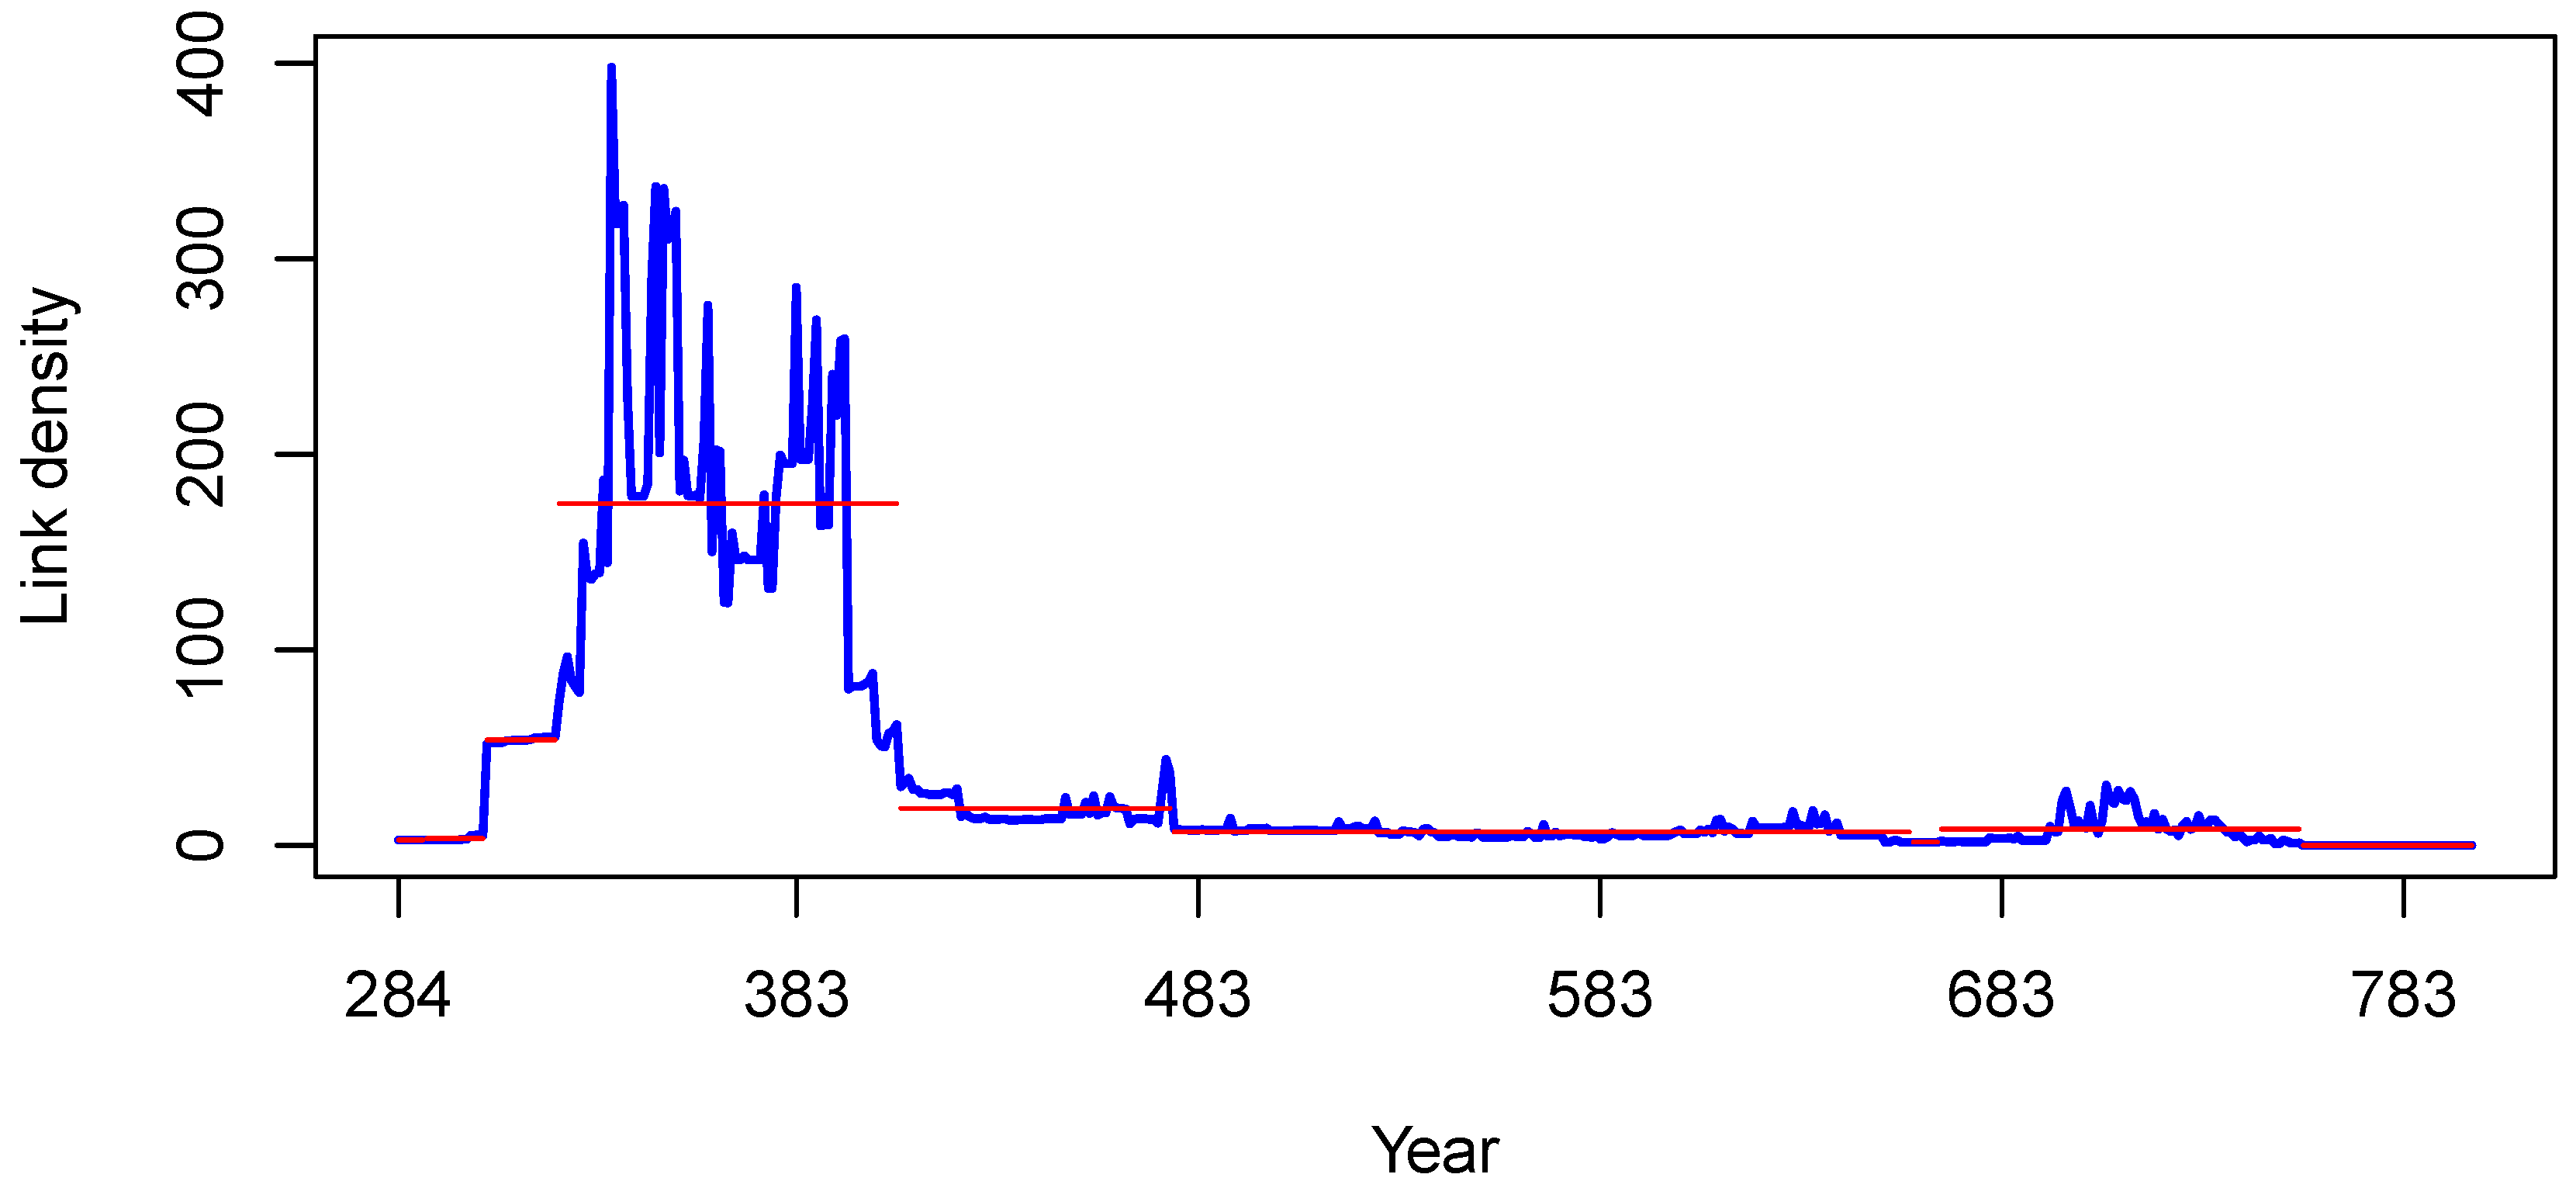
Figure 8.
Changepoint in the time series of intra-Iberian trade link density, with mean before and after the changepoint found using the cpt.mean method in red.
Figure 8.
Changepoint in the time series of intra-Iberian trade link density, with mean before and after the changepoint found using the cpt.mean method in red.
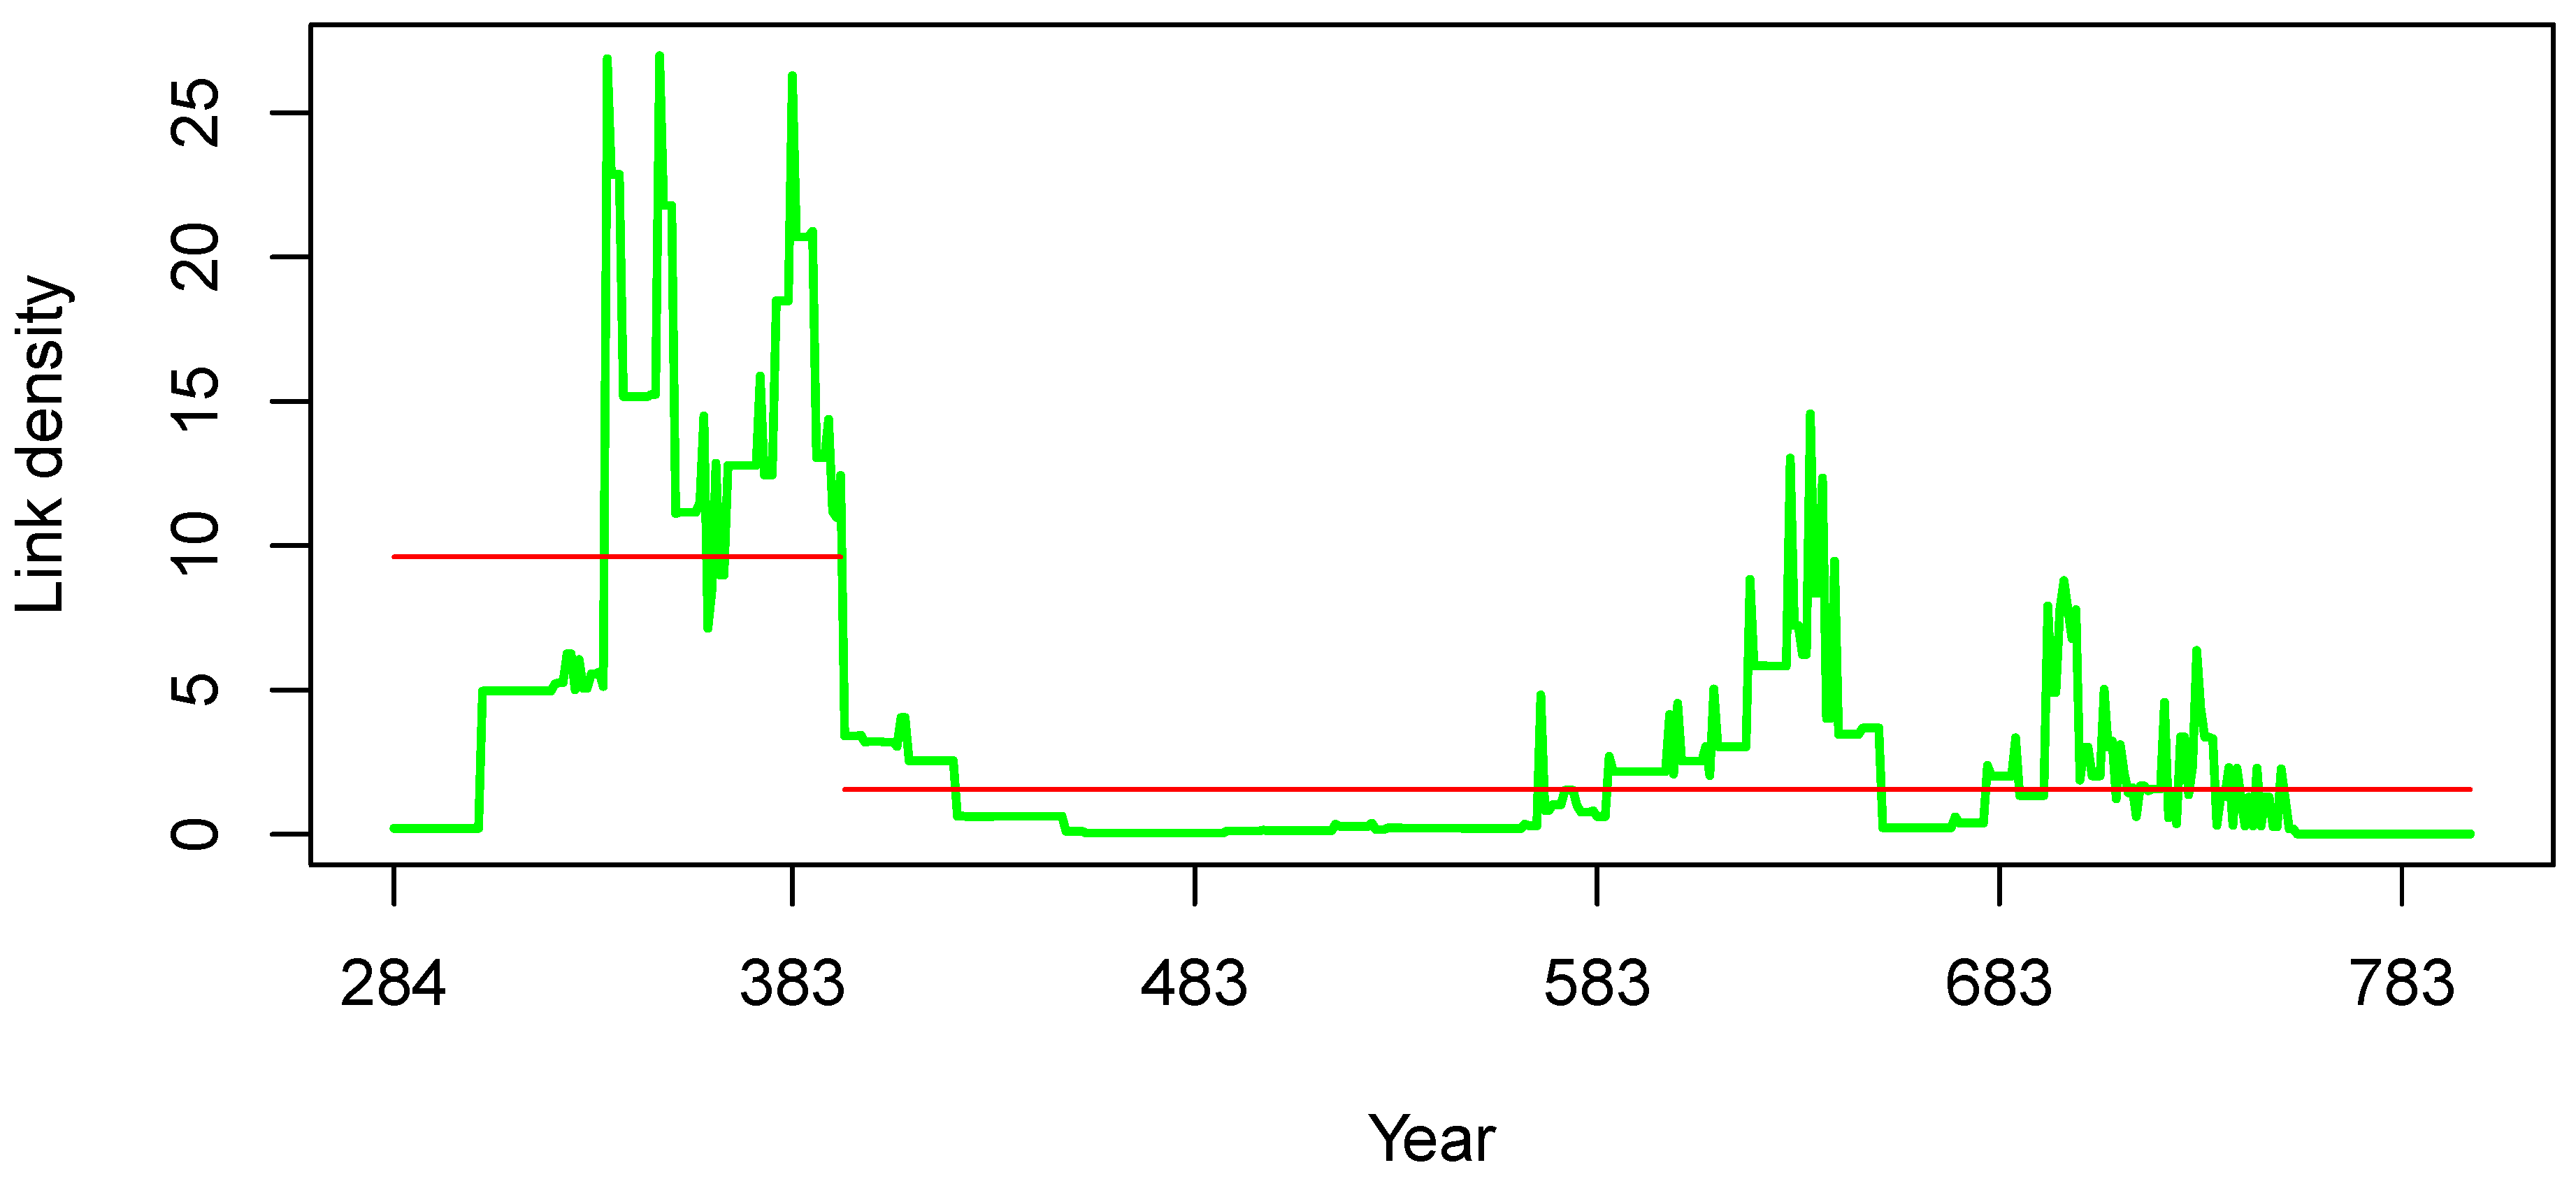
Figure 9.
Link density graph, showing internal and external link density as well as the changepoint found using the ecp multi-sequence method.
Figure 9.
Link density graph, showing internal and external link density as well as the changepoint found using the ecp multi-sequence method.
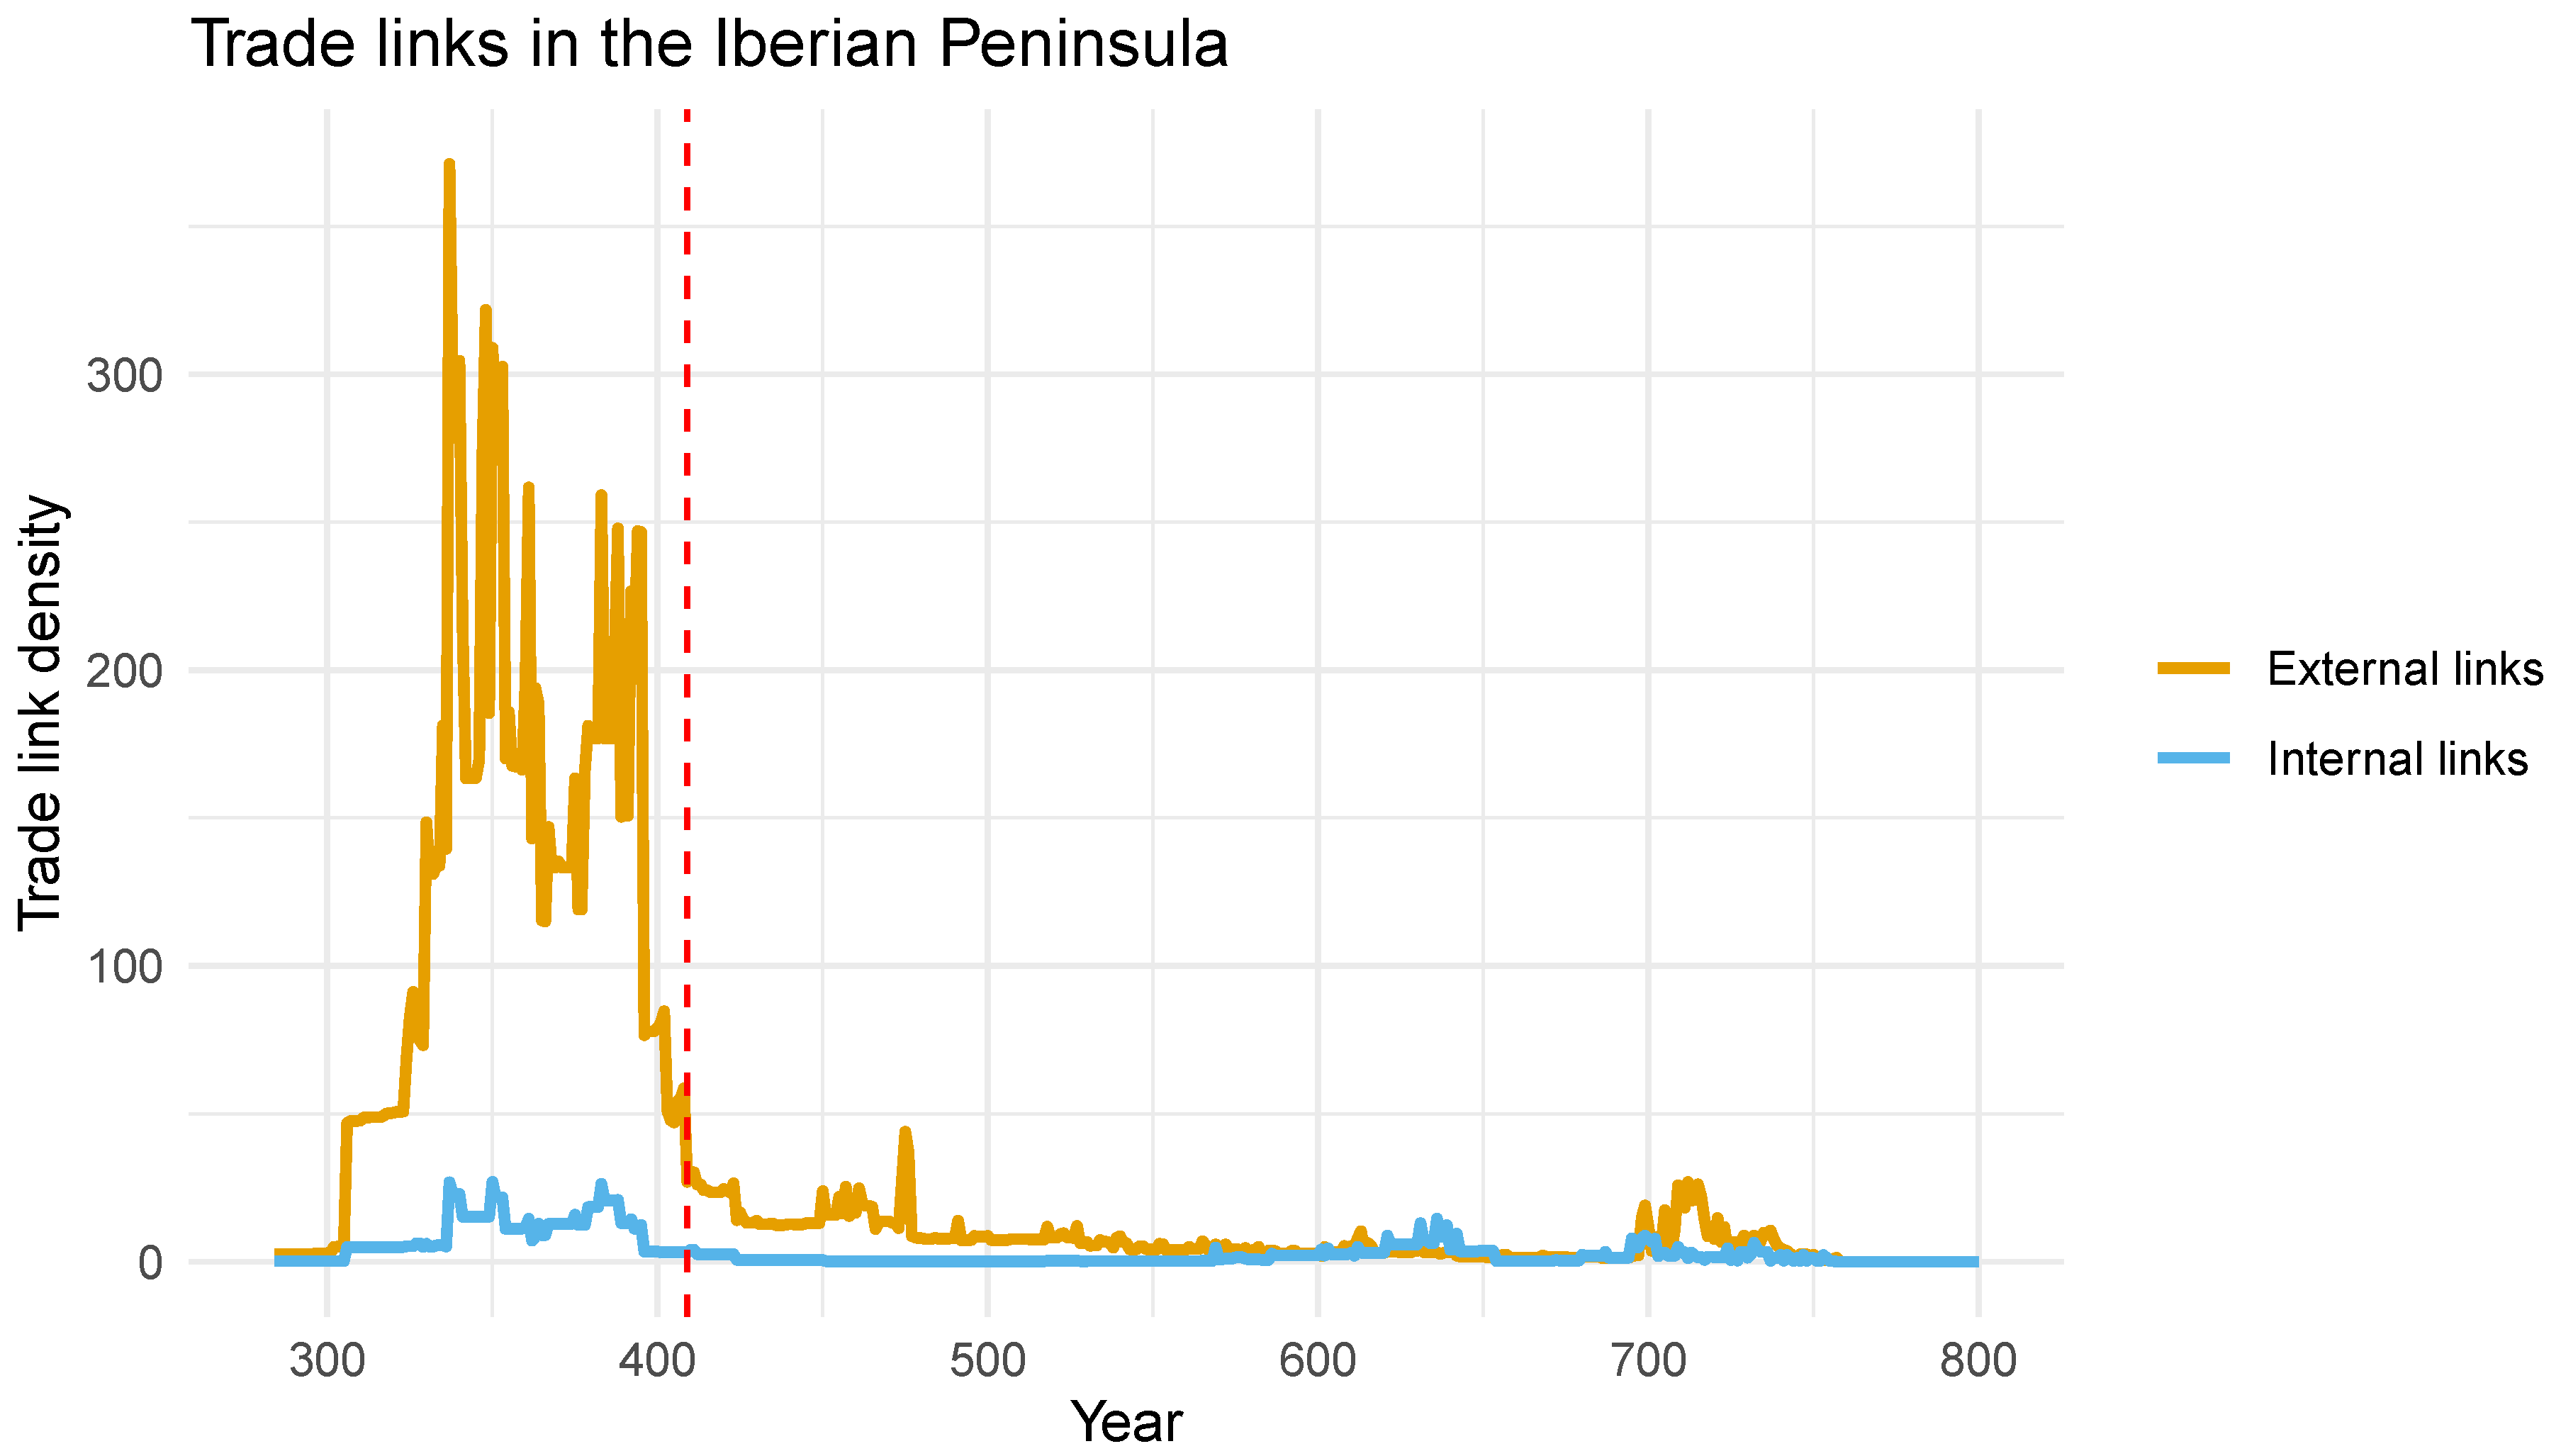
Figure 10.
Evolution through time of the average trade link density by decade with the main trading partners of the Iberian Peninsula, as well as internal links. These and the trade links to the UK are marked also with points for clarity.
Figure 10.
Evolution through time of the average trade link density by decade with the main trading partners of the Iberian Peninsula, as well as internal links. These and the trade links to the UK are marked also with points for clarity.
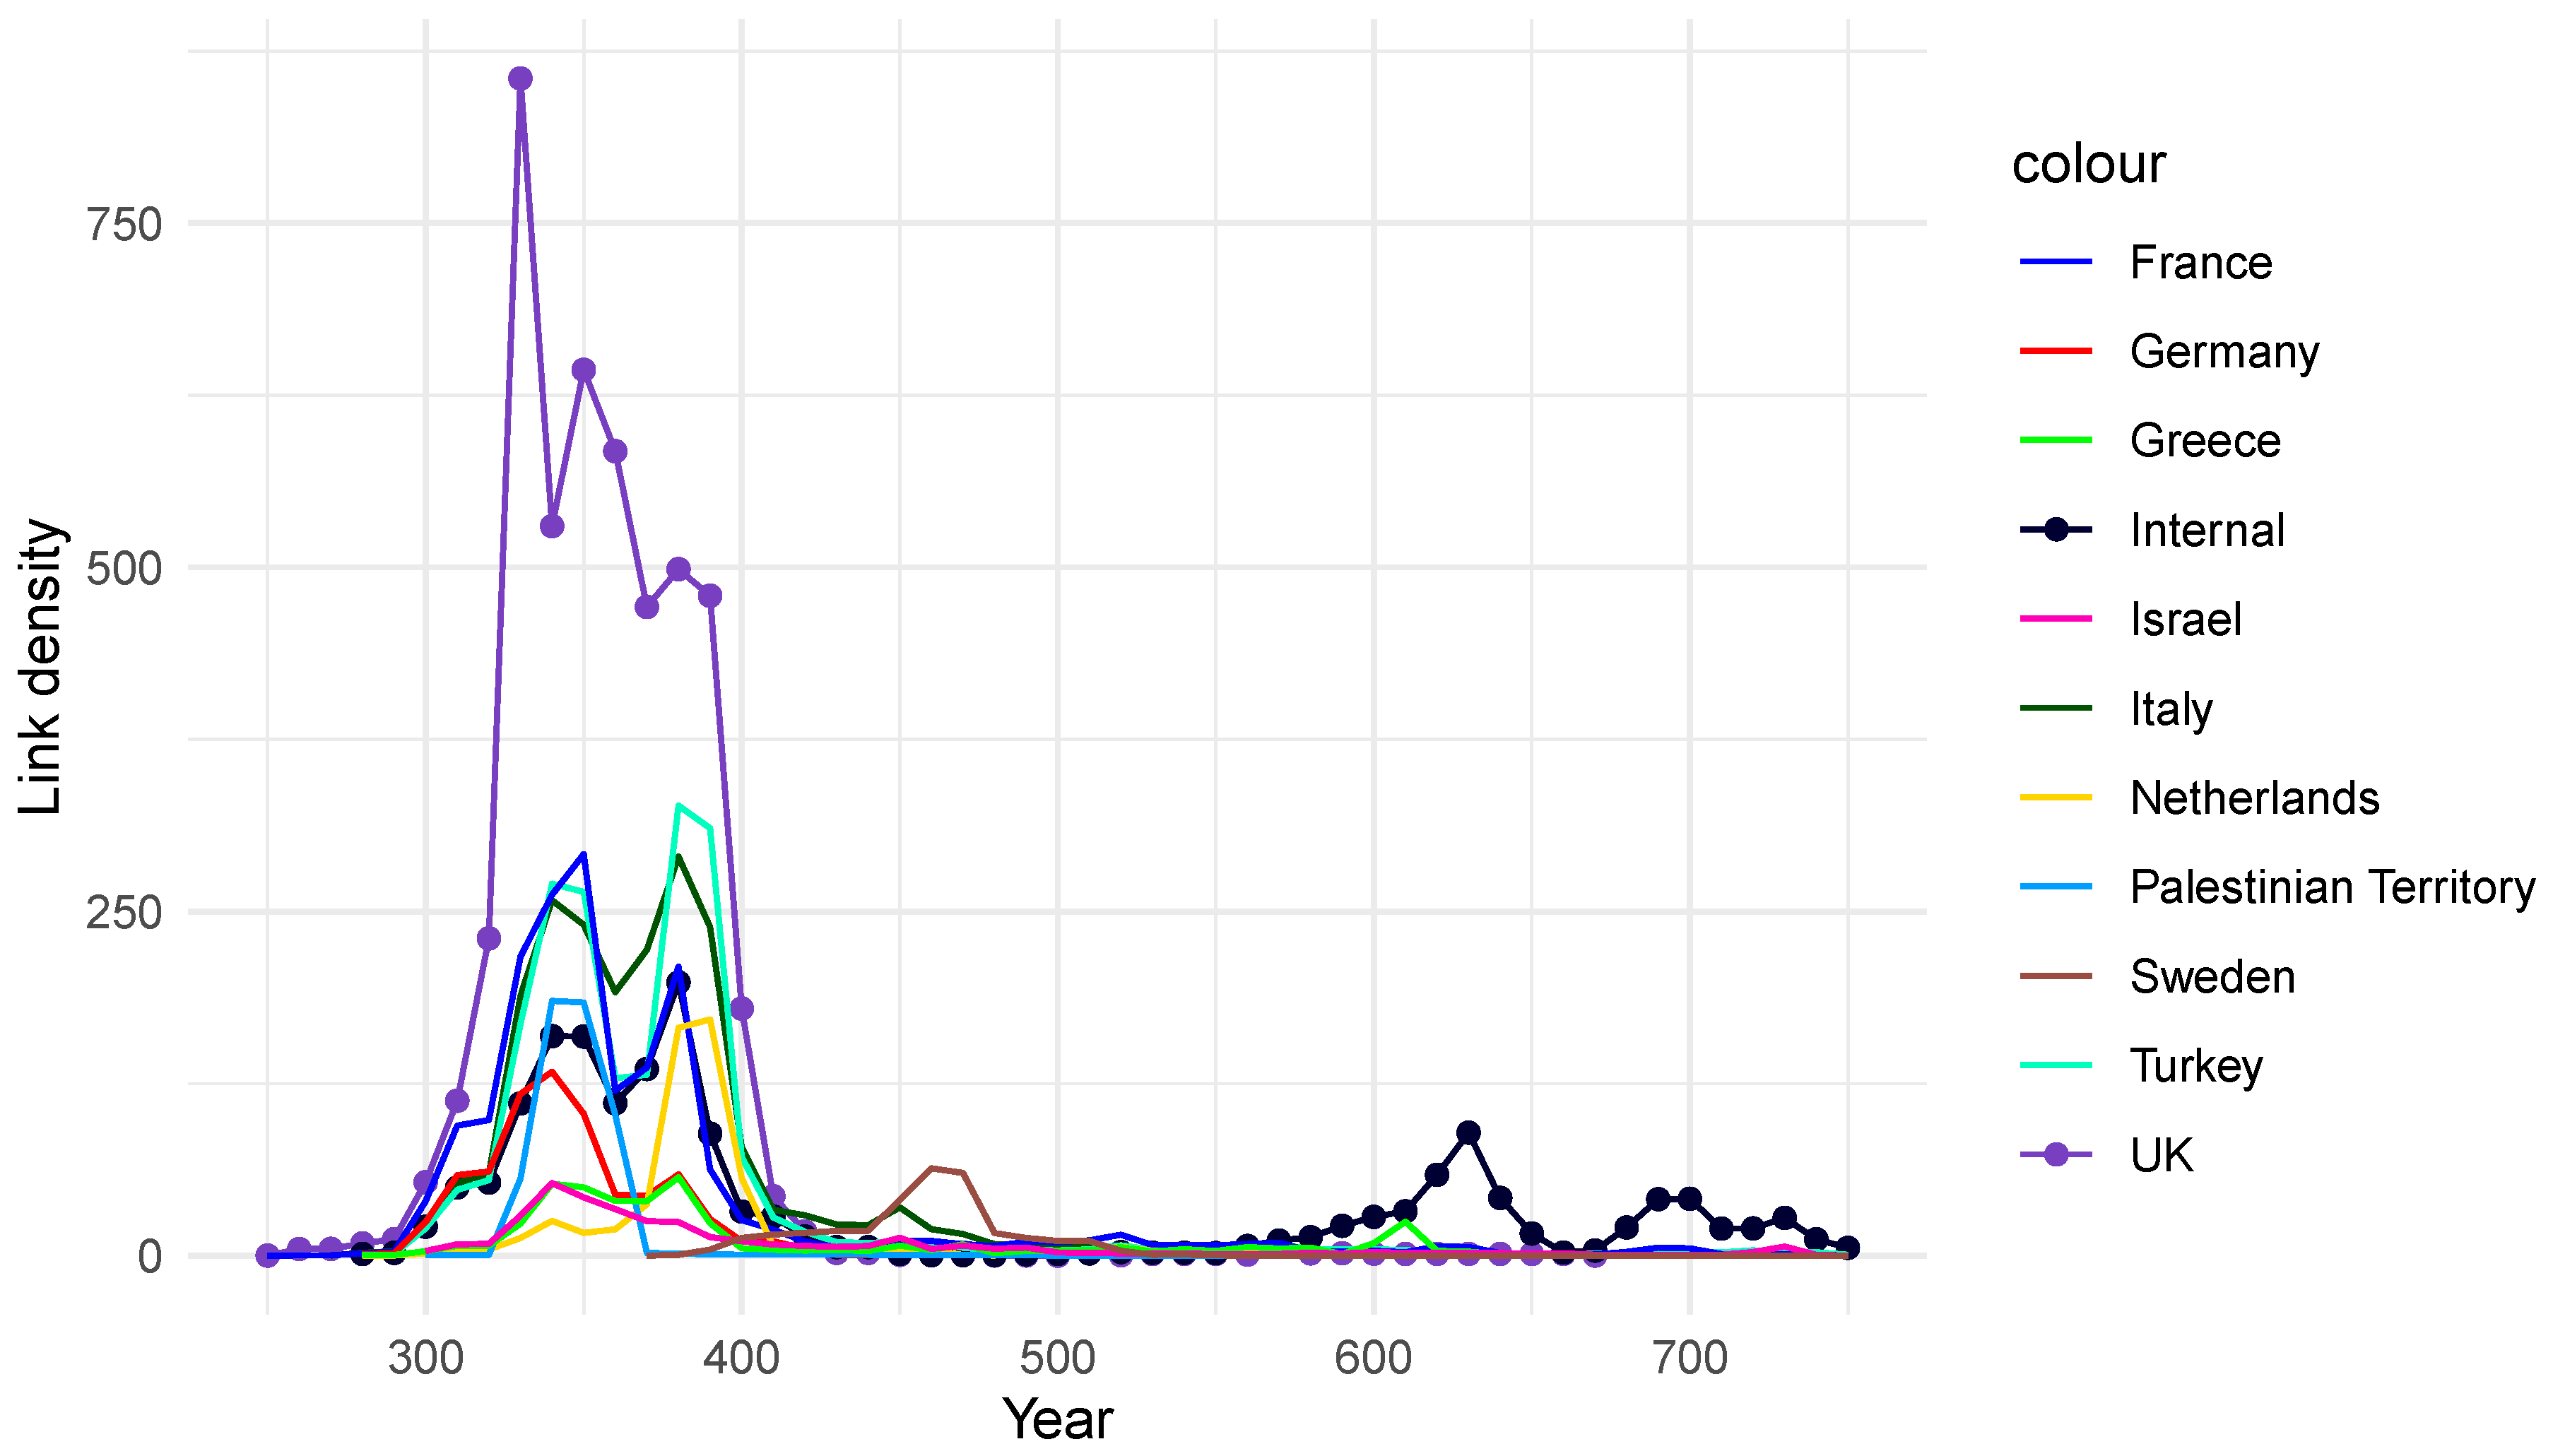
Figure 11.
Detail of the ratio of average trade links before and after the changepoint for the main trading partners. Please note the break of the y axis between 0.6 and 2.0.
Figure 11.
Detail of the ratio of average trade links before and after the changepoint for the main trading partners. Please note the break of the y axis between 0.6 and 2.0.
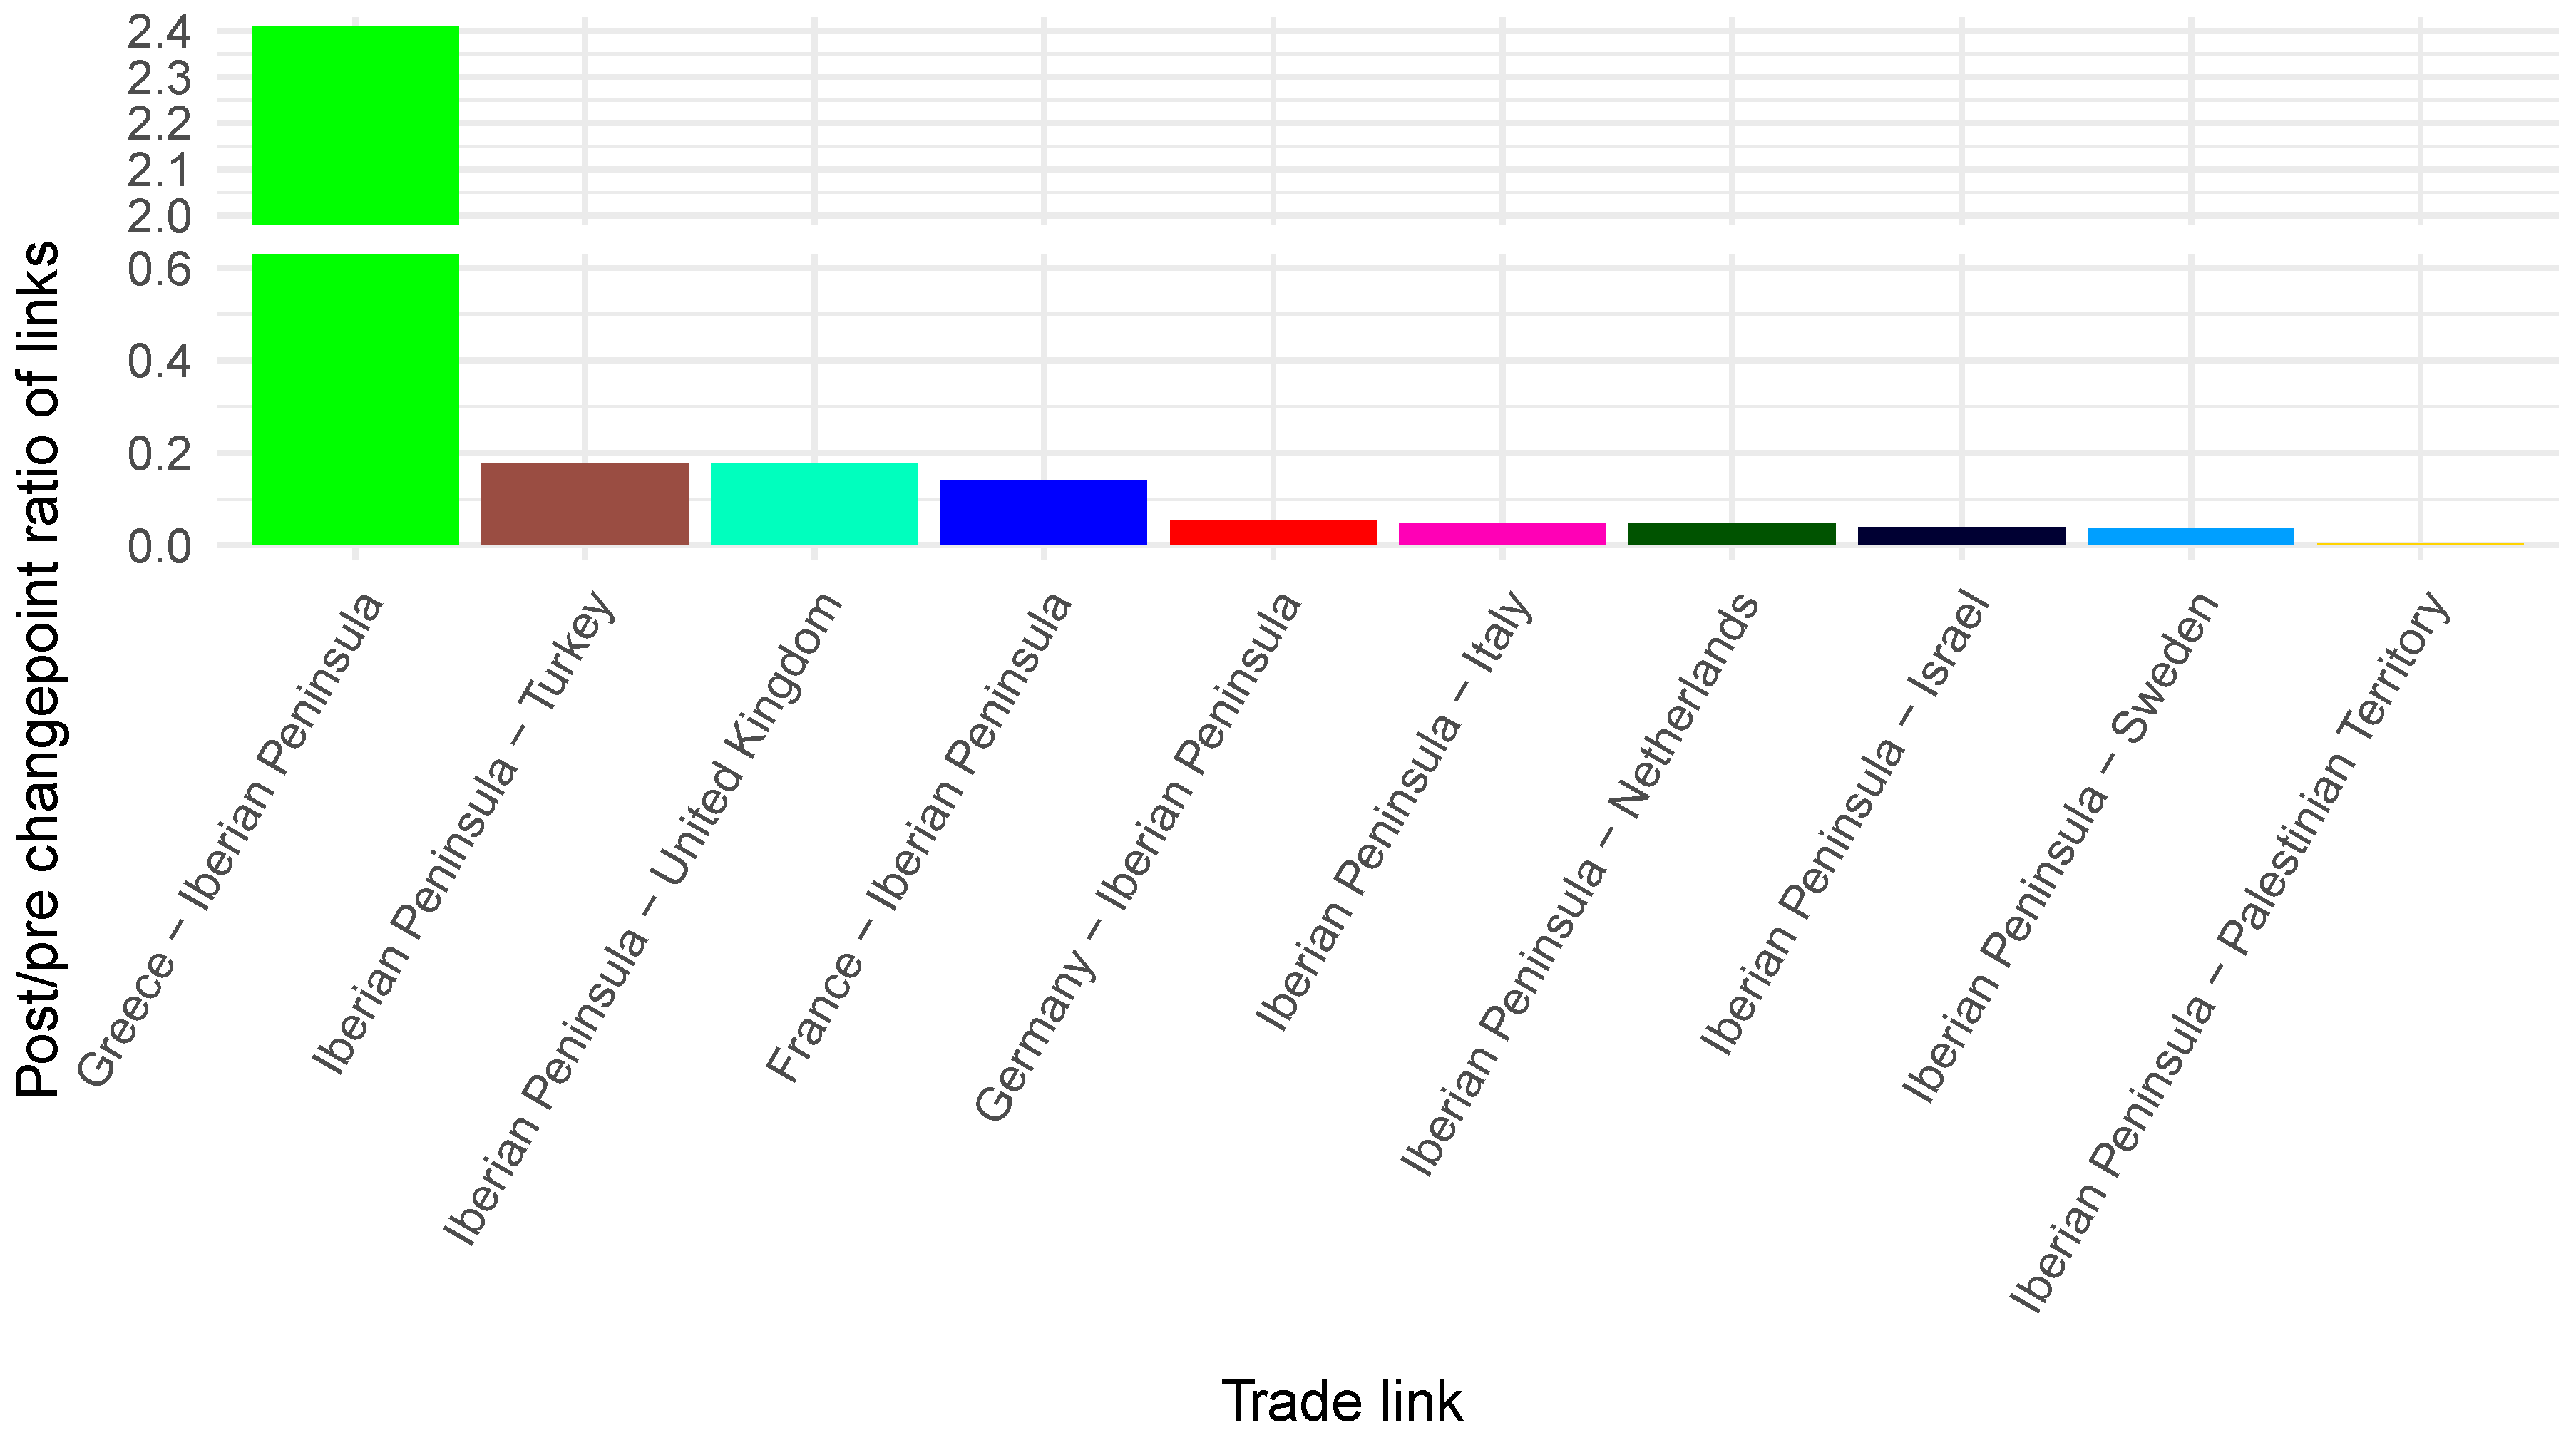
Figure 12.
Evolution through time of the link density with the main trading partners of the Iberian Peninsula between 250 and 750.
Figure 12.
Evolution through time of the link density with the main trading partners of the Iberian Peninsula between 250 and 750.
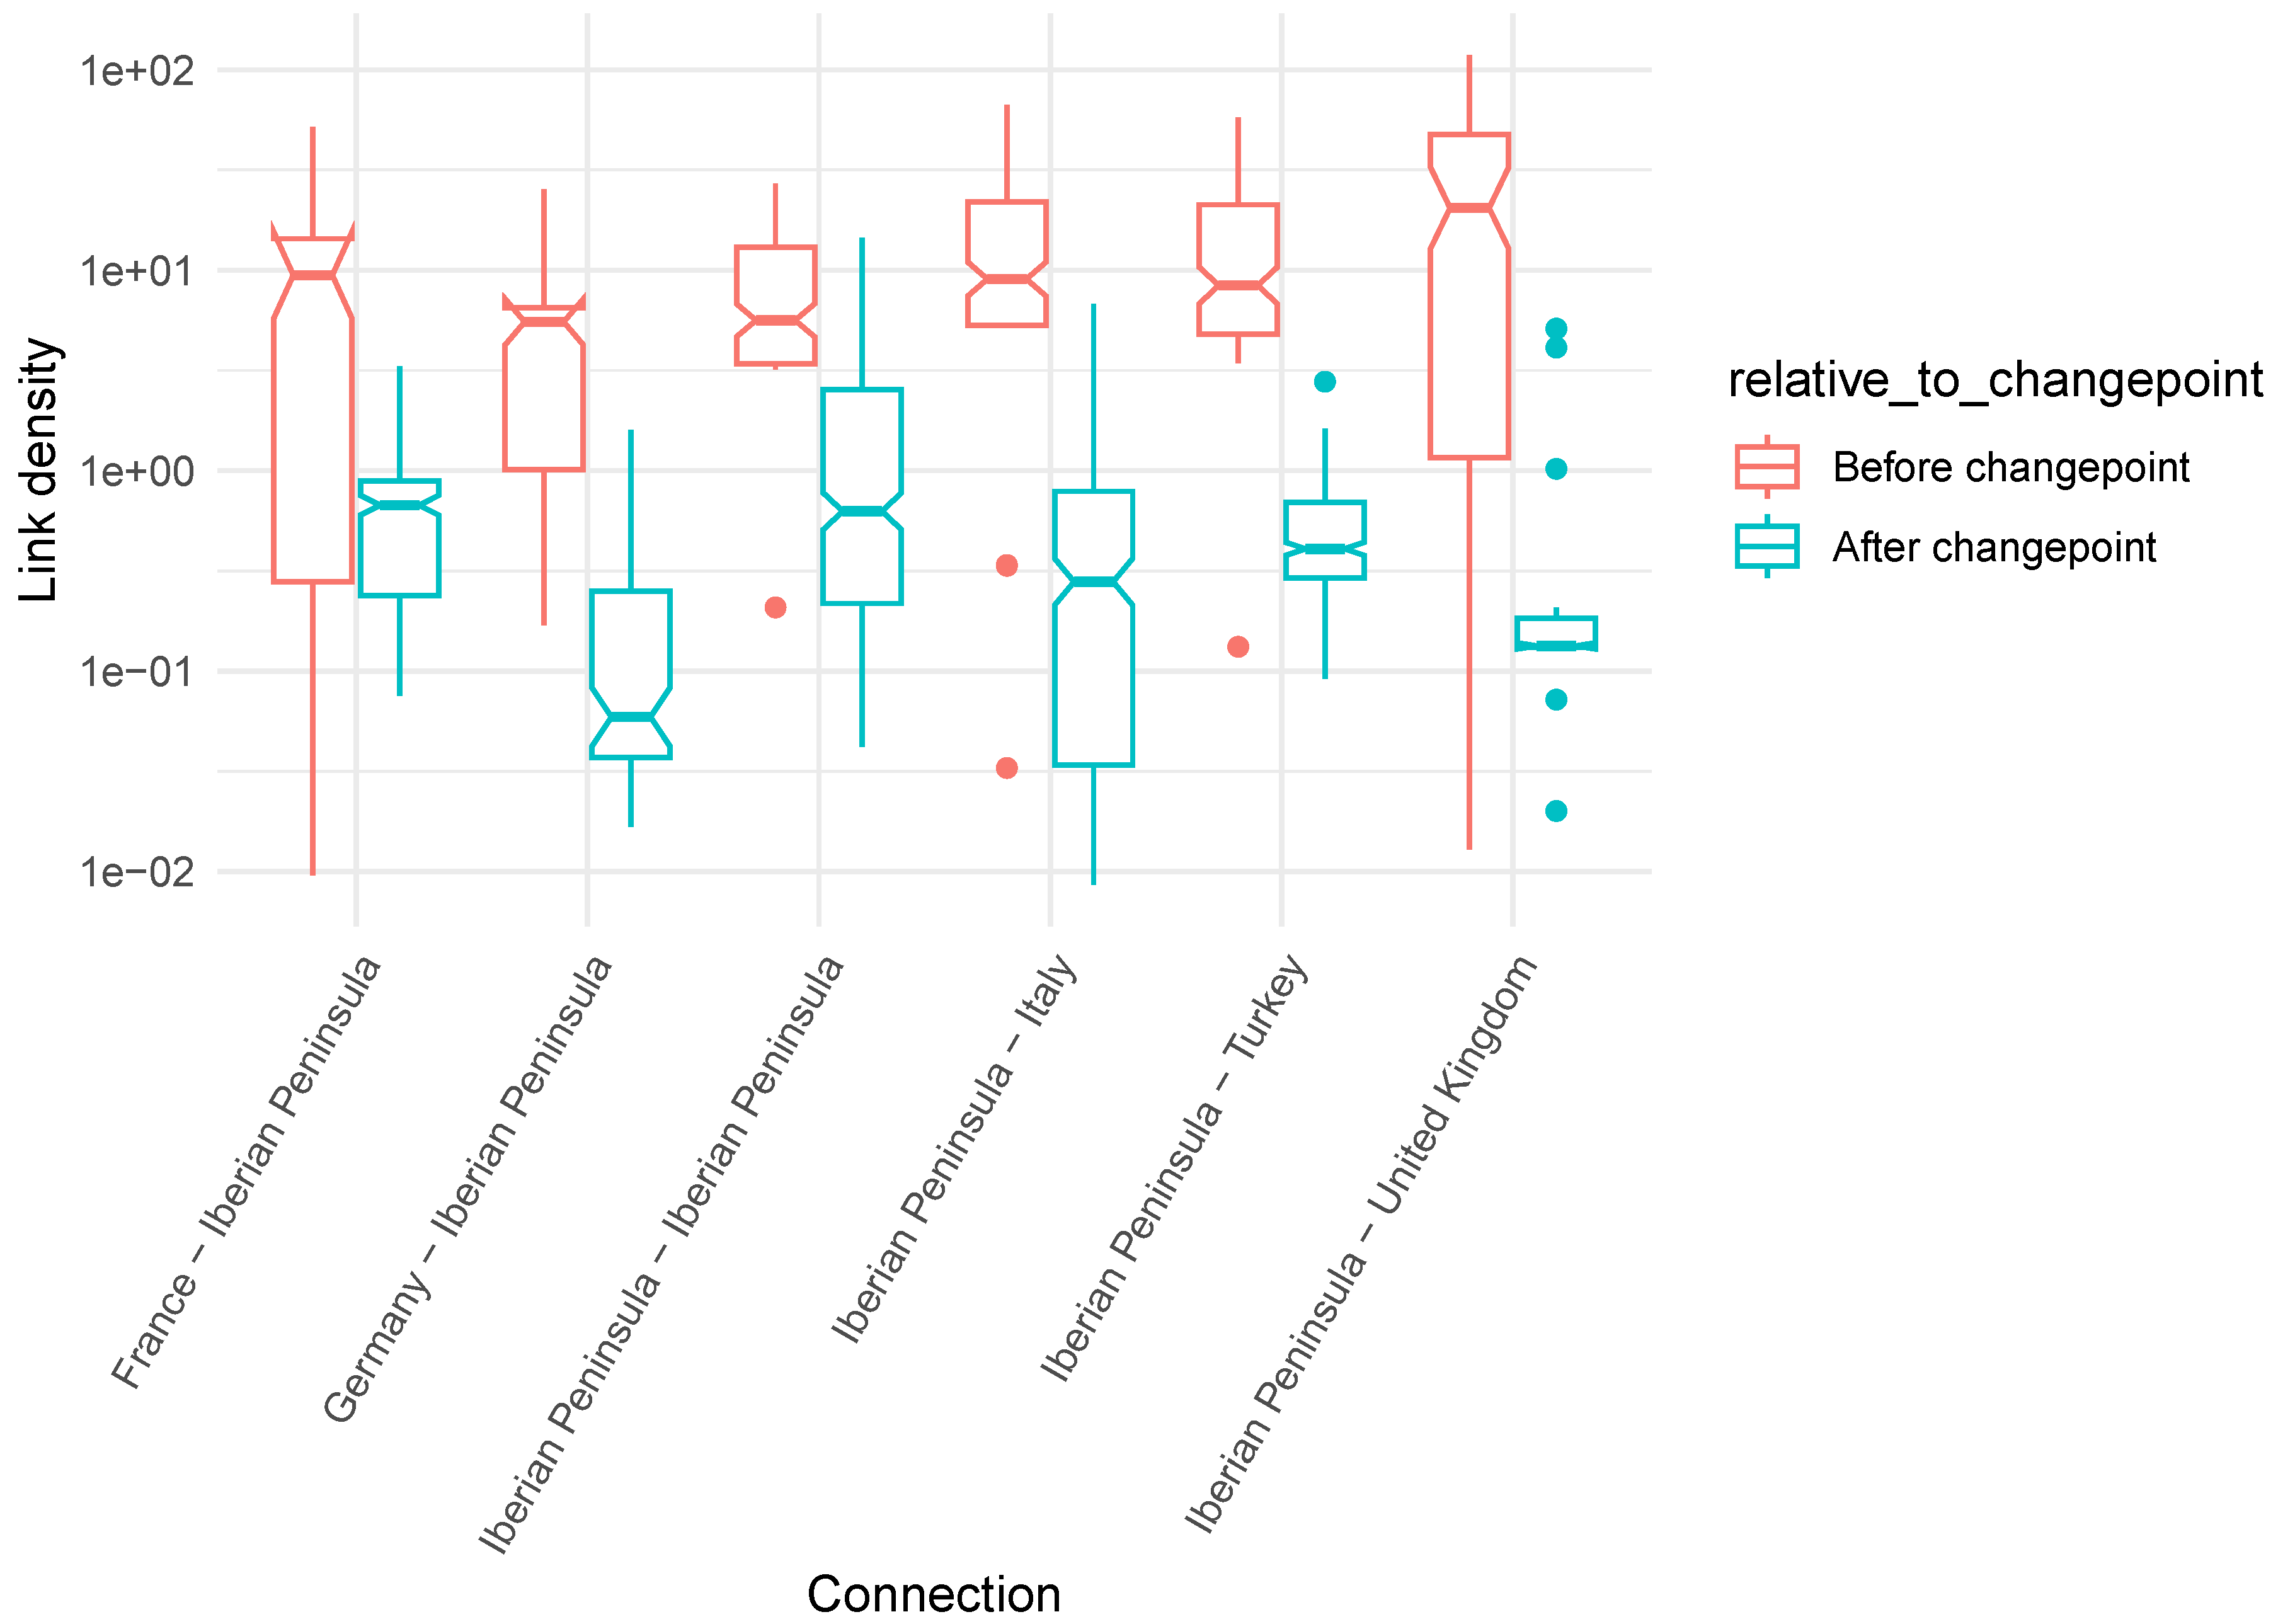

Table 1.
Top edge weights in the regional network.
| Weight | Node |
|---|---|
| 4758.3277 | United Kingdom |
| 2099.6803 | Italy |
| 1989.0296 | Turkey |
| 1781.2078 | France |
| 704.6233 | Germany |
| 572.5325 | Netherlands |
| 541.1008 | Palestinian Territory |
| 436.5597 | Greece |
| 361.5953 | Israel |
| 307.7852 | Sweden |
Table 2.
Stationarity tests for the time series of internal and complete trade link density.
| Series | ADF Statistic | KPSS statistic |
|---|---|---|
| Interior links | -3.020026 | 1.593249 |
| Exterior links | -2.584684 | 2.769855 |
Table 3.
Changepoint detection statistics for the Iberian trade links time series. p < 0.05 in all cases. Check text for reference on the last column.
Table 3.
Changepoint detection statistics for the Iberian trade links time series. p < 0.05 in all cases. Check text for reference on the last column.
| Method | Changepoint year | Changepoint (filtered) | Changepoint (midpoint) |
|---|---|---|---|
| Lanzante | 491 | 477 | 460 |
| Pettitt | 491 | 477 | 460 |
| Bu | 408 | 408 | 400 |
| Br | 408 | 408 | 400 |
Table 4.
Changepoints found in the Iberian trade links time series. We have also included results for the dataset with midpoint range imputation and with long ranges filtered out.
Table 4.
Changepoints found in the Iberian trade links time series. We have also included results for the dataset with midpoint range imputation and with long ranges filtered out.
| Method | Changepoint year |
|---|---|
| All links, cpt.meanvar (+filtered) | 423 |
| All links, cpt.meanvar (midpoint) | 420 |
| All Links, cpt.meanvar (PELT) | 408 |
| All links, Lanzante/Pettitt | 491 |
| All links, Lanzante/Pettitt (filtered) | 477 |
| Internal links, cpt.mean (+filtered) | 395 |
| Multi-sequence, e.divisive (+filtered) | 409 |
| Multi-sequence, e.divisive (midpoint) | 410 |
Disclaimer/Publisher’s Note: The statements, opinions and data contained in all publications are solely those of the individual author(s) and contributor(s) and not of MDPI and/or the editor(s). MDPI and/or the editor(s) disclaim responsibility for any injury to people or property resulting from any ideas, methods, instructions or products referred to in the content. |
© 2026 by the authors. Licensee MDPI, Basel, Switzerland. This article is an open access article distributed under the terms and conditions of the Creative Commons Attribution (CC BY) license (http://creativecommons.org/licenses/by/4.0/).
Copyright: This open access article is published under a Creative Commons CC BY 4.0 license, which permit the free download, distribution, and reuse, provided that the author and preprint are cited in any reuse.


